Filed pursuant to Rule 253(g)(2)
File No. 024-10918
OFFERING CIRCULAR DATED FEBRUARY 11, 2019
Coherix, Inc.

3980 Ranchero Dr.
Ann Arbor, MI 48108
(734) 922-4073
Up to 2,500,000 shares of Common Stock, par value $0.001
SEE “DESCRIPTION OF CAPITAL STOCK” AT PAGE 46
MINIMUM INDIVIDUAL INVESTMENT: 200 Shares $1,200
| | Price to Public | Underwriting discount and
commissions (2) | Proceeds to issuer |
| Per share/unit | $ 6.00 | $ 0.00 | $ 6.00 |
| Total Maximum | $ 15,000,000 | $ 0.00 | $ 15,000,000(1) |
(1)Before deducting expenses, estimated to be approximately $500,000 including legal fees, accounting fees, and printer costs. For more details, please see the section of this offering circular captioned “Plan of Distribution.” This is a “best efforts” offering. There is no minimum number of shares that must be distributed in this offering.
(2)The company does not currently intend to use commissioned sales agents or underwriters. In the event it uses commissioned sales agents or underwriters, it will file an amendment to the Offering Statement of which this Offering Circular forms a part.
The offering will commence within two calendar days after the offering statement in which this offering circular is included has been qualified by the US Securities and Exchange Commission (the “Commission” or the “SEC”) and includes an amount of shares that we reasonably expect to be offered and sold within two years from the date of initial qualification, unless subsequently amended. The offering will terminate at the earlier of: (1) the date at which the maximum offering amount has been sold, (2) the date which is one year from this offering being qualified by the Commission, or (3) the date at which the offering is earlier terminated by us in our sole discretion.
There is no minimum number of shares that we must sell in order to conduct a closing in this offering. We have made no arrangements to place subscription funds in an escrow, trust or similar account. Shares issued under this offering will be issued on a continuous basis under Rule 251(d)(3) under the Securities Act, and the company will have access to such funds from the first dollar invested, even if those proceeds do not cover the costs of this offering. For further details please see the section of this offering circular captioned “Plan of Distribution.”
THE UNITED STATES SECURITIES AND EXCHANGE COMMISSION DOES NOT PASS UPON THE MERITS OF OR GIVE ITS APPROVAL TO ANY SECURITIES OFFERED OR THE TERMS OF THE OFFERING, NOR DOES IT PASS UPON THE ACCURACY OR COMPLETENESS OF ANY OFFERING CIRCULAR OR OTHER SELLING LITERATURE. ANY REPRESENTATION TO THE CONTRARY IS UNLAWFUL.
THE SECURITIES HAVE NOT BEEN REGISTERED UNDER THE SECURITIES ACT OF 1933, AS AMENDED (THE “SECURITIES ACT”) OR APPLICABLE STATE SECURITIES LAWS, AND THESE SECURITIES ARE OFFERED PURSUANT TO AN EXEMPTION FROM REGISTRATION WITH THE COMMISSION. HOWEVER, THE COMMISSION HAS NOT MADE AN INDEPENDENT DETERMINATION THAT THE SECURITIES OFFERED HEREUNDER ARE EXEMPT FROM REGISTRATION.
THIS OFFERING CIRCULAR CONTAINS ALL OF THE REPRESENTATIONS BY THE COMPANY CONCERNING THIS OFFERING, AND NO PERSON SHALL MAKE DIFFERENT OR BROADER STATEMENTS THAN THOSE CONTAINED HEREIN. INVESTORS ARE CAUTIONED NOT TO RELY UPON ANY INFORMATION NOT EXPRESSLY SET FORTH IN THIS OFFERING CIRCULAR.
GENERALLY NO SALE MAY BE MADE TO YOU IN THIS OFFERING IF THE AGGREGATE PURCHASE PRICE YOU PAY IS MORE THAN 10% OF THE GREATER OF YOUR ANNUAL INCOME OR NET WORTH. DIFFERENT RULES APPLY TO ACCREDITED INVESTORS AND NON-NATURAL PERSONS. BEFORE MAKING ANY REPRESENTATION THAT YOUR INVESTMENT DOES NOT EXCEED APPLICABLE THRESHOLDS, WE ENCOURAGE YOU TO REVIEW RULE 251(d)(2)(i)(C) OF REGULATION A. FOR GENERAL INFORMATION ON INVESTING, WE ENCOURAGE YOU TO REFER TOwww.investor.gov.
This offering is inherently risky. See “Risk Factors” on page 8.
Sales of these securities will commence on approximately February 11, 2019.
The company is following the Form S-1 format of disclosure under Regulation A.
Table of Contents
In this Offering Circular, the terms “Coherix” or “the company,” “us” or “we” refer to Coherix, Inc. and its consolidated subsidiaries.
Statement Regarding Forward-Looking Statements
THIS OFFERING CIRCULAR MAY CONTAIN FORWARD-LOOKING STATEMENTS AND INFORMATION RELATING TO, AMONG OTHER THINGS, THE COMPANY, ITS BUSINESS PLAN AND STRATEGY, AND ITS INDUSTRY. THESE FORWARD-LOOKING STATEMENTS ARE BASED ON THE BELIEFS OF, ASSUMPTIONS MADE BY, AND INFORMATION CURRENTLY AVAILABLE TO THE COMPANY’S MANAGEMENT. WHEN USED IN THE OFFERING MATERIALS, THE WORDS “ESTIMATE,” “PROJECT,” “BELIEVE,” “ANTICIPATE,” “INTEND,” “EXPECT” AND SIMILAR EXPRESSIONS ARE INTENDED TO IDENTIFY FORWARD-LOOKING STATEMENTS, WHICH CONSTITUTE FORWARD LOOKING STATEMENTS. THESE STATEMENTS REFLECT MANAGEMENT’S CURRENT VIEWS WITH RESPECT TO FUTURE EVENTS AND ARE SUBJECT TO RISKS AND UNCERTAINTIES THAT COULD CAUSE THE COMPANY’S ACTUAL RESULTS TO DIFFER MATERIALLY FROM THOSE CONTAINED IN THE FORWARD-LOOKING STATEMENTS. INVESTORS ARE CAUTIONED NOT TO PLACE UNDUE RELIANCE ON THESE FORWARD-LOOKING STATEMENTS, WHICH SPEAK ONLY AS OF THE DATE ON WHICH THEY ARE MADE. THE COMPANY DOES NOT UNDERTAKE ANY OBLIGATION TO REVISE OR UPDATE THESE FORWARD-LOOKING STATEMENTS TO REFLECT EVENTS OR CIRCUMSTANCES AFTER SUCH DATE OR TO REFLECT THE OCCURRENCE OF UNANTICIPATED EVENTS.
Industry and Market Data
Although we are responsible for all disclosure contained in this Offering Circular, in some cases we have relied on certain market and industry data obtained from third-party sources that we believe to be reliable. Market estimates are calculated by using independent industry publications in conjunction with our assumptions regarding the machine vision for manufacturing industry and market. While we are not aware of any misstatements regarding any market, industry or similar data presented herein, such data involves risks and uncertainties and is subject to change based on various factors, including those discussed under the headings “Statement Regarding Forward-Looking Statements” and “Risk Factors” in this Offering Circular.
OFFERING CIRCULAR SUMMARY
This summary highlights selected information contained elsewhere in this Offering Circular. This summary is not complete and does not contain all the information that you should consider before deciding whether to invest in our Common Stock. You should carefully read the entire Offering Circular, including the risks associated with an investment in the company discussed in the "Risk Factors" section of this Offering Circular, before making an investment decision. Some of the statements in this Offering Circular are forward-looking statements. See the section entitled "Statement Regarding Forward-Looking Statements."
Company Information
The company was organized on October 30, 2003, under the laws of the State of Delaware. Our principal executive office is located at 3980 Ranchero Drive, Ann Arbor, MI 48108, and our telephone number is 734-922-4073. We have a wholly owned subsidiary in Singapore, Coherix Asia PTE Ltd., to market Coherix semiconductor products in the Asia Pacific region and a wholly owned subsidiary in Germany, Coherix GMBH, to market Coherix products in Europe. We have a distribution agreement with Marubeni to market Coherix products in Japan. In March 2018, we began to operate a Chinese Wholly Foreign Owned Enterprise (“WFOE”) in Shanghai, China to market and distribute Coherix, Inc. products in China.
Our website address is www.coherix.com. We do not incorporate the information on or accessible through our website into this Offering Circular, and you should not consider any information on, or that can be accessed through, our website as part of this Offering Circular.
Our Business
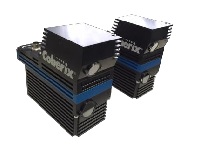
Coherix is a leading three-dimensional (“3D”) machine vision provider engaged in the development and application of high-speed error-proofing solutions for the automotive, semiconductor, electronics and general manufacturing sectors. Such solutions support the increasing demand to further automate various manufacturing processes. Coherix’s 3D machine vision products include software and hardware that serve as the “Eyes of Automation” and function like eyes for automation equipment such as robots and other complex machines. Coherix 3D machine vision products can perform many functions human eyes cannot, such as high precision, high speed, in-line error-proofing. To capture 3D information, Coherix uses its proprietary “SHARK™” electronic modules providing advanced sensor technology (the eyes). In addition, our proprietary “i-Cite™” software serves as the brains behind the eyes, and performs high speed processing of the 3D information coming from the sensors. Over 200 field tested powerful i-Cite software modules are adaptable, efficient, and easy-to use, acting as the “brains” of our entire suite of the company’s 3D machine vision products.
Machine vision is used in manufacturing when the requirements of the manufacturing process have surpassed the limits of human eyesight. Our products deliver substantial cost savings which are obtained through improved product quality and higher throughput. Manufactured parts often are produced with tolerances too small to be analyzed by the human eye. Machine vision technology provided by Coherix provides manufacturing solutions with sight, which meet the increasing demands for speed and accuracy in manufacturing processes, as well as smaller tolerances on parts being manufactured. Machine vision technologies have traditionally been two-dimensional (“2D”). It is well known that 2D vision cameras operate based on contrast of light in the scene, therefore, if the ambient light or the color of the part changes, the functions of the 2D vision camera are negatively impacted. Coherix 3D vision systems are not susceptible to ambient light or if the color of the part changes, which we believe is a significant change in inspection (error-proofing) in manufacturing. Industry analysts estimate that the 3D machine vision business could grow at a rate of 30% annually in terms of revenues.
Software and Hardware Platforms for our Products
Our core strategy is to displace temperamental 2D technology by offering manufacturers what we believe to be a more capable, cost-effective, and more reliable 3D solution. Coherix’s high-speed 3D solutions are based on our two proprietary software and hardware platforms: i-Cite modular software platform, and our proprietary modular SHARK hardware platform. The combination of the i-Cite software and SHARK hardware platforms significantly reduce time and effort to develop 3D vision solutions, thereby delivering greater performance at lower cost.
Our Error-Proofing Products
Error-proofing solutions are critical to the manufacturing of high volume and high value parts. Error-proofing is necessary given manufacturers’ stringent focus on quality and safety while delivering higher efficiencies and throughput. Coherix’s 3D error-proofing products are used in the electronics, semiconductor, automotive, and general manufacturing market segments. Our customers implement our high speed Robust3D® error-proofing solutions directly into their manufacturing processes in order to avoid defects in their manufacturing process.
Coherix solves difficult problems in manufacturing with its 3D vision solutions that cannot be performed by humans. Most of the manufacturing problems our products are solving have existed over several decades. Previously they could not be solved with human inspectors, mechanical probes, or 2D machine vision technologies. Solving these difficult manufacturing problems requires robust 3D (capable of performing without failure under a wide range of conditions) machine vision technology.
Coherix’s Robust3D machine vision technology has only been available since 2015 when Coherix introduced three new product lines.
Predator3D™

Our Predator3D™ product line performs error-proofing of the dispensing of sealants and structural adhesives. It is primarily used for structural adhesive bead volume and location in body assembly and room temperature vulcanization, used for sealing in engine and transmission assemblies.
Robust3D®
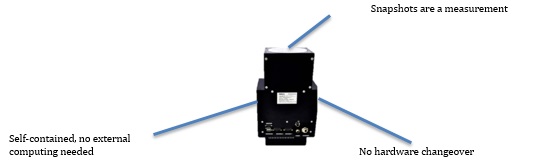
The second product line Coherix introduced in 2015 is called Robust3D, which is the new standard for assembly error-proofing in manufacturing processes. With its self-contained processor, the Tru3D™ sensor, it can be used for several applications.
Currently Tru3D (one sensor in the Robust3D error-proofing product line) is primarily used in the assembly of auto engines. However, any industry that assembles high value products will benefit from using our Robust3D error-proofing products.
Saber3D™
The third product line is called Saber3D, which is a high-speed, in-line inspection product line that eliminates the need for production machines to stop the assembly to perform inspection. Saber3D is the second generation of the 3DX product line, now featuring enhanced “Field of View” resolution and speed characteristics. It is used for very high speed error-proofing of small parts (maximum size 35 millimeters by 35 millimeters) primarily in the semiconductor and electronics manufacturing processes. However, in the future the company intends to introduce Saber3D products with larger Fields of View into other industries which have a need to perform high speed inspection of small objects.
Diverse End-User Markets
Our products can be used in a number of different markets.
Structural Adhesives
The global structural adhesives market grew to approximately $18.3 billion in 2016 with the compound annual growth rate (“CAGR”) anticipated to be approximately 7.9% from 2016 to 2022. High demand for lightweight metals and composites in applications such as automotive, transportation, building and construction and furniture are expected to fuel the overall demand of structural adhesives in future.
Automotive
The International Organization of Motor Vehicle Manufacturers reported global production of 97.3 million motor vehicles in 2017, up 2.4% over 2016. Automobiles and commercial vehicles require precision and consistency in manufacturing. Our error-proofing solutions enable our customers to reduce variation, resulting in consistent high quality. The automotive industry’s need to reduce vehicle weight promotes the joining of light weight dissimilar materials such as magnesium, aluminum, special light weight steel, and composites. The joining of these dissimilar materials cannot be done by traditional joining methods such as welding. Therefore, sophisticated adhesives and sealers have been developed and their use is accelerating in the aircraft, automotive, truck, and other industries. The requirement to know how much adhesive is applied and where it is applied to join dissimilar materials drives the demand for our Predator3D Bead Verification products. Our Predator3D™ products are used in automotive vehicle assembly plants where the auto bodies are constructed. Some classes of body joints are also subject to federal government safety standards requiring 100% error-proofing inspection. Also, in what is called the general vehicle assembly area, Predator3Ds are used to control the glass bonding of windshield and other glass components into the auto body. We call this Predator3D the GlassMaster™. Coherix continually focuses on adding value to improve the end user’s process control. As an example, the distance between the dispensing nozzle tip and the surface of the part is critical to the quality of the bead. Fortunately, Predator3D is designed with lasers all around the dispensing nozzle. Therefore, there are lasers behind the nozzle to inspect the dispensed bead, and there are also lasers ahead of the bead to control a predetermined distance between the nozzle tip and the surface (the distance in the “Z” dimension). To maintain this distance, Predator3D measures the distance continuously and sends Z height dimension offsets to adjust the robot path.
Predator3Ds are also used for error-proofing to control inspection in the manufacturing of doors, hoods, and trunks. To gain additional competitive advantage, the company has developed a special solution product for verifying the correct shape and volume of mastic dots, which are used to prevent the outer skin of a vehicle from fluttering when being driven. We call this special sensor DotMaster™.
Structural adhesives used in automotive are known for providing better adhesion between distinct substrates such as steel and plastics. Thus, these composites are used in doors, window glass attachments, brakes and clutch plates and others. On account of high demand for passenger cars in countries like China and India, the automotive industry requires adhesives with structural integrity and strong bonding properties that is expected to impact the global structural adhesive market growth.
Other auto manufacturing plants build engines and transmissions. These plants are called powertrain plants. Coherix Robust3D solutions are used for error-proofing the engine assembly process. There are several different applications in a powertrain plant. One application uses Predator3Ds to error proof “form in place gaskets.” This dispensed material eliminates the need to design, build, and stock hard gaskets. The company also has Robust3D error-proofing solutions for piston-pin circlips, rolling finger followers, and valve assembly. Additional applications are in development.
Coherix provides accurate and reliable error-proofing powertrain solutions globally to top automotive industry names. A sample list of these customers is Fiat Chrysler Automotive, Ford Motor Company, General Motors, Toyota, Honda, Nissan, Mazda, and SAIC-GM-Wuling Automobile.
The International Organization of Motor Vehicle Manufacturers reports 5 regions of the world accounted for nearly 70% of global motor vehicle production last year.

Management presentation of data derived from International Organization of Motor Vehicle Manufacturers Global Production Statistics.
Semiconductors
According to industry analysts, the global semiconductor market in 2017 was estimated to grow to approximately $377 billion in annual sales. According to World Semiconductor Trade Statistics, the worldwide semiconductor market is expected to increase by 15.7 percent in 2018 after 21.6 percent growth in 2017.
The semiconductor industry produces billions of components/packages per year. Most high value packages need to be inspected in 3D for several types of defects. Since its founding, Coherix has developed in-depth knowledge of the semiconductor industry through close relationships with several customers serving the “back end assembly and test” part of the semiconductor manufacturing process. We believe as the semiconductor industry moves to wafer level packaging (back end), 3D machine vision error-proofing solutions will need to adapt, and Coherix technology will be used to rapidly develop new applications via SHARK and i-Cite because of its high performance and low cost.
The company serves a significant number of industry leaders through its error-proofing solutions. Coherix views the Chinese market as a focused area of expansion in semiconductors due to the Chinese government’s intended investment of up to $161 billion over the next decade to promote domestic chip manufacturers.
In early 2018, Coherix incorporated Coherix China, Inc., a Chinese Wholly Foreign Owned Enterprise, to capitalize on the opportunities that the company believes exist in the automotive and semiconductor business in China. Coherix’s ability to take advantage of the large market in semiconductor has been limited due to lack of growth capital.
Electronics
The company’s understanding of the electronics industry was increased through a joint development project with Panasonic Factory Solutions Co, Ltd. (“Panasonic”), a large electronics manufacturer. Coherix owns the intellectual property (“IP”) developed during this project, and has licensed its IP portfolio to be used solely on one application. The company’s modular SHARK technology platform was developed during this project.
Other Opportunities
Coherix solutions can be applied across a variety of end markets where precision, speed, and automation are paramount. Examples include aircraft manufacturing, solar panels, biotechnology/medical, robot guidance for packaging, etc. Coherix’s strategy has been to first gain critical mass and exposure in the automotive, semiconductor, electronics, and general manufacturing markets with future plans to capitalize on additional end markets. Many of our large system integrators and dispensing customers not only use our products in their primary industries, but they are also beginning to utilize our products in their other industry segments.
Due to continued miniaturization of electronic systems, the error-proofing challenges are becoming more demanding, and therefore, we believe, increasing the need for Coherix’s products. With the increase in growth capital from this offering, the company plans to expand marketing into the electronics industry.
The Offering
| Securities offered: | 2,500,000 shares of Common Stock |
| Number of outstanding shares of Common Stock before the offering: | 13,091,200 |
| Number of shares of Common Stock to be outstanding after the offering: | 15,591,200 |
| Price per share:
| $6.00 |
| Maximum offering amount: | $15,000,000 |
| Use of proceeds: | Growth capital and certain debt repayment |
Risk Factors
Our business is subject to a number of risks and uncertainties, including those highlighted in the section titled “Risk Factors” immediately following this summary. These risks include, but are not limited to, the following:
Risks Related to the Company
| · | We have an evolving business model. |
| · | Our auditors have included a “going concern” explanatory paragraph in their audit opinion indicating substantial doubt about the company’s ability to continue as a going concern. |
| · | We are in default with respect to certain of our liabilities. |
| · | Our failure to introduce new products in a successful and timely manner could result in the loss of our market share and a decrease in our revenues and profits. |
| · | Future disruptive new technologies could have a negative effect on our business. |
| · | The loss of a large customer could have an adverse effect on our business. |
| · | A downturn in the semiconductor, electronics, or automotive industries may adversely affect our business. |
| · | Our inability to penetrate new markets may impede our revenue growth. |
| · | Information security breaches or business system disruptions may adversely affect our business. |
| · | The failure of a key supplier to deliver quality product in a timely manner or our inability to obtain components for our products could adversely affect our operating results. |
| · | We do not have agreements with our suppliers and rely on purchase order requests to obtain components for our products; the inability to obtain components for our products could adversely affect our operating results. |
| · | Our products may contain design or manufacturing defects, which could result in reduced demand, significant delays, or substantial costs. |
| · | Our failure to properly manage the distribution of our products and services could result in the loss of revenues and profits. |
| · | If we fail to successfully protect our intellectual property, our competitive position and operating results could suffer. |
| · | Our company may be subject to time-consuming and costly litigation. |
| · | Increased competition may result in decreased demand or prices for our products and services. |
| · | Our business could suffer if we lose the services of, or fail to attract, key personnel and additional personnel. |
| · | Implementation of our joint venture strategy may not be successful, which could affect our ability to increase our revenue or profitability and result in the impairment of acquired intangible assets. |
| · | Global economic conditions may negatively impact our operating results. |
| · | Financial, political, and other risks associated with international sales and operations could adversely affect our business and operating results. |
| · | The status of our joint venture in China is uncertain. |
| · | The trade war between the United States and China may have a negative impact on our business. |
| · | Fluctuations in foreign currency exchange rates could adversely affect our reported results, liquidity, and competitive position. |
| · | Investment in technologies, products, and regions that are unprofitable could have a negative impact on our company. |
| · | Our bylaws designate the Court of Chancery of the State of Delaware as the sole and exclusive forum for certain types of actions and proceedings that may be initiated by our stockholders, which could limit our stockholders’ ability to obtain a favorable judicial forum for disputes with us or our directors, officers or employees. |
Risks Related to the Offering and Investment
| · | Our stock price may be volatile. |
| · | We have not paid cash dividends on Common Stock in the past and do not expect to pay dividends in the future. Any return on investment may be limited to the value of our Common Stock. |
| · | There is currently no trading market for our Common Stock and we cannot ensure that one will ever develop or be sustained. |
| · | Sales by our significant stockholders could have an adverse effect on the market price of our stock. |
| · | We may need to implement additional finance and accounting systems, procedures and controls as we grow our business and organization and to satisfy new reporting requirements. |
| · | We have not conducted an evaluation of the effectiveness of our internal control over financial reporting and will not be required to do so until we are a public company. If we are unable to implement and maintain effective internal control over financial reporting investors may lose confidence in the accuracy and completeness of our financial reports and the market price of our Common Stock may be negatively affected. |
| · | There may be implications of being an Emerging Growth Company. |
| · | We may not satisfy NASDAQ’s initial quotation standards and, even if we do, we may be removed from quotation in the future. |
| · | Investors in this offering are bound by the governing law and jurisdiction provision contained in the subscription agreement, which limits an investor’s ability to bring lawsuits in connection with this offering. |
| · | You will experience future dilution as a result of future equity offerings. |
RISK FACTORS
The SEC requires the company to identify risks that are specific to its business and its financial condition. The company is still subject to all the same risks that all companies in its business, and all companies in the economy, are exposed to. These include risks relating to economic downturns, political and economic events and technological developments (such as hacking and the ability to prevent hacking). Additionally, early-stage companies are inherently more risky than more developed companies. You should consider general risks as well as specific risks when deciding whether to invest.
We have an evolving business model.
As machine vision technologies evolve, so will our business model. We may continue to try to offer additional types of products and services, and we cannot offer any assurance that any of them will be successful. From time to time we may also modify aspects of our business model relating to our product mix and service offerings. We cannot offer any assurance that these or any other modifications will be successful or will not result in harm to the business. Among the risks associated with the introduction of new products are research and development costs involved in new products, costs associated with launching new products, difficulty predicting customer demand and effectively managing inventory levels to ensure adequate supply of the new product and avoid excess supply of the legacy product. We may not be able to manage growth effectively, which could damage our reputation, limit our growth, and negatively affect our operating results.
We may strategically enter into non-cancelable commitments with vendors to purchase materials for our products in advance of demand to take advantage of favorable pricing or address concerns about the availability of future supplies or long lead times. This practice may expose us to an increased risk of excess or obsolete inventory and resulting charges if actual demand is lower than anticipated. Our failure to effectively manage product transitions or accurately forecast customer demand, in terms of both volume and configuration, has led to, and may again in the future lead to, an increased risk of excess or obsolete inventory and resulting charges.
Our auditors have included a “going concern” explanatory paragraph in their audit opinion indicating substantial doubt about the company’s ability to continue as a going concern.
As indicated in our December 31, 2017 financial statements and our independent auditor’s report, the financial statements have been prepared assuming that the company will continue as a going concern. The company’s ability to continue as a going concern is dependent on our ability to continue with our increased operating cash flow, debt management, and capital raising. The December 31, 2017 financial statements do not include any adjustments to reflect the possible future effects on the recoverability and classification of assets, or the amounts and classification of liabilities that may result if we do not continue as a going concern. Therefore, you should not rely on our balance sheet as an indication of the amount of proceeds that would be available to satisfy claims of creditors, and potentially be available for distribution to stockholders, in the event of liquidation.
We are in default with respect to certain of our liabilities.
We are currently in default with respect to certain of our liabilities. These liabilities consist of:
| · | $1,497,087 in principal amount of convertible debentures owed to investors and service providers who accepted notes in lieu of cash payments. Accrued and unpaid interest on these debentures is a current liability. |
| · | $1,973,627 in principal owed to Volvo Group Venture Capital AB (“Volvo”) under a promissory note. Accrued and unpaid interest on the promissory note is a current liability. |
| · | $2,027,139 owed to employees and consultants who agreed to defer all or a portion of their compensation in 2005-2011 under a plan that we refer to as the “Top Hat Deferred Compensation Plan.” Accrued and unpaid interest on this deferred compensation is a current liability. |
| · | $849,963, which represents accrued and unpaid cumulative dividends declared by the Board on previously outstanding shares of the company’s preferred stock that were converted into shares of Common Stock in November 2017. |
If we raise all the funds we are seeking under this offering, we intend to use $5 million of the net proceeds to repay all of the above amounts owed under the convertible debentures ($1,497,087), 50% of the principal and accrued interest amount owed to Volvo ($1,036,657), $1,616,293 of the amount owed under the Top Hat Deferred Compensation Plan, which includes a portion of the accrued interest under that program, and all of the accrued and unpaid dividends ($849,963). These proceeds will not therefore be available to grow our business. See “Use of Proceeds.”
Our failure to introduce new products in a successful and timely manner could result in the loss of our market share and a decrease in our revenues and profits.
The market for our products is characterized by rapidly changing technology. Accordingly, we believe that our future success will depend upon our ability to accelerate time-to-market for new products with improved functionality, ease-of-use, performance, or price. There can be no assurance that we will be able to introduce new products in accordance with scheduled release dates or that new products will achieve market acceptance. Our ability to keep pace with the rapid rate of technological change in the high-technology marketplace could have a material adverse effect on our operating results.
Product development is often a complex, time-consuming, and costly process involving significant investment in research and development with no assurance of return on investment. Research is by its nature speculative and the ultimate commercial success of a product depends upon various factors, many of which are not under our control. We may not achieve significant revenue from new product investments for a number of years, if at all. Moreover, new products may not generate the operating margins that we have experienced historically.
Future disruptive new technologies could have a negative effect on our business.
We are subject to the risk of future disruptive technologies. If new vision technologies develop that are superior to ours, or are perceived to be superior by consumers, it could have a material adverse effect on the company.
The loss of a large customer could have an adverse effect on our business.
Revenue from a single customer, Panasonic, accounted for 38% and 42% of total revenue in 2017 and 2016, respectively, representing the sixth and fifth years of a ten-year licensing fee arrangement. Customers of this size may divert management’s attention from other operational matters and pull resources from other areas of the business, resulting in potential loss of revenue from other customers. In addition, the loss of a large customer could be difficult to replace with another large customer or numerous smaller customers, and the company may initially experience a sharp drop in revenue. The market leaders in these industries are able to exert purchasing power over their vendors' supply chains, and our large customers in these industries may decide to purchase fewer products from Coherix or stop purchasing from Coherix altogether.
As a large portion of our sales are through resellers, there may be end customers of our resellers that are large consumers of our products. Furthermore, there may be industry leaders that are able to exert purchasing power over their vendors' supply chains, particularly in the automotive and consumer electronics industries. Our expansion within the factory automation marketplace has reduced our reliance on the revenue from any one customer. Nevertheless, the loss of, or significant curtailment of purchases by, any one or more of our larger customers could have a material adverse effect on our operating results.
A downturn in the semiconductor, electronics, or automotive industries may adversely affect our business.
The industries we currently serve in the factory automation market are the semiconductor, electronics, and automotive industries. We are reliant on sales from these industries and therefore our business is impacted by their economic and cyclical trends, including, the level of capital spending and product design cycles. Factors that negatively impact these industries (including those that reduce levels of capital spending or prolong design cycles), could materially and adversely affect our business.
Our inability to penetrate new markets may impede our revenue growth.
We are pursuing applications in machine vision beyond the automotive, semiconductor, and electronics sectors, including expanding to the aircraft manufacturing, packaging, and other general manufacturing sectors. Our growth plan includes successful penetration of these other manufacturing markets. Therefore, our failure to generate revenue in these new markets in the amounts or within the time periods anticipated may have a material adverse impact on our revenue growth and operating results.
Information security breaches or business system disruptions may adversely affect our business.
We rely on our information technology infrastructure and management information systems to effectively run our business. We may be subject to information security breaches caused by hacking, malicious software, or acts of vandalism or terrorism. Our security measures or those of our third-party service providers may not detect or prevent such breaches. Any such compromise to our information security could result in theft of our intellectual property, a misappropriation of our cash or other assets, an interruption in our operations, the unauthorized publication of our confidential business or proprietary information, the unauthorized release of customer, vendor, or employee data, the violation of privacy or other laws, and the exposure to litigation, any of which could harm our business and operating results.
The failure of a key supplier to deliver quality product in a timely manner or our inability to obtain components for our products could adversely affect our operating results.
A significant portion of our product is manufactured by a third-party contractor located in Livonia, Michigan. We do not have a contract with this contractor. We rely on this contractor to provide quality parts and meet delivery schedules. We engage in extensive product quality programs and processes, including actively monitoring the performance of our third-party manufacturers; however, we may not detect all product quality issues through these programs and processes.
Certain components are presently sourced from a single vendor that is selected based on price and performance considerations. We do not have a contract with this vendor. In the event of a supply disruption from a single-source vendor, these components may be purchased from an alternative vendor, which may result in manufacturing delays. Certain key electronic and mechanical components that are purchased from strategic suppliers, such as processors or imagers, are fundamental to the design of Coherix products. A disruption in the supply of these key components, such as a last-time-buy announcement, natural disaster, financial bankruptcy, or other event, may require us to purchase a significant amount of inventory at unfavorable prices resulting in lower gross margins and higher risk of carrying excess inventory. An interruption in, termination of, or material change in the purchase terms of any key components could have a material adverse effect on our operating results.
We do not have agreements with our suppliers and rely on purchase order requests to obtain components for our products; the inability to obtain components for our products could adversely affect our operating results.
We rely on all of our suppliers to provide us with components through the use of purchase order requests and do not have any agreements with the suppliers of our components. If our suppliers do not continue to satisfy our purchase order requests, we may experience a disruption in the supply of components, which could have a material adverse effect on our operating results.
Our products may contain design or manufacturing defects, which could result in reduced demand, significant delays, or substantial costs.
If flaws in either the design or manufacture of our products were to occur, we could experience a rate of failure in our products that could result in significant delays in shipment and material repair or replacement costs. Our release-to-market process may not be robust enough to detect significant design flaws or software bugs. Our product quality programs and processes, including actively monitoring and evaluating the quality of our component suppliers and contract manufacturers, may not be sufficient to avoid a product failure rate that results in:
| | · | Substantial delays in shipment, |
| | · | Significant repair or replacement costs, |
| | · | Product liability claims or lawsuits, or |
| | · | Potential damage to our reputation. |
Any of these results could have a material adverse effect on our operating results.
Our failure to properly manage the distribution of our products and services could result in the loss of revenues and profits.
We utilize a direct sales force and several integration and distribution channel partners to sell our products and services. For example, we use a network of machine vision system integratorsto serve a wide customer base in automotive, aerospace, electronics and other industries. System integrators provide turnkey inspection solutions, consulting, onsite support, and customer training services to deliver innovative machine vision solutions integrating Coherix Robust3D error-proofing solutions, includingPredator3Dadhesive and sealant bead inspection.
Successfully managing the interaction of our direct and indirect sales channels to reach various potential customers for our products and services is a complex process. In addition, our reliance upon indirect selling methods may reduce visibility to demand and pricing issues. Each sales channel has distinct risks and costs, and therefore, our failure to implement the most advantageous balance in the sales model for our products and services could adversely affect our revenue and profitability.
If we fail to successfully protect our intellectual property, our competitive position and operating results could suffer.
We rely on our proprietary software technology and hardware designs, as well as the technical expertise, creativity, and knowledge of our personnel to maintain our position as a leading provider of machine vision products. Software piracy and reverse engineering, specifically from companies in Russia and Asia, may result in counterfeit products that are misrepresented in the market as Coherix products. To protect our intellectual property, we never embed the core source code in our products and we do not give out the source code, except for customer specific portions associated with joint developments, which makes copying our software difficult. We also rely on patent, trademark, copyright, and trade secret protection, as well as non-disclosure agreements with customers, suppliers, employees, and consultants as well as restricting access to our proprietary information by a combination of technical and internal security measures. These measures, however, may not be adequate to:
| | · | Protect our proprietary technology, |
| | · | Protect our patents from challenge, invalidation, or circumvention, or |
| | · | Ensure that our intellectual property will provide us with competitive advantages. |
Any of these adverse circumstances could have a material adverse effect on our operating results.
Our company may be subject to time-consuming and costly litigation.
From time to time, we may be subject to various claims and lawsuits by competitors, customers, or other parties arising in the ordinary course of business, including lawsuits charging patent infringement, or claims and lawsuits instituted by us to protect our intellectual property or for other reasons. These matters can be time-consuming, divert management’s attention and resources, and cause us to incur significant expenses, regardless of the merit of a particular lawsuit or the eventual outcome. Furthermore, the results of any of these actions may have a material adverse effect on our operating results.
Increased competition may result in decreased demand or prices for our products and services.
The machine vision market is fragmented and Coherix’s competitors are typically other vendors of machine vision systems, controllers, and components; manufacturers of image processing systems, sensors, and components; and system integrators. Any of these competitors may have greater financial and other resources than we do. Ease-of-use and product price are significant competitive factors in the factory automation marketplace. We may not be able to compete successfully in the future and our investments in research and development, sales and marketing, and support activities may be insufficient to enable us to maintain our competitive advantage. In addition, competitive pressures could lead to price erosion that could have a material adverse effect on our gross margins and operating results.
Our business could suffer if we lose the services of, or fail to attract, key personnel and additional personnel.
We are highly dependent on the management and leadership of Dwight Carson, our Chief Executive Officer and Chairman of our Board of Directors, and Doug Davison, Chief Technology Officer, as well as other members of our senior management team. Although we have many experienced and qualified senior managers, the loss of key personnel could have a material adverse effect on our company. Our continued growth and success also depends upon our ability to attract and retain skilled employees and on the ability of our officers and key employees to effectively manage the growth of our business through the implementation of appropriate management information systems and internal controls. If we have difficulty attracting and retaining good employees, any such difficulties could materially adversely affect our business.
Implementation of our joint venture strategy may not be successful, which could affect our ability to increase our revenue or profitability and result in the impairment of acquired intangible assets.
We have in the past partnered, and will in the future consider joint ventures with or acquisition of, businesses and technologies in the machine vision industry. Our business may be negatively impacted by risks related to those acquisitions. These risks include, among others:
| | · | The inability to find or close attractive acquisition opportunities, |
| | · | The diversion of management’s attention from other operational matters, |
| | · | The inability to realize expected benefits resulting from the acquisition, |
| | · | Difficulties or delays in integrating the personnel, operations, technologies, products and systems of acquired businesses, |
| | · | Disagreements with joint venture partners, |
| | · | The failure to retain key customers or employees, and |
| | · | The impairment of acquired intangible assets resulting from lower-than-expected cash flows from the acquired assets. |
Joint ventures and acquisitions are inherently risky and the inability to effectively manage these risks could have a material adverse effect on our operating results.
Global economic conditions may negatively impact our operating results.
As we have a significant business presence in other countries throughout the world, our revenue levels are impacted by global economic conditions. If global economic conditions were to deteriorate, our revenue and our ability to generate operating profits could be materially adversely affected.
Unfavorable economic condition could negatively impact our business, including the following risks:
| · | Our customers may not have sufficient cash flow or access to financing to purchase our products, |
| · | Our customers may not pay us within agreed upon terms or may default on their payments altogether, |
| · | Our vendors may be unable to fulfill their delivery obligations to us in a timely manner, |
| · | Lower demand for our products may result in charges for excess and obsolete inventory, |
| · | Lower cash flows may result in impairment charges for acquired intangible assets or goodwill, and |
| · | A decline in our stock price may make stock options a less attractive form of compensation and therefore more difficult or expensive for us to retain our employees. |
Our operating results have been materially adversely affected in the past, and could be materially adversely affected in the future, as a result of unfavorable economic conditions and reduced capital spending by manufacturers worldwide.
Financial, political, and other risks associated with international sales and operations could adversely affect our business and operating results.
In 2016, approximately 62% of our revenue was derived from customers located outside of the United States. During 2017, approximately 65% of our revenue was derived from customers located outside of the United States. We intend to continue to expand our sales and operations outside the United States and expand our presence in international markets. As a result, our business is subject to the risks inherent in international sales and operations, including, among other things:
| · | Global political developments, |
| | · | Various regulatory and statutory requirements, |
| | · | Difficulties in injecting and repatriating cash, |
| | · | Export and import restrictions, |
| | · | Transportation delays, |
| | · | Employment regulations and local labor conditions, |
| | · | Difficulties in staffing and managing foreign sales operations, |
| | · | Instability in economic or political conditions, |
| | · | Difficulties protecting intellectual property, |
| | · | Business systems connectivity issues, and |
| | · | Potentially adverse tax consequences. |
Any of these factors could have a material adverse effect on our operating results.
The status of our joint venture in China is uncertain.
In 2015, we formed a joint venture (“JV”) with Dandong Xintai Electric Company Ltd. (“Dandong Xintai”). In connection with the formation of the JV, Dandong Xintai became an investor in Coherix, Inc. and was granted a board seat pursuant to an investors’ rights agreement. When we formed the JV with Dandong Xintai, Dandong Xintai was a listed public company in China; in June 2017, Dandong Xintai was delisted by the relevant Chinese securities authority. In September 2017, the company was told by a Dandong Xintai representative that Dandong Xintai was in bankruptcy proceedings in China. Recently, the company was informed that Dandong Xintai is now in reorganization proceedings in China. The company has not been able to verify whether Dandong Xintai was in bankruptcy or is now in reorganization proceedings under applicable Chinese law.
On September 27, 2017, we delivered a certified letter to Dandong Xintai, terminating the joint venture contract, based on Dandong Xintai’s defaults under the joint venture contract. Dandong Xintai responded to the letter via e-mail on October 10, 2017 and in a formal letter that was delivered to the company on October 17, 2017, objecting to our unilateral termination of the joint venture contract. Shortly after we sent the letter terminating the JV contract, our Board approved the formation of a WFOE in Shanghai. Dandong Xintai, which has a representative on our Board, objected to this decision. Early in 2018, the Board, including the director appointed by Dandong Xintai, provided written authorization to purchase a Shanghai company and we formed a WFOE to sell our products in China. We have a limited number of employees still on the payroll of the JV while we complete the JV’s existing purchase orders. As of June 30, 2018, we also had approximately $455,619 in past due receivables to collect from the JV. Dandong Xintai believes that the establishment of the WFOE may violate the joint venture contract the company has with Dandong Xintai in China. It has indicated it believes it may have rights under the terminated contract. However, as of the date of this Offering Circular, Dandong Xintai has not taken any legal action against the company with respect to this dispute. We cannot predict whether Dandong Xintai’s reorganization, or its objections to our formation of the WFOE and our sales of the company’s products through the WFOE, will affect the company and/or our operations in China.
The trade war between the United States and China may have a negative impact on our business.
Changes in international trade duties and other aspects of international trade policy, both in the United States and abroad, could materially impact our business. For example, China announced 20% tariffs on optical instruments covering our products. With the establishment of our China WFOE in 2018, we have been shipping sensor products to fulfill customer orders in the Chinese market during 2018 tariff free. However, future shipments will be subject to tariffs of up to 20%. For example, should the tariffs remain in place, our next shipment, estimated at $500,000, would incur an additional cost of $100,000 in tariffs. Accordingly, any additional tariffs or government actions related to international trade agreements or policies has the potential to further adversely impact demand for our products, our costs, customers, suppliers and/or the US economy or certain sectors thereof and, thus, to adversely impact our businesses.
Fluctuations in foreign currency exchange rates could adversely affect our reported results, liquidity, and competitive position.
Although, the majority of our business is done in US currency, we may face exposure to foreign currency exchange rate fluctuations in the future. We estimate that approximately 3% of our sales in 2016 and 11% in 2017 were invoiced in currencies other than the US Dollar. Changes in the relative strength of the US Dollar (for example, strengthening of the value of the dollar, making our products more expensive) may have a material impact on our operating results.
Investment in technologies, products, and regions that are unprofitable could have a negative impact on our company.
For several years the company has invested heavily in the development of certain technologies and products, as well as in establishing its presence in several global regions to support the global footprints of its large customers (such as General Motors, Ford, and Fiat Chrysler Automotive). This has resulted in several consecutive years of unprofitable operations, although in 2017 the company achieved a net profit. Although the company’s overall financial performance has reached a state of profitable operations, there are no assurances that this trend will continue. Furthermore, to rapidly accelerate global sales of the company’s product lines, the company intends that some of the proceeds from this offering will be used to increase sales and marketing personnel globally, which would increase the operating expenses, and may cause the company to experience net losses.
Risks Related to the Offering and Investment
We have not paid cash dividends on Common Stock in the past and do not expect to pay dividends in the future. Any return on investment may be limited to the value of our Common Stock.
We have never paid cash dividends on our Common Stock and do not anticipate doing so in the foreseeable future. The payment of dividends on our Common Stock will depend on earnings, financial condition and other business and economic factors affecting us at such time as our board of directors may consider relevant. If we do not pay dividends, our Common Stock may be less valuable because a return on your investment will only occur if our stock price appreciates.
There is currently no trading market for our Common Stock and we cannot ensure that one will ever develop or be sustained.
There is no current market for any of our shares of stock and a market may not develop. We hope to eventually apply to list our Common Stock on the Nasdaq Capital Market (“NASDAQ”) if we raise enough money in this offering, but there is no guarantee that we will be able to do so (see “--We may not satisfy NASDAQ’s initial quotation standards and, even if we do, we may be removed from quotation in the future.”). If not quoted on NASDAQ, shares of Common Stock, when issued, may be traded on the over-the-counter market to the extent any demand exists. Even if quoted on NASDAQ, a liquid trading market may not develop. Investors should assume that they may not be able to liquidate their investment for some time, or be able to pledge their shares as collateral.
We may need to implement additional finance and accounting systems, procedures and controls as we grow our business and organization and to satisfy new reporting requirements.
We are required to comply with a variety of reporting, accounting, and other rules and regulations and those rules and requirements will become more extensive if we become a public company. Compliance with existing requirements is expensive. Further requirements may increase our costs and require additional management time and resources. We may need to implement additional finance and accounting systems, procedures and controls to satisfy our reporting requirements. If our internal controls over financial reporting are determined to be ineffective, such failure could cause investors to lose confidence in our reported financial information, negatively affect the market price of our Common Stock, subject us to regulatory investigations and penalties, and adversely impact our business and financial condition.
We have not conducted an evaluation of the effectiveness of our internal control over financial reporting and will not be required to do so until we are a public company. If we are unable to implement and maintain effective internal control over financial reporting investors may lose confidence in the accuracy and completeness of our financial reports and the market price of our Common Stock may be negatively affected.
We hope to list as a public company eventually, and at that time various accounting rules applicable to public companies will apply to us. We can make no assurances that we have the procedures in place to make sure we meet those requirements, and compliance will be a burden. If and when required, our independent registered public accounting firm is unable to express an opinion as to the effectiveness of our internal control over financial reporting, at that time, investors may lose confidence in the accuracy and completeness of our financial reports and the market price of our Common Stock could be negatively affected, and we could become subject to investigations by the stock exchange on which our securities are listed, the SEC, or other regulatory authorities, which could require additional financial and management resources.
There may be implications of being an Emerging Growth Company.
As an issuer with less than $1 billion in total annual gross revenues during our last fiscal year, we will qualify as an “emerging growth company” under the Jumpstart Our Business Startups Act of 2012 (the “JOBS Act”). An emerging growth company may take advantage of certain reduced reporting requirements and is relieved of certain other significant requirements that are otherwise generally applicable to public companies. In particular, as an emerging growth company, even if and when we become registered with the SEC, we:
| · | Would not be required to obtain an auditor attestation on our internal control over financial reporting pursuant to the Sarbanes-Oxley Act of 2002; |
| · | Would not be required to provide a detailed narrative disclosure discussing our compensation principles, objectives and elements and analyzing how those elements fit with our principles and objectives (commonly referred to as “compensation discussion and analysis”); |
| · | Would not be required to obtain a non-binding advisory vote from our stockholders on executive compensation or golden parachute arrangements (commonly referred to as the “say-on-pay,” “say-on-frequency” and “say-on-golden-parachute” votes); |
| · | Would be exempt from certain executive compensation disclosure provisions requiring a pay-for-performance graph and CEO pay ratio disclosure; |
| · | Could present only two years of audited financial statements and only two years of related Management’s Discussion and Analysis of Financial Condition and Results of Operations; and |
| · | Would be eligible to claim longer phase-in periods for the adoption of new or revised financial accounting standards under §107 of the JOBS Act. |
We intend to take advantage of all of these reduced reporting requirements and exemptions, including the longer phase-in periods for the adoption of new or revised financial accounting standards under §107 of the JOBS Act. Our election to use the phase-in periods may make it difficult to compare our financial statements to those of non-emerging growth companies and other emerging growth companies that have opted out of the phase-in periods under §107 of the JOBS Act.
Under the JOBS Act, we may take advantage of the above-described reduced reporting requirements and exemptions for up to five years after our initial sale of common equity pursuant to a registration statement declared effective under the Securities Act, or such earlier time that we no longer meet the definition of an emerging growth company. Note that this offering, while a public offering, is not a sale of common equity pursuant to a registration statement, since the offering is conducted pursuant to an exemption from the registration requirements. In this regard, the JOBS Act provides that we would cease to be an “emerging growth company” if we have more than $1 billion in annual revenues, have more than $700 million in market value of our Common Stock held by non-affiliates, or issue more than $1 billion in principal amount of non-convertible debt over a three-year period.
We may not satisfy NASDAQ’s initial quotation standards and, even if we do, we may be removed from quotation in the future.
We hope to eventually apply to quote our Common Stock on NASDAQ. Our Common Stock will not commence trading on NASDAQ until a number of conditions are met, including that we have raised the minimum amount of offering proceeds necessary for us to meet the initial quotation requirements of NASDAQ. There is no guarantee that we will be able to sell a sufficient number of shares to raise the proceeds required. In addition, in order to be quoted on NASDAQ, we will be required to, among other things, file with the SEC a post qualification amendment to the Offering Statement of which this Offering Circular forms a part, and then file an SEC Form 8-A in order to register our shares under the Securities Exchange Act of 1934, as amended (the “Exchange Act”). The post qualification amendment of the Offering Statement is subject to review by the SEC, and there is no guarantee that such amendment will be qualified quickly after filing. Any delay in the qualification of the post qualification amendment may cause a delay in the initial trading of our Common Stock on NASDAQ. For all of the foregoing reasons, you may experience a delay between the closing of your purchase of our Common Stock and the commencement of exchange trading of our Common Stock, if such trading were ever to be initiated.
In the event we are able to quote our Common Stock on NASDAQ, we will be required to meet certain financial, public float, bid price and liquidity standards on an ongoing basis in order to continue the quotation of our Common Stock. If we fail to meet these continued listing requirements, our Common Stock may be subject to removal from quotation. If our Common Stock were to no longer be quoted on NASDAQ and we could not list or quote our Common Stock on another national securities exchange, we expect our securities would be quoted on an over-the-counter market. If this were to occur, our stockholders could face significant material adverse consequences, including limited availability of market quotations for our Common Stock and reduced liquidity for the trading of our securities. In addition, we could experience a decreased ability to issue additional securities and obtain additional financing in the future.
Investors in this offering are bound by the governing law and jurisdiction provision contained in the subscription agreement, which limits an investor’s ability to bring lawsuits in connection with this offering.
Investors agree to be bound by the governing law and jurisdiction provisions contained in the subscription agreement. These provisions apply to claims that may be made regarding this offering and, among other things, limit the ability of investors to seek remedies outside of the State of Michigan. As such, these provisions may limit an investor’s ability to bring a claim in a judicial forum that the investor believes is favorable for such disputes and may discourage lawsuits with respect to such claims, or investors located outside the State of Michigan may have difficulty bringing a legal claim against the company due to geographic limitations. This limitation is likely to result in increased costs, both in terms of time and money, to individual investors who wish to pursue claims against us.
You will experience future dilution as a result of future equity offerings.
We may in the future offer additional shares of our Common Stock or other securities convertible into or exchangeable for our Common Stock. Although no assurances can be given that we will consummate a financing, in the event we do, or in the event we sell shares of Common Stock or other securities convertible into shares of our Common Stock in the future, additional and substantial dilution will occur. In addition, investors purchasing shares or other securities in the future could have rights superior to investors in this offering. Subsequent offerings at a lower price (a “down round”) could result in additional dilution.
USE OF PROCEEDS
The company estimates that, at a per share price of $6.00, the net proceeds from the sale of 2,500,000 shares in this offering will be approximately $14,500,000, after deducting the estimated offering expenses of approximately $500,000 (including marketing, other legal and accounting professional fees, technology fees associated with hosting our offering online and other expenses).
The following table sets forth a breakdown of our estimated use of our net proceeds as we currently expect to use them, assuming the sale of, respectively, 25%, 50%, 75% and 100% of the maximum number of shares offered for sale in this offering.
| | | 100% Shares | | | % | | | 75% Shares | | | % | | | 50% Shares | | | % | | | 25% Shares | | | % | |
| Assumed percentage of shares sold | | Sold | | | Total | | | Sold | | | Total | | | Sold | | | Total | | | Sold | | | Total | |
| Gross Proceeds | | $ | 15,000,000 | | | | | | | $ | 11,250,000 | | | | | | | $ | 7,500,000 | | | | | | | $ | 3,750,000 | | | | | |
| Offering Expenses | | $ | 500,000 | | | | 3% | | | $ | 375,000 | | | | 3% | | | $ | 315,000 | | | | 4% | | | $ | 315,000 | | | | 8% | |
| Global Sales and Marketing | | $ | 5,000,000 | | | | 33% | | | $ | 5,000,000 | | | | 44% | | | $ | 2,500,000 | | | | 33% | | | $ | 1,000,000 | | | | 27% | |
| Debt Reduction | | $ | 5,000,000 | | | | 33% | | | $ | 3,750,000 | | | | 33% | | | $ | 2,500,000 | | | | 33% | | | $ | 2,400,000 | | | | 64% | |
| Product Development | | $ | 2,000,000 | | | | 13% | | | $ | 1,000,000 | | | | 9% | | | $ | 500,000 | | | | 7% | | | $ | 0 | | | | 0% | |
| General Administration | | $ | 1,000,000 | | | | 7% | | | $ | 750,000 | | | | 7% | | | $ | 375,000 | | | | 5% | | | $ | 0 | | | | 0% | |
| Working Capital & All Other General Corporate Purposes | | $ | 1,500,000 | | | | 10% | | | $ | 375,000 | | | | 3% | | | $ | 1,310,000 | | | | 17% | | | $ | 35,000 | | | | 1% | |
| Total Use of Proceeds | | $ | 15,000,000 | | | | 100% | | | $ | 11,250,000 | | | | 100% | | | $ | 7,500,000 | | | | 100% | | | $ | 3,750,000 | | | | 100% | |
The expected use of net proceeds from this offering represents our intentions based on our current plans and business conditions, which could change in the future as our plans and business conditions evolve and change. The amounts and timing of our actual expenditures, specifically with respect to working capital, may vary significantly depending on numerous factors.As a result, the company reserves the right to change the above use of proceeds if management believes it is in the best interests of the company.
In the event we do not sell all of the shares being offered, we may seek additional financing from other sources to support the intended use of proceeds indicated above. If we secure additional equity funding, investors in this offering would be diluted.
Restructuring and repayment of debt
The company is currently seeking a $15 million credit facility for working capital, general corporate purposes, and debt restructuring. We are in the due diligence stage of this negotiation and there is no guarantee the company will be successful in securing the credit facility, and in all events, there can be no assurance that additional financing would be available to use when wanted or needed and, if available, on terms acceptable to us. See “Management’s Discussion and Analysis of Financial Condition and Results of Operations – Liquidity and Capital Resources – Line of Credit.”
We plan to use certain of the net proceeds of this offering to repay the following debt:
| · | $1,497,087 in principal amount of convertible debentures owed to investors and service providers who accepted notes in lieu of cash payments. |
| · | $1,036,657, representing 50% of the principal and interest owed to Volvo Group under a promissory note. |
| · | $1,616,293 owed to employees and consultants under the Top Hat Deferred Compensation Plan. |
| · | $849,963 in accrued and unpaid dividends to the former holders of shares of our preferred stock. |
Dilution
Dilution means a reduction in value, control or earnings of the shares the investor owns.
Immediate Dilution
An early-stage company typically sells its shares (or grants options over its shares) to its founders and early employees at a very low cash cost, because they are, in effect, putting their “sweat equity” into the company. Coherix has a long standing and broadly based option grant program with all full time team members participating.
When the company seeks cash investments from outside investors, like you, the new investors typically pay a much larger sum for their shares than the founders or earlier investors, which means that the cash value of your stake is diluted because all the shares are worth the same amount, and you paid more than earlier investors for your shares.
The following table demonstrates the dilution new investors will experience upon investment in the company. The table uses the company’s net tangible book value deficit as of June 30, 2018 of ($18,988,215), which is derived from the net equity of the company per the unaudited interim financial statements reduced by the value of intangible assets as presented in this Offering Circular.
The table presents four scenarios: the sale in this offering of 625,000 shares (representing proceeds of $3,750,000); 1,250,000 shares (representing proceeds of $7,500,000), 1,875,000 shares (representing proceeds of $11,250,000) and 2,500,000 shares (representing proceeds of $15,000,000).
| | | Assuming the sale of offered shares | |
| | | 25% sold | | | 50% sold | | | 75% sold | | | maximum | |
| SHARES OFFERED | | 625,000 | | | 1,250,000 | | | 1,875,000 | | | 2,500,000 | |
| Offering price per share | | $ | 6.00 | | | $ | 6.00 | | | $ | 6.00 | | | $ | 6.00 | |
| | | | | | | | | | | | | | | | | |
| Offering proceeds before transaction expenses | | $ | 3,750,000 | | | $ | 7,500,000 | | | $ | 11,250,000 | | | $ | 15,000,000 | |
| Offering expenses | | $ | 315,000 | | | $ | 315,000 | | | $ | 375,000 | | | $ | 500,000 | |
| Net proceeds from offering | | $ | 3,435,000 | | | $ | 7,185,000 | | | $ | 10,875,000 | | | $ | 14,500,000 | |
| | | | | | | | | | | | | | | | | |
| Net tangible book value per share before offering | | $ | (1.45 | ) | | $ | (1.45 | ) | | $ | (1.45 | ) | | $ | (1.45 | ) |
| | | | | | | | | | | | | | | | | |
| Shares issued before the offering | | | 13,091,200 | | | | 13,091,200 | | | | 13,091,200 | | | | 13,091,200 | |
| Shares outstanding after the offering | | | 13,716,200 | | | | 14,341,200 | | | | 14,966,200 | | | | 15,591,200 | |
| | | | | | | | | | | | | | | | | |
| Net tangible book value per share after offering | | $ | (1.13 | ) | | $ | (0.82 | ) | | $ | (0.54 | ) | | $ | (0.29 | ) |
| | | | | | | | | | | | | | | | | |
| Net increase in net tangible book value per share to original stockholders | | $ | 0.32 | | | $ | 0.63 | | | $ | 0.91 | | | $ | 1.16 | |
| Decrease in investment to new stockholders | | $ | 7.13 | | | $ | 6.82 | | | $ | 6.54 | | | $ | 6.29 | |
| Dilution to new stockholders (%) | | | 119% | | | | 114% | | | | 109% | | | | 105% | |
The tangible net book value in the above table does not reflect the possible exercise of all options (1,314,140) and warrants (1,171,046) outstanding as of June 30, 2018. The options and warrants have exercise prices that range from $0.25 to $5.00 and include a cashless exercise feature. If all of the outstanding options and warrants were to be exercised, such exercise would provide $3,221,019 of proceeds and result in the issuance of 2,485,186 additional shares of Common Stock. The table above also excludes 1,767,088 shares related to options available for future grants under our existing stock option plan.
Future Dilution
Another important way of looking at dilution is the dilution that happens due to future actions by the company. The investor’s stake in a company could be diluted due to the company issuing additional shares. In other words, when the company issues more shares, the percentage of the company that you own will go down, even though the value of the company may go up. You will own a smaller piece of a larger company. This increase in number of shares outstanding could result from a stock offering (such as an initial public offering, a venture capital round, angel investment), employees exercising stock options, or by conversion of certain instruments (e.g. convertible bonds, preferred shares or warrants) into stock.
If the company decides to issue more shares, an investor could experience value dilution, with each share being worth less than before, and control dilution, with the total percentage an investor owns being less than before. There may also be earnings dilution, with a reduction in the amount earned per share (though this typically occurs only if the company offers dividends, and most early stage companies are unlikely to offer dividends, preferring to invest any earnings into the company).
The type of dilution that hurts early-stage investors most occurs when the company sells more shares in a “down round,” meaning at a lower valuation than in earlier offerings.
An example of how this might occur is as follows (numbers are for illustrative purposes only):
| · | In June 2017 Jane invests $20,000 for shares that represent 2% of a company valued at $1 million. |
| | · | In December the company is doing very well and sells $5 million in shares to venture capitalists on a valuation (before the new investment) of $10 million. Jane now owns only 1.3% of the company but her stake is worth $200,000. |
| | · | June 2018 the company has run into serious problems and in order to stay afloat it raises $1 million at a valuation of only $2 million (the “down round”). Jane now owns only 0.89% of the company and her stake is worth only $26,660. |
This type of dilution might also happen upon conversion of convertible notes into shares. Typically, the terms of convertible notes issued by early-stage companies provide that in the event of another round of financing, the holders of the convertible notes get to convert their notes into equity at a “discount” to the price paid by the new investors, i.e., they get more shares than the new investors would for the same price. Additionally, convertible notes may have a “price cap” on the conversion price, which effectively acts as a share price ceiling. Either way, the holders of the convertible notes get more shares for their money than new investors. In the event that the financing is a “down round”, the holders of the convertible notes will dilute existing equity holders, and even more than the new investors do, because they get more shares for their money. Investors should pay careful attention to the amount of convertible notes that the company has issued (and may issue in the future, and the terms of those notes.
If you are making an investment expecting to own a certain percentage of the company or expecting each share to hold a certain amount of value, it’s important to realize how the value of those shares can decrease by actions taken by the company. Dilution can make drastic changes to the value of each share, ownership percentage, voting control, and earnings per share.
MANAGEMENT’S DISCUSSION AND ANALYSIS OF FINANCIAL CONDITION AND RESULTS OF OPERATIONS
Financial Results
You should read the following discussion and analysis of our financial condition and results of our operations together with our consolidated financial statements and the notes thereto appearing elsewhere in this Offering Circular. This discussion contains forward-looking statements reflecting our current expectations, whose actual outcomes involve risks and uncertainties. Actual results and the timing of events may differ materially from those stated in or implied by these forward-looking statements due to a number of factors, including those discussed in the sections entitled “Risk Factors,” “Statement Regarding Forward-Looking Statements,” and elsewhere in this Offering Circular.
Overview
Since our incorporation in 2003, we have been engaged primarily in the design and manufacturing of 3D vision products for the automotive and semiconductor industries. Among the products offered, the company produces digital holographic imaging and 3D imaging technologies and related equipment that provide “on-the-fly” measurements within very tight tolerances. Our prospects must be considered in light of the uncertainties, risks, expenses, and difficulties frequently encountered by companies in their early stages of operations. We expect to incur additional net expenses over the next several years as we continue to maintain and expand our existing operations. The amount of future losses and when, if ever, we will achieve sustained profitability are uncertain.
Results of Operations
The company’s operations include Coherix, Inc., and its wholly-owned subsidiaries which include Coherix Asia Pte. Ltd., located in Singapore, Coherix Europe GmbH, located in Germany, Coherix Europe AB, located in Sweden, and, since March 2018, Coherix China, Inc., located in Shanghai China. Coherix Europe AB was liquidated and dissolved on January 22, 2017.
We derive revenues primarily from the purchases of our products and software to be used in manufacturing plants. The company also has a revenue licensing agreement for usage of certain intellectual property. As of June 30, 2018, we have 175 customers.
The company recognizes revenues when persuasive evidence of an arrangement exists, delivery has occurred, the fee is fixed or determinable, and collectability is probable. In instances when a product has to be completed based on customer specifications, revenue is deferred until tested and approved by the customer. Service and machine rental revenue is generally recognized once services are performed or based on the rental term. In the case of contracts with milestones, the company recognizes revenue for contingent consideration earned from the achievement of a substantive milestone in the entirety in the period in which the substantive milestone is achieved. The company also has a revenue licensing agreement for usage of certain intellectual property. Licensing from the usage of the intellectual property is recorded based on a third party’s use of the property, on a licensing fee per item sold basis.
Results of Operations for the Years Ended December 31, 2017 and December 31, 2016
Net Revenue
Net revenues were $9,383,866 for the year ended December 31, 2017, an increase of 89% compared with $4,962,203 for 2016. Product mix and volumes favorably impacted the sales growth on a year-over-year basis. Predator3D sensor revenues were $3,303,252 during the year ended December 31, 2017, an increase of 382% compared with $685,690 during 2016, primarily as a result of new business in adhesive dispenser controls and continued growth in automotive body and powertrain error-proofing applications. Robust3D revenues were $252,765 in 2017, an increase of 196% compared with $85,270 during 2016 due to the ramp up of marketing efforts for this new product. Saber3D revenues were $1,207,088, an increase of 324% compared with $284,887 for 2016, resulting from additional volumes in the semiconductor error-proofing applications. License fee revenues associated with the Panasonic contract were $3,573,960 in 2017, an increase of 66% compared with $2,157,180 during 2016. Offsetting these increases were volume decreases in ShaPix sales, resulting in net revenues of $789,558 in 2017, a decrease of 43% compared with $1,384,039 during 2016, and a decrease in other revenue of 30% resulting in revenue of $257,243 in 2017 compared with $365,237 during 2016.
Cost of Revenues
Cost of revenues consists of material, labor and overhead related to our product revenue and increased from $1,179,442 in 2016 to $2,202,011 in 2017. The increase is due to the costs associated with the higher Predator3D sensor revenue and the semiconductor error proofing application revenue over the prior year. The company’s gross profit percentage based upon net revenue increased slightly to 76.5% in 2017 from 76.2% in 2016. The gross profit percentage based upon product revenue, which excludes licensing revenue, increased to 60.4% in 2017 from 51.7% in 2016.
Operating Expenses
Company operating expenses grew from $5,320,961 in 2016, to $5,749,249 in 2017. The primary components of our operating expenses are product development, sales and marketing, and general administrative costs. The growth in operating expenses was driven by an increase in US-based sales and customer support expense of $461,543, an increase of approximately $322,000 of royalties associated with Predator3D sales over the royalty expense recognized in 2016 (totaling approximately $426,000 for 2017 based upon 2017 Predator sales), partially offset by a reduction in R&D project expenses of $260,907 related to the timing of new product investments and approximately $94,000 in other cost improvements. The Predator royalty expense approximates 13.5% of total Predator3D product sales through 2026 per the terms of the Predator program. The company expects to use a portion of the net proceeds of the offering to expand sales and customer support investments in key overseas industrial markets to increase revenue growth.
Operating Income (Loss)
Operating income increased to $1,433,606 for 2017, or 15.3% of net revenues, an improvement from an operating loss of ($1,538,100) or (31%) of net revenues for 2016.
Interest Expense
Interest expense increased 11% from $1,125,850 in 2016 to $1,251,772 in 2017, as financing activities continued to include an increase in interest based long-term debt, line of credit borrowings and capital lease financing. The company expects to use some of the net offering proceeds to retire current debts and certain note holders to convert to Common Stock, which will begin to reduce interest expense.
Net Income (Loss)
As a result of the foregoing factors, the company achieved profitability, recording net income of $293,250 in 2017, compared with a net loss of ($2,658,370) in 2016.
Results of Operations for the Six Months Ended June 30, 2018 and June 30, 2017
Net Revenue
Net revenues were $5,740,643 for the six months ended June 30, 2018, an increase of 47% compared with $3,910,349 during the six months ended June 30, 2017. Product mix and volumes impacted the sales growth on a year-over-year basis. Predator3D sensor revenues were $3,014,441 during the six months ended June 30, 2018, an increase of 155% compared with $1,180,389 for the same 2017 period, primarily as a result of increased volumes with two key North American automotive companies and our first sales by the China WFOE. Robust3D revenues were $221,289 for the six months ended June 30, 2018. Since this product is in the early marketing phase of the product life cycle, there was no revenue generated for Robust3D during the six months ended June 30, 2017. License fee revenues associated with the Panasonic contract were $1,917,270 during the six months ended June 30, 2018, an increase of 36% compared with $1,409,000 during the same 2017 period. Other revenue amounted to $252,214 during the six months ended June 30, 2018, an increase of 126% compared with $111,581 for the same 2017 period due to new R&D activity for a customer. Offsetting these increases were decreases in Saber3D revenues which totaled $213,333 during the six months ended June 30, 2018, a decrease of 60% compared with $536,154 for the same 2017 period, resulting from lower volumes in the semiconductor error-proofing applications; and lower ShaPix volumes resulting in net revenues of $136,008 during the six months ended June 30, 2018, a decrease of 80% compared with $673,225 for the same 2017 period, due to lower customer demand for this product in 2018.
Cost of Revenues
Cost of revenues consists of material, labor and overhead related to our product revenue and increased from $912,248 for the six months ended June 30, 2017 to $1,327,618 for the six months ended June 30, 2018. This increase is primarily due to the product costs associated with the higher Predator 3D sensor revenue offset by the net volume reductions in the other error-proofing applications revenue over the prior period. The company’s gross profit percentage based upon net revenue increased slightly to 76.9% for the six months ended June 30, 2018 as compared to 76.7% for the same period in 2017. The company’s gross profit percentage based upon product revenue, which excludes licensing revenue, increased slightly to 62.8% for the six months ended June 30, 2018 as compared to 61.8% for the same period in 2017.
Operating Expenses
Company operating expenses grew just over $1 million to $3,680,325 in the first six months of 2018 compared to $2,659,115 during the first six months of 2017. Current year expense includes an increase in accounting and legal professional fees related to two current year initiatives: the opening in the first quarter of 2018 of the China-based WFOE, which also accounted for about $170,000 in new sales, general and administrative and engineering operating expenses as we added our first employees in China, and the restructuring of the outstanding debt, which required the audits of the 2016 and 2017 financial results. The remainder of the increase was primarily higher compensation, commissions, and royalties. The royalties associated with Predator3D sales totaled approximately $392,000 during the six months ended June 30, 2018 (an increase of approximately $239,000 over the royalty expense recognized in the same 2017 period). The Predator royalty expense approximates 13.5% of the total Predator3D product sales through 2026 per the terms of the Predator program.
Operating Income
Operating income increased to $732,700 for the first six months of 2018, or 12.8% of revenues, up from $338,986 or 8.7%, for the first six months of 2017.
Interest Expense
Interest expense declined slightly to $647,872 in the first six months of 2018, due to higher line of credit interest costs, offset by a decrease in long term borrowings.
Net Income (Loss)
The company achieved profitability, recording net income of $95,043 during the first six months of 2018, compared to a net loss of ($330,046) during the first six months of 2017.
Cash Flows
Years Ended December 31, 2017 and December 31, 2016
Net Cash Used in Operating Activities
Improved profitability enabled the company to reduce net cash used in operating activities to $143,497 in 2017 from $1,346,008 in 2016.
Net Cash Used in Investing Activities
Net cash used in investing activities was $508,849 and $6,740 in 2017 and 2016, respectively. In 2017 the company financed an advance of $505,275 for the establishment of a WFOE in China, a large potential market for Coherix solutions.
Net Cash Provided by Financing Activities
Net cash provided by financing activities were $1,080,518 and $1,136,992 in 2017 and 2016, respectively. Proceeds from long-term debt issuance and net borrowings on lines of credit combined contributed $1,461,396 and $902,242 in 2017 and 2016, respectively. Noncash financing activities in 2017 included $5,201,798 of conversions of long- term debt and accrued interest into shares of Common Stock, most of which occurred near the end of 2017.
Six Months Ended June 30, 2018 and June 30, 2017
Net Cash Used in Operating Activities
For the six months ended June 30, 2018, net cash used in operating activities was $445,528, an increase over the net cash used in operating activities of $275,874 in the comparable 2017 period. Operating cash generation, as a result of this year’s net income, was more than offset by a growth in inventories of $722,343 added to support the expected revenue growth.
Net Cash Provided by (Used in) Investing Activities
Net cash provided by investing activities for the six months ended June 30, 2018 was $413,509, an increase over the net cash used in investing activities of ($3,216) for the comparable 2017 period. In March 2018, the $505,275 advance made to establish a Chinese subsidiary in 2017 was transferred to a WFOE and is now reflected in the consolidated company cash as a result of the purchase of the WFOE. Offsetting this cash item is the purchase of property and equipment.
Net Cash Provided by (Used in) Financing Activities
Net cash used in financing activities for the six months ended June 30, 2018 was $172,712 as compared with net cash provided by financing activities in the corresponding 2017 period of $64,277. A reduction in net borrowings under line of credit agreements of $366,633, partially offset by lower payments on long-term debt of $77,865 and capital lease obligations of $41,998 negatively impacted net cash flows from financing activities. Noncash financing activities in the first six months of 2018 included $193,336 of conversions of long-term debt and accrued interest into shares of Common Stock.
We expect to pay down certain debt with the net proceeds from this offering.
Liquidity and Capital Resources
As of June 30, 2018, the company had cash on hand of $694,790. Funding for the company to date has come primarily from debt.
Line of Credit
As of June 30, 2018, the company had a $3 million revolving line of credit with Crestmark Bank. At June 30, 2018, the company had drawn down $1,688,293 under this line of credit. The line of credit is personally guaranteed by the company’s CEO. In October 2018, Crestmark Bank amended the company’s line of credit, increasing the line to $4 million and increasing monthly payments to $250,000 per month. As of October 15, 2018, the company has $1 million credit available under this line. See Note 9 to the company’s unaudited interim financial statements for further information. The company may replace this line of credit under the terms of the new credit facility that the company is currently in due diligence with United Capital Partners LLC. The term sheet for the new credit facility provides for a $15 million credit facility that consists of a $5 million revolving credit line and a $10 million 5-year term loan debt facility, on which the company would only make payments of interest during the first year, with principal amortized over the last four years. There can be no guarantee that the company will enter into this new line of credit.
Promissory Notes; Long-term Debt Instruments
In 2015, the company entered into promissory notes due in 2018 that bore interest at the rate of 8% per year, together with warrants with an exercise price of $3.75 for every $100,000 in principal amount of notes issued. During the first six months of 2018, the company was successful in refinancing approximately $3.1 million of the 2015 notes with 25 different noteholders with new promissory notes due in 2021. In August 2018, the company entered into an additional promissory note due in 2021 for $250,000 and issued an additional 40,000 warrants with an exercise price of $5 to one new investor.
Since June 30, 2018, the company has received $190,000 in loan proceeds from existing investors. The loans pay 10% annual interest on a monthly basis and principal payments are due in July 2020. The proceeds of these loans were used to fund the purchase of materials to build products to meet shipment demands.
Since inception, the company has also funded its operations through the issuance of long-term debt instruments, with existing investors. At June 30, 2018, long-term debt amounted to $11,706,251, of which the current portion was $5,975,345. Convertible notes in the amount of $1,497,087 are past due. A promissory note with Volvo in the principal amount of $1,973,627 is past due and in default. See Note 5 to the company’s unaudited interim financial statements. The company intends to use a portion of the net proceeds of this offering to repay the past due principal on the convertible notes and to pay 50% of the outstanding principal and interest due on the Volvo promissory note. See “Use of Proceeds.” Volvo has informed the company that, upon repayment of 50% of the outstanding principal and interest, it intends to convert the remaining principal and interest into Common Stock of the company.
Sale Leaseback Program
The company has a sale leaseback program with North Coast Capital Corporation to fund demonstration equipment used to promote the company’s products. The company has three lease programs active with North Coast Capital Corporation with total balances due of $487,933 as of June 30, 2018 and monthly payments of $12,670. This program has generated $880,250 in new capital to the company since beginning the program in December 2013.
Other Debt
In September 2013 when investor convertible debt matured, $1,832,861 in convertible debt and accrued interest were converted into promissory notes due in 2020, which pay 4% annual interest on a quarterly basis, with principal payments amortized over the last five years of the notes. As of June 30, 2018, the balance due on these promissory notes was $615,995.
The company was successful in qualifying and closing five EB-5 investments with Green Detroit Regional Center (“GDRC”). Under this program, the company has notes payable to GDRC totaling $2,500,000, representing five (5) EB-5 investors. The company pays GDRC 4% annual interest, which is paid quarterly. The company will not commence principal payments under each note until each respective EB-5 investor has satisfied all conditions to receive a permanent green card. As of the date of this Offering Circular, the company is not yet obligated to repay any of these notes.
As of June 30, 2018, the company has $1,901,458 in balances due under term loans with maturity dates that were six, twelve, eighteen and 24 months from the date of issuance. These loans pay between 10% and 16% annual interest on a monthly basis and mature between February 2019 and August 2020. The company intends to retire this debt using a portion of the term loan debt facility with United Capital Partners LLC (if the company enters into such facility) and/or cash flow from operations. A portion of this balance, $780,069, is being amortized over 18 months, with principal and 10% annual interest currently being paid monthly. The company plans to pay off higher interest term loan debt first and upon maturity of the loans.
Debt Repayment
The table below sets forth our long-term debt, deferred compensation, preferred dividends payable, accrued interest and other liabilities outstanding at June 30, 2018 and illustrates the impact on reducing such liabilities of (1) applying the net proceeds of this offering to repay debt and other liabilities, assuming this offering is fully subscribed, (2) converting the Volvo note and accrued interest on the Volvo promissory note into shares of Common Stock, and (3) the offset of notes receivable and accrued interest receivable against certain deferred compensation.
| (USD thousands) | | | | | | | | | | | | | | | |
| Description | | Priority
to Repay | | | Outstanding
at
June 30, 2018 | | | Potential
Conversion
to Equity | | | Use of Proceeds
for Repayment | | | Notes Receivable &
Accrued Interest
Used to
Offset
Liability | | | Remaining
Liabilities | |
| Long-term debt: | | | | | | | | | | | | | | | | | | | | | | | | |
| Note payable - Volvo | | 1 | | | $ | 1,974 | | | $ | (937 | ) | | $ | (937 | ) | | $ | – | | | $ | 100 | |
| Convertible notes payable | | 2 | | | | 1,497 | | | | – | | | | (1,497 | ) | | | – | | | | – | |
| Other notes payable | | | | | | 8,235 | | | | – | | | | – | | | | – | | | | 8,235 | |
| Total long-term debt | | | | | | 11,706 | | | | (937 | ) | | | (2,434 | ) | | | – | | | | 8,335 | |
| | | | | | | | | | | | | | | | | | | | | | | | | |
| Deferred compensation | | 3 | | | | 2,840 | | | | – | | | | (989 | ) | | | (1,440 | ) | | | 411 | |
| Preferred dividends payable | | 4 | | | | 850 | | | | – | | | | (850 | ) | | | – | | | | – | |
| Accrued interest | | | | | | | 6,783 | | | | (100 | ) | | | (727 | ) | | | – | | | | 5,956 | |
| Lines of credit | | | | | | | 1,722 | | | | – | | | | – | | | | – | | | | 1,722 | |
| Other liabilities | | | | | | | 1,585 | | | | – | | | | – | | | | – | | | | 1,585 | |
| Total | | | | | | $ | 25,486 | | | $ | (1,037 | ) | | $ | (5,000 | ) | | $ | (1,440 | ) | | $ | 18,009 | |
The company intends to use $936,657 of the proceeds to pay 50% of the outstanding principal plus $100,000 of the accrued interest on the note payable to Volvo. The company holds various notes receivable and accrued interest from employees and has the ability to offset these notes receivable and related accrued interest receivable with deferred compensation and related accrued interest payable owed to these individuals. The notes receivable are discussed in detail in Note 3 to the unaudited interim financial statements for the six months ended June 30, 2018.
Quantitative and Qualitative Disclosures about Market Risk
In the ordinary course of our business, we have operations outside the United States. Operations outside the United States are subject to risks inherent in operating under different legal systems and various political and economic environments. Among the risks are changes in existing tax laws, possible limitations on foreign investments and income repatriation, government price or foreign exchange controls, and restrictions on currency exchange. The company does not engage in hedging activities to mitigate its exposure to fluctuations in foreign currency exchange rates.
Coherix Asia Pte. Ltd., which is located and operates in Singapore, keeps its books and records in US Dollars (“USD”). The functional currency of Coherix Asia Pte. Ltd. is USD. Coherix Europe AB (now dissolved), which was located and operated in Sweden, kept its books and records in Swedish Krona (“SEK”), and Coherix Europe GmbH, which is located and operates in Germany, keeps its books and records in the Euro (“EUR”) and Coherix China, Inc., which is located and operates in China, keeps its books and records in the Chinese Renminbi (“RMB”). The functional currency of Coherix Europe is the EUR, the currency of the primary economic environment in which each respective subsidiary operates. Accordingly, Coherix Europe AB’s, Coherix Europe GmbH’s and Coherix China, Inc.’s financial information is translated from SEK, EUR and RMB, into USD. Assets and liabilities of each of these three entities are translated into USD based on each prevailing exchange rate at each respective balance sheet date. Revenue and expenses are translated into USD based on the average exchange rate for the respective periods. Cumulative translation adjustments are included as a separate component of stockholders’ equity in accumulated other comprehensive income (loss). Currency transaction gains or losses are generally derived from cash, receivables and payables that are stated in a currency other than the local currency, and are recognized as income or expense.
Contingencies
Certain conditions may exist as of the date the financial statements were issued, which may result in a loss to the company, but which will only be resolved when one or more future events occur or fail to occur. The company’s management, in consultation with its legal counsel as appropriate, assesses such contingent liabilities, and such assessment inherently involves an exercise of judgment. In assessing loss contingencies related to legal proceedings that are pending against the company or unasserted claims that may result in such proceedings, the company, in consultation with legal counsel, evaluates the perceived merits of any legal proceedings or unasserted claims, as well as the perceived merits of the amount of relief sought or expected to be sought therein. If the assessment of a contingency indicates it is probable that a material loss has been incurred and the amount of the liability can be estimated, then the estimated liability would be accrued in the company’s financial statements. If the assessment indicates a potentially material loss contingency is not probable, but is reasonably possible, or is probable, but cannot be estimated, then the nature of the contingent liability, together with an estimate of the range of possible loss, if determinable and material, would be disclosed. Loss contingencies considered remote are generally not disclosed unless they involve guarantees, in which case the guarantees would be disclosed.
Relaxed Ongoing Reporting Requirements
At some point after the completion of this offering, we expect to seek to qualify our Common Stock for quotation on NASDAQ and elect to become a public reporting company under the Exchange Act. If we elect to do so, we will be required to publicly report on an ongoing basis as an “emerging growth company” (as defined in the JOBS Act) under the reporting rules set forth under the Exchange Act. For so long as we remain an “emerging growth company”, we may take advantage of certain exemptions from various reporting requirements that are applicable to other Exchange Act reporting companies that are not “emerging growth companies”, including but not limited to:
| · | not being required to comply with the auditor attestation requirements of Section 404 of the Sarbanes-Oxley Act; |
| | | |
| | · | taking advantage of extensions of time to comply with certain new or revised financial accounting standards; |
| | | |
| | · | being permitted to comply with reduced disclosure obligations regarding executive compensation in our periodic reports and proxy statements; and |
| | | |
| | · | being exempt from the requirement to hold a non-binding advisory vote on executive compensation and stockholder approval of any golden parachute payments not previously approved. |
We expect to take advantage of these reporting exemptions until we are no longer an emerging growth company. We would remain an “emerging growth company” for up to five years, although if the market value of our Common Stock that is held by non-affiliates exceeds $700 million as of any June 30 before that time, we would cease to be an “emerging growth company” as of the following December 31.
If we do not become a public reporting company under the Exchange Act for any reason, we will be required to publicly report on an ongoing basis under the reporting rules set forth in Regulation A for Tier 2 issuers. The ongoing reporting requirements under Regulation A are more relaxed than for “emerging growth companies” under the Exchange Act. The differences include, but are not limited to, being required to file only annual and semi-annual reports, rather than annual and quarterly reports. Annual reports are due within 120 calendar days after the end of the issuer’s fiscal year, and semi-annual reports are due within 90 calendar days after the end of the first six months of the issuer’s fiscal year.
In either case, we will be subject to ongoing public reporting requirements that are less rigorous than Exchange Act rules for companies that are not “emerging growth companies”, and our stockholders could receive less information than they might expect to receive from more mature public companies.
OVERVIEW OF MACHINE VISION INDUSTRY
Introduction to Machine Vision
Machine vision involves the ability of a computer to observe, inspect, and scrutinize work performance by employing one or more imaging sensors, digital signal processing and analog to digital conversion. The captured data is then transferred to a computer to analyze and provide the desired output. Resolution and sensitivity are two important aspects of any machine vision system. Resolution is responsible for differentiating between objects whereas sensitivity is the machine’s ability to detect objects or weak impulses despite dim lights or invisible wavelengths.
Machine vision particularly assists in supervising work environments. It offers features such as process control, robotic guidance, and automatic inspection in industrial applications. Industrial production and manufacturing activities are becoming increasingly complicated day-by-day, creating difficulties and increasing unreliability for the human eye to keenly detect, observe, and examine production activities. Machine vision systems deploy smart cameras and image processing to perform measurements and inspections.
The intensifying need for superior inspection and increasing automation are the key influencing factors paving the way for the notable adoption of machine vision technology. Furthermore, the company believes that the need for increased quality control by consumers and manufacturers, coupled with government regulations to abide by prescribed specifications, is expected to significantly increase the adoption of machine vision technology.
The following chart describes the various products and technology in the industry.
| Solution | 3D Error-proofing | Human Inspection | 2D | Touch Probes |
| Attributes | · Leading method of high speed in-line 3D solutions · Low-maintenance, limited set up time and significantly lower cost of ownership · Offers near 100% reliability, accountability, and traceability · Shatterproof resistant and resilient to all elements of manufacturing | · Only >85% accurate in real-world applications · Costly manual labor · Highly prone to error, depending on employee experience · Visual and sight limitations | · Depends on presence of color contrast to depict an accurate image · Temperamental and error prone · Affected by dust, grease, and other manufacturing elements · Results in false readings and “no reads,” causing gaps in inspection · Less flexible to the manufacturing environment | · Cost prohibitive · Constant maintenance/ calibration · High degree of programming is required |
Hardware and Software
The machine vision industry has been segregated into hardware and software segments. Hardware components comprise several components such as cameras, sensors, processors, frame grabbers, LED lightings, optics, and others. The market for software is application-specific and fragmented based on the necessity of application.
Software Applications
With regard to applications, the market has been segmented into quality assurance and inspection, positioning and guidance, measurement, and identification. The systems are extensively used for scanning and identifying labels, barcodes, and texts, especially in the packaging sector. This automates packaging activities, thereby saving time, avoiding human errors, and increasing efficiency. The technology is frequently used in the consumer goods, pharmaceutical, and packaging sectors.
Identification using machine vision is also used in camera surveillance, monitoring traffic, or recognizing license plate numbers for security purposes.
The following chart details the global machine vision market revenue by application in 2016 (%):
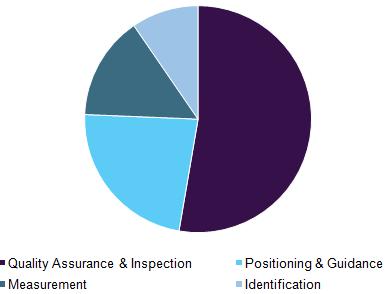
Hardware Products
The product segment can be sub-categorized into personal computer (“PC”) based products and independent smart camera systems. The PC based systems accounted for the largest market share in 2016. However, the smart camera based systems are projected to exhibit a robust growth rate over the forecast period. The segment is projected to grow at the fastest rate of 8.9% from 2017 to 2025. This considerable growth of the segment is attributable to the growing adoption of cameras in 3D imaging.
Regional Trends
The Asia Pacific region accounted for the largest share in the machine vision market in 2016. The company believes that the region will experience considerable growth and will continue to grow at a robust rate from 2017 to 2025. We believe this large market share and regional growth can be accredited to the lucrative opportunities in automotive, packaging, pharmaceutical, and other industrial applications in the Asia Pacific region.
As the region is establishing itself to become a global manufacturing hub, the technology is anticipated to gain significant traction over the forecast period. China and Japan are prominent countries which offer extensive opportunities for the emerging as well as matured technologies such as machine vision. The numerous manufacturing industries are contributing to the growth and prosperity of the region’s overall economic development.
In addition to this, the expenditure and operational benefits coupled with the initiatives being undertaken by the governments of emerging countries, such as South Korea, India, Taiwan, and Singapore, are responsible for catapulting investments and encouraging different industry players to establish their production units in the Asia Pacific region.
Furthermore, increasing investments are being carried out in research and development activities to improve machine vision technology and related developments, and prominent players are undertaking strategic initiatives such as distribution alliances, partnerships, mergers, and acquisitions. As such, all these factors are expected to propel the growth of machine vision market in the Asia Pacific region.
OUR BUSINESS
Company Information
The company was organized on October 30, 2003, as a corporation under the laws of the State of Delaware. The company was formed as RealCite Inc. and subsequently changed its name to Coherix, Inc. We have not participated in any bankruptcy, receivership, or similar proceeding. We have not had any material reclassification, merger, consolidation, or purchase or sale of a significant amount of assets not in the ordinary course of business.
Coherix was founded with the vision of becoming the world’s first true 3D machine vision company. Upon the inception of the company, founder Dwight Carlson assembled a team of former co-founders and managers from prior industry leading high technology companies that he founded, Perceptron (NASDAQ GM:PRCP) and XYCOM. The company employs a core strategy to displace incumbent 2D technology by offering more capable and cost-effective 3D solutions to solve critical manufacturing problems that the resulting solutions will sell in high volume.
Market Overview
Eyes of Automation
Error-proofing of high value assemblies is generally accomplished by human inspection, use of touch probes, 2D machine vision, and 3D machine vision. Machine vision, generally, is the technology and methods used to provide imaging-based automatic inspection and analysis, for process control, and robot guidance.
There are two general components to 3D machine vision—hardware and software. The products are either PC based or smart camera based. The application of machine vision is generally meant to accomplish:
| · | Quality assurance |
| | · | Positioning and guidance |
| | · | Measurement |
| | · | Identification |
Coherix's products act as the “Eyes of Automation” and today are primarily focused on automotive, semiconductor, electronics manufacturing, and general manufacturing, in which we are an important component of error-proofing automation systems. Coherix sells its products either directly to large end-users or through a number of channel partners. For example, large end users, such as global automotive companies, purchase factory automation systems from a variety of large global system integrators. In turn, these system integrators purchase Coherix solutions and incorporate them into their automation systems. Coherix also has significant relationships with smaller regional system integrators.
The company has other channel partners, including large global adhesive and sealant dispensing equipment companies such as Nordson, Durr, Graco, and Atlas Copco, among other smaller and more regional dispensing equipment companies.
In July 2018, Nordson developed a new dispensing controller product and integrated Coherix Predator3D to provide a fully integrated dispensing system with 3D vision capabilities. This new dispensing system is called the Process Sentry™ Integrated Vision System, providing instant quality feedback on 3 dimensional beads and dispense patterns, for higher production confidence. The system includes a vision dispense gun, Coherix sensor and bead confirmation software, integrated directly into the main system controller.
Coherix's products can help manufacturers who produce high volume assemblies achieve better quality and manufacturing efficiencies by using Coherix 3D error-proofing solutions. To date, Coherix has focused on serving end markets in which Coherix products are mission critical due to customer quality standards, industry standards, and government safety standards.
Principal Product/Services
Technology
Shortly after its inception in 2003, the company acquired a distinct software platform which would become the basis for the company’s 3D machine vision technology: i-Cite3D.Coherix purchased the company, Machine Vision Products Inc. to obtain the i-Cite™ Machine Vision software platform in 2004. The i-Cite 3D software platform development began in 1995 and currently contains over 200 proprietary, highly optimized, field-tested vision modules performing various types of inspection. I-Cite enables rapid creation of new applications and facilitates rapid prototyping. This intuitive and easy-to-use software platform supports all the company’s product lines: Predator 3D™ Saber 3D™, and Robust 3D®).
Our In-Line Inspection / Error-Proofing Solutions
Error-proofing inspection is aimed at assuring that there are zero defects in complex assemblies. Error-proofing is increasingly critical as manufacturers need to meet ever increasing customer demands. The company’s products respond to the market demand for shorter time to market, and more stringent government regulations.
Currently our three main product lines providing error-proofing solutions are the Predator3D, the Robust3D and the Saber3D.
The Predator3D
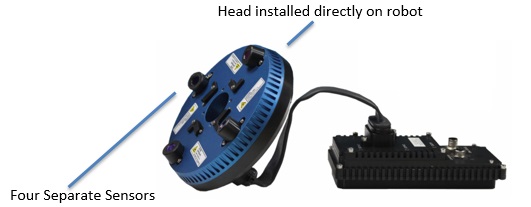
The Predator3D provides a robust 3D solution used to inspect and control the process of dispensing adhesives and sealants. Four 3D sensors in a compact disc shaped module are installed around the dispensing nozzle allowing for fast and precise bead verification.
Selected Features:
| · | Four 3D laser sensors accurately inspect the dispensed adhesive bead to 0.1 mm accuracy. |
| · | High speed integrated image processing and data transmission capabilities enable high speed 3D bead inspection to be performed at speeds up to 1,000 mm per second. |
| · | Predator3D fits seamlessly around the dispensing nozzle providing 360 degree bead verification with no need for remote expensive factory hardened computer systems. |
Differentiating Factors:
| · | Proven and reliable: machined aluminum casing makes it a factory hardened 3D solution providing immediate feedback on bead volume, shape, and location. |
| · | Once and Done: Four high speed 3D lasers sensors inspect the adhesive bead as it is being dispensed eliminating unscheduled downtime, which increases the throughput of the manufacturing process while significantly improving quality. |
| · | Easy to Integrate: Compact including sensors and processor, and is installed directly on robot and surrounds dispensing nozzle. |
| · | Rugged: Crash resistant machined aluminum ensures durability in rough manufacturing environments. |
Not impacted by changes in ambient light or part color, typically a serious problem for 2D vision systems in manufacturing environments.
Applications:

Indicative Manufacturer’s Problem:
A Tier 1 automotive supplier required a robust 3D solution to replace a dysfunctional 2D bead inspection system. The incumbent technology missed detecting gaps in sealing beads, which caused line stoppage and costly re-work. Also, if not discovered the customer risked a defective vehicle going to its end customer.
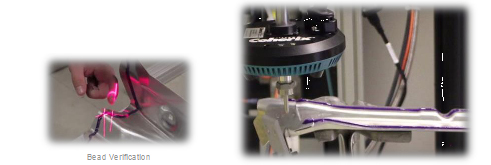
Coherix’s Solution to the Manufacturer’s Problem:
Coherix demonstrated its 3D capabilities to the original equipment manufacturer, or “OEM”, proving Predator3D provides the required accuracy, critical process information and delivers the required near 100% reliability.
Result of Coherix’s Solution of Utilizing the Predator3D:
Predator3D’s performance resulted in dollar savings and, most importantly ensured that the federal safety requirements were met. Coherix, by virtue of these results, was able to demonstrate this capability to the OEM’s Supplier Quality management, and secured additional business with other Tier 1 suppliers to this OEM.
A partial list of our Predator3D customers includes:
| · | Fiat Chrysler Automobiles |
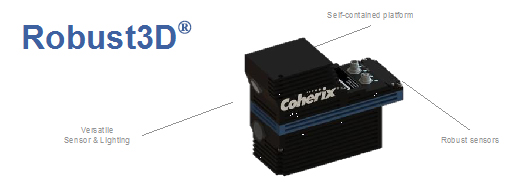
Robust3D high speed in-line error-proofing solutions are flexible and self-contained 3D vision systems meeting stringent inspection and error-proofing requirements. These products eliminate the problems with 2D vision solutions which have attempted to deliver this capability but failed do to so due to unpredictable exposure to noise, changes in ambient light and part color which causes contrast challenges.
Differentiating Factors:
| · | Robust3D solutions deliver real time 3D manufacturing process performance information to eliminate defects. |
| · | Robust3D architecture: Generates 3D models from a single sensor, providing ultimate flexibility. |
| · | Self-contained: Lighting, optics and processing all contained onboard a durable factory hardened product. |
| · | Easy to Use: One second acquisition time simplify setup and eliminates frequent adjustments typically required with 2D vision systems. |
| · | Versatile: Can be configured for a variety of error-proofing needs with software supporting measurements and positioning. |
Applications:
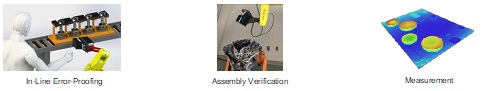
Indicative Manufacturer’s Problem:
A global automotive company was using unreliable 2D vision cameras to inspect their engine piston assemblies, which failed when changes in ambient lighting or part color changes occurred. The incumbent 2D vision cameras were continuously delivering nuisance false failures, unnecessarily stopping the line and reducing manufacturing throughput (volume).
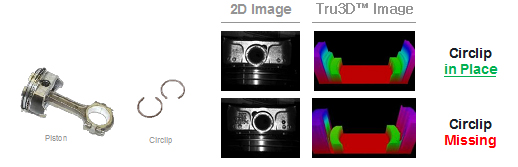
Coherix’s Solution to the Manufacturer’s Problem:
The Coherix Robust3D solution delivered near 100% reliable verification of the piston assembly eliminating nuisance failures.
Result of using the Coherix Robust3D Solution:
After solving the problem, the customer is implementing Coherix Robust3D piston assembly verification systems in their manufacturer’s bill of process, resulting in installations being made in their engine manufacturing lines around the world.
Our Robust3D customers include:
| · | Fiat Chrysler Automotive |
| · | SAIC-GM-Wuling Automobile |

The Saber3D high-speed, in-line inspection product line eliminates the need for production machines to stop the assembly to perform inspection. Saber3D is the second generation of the 3DX product line, now featuring enhanced “Field of View” resolution and speed characteristics. Reducing defects increases manufacturing throughput, resulting in improved customer profits.
Selected Features:
| · | 3D high-definition, high speed inspection capability. |
| · | Point and shoot capability needing no lasers, or line scanning. |
| · | High speed freeze frame data acquisition. |
Differentiating Factors:
| · | High Definition 3D: Multi-stereo technology increases the fidelity of information. |
| · | Snapshot measurements: used for high speed applications such as semiconductors. |
| · | Built-in Lighting: Multi-spectral LED lighting provides increased accuracy of measurements. |
| · | Self-contained: No external computing or hardware changes required for use. |
Applications:
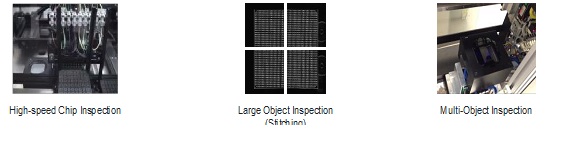
Indicative Manufacturer’s Problem:
An electronics manufacturer’s assembly division required a 3D vision system to provide accurate 3D error-proofing within its manufacturing system. In addition to accuracy, the new vision system needed to be ultra-high speed to keep up with demands of the electronics industry.
Coherix’s Solution to the Manufacturer’s Problem:
Leveraging its core software and hardware platforms, Coherix developed a self- contained, high definition 3D vision system. Multiple stereo sensors and a state-of-the-art lighting system allowed Coherix to meet the precision and definition needs of the manufacturer and its end users.
Result of Coherix’s Solution of Utilizing the Saber3D:
The high-speed Saber3D system was designed in conjunction with the manufacturer and tailored to meet precision production needs. Notably, the speed and reliability of Coherix’s Saber3D technology enabled the customer to strengthen its position as the market-leading electronic assembly machines manufacturer.
A partial list of our customers includes:
| · | UST Technology Pte. Ltd. |
Legacy Products
A portion of Coherix’s revenue comes from legacy products. The company has an agreement with Diamond International to supply previously developed software for their egg sorting machines. The software has been stable for several years requiring little support.
Another legacy product is ShaPix®. This holographic based product is a metrology product. It is highly specialized and addresses a small market segment. Today, the annual revenue is less than $1 million. The company will continue to support ShaPix products; however, the company does not intend to focus sales efforts to promote ShaPix products. The company is looking for a metrology equipment company to partner with to leverage its ShaPix technology.
University of Michigan
Over the past two decades, members of Coherix’s management have developed a close relationship with the University of Michigan (the “University”). Members of Coherix’s management and Board of Directors currently serve on the University’s advisory boards, teach, or have studied there. Coherix also employs interns upon graduation.
Professor Jun Ni
Professor Jun Ni is a Coherix Board member, and is the Director of the University of Michigan Manufacturing Research Center. He also serves as Dean of the Multi-Campus National Science Foundation Center for Intelligent Maintenance Systems. For nine years Professor Ni served as Dean of the University of Michigan/Shanghai Jiao Tong University Joint Institute. This relationship supports both Coherix and Coherix China.
In addition the company has strategic relationships with large global dispensing companies who have fully integrated Coherix products in their dispensing systems.
Competition
The machine vision market is fragmented and our competitors are typically other vendors of machine vision systems, controllers, and components; manufacturers of image processing systems, sensors, and components; and system integrators. In addition, in the semiconductor and electronics capital equipment market, and with respect to machine builders in the factory automation market, we compete with the internal engineering departments of current or prospective customers. General purpose machine vision competitors with global presence and are primarily 2D vision companies include Cognex, Keyence, and Omron. Smaller European competitors such as ISRA, Quiss and VMT have been in existence longer than Coherix, therefore, they have higher customer visibility.
Coherix’s ability to compete depends upon our ability to identify specific market niches where 3D vision technology can solve a very difficult industry need and the resulting solutions sell in high volume. The company’s competitive advantage is its experience to create, innovate, design, manufacture, and sell high-quality 3D vision products globally, as well as our ability to develop new products and functionality that meet evolving customer requirements. The primary competitive factors affecting the choice of a 3D machine vision solution include vendor reputation, product functionality and performance, ease of use, price, and post-sales support. The importance of each of these factors varies depending upon the specific customer.
Customers
OEMs and Tier 1 Suppliers (End Users)
OEMs are manufacturing companies making products like cars. The Tier 1 companies supply completed sub-assemblies to the OEMs. Our products heavily influence the use of new technologies, and help OEMs set manufacturing standards – known as the global “bill of process.” Each OEM treats procurement differently, for example, some automobile OEMs tend to do most assembling in-house and others will outsource some of this work, leading to additional opportunities for Coherix through Tier 1 suppliers. We anticipate our company’s largest opportunities are with OEMs, and Tier 1 suppliers, given our ability to support them across their global footprint.
Systems Integrators/Equipment OEMs
Systems integrators are hired by OEMs and Tier 1 suppliers to create entire manufacturing lines. Typically important products included in these manufacturing lines are specified by OEMs in their “bill of process;” however, in some cases the System Integrators will propose proven solutions. System Integrators and equipment makers have a vested interest in having reliable technology providers like Coherix, because they typically receive the first call if an issue arises at the end user.
Tier 1 Suppliers
Tier 1 suppliers are influenced by OEMs and systems integrators. Tier 1 suppliers of automotive sub-assemblies purchase Coherix products to enhance their manufacturing processes. Tier 1 sub-assemblies suppliers share the same needs for precision manufacturing systems as their OEM customers.
Customer Base
Our customer base consists of the world’s largest OEMs, system integrators, dispensing companies, and Tier 1 automotive manufacturers. Our global customer base spans across the globe and includes companies located in Taiwan, China, Singapore, Malaysia, Europe (including Germany, Italy, United Kingdom and Sweden), and the United States. Customers acknowledge the high cost of failure associated with manufacturing and heavily rely on Coherix technology throughout the manufacturing process. Current partnerships are created through product-related success. Coherix has already entrenched itself in the day-to-day operations of our customers. Coherix is currently undergoing “evaluations” and late stage discussions with more than ten industry leading Tier 1 manufacturers and OEMs.
Go-To Market Strategy
Coherix capitalizes on multiple touch points within the value chain, thus, increasing our sales opportunities. We have various touch points within organizations, from plant level to mid-level executives, enabling us to build a broad relationship footprint. We market and sell our products through distribution channels (system integrators, equipment makers, dispensing companies, Tier 1 and OEMs) enabling us to add value at different points in the process. Our distribution channels enable our 3D vision products to be spread throughout their customer’s broad geographic footprint.
Dependence on One or A Few Major Customers
Coherix has one large customer, Panasonic, which is in its seventh year of a ten year technical collaboration and license agreement (the “License Agreement”). The License Agreement is the result of the successful completion of a $5.3 million four year joint development project completed in June 2013 to develop 2D, 3D and 3DL vision cameras for use on an exclusive and non-transferable, worldwide basis in Panasonic’s electronic assembly machine products. The term “3DL” refers to a set of libraries and image transfer code that support 3D processing on the Panasonic CPU, instead of on the Coherix CPU, thereby saving the cost of Panasonic using the Coherix CPU, but at a lower 3D performance. The License Agreement is filed as an exhibit to the Offering Statement of which this Offering Circular forms a part. The License Agreement is effective until March 2022.
We have licensed to Panasonic computer object and source code, together with the intellectual property and certain documentation associated with that code, that it may use in its electronic assembly machine products. Panasonic is obligated to pay licensing fees to Coherix for each 2D, 3D and 3DL vision cameras manufactured by Panasonic as follows:
| · | $800 per 3D vision camera for the first 5,000 units sold, which fee decreases by $50 for every 5,000 units sold until the fee reaches zero; |
| · | $600 per 3DL vision camera for the first 5,000 units sold, which fee decreases by $20 for every 5,000 units sold until the fee reaches zero; |
| · | $200 per 2D vision camera for the first 5,000 units sold, which fee decreases by $10 for every 5,000 units sold until the fee reaches zero; |
| · | $200 per upgrade kit that enables Panasonic to upgrade a 3DL vison camera to a 3D vision camera; and |
| · | $400 per upgrade kit that enables Panasonic to upgrade a 2D vison camera to a 3DL vision camera. |
Under the License Agreement, the company also granted to Panasonic a non-exclusive, non-transferable and royalty-free license to use certain of the company's trademarks, including, among others, Coherix®, i-Cite™, ShaPix® andTru3D™, in connection with the sale and promotion of its products.
Very little follow on support has been needed. Any additional support provided to Panasonic is invoiced and paid.
Distribution Methods of Products and Services
Coherix engages with distributors to provide the distribution of its products and services. Coherix engages with:
| · | MSI Viking, a supplier of manufacturing measurement systems in the automotive and manufacturing engineering market to distribute Coherix products in the following states in the United States: Virginia, North Carolina, South Carolina, Georgia, Alabama, Tennessee, and Mississippi. |
| · | Marubeni Information Systems Co., Ltd, Coherix’s exclusive distributor in Japan. |
| · | Integro Technologies, VRSI, Vantage, JR Automation, are a partial list of companies that sell, and support Coherix products as part of their systems sold and marketed in the United States, Canada, and Mexico. |
| · | Visionetx, sales distributor in the United States and Europe for semiconductor sales. |
Suppliers
The company deals with a number of different suppliers:
| · | Odyssey Electronics – Provides contract manufacturing, printed circuit boards and Predator3D sub-assembly |
| · | Y-Squared – Provides contract manufacturing of cables. |
The following suppliers are currently the sole source for their products:
| · | Congatec – Provides custom, single board computer. Adding another supplier would require redesign of hardware and software. |
| · | Keynote Photonics – Custom manufacturer of digital light projector. Adding another supplier would require redesign of hardware and software. |
| · | Osela – Custom manufacturer of lasers for Predator3D product line. |
| · | Agiltron – Optical splitters Shapix products. |
| · | CMOSIS – Single source supplier of optical imagers. (Arrow Electronics is a distributor for CMOSIS imagers). |
The following are providers of raw materials:
| · | Zero Hour Parts – Provides machined components for all product lines |
| · | RTD Manufacturing –Provides machined components for all product lines |
| · | Stratasys Manufacturing – Provides supply plastic parts for the 3DX semiconductor product lines |
| · | Oz Optics – Supplies fiber optic cables for ShaPix product lines |
| · | Dell - Leases computers for Coherix, Inc. purposes and purchases for customer requirements. |
| · | Universal Kogaku – Supplies lenses for all product lines |
| · | Precise Metal – Supplies sheet metal components for all product lines |
| · | Inradoptics – Manufactures custom parabolic mirrors used in ShaPix product line |
Research and Development
In 2016 and 2017, we incurred expenses of approximately $1,615,000 and $1,385,000, respectively, for our development efforts. We expect to continue to incur significant expenditures on development. Our development efforts will focus primarily on additional enhancements to Predator3D that will enable our customers to lower costs and improve performance in the adhesive and sealant dispensing process. Another area of focus will be to further develop Predator3D for use in the electronics industry where there are higher speed, more compact and higher resolution requirements. The third development focus is to expand the number of Robust3D error-proofing applications in the automotive and electronics industries.
Intellectual Property
We need our trademark, domain names, and proprietary technology to remain competitive and we rely on trademark, copyright, patent law, trade-secret protection, and confidentiality and/or license agreements with our employees, customers, partners, and others to protect our proprietary rights. The company holds twelve registered patents in the United States, two registered in China; one registered in Europe and one registered in Japan. The Predator3D™, Tru3D™ and Saber3D™ sensor products use the i-Cite3D software platform and are covered by one pattern recognition patent registered in both the United States and China. The Saber3D hardware is covered by one patent registered in both the United States and China. The remaining patents are associated with the legacy ShaPix3D hardware and software. Hardware associated with the Predator3D, Tru3D and SHARK sensor products are not covered under any existing patent. All aspects of the company’s software and hardware are covered under trade secret protection. The company also has 3 registered trademarks Coherix®, ShaPix®, and Robust3D® with trademark registration in the United States, Europe, China, and Japan.
Legal Matters
The company is not involved in any litigation, and its management is not aware of any pending or threatened legal actions relating to its intellectual property, conduct of its business activities, or otherwise.
Certain legal matters with respect to the shares of Common Stock offered hereby will be passed upon by CrowdCheck Law LLP.
Employees
At the date of this Offering Circular, Coherix has 50 full-time employees, 3 part-time employees and 26 independent contractors. Twenty-nine full time employees and three part-time employees are based in Ann Arbor, Michigan at the company’s headquarters. All others are performing sales, marketing and application functions around in our wholly owned subsidiaries in Singapore, China and Europe.
Company’s Property
Coherix is a “capital light” company requiring very little capital equipment. We lease our headquarters space at 3980 Ranchero Drive, Ann Arbor, Michigan 48108 from Oxford Companies Ann Arbor LLC, 210 S. Fifth Avenue, P.O. Box 8200, Ann Arbor Michigan 48107.
We lease approximately 2,667 square feet of warehouse/and/or office and/or light industrial facilities designated as Suite 1B at 739 Airport Boulevard, Ann Arbor, Michigan, 48108, beginning December 4, 2015 and continues on a month-by-month lease. Airport Boulevard Associates, LLC is the landlord.
DIRECTORS, EXECUTIVE OFFICERS AND SIGNIFICANT EMPLOYEES
The directors, executive officers, and key employees are set forth in the chart below.
| Name | Position | Age | Term of Office (if
indefinite, give date
appointed) | Approximate hours per week
(if part-time)/full-time |
| Directors: |
| Dwight D. Carlson | Chairman | 74 | 2003 - present | Full time |
| Jun Ni | Director | 57 | 2012 - present | Part-time, Quarterly Board Meetings |
| Philip Rice II | Director | 64 | 2017 - present | Part-time, Quarterly Board Meeting; Annual Compensation Committee Meeting |
| Robert A. Smith | Director | 77 | 2006 - present | Part-time, Quarterly Board Meetings; Annual Compensation Committee |
| Jinyang Wen | Investor Director | 22 | 2018 - present | Part-time, Quarterly Board Meetings |
| Executive Officers: |
| Dwight D. Carlson | Chief Executive Officer (Founder) | 74 | 2003 - present | Full-time |
| Doug Davidson | Chief Technical Officer (Founder) | 59 | 2003 - present | Full-time |
| Michael Schneider | Principal Accountant, Controller | 56 | 2014 - present | Full-time |
| Key Employees: | | | |
| Dr. Zhenhua Huang | General Manager The Americas | 2006 - present | Full-time |
| David Kelly | General Manager Coherix Europe | 2011 - present | Full-time |
| Khalid Rashid | General Manager Asia Pacific | 2006 - present | Full-time |
| Alice M. Grisham | VP Administration and Human Resources (Founder) | 2004 - present | Full-time |
| Joseph Rupert | Director Manufacturing | 2012 - present | Full-time |
Dwight Carlson, CEO, Chairman and Director
Dwight Carlson has been Chairman and CEO, Founder and Director from October 30, 2003 to present. Prior to Coherix, Inc., Mr. Carlson was Founder, CEO and Director of Perceptron, Inc., taking the company public in 1992 and Founder and CEO of XYCOM, an industrial microcomputer company.
Professor Ni Jun, Director
Professor Ni Jun has been a Director from 2012 to present. He serves as an Associate Editor of the Journal of Manufacturing Systems and a Professor at the University of Michigan. He serves as the Dean of the Joint Institute between Michigan and Jiao Tong University. He has been an Independent Non-Executive Director of Eco-tek Holdings Ltd., since February 2003. He serves as Deputy Director of NSF- Engineering Research Center for Reconfigurable Manufacturing Systems. He serves as a Director in various non-profit making research centers such as the S.M. Wu Manufacturing Research Centre and the Multi-Campus National Science Foundation Centre for Intelligent Maintenance Systems of the University of Michigan. His research interests include: manufacturing process modeling, analysis and prediction; precision engineering and metrology; cutting tool development, quality control methods, intelligent maintenance systems, monitoring and fault diagnosis. He obtained his Ph.D. in 1987 from the University of Wisconsin-Madison. Professor Ni graduated from Shanghai Jiaotong University with a BS Mechanical and Production Engineering in 1982 and graduated from the University of Wisconsin-Madison with an M.S. in Mechanical Engineering in 1984.
Mr. Philip M Rice II, Director
Mr. Philip M Rice II has been a Director since July 20, 2017. He also serves on the Compensation Committee of the Board. Mr. Rice is the Chairman and Chief Financial Officer of Zivo Bioscience, Inc. (“Zivo”). Mr. Rice was appointed Chief Financial Officer of Zivo in November 2011. In January 2012, Mr. Rice was appointed to the Board of Directors. Zivo's Board currently consists of five Directors. The Board has determined that Mr. Rice qualifies as an "Audit Committee Financial Expert" as the term is defined in rules promulgated by the SEC. In 2001, Mr. Rice founded Legacy Results, LLC (now Legacy Results, Inc.) a management consulting firm providing a wide range of consulting services, including strategic planning, business plan development, turnaround management, financial management and mergers and acquisitions, and has served as its Managing Partner since that date. From December 2007 through March 2008, Mr. Rice served as chairman of the board of IMX Solutions, Inc. a technology company providing secure internet transactions including private data transactions. Mr. Rice practiced as a CPA and worked for Deloitte & Touche LLP for thirteen years before founding Legacy Results.
Mr. Robert A. Smith, Director
Mr. Robert A. Smith has been a Director since 2006 and a member of the Compensation Committee of the Board. He served as Senior Vice President at Owens-Illinois Inc. since 2003 and as General Manager, Domestic Glass Container since 2002. Mr. Smith served as Vice President of Owens-Illinois, Inc. from 1993 to 2003. Mr. Smith served as Vice President and Technical Director of Owens-Illinois, Inc. from 1998 to 2002, as Vice President, International Operations from 1997 to 1998 and as Vice President, Glass Container Manufacturing from 1993 to 1997.
Jinyang Wen, Investor Director
At the October 19, 2018 Board Meeting, Ms. Jinyang Wen was elected to the Coherix, Inc. Board of Directors as Investor Director representing Xintai US Investments LLC (”Xintai”), pursuant to the company’s investors’ rights agreement with Xintai (See “Description of Capital Stock – Amended and Restated Investors’ Rights Agreement”). She will also be added to the slate of directors for election at the November 3, 2018 Annual Stockholder Meeting. She studied in the Beijing Xindongfang English School and is attending the University of Washington from 2015 to present. Her major is in Communications. Some of her social and volunteer work includes China Giant Panda Protection and Research Center, the University of Washington Orc Outdoor Organization and employment at the University of Washington Library. She speaks fluent Chinese and English.
Douglas Davidson, Chief Technical Officer (“CTO”) Douglas Davidson is a co-founder, and since October 30, 2003, has been CTO and Chief Architect of the Coherix software suites. He previously served as Director of Software Engineering at Machine Vision Products, Inc. and Senior Manager of Software Engineering at Automated Intelligent Systems, Inc. He has 25 years of software design, implementation and management experience including UNIX, MS-DOS, board level and Microsoft Windows platforms.
Michael Schneider, Principal Accountant
Michael Schneider currently holds the position of Principal Accountant and Controller. Mr. Schneider joined the company in February 2014, and holds a BBA with Business Computer Systems Major degree from Eastern Michigan University. Mr. Schneider is an accomplished financial professional with solid and progressive experience in all facets of accounting, cash and business management. His prior experience includes Controller and CFO in Clover Technologies Group and The Wireless Source, respectfully. He has over 35 years of experience with controller responsibilities ranging from Assistant Controller to CFO.
Board of Directors' Compensation
As of July 20, 2017, the company pays a quarterly payment to each director attending and/or participating in the quarterly meetings, equal to $2,500 per meeting. In addition, directors earn annual restricted warrants to purchase 12,000 shares of Common Stock for each Director.
Compensation Committee
Today, Coherix has one Committee of the Board, the Compensation Committee. Robert Smith and Philip Rice II serve on the Compensation Committee. This Committee reviews and recommends compensation and performance bonuses for the CEO and CTO, as well as for officers of the company. In addition, the Compensation Committee of the Board reviews and recommends companywide bonus/incentive plans. The company does not currently have a Bonus or Incentive Plan for 2018; however, the Compensation Committee plans to review the need for a Total Company Incentive Plan for 2018. Beginning September 28, 2017, members of the Compensation Committee receive $500 per Compensation Committee Meeting and restricted warrants to purchase 1,000 shares of Common Stock.
EXECUTIVE COMPENSATION
We are an emerging growth company for purposes of the Commission’s executive compensation disclosure rules. In accordance with such rules, we are required to provide a summary compensation table, as well as limited narrative disclosures regarding executive compensation for our last completed fiscal year. Further, our reporting obligations extend only to our “named executive officers,” who are those individuals serving as our CEO, our CTO and our Principal Accountant and Controller who were serving as executive officers at the end of the last completed fiscal year.
For the fiscal year ended December 31, 2017, our “named executive officers” and their compensation were as follows:
| Name | | Capacities in which compensation was received | | Cash compensation ($) | | | Other compensation ($) | | | Total compensation ($) | |
| Dwight D. Carlson | | CEO/Chairman | | $ | 229,166.65 | | | $ | 29,000.00 | (1) | | $ | 258,166.65 | |
| Douglas L. Davidson | | CTO | | $ | 161,875.02 | | | $ | 2,500.00 | | | $ | 164,375.02 | |
| Michael Schneider | | Principal Accountant | | $ | 103,166.70 | | | $ | 4,000.00 | | | $ | 107,166.70 | |
| (1) | Mr. Carlson’s other compensation includes the value of options received under the 2004 Plan and warrants received in connection with his service as a Director. |
The total number of shares of Common Stock that may be issued pursuant to our 2004 Incentive and Non-qualified Stock Option Plan (the “2004 Plan”) may not exceed an aggregate of 5,100,000 shares. As of June 30, 2018, 2,018,772 shares have been issued in connection with the exercise of stock options; 1,314,140 stock options have been granted but are unexercised and 1,767,088 shares are available under the 2004 Plan for future grants.
For the fiscal year ended December 31, 2016, no cash payments were made to directors. There are five directors in this group. In July 2017, the Board approved paying $2,500 per meeting to each Director participating in a quarterly board meeting and an annual award of 12,000 restricted warrants to each Director. For the fiscal year ended December 31, 2017, the company did not make any cash payments to Directors in connection with their service and issued 46,000 restricted warrants to the 4 Directors other than Mr. Carlson.
RELATED PARTY TRANSACTIONS
Information with respect to related party transactions appears in Notes 6, 8, 9, 11 and 19 to our audited financial statements for the year ended December 31, 2017 and Notes 3, 4, 5 and 8 to the unaudited interim financial statements for the six months ended June 30, 2018. Those footnotes reflect all transactions with stockholders of any size; the following discussion complies with the requirements for Offering Statements on Form 1-A under Regulation A.
At June 30, 2018, the company had notes receivable from Dwight Carlson, the company’s Chairman, Director and CEO, used to exercise his stock options during 2010 to 2018 and related accrued interest totaling $951,011. The company owes Mr. Carlson $1,165,373 in deferred compensation and related accrued interest under the Top Hat Deferred Compensation Plan. The company also owes Mr. Carlson $402,736 in short term salary deferral and related accrued interest from mid-2016 into 2017. The company has the ability, and intends to, offset the loans receivable and related accrued interest with certain deferred compensation liabilities and related accrued interest. The company will also use $251,405 in net offering proceeds to settle certain deferred compensation liabilities owed to him. After offsetting the loan receivable with certain deferred compensation liabilities and accrued interest and the payment of the proceeds, Mr. Carlson would still be due $365,693. The remaining balance due Mr. Carlson for short term salary deferral and accrued interest will be deferred until the Company has the necessary cash flow from operations or its shares of Common Stock are approved for quotation on NASDAQ.
Mr. Carlson does not hold any notes payable with the company. He is a participant in the Predator 3D Royalty Program. See “Description of Capital Stock -- Ten Year Royalty Programs.” Under the program, Mr. Carlson will receive royalties of 0.848% of future Predator sales through 2026.
Mr. Carlson also provides a personal guaranty on the Crestmark line of credit. See “Management’s Discussion and Analysis of Financial Condition and Results of Operations – Liquidity and Capital Resources – Line of Credit.”
Robert A. Smith, who is one of the company’s Directors, has invested $50,000 in a promissory note due in 2021, with 8,000 warrants with an exercise price of $3.75 per warrant. These promissory notes earn 8% annual interest, which is paid monthly. In 2017, Mr. Smith earned approximately $4,000 in interest income and during the six months ended June 30, 2018, he earned another $2,000 in interest income. In December 2017, Mr. Smith used $60,557 of accrued interest to purchase shares of Common Stock at a price of $5.00 per share. Also in December 2017, Mr. Smith's two sons, who also each had accrued interest of $90,835, used the accrued interest to purchase shares of Common Stock at a price of $5.00 per share. Each son holds a $50,000 promissory note each with 8,000 warrants with an exercise price of $3.75 per warrant; each earned $4,000 in interest income in 2017 and $2,000 in interest income during the six months ended June 30, 2018.
The wife of Philip Rice II, who is one of the company's Directors, has invested $730,000 in promissory notes due in July and August 2018, which earn 16% annual interest ($79,018 in interest was paid in 2017), and a convertible debenture in the amount of $100,000, which has accrued and unpaid interest of approximately $149,619 as of June 30, 2018. In August 2018, the company repaid $350,000 of the promissory notes and repayment of the balance was extended until February 2019. The company intends to use the net proceeds of this offering to repay its convertible debentures and, as a result, Mr. Rice's wife will receive $100,000 of the net proceeds.
In December 2017, Xintai converted $4,000,000 of convertible debentures into shares of Common Stock at a conversion price of $3.44 per share. In January 2018, Xintai converted a portion of the accrued interest on such debentures totaling $170,734 into shares of Common Stock at a conversion price of $3.44 per share.
Statement of Policy
Our board of directors recognizes the fact that transactions with related parties present a heightened risk of conflicts of interests and/or improper valuation (or the perception thereof). In the event our shares are approved for quotation on NASDAQ, our board of directors will adopt a written policy on transactions with related parties in conformity with the requirements for issuers having publicly held common stock quoted on the NASDAQ Capital Market. Under the policy, any related-party transaction, and any material amendment or modification of a related-party transaction, will be required to be reviewed and approved or ratified by a committee of the board of directors composed solely of independent directors who are disinterested, or by the disinterested members of the board of directors and any employment relationship or transaction involving an executive officer and any related compensation will be required to be recommended by the Compensation Committee to the board of directors for its approval.
In connection with the review and approval or ratification of a related-party transaction:
| · | The management must disclose to the audit committee or another independent body of the board of directors, as applicable, the name of the related party and the basis on which the party is a related party, the material terms of the related-party transaction, including the approximate dollar value of the amount involved in the transaction, and all the material facts as to the related party’s direct or indirect interest in, or relationship to, the related-party transaction; |
| | | |
| | · | The management must advise the audit committee or another independent body of the board of directors, as applicable, whether the related-party transaction complies with the terms of our agreements governing any material outstanding indebtedness that limit or restrict our ability to enter into a related-party transaction; |
| | | |
| | · | The management must advise the audit committee or another independent body of the board of directors, as applicable, whether the related-party transaction will be required to be disclosed in our applicable filings under the Securities Act or the Exchange Act and related rules, and, to the extent required to be disclosed, management must ensure that the related-party transaction is disclosed in accordance with such Acts and related rules; and management must advise the audit committee or another independent body of the board of directors, as applicable, whether the related-party transaction constitutes a "personal loan" for purposes of Section 402 of the Sarbanes-Oxley Act. |
In addition, the related-party transaction policy will provide that the audit committee or another independent body of the board of directors, as applicable, must consider whether any approval or ratification of a related-party transaction involving a non-employee director or director nominee would compromise the director or director nominee's status as an "independent", "outside", or "non-employee" director, as applicable, under the rules and regulations of the SEC, the NASDAQ Capital Market and the Internal Revenue Code.
Security Ownership of Management and Certain Securityholders
The following table sets forth certain information known to us regarding beneficial ownership of our capital stock as of June 30, 2018 for (i) all executive officers and directors as a group and (ii) each person, or group of affiliated persons, known by us to be the beneficial owner of more than five percent (5%) of our capital stock. The percentage of beneficial ownership in the table below is based on 13,091,200 shares of Common Stock deemed to be outstanding as of June 30, 2018.
| Name and address of beneficial owner | Title of | Amount and | Amount and | Percent of |
| class | nature of | nature of | class |
| | beneficial | beneficial | |
| | ownership | ownership | |
| | | acquirable | |
| Dwight D. Carlson | Common Stock | 1,084,012 | 139,062 | 9.34% |
| 3980 Ranchero Drive | | | | |
| Ann Arbor, MI 48108 | | | | |
| Xintai US Investment LLC | Common Stock | 2,278,248 | 0 | 17.40% |
| 3980 Ranchero Drive | | | | |
| Ann Arbor, MI 48108 | | | | |
| All current officers and directors | Common Stock | 3,808,196 | 194,187 | 30.57% |
| as a group (7 people) | | | | |
DESCRIPTION OF CAPITAL STOCK
Summary of Securities
The following description summarizes certain terms of our capital stock, as in effect upon the completion of this offering. Because it is only a summary, it does not contain all the information that may be important to you. For a complete description of the matters set forth in this section you should refer to our amended and restated certificate of incorporation and bylaws, which are included as exhibits to the Offering Statement of which this Offering Circular forms a part, and to the applicable provisions of Delaware law.
Our authorized capital stock consists of 30,000,000 shares of Common Stock, $0.001 par value per share, and 400,000 shares of preferred stock, $0.001 par value per share. There were 13,091,200 shares of Common Stock and no shares of Preferred Stock issued and outstanding as of June 30, 2018.
Common Stock
Dividend Rights
Since our inception, we have not paid dividends on our Common Stock and we currently expect that, for the foreseeable future, all earnings (if any) will be retained for the development of our business. No dividends will be declared or paid. In the future, the Board of Directors may decide, in their discretion, whether dividends may be declared and paid, taking into consideration, among other things, our earnings (if any), operating results, financial conditions and capital requirements, general business conditions and other pertinent facts.
Voting Rights
Holders of our Common Stock are entitled to one vote per share on any matter to be voted upon by stockholders, however, except as otherwise required by law. We have not provided for cumulative voting for the election of directors in our amended and restated certificate of incorporation. Our bylaws establish a board of directors whose term is for one year, to be elected at the annual meeting of stockholders.
No Preemptive or Similar Rights
Prior to the qualification of the Offering Statement by the SEC, one stockholder, Xintai, has pre-emptive rights under an investors’ rights agreement, dated August 5, 2015 (the “2015 Investors’ Rights Agreement”). The company and Xintai have entered into an Amended and Restated Investors’ Rights Agreement dated July 23, 2018 (the “Amended and Restated Investors’ Rights Agreement”), pursuant to which, upon qualification of the Offering Statement in connection with this offering, all pre-emptive rights will terminate. See “—Amended and Restated Investors’ Rights Agreement.”
Other than Xintai’s pre-emptive rights noted above, no other holder of our Common Stock is entitled to preemptive rights, and the Common Stock is not subject to conversion, redemption, or sinking fund provisions.
Warrants
As of June 30, 2018 there are 1,171,046 warrants issued and outstanding. All warrants have a cashless exercise option.
Options
There are 5,100,000 options authorized under the company’s 2004 Incentive and Non-Qualified Stock Option Plan. Of these options, 2,018,772 options have been exercised and 1,767,088 options are available for new grants as of June 30, 2018.
Ten-Year Royalty Programs
Under the Predator3D programs discussed below, the company will be required to pay royalties for a ten year period to eligible stockholders based on Predator3D sales into the sealant and sealant dispensing industry. The Royalty Programs are discussed in detail in Note 7 to the unaudited interim financial statements for the six months ended June 30, 2018.
Predator Royalty with Stock Investment Programs
Certain investors agreed to enter into the Predator3D Royalty Program with Common Stock. Each investor investing $1,000 would receive .05% of the Royalty Pool for ten years and 67 shares of Coherix Common Stock (one share for every $15 invested). Under the first pool, Coherix raised $2,000,000 to fund the development of Predator3D and a 5% Pool was created. Commencing on the date of the first shipment of a Predator unit, 5% of the revenue recognized from the sealant and sealant dispensing industry was deposited into the pool and paid to eligible stockholders on a quarterly basis. The first pool was created on June 24, 2014, as amended, and was fully subscribed.
A Second Predator3D Pool was established in the amount of $2,000,000 to fund promotion and sales of the Predator3D and mirrored the June 24, 2014 Program. The company raised only 16% ($332,848) of the $2,000,000 available under the Second Program.
Predator3D Royalty Opportunity Pools
Certain investors with accrued interest balances from their equity conversions agreed to forfeit their right to payment of accrued interest for the opportunity to receive potential future royalties on future shipments of Predator3D units into the sealant and sealant dispensing industry. Each participant understood the risks and that they might never receive any royalties as a result of Predator3D sales into the sealant and sealant dispensing industry. Again the potential for future royalties was for a 10 year period, commencing on the date of the first shipment of a production Predator unit. A smaller Predator3D Opportunity Pool was created for employees who agreed to forfeit a portion of their salary in return for a future opportunity to receive royalties on future Predator3D shipments into the sealant and sealant dispensing industry. Team members also understood the risk associated with their forfeiting a portion of their salary, that they would not be eligible to receive repayment in the future and that there was no guarantee that they would receive any royalties.
In September 2016, all Predator3D Programs were closed. After that date, no new funding was received and/or no additional forfeited accrued interest and/or forfeited salaries were allowed under the programs.
Antitakeover Matters
Charter and Bylaw Provisions
The provisions of Delaware law, our amended and restated certificate of incorporation, and our bylaws include a number of provisions that may have the effect of delaying, deferring, or discouraging another person from acquiring control of our company and discouraging takeover bids. These provisions may also have the effect of encouraging persons considering unsolicited tender offers or other unilateral takeover proposals to negotiate with our board of directors rather than pursue non-negotiated takeover attempts. These provisions include the items described below.
Board Composition and Filling Vacancies
Our bylaws provide that any vacancy on our board of directors may only be filled by the affirmative vote of a majority of our stockholders. The number of directors are determined from time to time by the board of directors. The Board has the right to elect interim directors if a director steps down.
No Cumulative Voting
The Delaware General Corporation Law provides that stockholders are not entitled to the right to cumulate votes in the election of directors unless the certificate of incorporation provides otherwise. Neither our amended and restated certificate of incorporation nor our bylaws provide for cumulative voting.
Limitations of Director Liability and Indemnification of Directors and Officers
We intend to maintain general liability insurance that covers certain liabilities of our directors and officers arising out of claims based on acts or omissions in their capacities as directors or officers, including liabilities under the Securities Act. Insofar as indemnification for liabilities arising under the Securities Act may be permitted to directors, officers, or persons who control us, we have been informed that in the opinion of the SEC such indemnification is against public policy as expressed in the Securities Act and is therefore unenforceable. These provisions may discourage stockholders from bringing a lawsuit against our directors for breach of their fiduciary duty. These provisions may also have the effect of reducing the likelihood of derivative litigation against directors and officers, even though such an action, if successful, might otherwise benefit us and our stockholders. Furthermore, a stockholder’s investment may be adversely affected to the extent we pay the costs of settlement and damage awards against directors and officers pursuant to these indemnification provisions. We believe that these provisions, the indemnification agreements, and the insurance are necessary to attract and retain talented and experienced directors and officers. At present, there is no pending litigation or proceeding involving any of our directors or officers where indemnification will be required or permitted. We are not aware of any threatened litigation or proceeding that might result in a claim for such indemnification.
Our amended and restated certificate of incorporation provides that to the fullest extent permitted by law, no director of the company shall be personally liable for monetary damages for breach of fiduciary duty as a director. In addition, the corporation may indemnify to the fullest extent permitted by law, any person made or threatened to be made a party to an action or proceedings, whether criminal, civil, administrative, or investigative, by reason of the fact that he, his testator or intestate is or was a director, officer, or employee of the company, or any predecessor the company or serves or served at any other enterprise as a director, officer, or employee, at the request of the company.
Amended and Restated Investors’ Rights Agreement
Upon the qualification of the Offering Statement, the 2015 Investors’ Rights Agreement will terminate and the Amended and Restated Investors’ Rights Agreement will become effective. Under the Amended and Restated Investors’ Rights Agreement, Xintai will have the following rights:
| · | Registration rights in the event that the company executes a firm commitment underwritten public offering of its Common Stock pursuant to the Securities Act that raises at least $25 million at a pre-money valuation of at least $100 million (a “qualified IPO”); |
| · | Information and inspection rights; and |
| · | The right to appoint one member of the Board of Directors (the “Investor Director”), provided Xintai's ownership is 5% or greater. Jinyang Wen is the current Investor Director designated by Xintai under the existing agreement and will continue as the Investor Director after the Amended and Restated Investor Rights Agreement takes effect. |
The Amended and Restated Investors’ Rights Agreement also grants registration rights to the company’s CEO.
All rights other than the registration rights and the right to designate a board seat will terminate immediately prior to the initial closing of this offering. The registration rights will terminate upon the earlier to occur of
| · | when all of a party's registrable securities have been sold under an effective registration statement or pursuant to Rule 144 under the Securities Act; |
| · | when all of a party’s registrable securities can be sold under Rule 144 within 90 days without limitation on the amount of securities that can be sold; and |
| · | the fifth anniversary of a qualified IPO. |
Exchange Listing
We intend to apply to have our Common Stock approved for quotation on NASDAQ, but we cannot guarantee that we will satisfy the quotation requirements or otherwise be accepted for such quotation.
Transfer Agent and Registrar
We intend to appoint Colonial Stock Transfer Company, Inc. (“Colonial”) as the transfer agent and registrar for our Common Stock. Colonial’s address is 66 Exchange Place, 1st floor, Salt Lake City, UT 84111, and its telephone number is 801-355-5740.
DIVIDEND POLICY
Since our inception, we have not paid any dividends on our Common Stock and we currently expect that, for the foreseeable future, all earnings (if any) will be retained for the development of our business and no dividends will be declared or paid. In the future, the Board of Directors may decide, in their discretion, whether dividends may be declared and paid, taking into consideration, among other things, our earnings (if any), operating results, financial conditions and capital requirements, general business conditions and other pertinent facts.
SHARES ELIGIBLE FOR FUTURE SALE
Prior to this offering, there has been no market for our Common Stock. Future sales of substantial amounts of our Common Stock, or securities or instruments convertible into our Common Stock, in the public market, or the perception that such sales may occur, could adversely affect the market price of our Common Stock prevailing from time to time.
Upon completion of this offering, assuming the maximum number of shares of Common Stock offered in this offering are sold, there will be 15,591,200 shares of our Common Stock outstanding. This number includes the shares of Common Stock outstanding as of June 30, 2018, but does not include additional shares of Common Stock issuable upon exercise of stock options outstanding as of the date of this Offering Circular.
All of the shares sold in this offering will be freely tradable. The remaining 13,091,200 shares of our Common Stock not sold in this offering will be restricted securities within the meaning of Rule 144 of the Securities Act, and would be tradable only if they are sold pursuant to a registration statement under the Securities Act or if they qualify for an exemption from registration, including under Rule 144. See “— Rule 144,” below.
Rule 144
In general, a person who has beneficially owned restricted shares of our Common Stock for at least one year, in the event we are a reporting company under Regulation A, or at least six months, in the event we have been a reporting company under the Exchange Act for at least 90 days (which is not yet the case), would be entitled to sell such securities, provided that such person is not deemed to be an affiliate of ours, as such term is defined under Rule 405 under the Securities Act, at any time during the three months preceding the sale. Under Rule 405, an affiliate of a specified person is a person that directly, or indirectly through one or more intermediaries, controls or is controlled by, or is under common control with, the specified person. Any affiliate of ours that acquires our shares can only further transact in such shares in compliance with Rule 144. A person who is an affiliate of ours at such time would be subject to additional restrictions, by which such person would be entitled to sell within any three month period only a number of shares that does not exceed the greater of the following:
| · | 1% of the number of shares of our Common Stock then outstanding; or |
| · | The average weekly trading volume of our Common Stock during the four calendar weeks preceding the filing by such person with the SEC of a notice on Form 144 with respect to the sale; provided that, in each case, we have been subject to the periodic reporting requirements of the Exchange Act for at least 90 days before the sale. Persons relying on Rule 144 to transact in our Common Stock must also comply with the manner of sale, notice and other provisions of Rule 144, to the extent applicable. |
Rule 701
In general,Rule 701 allows a stockholder who purchased shares of our capital stock pursuant to a written compensatory plan or contract and who is not deemed to have been an affiliate of ours during the immediately preceding 90 days to sell those shares in reliance upon Rule 144, but without being required to comply with the public information, holding period, volume limitation or notice provisions of Rule 144. Persons relying on Rule 701 to transact in our Common Stock, however, are required to wait until 90 days after the date of this Offering Circular before selling shares pursuant to Rule 701.
PLAN OF DISTRIBUTION
The company is offering up to 2,500,000 shares of Common Stock, on a “best efforts basis” as described in this Offering Circular. The company has not engaged a broker-dealer to assist in the placement of its securities.
The company intends to use the online platform, Equity Track, at the domain name Coherixinvest.com (the “Online Platform”) to provide technology tools to allow for the sales of securities in this offering. We have also purchased the domain names coherixinvest.net and coherixinvest.co to prevent fraudulent use. The company will pay a monthly fee of $500 which may be terminated at any time without penalty.
Investment Fee on Sales of Securities
There are no investment fees in connection with purchases of securities under this offering.
Termination of Offering
The offering will terminate at the earlier of (1) the date at which the maximum offering amount has been sold, (2) the date that is twelve months from the date of this Offering Statement being qualified by the Commission, or (3) the date at which the Offering is earlier terminated by the company in its sole discretion, which may happen at any time (the “Offering Termination Date”).
Selling Security holders
No securities are being sold for the account of security holders; all net proceeds of this offering will go to the company.
Investors’ Tender of Funds
After the Offering Statement has been qualified by the Commission, the company will accept tenders of funds to purchase the Common Stock. The company may close on investments on a “rolling” basis (so not all investors will receive their shares on the same date). The funds tendered by potential investors will go directly to the company, and the company will issues shares thereafter, in its discretion. However, the offering will remain open and investor subscriptions will be accepted throughout the entire offering and will not be halted when funds are transferred to the company or the company closes on investments during the offering. Upon closing, funds tendered by investors will be made available to the company for its use. The offering will terminate (and subscriptions will no longer be accepted) at the earlier of: (1) the date at which the maximum offering amount has been sold, (2) the date which is one year from this offering being qualified by the Commission, or (3) the date at which the offering is earlier terminated by us in our sole discretion.
Investors will be required to subscribe to the offering via the Online Platform, and agree to the terms of the offering and subscription agreement. The subscription agreement includes a representation by the investor to the effect that, if you are not an “accredited investor” as defined under securities law, you are investing an amount that does not exceed the greater of 10% of your annual income or 10% of your net worth (excluding your principal residence).
Offering Expenses
We are responsible for all offering fees and expenses, including the following: (i) fees and disbursements of our legal counsel, accountants, and other professionals we engage; (ii) fees and expenses incurred in the production of offering documents, including design, printing, photograph, and written material procurement costs; (iii) all filing fees, including blue sky notice filing fees; and (iv) all of the legal fees related to the filing of notice filings under state securities laws.
Investment Limitations
Generally, no sale may be made to you in this offering if the aggregate purchase price you pay is more than 10% of the greater of your annual income or net worth (please see below on how to calculate your net worth). Different rules apply to accredited investors and non-natural persons. Before making any representation that your investment does not exceed applicable thresholds, we encourage you to review Rule 251(d)(2)(i)(C) of Regulation A. For general information on investing, we encourage you to refer to www.investor.gov.
Because this is a Tier 2 Regulation A offering, most investors must comply with the 10% limitation on investment in the offering. The only investor in this offering exempt from this limitation is an "accredited investor" as defined under Rule 501 of Regulation D under the Securities Act (an "Accredited Investor"). If you meet one of the following tests you should qualify as an Accredited Investor:
| • | You are a natural person who has had individual income in excess of $200,000 in each of the two most recent years, or joint income with your spouse in excess of $300,000 in each of these years, and have a reasonable expectation of reaching the same income level in the current year; |
| • | You are a natural person and your individual net worth, or joint net worth with your spouse, exceeds $1,000,000 at the time you purchase offered shares (please see below on how to calculate your net worth); |
| • | You are an executive officer or general partner of the issuer or a manager or executive officer of the general partner of the issuer; |
| • | You are an organization described in Section 501(c)(3) of the Internal Revenue Code of 1986, as amended, or the Code, a corporation, a Massachusetts or similar business trust or a partnership, not formed for the specific purpose of acquiring the offered shares, with total assets in excess of $5,000,000; |
| • | You are a bank or a savings and loan association or other institution as defined in the Securities Act, a broker or dealer registered pursuant to Section 15 of the Exchange Act, an insurance company as defined by the Securities Act, an investment company registered under the Investment Company Act of 1940 (the "Investment Company Act"), or a business development company as defined in that act, any Small Business Investment Company licensed by the Small Business Investment Act of 1958 or a private business development company as defined in the Investment Advisers Act of 1940; |
| • | You are an entity (including an Individual Retirement Account trust) in which each equity owner is an accredited investor; |
| • | You are a trust with total assets in excess of $5,000,000, your purchase of offered shares is directed by a person who either alone or with his purchaser representative(s) (as defined in Regulation D promulgated under the Securities Act) has such knowledge and experience in financial and business matters that he is capable of evaluating the merits and risks of the prospective investment, and you were not formed for the specific purpose of investing in the offered shares; or |
| • | You are a plan established and maintained by a state, its political subdivisions, or any agency or instrumentality of a state or its political subdivisions, for the benefit of its employees, if such plan has assets in excess of $5,000,000. |
In addition, investments will not be accepted from residents of the following states: Arizona, Florida, Nebraska, North Dakota and Texas. Because we are not engaging a broker-dealer and we are not registering in these states as an issuer-dealer, we will not be selling securities in these states unless and until we engage a broker-dealer or register as an issuer-dealer.
Procedures for Subscribing
If you decide to subscribe for shares in this offering, you should:
Go to www.coherixinvest.com, click on the "Invest Now" button and follow the procedures as described.
| | 1. | Electronically receive, review, execute and deliver to us a subscription agreement; and |
| 2. | Deliver funds directly by wire or electronic funds transfer via ACH to the specified account maintained by the company at Old National Bank. |
Any potential investor will have ample time to review the subscription agreement, along with their counsel, prior to making any final investment decision. We shall only deliver such subscription agreement upon request after a potential investor has had ample opportunity to review this Offering Circular.
Right to Reject Subscriptions
After we receive your complete, executed subscription agreement and the funds required under the subscription agreement have been transferred to the company’s account, we have the right to review and accept or reject your subscription in whole or in part, for any reason or for no reason. We will return all monies from rejected subscriptions immediately to you, without interest or deduction.
Acceptance of Subscriptions
Upon our acceptance of a subscription agreement, we will countersign the subscription agreement and issue the shares subscribed at closing. Once you submit the subscription agreement and it is accepted, you may not revoke or change your subscription or request your subscription funds. All accepted subscription agreements are irrevocable.
Under Rule 251 of Regulation A, non-accredited, investors are subject to the investment limitation and may only invest funds which do not exceed 10% of the greater of the purchaser's revenue or net assets (as of the purchaser's most recent fiscal year end). A non-accredited, natural person may only invest funds which do not exceed 10% of the greater of the purchaser's annual income or net worth (please see below on how to calculate your net worth).
For the purposes of calculating your net worth, it is defined as the difference between total assets and total liabilities. This calculation must exclude the value of your primary residence and may exclude any indebtedness secured by your primary residence (up to an amount equal to the value of your primary residence). In the case of fiduciary accounts, net worth and/or income suitability requirements may be satisfied by the beneficiary of the account or by the fiduciary, if the fiduciary directly or indirectly provides funds for the purchase of the shares.
In order to purchase shares and prior to the acceptance of any funds from an investor, an investor will be required to represent, to the company's satisfaction, that he is either an accredited investor or is in compliance with the 10% of net worth or annual income limitation on investment in this offering.
Forum Selection Provision
The subscription agreement includes a forum selection provision that requires that subscribers bring any claims against the company based on the subscription agreement in a state or federal court of competent jurisdiction in the State of Michigan. The forum selection provision may limit investors’ ability to bring claims in a judicial forum that they believe is favorable to such disputes and may discourage lawsuits with respect to such claims. The company has adopted the provision since Michigan has a well-developed framework for contract law and seeks to limit the time and expense incurred by its management to challenge any such claims. As a company with a small management team, this provision allows our officers to not lose a significant amount of time travelling to any particular forum so they may continue to focus on operations of the company.
INDEPENDENT AUDITORS
The consolidated financial statements of Coherix, Inc. and Subsidiaries as of December 31, 2017 and for the year then ended, appearing elsewhere in this Offering Circular, have been audited by UHY LLP, independent auditors, as stated in their report, which includes an explanatory paragraph as to the company’s ability to continue as a going concern, appearing elsewhere herein.
UHY LLP has not performed any procedures on the consolidated financial statements of the company as of June 30, 2018 and for the six months ended June 30, 2018 and 2017, appearing elsewhere in this Offering Circular, and expresses no opinion or conclusion on these interim consolidated financial statements.
The consolidated financial statements of Coherix, Inc. and Subsidiaries as of December 31, 2016 and for the year then ended, appearing elsewhere in this Offering Circular, have been audited by George Johnson & Company, independent auditors, as stated in their report, appearing elsewhere herein.
WHERE YOU CAN FIND ADDITIONAL INFORMATION
We have filed with the SEC a Regulation A Offering Statement on Form 1-A under the Securities Act with respect to the shares of Common Stock offered hereby. This Offering Circular, which constitutes a part of the Offering Statement, does not contain all of the information set forth in the Offering Statement or the exhibits and schedules filed therewith. For further information about us and the Common Stock offered hereby, we refer you to the Offering Statement and the exhibits and schedules filed therewith. Statements contained in this Offering Circular regarding the contents of any contract or other document that is filed as an exhibit to the Offering Statement are not necessarily complete, and each such statement is qualified in all respects by reference to the full text of such contract or other document filed as an exhibit to the Offering Statement. Upon the completion of this offering, we will be required to file ongoing reports with the SEC pursuant to Regulation A. You may read and copy this information at the SEC's Public Reference Room, 100 F Street, N.E., Room 1580, Washington, D.C. 20549. You may obtain information on the operation of the Public Reference Room by calling the SEC at 1-800-SEC-0330. The SEC also maintains an Internet website that contains reports, proxy statements and other information about issuers, including us, that file electronically with the SEC. The address of this site is www.sec.gov.
INDEX TO CONSOLIDATED FINANCIAL STATEMENTS
COHERIX, INC. AND SUBSIDIARIES
TABLE OF CONTENTS
| | Page |
| | |
| Unaudited Interim Financial Statements | |
| Consolidated Balance Sheets as of June 30, 2018 and December 31, 2017 | F-2 |
| Consolidated Statements of Operations and Comprehensive Income (Loss) for the six months ended June 30, 2018 and June 30, 2017 | F-4 |
| Consolidated Statements of Cash Flows for the six months ended June 30, 2018 and June 30, 2017 | F-5 |
| Notes to Consolidated Financial Statements for the six months ended June 30, 2018 | F-7 |
| | |
| Independent Auditors’ Reports | F-22 |
| | |
| Financial Statements | |
| Consolidated Balance Sheets as of December 31, 2017 and 2016 | F-24 |
| Consolidated Statements of Operations and Comprehensive Income (Loss) for the years ended December 31, 2017 and 2016 | F-26 |
| Consolidated Statements of Stockholders’ Deficit for the years ended December 31, 2017 and 2016 | F-27 |
| Consolidated Statements of Cash Flows for the years ended December 31, 2017 and 2016 | F-28 |
| Notes to Consolidated Financial Statements for the years ended December 31, 2017 and 2016 | F-30 |
COHERIX, INC. AND SUBSIDIARIES
UNAUDITED CONSOLIDATED BALANCE SHEETS
| | | June 30, | | | December 31, | |
| | | 2018 | | | 2017 | |
| ASSETS | | | | | | |
| | | | | | | |
| CURRENT ASSETS | | | | | | | | |
| Cash and cash equivalents | | $ | 694,790 | | | $ | 900,660 | |
| Accounts receivable | | | | | | | | |
| Trade, net | | | 1,584,820 | | | | 1,522,343 | |
| Related party, net | | | 477,503 | | | | 362,450 | |
| Inventories, net | | | 1,781,449 | | | | 1,059,105 | |
| Prepaid expenses and other | | | 217,121 | | | | 110,987 | |
| | | | | | | | | |
| Total current assets | | | 4,755,683 | | | | 3,955,545 | |
| | | | | | | | | |
| PROPERTY AND EQUIPMENT, NET | | | 120,579 | | | | 93,607 | |
| | | | | | | | | |
| OTHER ASSETS | | | | | | | | |
| Notes receivable – related parties | | | 1,142,853 | | | | 1,140,353 | |
| Accrued interest receivable – related parties | | | 297,386 | | | | 295,803 | |
| Advance to establish Chinese subsidiary | | | – | | | | 505,275 | |
| Other deposits | | | 181,470 | | | | 181,470 | |
| Intangible assets, net | | | 406 | | | | 893 | |
| | | | | | | | | |
| Total other assets | | | 1,622,114 | | | | 2,123,794 | |
| | | | | | | | | |
| TOTAL ASSETS | | $ | 6,498,376 | | | $ | 6,172,946 | |
See notes to unaudited consolidated financial statements.
COHERIX, INC. AND SUBSIDIARIES
UNAUDITED CONSOLIDATED BALANCE SHEETS(Continued)
| | | June 30, | | | December 31, | |
| | | 2018 | | | 2017 | |
| LIABILITIES AND STOCKHOLDERS’ DEFICIT | | | | | | |
| | | | | | | |
| CURRENT LIABILITIES | | | | | | | | |
| Lines of credit | | $ | 1,722,293 | | | $ | 1,653,997 | |
| Current portion of long-term debt | | | 5,975,345 | | | | 5,192,588 | |
| Current portion of deferred compensation | | | 2,840,179 | | | | 2,920,546 | |
| Current portion of capital lease obligations | | | 145,545 | | | | 145,545 | |
| Accounts payable – trade | | | 472,280 | | | | 174,464 | |
| Accounts payable – related party | | | 192,697 | | | | 185,076 | |
| Current portion of accrued interest | | | 6,566,795 | | | | 6,709,459 | |
| Deposits | | | 5,320 | | | | 38,420 | |
| Preferred dividends payable | | | 849,963 | | | | 864,648 | |
| Other accrued liabilities | | | 426,211 | | | | 440,905 | |
| | | | | | | | | |
| Total current liabilities | | | 19,196,628 | | | | 18,325,648 | |
| | | | | | | | | |
| LONG-TERM LIABILITIES | | | | | | | | |
| Long-term debt, less current portion | | | 5,730,906 | | | | 6,713,071 | |
| Accrued interest, less current portion | | | 216,263 | | | | 216,263 | |
| Capital lease obligations, less current portion | | | 342,388 | | | | 412,390 | |
| | | | | | | | | |
| Total long-term liabilities | | | 6,289,557 | | | | 7,341,724 | |
| | | | | | | | | |
| Total liabilities | | | 25,486,185 | | | | 25,667,372 | |
| | | | | | | | | |
COMMITMENTS AND CONTINGENCIES | | | | | | | | |
| | | | | | | | | |
| STOCKHOLDERS’ DEFICIT | | | | | | | | |
| Common stock, $0.001 par value, 30,000,000 authorized, and 13,091,200 and 12,973,604 shares issued and outstanding, respectively | | | 13,091 | | | | 12,974 | |
| Additional paid-in-capital | | | 35,618,155 | | | | 35,164,347 | |
| Accumulated deficit | | | (54,595,062 | ) | | | (54,690,105 | ) |
| Accumulated other comprehensive income (loss) net of income taxes of $0 | | | (23,993 | ) | | | 18,358 | |
| | | | | | | | | |
| Total stockholders’ deficit | | | (18,987,809 | ) | | | (19,494,426 | ) |
| | | | | | | | | |
| TOTAL LIABILITIES AND STOCKHOLDERS’ DEFICIT | | $ | 6,498,376 | | | $ | 6,172,946 | |
See notes to unaudited consolidated financial statements.
COHERIX, INC. AND SUBSIDIARIES
UNAUDITED CONSOLIDATED STATEMENTS OF OPERATIONSAND COMPREHENSIVE INCOME (LOSS)
| | | Six months ended June 30, | |
| | | 2018 | | | 2017 | |
| Net revenue | | $ | 5,740,643 | | | $ | 3,910,349 | |
| Cost of product revenue | | | 1,327,618 | | | | 912,248 | |
| | | | | | | | | |
| Gross profit | | | 4,413,025 | | | | 2,998,101 | |
| | | | | | | | | |
| Operating expense | | | 3,680,325 | | | | 2,659,115 | |
| | | | | | | | | |
| Income from operations | | | 732,700 | | | | 338,986 | |
| | | | | | | | | |
| Other income (expense): | | | | | | | | |
| Interest income | | | 1,609 | | | | – | |
| Interest expense | | | (647,872 | ) | | | (665,508 | ) |
| Other income, net | | | 10,545 | | | | 405 | |
| Net loss on foreign currency transactions | | | (1,939 | ) | | | (3,929 | ) |
| | | | | | | | | |
| Total other expense, net | | | (637,657 | ) | | | (669,032 | ) |
| | | | | | | | | |
| Income (loss) before income tax | | | 95,043 | | | | (330,046 | ) |
| | | | | | | | | |
| Income tax expense | | | – | | | | – | |
| | | | | | | | | |
| Net income (loss) | | $ | 95,043 | | | $ | (330,046 | ) |
| | | | | | | | | |
| | | | | | | |
| EARNINGS (LOSS) PER SHARE | | | | | | |
| Net income (loss) | | $ | 95,043 | | | $ | (330,046 | ) |
| Less: cumulative dividends on preferred stock | | $ | – | | | $ | (105,499 | ) |
| Net income (loss) attributable to common stockholders | | $ | 95,043 | | | $ | (435,545 | ) |
| | | | | | | | | |
| Weighted-average common shares outstanding | | | | | | | | |
| Basic | | | 13,065,820 | | | | 9,356,713 | |
| Dilutive effect of stock options, warrants and convertible debt | | | 1,768,619 | | | | – | |
| Diluted | | | 14,834,439 | | | | 9,356,713 | |
| Dividends declared per common share | | $ | – | | | $ | – | |
| | | | | | | | | |
| Basic earnings (loss) per share attributable to common stockholders of Coherix, Inc. | | $ | 0.01 | | | $ | (0.05 | ) |
| Diluted earnings (loss) per share attributable to common stockholders of Coherix, Inc. | | $ | 0.01 | | | $ | (0.05 | ) |
| | | | | | | | | |
| COMPREHENSIVE INCOME (LOSS) | | | | | | | | |
| Net income (loss) | | $ | 95,043 | | | $ | (330,046 | ) |
| Foreign currency translation adjustment, net of income taxes of $-0- | | | (42,351 | ) | | | 1,114 | |
| COMPREHENSIVE INCOME (LOSS) | | $ | 52,692 | | | $ | (328,932 | ) |
See notes to unaudited consolidated financial statements.
COHERIX, INC. AND SUBSIDIARIES
UNAUDITED CONSOLIDATED STATEMENTS OF CASH FLOWS
| | | Six months ended June 30, | |
| | | 2018 | | | 2017 | |
| OPERATING ACTIVITIES | | | | | | | | |
| Net income (loss) | | $ | 95,043 | | | $ | (330,046 | ) |
| Adjustments to reconcile net income (loss) to net cash flows from operating activities: | | | | | | | | |
| Depreciation and amortization | | | 65,133 | | | | 29,167 | |
| Share-based compensation | | | 252,000 | | | | 254,807 | |
| Net unrealized gain on foreign currency transactions | | | (41,064 | ) | | | (3,890 | ) |
| Changes in assets and liabilities: | | | | | | | | |
| Accounts receivable | | | (185,149 | ) | | | (321,821 | ) |
| Inventories | | | (722,343 | ) | | | (189,024 | ) |
| Prepaid expenses and other current assets | | | (98,515 | ) | | | 19,325 | |
| Accrued interest receivable | | | (1,583 | ) | | | 4,052 | |
| Accounts payable | | | 305,438 | | | | (44,921 | ) |
| Accrued interest payable | | | 28,172 | | | | 229,181 | |
| Other accrued liabilities and deposits | | | (62,479 | ) | | | 430 | |
| Deferred compensation | | | (80,181 | ) | | | 76,866 | |
| | | | | | | | | |
| Net cash used in operating activities | | | (445,528 | ) | | | (275,874 | ) |
| | | | | | | | | |
| INVESTING ACTIVITIES | | | | | | | | |
| Purchase of Chinese subsidiary, net of cash acquired | | | 505,275 | | | | – | |
| Purchase of property and equipment | | | (91,766 | ) | | | (3,216 | ) |
| | | | | | | | | |
Net cash provided by (used in) investing activities | | | 413,509 | | | | (3,216 | ) |
| | | | | | | | | |
| FINANCING ACTIVITIES | | | | | | | | |
| Net borrowings under line of credit agreements | | | 168,296 | | | | 534,929 | |
| Payments on long-term debt | | | (306,908 | ) | | | (384,773 | ) |
| Proceeds from issuance of long-term debt | | | 30,000 | | | | 25,000 | |
| Proceeds from exercise of stock options for common stock | | | 5,902 | | | | 1,121 | |
| Payments on capital lease obligations | | | (70,002 | ) | | | (112,000 | ) |
| | | | | | | | | |
| Net cash provided by (used in) financing activities | | | (172,712 | ) | | | 64,277 | |
| | | | | | | | | |
| Effect of exchange rate changes on cash | | | (1,139 | ) | | | 4,594 | |
| NET CHANGE IN CASH | | | (205,870 | ) | | | (210,219 | ) |
| | | | | | | | | |
| CASH, Beginning of Year | | | 900,660 | | | | 470,206 | |
| CASH, End of June | | $ | 649,790 | | | $ | 259,987 | |
See notes to unaudited consolidated financial statements.
COHERIX, INC. AND SUBSIDIARIES
UNAUDITED CONSOLIDATED STATEMENTS OF CASH FLOWS(Continued)
| | | Six months ended June 30, | |
| | | 2018 | | | 2017 | |
| SUPPLEMENTAL CASH FLOW INFORMATION | | | | | | | | |
| Cash paid during the six months for: | | | | | | | | |
| Interest | | $ | 448,864 | | | $ | 249,142 | |
| Income taxes | | $ | – | | | $ | – | |
| | | | | | | | | |
| SUPPLEMENTAL NONCASH INVESTING AND FINANCING ACTIVITIES | | | | | | | | |
| Conversion of long-term debt and accrued interest into common stock | | $ | 193,336 | | | $ | – | |
| Notes receivable issued to exercise stock options for common stock | | $ | 2,500 | | | $ | – | |
| Deferred compensation used to exercise stock options for common stock | | $ | 186 | | | $ | – | |
| Issuance of term notes in lieu of accrued interest | | $ | – | | | $ | 14,602 | |
See notes to unaudited consolidated financial statements.
COHERIX, INC. AND SUBSIDIARIES
NOTES TO UNAUDITED CONSOLIDATED FINANCIAL STATEMENTS
June 30, 2018 and 2017
NOTE 1 – BUSINESS AND OPERATIONS
Coherix, Inc. and Subsidiaries (the “Company”) is primarily engaged in the design and manufacturing of 3-D vision products for the automotive and semiconductor industries in North America, Europe, and Asia. Among the products offered, the Company produces digital holographic imaging and 3-D imaging technologies and related equipment that provide “on-the-fly” measurements within very tight tolerances.
The Company has incurred historical losses, and current liabilities exceed current assets at June 30, 2018, with the majority of the current liabilities tied to maturing long-term notes which have been a primary funding mechanism. The Company had net income for the six months ended June 30, 2018. The Company’s revenue increased significantly and operating cash flow improved during the six months ended June 30, 2018.
Currently, the Company is working with a bank that has supplied a line of credit and agreed to increase the line as discussed in Note 4. Also, the major part of the Company's debt obligations are with stockholders who have consistently extended maturity dates of such obligations.
As of June 30, 2018 the Company holds certain liabilities that are in default or otherwise past due. These unsecured liabilities include a note payable, convertible notes payable, deferred compensation owed to employees, and accrued interest due to creditors and employees related to the aforementioned liabilities, all of which total approximately $12,817,000. Given the nature of these obligations, the Company has previously been successful in extending the maturity dates of these various instruments in order to avoid immediate payment. As these items are unsecured, the Company does not anticipate that the creditors would take any action against the Company.
While the Company has instituted measures to preserve cash and secure additional financing, there are uncertainties as to the success of such measures. Management realizes that the combination of these uncertainties casts substantial doubt upon the Company’s ability to continue as a going concern within one year from issuance of these financial statements. In response, the Company plans to:
| 1. | Continue the recent initiatives to generate profitable growth leading to positive operating cash flow generation |
| 2. | Negotiate extensions to existing debt maturities and/or conversion to equity |
| 3. | Conclude negotiations on a new $15 million long-term debt facility with at least $3.5 million to retire maturing long-term notes |
| 4. | Raise up to $15 million of equity capital through a Regulation A+ offering |
Having considered the above, management of the Company continues using the going concern basis in preparing the consolidated financial statements.
NOTE 2 –SummarY of Significant Accounting Policies
Basis of Presentation and Principles of Consolidation
The consolidated financial statements include the accounts of Coherix, Inc., and its wholly-owned subsidiaries which include Coherix Asia Pte. Ltd., located in Singapore, Coherix Europe AB, located in Sweden, Coherix Europe GmbH, located in Germany and Coherix China, Inc., located in China. All significant intercompany balances, transactions and equity holdings have been eliminated in consolidation.
The consolidated financial statements for the six months ended June 30, 2018 and 2017 include the operating results of Coherix, Inc. and its subsidiaries for the six months ended June 30, 2018 and 2017, except for Coherix Europe AB which is only included through January 22, 2017, the date it was liquidated and dissolved, and Coherix China, Inc. which is only included since March 20, 2018, the date it was purchased.
COHERIX, INC. AND SUBSIDIARIES
NOTES TO UNAUDITED CONSOLIDATED FINANCIAL STATEMENTS
June 30, 2018 and 2017
NOTE 2 – SUMMARY OF SIGNIFICANT ACCOUNTING POLICIES (Continued)
Basis of Presentation and Principles of Consolidation(Continued)
In December 2017, the Company executed a 4 for 1 split of its common stock. All periods presented reflect the effect of the stock split in share and per share amounts as noted throughout these consolidated financial statements.
The accompanying interim unaudited consolidated financial statements have been prepared in accordance with accounting principles generally accepted in the United States for interim financial information. Accordingly, they do not include all of the information and footnotes required by accounting principles generally accepted in the United States for annual financial statements.
In our opinion, the accompanying interim unaudited consolidated financial statements include all adjustments of a normal, recurring nature considered necessary for a fair presentation of our financial position as of June 30, 2018 and the results of operations for the six months ended June 30, 2018 and 2017. Results of operations for the six months ended June 30, 2018 are not necessarily indicative of the results that may be expected for the year ending December 31, 2018. The accompanying interim unaudited consolidated financial statements and related notes should be read in conjunction with our audited consolidated financial statements and related notes for the year ended December 31, 2017.
Use of Estimates
Preparation of the consolidated financial statements in conformity with accounting principles generally accepted in the United States of America (“U.S. GAAP”) requires management to make estimates and assumptions that affect the reported amounts of assets and liabilities, the disclosure of contingent assets and liabilities at the date of the financial statements, and the reported amounts of revenue and expenses during the reporting period. Actual results could differ from those estimates.
Cash and Cash Equivalents
The Company considers all highly liquid investments, generally with an original maturity of three months or less, to be cash equivalents.
Accounts Receivable
The Company transacts business with companies on an open credit basis. The Company’s trade accounts receivable are generally uncollateralized.The Company carries its accounts receivable at invoiced amount. The Company's policy is not to accrue interest on past due accounts receivable.The Company periodically reviews accounts receivable for collectability and establishes reserves for accounts when the Company considers amounts uncollectible. Balances that remain outstanding after the Company has used reasonable collection efforts are written off. Trade accounts receivable are stated net of an allowance for doubtful accounts of $11,271 at June 30, 2018 and December 31, 2017. Related party accounts receivable are stated net of an allowance for doubtful accounts of $32,623 and $50,000 at June 30, 2018 and December 31, 2017, respectively.
Inventories
Inventories consist of components used in manufacturing and assembling machines and are stated at the lower of cost or net realizable value with cost being determined using the first-in, first-out method. Maintenance, operating and office supplies are not inventoried, but are charged to expense when purchased. Management has deemed it impracticable to track inventories by classes of raw materials, work-in-process and finished goods. The reserve for potentially obsolete inventory totaled $52,042 and $63,183 as of June 30, 2018 and December 31, 2017, respectively.
COHERIX, INC. AND SUBSIDIARIES
NOTES TO UNAUDITED CONSOLIDATED FINANCIAL STATEMENTS
June 30, 2018 and 2017
NOTE 2 – SUMMARY OF SIGNIFICANT ACCOUNTING POLICIES (Continued)
Property and Equipment
Property and equipment are recorded at cost, net of accumulated depreciation and amortization. For financial statement reporting purposes, property and equipment are depreciated over estimated useful lives ranging from 3 to 7 years, with the exception of leasehold improvements which are amortized over the shorter of the life of the related lease or the useful life, all using the straight-line method of depreciation. Additions of new equipment and major renewals and replacements of existing equipment are capitalized. Repairs and maintenance expenditures are charged to expense in the year incurred. Upon sale, disposal, and retirement of property and equipment, the cost and accumulated depreciation and amortization are written off and any gain or loss is included in earnings.
Intangible Assets
The Company amortizes its intangible assets with finite lives on a straight-line basis over their estimated useful lives. The Company’s intangible assets consist of software and patents and are amortized over 10 and 15 years, respectively.
Long-Lived Assets
Long-lived assets, such as property and equipment, and intangible assets subject to amortization, are reviewed for impairment whenever events or changes in circumstances indicate that the carrying amount of an asset may not be recoverable. Recoverability of assets to be held and used is measured by a comparison of the carrying amount of an asset to estimated undiscounted future cash flows expected to be generated by the asset. If the carrying amount of an asset exceeds its estimated future cash flows, an impairment charge is recognized in the amount by which the carrying amount of the asset exceeds the fair value of the asset. There were no impairments recognized during the six months ended June 30, 2018 and 2017.
Income Taxes
Deferred income tax assets and liabilities are classified as noncurrent and are recorded for the estimated future tax consequences attributable to the differences between the financial statement carrying amounts of existing assets and liabilities and their respective tax bases. Deferred income tax assets and liabilities are measured using enacted tax rates in effect for the years in which those temporary differences are expected to be realized. The effect on deferred income tax assets and liabilities of a change in tax rates is recognized in the period that includes the enactment date. A valuation allowance is recorded against deferred tax assets when the Company is unable to conclude that realization of the deferred tax assets is more likely than not.
The benefit of an uncertain tax position is recognized in the financial statements if it meets a minimum recognition threshold. A determination is first made as to whether it is more likely than not that the income tax position will be sustained, based upon technical merits, upon examination by the taxing authorities. If the income tax position is expected to meet the more-likely-than-not criteria, the benefit recorded in the financial statements equals the largest amount that is greater than 50% likely to be realized upon its ultimate settlement. In a case where interest or penalties are incurred, the Company recognizes interest accrued related to unrecognized tax benefits in interest expense and penalties in operating expenses. At June 30, 2018 and December 31, 2017, there were no uncertain tax positions for which a reserve or liability is necessary.
COHERIX, INC. AND SUBSIDIARIES
NOTES TO UNAUDITED CONSOLIDATED FINANCIAL STATEMENTS
June 30, 2018 and 2017
NOTE 2 – SUMMARY OF SIGNIFICANT ACCOUNTING POLICIES(Continued)
Income Taxes(Continued)
At June 30, 2018 and December 31, 2017, there were no undistributed earnings of foreign subsidiaries as Coherix Asia Pte. Ltd., Coherix Europe GmbH and Coherix China, Inc., had an accumulated deficit. Coherix Europe AB was dissolved in early 2017.
Revenue Recognition
The Company recognizes product revenue when persuasive evidence of an arrangement exists, delivery has occurred, the fee if fixed or determinable, and collectability is probable. In instances where a product has to be completed based on customer specifications, revenue is deferred until tested and approved by the customer. Service and machine rental revenue is generally recognized once services are performed or based on the rental term. Cash payments received in advance for product sales are recorded as customer deposits. Cash payments received in advance for services or machine rental are recorded as deposits.
In the case of contracts with milestones, the Company has an accounting policy of recognizing revenue for contingent consideration earned from the achievement of a substantive milestone in its entirety in the period in which the substantive milestone is achieved. Substantive milestone payments are recognized upon achievement of the milestone only if all of the following conditions are met: the milestone payment relates solely to past performance, the milestone payments are non-refundable; achievement of the milestone involves a degree of risk and was not reasonably assured at the inception of the arrangement; substantive effort is involved in achieving the milestone; the amount of the milestone is reasonable in relation to the effort expended or the risk associated with achievement of the milestone; and a reasonable amount of time passes between the execution of the contract and the first milestone payment as well as between each subsequent milestone payment. If any of these conditions are not met, the milestone payments are deferred and recognized as revenue over the term of the arrangement as the performance obligations are completed.
The Company also has a revenue licensing agreement for usage of certain intellectual property. Licensing revenue from the usage of the intellectual property is recorded based on a third party’s use of the property, on a licensing fee per item sold basis.
Shipping and Handling
The Company classifies amounts billed to customers in sales transactions related to shipping and handling as revenue, and costs incurred by the Company for shipping and handling as cost of revenue.
COHERIX, INC. AND SUBSIDIARIES
NOTES TO UNAUDITED CONSOLIDATED FINANCIAL STATEMENTS
June 30, 2018 and 2017
NOTE 2 – SUMMARY OF SIGNIFICANT ACCOUNTING POLICIES(Continued)
Research and Development
Research and development costs are charged to expense as incurred and amounted to approximately $867,000 and $933,000 for the six months ended June 30, 2018 and 2017, respectively.
Share-Based Compensation
Share-based compensation represents the cost related to stock-based awards granted to employees or consultants. The Company measures share-based compensation based on the estimated fair value of the award on the grant date, which is recognized as expense on a straight-line basis over the requisite service period for awards that vest over time. The Company estimates the fair value of stock options using the Black-Scholes valuation model.
Foreign Currency Translation and Transactions
Coherix Asia Pte. Ltd., which is located and operates in Singapore, keeps its books and records in U.S. Dollars (“USD”) as its functional currency is the USD. Currency transaction gains or losses are generally derived from cash, receivables and payables that are stated in a currency other than USD, and are recognized as income or expense.
Coherix Europe AB, which was located and operated in Sweden, kept its books and records in Swedish Krona (“SEK”), Coherix Europe GmbH, which is located and operates in Germany, keeps its books and records in the euro (“EUR”), and Coherix China, Inc., which is located and operates in China, keeps its books and records in the Chinese Renminbi (“RMB”). The functional currency of Coherix Europe AB is the SEK, Coherix Europe GmbH is the EUR, and Coherix China, Inc. is the RMB, the currency of the primary economic environment in which each respective subsidiary operates. Accordingly, Coherix Europe AB’s, Coherix Europe GmbH’s and Coherix China, Inc.’s financial information is translated from SEK, EUR and RMB, into USD. Assets and liabilities of each of these three entities are translated into USD based on each prevailing exchange rate at each respective balance sheet date. Revenue and expenses are translated into USD based on the average exchange rate for the respective periods. Cumulative translation adjustments are included as a separate component of stockholders’ deficit in accumulated other comprehensive income (loss). Currency transaction gains or losses are generally derived from cash, receivables and payables that are stated in a currency other than the local currency, and are recognized as income or expense.
Foreign Operations
Operations outside the United States of America are subject to risks inherent in operating under different legal systems and various political and economic environments. Among the risks are changes in existing tax laws, possible limitations on foreign investment and income repatriation, government price or foreign exchange controls, and restrictions on currency exchange. The Company does not engage in hedging activities to mitigate its exposure to fluctuations in foreign currency exchange rates.
COHERIX, INC. AND SUBSIDIARIES
NOTES TO UNAUDITED CONSOLIDATED FINANCIAL STATEMENTS
June 30, 2018 and 2017
NOTE 2 – SUMMARY OF SIGNIFICANT ACCOUNTING POLICIES(Continued)
Foreign Operations(Continued)
The consolidated financial statements include the operations of Coherix Asia Pte. Ltd., Coherix Europe AB, Coherix Europe GmbH and Coherix China, Inc., as described above. Included in the consolidated statements of operations and comprehensive income (loss) is net sales of approximately $884,000 and $428,000, and a net loss of approximately $132,000 and $66,000, for the six months ended June 30, 2018 and 2017, respectively, which related to these foreign subsidiaries. The consolidated balance sheet included total assets of approximately $1,225,000 and $256,000 at June 30, 2018 and December 31, 2017, respectively, which related to these foreign subsidiaries.
Comprehensive Income (Loss)
Comprehensive income (loss) is defined as net income (loss) and all non-ownership changes in stockholders’ deficit. For the Company, comprehensive income (loss) for the six months ended June 30, 2018 and 2017 consists of net income (loss) and the foreign currency translation adjustment.
Computation of EPS
Basic and diluted earnings (loss) per share (“EPS”) are computed by dividing net income (loss) attributable to common stockholders by the weighted-average common shares outstanding in the period. Diluted EPS is computed by giving effect to all potentially dilutive securities that are outstanding, and excludes the effects of any potentially antidilutive securities. The number of shares related to options, warrants, and convertible debt included in diluted EPS is based on the treasury stock or if-converted methods, as applicable.
The Company has preferred shares that earn preferred dividends. In the determination of EPS, net income available to common stockholders has been reduced by the amount of preferred dividends.
Recently Adopted Accounting Pronouncements
In July 2015, the Financial Accounting Standards Board (“FASB”) issued Accounting Standards Update (“ASU”) 2015-11, “Simplifying the Measurement of Inventory,” (“ASU 2015-11”). ASU 2015-11 requires inventory be measured at the lower of cost or net realizable value and options that currently exist for market value be eliminated. ASU 2015-11 defines net realizable value as estimated selling prices in the ordinary course of business, less reasonably predictable costs of completion, disposal, and transportation. The Company adopted this guidance on January 1, 2017 on a prospective basis. The adoption of this guidance did not have a material impact on the consolidated financial statements.
COHERIX, INC. AND SUBSIDIARIES
NOTES TO UNAUDITED CONSOLIDATED FINANCIAL STATEMENTS
June 30, 2018 and 2017
NOTE 2 – SUMMARY OF SIGNIFICANT ACCOUNTING POLICIES(Continued)
Recently Adopted Accounting Pronouncements(Continued)
In November 2015, the FASB issued ASU 2015-17, “Income Taxes (Topic 740), Balance Sheet Classification of Deferred Taxes” (“ASU 2015-17”), which requires companies to classify all deferred tax assets and liabilities as noncurrent on the balance sheet instead of separating deferred taxes into current and noncurrent amounts. This amendment was adopted on January 1, 2017 on a retrospective basis. The adoption of this guidance did not have a material impact on the consolidated financial statements.
In March 2016, the FASB issued ASU 2016-09, "Compensation - Stock Compensation (Topic 718): Improvements to Employee Share-Based Payment Accounting" ("ASU 2016-09"), which includes multiple amendments intended to simplify aspects of share-based payment accounting. Amendments to the timing of when excess tax benefits are recognized, minimum statutory withholding requirements, and forfeitures will be applied using a modified retrospective transition method through a cumulative-effect adjustment to equity as of the beginning of the period of adoption. Amendments to the presentation of employee taxes paid on the statement of cash flows when an employer withholds shares to meet the minimum statutory withholding requirement will be applied retrospectively, and amendments requiring the recognition of excess tax benefits and tax deficiencies in the income statement are to be applied prospectively. This ASU was adopted on January 1, 2017 and did not have a material impact on the Company’s consolidated financial statements.
In May 2017, the FASB issued ASU 2017-09, “Compensation – Stock Compensation (Topic 718), Scope of Modification Accounting” (“ASU 2017-09”) which clarifies when changes to the terms or conditions of a share-based payment award must be accounted for as modifications. The new guidance will reduce diversity in practice and result in fewer changes to the terms of an award being accounted for as modifications. ASU 2017-09 will be applied prospectively to awards modified on or after the adoption date. The ASU was adopted on January 1, 2018 and did not have a material impact on the Company’s consolidated financial statements.
Recent Accounting Pronouncements – Not Yet Adopted
The Company has elected to use the extended transition periods for private companies to comply with new or revised accounting standards.
In May 2014, the FASB issued ASU 2014-09, “Revenue from Contracts with Customers” (“ASU 2014-09”), which provides guidance for the recognition, measurement and disclosure of revenue resulting from contracts with customers and will supersede virtually all of the current revenue recognition guidance under U.S. GAAP. The FASB has also issued a number of updates to this standard. For the Company, this standard is effective for the fiscal and interim periods beginning after December 15, 2018. The Company is currently evaluating the impact that this standard will have on its consolidated financial statements.
In February 2016, the FASB issued ASU 2016-02, “Leases (Topic 842)” (“ASU 2016-02”)¸which requires that all leases be reflected on the balance sheet as assets and liabilities for the rights and obligations created by these leases. For the Company, ASU 2016-02 is effective for fiscal years and interim periods beginning after December 15, 2019. The Company is currently evaluating the impact that this standard will have on its consolidated financial statements.
In August 2016, the FASB issued ASU 2016-15, “Classification of Certain Cash Receipts and Cash Payments (Topic 230): Statement of Cash Flows” (“ASU 2016-15”), which clarifies how entities should classify certain cash receipts and cash payments on the statement of cash flows. ASU 2016-15 also clarifies how the predominance principle should be applied when cash receipts and cash payments have aspects of more than one class of cash flows. For the Company, ASU 2016-15 is effective for fiscal years and interim periods beginning after December 15, 2018. The Company is currently evaluating the impact that this standard will have on its consolidated financial statements.
COHERIX, INC. AND SUBSIDIARIES
NOTES TO UNAUDITED CONSOLIDATED FINANCIAL STATEMENTS
June 30, 2018 and 2017
NOTE 3 – NOTES RECEIVABLE – RELATED PARTIES
At June 30, 2018 and December 31, 2017, the Company had 33 notes receivable from stockholders with balances totaling $936,413. As these notes are no longer interest bearing, there was no interest income related to these notes for the six months ended June 30, 2018 and 2017. These notes can be extended at the Company’s option and are classified as long-term assets. The Company has the ability, and intends to, offset these notes receivable with deferred compensation liabilities owed to these related parties. At June 30, 2018 and December 31, 2017, accrued interest receivable related to these notes amounted to $295,072 and $295,072, respectively.
At June 30, 2018 and December 31, 2017, the Company had 13 and 12 notes receivable from stockholders with balances totaling $206,440 and $203,940. These notes were entered into during 2018 and 2017. One of these notes totaling $90,000 bears no interest, and 12 of these notes totaling $116,440 bear interest at 2.75%. These notes can be extended at the Company’s option and are classified as long-term assets. The Company has the ability, and intends to, offset these notes receivable with deferred compensation liabilities owed to these related parties. At June 30, 2018 and December 31, 2017, accrued interest receivable related to these notes amounted to $2,314 and $731, respectively. Related party interest income from these notes amounted to $2,314 and $0 for the six months ended June 30, 2018 and June 30, 2017, respectively.
COHERIX, INC. AND SUBSIDIARIES
NOTES TO UNAUDITED CONSOLIDATED FINANCIAL STATEMENTS
June 30, 2018 and 2017
NOTE 4 – LINES OF CREDIT
During the year ended December 31, 2016, the Company entered into a new credit agreement under which the Company may borrow up to $2,000,000. During the year ended December 31, 2017, the limit on this agreement was increased to $3,000,000. The Company may borrow on this line based on eligible accounts receivable, as defined in the credit agreement. The line is due on demand, with interest due monthly at prime plus 2% per annum (effective rate of 7% at June 30, 2018). The balance on the line was $1,688,293 and $1,519,997 at June 30, 2018 and December 31, 2017, respectively. Prior to June 30, 2018, the Company amended certain terms of this line, and as of June 30, 2018 the Company is now required to make monthly principal payments of $166,667 through April 2019. The Company is required to pay an annual fee of 1% of the maximum allowable borrowings, a monthly maintenance fee ranging from 0.45% to 0.65% of the average outstanding monthly balance, an additional monthly maintenance fee of 0.55% of the average outstanding monthly balance of advances made on foreign accounts receivable, and a 2% fee of the maximum allowable borrowings in the event that Company decides to exit the agreement prior to two years from the date of the agreement. The Company is required to pay interest and monthly maintenance fees on a $750,000 minimum outstanding balance. This line of credit is personally guaranteed by the chief executive officer of the Company, who is also a stockholder of the Company. See Note 9 for additional discussion.
The Company also had a line of credit under credit agreements with three stockholders of the Company. The outstanding balance of the line at June 30, 2018 and December 31, 2017 was $34,000 and $134,000, respectively.
Under this line of credit, draws can be made upon receipt of a purchase order from a customer or upon issuance of an invoice to a customer. The Company sends notice to each participant of its intent to borrow against each participant’s commitment to finance a particular purchase order or accounts receivable balance as defined in the credit agreement. Each participant confirms in writing its agreement to loan the amount set forth in the notice. Each participant can decline to loan the amount set forth in the notice. In the event of decline, the Company will immediately send notice to all participants that the participant has declined. The participants will then reach a mutual agreement to either have one or more of the other participants loan the declined amount, or move forward with the financing of the purchase order or accounts receivable balance without funding the declined amount.
Within 10 days of payment in full of the purchase order or accounts receivable balance by the customer, the Company must repay principal and interest related to that purchase order or accounts receivable balance. In the event a customer defaults on payment or a purchase order was cancelled, the Company must repay the participants within sixty days of default or cancellation.
The line bore interest at 10% through September 2016, at which point interest increased to 12.5%. As of June 30, 2018 and December 31, 2017, the Company had unutilized and available credit under this line of credit totaling $150,000 and $16,000, respectively. As of the date of this report, all commitments were beyond their initial twelve-month term and were eligible to be withdrawn by investors.
COHERIX, INC. AND SUBSIDIARIES
NOTES TO UNAUDITED CONSOLIDATED FINANCIAL STATEMENTS
June 30, 2018 and 2017
NOTE 5 – LONG-TERM DEBT
At June 30, 2018 and December 31, 2017, long-term debt consists of the following:
| | | June 30,
2018 | | | December 31,
2017 | |
| Convertible notes payable with principal and interest ranging from 4% to 10% per annum due at maturity. These convertible notes are all past due. Approximately 28% of these convertible note balances are with related parties. | | $ | 1,497,087 | | | $ | 1,497,087 | |
| | | | | | | | | |
| Note payable with principal payments of $200,000 plus 2.2% interest due quarterly starting December 31, 2015. The note is past due and an in default. | | | 1,973,627 | | | | 1,973,627 | |
| | | | | | | | | |
| Notes payable with principal balances due at maturity, and 10% to 16% interest payable at various times, depending on each respective note. As of June 30, 2018, certain of these notes with balances totaling $593,889 were amended such that maturity dates range from 2018 to 2021. These notes are unsecured. 100% of these notes are with related parties. | | | 251,389 | | | | 601,389 | |
| | | | | | | | | |
| Notes payable with 4% interest due quarterly for the first two years, and principal and interest due quarterly during years three through seven. Maturity dates range from June 2020 to January 2024. These notes are unsecured. Approximately 24% of these notes are with related parties. | | | 615,995 | | | | 827,706 | |
| | | | | | | | | |
| Notes payable with the principal balances due at maturity, and 4% interest due quarterly. Maturity dates range from August 2018 to December 2020. These notes are unsecured. Approximately 20% of these notes are with related parties. | | | 2,500,000 | | | | 2,500,000 | |
COHERIX, INC. AND SUBSIDIARIES
NOTES TO UNAUDITED CONSOLIDATED FINANCIAL STATEMENTS
June 30, 2018 and 2017
NOTE 5 – LONG-TERM DEBT(Continued)
| | | June 30,
2018 | | | December 31,
2017 | |
| | | | | | | | | |
| Notes payable with the principal balances due at maturity, and 8% interest due monthly. As of June 30, 2018, certain of these notes with balances totaling $2,365,000 were amended such that maturity dates range from 2018 to 2021. These notes are unsecured. Approximately 83% of these notes are with related parties. | | | 3,202,809 | | | | 2,509,000 | |
| | | | | | | | | |
| Notes payable with either, principal payments due monthly and a balloon payment due at maturity, or the entire principal balance due at maturity. Interest ranging from 13% to 16% is payable due monthly. As of June 30, 2018, these notes were amended such that maturity dates range from 2018 to 2021. These notes are unsecured. Approximately 86% of these note balances are with related parties. | | | 780,069 | | | | 971,575 | |
| | | | | | | | | |
| Related party notes payable with the principal balance due at maturity, and 16% interest due monthly. As of June 30, 2018, these notes were amended with a maturity date of 2019. These notes are unsecured. | | | 380,000 | | | | 520,000 | |
| | | | | | | | | |
| Note payable with the principal balance due at maturity, and 10% interest due quarterly. The maturity date is September 2019. This note is collateralized by a licensing revenue contract. | | | 505,275 | | | | 505,275 | |
| | | | | | | | | |
| | | | 11,706,251 | | | | 11,905,659 | |
| Less: current portion of long-term debt | | | 5,975,345 | | | | 5,192,588 | |
| | | | | | | | | |
| | | $ | 5,730,906 | | | $ | 6,713,071 | |
COHERIX, INC. AND SUBSIDIARIES
NOTES TO UNAUDITED CONSOLIDATED FINANCIAL STATEMENTS
June 30, 2018 and 2017
NOTE 5 – LONG-TERM DEBT(Continued)
No beneficial conversion feature discount was applied to the convertible notes payable as the conversion features had no intrinsic value at the date of each respective issuance or amendment to terms. Each creditor can convert the entire principal balance of its convertible note to shares of the Company’s common stock at conversion prices ranging from $2.50 to $6.25 (adjusted for 4 for 1 stock split that occurred in 2017) per common share. As of June 30, 2018, the conversion prices and the related note face amounts are as follows:
| | | | Face Amount | |
| Conversion Price at June 30, 2018 | | | of Notes | |
| | | | | |
| | 2.50 | | | $ | 322,289 | |
| | 4.55 | | | | 825,000 | |
| | 5.00 | | | | 50,000 | |
| | 6.25 | | | | 299,798 | |
| | | | | | | |
| | | | | $ | 1,497,087 | |
COHERIX, INC. AND SUBSIDIARIES
NOTES TO UNAUDITED CONSOLIDATED FINANCIAL STATEMENTS
June 30, 2018 and 2017
NOTE 6 – CHINESE INVESTMENTS
Chinese Joint Venture
As of June 30, 2018 and December 31, 2017, the Company held 49% ownership in a Chinese joint venture (the “Chinese Affiliate”). The Company accounts for this investment using the cost method as the Company does not have the ability to exercise significant influence over the Chinese Affiliate. On September 27, 2017, the Company sent a notice of termination of the joint venture contract, due to certain events of default by the 51% owner, as defined in the joint venture contract. Pursuant to the joint venture contract, the notice was effective October 1, 2017. The JV partner responded to the letter on October 10, 2017 stating objection to the termination of the joint venture contract. The carrying value of the Company's investment was $0 at June 30, 2018 and December 31, 2017 due to an other-than-temporary impairment prior to 2016.
Advance to Establish Chinese Subsidiary
During 2017, as a result of financial difficulties of the Chinese Affiliate’s other 51% owner, the Company began negotiations to restructure the joint venture and began the process of establishing a new Chinese entity (the “New Chinese Entity”) to increase resources focused on sales and customer support of the Company’s products in China.
At December 31, 2017, under direction of local counsel, the Company had an outstanding advance totaling $505,275 to an agent of our local attorney with whom the Company has a long working relationship. This advance was used for the purpose of providing the paid-in-capital to organize the New Chinese Entity.
On March 20, 2018, ownership of the New Chinese Entity was transferred to the Company at which point the Company began consolidating Coherix China, Inc. into the Company’s financial statements. This was accounted for as an acquisition of assets as the New Chinese Entity was not a business.
NOTE 7 – COMMITMENTS AND CONTINGENCIES
Concentration, Credit, and Market Risks
Revenue from the Company’s largest customer accounted for approximately 36% of net revenue for the six months ended June 30, 2018 and 2017. Approximately 24% and 23% of accounts receivable is related to this customer at June 30, 2018 and December 31, 2017, respectively. This revenue consists of royalties from a licensing agreement for usage of certain intellectual property. The rest of the Company’s revenue relates to sales of machines, parts, or related services.
The Company sells its products and services in domestic and international markets. Ongoing credit evaluations of its customers are performed and, generally, the Company does not require collateral. Losses have historically been insignificant.
The Company from time to time may maintain cash balances with financial institutions in excess of insured limits. Management has deemed this as a normal business risk. Depository institutions are selected by management based on their review of the financial stability of the institutions.
COHERIX, INC. AND SUBSIDIARIES
NOTES TO UNAUDITED CONSOLIDATED FINANCIAL STATEMENTS
June 30, 2018 and 2017
NOTE 7 – COMMITMENTS AND CONTINGENCIES(Continued)
Contingencies
From time to time, the Company could be involved in various litigation matters arising in the ordinary course of business. There are no matters, individually or in aggregate, that are currently material to the Company.
Predator Programs
Under the Predator Programs (the “Program”) discussed below, during the six months ended June 30, 2018 and 2017, the Company incurred expense of $391,342 and $152,804 on Predator product sales of $2,897,490 and $1,131,364, respectively. As further described below, the Company will be required to pay royalties under the Program through 2026. The Program has been closed to new participants.
Predator Royalty With Stock Investment Program
Under the Program, investors agreed to pay cash to purchase common stock with a right to receive royalties under the Program. Under the Program, two $2,000,000 pools were established for certain investors who acquire common stock for cash or through conversion of debt. For 10 years, commencing on the date of the first shipment for the sale of a Predator unit, each $2,000,000 pool is entitled to receive 5% of the revenue from Predator product sales. The royalties are deposited into the royalty pool and are paid quarterly to investors based on each investor’s respective interest in each respective pool.
As of both June 30, 2018 and December 31, 2017, pool 1 was filled with $2,000,000 of common stock purchases, and pool 2 was filled with $332,871 of common stock purchases.
Predator Royalty Opportunity Pools
Also under the Program, certain investors with accrued interest balances agreed to forfeit their right to payment for the opportunity to enter the Program. Under the Program, three pools of participating interests were created. Two $2,000,000 pools were established for investors and employees that agreed to forgive the accrued interest owed to them by the Company or forfeit a portion of salaries or consulting fees. Another $200,000 pool was established for employees that agreed to forfeit a portion of their salary. For 10 years, commencing on the date of the first shipment for the sale of a Predator unit, each $2,000,000 pool is entitled to receive 5% of the revenue from Predator product sales and the $200,000 pool is entitled to receive 0.5% of the revenue from Predator product sales. The royalties are deposited into the royalty pool and are paid quarterly to participants based on each participant’s respective interest in the respective pool.
As of both June 30, 2018 and December 31, 2017, pool 1 was filled with $2,000,000 of forgiven accrued interest, pool 2 was filled with $856,713 of forgiven accrued interest, forfeited salaries, and consulting fees, and pool 3 was filled with $199,517 of forfeited salaries.
COHERIX, INC. AND SUBSIDIARIES
NOTES TO UNAUDITED CONSOLIDATED FINANCIAL STATEMENTS
June 30, 2018 and 2017
NOTE 7 – COMMITMENTS AND CONTINGENCIES(Continued)
Predator Programs(Continued)
Predator Team Member Pool
Also, under the Program, one pool was established for employees as a bonus. Under this pool, each employee is entitled to 2% of the pool royalties. For 10 years, commencing on the date of the first shipment for the sale of a Predator unit, the pool is entitled to receive 0.125% of the revenue from Predator product sales. The royalties are deposited into the royalty pool and are paid quarterly to employees at a rate of 2% per employee.
As of both June 30, 2018 and December 31, 2017, this pool was filled with 29 employees.
NOTE 8 – RELATED PARTY TRANSACTIONS
During the six months ended June 30, 2018 and 2017, the Company had product revenue from a related party through common ownership of approximately $92,400 and $94,200, respectively. The Company also had product revenue from its Chinese Affiliate of approximately $600,400 and $180,700. Related to these transactions, the Company had net accounts receivable due from related parties totaling $477,503 and $362,450 at June 30, 2018 and December 31, 2017, respectively.
The Company had accounts payable due to employees and related parties through common ownership totaling $192,697 and $185,076 at June 30, 2018 and December 31, 2017, respectively.
NOTE 9 – SUBSEQUENT EVENTS
The Company has performed a review of events subsequent to June 30, 2018. Any effect of subsequent events on these consolidated financial statements has been included as appropriate.
Subsequent to June 30, 2018, the Company amended its line of credit to increase the amount available for borrowing from $3,000,000 to $4,000,000. This amendment also includes an increase in the monthly principal payments to $250,000 through April 2019.
Subsequent to June 30, 2018, the Company amended certain notes as such notes were coming due. The principal balances of these notes totaled approximately $211,000. Subsequent to June 30, 2018, the Company also borrowed an additional $440,000 under new notes payable. In conjunction with certain of these amendments and new financing instruments, the Company issued warrants to purchase 40,000 shares of common stock with an exercise price of $5.00 per share, and reissued or extended warrants to purchase 13,760 shares of common stock with an exercise price of $3.75 per share that were outstanding at December 31, 2017 and scheduled to expire in 2018. All of these warrants now expire in 2021.
Subsequent to June 30, 2018, notes payable with balances totaling $129,000 were used to exercise 34,400 warrants ($3.75 per share).
The Company is in the process of restructuring its outstanding debt and related accrued interest, and is in the process of attempting to raise $30 million in capital through a combination of a Regulation A+ offering and new senior long-term debt.
INDEPENDENT AUDITOR’S REPORT
To the Board of Directors and Stockholders of
Coherix, Inc.
We have audited the accompanying consolidated financial statements of Coherix, Inc. and Subsidiaries (the “Company”), which comprise the consolidated balance sheet as of December 31, 2017, and the related consolidated statements of operations and comprehensive income (loss), stockholders’ deficit, and cash flows for the year then ended, and the related notes to the consolidated financial statements.
Management’s Responsibility for the Financial Statements
Management is responsible for the preparation and fair presentation of these consolidated financial statements in accordance with accounting principles generally accepted in the United States of America; this includes the design, implementation, and maintenance of internal control relevant to the preparation and fair presentation of financial statements that are free from material misstatement, whether due to fraud or error.
Auditor’s Responsibility
Our responsibility is to express an opinion on these consolidated financial statements based on our audit. We conducted our audit in accordance with auditing standards generally accepted in the United States of America. Those standards require that we plan and perform the audit to obtain reasonable assurance about whether the consolidated financial statements are free from material misstatement.
An audit involves performing procedures to obtain audit evidence about the amounts and disclosures in the financial statements. The procedures selected depend on the auditor’s judgment, including the assessment of the risks of material misstatement of the financial statements, whether due to fraud or error. In making those risk assessments, the auditor considers internal control relevant to the entity’s preparation and fair presentation of the financial statements in order to design audit procedures that are appropriate in the circumstances, but not for the purpose of expressing an opinion on the effectiveness of the entity’s internal control. Accordingly, we express no such opinion. An audit also includes evaluating the appropriateness of accounting policies used and the reasonableness of significant accounting estimates made by management, as well as evaluating the overall presentation of the financial statements.
We believe that the audit evidence we have obtained is sufficient and appropriate to provide a basis for our audit opinion.
Opinion
In our opinion, the consolidated financial statements referred to above present fairly, in all material respects, the financial position of Coherix, Inc. and Subsidiaries as of December 31, 2017, and the results of their operations and their cash flows for the year then ended, in accordance with accounting principles generally accepted in the United States of America.
Substantial Doubt About the Company's Ability to Continue as a Going Concern
The accompanying consolidated financial statements have been prepared assuming that the Company will continue as a going concern. As shown in the consolidated financial statements, the Company had a working capital deficiency of $14,370,103 and stockholders’ deficit of $19,494,426 at December 31, 2017. As discussed in Note 1 to the consolidated financial statements, while the Company has instituted measures to preserve cash and secure additional financing, there are uncertainties as to the future success of such measures. Management has stated that the combination of these uncertainties raises substantial doubt about the Company’s ability to continue as a going concern. Management’s evaluation of the events and conditions and management's plans regarding those matters are also described in Note 1. The consolidated financial statements do not include any adjustments that might result from the outcome of this uncertainty. Our opinion is not modified with respect to that matter.
/s/ UHY LLP
Farmington Hills, Michigan
October 2, 2018
INDEPENDENT AUDITOR’S REPORT
March 16, 2018, except for Notes 3 and 13, as to which the date is September 19, 2018
To the Board of Directors
Coherix, Inc.
Report on the Consolidated Financial Statements
We have audited the accompanying consolidated financial statements of Coherix, Inc. (the “Company”) and Subsidiaries, which comprise the consolidated balance sheet as of December 31, 2016, and the related consolidated statements of operations and comprehensive income (loss), stockholders’ deficit, and cash flows for the year then ended, as well as the related notes to the consolidated financial statements.
Management’s Responsibility for the Consolidated Financial Statements
The Company’s management is responsible for the preparation and fair presentation of these consolidated financial statements in accordance with accounting principles generally accepted in the United States of America; this includes the design, implementation, and maintenance of internal control relevant to the preparation and fair presentation of consolidated financial statements that are free from material misstatement, whether due to fraud or error.
Auditor’s Responsibility
Our responsibility is to express an opinion on these consolidated financial statements based on our audit. We conducted our audit in accordance with auditing standards generally accepted in the United States of America. Those standards require that we plan and perform the audit to obtain reasonable assurance about whether the consolidated financial statements are free from material misstatement.
An audit involves performing procedures to obtain audit evidence about the amounts and disclosures in the consolidated financial statements. The procedures selected depend on the auditor’s judgment, including the assessment of the risks of material misstatement of the consolidated financial statements, whether due to fraud or error. In making those risk assessments, the auditor considers internal control relevant to the Company’s preparation and fair presentation of the consolidated financial statements in order to design audit procedures that are appropriate in the circumstances, but not for the purpose of expressing an opinion on the effectiveness of the Company’s internal control. Accordingly, we express no such opinion.
An audit also includes evaluating the appropriateness of accounting policies used and the reasonableness of significant accounting estimates made by management, as well as evaluating the overall presentation of the consolidated financial statements.
We believe that the audit evidence we have obtained is sufficient and appropriate to provide a basis for our audit opinion.
Opinion
In our opinion, the 2016 consolidated financial statements referred to above present fairly, in all material respects, the consolidated financial position of Coherix, Inc. and Subsidiaries as of December 31, 2016, and the consolidated results of their operations and their consolidated cash flows for the year then ended, in accordance with accounting principles generally accepted in the United States of America.
Changes in Presentation
As disclosed in Note 3 to the consolidated financial statements, the Company has updated its 2016 consolidated financial statements to retrospectively disclose earnings (loss) per share information. Also, as disclosed in Note 13 to the consolidated financial statements, the Company has updated its 2016 consolidated financial statements to retrospectively disclose effective income tax rate information. Our opinion is not modified with respect to those matters.
/s/ GEORGE JOHNSON & COMPANY
CERTIFIED PUBLIC ACCOUNTANTS
Detroit, Michigan
COHERIX, INC. AND SUBSIDIARIES
CONSOLIDATED BALANCE SHEETS
| | | December 31, | |
| | | 2017 | | | 2016 | |
| ASSETS | | | | | | |
| | | | | | | |
| CURRENT ASSETS | | | | | | | | |
| Cash and cash equivalents | | $ | 900,660 | | | $ | 470,206 | |
| Restricted cash and cash equivalents | | | – | | | | 209,520 | |
| Accounts receivable | | | | | | | | |
| Trade, net | | | 1,522,343 | | | | 572,022 | |
| Related party, net | | | 362,450 | | | | 275,304 | |
| Inventories, net | | | 1,059,105 | | | | 871,102 | |
| Prepaid expenses and other | | | 110,987 | | | | 166,281 | |
| | | | | | | | | |
| Total current assets | | | 3,955,545 | | | | 2,564,435 | |
| | | | | | | | | |
| PROPERTY AND EQUIPMENT, NET | | | 93,607 | | | | 136,209 | |
| | | | | | | | | |
| OTHER ASSETS | | | | | | | | |
| Notes receivable – related parties | | | 1,140,353 | | | | 956,413 | |
| Accrued interest receivable – related parties | | | 295,803 | | | | 299,124 | |
| Advance to establish Chinese subsidiary | | | 505,275 | | | | – | |
| Other deposits | | | 181,470 | | | | 232,910 | |
| Intangible assets, net | | | 893 | | | | 1,868 | |
| | | | | | | | | |
| Total other assets | | | 2,123,794 | | | | 1,490,315 | |
| | | | | | | | | |
| TOTAL ASSETS | | $ | 6,172,946 | | | $ | 4,190,959 | |
See notes to consolidated financial statements.
COHERIX, INC. AND SUBSIDIARIES
CONSOLIDATED BALANCE SHEETS(Continued)
| | | December 31, | |
| | | 2017 | | | 2016 | |
| LIABILITIES AND STOCKHOLDERS’ DEFICIT | | | | | | |
| | | | | | | |
| CURRENT LIABILITIES | | | | | | | | |
| Lines of credit | | $ | 1,653,997 | | | $ | 952,876 | |
| Current portion of long-term debt | | | 5,192,588 | | | | 5,823,695 | |
| Current portion of deferred compensation | | | 2,920,546 | | | | 2,972,088 | |
| Current portion of capital lease obligations | | | 145,545 | | | | 197,695 | |
| Accounts payable – trade | | | 174,464 | | | | 309,778 | |
| Accounts payable – related party | | | 185,076 | | | | 180,197 | |
| Current portion of accrued interest | | | 6,709,459 | | | | 7,817,936 | |
| Deposits | | | 38,420 | | | | 195,820 | |
| Preferred dividends payable | | | 864,648 | | | | – | |
| Other accrued liabilities | | | 440,905 | | | | 351,105 | |
| | | | | | | | | |
| Total current liabilities | | | 18,325,648 | | | | 18,801,190 | |
| | | | | | | | | |
| LONG-TERM LIABILITIES | | | | | | | | |
| Long-term debt, less current portion | | | 6,713,071 | | | | 9,857,602 | |
| Accrued interest, less current portion | | | 216,263 | | | | 125,502 | |
| Capital lease obligations, less current portion | | | 412,390 | | | | 369,981 | |
| | | | | | | | | |
| Total long-term liabilities | | | 7,341,724 | | | | 10,353,085 | |
| | | | | | | | | |
| Total liabilities | | | 25,667,372 | | | | 29,154,275 | |
| | | | | | | | | |
COMMITMENTS AND CONTINGENCIES | | | | | | | | |
| | | | | | | | | |
| STOCKHOLDERS’ DEFICIT | | | | | | | | |
| Series A convertible preferred stock, $0.001 par value, 400,000 shares authorized, $10 per share liquidation value, 8% cumulative, -0- and 370,988 shares issued and outstanding, respectively |
|
|
– |
|
|
|
371 |
|
| Common stock, $0.001 par value, 30,000,000 authorized, and 12,973,604 and 9,355,276 shares issued and outstanding, respectively(a) | | | 12,974 | | | | 9,355 | |
| Additional paid-in-capital(a) | | | 35,164,347 | | | | 28,807,834 | |
| Accumulated deficit | | | (54,690,105 | ) | | | (53,778,107 | ) |
| Accumulated other comprehensive income (loss) net of income taxes of $0 | | | 18,358 | | | | (2,769 | ) |
| | | | | | | | | |
| Total stockholders’ deficit | | | (19,494,426 | ) | | | (24,963,316 | ) |
| | | | | | | | | |
| TOTAL LIABILITIES AND STOCKHOLDERS’ DEFICIT | | $ | 6,172,946 | | | $ | 4,190,959 | |
(a) Reflects the effect of the 4 for 1 split of common stock
See notes to consolidated financial statements.
COHERIX, INC. AND SUBSIDIARIES
CONSOLIDATED STATEMENTS OF OPERATIONSAND COMPREHENSIVE INCOME (LOSS)
| | | Years ended December 31, | |
| | | 2017 | | | 2016 | |
| Net revenue | | | | | | | | |
| Product revenue | | $ | 5,552,663 | | | $ | 2,439,886 | |
| Licensing revenue | | | 3,573,960 | | | | 2,157,180 | |
| Other | | | 257,243 | | | | 365,237 | |
| | | | | | | | | |
| Total net revenue | | | 9,383,866 | | | | 4,962,303 | |
| | | | | | | | | |
| Cost of product revenue | | | 2,201,011 | | | | 1,179,442 | |
| | | | | | | | | |
| Gross profit | | | 7,182,855 | | | | 3,782,861 | |
| | | | | | | | | |
| Operating expense | | | 5,749,249 | | | | 5,320,961 | |
| | | | | | | | | |
| Income (loss) from operations | | | 1,433,606 | | | | (1,538,100 | ) |
| | | | | | | | | |
| Other income (expense): | | | | | | | | |
| Interest income | | | 1,565 | | | | 7,453 | |
| Interest expense | | | (1,251,772 | ) | | | (1,125,850 | ) |
| Other income, net | | | 113,143 | | | | 11,071 | |
| Net loss on foreign currency transactions | | | (3,292 | ) | | | (12,944 | ) |
| | | | | | | | | |
| Total other expense, net | | | (1,140,356 | ) | | | (1,120,270 | ) |
| | | | | | | | | |
| Income (loss) before income tax | | | 293,250 | | | | (2,658,370 | ) |
| | | | | | | | | |
| Income tax expense | | | – | | | | – | |
| | | | | | | | | |
| Net income (loss) | | $ | 293,250 | | | $ | (2,658,370 | ) |
| | | | | | | | | |
| EARNINGS (LOSS) PER SHARE(a) | | | | | | | | |
| Basic earnings (loss) per share attributable to common stockholders of Coherix, Inc. | | $ | 0.01 | | | $ | (0.31 | ) |
| Diluted earnings (loss) per share attributable to common stockholders of Coherix, Inc. | | $ | 0.01 | | | $ | (0.31 | ) |
| | | | | | | | | |
| Weighted-average common shares outstanding | | | | | | | | |
| Basic | | | 9,651,443 | | | | 9,200,441 | |
| Diluted | | | 11,357,258 | | | | 9,200,441 | |
| Dividends declared per common share | | $ | – | | | $ | – | |
| | | | | | | | | |
| COMPREHENSIVE INCOME (LOSS) | | | | | | | | |
| Net income (loss) | | $ | 293,250 | | | $ | (2,658,370 | ) |
| Foreign currency translation adjustment, net of income taxes of $-0- | | | 21,127 | | | | 6 | |
| COMPREHENSIVE INCOME (LOSS) | | $ | 314,377 | | | $ | (2,658,364 | ) |
(a)Reflects the effect of the 4 for 1 split of common stock
See notes to consolidated financial statements.
COHERIX, INC. AND SUBSIDIARIES
CONSOLIDATED STATEMENTS OF STOCKHOLDERS' DEFICIT
Years Ended December 31, 2017 and 2016
| | | Series A Convertible Preferred Stock | | | (a)
Common Stock | | | (a)
Additional | | | | | | Accumulated Other Comprehensive Income (Loss), Net of | | | Total | |
| | | Number of | | | | | | Number of | | | | | | Paid-in | | | Accumulated | | | Income | | | Stockholders’ | |
| | | Shares | | | Amount | | | Shares | | | Amount | | | Capital | | | Deficit | | | Taxes | | | Deficit | |
| | | | | | | | | | | | | | | | | | | | | | | | | |
| Balance, January 1, 2016 | | | 370,988 | | | $ | 371 | | | | 9,108,928 | | | $ | 9,109 | | | $ | 27,787,927 | | | $ | (51,119,737 | ) | | $ | (2,775 | ) | | $ | (23,325,105 | ) |
| | | | | | | | | | | | | | | | | | | | | | | | | | | | | | | | | |
| Share-based compensation | | | – | | | | – | | | | – | | | | – | | | | 501,251 | | | | – | | | | – | | | | 501,251 | |
| | | | | | | | | | | | | | | | | | | | | | | | | | | | | | | | | |
| Issuance of common stock | | | – | | | | – | | | | 84,924 | | | | 85 | | | | 318,397 | | | | – | | | | – | | | | 318,482 | |
| | | | | | | | | | | | | | | | | | | | | | | | | | | | | | | | | |
| Exercise of stock options | | | – | | | | – | | | | 105,100 | | | | 105 | | | | 26,170 | | | | – | | | | – | | | | 26,275 | |
| | | | | | | | | | | | | | | | | | | | | | | | | | | | | | | | | |
| Conversion of debt and accrued interest into common stock | | | – | | | | – | | | | 56,324 | | | | 56 | | | | 174,089 | | | | – | | | | – | | | | 174,145 | |
| | | | | | | | | | | | | | | | | | | | | | | | | | | | | | | | | |
| Net loss | | | – | | | | – | | | | – | | | | – | | | | – | | | | (2,658,370 | ) | | | – | | | | (2,658,370 | ) |
| | | | | | | | | | | | | | | | | | | | | | | | | | | | | | | | | |
| Foreign currency translation adjustment, net of income taxes of $0 | | | – | | | | – | | | | – | | | | – | | | | – | | | | – | | | | 6 | | | | 6 | |
| | | | | | | | | | | | | | | | | | | | | | | | | | | | | | | | | |
| Balance, December 31, 2016 | | | 370,988 | | | | 371 | | | | 9,355,276 | | | | 9,355 | | | | 28,807,834 | | | | (53,778,107 | ) | | | (2,769 | ) | | | (24,963,316 | ) |
| | | | | | | | | | | | | | | | | | | | | | | | | | | | | | | | | |
| Share-based compensation | | | – | | | | – | | | | – | | | | – | | | | 490,477 | | | | – | | | | – | | | | 490,477 | |
| | | | | | | | | | | | | | | | | | | | | | | | | | | | | | | | | |
Conversion of preferred stock to common
stock | | | (370,988 | ) | | | (371 | ) | | | 1,483,952 | | | | 1,484 | | | | (1,113 | ) | | | – | | | | – | | | | – | |
| | | | | | | | | | | | | | | | | | | | | | | | | | | | | | | | | |
| Issuance of common stock | | | – | | | | – | | | | 101,816 | | | | 102 | | | | 508,996 | | | | – | | | | – | | | | 509,098 | |
| | | | | | | | | | | | | | | | | | | | | | | | | | | | | | | | | |
| Exercise of stock options | | | – | | | | – | | | | 633,552 | | | | 634 | | | | 157,754 | | | | – | | | | – | | | | 158,388 | |
| | | | | | | | | | | | | | | | | | | | | | | | | | | | | | | | | |
| Conversion of debt and accrued interest into common stock | | | – | | | | – | | | | 1,399,008 | | | | 1,399 | | | | 5,200,399 | | | | – | | | | – | | | | 5,201,798 | |
| | | | | | | | | | | | | | | | | | | | | | | | | | | | | | | | | |
| Preferred stock dividends declared | | | – | | | | – | | | | – | | | | – | | | | – | | | | (1,205,248 | ) | | | – | | | | (1,205,248 | ) |
| | | | | | | | | | | | | | | | | | | | | | | | | | | | | | | | | |
| Net income | | | – | | | | – | | | | – | | | | – | | | | – | | | | 293,250 | | | | – | | | | 293,250 | |
| | | | | | | | | | | | | | | | | | | | | | | | | | | | | | | | | |
| Foreign currency translation adjustment, net of income taxes of $0 | | | – | | | | – | | | | – | | | | – | | | | – | | | | – | | | | 21,127 | | | | 21,127 | |
| | | | | | | | | | | | | | | | | | | | | | | | | | | | | | | | | |
| Balance, December 31, 2017 | | | – | | | $ | – | | | | 12,973,604 | | | $ | 12,974 | | | $ | 35,164,347 | | | $ | (54,690,105 | ) | | $ | 18,358 | | | $ | (19,494,426 | ) |
(a) Reflects the effect of the 4 for 1 split of common stock
See notes to consolidated financial statements.
COHERIX, INC. AND SUBSIDIARIES
CONSOLIDATED STATEMENTS OF CASH FLOWS
| | | Years ended December 31, | |
| | | 2017 | | | 2016 | |
| OPERATING ACTIVITIES | | | | | | | | |
| Net income (loss) | | $ | 293,250 | | | $ | (2,658,370 | ) |
| Adjustments to reconcile net income (loss) to net cash flows from operating activities: | | | | | | | | |
| Depreciation and amortization | | | 47,895 | | | | 54,305 | |
| Share-based compensation | | | 490,477 | | | | 501,251 | |
| Net unrealized (gain) loss on foreign currency transactions | | | 20,550 | | | | (868 | ) |
| Forgiveness of accrued interest | | | (17,502 | ) | | | (9,068 | ) |
| Changes in assets and liabilities: | | | | | | | | |
| Accounts receivable | | | (1,036,168 | ) | | | 538,926 | |
| Inventories | | | (188,003 | ) | | | 15,126 | |
| Prepaid expenses and other current assets | | | 61,533 | | | | 7,862 | |
| Accrued interest receivable | | | 3,321 | | | | – | |
| Other deposits | | | 51,440 | | | | 22,000 | |
| Accounts payable | | | (135,179 | ) | | | (57,275 | ) |
| Accrued interest payable | | | 329,601 | | | | 275,473 | |
| Other accrued liabilities and deposits | | | (72,844 | ) | | | (939 | ) |
| Deferred compensation | | | 8,132 | | | | (34,431 | ) |
| | | | | | | | | |
| Net cash used in operating activities | | | (143,497 | ) | | | (1,346,008 | ) |
| | | | | | | | | |
| INVESTING ACTIVITIES | | | | | | | | |
| Advance to establish Chinese subsidiary | | | (505,275 | ) | | | – | |
| Purchase of property and equipment | | | (3,574 | ) | | | (6,740 | ) |
| | | | | | | | | |
| Net cash used in financing activities | | | (508,849 | ) | | | (6,740 | ) |
| | | | | | | | | |
| FINANCING ACTIVITIES | | | | | | | | |
| Net borrowings under line of credit agreements | | | 701,121 | | | | 362,876 | |
| Payments on long-term debt | | | (600,515 | ) | | | (1,024,586 | ) |
| Proceeds from issuance of long-term debt | | | 760,275 | | | | 539,366 | |
| Proceeds from issuance of common stock | | | – | | | | 318,482 | |
| Proceeds from exercise of stock options for common stock | | | 19,858 | | | | 23,875 | |
| Change in restricted cash and cash equivalents | | | 209,520 | | | | 1,218,814 | |
| Proceeds from capital leasing financing | | | 199,621 | | | | – | |
| Payments on capital lease obligations | | | (209,362 | ) | | | (301,835 | ) |
| | | | | | | | | |
| Net cash provided by financing activities | | | 1,080,518 | | | | 1,136,992 | |
| | | | | | | | | |
| Effect of exchange rate changes on cash | | | 2,282 | | | | (65 | ) |
| NET CHANGE IN CASH | | | 430,454 | | | | (215,821 | ) |
| | | | | | | | | |
| CASH, Beginning of Year | | | 470,206 | | | | 686,027 | |
| CASH, End of Year | | $ | 900,660 | | | $ | 470,206 | |
See notes to consolidated financial statements.
COHERIX, INC. AND SUBSIDIARIES
CONSOLIDATED STATEMENTS OF CASH FLOWS(Continued)
| | | Years ended December 31, | |
| | | 2017 | | | 2016 | |
| SUPPLEMENTAL CASH FLOW INFORMATION | | | | | | | | |
| Cash paid during the year for: | | | | | | | | |
| Interest | | $ | 922,171 | | | $ | 850,377 | |
| Income taxes | | $ | – | | | $ | – | |
| | | | | | | | | |
| SUPPLEMENTAL NONCASH INVESTING AND FINANCING ACTIVITIES | | | | | | | | |
| Conversion of long-term debt and accrued interest into common stock | | $ | 5,201,798 | | | $ | 74,145 | |
| Preferred dividends payable used to purchase common stock | | $ | 340,600 | | | $ | – | |
| Notes receivable issued to exercise stock options for common stock | | $ | 203,940 | | | $ | 2,400 | |
| Issuance of term notes in lieu of accrued interest | | $ | 14,602 | | | $ | 19,491 | |
| Deferred compensation used to purchase common stock or exercise stock options for common stock | | $ | 39,674 | | | $ | – | |
| Deferred compensation used to pay off note receivable | | $ | 20,000 | | | $ | – | |
| Common stock issued to pay accrued interest | | $ | 63,415 | | | $ | – | |
| Issuance of term notes in lieu of lines of credit | | $ | – | | | $ | 10,000 | |
| Common stock issued to pay stockholder line of credit | | $ | – | | | $ | 100,000 | |
| Transfer of stockholder term notes to stockholder lines of credit | | $ | – | | | $ | 200,000 | |
See notes to consolidated financial statements.
COHERIX, INC. AND SUBSIDIARIES
NOTES TO CONSOLIDATED FINANCIAL STATEMENTS
December 31, 2017 and 2016
NOTE 1 – BUSINESS AND OPERATIONS
Coherix, Inc. and Subsidiaries (the “Company”) is primarily engaged in the design and manufacturing of 3-D vision products for the automotive and semiconductor industries in North America, Europe, and Asia. Among the products offered, the Company produces digital holographic imaging and 3-D imaging technologies and related equipment that provide “on-the-fly” measurements within very tight tolerances.
The Company has incurred historical losses, and current liabilities exceed current assets at December 31, 2017, with the majority of the current liabilities tied to maturing long-term notes which have been a primary funding mechanism. The Company had net income for the year ended December 31, 2017. The Company’s revenue increased significantly and operating cash flow dramatically improved during the year ended December 31, 2017. The Company also reduced its debt obligations during the year ended December 31, 2017 as many creditors also converted their debt into common shares as discussed in Note 9.
Currently, the Company is working with a bank that has supplied a line of credit and agreed to increase the line as discussed in Note 8. In 2018, the Company was also able to secure additional financing through new sale leaseback transactions. Also, the major part of the Company's debt obligations are with stockholders who have consistently extended maturity dates of such obligations.
While the Company has instituted measures to preserve cash and secure additional financing, there are uncertainties as to the success of such measures. Management realizes that the combination of these uncertainties casts substantial doubt upon the Company’s ability to continue as a going concern within one year from issuance of these financial statements. In response, the Company plans to:
| 1. | Continue the recent initiatives to generate profitable growth leading to positive operating cash flow generation |
| 2. | Negotiate extensions to existing debt maturities and/or conversion to equity |
| 3. | Conclude negotiations on a new $15 million long-term debt facility with at least $3.5 million to retire maturing long-term notes |
| 4. | Raise up to $15 million of equity capital through a Regulation A+ offering |
Having considered the above, management of the Company continues using the going concern basis in preparing the consolidated financial statements.
COHERIX, INC. AND SUBSIDIARIES
NOTES TO CONSOLIDATED FINANCIAL STATEMENTS
December 31, 2017 and 2016
NOTE 2 –SummarY of Significant Accounting Policies
Basis of Presentation and Principles of Consolidation
The consolidated financial statements include the accounts of Coherix, Inc., and its wholly-owned subsidiaries which include Coherix Asia Pte. Ltd., located in Singapore, Coherix Europe AB, located in Sweden, and Coherix Europe GmbH, located in Germany. All significant intercompany balances, transactions and equity holdings have been eliminated in consolidation.
The consolidated financial statements for the years ended December 31, 2017 and 2016 include the operating results of Coherix, Inc. and its subsidiaries for the years ended December 31, 2017 and 2016, except for Coherix Europe AB which is only included through January 22, 2017, the date it was liquidated and dissolved.
In December 2017, the Company executed a 4 for 1 split of its common stock. The Company also amended its certificate of incorporation and increased the pool of authorized shares to 30,400,000, consisting of 30,000,000 common shares and 400,000 preferred shares. All periods presented reflect the effect of the stock split in share and per share amounts as noted throughout these consolidated financial statements.
Variable Interest Entity
The Company follows the guidance of accounting for variable interest entities (“VIE”s), which requires certain VIEs to be consolidated by the primary beneficiary of the entities. The Company’s management evaluated the relationship between the Company and the New Chinese Entity discussed in Note 12. The Company concluded that it was not the primary beneficiary of the New Chinese Entity at December 31, 2017 as the Company lacked the power to direct the activities of the VIE that most significantly impact the VIE’s economic performance. At December 31, 2017, the agent owner held the power to direct all activities of the VIE. Therefore consolidation in the Company’s financial statements is not required. As discussed in Note 12, the Company provided implicit financial support to the VIE through the advance made to the agent of our local attorney. This advance represents the maximum exposure to loss at December 31, 2017.
Use of Estimates
Preparation of the consolidated financial statements in conformity with accounting principles generally accepted in the United States of America (“U.S. GAAP”) requires management to make estimates and assumptions that affect the reported amounts of assets and liabilities, the disclosure of contingent assets and liabilities at the date of the financial statements, and the reported amounts of revenue and expenses during the reporting period. Actual results could differ from those estimates.
COHERIX, INC. AND SUBSIDIARIES
NOTES TO CONSOLIDATED FINANCIAL STATEMENTS
December 31, 2017 and 2016
NOTE 2 – SUMMARY OF SIGNIFICANT ACCOUNTING POLICIES(Continued)
Cash and Cash Equivalents
The Company considers all highly liquid investments, generally with an original maturity of three months or less, to be cash equivalents.
Accounts Receivable
The Company transacts business with companies on an open credit basis. The Company’s trade accounts receivable are generally uncollateralized.The Company carries its accounts receivable at invoiced amount. The Company's policy is not to accrue interest on past due accounts receivable.The Company periodically reviews accounts receivable for collectability and establishes reserves for accounts when the Company considers amounts uncollectible. Balances that remain outstanding after the Company has used reasonable collection efforts are written off. Trade accounts receivable are stated net of an allowance for doubtful accounts of $11,271 at December 31, 2017 and 2016. Related party accounts receivable are stated net of an allowance for doubtful accounts of $50,000 at December 31, 2017 and 2016.
Inventories
Inventories consist of components used in manufacturing and assembling machines and are stated at the lower of cost or net realizable value with cost being determined using the first-in, first-out method. Maintenance, operating and office supplies are not inventoried, but are charged to expense when purchased. Management has deemed it impracticable to track inventories by classes of raw materials, work-in-process and finished goods. The reserve for potentially obsolete inventory totaled $63,183 and $36,259 as of December 31, 2017 and 2016, respectively.
Property and Equipment
Property and equipment are recorded at cost, net of accumulated depreciation and amortization. For financial statement reporting purposes, property and equipment are depreciated over estimated useful lives ranging from 3 to 7 years, with the exception of leasehold improvements which are amortized over the shorter of the life of the related lease or the useful life, all using the straight-line method of depreciation. Additions of new equipment and major renewals and replacements of existing equipment are capitalized. Repairs and maintenance expenditures are charged to expense in the year incurred. Upon sale, disposal, and retirement of property and equipment, the cost and accumulated depreciation and amortization are written off and any gain or loss is included in earnings.
Intangible Assets
The Company amortizes its intangible assets with finite lives on a straight-line basis over their estimated useful lives. The Company’s intangible assets consist of software and patents and are amortized over 10 and 15 years, respectively.
COHERIX, INC. AND SUBSIDIARIES
NOTES TO CONSOLIDATED FINANCIAL STATEMENTS
December 31, 2017 and 2016
NOTE 2 – SUMMARY OF SIGNIFICANT ACCOUNTING POLICIES(Continued)
Long-Lived Assets
Long-lived assets, such as property and equipment, and intangible assets subject to amortization, are reviewed for impairment whenever events or changes in circumstances indicate that the carrying amount of an asset may not be recoverable. Recoverability of assets to be held and used is measured by a comparison of the carrying amount of an asset to estimated undiscounted future cash flows expected to be generated by the asset. If the carrying amount of an asset exceeds its estimated future cash flows, an impairment charge is recognized in the amount by which the carrying amount of the asset exceeds the fair value of the asset. There were no impairments recognized during the years ended December 31, 2017 and 2016.
Income Taxes
Deferred income tax assets and liabilities are classified as noncurrent and are recorded for the estimated future tax consequences attributable to the differences between the financial statement carrying amounts of existing assets and liabilities and their respective tax bases. Deferred income tax assets and liabilities are measured using enacted tax rates in effect for the years in which those temporary differences are expected to be realized. The effect on deferred income tax assets and liabilities of a change in tax rates is recognized in the period that includes the enactment date. A valuation allowance is recorded against deferred tax assets when the Company is unable to conclude that realization of the deferred tax assets is more likely than not.
The benefit of an uncertain tax position is recognized in the financial statements if it meets a minimum recognition threshold. A determination is first made as to whether it is more likely than not that the income tax position will be sustained, based upon technical merits, upon examination by the taxing authorities. If the income tax position is expected to meet the more-likely-than-not criteria, the benefit recorded in the financial statements equals the largest amount that is greater than 50% likely to be realized upon its ultimate settlement. In a case where interest or penalties are incurred, the Company recognizes interest accrued related to unrecognized tax benefits in interest expense and penalties in operating expenses. At December 31, 2017 and 2016, there were no uncertain tax positions for which a reserve or liability is necessary.
At December 31, 2017, there were no undistributed earnings of foreign subsidiaries as Coherix Asia Pte. Ltd. and Coherix Europe GmbH had an accumulated deficit. Coherix Europe AB was dissolved in early 2017.
COHERIX, INC. AND SUBSIDIARIES
NOTES TO CONSOLIDATED FINANCIAL STATEMENTS
December 31, 2017 and 2016
NOTE 2 – SUMMARY OF SIGNIFICANT ACCOUNTING POLICIES(Continued)
Revenue Recognition
The Company recognizes product revenue when persuasive evidence of an arrangement exists, delivery has occurred, the fee is fixed or determinable, and collectability is probable. In instances where a product has to be completed based on customer specifications, revenue is deferred until tested and approved by the customer. Service and machine rental revenue is generally recognized once services are performed or based on the rental term. Cash payments received in advance for product sales are recorded as customer deposits. Cash payments received in advance for services or machine rental are recorded as deposits.
In the case of contracts with milestones, the Company has an accounting policy of recognizing revenue for contingent consideration earned from the achievement of a substantive milestone in its entirety in the period in which the substantive milestone is achieved. Substantive milestone payments are recognized upon achievement of the milestone only if all of the following conditions are met: the milestone payment relates solely to past performance, the milestone payments are non-refundable; achievement of the milestone involves a degree of risk and was not reasonably assured at the inception of the arrangement; substantive effort is involved in achieving the milestone; the amount of the milestone is reasonable in relation to the effort expended or the risk associated with achievement of the milestone; and a reasonable amount of time passes between the execution of the contract and the first milestone payment as well as between each subsequent milestone payment. If any of these conditions are not met, the milestone payments are deferred and recognized as revenue over the term of the arrangement as the performance obligations are completed.
The Company also has a revenue licensing agreement for usage of certain intellectual property. Licensing revenue from the usage of the intellectual property is recorded based on a third party’s use of the property, on a licensing fee per item sold basis.
Shipping and Handling
The Company classifies amounts billed to customers in sales transactions related to shipping and handling as revenue, and costs incurred by the Company for shipping and handling as cost of revenue.
Research and Development
Research and development costs are charged to expense as incurred and amounted to approximately $1,385,000 and $1,615,000 for the years ended December 31, 2017 and 2016, respectively.
COHERIX, INC. AND SUBSIDIARIES
NOTES TO CONSOLIDATED FINANCIAL STATEMENTS
December 31, 2017 and 2016
NOTE 2 – SUMMARY OF SIGNIFICANT ACCOUNTING POLICIES(Continued)
Share-Based Compensation
Share-based compensation represents the cost related to stock-based awards granted to employees or consultants. The Company measures share-based compensation based on the estimated fair value of the award on the grant date, which is recognized as expense on a straight-line basis over the requisite service period for awards that vest over time. The Company estimates the fair value of stock options using the Black-Scholes valuation model.
Foreign Currency Translation and Transactions
Coherix Asia Pte. Ltd., which is located and operates in Singapore, keeps its books and records in U.S. Dollars (“USD”) as its functional currency is the USD. Currency transaction gains or losses are generally derived from cash, receivables and payables that are stated in a currency other than USD, and are recognized as income or expense.
Coherix Europe AB, which was located and operated in Sweden, kept its books and records in Swedish Krona (“SEK”), and Coherix Europe GmbH, which is located and operates in Germany, keeps its books and records in the euro (“EUR”). The functional currency of Coherix Europe AB is the SEK, and Coherix Europe GmbH is the EUR, the currency of the primary economic environment in which the each respective subsidiary operates. Accordingly, Coherix Europe AB’s and Coherix Europe GmbH’s financial information is translated from SEK and EUR, into USD. Assets and liabilities of each of these two entities are translated into USD based on each prevailing exchange rate at each respective balance sheet date. Revenue and expenses are translated into USD based on the average exchange rate for the respective periods. Cumulative translation adjustments are included as a separate component of stockholders’ deficit in accumulated other comprehensive income (loss). Currency transaction gains or losses are generally derived from cash, receivables and payables that are stated in a currency other than the local currency, and are recognized as income or expense.
Foreign Operations
Operations outside the United States of America are subject to risks inherent in operating under different legal systems and various political and economic environments. Among the risks are changes in existing tax laws, possible limitations on foreign investment and income repatriation, government price or foreign exchange controls, and restrictions on currency exchange. The Company does not engage in hedging activities to mitigate its exposure to fluctuations in foreign currency exchange rates.
COHERIX, INC. AND SUBSIDIARIES
NOTES TO CONSOLIDATED FINANCIAL STATEMENTS
December 31, 2017 and 2016
NOTE 2 – SUMMARY OF SIGNIFICANT ACCOUNTING POLICIES(Continued)
Foreign Operations(Continued)
The consolidated financial statements include the operations of Coherix Asia Pte. Ltd., Coherix Europe AB, and Coherix Europe GmbH as described above in Note 2. Included in the consolidated statements of operations and comprehensive income (loss) is net sales of approximately $1,075,000 and $63,000, and a net loss of approximately $115,000 and $620,000, for the years ended December 31, 2017 and 2016, respectively, which related to these foreign subsidiaries. The consolidated balance sheet included total assets of approximately $256,000 and $131,000 at December 31, 2017 and 2016, respectively, which related to these foreign subsidiaries.
Comprehensive Income (Loss)
Comprehensive income (loss) is defined as net income (loss) and all non-ownership changes in stockholders’ deficit. For the Company, comprehensive income (loss) for the years ended December 31, 2017 and 2016 consists of net income (loss) and the foreign currency translation adjustment.
Computation of EPS
Basic and diluted earnings (loss) per share (“EPS”) are computed by dividing net income (loss) attributable to common stockholders by the weighted-average common shares outstanding in the period. Diluted EPS is computed by giving effect to all potentially dilutive securities that are outstanding, and excludes the effects of any potentially antidilutive securities. The number of shares related to options, warrants, and convertible debt included in diluted EPS is based on the treasury stock or if-converted methods, as applicable.
The Company has preferred shares that earn preferred dividends. In the determination of EPS, net income available to common stockholders has been reduced by the amount of preferred dividends.
Reclassifications
Certain 2016 amounts have been reclassified to conform to the presentation adopted in 2017. These reclassifications had no effect on net loss or stockholders’ deficit.
COHERIX, INC. AND SUBSIDIARIES
NOTES TO CONSOLIDATED FINANCIAL STATEMENTS
December 31, 2017 and 2016
NOTE 2 – SUMMARY OF SIGNIFICANT ACCOUNTING POLICIES(Continued)
Recently Adopted Accounting Pronouncements
In July 2015, the Financial Accounting Standards Board (“FASB”) issued Accounting Standards Update (“ASU”) 2015-11, “Simplifying the Measurement of Inventory,” (“ASU 2015-11”). ASU 2015-11 requires inventory be measured at the lower of cost or net realizable value and options that currently exist for market value be eliminated. ASU 2015-11 defines net realizable value as estimated selling prices in the ordinary course of business, less reasonably predictable costs of completion, disposal, and transportation. The Company adopted this guidance on January 1, 2017 on a prospective basis. The adoption of this guidance did not have a material impact on the consolidated financial statements.
In November 2015, the FASB issued ASU 2015-17, “Income Taxes (Topic 740), Balance Sheet Classification of Deferred Taxes” (“ASU 2015-17”), which requires companies to classify all deferred tax assets and liabilities as noncurrent on the balance sheet instead of separating deferred taxes into current and noncurrent amounts. This amendment was adopted on January 1, 2017 on a retrospective basis. The adoption of this guidance did not have a material impact on the consolidated financial statements.
In March 2016, the FASB issued ASU 2016-09, "Compensation - Stock Compensation (Topic 718): Improvements to Employee Share-Based Payment Accounting" ("ASU 2016-09"), which includes multiple amendments intended to simplify aspects of share-based payment accounting. Amendments to the timing of when excess tax benefits are recognized, minimum statutory withholding requirements, and forfeitures will be applied using a modified retrospective transition method through a cumulative-effect adjustment to equity as of the beginning of the period of adoption. Amendments to the presentation of employee taxes paid on the statement of cash flows when an employer withholds shares to meet the minimum statutory withholding requirement will be applied retrospectively, and amendments requiring the recognition of excess tax benefits and tax deficiencies in the income statement are to be applied prospectively. This ASU was adopted on January 1, 2017 and did not have a material impact on the Company’s consolidated financial statements.
Recent Accounting Pronouncements – Not Yet Adopted
The Company has elected to use the extended transition periods for private companies to comply with new or revised accounting standards.
In May 2014, the FASB issued ASU 2014-09, “Revenue from Contracts with Customers” (“ASU 2014-09”), which provides guidance for the recognition, measurement and disclosure of revenue resulting from contracts with customers and will supersede virtually all of the current revenue recognition guidance under U.S. GAAP. The FASB has also issued a number of updates to this standard. For the Company, this standard is effective for the fiscal and interim periods beginning after December 15, 2018. The Company is currently evaluating the impact that this standard will have on its consolidated financial statements.
COHERIX, INC. AND SUBSIDIARIES
NOTES TO CONSOLIDATED FINANCIAL STATEMENTS
December 31, 2017 and 2016
NOTE 2 – SUMMARY OF SIGNIFICANT ACCOUNTING POLICIES(Continued)
Recent Accounting Pronouncements – Not Yet Adopted(Continued)
In February 2016, the FASB issued ASU 2016-02, “Leases (Topic 842)” (“ASU 2016-02”)¸which requires that all leases be reflected on the balance sheet as assets and liabilities for the rights and obligations created by these leases. For the Company, ASU 2016-02 is effective for fiscal years and interim periods beginning after December 15, 2019. The Company is currently evaluating the impact that this standard will have on its consolidated financial statements.
In August 2016, the FASB issued ASU 2016-15, “Classification of Certain Cash Receipts and Cash Payments (Topic 230): Statement of Cash Flows” (“ASU 2016-15”), which clarifies how entities should classify certain cash receipts and cash payments on the statement of cash flows. ASU 2016-15 also clarifies how the predominance principle should be applied when cash receipts and cash payments have aspects of more than one class of cash flows. For the Company, ASU 2016-15 is effective for fiscal years and interim periods beginning after December 15, 2018. The Company is currently evaluating the impact that this standard will have on its consolidated financial statements.
In May 2017, the FASB issued ASU 2017-09, “Compensation – Stock Compensation (Topic 718), Scope of Modification Accounting” (“ASU 2017-09”) which clarifies when changes to the terms or conditions of a share-based payment award must be accounted for as modifications. The new guidance will reduce diversity in practice and result in fewer changes to the terms of an award being accounted for as modifications. ASU 2017-09 will be applied prospectively to awards modified on or after the adoption date. For the Company, the guidance is effective for annual periods, and interim periods within those annual periods beginning after December 15, 2017, with early adoption permitted. The Company is currently evaluating the impact that this standard will have on its consolidated financial statements.
COHERIX, INC. AND SUBSIDIARIES
NOTES TO CONSOLIDATED FINANCIAL STATEMENTS
December 31, 2017 and 2016
NOTE 3 – EARNINGS PER SHARE
The following table sets forth the computation of basic and diluted earnings per share and reflects the effects of the 4 for 1 split of common stock discussed above in Note 2:
| | | Years ended December 31, | |
| | | 2017 | | | 2016 | |
| | | | | | | |
| Basic earnings (loss) per share | | | | | | | | |
| Net income (loss) | | $ | 293,250 | | | $ | (2,658,370 | ) |
| Less: cumulative dividends on preferred stock | | | (193,414 | ) | | | (210,734 | ) |
| | | | | | | | | |
| Net income (loss) attributable to common stockholders | | $ | 99,836 | | | $ | (2,869,104 | ) |
| | | | | | | | | |
| Weighted-average common shares outstanding | | | 9,651,443 | | | | 9,200,441 | |
| | | | | | | | | |
| Basic earnings (loss) per share | | $ | 0.01 | | | $ | (0.31 | ) |
| | | | | | | | | |
| Diluted earnings (loss) per share | | | | | | | | |
| Net income (loss) attributable to common stockholders - diluted | | $ | 99,836 | | | $ | (2,869,104 | ) |
| | | | | | | | | |
| Weighted-average common shares outstanding - basic | | | 9,651,443 | | | | 9,200,441 | |
| Dilutive effect of stock options, warrants, and convertible debt | | | 1,705,815 | | | | – | |
| | | | | | | | | |
| Weighted-average common shares outstanding - diluted | | | 11,357,258 | | | | 9,200,441 | |
| | | | | | | | | |
| Diluted earnings (loss) per share | | $ | 0.01 | | | $ | (0.31 | ) |
There were 2,917,287 and 4,794,426 weighted-average shares of common stock equivalents related to stock options, warrants, convertible debt, and convertible preferred stock which are anti-dilutive and therefore are not included in the computation of the weighted-average number of diluted shares shown above for the years ended December 31, 2017 and 2016, respectively.
NOTE 4 - RESTRICTED CASH AND CASH EQUIVALENTS
Certain cash and cash equivalents are maintained in separate accounts and are restricted from use pursuant to the sale-leaseback agreements discussed in Note 18. The total restricted cash and cash equivalents at December 31, 2017 and 2016 was $-0- and $209,520, respectively.
COHERIX, INC. AND SUBSIDIARIES
NOTES TO CONSOLIDATED FINANCIAL STATEMENTS
December 31, 2017 and 2016
NOTE 5 – PROPERTY AND EQUIPMENT, NET
Property and equipment, net consist of the following:
| | | December 31, | |
| | | 2017 | | | 2016 | |
| | | | | | | |
| Machinery and equipment | | $ | 691,442 | | | $ | 691,442 | |
| Computer equipment | | | 212,535 | | | | 212,535 | |
| Office furniture and equipment | | | 152,929 | | | | 148,126 | |
| Leasehold improvements | | | 6,707 | | | | 6,707 | |
| | | | | | | | | |
| | | | 1,063,613 | | | | 1,058,810 | |
| | | | | | | | | |
| Less: accumulated depreciation and amortization | | | 970,006 | | | | 922,601 | |
| | | | | | | | | |
| Property and equipment, net | | $ | 93,607 | | | $ | 136,209 | |
Depreciation and amortization expense charged to operations for the years ended December 31, 2017 and 2016 was $46,920 and $53,330, respectively.
NOTE 6 – NOTES RECEIVABLE – RELATED PARTIES
At December 31, 2017 and 2016, the Company had 33 and 34 notes receivable from stockholders with balances totaling $936,413 and $956,413, respectively. As these notes are no longer interest bearing, there was no interest income related to these notes for the years ended December 31, 2017 and 2016. These notes can be extended at the Company’s option and are classified as long-term assets. The Company has the ability, and intends to, offset these notes receivable with deferred compensation liabilities owed to these related parties. At December 31, 2017 and 2016, accrued interest receivable related to these notes amounted to $295,072 and $299,124, respectively.
At December 31, 2017, the Company had 12 notes receivable from stockholders with balances totaling $203,940. These notes were entered into during 2017. One of these notes totaling $90,000 bears no interest, and 11 of these notes totaling $113,940 bear interest at 2.75%. These notes can be extended at the Company’s option and are classified as long-term assets. The Company has the ability, and intends to, offset these notes receivable with deferred compensation liabilities owed to these related parties. At December 31, 2017, accrued interest receivable related to these notes amounted to $731. Related party interest income from these notes amounted to $731 for the year ended December 31, 2017.
COHERIX, INC. AND SUBSIDIARIES
NOTES TO CONSOLIDATED FINANCIAL STATEMENTS
December 31, 2017 and 2016
NOTE 7 – INTANGIBLE ASSETS, NET
Through a 2004 acquisition, the Company acquired assets which included $183,720 of intangible assets. Below is a summary of intangible assets:
| | | December 31, | |
| | | 2017 | | | 2016 | |
| | | | | | | |
| Software | | $ | 169,588 | | | $ | 169,588 | |
| Patents | | | 14,132 | | | | 14,132 | |
| | | | | | | | | |
| | | | 183,720 | | | | 183,720 | |
| Less: accumulated amortization | | | 182,827 | | | | 181,852 | |
| | | | | | | | | |
| Intangible assets, net | | $ | 893 | | | $ | 1,868 | |
No significant residual value is estimated for these intangible assets. Amortization expense for each of the years ended December 31, 2017 and 2016 was $975. Total estimated amortization of these intangible assets is expected to be $893 during the year ending December 31, 2018.
NOTE 8 – LINES OF CREDIT
During the year ended December 31, 2016, the Company entered into a new credit agreement under which the Company may borrow up to $2,000,000. During the year ended December 31, 2017, the limit on this agreement was increased to $3,000,000. The Company may borrow on this line based on eligible accounts receivable, as defined in the credit agreement. The line is due on demand, with interest due monthly at prime plus 2% per annum (effective rate of 6.5% at December 31, 2017). The balance on the line was $1,519,997 and $673,736 at December 31, 2017 and 2016, respectively. Subsequent to December 31, 2017, the Company amended certain terms of this line, and the Company is now required to make monthly principal payments of $166,667 through April 2019. The Company is required to pay an annual fee of 1% of the maximum allowable borrowings, a monthly maintenance fee ranging from 0.45% to 0.65% of the average outstanding monthly balance, an additional monthly maintenance fee of 0.55% of the average outstanding monthly balance of advances made on foreign accounts receivable, and a 2% fee of the maximum allowable borrowings in the event that Company decides to exit the agreement prior to two years from the date of the agreement. The Company is required to pay interest and monthly maintenance fees on a $750,000 minimum outstanding balance. This line of credit is personally guaranteed by the chief executive officer of the Company, who is also a stockholder of the Company.
COHERIX, INC. AND SUBSIDIARIES
NOTES TO CONSOLIDATED FINANCIAL STATEMENTS
December 31, 2017 and 2016
NOTE 8 – LINES OF CREDIT(Continued)
The Company also had a line of credit under credit agreements with three stockholders of the Company. The outstanding balance of the line at December 31, 2017 and 2016 was $134,000 and $279,140, respectively.
Under this line of credit, draws can be made upon receipt of a purchase order from a customer or upon issuance of an invoice to a customer. The Company sends notice to each participant of its intent to borrow against each participant’s commitment to finance a particular purchase order or accounts receivable balance as defined in the credit agreement. Each participant confirms in writing its agreement to loan the amount set forth in the notice. Each participant can decline to loan the amount set forth in the notice. In the event of decline, the Company will immediately send notice to all participants that the participant has declined. The participants will then reach a mutual agreement to either have one or more of the other participants loan the declined amount, or move forward with the financing of the purchase order or accounts receivable balance without funding the declined amount.
Within 10 days of payment in full of the purchase order or accounts receivable balance by the customer, the Company must repay principal and interest related to that purchase order or accounts receivable balance. In the event a customer defaults on payment or a purchase order was cancelled, the Company must repay the participants within sixty days of default or cancellation.
The line bore interest at 10% through September 2016, at which point interest increased to 12.5%. As of December 31, 2017 and 2016, the Company had unutilized and available credit under this line of credit totaling $16,000 and $180,860, respectively. As of the date of this report, all commitments were beyond their initial twelve-month term and were eligible to be withdrawn by investors.
COHERIX, INC. AND SUBSIDIARIES
NOTES TO CONSOLIDATED FINANCIAL STATEMENTS
December 31, 2017 and 2016
NOTE 9 – LONG-TERM DEBT
At December 31, 2017 and 2016, long-term debt consists of the following:
| | | December 31, | |
| | | 2017 | | | 2016 | |
| Convertible notes payable with principal and interest ranging from 4% to 10% per annum due at maturity. These convertible notes are all past due. Approximately 28% of these convertible note balances are with related parties. | | $ | 1,497,087 | | | $ | 1,512,087 | |
| | | | | | | | | |
| Two convertible notes payable to a stockholder with principal and 2.2% interest due at maturity. These convertible notes were due in July 2020 and August 2020; however, the principal balances were converted to common stock during 2017. | | | – | | | | 4,000,000 | |
| | | | | | | | | |
| Note payable with principal payments of $200,000 plus 2.2% interest due quarterly starting December 31, 2015. The note is past due and an in default. | | | 1,973,627 | | | | 1,973,627 | |
| | | | | | | | | |
| Notes payable with principal balances due at maturity, and 16% interest due monthly. These notes were paid off during 2017. Approximately 74% of these note balances were with related parties. | | | – | | | | 190,000 | |
| | | | | | | | | |
| Notes payable with principal balances due at maturity, and 10% to 16% interest payable at various times, depending on each respective note. Subsequent to December 31, 2017, certain of these notes with balances totaling $593,889 were amended such that maturity dates range from 2018 to 2021. These notes are unsecured. 100% of these notes are with related parties. | | | 601,389 | | | | 575,000 | |
COHERIX, INC. AND SUBSIDIARIES
NOTES TO CONSOLIDATED FINANCIAL STATEMENTS
December 31, 2017 and 2016
NOTE 9 – LONG-TERM DEBT(Continued)
| | | December 31, | |
| | | 2017 | | | 2016 | |
| Notes payable with 4% interest due quarterly for the first two years, and principal and interest due quarterly during years three through seven. Maturity dates range from June 2020 to January 2024. These notes are unsecured. Approximately 24% and 20% of these note balances, respectively, are with related parties. | | | 827,706 | | | | 1,246,125 | |
| | | | | | | | | |
| Notes payable with the principal balances due at maturity, and 4% interest due quarterly. Maturity dates range from August 2018 to December 2020. These notes are unsecured. Approximately 20% of these note balances are with related parties. | | | 2,500,000 | | | | 2,500,000 | |
| | | | | | | | | |
| Notes payable with the principal balances due at maturity, and 8% interest due monthly. Subsequent to December 31, 2017, certain of these notes with balances totaling $2,365,000 were amended such that maturity dates range from 2018 to 2021. These notes are unsecured. Approximately 83% of these notes are with related parties. | | | 2,509,000 | | | | 2,509,000 | |
| | | | | | | | | |
| Notes payable with either principal payments due monthly and a balloon payment due at maturity or the entire principal balance due at maturity. Interest ranging from 13% to 16% is due monthly. Subsequent to December 31, 2017, these notes were amended such that maturity dates range from 2018 to 2021. These notes are unsecured. Approximately 86% and 87% of these note balances, respectively, are with related parties. | | | 971,575 | | | | 1,055,967 | |
| | | | | | | | | |
| Related party notes payable with the principal balance due at maturity, and 16% interest due monthly. Subsequent to December 31, 2017, these notes were amended such that maturity dates range from 2019 to 2021. These notes are unsecured. | | | 520,000 | | | | 110,000 | |
COHERIX, INC. AND SUBSIDIARIES
NOTES TO CONSOLIDATED FINANCIAL STATEMENTS
December 31, 2017 and 2016
NOTE 9 – LONG-TERM DEBT(Continued)
| | | | | | | |
| | | December 31, | |
| | | 2017 | | | 2016 | |
| Note payable with the principal balance due at maturity, and 10% interest due quarterly. The maturity date is September 2019. This note is collateralized by a licensing revenue contract. | | | 505,275 | | | | – | |
| | | | | | | | | |
| Other | | | – | | | | 9,491 | |
| | | | | | | | | |
| | | | 11,905,659 | | | | 15,681,297 | |
| Less: current portion of long-term debt | | | 5,192,588 | | | | 5,823,695 | |
| | | | | | | | | |
| | | $ | 6,713,071 | | | $ | 9,857,602 | |
During the year ended December 31, 2017, in light of the Company’s inability to meet its long-term debt obligations, new promissory notes were issued in lieu of term notes and convertible notes with principal balances totaling $206,389 and the related accrued interest of $14,602. During the year ended December 31, 2016, new promissory notes were issued in lieu of term notes and convertible notes with principal balances totaling $225,000 and the related accrued interest of $19,491. During the year ended December 31, 2016, the Company also entered into new agreements with the investors who held the various line of credit agreements discussed in Note 8. Under the new agreements entered into during the year ended December 31, 2016, outstanding line of credit balances to stockholders of $10,000 were converted into term notes, and term note balances of $200,000 were converted into line of credit balances to stockholders.
The Company also offered a program to those investors that converted their notes to equity in the past, but still had accrued interest balances. The Company offered these creditors the opportunity to receive royalty payments based on sales of certain products as defined in the investment offering as further discussed in Note 18, in exchange for forgiveness of accrued interest. During the year ended December 31, 2016, under this arrangement, investors agreed to forgive outstanding accrued interest related to debt totaling $9,068. There were no transactions under this arrangement during the year ended December 31, 2017. See Note 18 for further discussion.
COHERIX, INC. AND SUBSIDIARIES
NOTES TO CONSOLIDATED FINANCIAL STATEMENTS
December 31, 2017 and 2016
NOTE 9 – LONG-TERM DEBT(Continued)
Under the Predator royalty with stock investment program discussed in Note 18, the Company offered certain creditors the opportunity to convert certain debt instruments into shares of common stock. For each $15 investment, the creditor received four shares of common stock (adjusted for 4 for 1 stock split that occurred in 2017) and will be entitled to receive royalty payments based on sales of certain products as defined in the investment offering as further discussed in Note 18. During the year ended December 31, 2016, under this arrangement, a creditor with an outstanding line of credit principal balance totaling $100,000, converted its balance into 26,668 common shares. There were no transactions under this arrangement during the year ended December 31, 2017.
During the year ended December 31, 2017, creditors with convertible notes and accrued interest totaling $5,201,798 converted their notes and accrued interest into 1,399,008 common shares. During the year ended December 31, 2016, creditors with convertible notes and accrued interest totaling $74,145 converted their notes and accrued interest into 29,656 common shares. These conversions were not part of the Predator Programs.
No beneficial conversion feature discount was applied to the convertible notes payable as the conversion features had no intrinsic value at the date of each respective issuance or amendment to terms. Each creditor can convert the entire principal balance of its convertible note to shares of the Company’s common stock at conversion prices ranging from $2.50 to $6.25 (adjusted for 4 for 1 stock split that occurred in 2017) per common share. As of December 31, 2017, the conversion prices and the related note face amounts are as follows:
| | | | Face Amount | |
| Conversion Price at December 31, 2017 | | | of Notes | |
| | | | | |
| | 2.50 | | | $ | 322,289 | |
| | 4.55 | | | | 825,000 | |
| | 5.00 | | | | 50,000 | |
| | 6.25 | | | | 299,798 | |
| | | | | | | |
| | | | | $ | 1,497,087 | |
Two convertible notes that had their principal balance converted to common stock during the year ended December 31, 2017 also have a provision that allows the accrued interest to be converted at the same anti-dilutive rate as the principal balance. The anti-dilutive feature requires adjustment to the conversion price for any deemed issuance of common stock in accordance with the agreements. As of December 31, 2017, there was accrued interest related to these convertible notes totaling approximately $216,300 for which the conversion price was estimated to be approximately $3.44 (adjusted for 4 for 1 stock split that occurred in 2017).
COHERIX, INC. AND SUBSIDIARIES
NOTES TO CONSOLIDATED FINANCIAL STATEMENTS
December 31, 2017 and 2016
NOTE 9 – LONG-TERM DEBT(Continued)
See Note 20 for discussion of subsequent events. As of December 31, 2017, the maturities of long-term debt are as follows:
| Year ending December 31, | | | Amount | |
| | | | | |
| | 2018 | | | $ | 5,192,588 | |
| | 2019 | | | | 2,578,926 | |
| | 2020 | | | | 1,158,597 | |
| | 2021 | | | | 2,957,757 | |
| | 2022 | | | | 10,390 | |
| | Thereafter | | | | 7,401 | |
| | | | | | | |
| | | | | $ | 11,905,659 | |
NOTE 10 – DEFERRED COMPENSATION
Through a five-year deferred compensation plan, the Company offers qualified employees and consultants the opportunity to elect to defer all or a portion of compensation earned. Each participant may elect their respective deferral amount. The deferrals earned interest at 8% compounded annually through August 2015 and ceased accruing interest subsequent to that date. No new deferrals have been made under this five-year deferred compensation plan since 2011.
In 2016, the majority of all employees and consultants took short-term salary reductions which were treated as short-term deferred compensation, accruing interest at 2.75%.
At December 31, 2017 and 2016, deferred compensation totaled $2,920,546 and $2,972,088, respectively, of which $288,654 and $156,223 was accruing interest at 2.75%, respectively. As discussed above, certain deferrals were due five years after the original deferral was made, while others were due upon the Company meeting certain financial criteria as defined in the respective deferred compensation agreements. As of December 31, 2017, all deferred compensation was past due.
During the year ended December 31, 2017, deferred compensation of $39,674 was used to purchase common stock or exercise stock options for common stock.
COHERIX, INC. AND SUBSIDIARIES
NOTES TO CONSOLIDATED FINANCIAL STATEMENTS
December 31, 2017 and 2016
NOTE 11 – ACCRUED INTEREST
Under the terms of the Company’s lines of credit discussed in Note 8, long-term debt arrangements discussed in Note 9, and deferred compensation arrangements discussed in Note 10, the Company has short-term and long-term obligations to pay its accrued interest. The due dates of accrued interest as of December 31, 2017 are as follows:
| Year ending December 31, | | | Amount | |
| | | | | |
| | Past due or due in 2018 | | | $ | 6,709,459 | |
| | 2020 | | | | 216,263 | |
| | | | | | | |
| | | | | $ | 6,925,722 | |
At December 31, 2017, approximately $4,600,000 of accrued interest was frozen and was no longer accruing compounded interest, and approximately $2,200,000 of accrued interest was accruing compounded interest at rates ranging from 2.2%-10% as detailed in Note 9. The remaining accrued interest is being paid in accordance with payment terms as described in Note 9.
As of December 31, 2017 and 2016, accrued interest owed to related parties totaled approximately $5,500,000 and $6,200,000, respectively. Interest expense to related parties totaled approximately $745,000 and $765,000 for the years ended December 31, 2017 and 2016, respectively.
NOTE 12 – CHINESE INVESTMENTS
Chinese Joint Venture
As of December 31, 2017 and 2016, the Company held 49% ownership in a Chinese joint venture (the “Chinese Affiliate”). The Company accounts for this investment using the cost method as the Company does not have the ability to exercise significant influence over the Chinese Affiliate. On September 27, 2017, the Company sent a notice of termination of the joint venture contract, due to certain events of default by the 51% owner, as defined in the joint venture contract. Pursuant to the joint venture contract, the notice was effective October 1, 2017. The carrying value of the Company's investment was $-0- at December 31, 2017 and 2016 due to an other-than-temporary impairment prior to 2016.
Advance to Establish Chinese Subsidiary
During 2017, as a result of financial difficulties of the Chinese Affiliate’s other 51% owner, the Company began negotiations to restructure the joint venture and began the process of establishing a new Chinese entity (the “New Chinese Entity”) to increase resources focused on sales and customer support of the Company’s products in China.
COHERIX, INC. AND SUBSIDIARIES
NOTES TO CONSOLIDATED FINANCIAL STATEMENTS
December 31, 2017 and 2016
NOTE 12 – CHINESE INVESTMENTS(Continued)
At December 31, 2017, under direction of local counsel, the Company had made an advance totaling $505,275 to an agent of our local attorney with whom the Company has a long working relationship. This advance was used for the purpose of providing the paid-in-capital to organize the New Chinese Entity which incurred approximately $27,000 in administrative expenses during 2017.
At December 31, 2017, the New Chinese Entity was a variable interest entity. However, it was determined that the Company was not the primary beneficiary of the New Chinese Entity as the Company could not exercise effective control over the VIE at December 31, 2017. See Note 2 for further discussion regarding the VIE entity.
On March 20, 2018, ownership of the New Chinese Entity was transferred to the Company, at which point the Company began consolidating the New Chinese Entity in the Company’s financial statements.
NOTE 13 – INCOME TAXES
On December 22, 2017, the Tax Cuts and Jobs Act was signed into law. The principal element of the Tax Cuts and Jobs Act relevant to the Company’s consolidated financial statements is a reduction in the U.S. federal corporate tax rate from 34% to 21%, effective for the Company on January 1, 2018. Other provisions of the Tax Cuts and Jobs Act did not have a significant impact on the Company’s consolidated financial statements for the year ended December 31, 2017.
The provision for income taxes for the years ended December 31, 2017 and 2016 is summarized as follows:
| | | Years ended December 31, | |
| | | 2017 | | | 2016 | |
| Current provision (benefit): | | | | | | | | |
| U.S. federal | | $ | – | | | $ | – | |
| State | | | – | | | | – | |
| Foreign | | | – | | | | – | |
| | | | | | | | | |
| | | | – | | | | – | |
| | | | | | | | | |
| Deferred provision (benefit): | | | | | | | | |
| U.S. federal | | | 136,823 | | | | (494,072 | ) |
| State | | | 19,537 | | | | (122,299 | ) |
| Foreign | | | (85,899 | ) | | | 23,283 | |
| Impact of change in enacted tax rates | | | 5,038,727 | | | | – | |
| Change in valuation allowance | | | (5,109,188 | ) | | | 593,088 | |
| | | | | | | | | |
| | | | – | | | | – | |
| | | | | | | | | |
| Total provision for income taxes | | $ | – | | | $ | – | |
COHERIX, INC. AND SUBSIDIARIES
NOTES TO CONSOLIDATED FINANCIAL STATEMENTS
December 31, 2017 and 2016
NOTE 13 – INCOME TAXES(Continued)
The effective tax rate varies from the current U.S. federal statutory income tax rate as follows:
| | | Year ended December 31, | |
| | | 2017 | | | 2016 | |
| | | | | | | |
| Statutory rate | | | 34% | | | | 34% | |
| State and local taxes | | | 7% | | | | 5% | |
| Permanent differences | | | 2% | | | | -14% | |
| Tax credits | | | -28% | | | | 3% | |
| Foreign operations | | | 9% | | | | -6% | |
| Change in enacted tax rates | | | 1718% | | | | 0% | |
| Valuation allowance | | | -1742% | | | | -22% | |
| | | | | | | | | |
| | | | 0% | | | | 0% | |
The components of the Company's deferred income taxes are as follows:
| | | December 31, | |
| | | 2017 | | | 2016 | |
| Deferred income tax assets: | | | | | | | | |
| Net operating loss carryforwards | | $ | 7,383,229 | | | $ | 11,830,825 | |
| R & D credit carryforward | | | 2,075,076 | | | | 1,951,125 | |
| Capital loss carryforward | | | 67,030 | | | | – | |
| Accounts receivable | | | 13,970 | | | | 21,935 | |
| Inventories | | | 87,594 | | | | 142,553 | |
| Investments | | | 114,000 | | | | 179,000 | |
| Accounts payable and accrued liabilities | | | 650,170 | | | | 1,002,288 | |
| Deferred compensation | | | 665,884 | | | | 1,064,008 | |
| | | | | | | | | |
| Total deferred tax assets | | | 11,056,953 | | | | 16,191,734 | |
| | | | | | | | | |
| Deferred income tax liabilities: | | | | | | | | |
| Property, equipment, and intangible assets | | | 20,123 | | | | 45,716 | |
| | | | | | | | | |
| Net deferred tax asset | | | 11,036,830 | | | | 16,146,018 | |
| Valuation allowance | | | (11,036,830 | ) | | | (16,146,018 | ) |
| | | | | | | | | |
| Net of valuation allowance | | $ | – | | | $ | – | |
COHERIX, INC. AND SUBSIDIARIES
NOTES TO CONSOLIDATED FINANCIAL STATEMENTS
December 31, 2017 and 2016
NOTE 13 – INCOME TAXES(Continued)
Due to historical losses and based on management’s estimates of future income, management has recorded a full reserve against the net deferred tax asset as of December 31, 2017 and 2016.
At December 31, 2017, Coherix, Inc. has approximately $32 million of unused operating loss carryforwards in the U.S. that may be applied against future taxable income of Coherix, Inc. and expire beginning in 2026. Coherix, Inc. also has approximately $2.1 million of unused R & D credits that may be applied against future income tax of Coherix, Inc. and expire beginning in 2025. Also at December 31, 2017, Coherix Asia Pte. Ltd. and Coherix Europe AB, respectively, had approximately $1.6 million and $0.6 million of unused operating loss carryforwards that do not expire, and may be applied against future taxable income in each respective country.
Coherix, Inc. and its subsidiaries file income tax returns in the U.S. federal jurisdiction and various state and foreign jurisdictions. The Company is no longer subject to U.S. federal, state and local, or non-U.S. income tax examinations by tax authorities for years before fiscal year 2013.
NOTE 14 – SHARE-BASED COMPENSATION
The Company has a stock option plan (the “Plan”) under which officers, key employees, and non-employee directors may be granted options to purchase shares of common stock. As of December 31, 2017, the Company’s Board of Directors and shareholders had approved a pool of 5,100,000 options that could be issued under the plan. Options currently expire no later than 10 years from the grant date and generally vest within 1-4 years.
COHERIX, INC. AND SUBSIDIARIES
NOTES TO CONSOLIDATED FINANCIAL STATEMENTS
December 31, 2017 and 2016
NOTE 14 – SHARE-BASED COMPENSATION(Continued)
Additional information with respect to the Plan’s stock option activity is as follows:
| | | | | | | | | Weighted | |
| | | | | | Weighted | | | Average | |
| | | | | | Average | | | Remaining | |
| | | Number | | | Exercise | | | Contractual | |
| | | of Options | | | Price | | | Term in Years | |
| | | | | | | | | | |
| Outstanding at January 1, 2016 | | | 1,764,468 | | | $ | 0.25 | | | | | |
| Granted | | | 188,000 | | | $ | 0.25 | | | | | |
| Exercised | | | (105,100 | ) | | $ | 0.25 | | | | | |
| Cancelled | | | (188,692 | ) | | $ | 0.25 | | | | | |
| | | | | | | | | | | | | |
| Outstanding at December 31, 2016 | | | 1,658,676 | | | $ | 0.25 | | | | | |
| Granted | | | 492,000 | | | $ | 0.25 | | | | | |
| Exercised | | | (633,552 | ) | | $ | 0.25 | | | | | |
| Cancelled | | | (161,028 | ) | | $ | 0.25 | | | | | |
| | | | | | | | | | | | | |
| Outstanding at December 31, 2017 | | | 1,356,096 | | | $ | 0.25 | | | | 7.3 | |
| | | | | | | | | | | | | |
| Vested and expected to vest in | | | | | | | | | | | | |
| the future at December 31, 2017 | | | 1,356,096 | | | $ | 0.25 | | | | 7.3 | |
| | | | | | | | | | | | | |
| Options exercisable at | | | | | | | | | | | | |
| December 31, 2017 | | | 662,476 | | | $ | 0.25 | | | | 5.4 | |
At December 31, 2017, the intrinsic value of options vested and expected to vest totaled approximately $4,746,000, and the intrinsic value of options exercisable totaled approximately $2,319,000.
COHERIX, INC. AND SUBSIDIARIES
NOTES TO CONSOLIDATED FINANCIAL STATEMENTS
December 31, 2017 and 2016
NOTE 14 – SHARE-BASED COMPENSATION(Continued)
The Company recorded share-based compensation expense totaling $490,477 and $458,526 related to outstanding options for the years ended December 31, 2017 and 2016, respectively. At December 31, 2017, unrecognized compensation cost related to stock options totaled approximately $2,651,000, which is expected to be recognized over a weighted-average period of approximately 3.1 years.
During the years ended December 31, 2017 and 2016, options were exercised for $158,388 and $26,275, respectively. As of the exercise dates, there was an intrinsic value of these exercised options of approximately $2,217,000 and $368,000 for the years ended December 31, 2017 and 2016, respectively.
The weighted-average grant-date fair value of stock options granted during the years ended December 31, 2017 and 2016 was $3.55 and $3.54 per option (adjusted for 4 for 1 stock split that occurred in 2017), respectively. These amounts were determined using the Black-Scholes option pricing model, which values options based on the stock price at the grant date, expected term of the option, expected volatility of the stock, expected dividend payments, and risk-free interest rate over the expected term of the option. The Company accounts for any forfeitures of options when they occur. The assumptions used in the Black-Scholes model were as follows for the years ended December 31, 2017 and 2016 (adjusted for 4 for 1 stock split that occurred in 2017):
| Risk-free interest rate | | 1.8% - 2.4% |
| Expected volatility | | 30% |
| Expected dividend yield | | 0% |
| Expected term | | 10 years |
| Stock price | | $3.75 |
The Black-Scholes option valuation model was developed for estimating the fair value of traded options that have no vesting restrictions and are fully transferable. Because option valuation models require the use of subjective assumptions, changes in these assumptions can materially affect the fair value of the options. As the Company’s options do not have the characteristics of traded options, the option valuation models do not necessarily provide a reliable measure of the fair value of its options.
COHERIX, INC. AND SUBSIDIARIES
NOTES TO CONSOLIDATED FINANCIAL STATEMENTS
December 31, 2017 and 2016
NOTE 15 – WARRANTS
Warrants were issued to certain board members for their services to the Company and certain investors in conjunction with the Company’s debt. Additional information regarding warrants is as follows:
| | | | | | | | | | Weighted | |
| | | | | | | Weighted | | | Average | |
| | | | | | | Average | | | Remaining | |
| | | | Number | | | Exercise | | | Contractual | |
| | | | of Warrants | | | Price | | | Term in Years | |
| | | | | | | | | | | |
| | Outstanding at January 1, 2016 | | | | 705,496 | | | | 3.67 | | | | | |
| | Granted | | | | 344,148 | | | | 0.51 | | | | | |
| | Exercised | | | | – | | | | – | | | | | |
| | Cancelled | | | | (3,000 | ) | | | 2.50 | | | | | |
| | | | | | | | | | | | | | | |
| | Outstanding at December 31, 2016 | | | | 1,046,644 | | | | 2.63 | | | | | |
| | Granted | | | | 74,000 | | | | 0.25 | | | | | |
| | Exercised | | | | – | | | | – | | | | | |
| | Cancelled | | | | (62,204 | ) | | | 2.69 | | | | | |
| | | | | | | | | | | | | | | |
| | Outstanding at December 31, 2017 | | | | 1,058,440 | | | | 2.47 | | | | 4.0 | |
At December 31, 2017 and 2016, 693,440 and 735,644 of the outstanding warrants were exercisable, respectively, and the remaining warrants were restricted. As defined in the warrant agreements, these restricted warrants can only be exercised upon a change in control or liquidity event. The Company recorded share-based compensation expense totaling $-0- and $42,725 related to warrants for the years ended December 31, 2017 and 2016, respectively. At December 31, 2017, unrecognized compensation cost related to warrants totaled approximately $1,360,000, which all related to the restricted warrants and is expected to be recognized upon a change in control or liquidity event, as defined in the warrant agreement.
The weighted-average grant-date fair value of warrants granted during the years ended December 31, 2017 and 2016 was $3.55 and $3.33 per warrant (adjusted for 4 for 1 stock split that occurred in 2017), respectively. The assumptions used in the Black-Scholes model were as follows for the years ended December 31, 2017 and 2016 (adjusted for 4 for 1 stock split that occurred in 2017):
| Risk-free interest rate | | 0.5% - 2.2% |
| Expected volatility | | 30% |
| Expected dividend yield | | 0% |
| Expected term | | 1.5 - 10 years |
| Stock price | | $3.75 |
The warrant valuation models do not necessarily provide a reliable measure of the fair value of the Company’s warrants.
COHERIX, INC. AND SUBSIDIARIES
NOTES TO CONSOLIDATED FINANCIAL STATEMENTS
December 31, 2017 and 2016
NOTE 16 – CONVERTIBLE PREFERRED STOCK
The Company’s preferred stock has liquidation preference over the common stock. Each share of preferred stock can be converted into one share of common stock. These preferred shares automatically convert to common shares upon a qualifying initial public offering, as defined in the Company’s amended certificate of incorporation. The shares have a $10 per share liquidation value and accrue cumulative, non-compounding dividends at an annual rate of 8%. The Company has no obligation to pay these preferred dividends until declared by the Board of Directors.
At December 31, 2016, the Company had preferred stock dividends in arrears totaling $1,011,834. These preferred dividends are not recorded as a liability on the Company’s consolidated balance sheet until declared by the Board of Directors.
On November 30, 2017, the Board of Directors declared preferred dividends totaling $1,205,248 which represented the total accrued cumulative dividends on all preferred stock through that date. All preferred stockholders concurrently converted 370,988 preferred shares into 1,483,952 common shares. In conjunction with these transactions, certain preferred stockholders used preferred dividends payable totaling $340,600 to purchase 68,120 common shares.
At December 31, 2017, the Company had a balance of preferred dividends payable totaling $864,648 that is included in the consolidated balance sheet, and there were no preferred stock dividends in arrears that were not declared by the Board of Directors.
COHERIX, INC. AND SUBSIDIARIES
NOTES TO CONSOLIDATED FINANCIAL STATEMENTS
December 31, 2017 and 2016
NOTE 17 – EMPLOYEE RETIREMENT PLAN
The Company provides an employee 401(k) savings and retirement plan in which qualified employees may elect to defer a portion of their gross pay and contribute to the plan. Employer contributions are discretionary. There were no employer contributions made during the years ended December 31, 2017 and 2016.
NOTE 18 – COMMITMENTS AND CONTINGENCIES
Operating Lease Commitments
The Company leases certain office and warehouse space under non-cancelable operating leases. Total rent expense for years ended December 31, 2017 and 2016 was $336,016 and $358,713, respectively, of which approximately $198,000 each year was to stockholders. Future minimum payments required under the aforementioned non-cancelable operating leases as of December 31, 2017 are as follows:
| Year ending December 31, | | | Amount | |
| | | | | |
| | 2018 | | | $ | 247,017 | |
| | 2019 | | | | 103,434 | |
| | | | | | | |
| | | | | $ | 350,451 | |
Sale-Leaseback Transactions
At December 31, 2017 and 2016, the Company was party to various sale-leaseback arrangements. The leases were determined to be capital leases. These transactions were treated as financing transactions, with the related machines retained at their historical cost basis.
COHERIX, INC. AND SUBSIDIARIES
NOTES TO CONSOLIDATED FINANCIAL STATEMENTS
December 31, 2017 and 2016
NOTE 18 – COMMITMENTS AND CONTINGENCIES(Continued)
Sale-Leaseback Transactions(Continued)
The following is a schedule of future lease payments required under the capital leases as of December 31, 2017:
| Year ending December 31, | | Amount | |
| | | | |
| 2018 | | $ | 145,399 | |
| 2019 | | | 224,382 | |
| 2020 | | | 170,082 | |
| 2021 | | | 66,314 | |
| | | | | |
| Total minimum lease payments | | | 606,177 | |
| | | | | |
| Less – amount representing interest | | | 48,242 | |
| | | | | |
| Present value of minimum capital lease payments | | | 557,935 | |
| Less – current portion | | | 145,545 | |
| | | | | |
| Long-term obligation under capital leases | | $ | 412,390 | |
Under certain sale-leaseback transactions, the Company received restricted cash that was held in an escrow account. During the year ended December 31, 2016, $116,400 was released from escrow, leaving $209,520 still held in escrow at December 31, 2016. During the year ended December 31, 2017, the remaining $209,520 was released from escrow, and the Company received additional proceeds of $199,621 from new sale-leaseback transactions.
At December 31, 2017 and 2016, the cost of equipment held under capital leases totaled $257,311, and accumulated depreciation totaled $133,233 and $168,706, respectively.
Concentration, Credit, and Market Risks
Revenue from the Company’s largest customer accounted for approximately 38% and 42% of net revenue for the years ended December 31, 2017 and 2016, respectively. Approximately 23% and 28% of accounts receivable is related to this customer at December 31, 2017 and 2016, respectively. This revenue consists of royalties from a licensing agreement for usage of certain intellectual property. The rest of the Company’s revenue relates to sales of machines, parts, or related services.
The Company sells its products and services in domestic and international markets. Ongoing credit evaluations of its customers are performed and, generally, the Company does not require collateral. Losses have historically been insignificant.
For the years ended December 31, 2017 and 2016, approximately 65% and 62% of net revenue are from customers located in foreign countries in North America, Europe, and Asia.
COHERIX, INC. AND SUBSIDIARIES
NOTES TO CONSOLIDATED FINANCIAL STATEMENTS
December 31, 2017 and 2016
NOTE 18 – COMMITMENTS AND CONTINGENCIES(Continued)
Concentration, Credit, and Market Risks(Continued)
The Company from time to time may maintain cash balances with financial institutions in excess of insured limits. Management has deemed this as a normal business risk. Depository institutions are selected by management based on their review of the financial stability of the institutions.
Contingencies
From time to time, the Company could be involved in various litigation matters arising in the ordinary course of business. There are no matters, individually or in aggregate, that are currently material to the Company.
Predator Programs
Under the Predator Programs (the “Program”) discussed below, during the years ended December 31, 2017 and 2016, the Company incurred expense of $425,906 and $103,415 on Predator product sales of $3,153,404 and $685,690, respectively. As further described below, the Company will be required to pay royalties under the Program through 2026. The Program has been closed to new participants.
Predator Royalty With Stock Investment Program
Under the Program, investors agreed to pay cash to purchase common stock with a right to receive royalties under the Program. Under the Program, two $2,000,000 pools were established for certain investors who acquire common stock for cash or through conversion of debt. For 10 years, commencing on the date of the first shipment for the sale of a Predator unit, each $2,000,000 pool is entitled to receive 5% of the revenue from Predator product sales. The royalties are deposited into the royalty pool and are paid quarterly to investors based on each investor’s respective interest in each respective pool.
As of both December 31, 2017 and 2016, pool 1 was filled with $2,000,000 of common stock purchases, and pool 2 was filled with $332,871 of common stock purchases.
COHERIX, INC. AND SUBSIDIARIES
NOTES TO CONSOLIDATED FINANCIAL STATEMENTS
December 31, 2017 and 2016
NOTE 18 – COMMITMENTS AND CONTINGENCIES(Continued)
Predator Programs(Continued)
Predator Royalty Opportunity Pools
As discussed in Note 9, certain investors with accrued interest balances agreed to forfeit their right to payment for the opportunity to enter the Program. Under the Program, three pools of participating interests were created. Two $2,000,000 pools were established for investors and employees that agreed to forgive the accrued interest owed to them by the Company or forfeit a portion of salaries or consulting fees. Another $200,000 pool was established for employees that agreed to forfeit a portion of their salary. For 10 years, commencing on the date of the first shipment for the sale of a Predator unit, each $2,000,000 pool is entitled to receive 5% of the revenue from Predator product sales and the $200,000 pool is entitled to receive 0.5% of the revenue from Predator product sales. The royalties are deposited into the royalty pool and are paid quarterly to participants based on each participant’s respective interest in the respective pool.
As of both December 31, 2017 and 2016, pool 1 was filled with $2,000,000 of forgiven accrued interest, pool 2 was filled with $856,713 of forgiven accrued interest, forfeited salaries, and consulting fees, and pool 3 was filled with $199,517 of forfeited salaries.
Predator Team Member Pool
Also, under the Program, one pool was established for employees as a bonus. Under this pool, each employee is entitled to 2% of the pool royalties. For 10 years, commencing on the date of the first shipment for the sale of a Predator unit, the pool is entitled to receive 0.125% of the revenue from Predator product sales. The royalties are deposited into the royalty pool and are paid quarterly to employees at a rate of 2% per employee.
As of both December 31, 2017 and 2016, this pool was filled with 29 employees.
NOTE 19 – RELATED PARTY TRANSACTIONS
During the years ended December 31, 2017 and 2016, the Company had product revenue from a related party through common ownership of approximately $253,000 and $254,000, respectively. The Company also had product revenue from its Chinese Affiliate of approximately $486,000 and $396,000, and support fee revenue of approximately $56,000 and $203,000, respectively. Related to these transactions, the Company had net accounts receivable due from related parties totaling $362,450 and $275,304 at December 31, 2017 and 2016, respectively.
The Company had accounts payable due to employees and related parties through common ownership totaling $185,076 and $180,197 at December 31, 2017 and 2016, respectively.
COHERIX, INC. AND SUBSIDIARIES
NOTES TO CONSOLIDATED FINANCIAL STATEMENTS
December 31, 2017 and 2016
NOTE 19 – RELATED PARTY TRANSACTIONS(Continued)
In addition, as discussed in Note 6, at December 31, 2017 and 2016, the Company had notes receivable and accrued interest due from stockholders. As discussed in Note 8, the Company has a line of credit with certain stockholders. As discussed in Note 9, the Company has various notes payables and accrued interest due from stockholders.
NOTE 20 – SUBSEQUENT EVENTS
The Company has performed a review of events subsequent to December 31, 2017 through October 2, 2018, the date the consolidated financial statements were available to be issued. Any effect of subsequent events on these consolidated financial statements has been included as appropriate.
As discussed in Note 8, subsequent to December 31, 2017, the Company amended its $3,000,000 line of credit.
As discussed in Note 9, subsequent to December 31, 2017, the Company amended certain notes as such notes were coming due. The principal balances of these notes totaled approximately $4,000,000. Subsequent to December 31, 2017, the Company also borrowed an additional $470,000 under new notes payable and a new leasing arrangement. In conjunction with certain of these amendments and new financing instruments, the Company issued warrants to purchase 40,000 and 122,000 shares of common stock with an exercise price of $5.00 and $3.75 per share, respectively, and reissued or extended warrants to purchase 380,000 shares of common stock with an exercise price of $3.75 per share that were outstanding at December 31, 2017 and scheduled to expire in 2018. All of these warrants now expire in 2021.
Subsequent to December 31, 2017, notes payable with balances totaling $151,500 were used to exercise 40,400 warrants ($3.75 per share).
As of the date of this report, the Company is in the process of restructuring its outstanding debt and related accrued interest, and is in the process of attempting to raise $30 million in capital through a combination of a Regulation A+ offering and new senior long-term debt.