
Financial Results for the Quarter Ended January 31, 2012 1 Exhibit 99.2
F O R WAR D - L O O K I N G S TAT E M E N T S Today’s discussion may include “forward-looking statements” within the meaning of the Private Securities Litigation Reform Act of 1995. Such statements relate to future events and expectations and involve known and unknown risks and uncertainties. VeriFone’s actual results or actions may differ materially from those projected in the forward-looking statements. For a summary of the specific risk factors that could cause results to differ materially from those expressed in the forward-looking statements, please refer to VeriFone’s filings with the Securities and Exchange Commission, including its annual report on Form 10-K and quarterly reports on Form 10-Q. VeriFone is under no obligation to, and expressly disclaims any obligation to, update or alter its forward-looking statements, whether as a result of new information, future events, changes in assumptions or otherwise. 2
N O N - G A A P F I N AN C I A L M E AS U R E S With respect to any Non-GAAP financial measures presented in the information, reconciliations of Non-GAAP to GAAP financial measures may be found in VeriFone’s quarterly earnings release as filed with the Securities and Exchange Commission as well as the Appendix to these slides. Management uses Non-GAAP financial measures only in addition to and in conjunction with results presented in accordance with GAAP. Management believes that these Non-GAAP financial measures help it to evaluate VeriFone’s performance and to compare VeriFone’s current results with those for prior periods as well as with the results of peer companies. These Non-GAAP financial measures contain limitations and should be considered as a supplement to, and not as a substitute for, or superior to, disclosures made in accordance with GAAP. 3
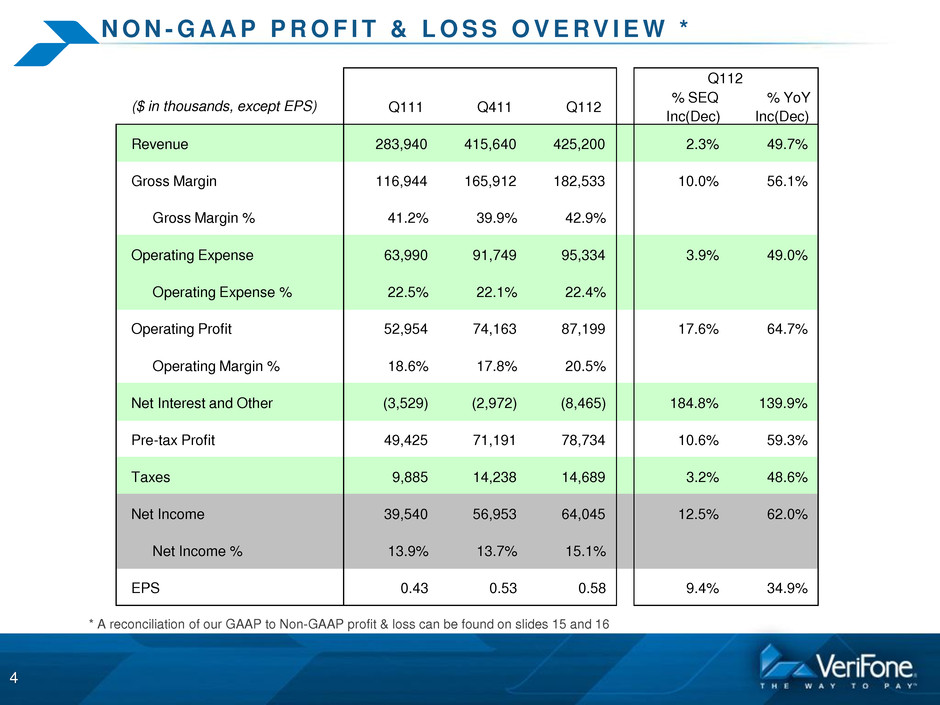
N O N - G A A P P R O F I T & L O S S O V E R V I E W * 4 * A reconciliation of our GAAP to Non-GAAP profit & loss can be found on slides 15 and 16 ($ in thousands, except EPS) Q111 Q411 Q112 % SEQ Inc(Dec) % YoY Inc(Dec) Revenue 283,940 415,640 425,200 2.3% 49.7% Gross Margin 116,944 165,912 182,533 10.0% 56.1% Gross Margin % 41.2% 39.9% 42.9% Operating Expense 63,990 91,749 95,334 3.9% 49.0% Operating Expense % 22.5% 22.1% 22.4% Operating Profit 52,954 74,163 87,199 17.6% 64.7% Operating Margin % 18.6% 17.8% 20.5% Net Interest and Other (3,529) (2,972) (8,465) 184.8% 139.9% Pre-tax Profit 49,425 71,191 78,734 10.6% 59.3% Taxes 9,885 14,238 14,689 3.2% 48.6% Net Income 39,540 56,953 64,045 12.5% 62.0% Net Income % 13.9% 13.7% 15.1% EPS 0.43 0.53 0.58 9.4% 34.9% Q112
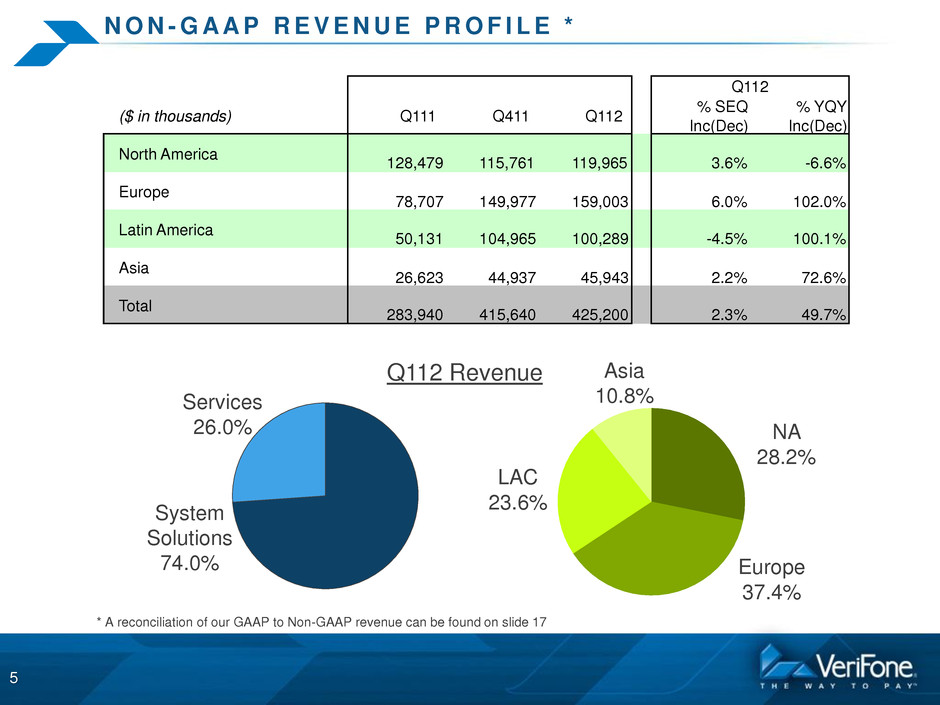
N O N - G A A P R E V E N U E P R O F I L E * Services 26.0% System Solutions 74.0% Q112 Revenue LAC 23.6% NA 28.2% Asia 10.8% Europe 37.4% 5 * A reconciliation of our GAAP to Non-GAAP revenue can be found on slide 17 ($ in thousands) Q111 Q411 Q112 % SEQ Inc(Dec) % YQY Inc(Dec) North America 128,479 115,761 119,965 3.6% -6.6% Europe 78,707 149,977 159,003 6.0% 102.0% Latin America 50,131 104,965 100,289 -4.5% 100.1% Asia 26,623 44,937 45,943 2.2% 72.6% Total 283,940 415,640 425,200 2.3% 49.7% Q112
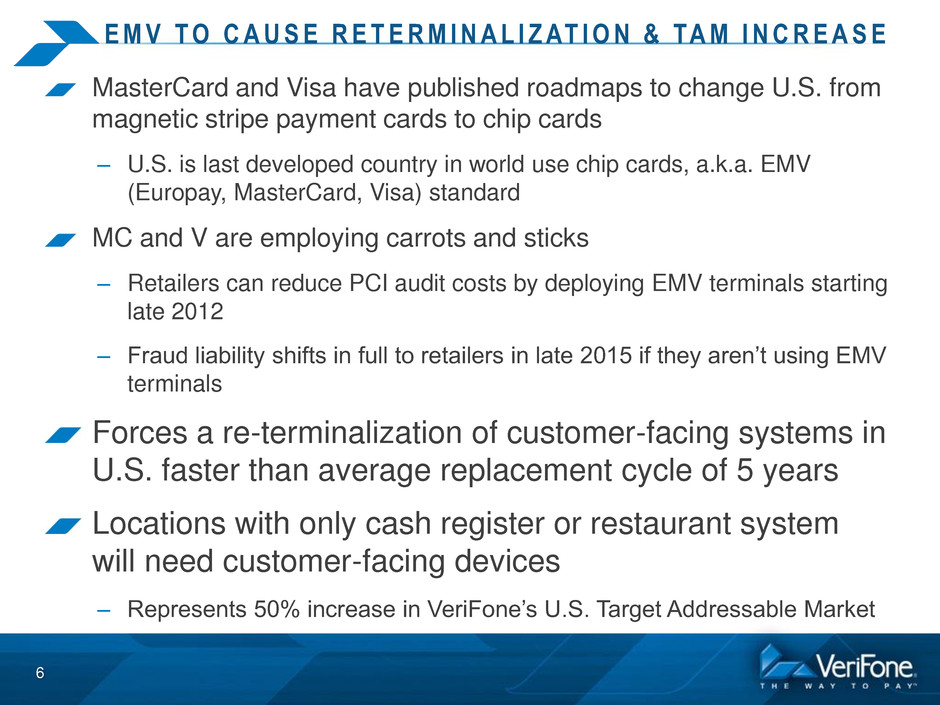
E M V T O C A U S E R E T E R M I N A L I Z AT I O N & TA M I N C R E A S E MasterCard and Visa have published roadmaps to change U.S. from magnetic stripe payment cards to chip cards – U.S. is last developed country in world use chip cards, a.k.a. EMV (Europay, MasterCard, Visa) standard MC and V are employing carrots and sticks – Retailers can reduce PCI audit costs by deploying EMV terminals starting late 2012 – Fraud liability shifts in full to retailers in late 2015 if they aren’t using EMV terminals Forces a re-terminalization of customer-facing systems in U.S. faster than average replacement cycle of 5 years Locations with only cash register or restaurant system will need customer-facing devices – Represents 50% increase in VeriFone’s U.S. Target Addressable Market 6

S O F T WA R E AT P O S : M O B I L E R E TA I L A N D G L O B A L B AY 7 “Mobile Retailing” spreading as merchants seek to interact with customers away from check-out to deliver personalized and interactive service, up-sell and cross-sell, close the sale, and take payment – “Clienteling”: Combining on-line capabilities with in-person interaction that online retailers cannot deliver – Mobile POS is ½-1/3 cost of traditional ECR POS system for merchant On Nov. 21, 2011, VeriFone acquired GlobalBay Mobile Technologies, a top provider of mobile retail software applications Complements VeriFone’s PAYware Mobile Enterprise (PwME) device that fits around iPad, iPhone, etc. and securely takes Credit, Debit, PIN Entry, NFC, and has barcode scanner VeriFone will sell GlobalBay apps as annual subscription or license with annual maintenance, with PwME or separately

FINANCIAL RESULTS AND GUIDANCE 8
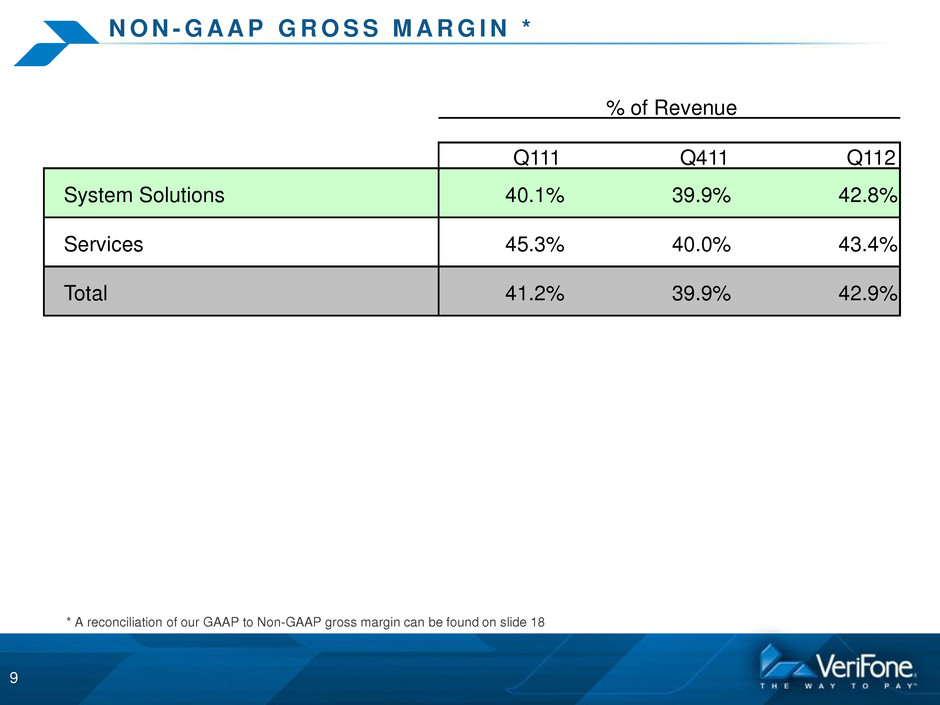
N O N - G A A P G R O S S M A R G I N * 9 * A reconciliation of our GAAP to Non-GAAP gross margin can be found on slide 18 Q111 Q411 Q112 System Solutions 40.1% 39.9% 42.8% Services 45.3% 40.0% 43.4% Total 41.2% 39.9% 42.9% % of Revenue
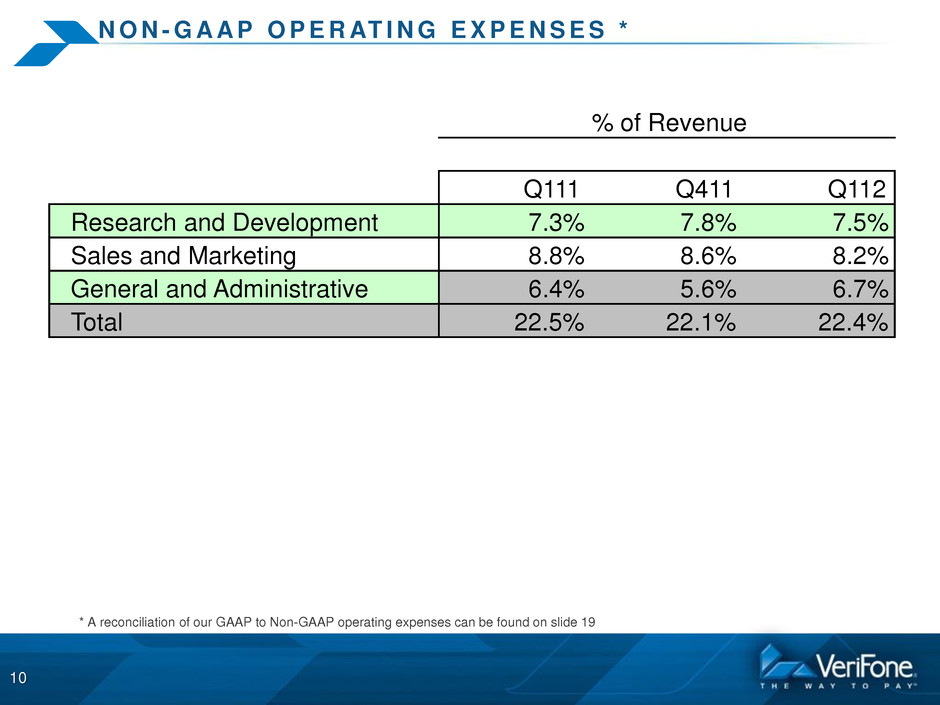
N O N - G A A P O P E R AT I N G E X P E N S E S * 10 * A reconciliation of our GAAP to Non-GAAP operating expenses can be found on slide 19 Q111 Q411 Q112 Research and Development 7.3% 7.8% 7.5% Sales and Marketing 8.8% 8.6% 8.2% General and Administrative 6.4% 5.6% 6.7% Total 22.5% 22.1% 22.4% % of Revenue

C AS H F L O W AN D B AL A N C E S H E E T 11 ($ in thousands, except Days) $ $ $ Cash Flow from Operations before Changes in Working Capital 50,800 2,416 35,722 Cash Flow from Operations 30,409 52,919 32,168 Key Balance Sheet Items: Cash 479,167 594,562 379,979 Accounts Receivables, net 164,830 54 294,440 68 302,559 67 Accounts Receivables Reserves (5,771) (5,658) (5,613) Inventories, net 112,084 60 144,316 53 171,414 58 Inventories Reserves (27,294) (51,225) (56,296) Accounts Payable 77,596 42 144,278 52 152,279 56 Deferred Revenue, net 78,494 100,291 130,893 Note: Accounts Receivable Days Sales Outstanding is calculated based on Non-GAAP Revenue and Gross Accounts Receivable Net of Reserve for Product Returns. Days in Inventory is calculated as Average Net Inventory divided by Total Non-GAAP Cost of Goods Sold. Days in Accounts Payable is calculated as Accounts Payable divided by Total Non-GAAP Cost of Goods Sold. Q111 Days Q112 Days Q411 Days
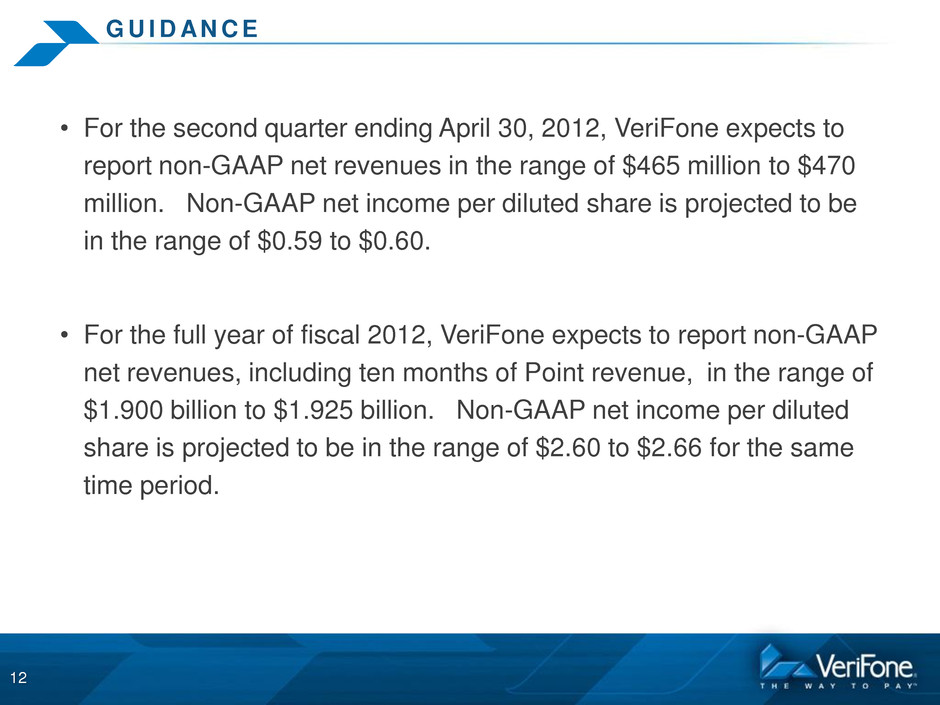
G U I D AN C E • For the second quarter ending April 30, 2012, VeriFone expects to report non-GAAP net revenues in the range of $465 million to $470 million. Non-GAAP net income per diluted share is projected to be in the range of $0.59 to $0.60. • For the full year of fiscal 2012, VeriFone expects to report non-GAAP net revenues, including ten months of Point revenue, in the range of $1.900 billion to $1.925 billion. Non-GAAP net income per diluted share is projected to be in the range of $2.60 to $2.66 for the same time period. 12

Q & A SESSION 13

APPENDIX 14
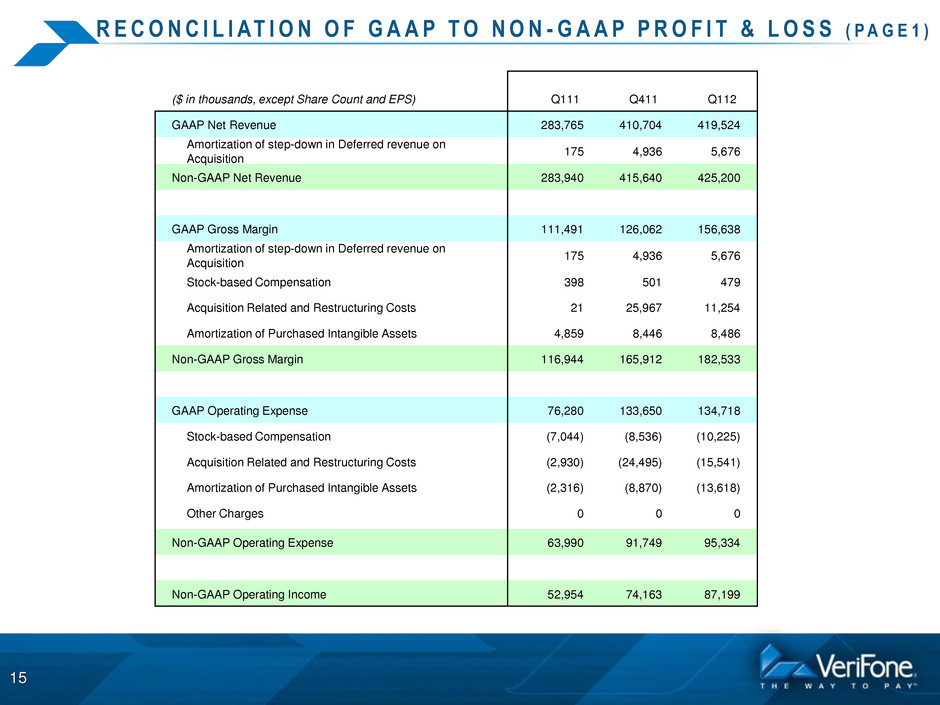
R E C O N C I L I AT I O N O F G A A P T O N O N - G A A P P R O F I T & L O S S ( P A G E 1 ) 15 ($ in thousands, except Share Count and EPS) Q111 Q411 Q112 GAAP Net Revenue 283,765 410,704 419,524 Amortization of step-down in Deferred revenue on Acquisition 175 4,936 5,676 Non-GAAP Net Revenue 283,940 415,640 425,200 GAAP Gross Margin 111,491 126,062 156,638 Amortization of step-down in Deferred revenue on Acquisition 175 4,936 5,676 Stock-based Compensation 398 501 479 Acquisition Related and Restructuring Costs 21 25,967 11,254 Amortization of Purchased Intangible Assets 4,859 8,446 8,486 Non-GAAP Gross Margin 116,944 165,912 182,533 GAAP Operating Expense 76,280 133,650 134,718 Stock-based Compensation (7,044) (8,536) (10,225) Acquisition Related and Restructuring Costs (2,930) (24,495) (15,541) Amortization of Purchased Intangible Assets (2,316) (8,870) (13,618) Other Charges 0 0 0 Non-GAAP Operating Expense 63,990 91,749 95,334 Non-GAAP Operating Income 52,954 74,163 87,199
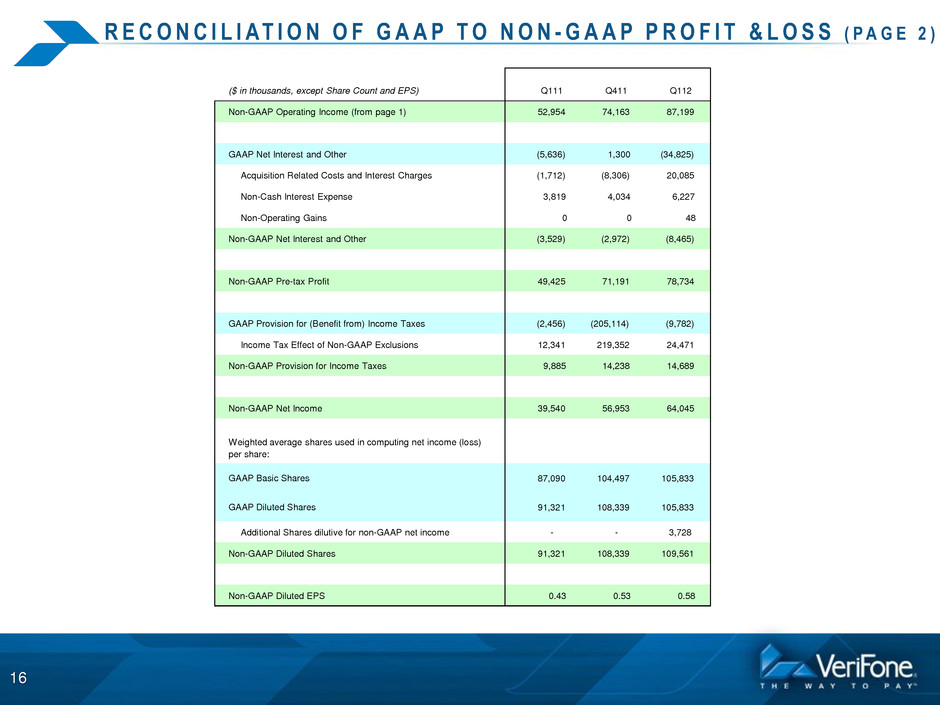
R E C O N C I L I AT I O N O F G A A P T O N O N - G A A P P R O F I T & L O S S ( P A G E 2 ) 16 ($ in thousands, except Share Count and EPS) Q111 Q411 Q112 Non-GAAP Operating Income (from page 1) 52,954 74,163 87,199 GAAP Net Interest and Other (5,636) 1,300 (34,825) Acquisition Related Costs and Interest Charges (1,712) (8,306) 20,085 Non-Cash Interest Expense 3,819 4,034 6,227 Non-Operating Gains 0 0 48 Non-GAAP Net Interest and Other (3,529) (2,972) (8,465) Non-GAAP Pre-tax Profit 49,425 71,191 78,734 GAAP Provision for (Benefit from) Income Taxes (2,456) (205,114) (9,782) Income Tax Effect of Non-GAAP Exclusions 12,341 219,352 24,471 Non-GAAP Provision for Income Taxes 9,885 14,238 14,689 Non-GAAP Net Income 39,540 56,953 64,045 87,090 104,497 105,833 91,321 108,339 105,833 Additional Shares dilutive for non-GAAP net income - - 3,728 Non-GAAP Diluted Shares 91,321 108,339 109,561 Non-GAAP Diluted EPS 0.43 0.53 0.58 GAAP Basic Shares Weighted average shares used in computing net income (loss) per share: GAAP Diluted Shares
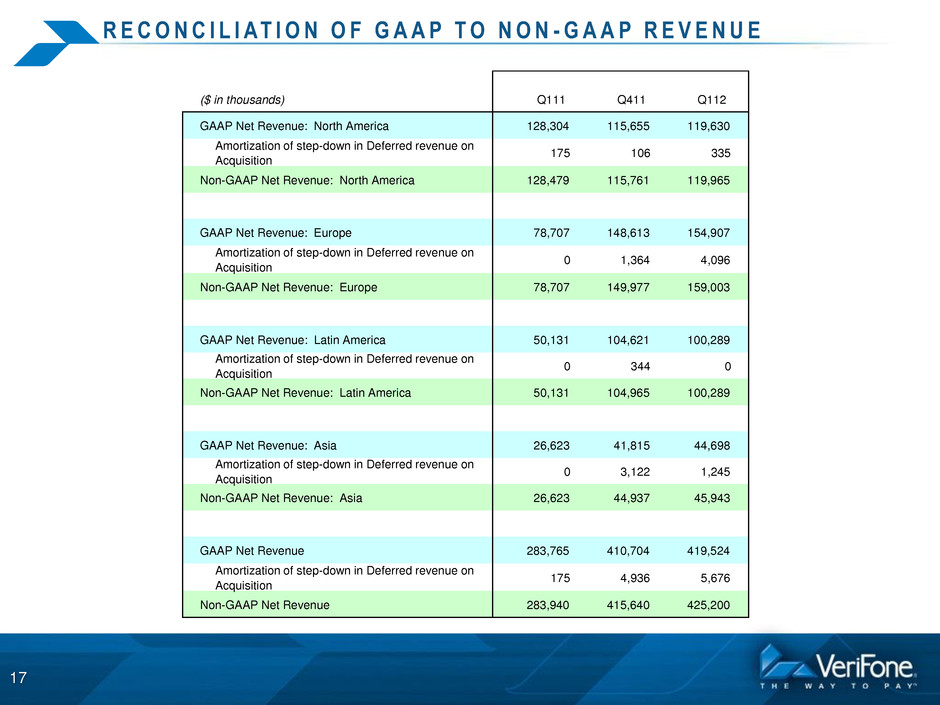
R E C O N C I L I AT I O N O F G A A P T O N O N - G A A P R E V E N U E 17 ($ in thousands) Q111 Q411 Q112 GAAP Net Revenue: North America 128,304 115,655 119,630 Amortization of step-down in Deferred revenue on Acquisition 175 106 335 Non-GAAP Net Revenue: North America 128,479 115,761 119,965 GAAP Net Revenue: Europe 78,707 148,613 154,907 Amortization of step-down in Deferred revenue on Acquisition 0 1,364 4,096 Non-GAAP Net Revenue: Europe 78,707 149,977 159,003 GAAP Net Revenue: Latin America 50,131 104,621 100,289 Amortization of step-down in Deferred revenue on Acquisition 0 344 0 Non-GAAP Net Revenue: Latin America 50,131 104,965 100,289 GAAP Net Revenue: Asia 26,623 41,815 44,698 Amortization of step-down in Deferred revenue on Acquisition 0 3,122 1,245 Non-GAAP Net Revenue: Asia 26,623 44,937 45,943 GAAP Net Revenue 283,765 410,704 419,524 Amortization of step-down in Deferred revenue on Acquisition 175 4,936 5,676 Non-GAAP Net Revenue 283,940 415,640 425,200
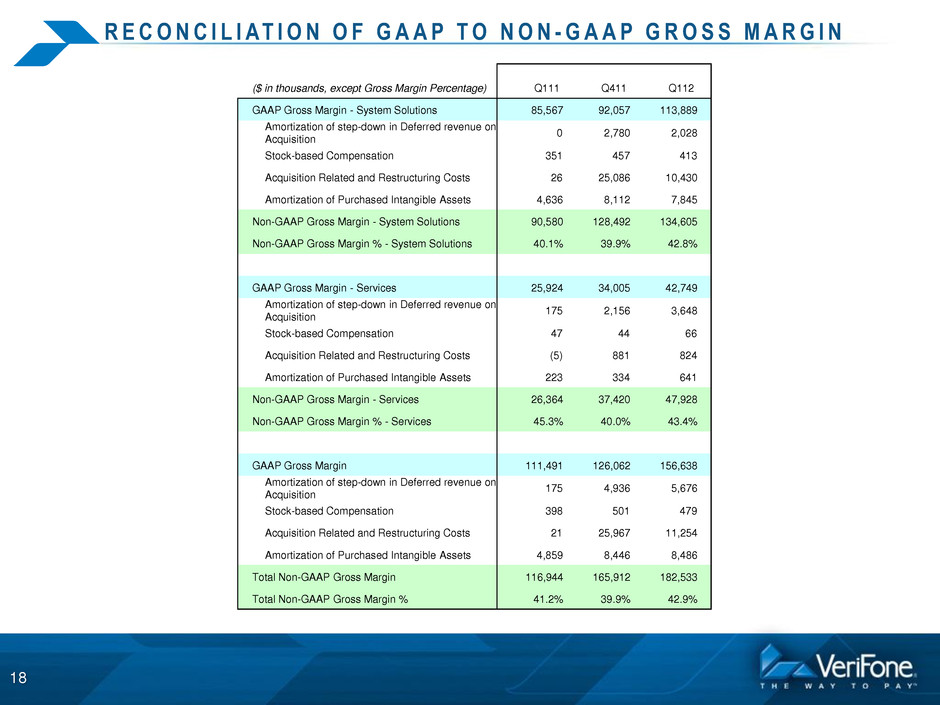
R E C O N C I L I AT I O N O F G A A P T O N O N - G A A P G R O S S M A R G I N 18 ($ in thousands, except Gross Margin Percentage) Q111 Q411 Q112 GAAP Gross Margin - System Solutions 85,567 92,057 113,889 Amortization of step-down in Deferred revenue on Acquisition 0 2,780 2,028 Stock-based Compensation 351 457 413 Acquisition Related and Restructuring Costs 26 25,086 10,430 Amortization of Purchased Intangible Assets 4,636 8,112 7,845 Non-GAAP Gross Margin - System Solutions 90,580 128,492 134,605 Non-GAAP Gross Margin % - System Solutions 40.1% 39.9% 42.8% GAAP Gross Margin - Services 25,924 34,005 42,749 Amortization of step-down in Deferred revenue on Acquisition 175 2,156 3,648 Stock-based Compensation 47 44 66 Acquisition Related and Restructuring Costs (5) 881 824 Amortization of Purchased Intangible Assets 223 334 641 Non-GAAP Gross Margin - Services 26,364 37,420 47,928 Non-GAAP Gross Margin % - Services 45.3% 40.0% 43.4% GAAP Gross Margin 111,491 126,062 156,638 Amortization of step-down in Deferred revenue on Acquisition 175 4,936 5,676 Stock-based Compensation 398 501 479 Acquisition Related and Restructuring Costs 21 25,967 11,254 Amortization of Purchased Intangible Assets 4,859 8,446 8,486 Total Non-GAAP Gross Margin 116,944 165,912 182,533 Total Non-GAAP Gross Margin % 41.2% 39.9% 42.9%
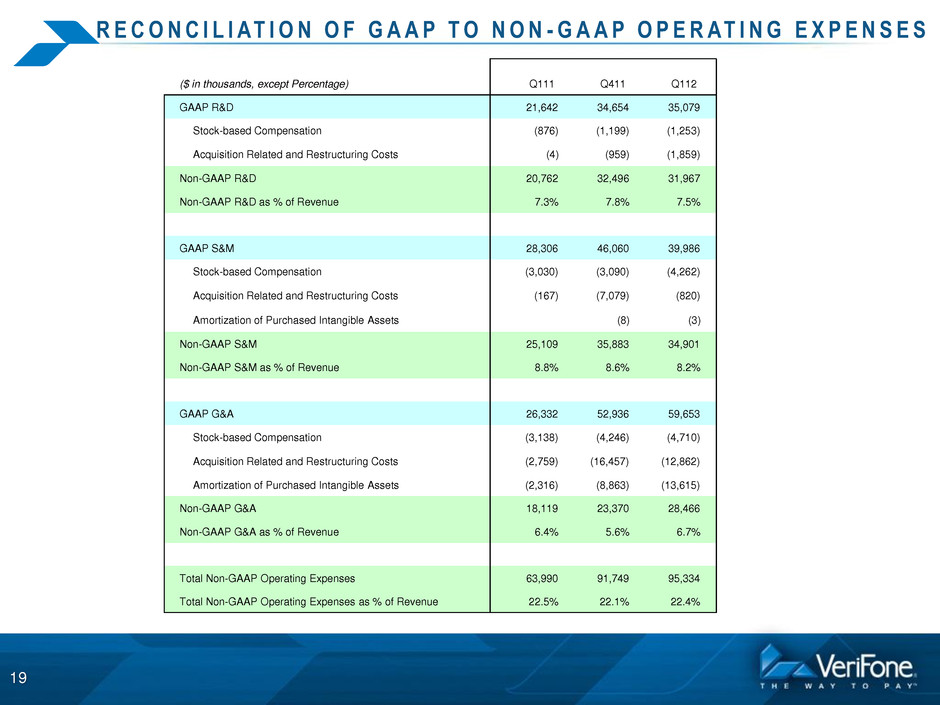
R E C O N C I L I AT I O N O F G A A P T O N O N - G A A P O P E R AT I N G E X P E N S E S 19 ($ in thousands, except Percentage) Q111 Q411 Q112 GAAP R&D 21,642 34,654 35,079 Stock-based Compensation (876) (1,199) (1,253) Acquisition Related and Restructuring Costs (4) (959) (1,859) Non-GAAP R&D 20,762 32,496 31,967 Non-GAAP R&D as % of Revenue 7.3% 7.8% 7.5% GAAP S&M 28,306 46,060 39,986 Stock-based Compensation (3,030) (3,090) (4,262) Acquisition Related and Restructuring Costs (167) (7,079) (820) Amortization of Purchased Intangible Assets (8) (3) Non-GAAP S&M 25,109 35,883 34,901 Non-GAAP S&M as % of Revenue 8.8% 8.6% 8.2% GAAP G&A 26,332 52,936 59,653 Stock-based Compensation (3,138) (4,246) (4,710) Acquisition Related and Restructuring Costs (2,759) (16,457) (12,862) Amortization of Purchased Intangible Assets (2,316) (8,863) (13,615) Non-GAAP G&A 18,119 23,370 28,466 Non-GAAP G&A as % of Revenue 6.4% 5.6% 6.7% Total Non-GAAP Operating Expenses 63,990 91,749 95,334 Total Non-GAAP Operating Expenses as % of Revenue 22.5% 22.1% 22.4%

Financial Results for the Quarter Ended January 31, 2012 20


