
Financial Results for the Quarter Ended July 31, 2012 1

F O R WAR D - L O O K I N G S TAT E M E N T S Today’s discussion may include “forward-looking statements” within the meaning of the Private Securities Litigation Reform Act of 1995. Such statements relate to future events and expectations and involve known and unknown risks and uncertainties. VeriFone’s actual results or actions may differ materially from those projected in the forward-looking statements. For a summary of the specific risk factors that could cause results to differ materially from those expressed in the forward-looking statements, please refer to VeriFone’s filings with the Securities and Exchange Commission, including its annual report on Form 10-K and quarterly reports on Form 10-Q. VeriFone is under no obligation to, and expressly disclaims any obligation to, update or alter its forward-looking statements, whether as a result of new information, future events, changes in assumptions or otherwise. 2
N O N - G A A P F I N AN C I A L M E AS U R E S With respect to any Non-GAAP financial measures presented in the information, reconciliations of Non-GAAP to GAAP financial measures may be found in VeriFone’s quarterly earnings release as filed with the Securities and Exchange Commission as well as the Appendix to these slides. Management uses Non-GAAP financial measures only in addition to and in conjunction with results presented in accordance with GAAP. Management believes that these Non-GAAP financial measures help it to evaluate VeriFone’s performance and to compare VeriFone’s current results with those for prior periods as well as with the results of peer companies. These Non-GAAP financial measures contain limitations and should be considered as a supplement to, and not as a substitute for, or superior to, disclosures made in accordance with GAAP. 3

N O N - G A A P P R O F I T & L O S S O V E R V I E W * 4 * A reconciliation of our GAAP to Non-GAAP profit & loss can be found on slides 26 and 27 ($ in thousands, except EPS) Q311 Q212 Q312 % SEQ Inc(Dec) Revenue 317,155 479,364 493,219 2.9% 55.5% Gross Margin 135,037 214,018 224,001 4.7% 65.9% % of Revenue 42.6% 44.6% 45.4% Operating Expense 74,321 111,868 111,718 -0.1% 50.3% % of Revenue 23.4% 23.3% 22.7% Operating Income 60,716 102,150 112,283 9.9% 84.9% % of Revenue 19.1% 21.3% 22.8% Net Interest and Other (3,139) (15,030) (15,523) 3.3% 394.5% Income before Income Taxes 57,577 87,120 96,760 11.1% 68.1% Taxes 11,515 15,683 13,546 -13.6% 17.6% Consolidated Net Income Attributable to VF Stockholders 46,062 71,437 83,214 16.5% 80.7% % of Revenue 14.5% 14.9% 16.9% EPS 0.49 0.64 0.75 17.2% 53.1% Q312 % YoY Inc(Dec)

N O N - G A A P R E V E N U E P R O F I L E * 5 * A reconciliation of GAAP to Non-GAAP revenue can be found on slide 28 ** A bridge of Organic Non-GAAP revenue and Constant Currency Non-GAAP revenue can be found on slides 17, 31 and 32 ($ in thousands) Q311 Q212 Q312 % SEQ Inc(Dec) % YoY Inc(Dec) Organic YoY Growth Organic YoY Constant Currency Growth North America 121,836 129,205 138,433 7.1% 13.6% 8.7% 8.9% International: Europe, Middle East, and Africa 97,206 205,073 203,413 -0.8% 109.3% 16.4% 24.1% Latin America 64,961 96,205 94,378 -1.9% 45.3% 30.0% 39.9% Asia 33,152 48,881 56,995 16.6% 71.9% 13.2% 15.9% International 195,319 350,159 354,786 1.3% 81.6% 20.5% 28.1% Total 317,155 479,364 493,219 2.9% 55.5% 15.9% 20.5% Q312 Q312 **
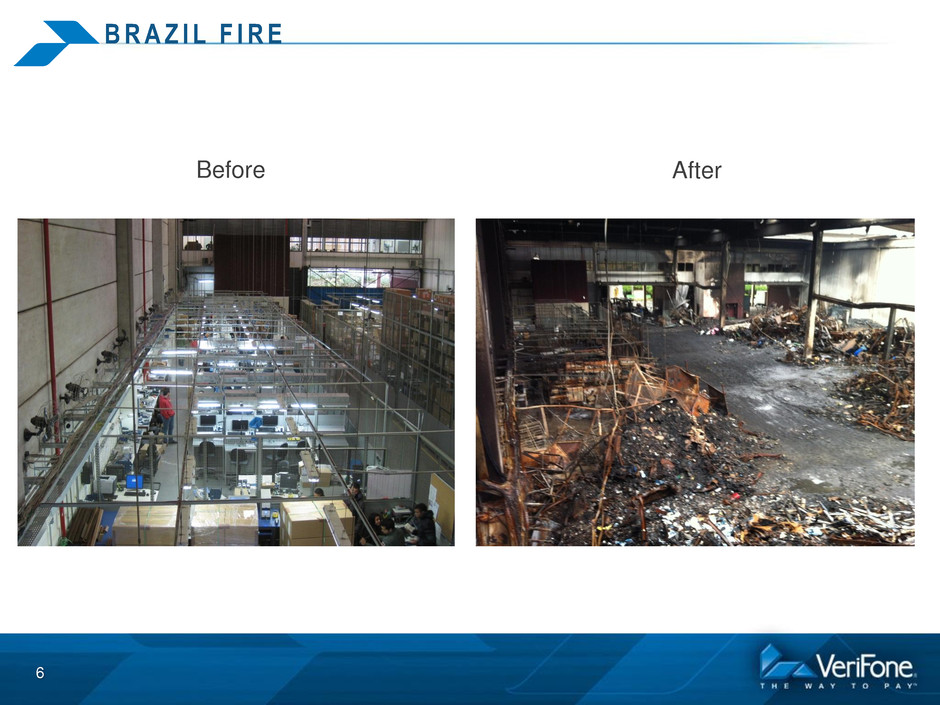
B R A Z I L F I R E 6 Before After

N O N - G A A P R E V E N U E P R O F I L E * 7 ($ in thousands) Q311 Q212 Q312 % SEQ Inc(Dec) % YoY Inc(Dec) Organic YoY Growth Organic YoY Constant Currency Growth North America 121,836 129,205 138,433 7.1% 13.6% 8.7% 8.9% International: Europe, Middle East, and Africa 97,206 205,073 203,413 -0.8% 109.3% 16.4% 24.1% Latin America 64,961 96,205 94,378 -1.9% 45.3% 30.0% 39.9% Asia 33,152 48,881 56,995 16.6% 71.9% 13.2% 15.9% International 195,319 350,159 354,786 1.3% 81.6% 20.5% 28.1% Total 317,155 479,364 493,219 2.9% 55.5% 15.9% 20.5% Q312 Q312 ** * A reconciliation of GAAP to Non-GAAP revenue can be found on slide 28 ** A bridge of Organic Non-GAAP revenue and Constant Currency Non-GAAP revenue can be found on slides 17, 31 and 32
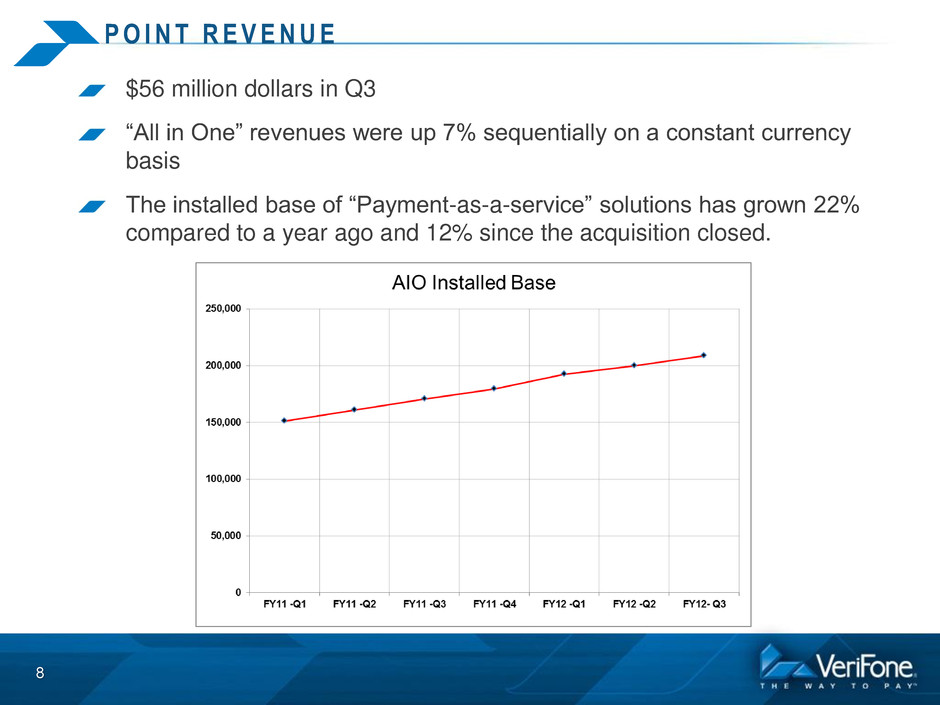
P O I N T R E V E N U E $56 million dollars in Q3 “All in One” revenues were up 7% sequentially on a constant currency basis The installed base of “Payment-as-a-service” solutions has grown 22% compared to a year ago and 12% since the acquisition closed. 8

L O N D O N B L A C K C A B S Over 10,700 cabs signed to multi-year contracts Over 6,000 cabs installed now Over 10,000 cabs installed by calendar year end 9
A S I A Q3 Revenues up 72% from a year ago 13% organic growth 16% constant currency growth Strength in China, Greater Asia, and Australia 10

N O R T H A M E R I C A Sales up 14% from a year ago, 7% sequentially Great Wins in: – MultiLane Retail: Verizon Wireless, Century 21, Sport Chalet, North Face and Game Stop – PayPal e-wallet software solution: PayPal purchased over 15,000 VeriFone e-wallet licenses – Transportation: Staten Island and Bronx New York Metropolitan Transportation Authority contracts – Hospitality: Choice Hotels International – Payment-as-a-service: L’Oreal, Sizzler Steakhouse, Little Caesars Pizza, and Overland Rentals Petroleum: – Topaz & Sapphire sales strong 11
S M A L L B U S I N E S S S E C T O R Sales to small business sector revenue up 17% sequentially Sell-in now rebounding to sell-through levels 12
TA X I B U S I N E S S Won Washington DC’s competition for all of their 6,500 cabs – Five-year contract worth from $35M to $45M Taxi advertising business: Increased year over year digital revenues by 37% in New York and 110% in other markets. 13
V E R I S H I E L D P R O T E C T 14 The de facto standard for security – Record merchant additions in Q3 – Total national merchants now at 105 – 9 of the top 11 payment processors supporting our technology solution
15 V E R I F O N E A S S W I T Z E R L A N D Offers new payment entrants access to our worldwide 20 million merchant lanes – Google – PayPal – Groupon – Isis – Visa – MasterCard – American Express

FINANCIAL RESULTS AND GUIDANCE 16
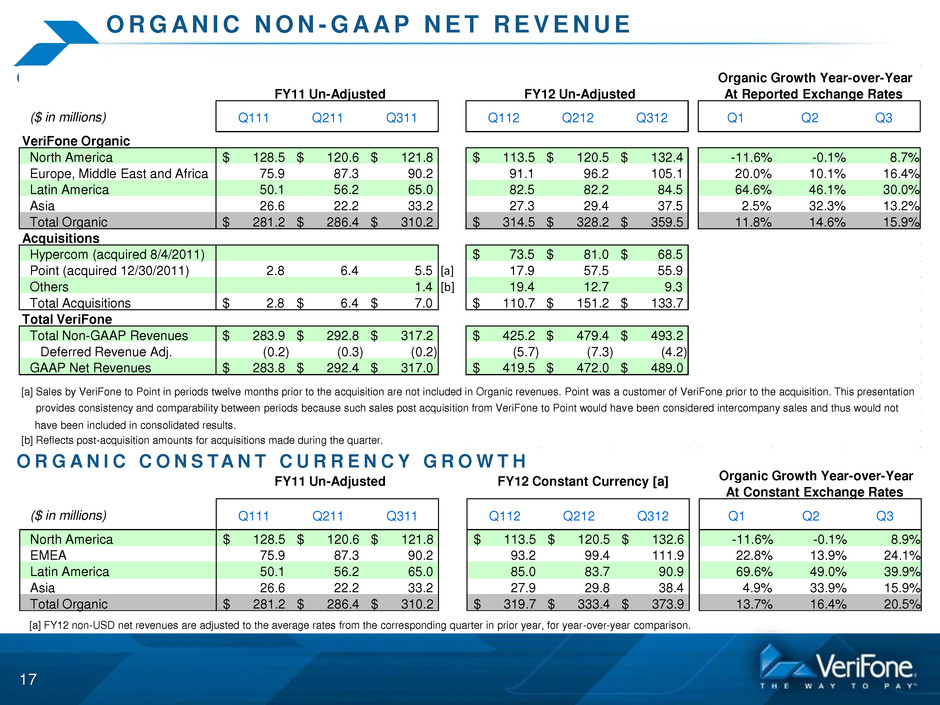
O R G AN I C N O N - G A A P N E T R E V E N U E 17 O R G A N I C G R O W T H O R G A N I C C O N S TA N T C U R R E N C Y G R O W T H ($ in millions) Q111 Q211 Q311 Q112 Q212 Q312 Q1 Q2 Q3 VeriFone Organic North America 128.5 $ 120.6 $ 121.8 $ 113.5 $ 120.5 $ 132.4 $ -11.6% -0.1% 8.7% Europe, Middle East and Africa 75.9 87.3 90.2 91.1 96.2 105.1 20.0% 10.1% 16.4% Latin America 50.1 56.2 65.0 82.5 82.2 84.5 64.6% 46.1% 30.0% Asia 26.6 22.2 33.2 27.3 29.4 37.5 2.5% 32.3% 13.2% Total Organic 281.2 $ 286.4 $ 310.2 $ 314.5 $ 328.2 $ 359.5 $ 11.8% 14.6% 15.9% Acquisitions Hypercom (acquired 8/4/2011) 73.5 $ 81.0 $ 68.5 $ Point (acquired 12/30/2011) 2.8 6.4 5.5 [a] 17.9 57.5 55.9 Others 1.4 [b] 19.4 12.7 9.3 Total Acquisitions 2.8 $ 6.4 $ 7.0 $ 110.7 $ 151.2 $ 133.7 $ Total VeriFone Total Non-GAAP Revenues 283.9 $ 292.8 $ 317.2 $ 425.2 $ 479.4 $ 493.2 $ Deferred Revenue Adj. (0.2) (0.3) (0.2) (5.7) (7.3) (4.2) GAAP Net Revenues 283.8 $ 292.4 $ 317.0 $ 419.5 $ 472.0 $ 489.0 $ [a] Sales by VeriFone to Point in periods twelve months prior to the acquisition are not included in Organic revenues. Point was a customer of VeriFone prior to the acquisition. This presentation provides consistency and comparability between periods because such sales post acquisition from VeriFone to Point would have been considered intercompany sales and thus would not have been included in consolidated results. [b] Reflects post-acquisition amounts for acquisitions made during the quarter. FY11 Un-Adjusted FY12 Un-Adjusted Organic Growth Year-over-Year At Reported Exchange Rates ($ in millions) Q111 Q211 Q311 Q112 Q212 Q312 Q1 Q2 Q3 North America 128.5 $ 120.6 $ 121.8 $ 113.5 $ 120.5 $ 132.6 $ -11.6% -0.1% 8.9% EMEA 75.9 87.3 90.2 93.2 99.4 111.9 22.8% 13.9% 24.1% Latin America 50.1 56.2 65.0 85.0 83.7 90.9 69.6% 49.0% 39.9% Asia 26.6 22.2 33.2 27.9 29.8 38.4 4.9% 33.9% 15.9% Total Organic 281.2 $ 286.4 $ 310.2 $ 319.7 $ 333.4 $ 373.9 $ 13.7% 16.4% 20.5% [a] FY12 non-USD net revenues are adjusted to the average rates from the corresponding quarter in prior year, for year-over-year comparison. FY11 Un-Adjusted FY12 Constant Currency [a] Organic Growth Year-over-Year At Constant Exchange Rates

N O N - G A A P G R O S S M A R G I N * 18 * A reconciliation of our GAAP to Non-GAAP gross margin can be found on slide 29 % of Revenue Q311 Q212 Q312 System Solutions 41.8% 44.6% 44.5% Services 45.7% 44.8% 47.6% Total 42.6% 44.6% 45.4%

N O N - G A A P O P E R AT I N G E X P E N S E S * 19 * A reconciliation of our GAAP to Non-GAAP operating expenses can be found on slide 30 % of Revenue Q311 Q212 Q312 Research and Development 8.3% 7.4% 7.3% Sales and Marketing 8.9% 8.6% 8.2% General and Administrative 6.2% 7.3% 7.2% Total 23.4% 23.3% 22.7%
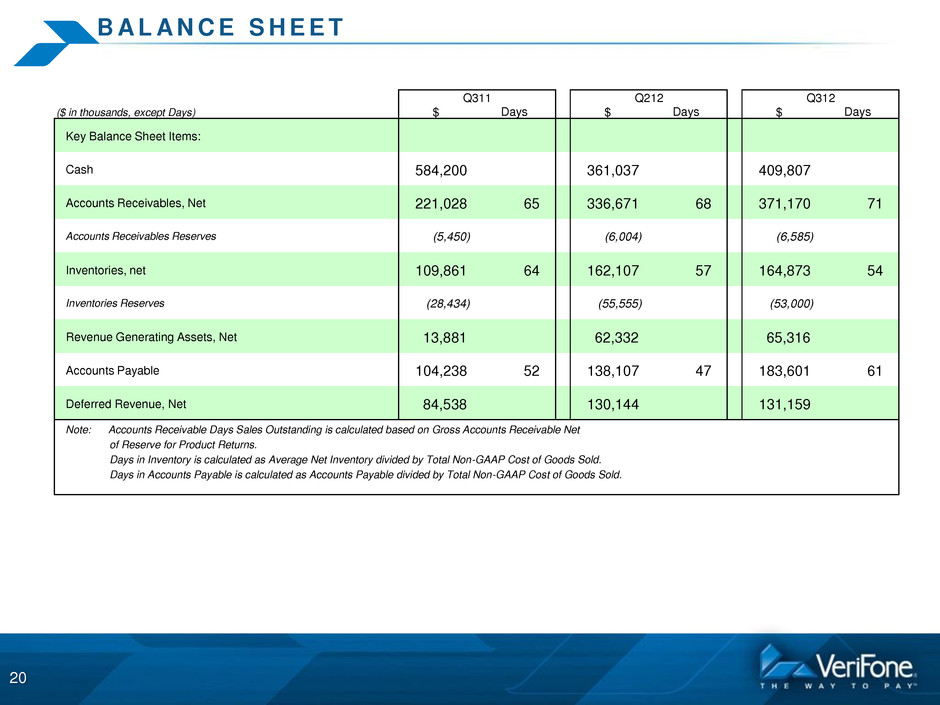
B AL A N C E S H E E T 20 ($ in thousands, except Days) $ $ $ Key Balance Sheet Items: Cash 584,200 361,037 409,807 Accounts Receivables, Net 221,028 65 336,671 68 371,170 71 Accounts Receivables Reserves (5,450) (6,004) (6,585) Inventories, net 109,861 64 162,107 57 164,873 54 Inventories Reserves (28,434) (55,555) (53,000) Revenue Generating Assets, Net 13,881 62,332 65,316 Accounts Payable 104,238 52 138,107 47 183,601 61 Deferred Revenue, Net 84,538 130,144 131,159 Note: Accounts Receivable Days Sales Outstanding is calculated based on Gross Accounts Receivable Net of Reserve for Product Returns. Days in Inventory is calculated as Average Net Inventory divided by Total Non-GAAP Cost of Goods Sold. Days in Accounts Payable is calculated as Accounts Payable divided by Total Non-GAAP Cost of Goods Sold. Days Days Days Q212 Q312 Q311

C AS H F L O W 21 ($ in thousands) $ $ $ Cash Flow from Operations before Changes in Operating Assets & Liabilities 44,786 68,539 95,075 Changes in Operating Assets and Liabilities 8,037 (37,786) (12,633) Cash Flow from Operations 52,823 30,753 82,442 Less: - Cash Expenditures for Revenue Generating Assets * 0 (12,670) (7,830) - Purchases of Property, Plant, Equipment, and Capitalized Software Development (3,476) (7,027) (9,018) Free Cash Flow 49,347 11,056 65,594 Q312 Q212 Q311 * Immaterial in Q311
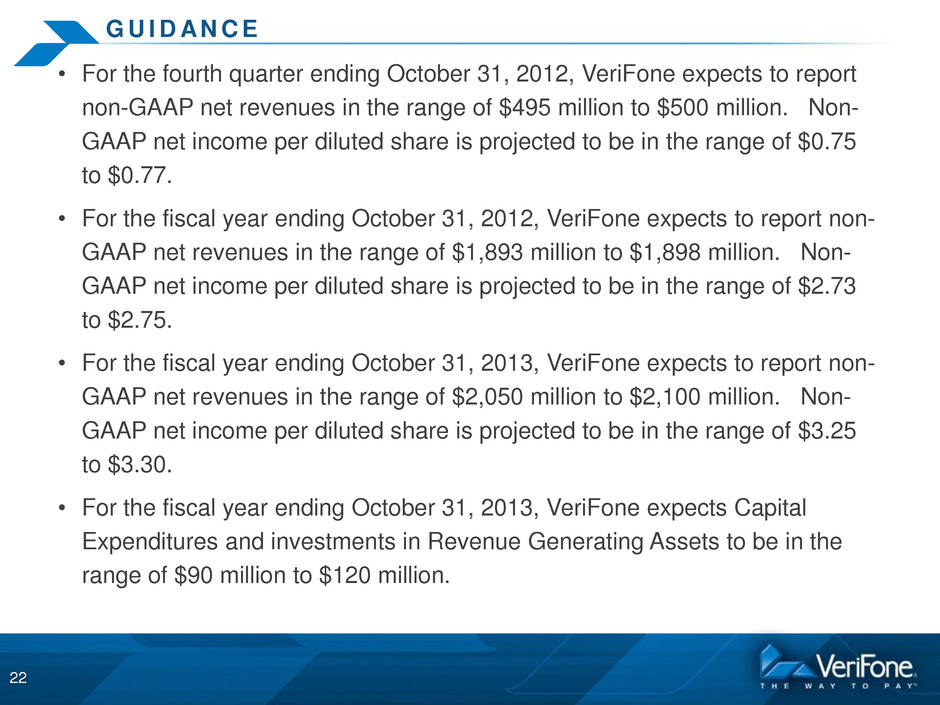
G U I D AN C E • For the fourth quarter ending October 31, 2012, VeriFone expects to report non-GAAP net revenues in the range of $495 million to $500 million. Non- GAAP net income per diluted share is projected to be in the range of $0.75 to $0.77. • For the fiscal year ending October 31, 2012, VeriFone expects to report non- GAAP net revenues in the range of $1,893 million to $1,898 million. Non- GAAP net income per diluted share is projected to be in the range of $2.73 to $2.75. • For the fiscal year ending October 31, 2013, VeriFone expects to report non- GAAP net revenues in the range of $2,050 million to $2,100 million. Non- GAAP net income per diluted share is projected to be in the range of $3.25 to $3.30. • For the fiscal year ending October 31, 2013, VeriFone expects Capital Expenditures and investments in Revenue Generating Assets to be in the range of $90 million to $120 million. 22
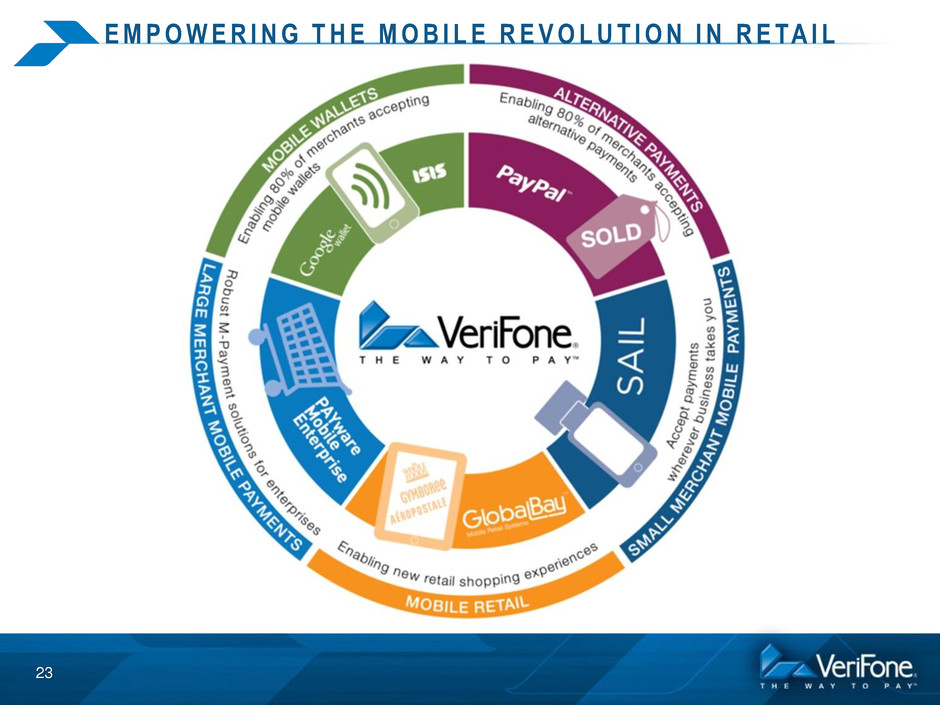
E M P O W E R I N G T H E M O B I L E R E V O L U T I O N I N R E TA I L 23

Q & A SESSION 24

APPENDIX 25

R E C O N C I L I AT I O N O F G A A P T O N O N - G A A P P R O F I T & L O S S ( P A G E 1 ) 26 ($ in thousands, except Share Count and EPS) Q311 Q212 Q312 GAAP Net Revenue 316,951 472,018 489,050 Amortization of step-down in Deferred revenue at Acquisition 204 7,346 4,169 Non-GAAP Net Revenue 317,155 479,364 493,219 GAAP Cost of Net Revenues 185,339 279,859 281,543 Stock-based Compensation (433) (463) (560) Acquisition Related and Restructuring Costs (101) (3,336) (1,183) Amortization of Purchased Intangible Assets (2,687) (10,714) (10,582) Non-GAAP Cost of Net Revenues 182,118 265,346 269,218 GAAP Gross Margin 131,612 192,159 207,507 Amortization of step-down in Deferred revenue at Acquisition 204 7,346 4,169 Stock-based Compensation 433 463 560 Acquisition Related and Restructuring Costs 101 3,336 1,183 Amortization of Purchased Intangible Assets 2,687 10,714 10,582 Non-GAAP Gross Margin 135,037 214,018 224,001 GAAP Operating Expense 90,863 174,075 151,430 Stock-based Compensation (7,917) (10,560) (11,885) Acquisition Related and Restructuring Costs (6,645) (10,258) (4,650) Amortization of Purchased Intangible Assets (1,980) (23,757) (23,177) Patent Litigation Loss Contingency Expense 0 (17,632) 0 Other Charges 0 0 0 Non-GAAP Operating Expense 74,321 111,868 111,718 Non-GAAP Operating Income 60,716 102,150 112,283

R E C O N C I L I AT I O N O F G A A P T O N O N - G A A P P R O F I T & L O S S ( P A G E 2 ) 27 ($ in thousands, except Share Count and EPS) Q311 Q212 Q312 Non-GAAP Operating Income (from page 1) 60,716 102,150 112,283 GAAP Net Interest and Other (1,171) (19,273) (15,985) Acquisition Related Costs and Interest Charges (574) (17) (1,934) Non-Cash Interest Expense 3,961 4,094 2,087 Non-Operating Gains (5,196) 98 393 Non-Controlling Interest (159) 68 (84) Non-GAAP Net Interest and Other (3,139) (15,030) (15,523) Non-GAAP Pre-tax Profit 57,577 87,120 96,760 GAAP Provision for (Benefit from) Income Taxes 13,072 (4,598) 2,313 Income Tax Effect of Non-GAAP Exclusions (1,557) 20,281 11,233 Non-GAAP Provision for Income Taxes 11,515 15,683 13,546 Non-GAAP Consolidated Net Income Attributable to VF Stockholders 46,062 71,437 83,214 89,602 106,898 107,568 93,322 111,148 110,384 Additional Shares dilutive for non-GAAP net income (31) (371) - Non-GAAP Diluted Shares 93,291 110,777 110,384 Non-GAAP Diluted EPS 0.49 0.64 0.75 GAAP Basic Shares Weighted average shares used in computing net income (loss) earnings per share: GAAP Diluted Shares

R E C O N C I L I AT I O N O F G A A P T O N O N - G A A P R E V E N U E 28 ($ in thousands) Q311 Q212 Q312 GAAP Net Revenue: North America 121,807 128,907 138,162 Amortization of step-down in Deferred revenue at Acquisition 29 298 271 Non-GAAP Net Revenue: North America 121,836 129,205 138,433 GAAP Net Revenue: Europe 97,032 198,941 199,992 Amortization of step-down in Deferred revenue at Acquisition 174 6,132 3,421 Non-GAAP Net Revenue: Europe 97,206 205,073 203,413 GAAP Net Revenue: Latin America 64,961 96,205 94,378 Amortization of step-down in Deferred revenue at Acquisition 0 0 0 Non-GAAP Net Revenue: Latin America 64,961 96,205 94,378 GAAP Net Revenue: Asia 33,151 47,965 56,518 Amortization of step-down in Deferred revenue at Acquisition 1 916 477 Non-GAAP Net Revenue: Asia 33,152 48,881 56,995 GAAP Net Revenue 316,951 472,018 489,050 Amortization of step-down in Deferred revenue at Acquisition 204 7,346 4,169 Non-GAAP Net Revenue 317,155 479,364 493,219

R E C O N C I L I AT I O N O F G A A P T O N O N - G A A P G R O S S M A R G I N 29 ($ in thousands, except Gross Margin Percentage) Q311 Q212 Q312 GAAP Gross Margin - System Solutions 103,038 138,170 144,017 Amortization of step-down in Deferred revenue at Acquisition 0 3,310 729 Stock-based Compensation 380 418 442 Acquisition Related and Restructuring Costs 134 1,658 1,403 Amortization of Purchased Intangible Assets 2,483 9,754 9,630 Non-GAAP Gross Margin - System Solutions 106,035 153,310 156,221 Non-GAAP Gross Margin % - System Solutions 41.8% 44.6% 44.5% GAAP Gross Margin - Services 28,574 53,989 63,490 Amortization of step-down in Deferred revenue at Acquisition 204 4,036 3,440 Stock-based Compensation 53 45 118 Acquisition Related and Restructuring Costs (33) 1,678 (220) Amortization of Purchased Intangible Assets 204 960 952 Non-GAAP Gross Margin - Services 29,002 60,708 67,780 Non-GAAP Gross Margin % - Services 45.7% 44.8% 47.6% GAAP Gross Margin 131,612 192,159 207,507 Amortization of step-down in Deferred revenue at Acquisition 204 7,346 4,169 Stock-based Compensation 433 463 560 Acquisition Related and Restructuring Costs 101 3,336 1,183 Amortization of Purchased Intangible Assets 2,687 10,714 10,582 Total Non-GAAP Gross Margin 135,037 214,018 224,001 Total Non-GAAP Gross Margin % 42.6% 44.6% 45.4%
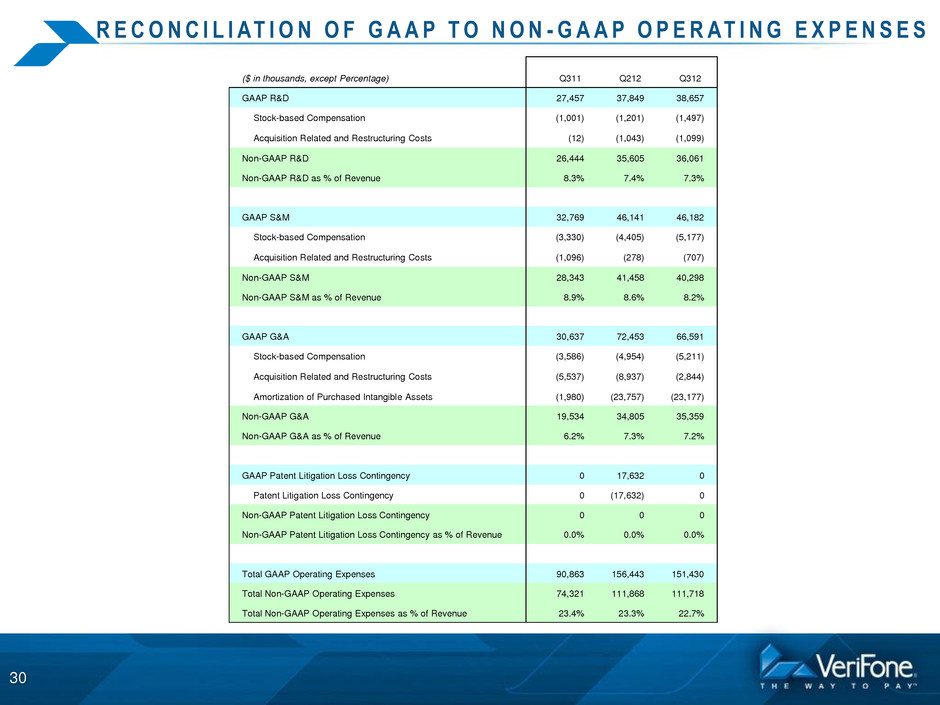
R E C O N C I L I AT I O N O F G A A P T O N O N - G A A P O P E R AT I N G E X P E N S E S 30 ($ in thousands, except Percentage) Q311 Q212 Q312 GAAP R&D 27,457 37,849 38,657 Stock-based Compensation (1,001) (1,201) (1,497) Acquisition Related and Restructuring Costs (12) (1,043) (1,099) Non-GAAP R&D 26,444 35,605 36,061 Non-GAAP R&D as % of Revenue 8.3% 7.4% 7.3% GAAP S&M 32,769 46,141 46,182 Stock-based Compensation (3,330) (4,405) (5,177) Acquisition Related and Restructuring Costs (1,096) (278) (707) Non-GAAP S&M 28,343 41,458 40,298 Non-GAAP S&M as % of Revenue 8.9% 8.6% 8.2% GAAP G&A 30,637 72,453 66,591 Stock-based Compensation (3,586) (4,954) (5,211) Acquisition Related and Restructuring Costs (5,537) (8,937) (2,844) Amortization of Purchased Intangible Assets (1,980) (23,757) (23,177) Non-GAAP G&A 19,534 34,805 35,359 Non-GAAP G&A as % of Revenue 6.2% 7.3% 7.2% GAAP Patent Litigation Loss Contingency 0 17,632 0 Patent Litigation Loss Contingency 0 (17,632) 0 Non-GAAP Patent Litigation Loss Contingency 0 0 0 Non-GAAP Patent Litigation Loss Contingency as % of Revenue 0.0% 0.0% 0.0% Total GAAP Operating Expenses 90,863 156,443 151,430 Total Non-GAAP Operating Expenses 74,321 111,868 111,718 Total Non-GAAP Operating Expenses as % of Revenue 23.4% 23.3% 22.7%
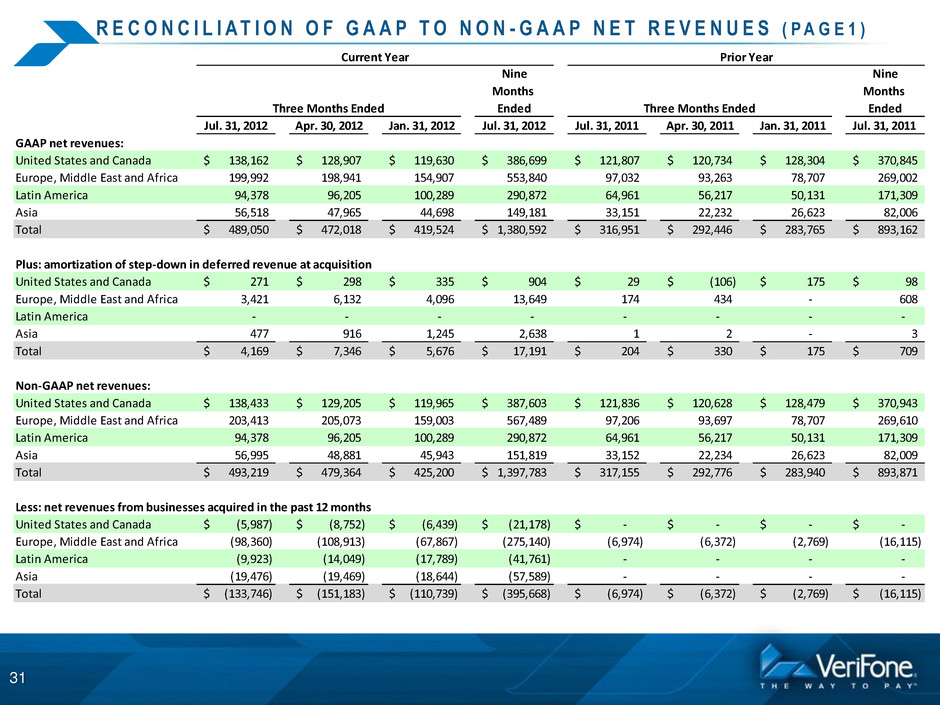
R E C O N C I L I A T I O N O F G A A P T O N O N - G A A P N E T R E V E N U E S ( P A G E 1 ) 31 Jul. 31, 2012 Apr. 30, 2012 Jan. 31, 2012 Jul. 31, 2012 Jul. 31, 2011 Apr. 30, 2011 Jan. 31, 2011 Jul. 31, 2011 GAAP net revenues: United States and Canada 138,162$ 128,907$ 119,630$ 386,699$ 121,807$ 120,734$ 128,304$ 370,845$ Europe, Middle East and Africa 199,992 198,941 154,907 553,840 97,032 93,263 78,707 269,002 Latin America 94,378 96,205 100,289 290,872 64,961 56,217 50,131 171,309 Asia 56,518 47,965 44,698 149,181 33,151 22,232 26,623 82,006 Total 489,050$ 472,018$ 419,524$ 1,380,592$ 316,951$ 292,446$ 283,765$ 893,162$ Plus: amortization of step-down in deferred revenue at acquisition United States and Canada 271$ 298$ 335$ 904$ 29$ (106)$ 175$ 98$ Europe, Middle East and Africa 3,421 6,132 4,096 13,649 174 434 - 608 Latin America - - - - - - - - Asia 477 916 1,245 2,638 1 2 - 3 Total 4,169$ 7,346$ 5,676$ 17,191$ 204$ 330$ 175$ 709$ Non-GAAP net revenues: United States and Canada 138,433$ 129,205$ 119,965$ 387,603$ 121,836$ 120,628$ 128,479$ 370,943$ Europe, Middle East and Africa 203,413 205,073 159,003 567,489 97,206 93,697 78,707 269,610 Latin America 94,378 96,205 100,289 290,872 64,961 56,217 50,131 171,309 Asia 56,995 48,881 45,943 151,819 33,152 22,234 26,623 82,009 Total 493,219$ 479,364$ 425,200$ 1,397,783$ 317,155$ 292,776$ 283,940$ 893,871$ Less: net revenues from businesses acquired in the past 12 months United States and Canada (5,987)$ (8,752)$ (6,439)$ (21,178)$ -$ -$ -$ -$ Europe, Middle East and Africa (98,360) (108,913) (67,867) (275,140) (6,974) (6,372) (2,769) (16,115) Latin America (9,923) (14,049) (17,789) (41,761) - - - - Asia (19,476) (19,469) (18,644) (57,589) - - - - Total (133,746)$ (151,183)$ (110,739)$ (395,668)$ (6,974)$ (6,372)$ (2,769)$ (16,115)$ Current Year Prior Year Nine Months Ended Nine Months Ended Three Months Ended Three Months Ended

R E C O N C I L I A T I O N O F G A A P T O N O N - G A A P N E T R E V E N U E S ( P A G E 2 ) 32 Jul. 31, 2012 Apr. 30, 2012 Jan. 31, 2012 Jul. 31, 2012 Jul. 31, 2011 Apr. 30, 2011 Jan. 31, 2011 Jul. 31, 2011 Organic non-GAAP net revenues: United States and Canada 132,446$ 120,453$ 113,526$ 366,425$ 121,836$ 120,628$ 128,479$ 370,943$ Europe, Middle East and Africa 105,053 96,160 91,136 292,349 90,232 87,325 75,938 253,495 Latin America 84,455 82,156 82,500 249,111 64,961 56,217 50,131 171,309 Asia 37,519 29,412 27,299 94,230 33,152 22,234 26,623 82,009 Total 359,473$ 328,181$ 314,461$ 1,002,115$ 310,181$ 286,404$ 281,171$ 877,756$ Plus: constant currency adjustment United States and Canada 195$ 18$ 11$ 224$ Europe, Middle East and Africa 6,893 3,271 2,096 12,260 Latin America 6,433 1,588 2,526 10,547 Asia 906 361 634 1,901 Total 14,427$ 5,238$ 5,267$ 24,932$ Organic non- AAP net revenues at constant currency: United States and Canada 132,641$ 120,471$ 113,537$ 366,649$ 121,836$ 120,628$ 128,479$ 370,943$ Europe, Middle East and Africa 111,946 99,431 93,232 304,609 90,232 87,325 75,938 253,495 Latin America 90,888 83,744 85,026 259,658 64,961 56,217 50,131 171,309 Asia 38,425 29,773 27,933 96,131 33,152 22,234 26,623 82,009 Total 373,900$ 333,419$ 319,728$ 1,027,047$ 310,181$ 286,404$ 281,171$ 877,756$ Current Year Prior Year Nine Months Ended Three Months EndedThree Months Ended Nine Months Ended

Financial Results for the Quarter Ended July 31, 2012 33


