
Financial Results for the Quarter Ended January 31, 2013 Exhibit 99.2
F O RWA R D - L O O K I N G S TAT E M E N T S Today’s discussion may include “forward-looking statements” within the meaning of the Private Securities Litigation Reform Act of 1995. Such statements relate to future events and expectations and involve known and unknown risks and uncertainties. VeriFone’s actual results or actions may differ materially from those projected in the forward-looking statements. For a summary of the specific risk factors that could cause results to differ materially from those expressed in the forward-looking statements, please refer to VeriFone’s filings with the Securities and Exchange Commission, including its annual report on Form 10-K and quarterly reports on Form 10-Q. VeriFone is under no obligation to, and expressly disclaims any obligation to, update or alter its forward-looking statements, whether as a result of new information, future events, changes in assumptions or otherwise. 2
N O N - G A A P F I N A N C I A L M E A S U R E S With respect to any Non-GAAP financial measures presented in the information, reconciliations of Non-GAAP to GAAP financial measures may be found in VeriFone’s quarterly earnings release as filed with the Securities and Exchange Commission as well as the Appendix to these slides. Management uses Non-GAAP financial measures only in addition to and in conjunction with results presented in accordance with GAAP. Management believes that these Non-GAAP financial measures help it to evaluate VeriFone’s performance and to compare VeriFone’s current results with those for prior periods as well as with the results of peer companies. These Non-GAAP financial measures contain limitations and should be considered as a supplement to, and not as a substitute for, or superior to, disclosures made in accordance with GAAP. 3
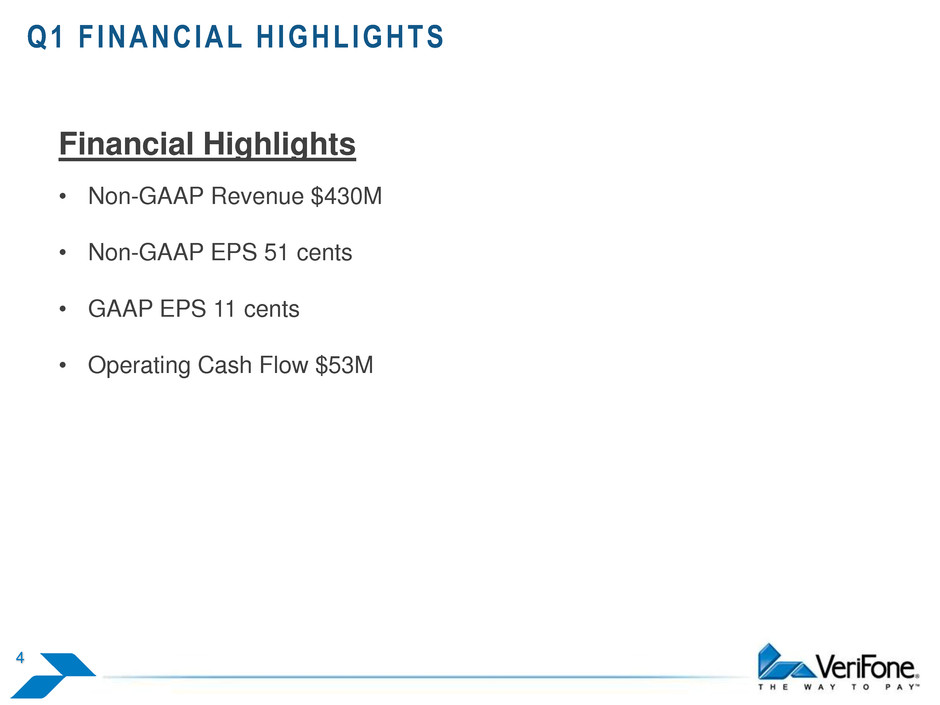
Q1 F INANCIAL HIGHLIGHTS 4 Financial Highlights • Non-GAAP Revenue $430M • Non-GAAP EPS 51 cents • GAAP EPS 11 cents • Operating Cash Flow $53M
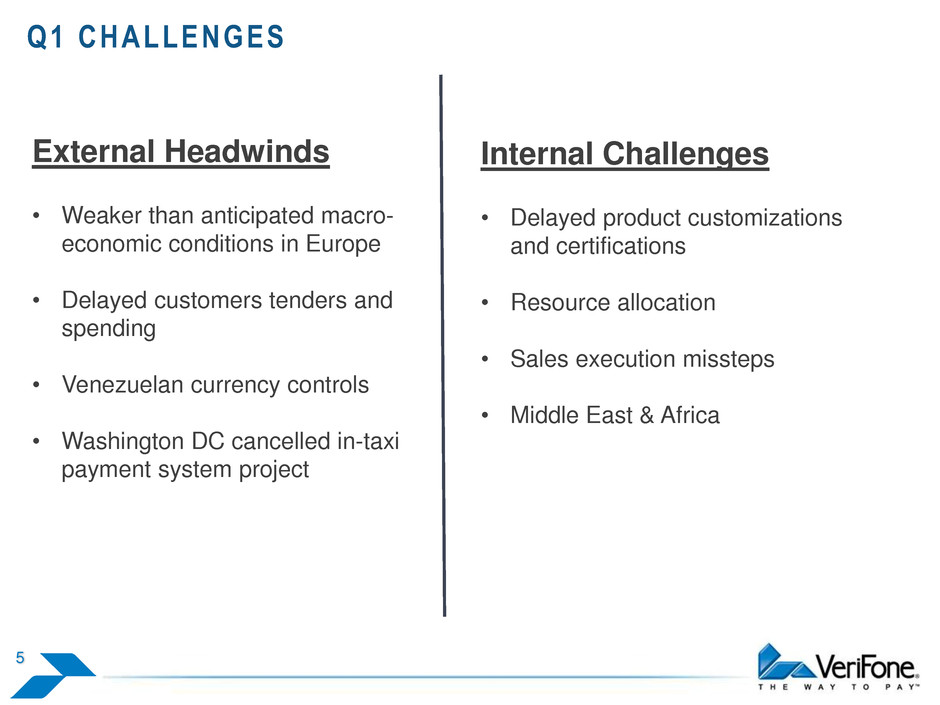
Q1 CHALLENGES 5 External Headwinds • Weaker than anticipated macro- economic conditions in Europe • Delayed customers tenders and spending • Venezuelan currency controls • Washington DC cancelled in-taxi payment system project Internal Challenges • Delayed product customizations and certifications • Resource allocation • Sales execution missteps • Middle East & Africa
Q1 ACHIEVEMENTS 6 What Went Right • Strong North America and Point performance • Good progress on expanding our services model with managed service wins • Standard Bank of South Africa • China PnR • VF brands in U.S. (includes North Face, Vans, and Timberland) • U.S. Multi-lane Retail net revenues increased 11% year-over-year • In our U.S. Petroleum business, Topaz unit sales set a record
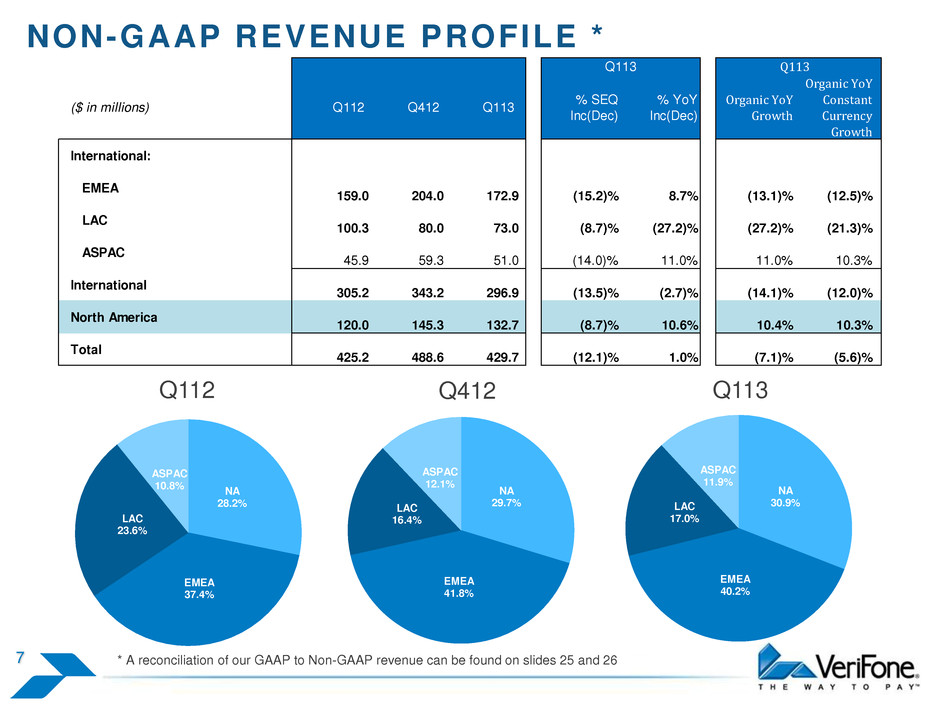
NON-GAAP REVENUE PROFILE * 7 NA 29.7% EMEA 41.8% LAC 16.4% ASPAC 12.1% * A reconciliation of our GAAP to Non-GAAP revenue can be found on slides 25 and 26 Q412 NA 30.9% EMEA 40.2% LAC 17.0% ASPAC 11.9% NA 28.2% EMEA 37.4% LAC 23.6% ASPAC 10.8% Q113 Q112 ($ in millions) Q112 Q412 Q113 % SEQ Inc(Dec) % YoY Inc(Dec) Organic YoY Growth Organic YoY Constant Currency Growth International: EMEA 159.0 204.0 172.9 (15.2)% 8.7% (13.1)% (12.5)% LAC 100.3 80.0 73.0 (8.7)% (27.2)% (27.2)% (21.3)% ASPAC 45.9 59.3 51.0 (14.0)% 11.0% 11.0% 10.3% International 305.2 343.2 296.9 (13.5)% (2.7)% (14.1)% (12.0)% North America 120.0 145.3 132.7 (8.7)% 10.6% 10.4% 10.3% Total 425.2 488.6 429.7 (12.1)% 1.0% (7.1)% (5.6)% Q113 Q113
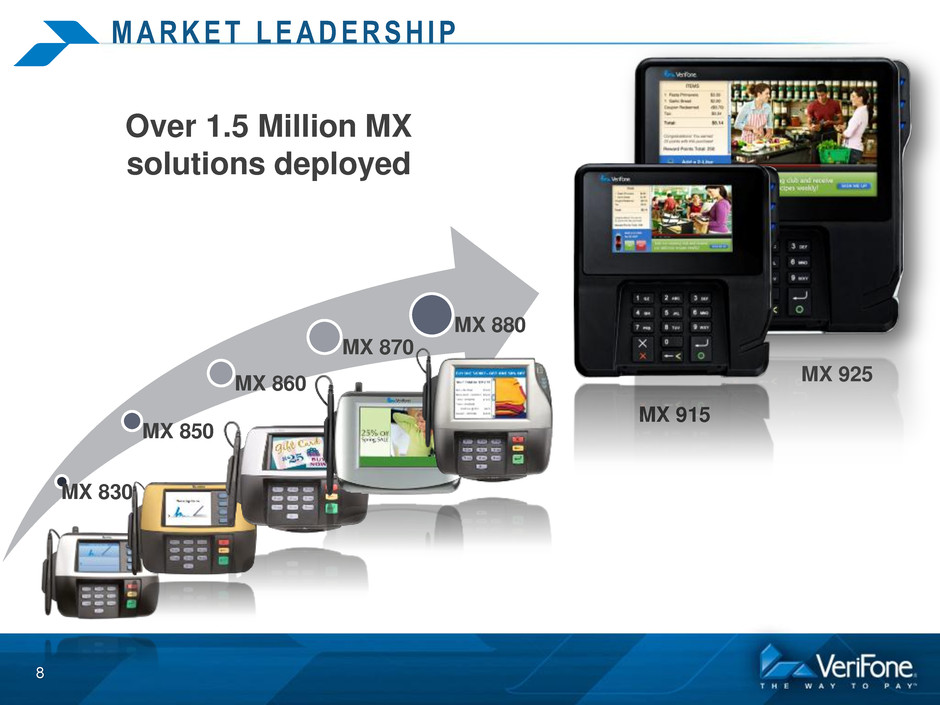
MX 915 MX 925 MX 830 MX 850 MX 860 MX 870 MX 880 Over 1.5 Million MX solutions deployed M A R K E T L E A D E R S H I P 8
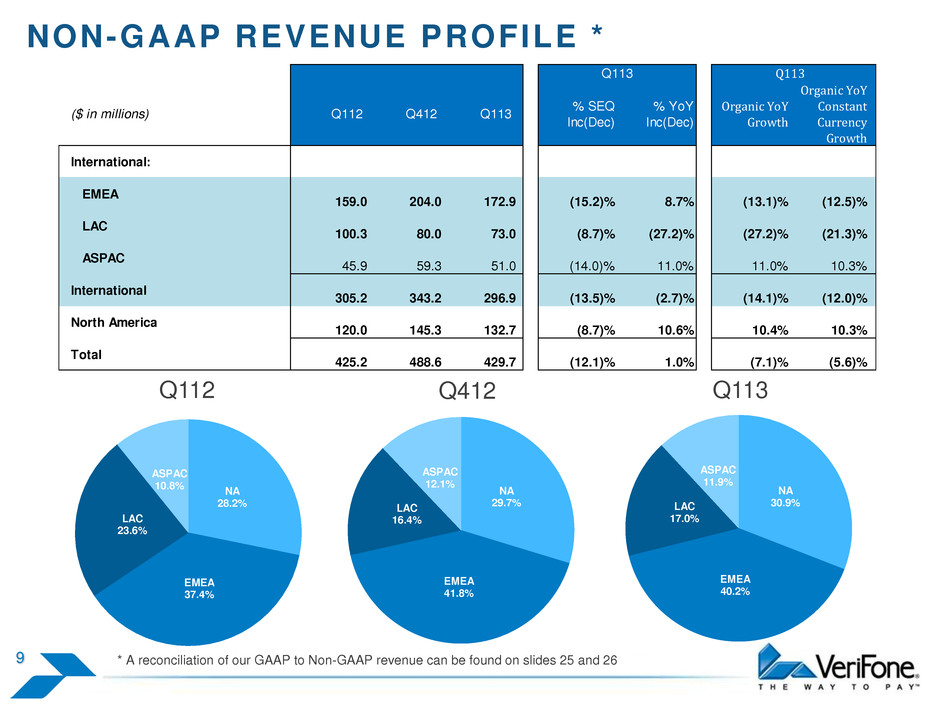
NON-GAAP REVENUE PROFILE * 9 NA 29.7% EMEA 41.8% LAC 16.4% ASPAC 12.1% * A reconciliation of our GAAP to Non-GAAP revenue can be found on slides 25 and 26 Q412 NA 30.9% EMEA 40.2% LAC 17.0% ASPAC 11.9% NA 28.2% EMEA 37.4% LAC 23.6% ASPAC 10.8% Q113 Q112 ($ in millions) Q112 Q412 Q113 % SEQ Inc(Dec) % YoY Inc(Dec) Organic YoY Growth Organic YoY Constant Currency Growth International: EMEA 159.0 204.0 172.9 (15.2)% 8.7% (13.1)% (12.5)% LAC 100.3 80.0 73.0 (8.7)% (27.2)% (27.2)% (21.3)% ASPAC 45.9 59.3 51.0 (14.0)% 11.0% 11.0% 10.3% International 305.2 343.2 296.9 (13.5)% (2.7)% (14.1)% (12.0)% North America 120.0 145.3 132.7 (8.7)% 10.6% 10.4% 10.3% Total 425.2 488.6 429.7 (12.1)% 1.0% (7.1)% (5.6)% Q113 Q113
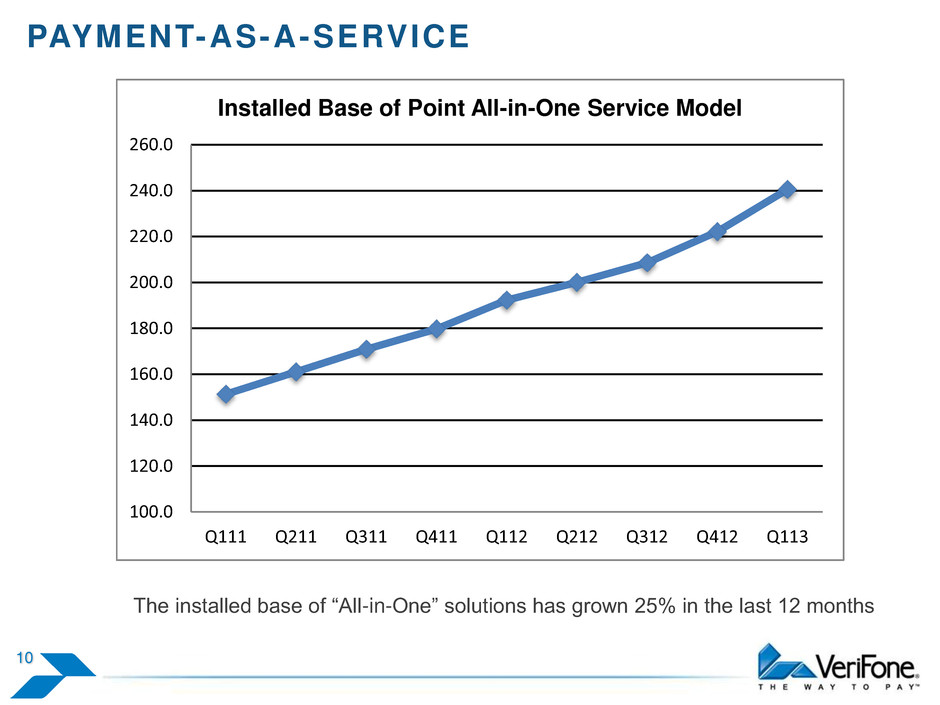
PAYMENT-AS-A-SERVICE The installed base of “All-in-One” solutions has grown 25% in the last 12 months 10 100.0 120.0 140.0 160.0 180.0 200.0 220.0 240.0 260.0 Q111 Q211 Q311 Q411 Q112 Q212 Q312 Q412 Q113 Installed Base of Point All-in-One Service Model
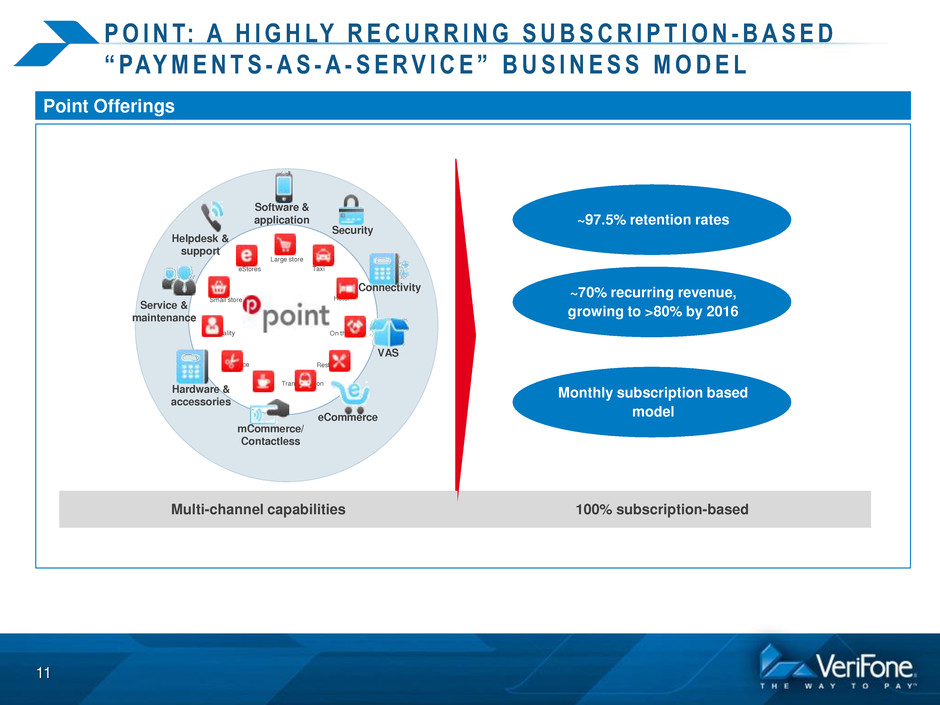
Point Offerings 100% subscription-based ~97.5% retention rates ~70% recurring revenue, growing to >80% by 2016 Monthly subscription based model Multi-channel capabilities Software & application Taxi Hotel On the road Restaurant Transportation Café Service Hospitality Small store eStores Large store VAS eCommerce Service & maintenance mCommerce/ Contactless Connectivity Helpdesk & support Hardware & accessories Security P O I N T: A H I G H LY R E C U R R I N G S U B S C R I P T I O N - B A S E D “ PAYMENTS - A S - A -SERV I CE ” BUS I NESS MODEL 11

FINANCIAL RESULTS AND GUIDANCE
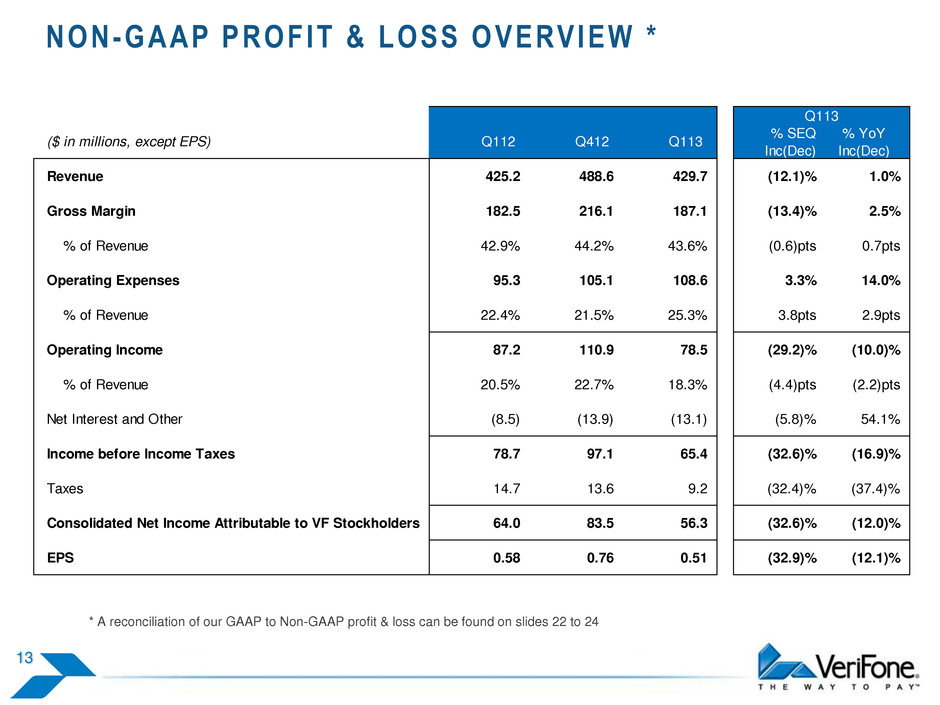
NON-GAAP PROFIT & LOSS OVERVIEW * * A reconciliation of our GAAP to Non-GAAP profit & loss can be found on slides 22 to 24 13 ($ in millions, except EPS) Q112 Q412 Q113 % SEQ Inc(Dec) Revenue 425.2 488.6 429.7 (12.1)% 1.0% Gross Margin 182.5 216.1 187.1 (13.4)% 2.5% % of Revenue 42.9% 44.2% 43.6% (0.6)pts 0.7pts Operating Expenses 95.3 105.1 108.6 3.3% 14.0% % of Revenue 22.4% 21.5% 25.3% 3.8pts 2.9pts Operating Income 87.2 110.9 78.5 (29.2)% (10.0)% % of Revenue 20.5% 22.7% 18.3% (4.4)pts (2.2)pts Net Interest and Other (8.5) (13.9) (13.1) (5.8)% 54.1% Income before Income Taxes 78.7 97.1 65.4 (32.6)% (16.9)% Taxes 14.7 13.6 9.2 (32.4)% (37.4)% Consolidated Net Income Attributable to VF Stockholders 64.0 83.5 56.3 (32.6)% (12.0)% EPS 0.58 0.76 0.51 (32.9)% (12.1)% Q113 % YoY Inc(Dec)
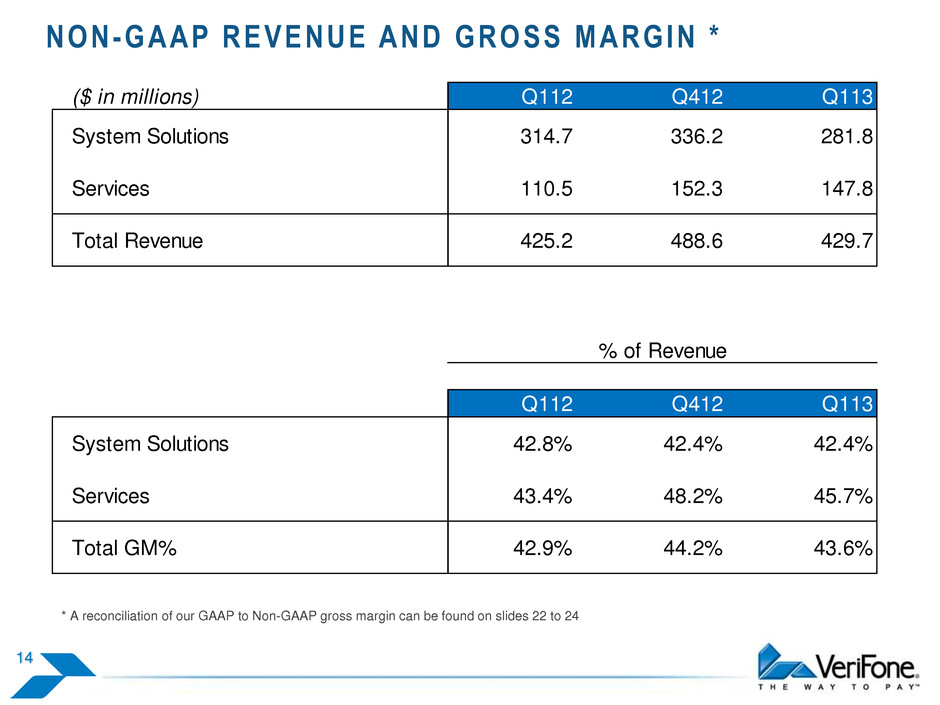
NON-GAAP REVENUE AND GROSS MARGIN * 14 * A reconciliation of our GAAP to Non-GAAP gross margin can be found on slides 22 to 24 Q112 Q412 Q113 System Solutions 42.8% 42.4% 42.4% Services 43.4% 48.2% 45.7% Total GM% 42.9% 44.2% 43.6% % of Revenue ($ in millions) Q112 Q412 Q113 System Solutions 314.7 336.2 281.8 Services 110.5 152.3 147.8 Total Revenue 425. 488.6 429.7
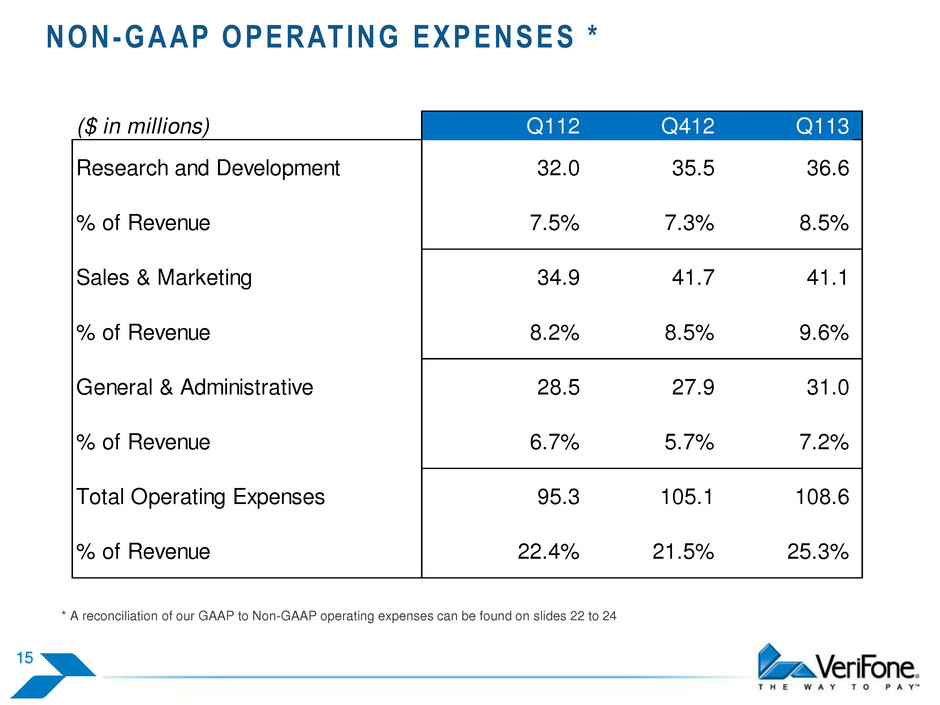
NON-GAAP OPERATING EXPENSES * 15 * A reconciliation of our GAAP to Non-GAAP operating expenses can be found on slides 22 to 24 ($ in millions) Q112 Q412 Q113 Research and Development 32.0 35.5 36.6 % of Revenue 7.5% 7.3% 8.5% Sales & Marketing 34.9 41.7 41.1 % of Revenue 8.2% 8.5% 9.6% General & Administrative 28.5 27.9 31.0 % of Revenue 6.7% 5.7% 7.2% Total Operating Expenses 95.3 105.1 108.6 % of Revenue 22.4% 21.5% 25.3%
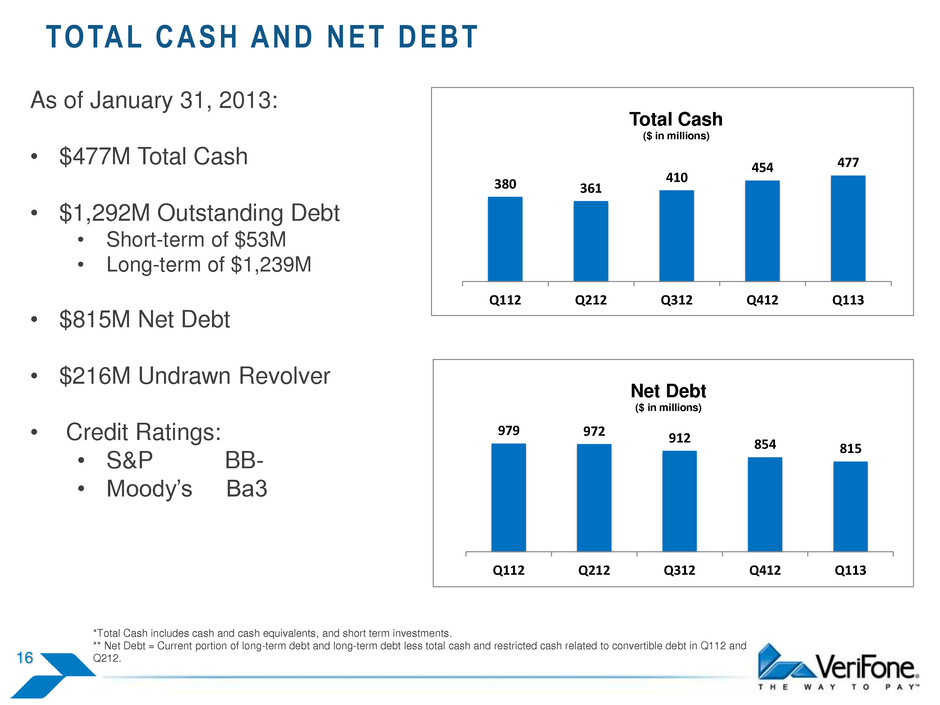
TOTAL CASH AND NET DEBT 16 As of January 31, 2013: • $477M Total Cash • $1,292M Outstanding Debt • Short-term of $53M • Long-term of $1,239M • $815M Net Debt • $216M Undrawn Revolver • Credit Ratings: • S&P BB- • Moody’s Ba3 *Total Cash includes cash and cash equivalents, and short term investments. ** Net Debt = Current portion of long-term debt and long-term debt less total cash and restricted cash related to convertible debt in Q112 and Q212. 380 361 410 454 477 Q112 Q212 Q312 Q412 Q113 Total Cash ($ in millions) 979 972 912 854 815 Q112 Q212 Q312 Q412 Q113 Net Debt ($ in millions)

BALANCE SHEET 17 ($ in millions, except Days) $ $ $ Accounts Receivables, net 302.6 64 366.9 68 355.1 74 Inventories, net 171.4 58 178.3 57 188.8 68 Accounts Payable 152.3 56 193.1 64 154.6 57 Deferred Revenue, net 130.9 128.6 158.1 Days Q112 Q113 Days Q412 Days Note: Accounts Receivable Days Sales Outstanding is calculated as Net Accounts Receivable divided by Total Non-GAAP Revenue / 90 days Days i Inv ntory is calculated as Aver ge Net Inventory divided by Total Non-GAAP Cost of Goods Sold / 90 days in Accounts Pay ble is calculat d as Accounts Payable divided by Total Non-GAAP Cost of Goods Sold / 90 days
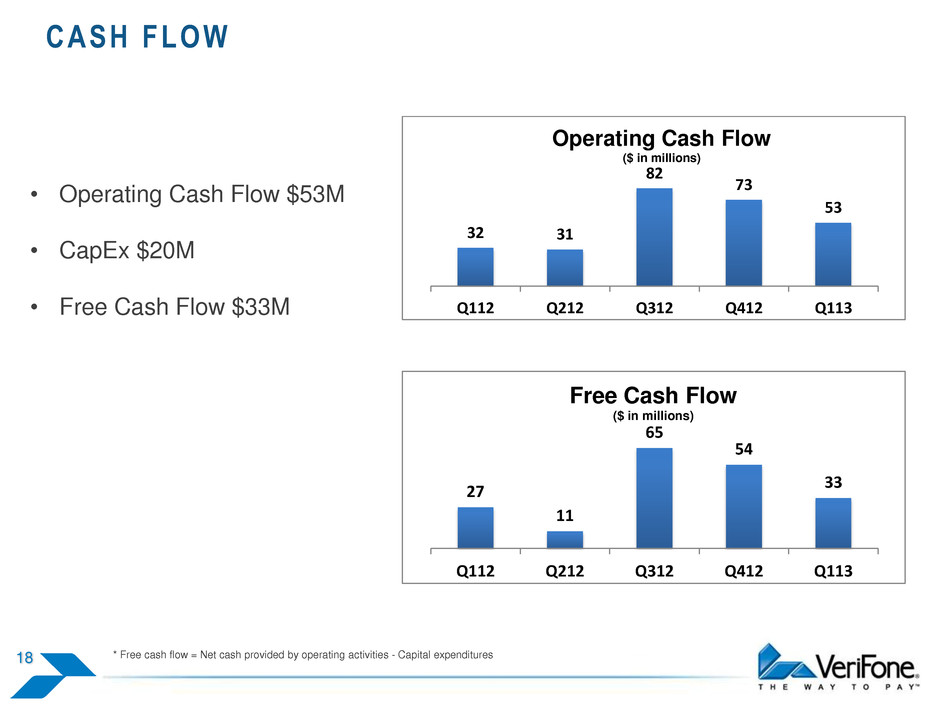
CASH FLOW 18 • Operating Cash Flow $53M • CapEx $20M • Free Cash Flow $33M * Free cash flow = Net cash provided by operating activities - Capital expenditures 32 31 82 73 53 Q112 Q212 Q312 Q412 Q113 Operating Cash Flow ($ in millions) 27 11 65 54 33 Q112 Q212 Q312 Q412 Q113 Free Cash Flow ($ in millions)
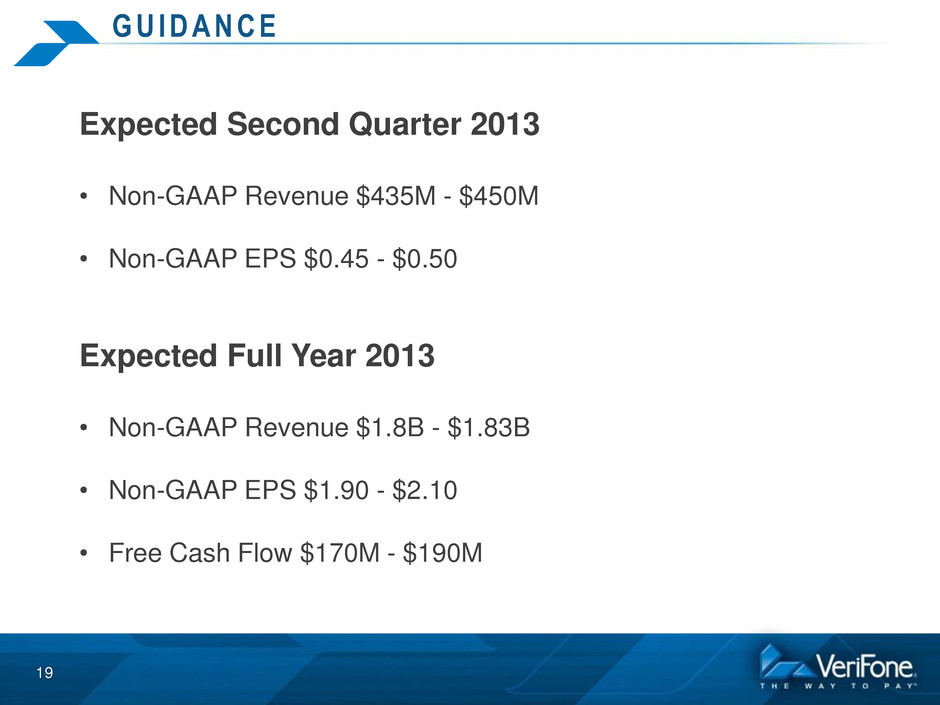
G U I D A N C E 19 Expected Second Quarter 2013 • Non-GAAP Revenue $435M - $450M • Non-GAAP EPS $0.45 - $0.50 Expected Full Year 2013 • Non-GAAP Revenue $1.8B - $1.83B • Non-GAAP EPS $1.90 - $2.10 • Free Cash Flow $170M - $190M

Q & A SESSION

APPENDIX
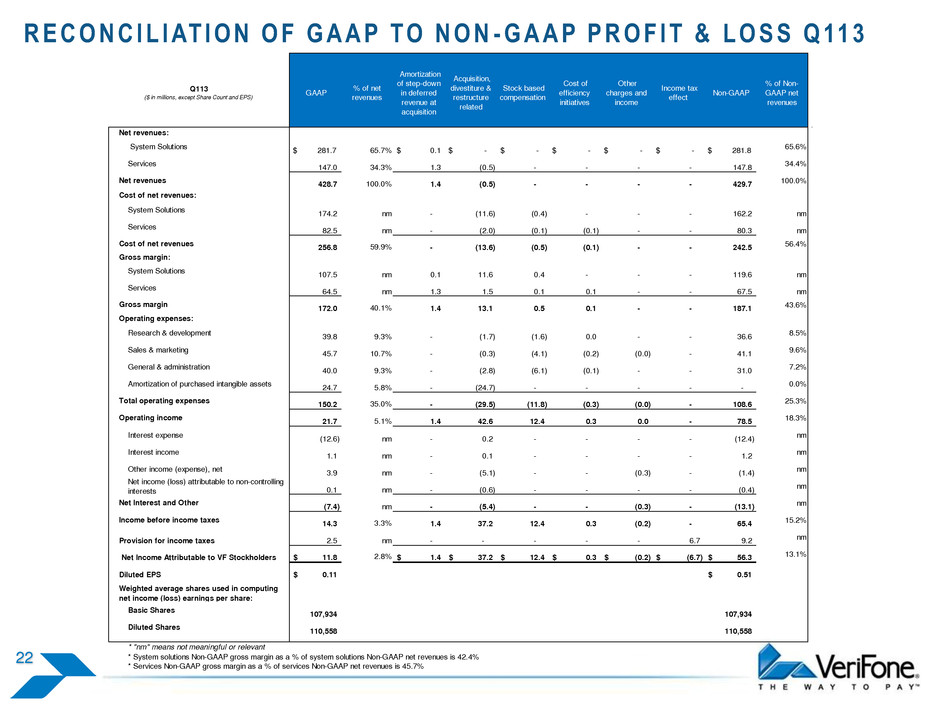
R E C O N C I L I AT I O N O F G A A P T O N O N - G A A P P R O F I T & L O S S Q 11 3 22 GAAP % of net revenues Amortization of step-down in deferred revenue at acquisition Acquisition, divestiture & restructure related Stock based compensation Cost of efficiency initiatives Other charges and income Income tax effect Non-GAAP % of Non- GAAP net revenues Net revenues: System Solutions $ 281.7 65.7% $ 0.1 $ - $ - $ - $ - $ - $ 281.8 65.6% Services 147.0 34.3% 1.3 (0.5) - - - - 147.8 34.4% Net revenues 428.7 100.0% 1.4 (0.5) - - - - 429.7 100.0% Cost of net revenues: System Solutions 174.2 nm - (11.6) (0.4) - - - 162.2 nm Services 82.5 nm - (2.0) (0.1) (0.1) - - 80.3 nm Cost of net revenues 256.8 59.9% - (13.6) (0.5) (0.1) - - 242.5 56.4% Gross margin: System Solutions 107.5 nm 0.1 11.6 0.4 - - - 119.6 nm Services 64.5 nm 1.3 1.5 0.1 0.1 - - 67.5 nm Gross margin 172.0 40.1% 1.4 13.1 0.5 0.1 - - 187.1 43.6% Operating expenses: Research & development 39.8 9.3% - (1.7) (1.6) 0.0 - - 36.6 8.5% Sales & marketing 45.7 10.7% - (0.3) (4.1) (0.2) (0.0) - 41.1 9.6% General & administration 40.0 9.3% - (2.8) (6.1) (0.1) - - 31.0 7.2% Amortization of purchased intangible assets 24.7 5.8% - (24.7) - - - - - 0.0% Total operating expenses 150.2 35.0% - (29.5) (11.8) (0.3) (0.0) - 108.6 25.3% Operating income 21.7 5.1% 1.4 42.6 12.4 0.3 0.0 - 78.5 18.3% Interest expense (12.6) nm - 0.2 - - - - (12.4) nm Interest income 1.1 nm - 0.1 - - - - 1.2 nm Other income (expense), net 3.9 nm - (5.1) - - (0.3) - (1.4) nm Net income (loss) attributable to non-controlling interests 0.1 nm - (0.6) - - - - (0.4) nm Net Interest and Other (7.4) nm - (5.4) - - (0.3) - (13.1) nm Income before income taxes 14.3 3.3% 1.4 37.2 12.4 0.3 (0.2) - 65.4 15.2% Provision for income taxes 2.5 nm - - - - - 6.7 9.2 nm Net Income Attributable to VF Stockholders 11.8$ 2.8% 1.4$ 37.2$ 12.4$ 0.3$ (0.2)$ (6.7)$ 56.3$ 13.1% Diluted EPS 0.11$ 0.51$ Basic Shares 107,934 107,934 Diluted Shares 110,558 110,558 * "nm" means not meaningful or relevant * System solutions Non-GAAP gross margin as a % of system solutions Non-GAAP net revenues is 42.4% * Services Non-GAAP gross margin as a % of services Non-GAAP net revenues is 45.7% Q113 ($ in millions, except Share Count and EPS) Weighted average shares used in computing net income (loss) earnings per share:

R E C O N C I L I AT I O N O F G A A P T O N O N - G A A P P R O F I T & L O S S Q 4 1 2 23 GAAP % of net revenues Amortization of step-down in deferred revenue at acquisition Acquisition, divestiture & restructure related Stock based compensation Cost of efficiency initiatives Other charges and income Income tax effect Non-GAAP % of Non- GAAP net revenues Net revenues: System Solutions $ 335.7 69.2% $ 0.5 $ - $ - $ - $ - $ - $ 336.2 68.8% Services 149.7 30.8% 2.8 (0.1) - - - - 152.3 31.2% Net revenues 485.4 100.0% 3.3 (0.1) - - - - 488.6 100.0% Cost of net revenues: System Solutions 204.4 nm - (10.5) (0.3) (0.0) - - 193.5 nm Services 81.4 nm - (2.1) (0.3) (0.1) - - 79.0 nm Cost of net revenues 285.8 58.9% - (12.6) (0.6) (0.1) - - 272.5 55.8% Gross margin: System Solutions 131.3 nm 0.5 10.5 0.3 0.0 - - 142.7 nm Services 68.2 nm 2.8 2.0 0.3 0.1 - - 73.4 nm Gross margin 199.5 41.1% 3.3 12.5 0.6 0.1 - - 216.1 44.2% Operating expenses: Research & development 40.4 8.3% - (2.0) (2.2) (0.7) - - 35.5 7.3% Sales & marketing 47.4 9.8% - (1.5) (1.9) (0.6) (1.6) - 41.7 8.5% General & administration 37.0 7.6% - (3.4) (5.7) (0.1) - - 27.9 5.7% Amortization of purchased intangible assets 23.2 4.8% - (23.2) - - - - - 0.0% Total operating expenses 148.1 30.5% - (30.1) (9.8) (1.4) (1.6) - 105.1 21.5% Operating income 51.5 10.6% 3.3 42.6 10.4 1.6 1.6 - 110.9 22.7% Interest expense (13.2) nm - (2.6) - - 3.2 - (12.7) nm Interest income 1.1 nm - 0.1 - - - - 1.2 nm Other income (expense), net 2.6 nm - (5.5) - - 2.0 - (0.9) nm Net income (loss) attributable to non-controlling interests (0.9) nm - (0.7) - - - - (1.6) nm Net Interest and Other (10.4) nm - (8.6) - - 5.1 - (13.9) nm Income before income taxes 41.1 8.5% 3.3 34.0 10.4 1.6 6.8 - 97.1 19.9% Provision for income taxes 14.1 nm - - - - - (0.5) 13.6 nm Net Income Attributable to VF Stockholders 27.0$ 5.6% 3.3$ 34.0$ 10.4$ 1.6$ 6.8$ 0.5$ 83.5$ 17.1% Diluted EPS 0.24$ 0.76$ Basic Shares 107,718 107,718 Diluted Shares 110,342 110,342 * "nm" means not meaningful or relevant * System solutions Non-GAAP gross margin as a % of system solutions Non-GAAP net revenues is 42.4% * Services Non-GAAP gross margin as a % of services Non-GAAP net revenues is 48.2% Weighted average shares used in computing net income (loss) earnings per share: Q412 ($ in millions, except Share Count and EPS)
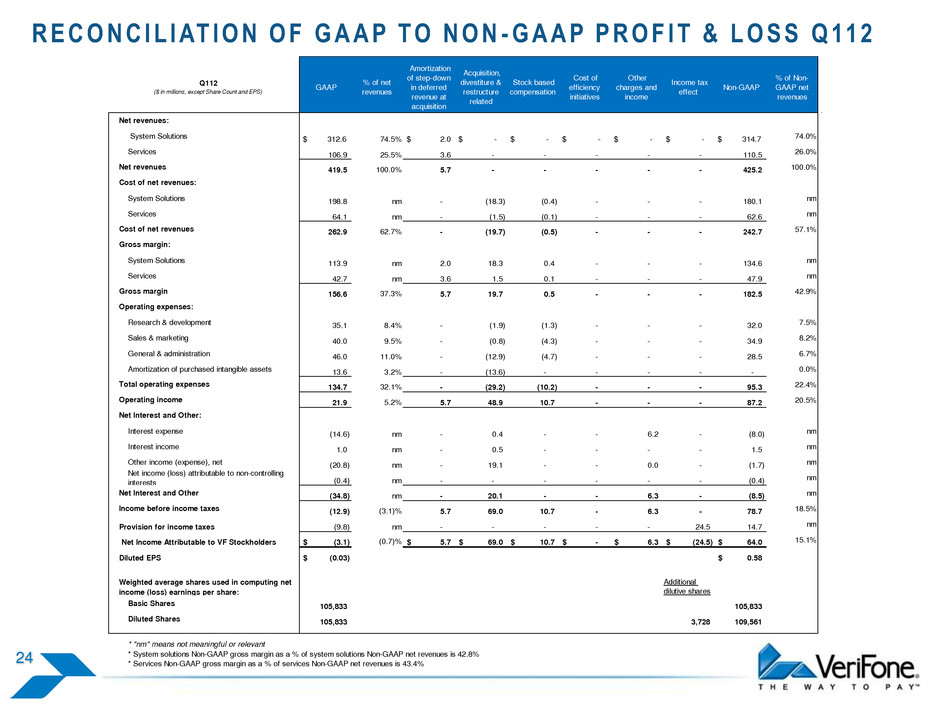
R E C O N C I L I AT I O N O F G A A P T O N O N - G A A P P R O F I T & L O S S Q 11 2 24 GAAP % of net revenues Amortization of step-down in deferred revenue at acquisition Acquisition, divestiture & restructure related Stock based compensation Cost of efficiency initiatives Other charges and income Income tax effect Non-GAAP % of Non- GAAP net revenues Net revenues: System Solutions $ 312.6 74.5% $ 2.0 $ - $ - $ - $ - $ - $ 314.7 74.0% Services 106.9 25.5% 3.6 - - - - - 110.5 26.0% Net revenues 419.5 100.0% 5.7 - - - - - 425.2 100.0% Cost of net revenues: System Solutions 198.8 nm - (18.3) (0.4) - - - 180.1 nm Services 64.1 nm - (1.5) (0.1) - - - 62.6 nm Cost of net revenues 262.9 62.7% - (19.7) (0.5) - - - 242.7 57.1% Gross margin: System Solutions 113.9 nm 2.0 18.3 0.4 - - - 134.6 nm Services 42.7 nm 3.6 1.5 0.1 - - - 47.9 nm Gross margin 156.6 37.3% 5.7 19.7 0.5 - - - 182.5 42.9% Operating expenses: Research & development 35.1 8.4% - (1.9) (1.3) - - - 32.0 7.5% Sales & marketing 40.0 9.5% - (0.8) (4.3) - - - 34.9 8.2% General & administration 46.0 11.0% - (12.9) (4.7) - - - 28.5 6.7% Amortization of purchased intangible assets 13.6 3.2% - (13.6) - - - - - 0.0% Total operating expenses 134.7 32.1% - (29.2) (10.2) - - - 95.3 22.4% Operating income 21.9 5.2% 5.7 48.9 10.7 - - - 87.2 20.5% Net Interest and Other: Interest expense (14.6) nm - 0.4 - - 6.2 - (8.0) nm Interest income 1.0 nm - 0.5 - - - - 1.5 nm Other income (expense), net (20.8) nm - 19.1 - - 0.0 - (1.7) nm Net income (loss) attributable to non-controlling interests (0.4) nm - - - - - - (0.4) nm Net Interest and Other (34.8) nm - 20.1 - - 6.3 - (8.5) nm Income before income taxes (12.9) (3.1)% 5.7 69.0 10.7 - 6.3 - 78.7 18.5% Provision for income taxes (9.8) nm - - - - - 24.5 14.7 nm Net Income Attributable to VF Stockholders (3.1)$ (0.7)% 5.7$ 69.0$ 10.7$ -$ 6.3$ (24.5)$ 64.0$ 15.1% Diluted EPS (0.03)$ 0.58$ Additional dilutive shares Basic Shares 105,833 105,833 Diluted Shares 105,833 3,728 109,561 * "nm" means not meaningful or relevant * System solutions Non-GAAP gross margin as a % of system solutions Non-GAAP net revenues is 42.8% * Services Non-GAAP gross margin as a % of services Non-GAAP net revenues is 43.4% Weighted average shares used in computing net income (loss) earnings per share: Q112 ($ in millions, except Share Count and EPS)
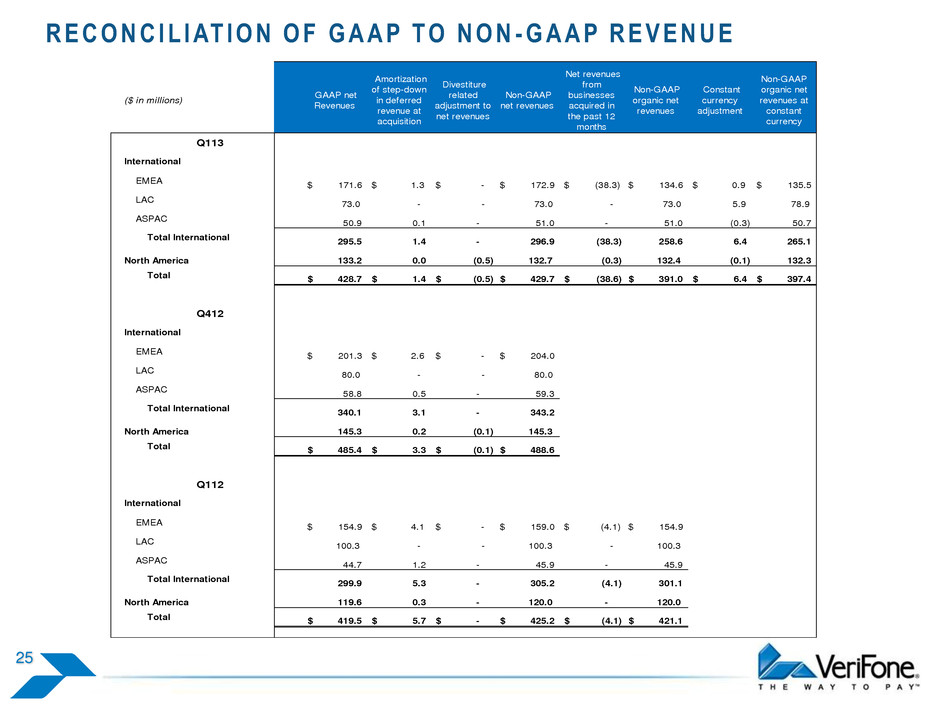
R E C O N C I L I AT I O N O F G A A P T O N O N - G A A P R E V E N U E 25 ($ in millions) GAAP net Revenues Amortization of step-down in deferred revenue at acquisition Divestiture related adjustment to net revenues Non-GAAP net revenues Net revenues from businesses acquired in the past 12 months Non-GAAP organic net revenues Constant currency adjustment Non-GAAP organic net revenues at constant currency Q113 International EMEA $ 171.6 $ 1.3 $ - $ 172.9 $ (38.3) $ 134.6 $ 0.9 $ 135.5 LAC 73.0 - - 73.0 - 73.0 5.9 78.9 ASPAC 50.9 0.1 - 51.0 - 51.0 (0.3) 50.7 Total International 295.5 1.4 - 296.9 (38.3) 258.6 6.4 265.1 North America 133.2 0.0 (0.5) 132.7 (0.3) 132.4 (0.1) 132.3 Total 428.7$ 1.4$ (0.5)$ 429.7$ (38.6)$ 391.0$ 6.4$ 397.4$ Q412 International EMEA $ 201.3 $ 2.6 $ - $ 204.0 LAC 80.0 - - 80.0 ASPAC 58.8 0.5 - 59.3 Total International 340.1 3.1 - 343.2 North America 145.3 0.2 (0.1) 145.3 Total 485.4$ 3.3$ (0.1)$ 488.6$ Q112 International EMEA $ 154.9 $ 4.1 $ - $ 159.0 $ (4.1) $ 154.9 LAC 100.3 - - 100.3 - 100.3 ASPAC 44.7 1.2 - 45.9 - 45.9 Total International 299.9 5.3 - 305.2 (4.1) 301.1 North America 119.6 0.3 - 120.0 - 120.0 Total 419.5$ 5.7$ -$ 425.2$ (4.1)$ 421.1$
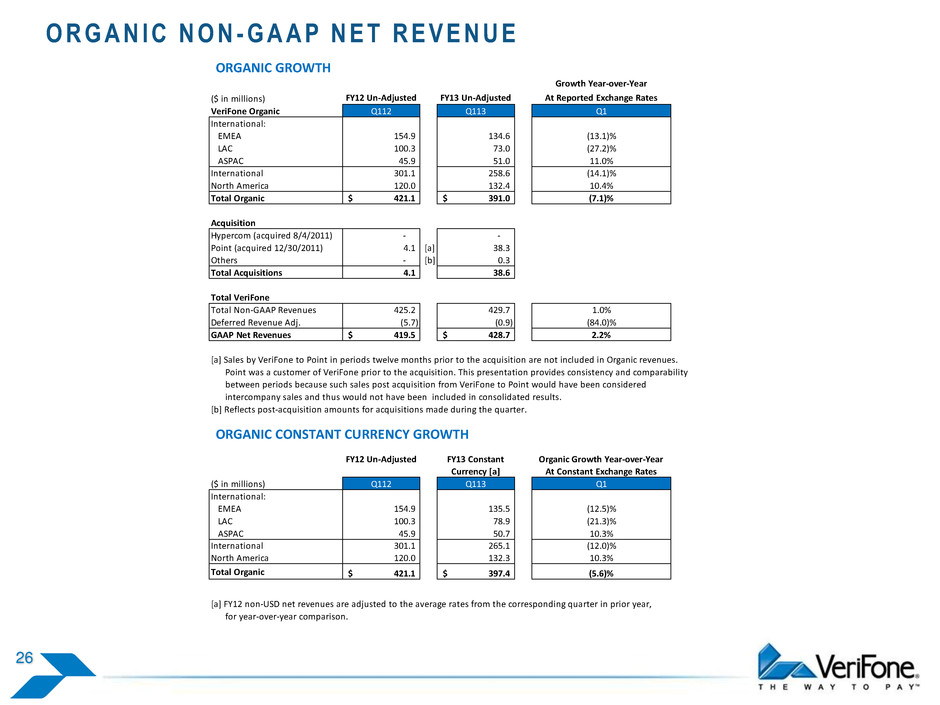
O R G A N I C N O N - G A A P N E T R E V E N U E 26 ORGANIC GROWTH ($ in millions) VeriFone Organic Q112 Q113 Q1 International: EMEA 154.9 134.6 (13.1)% LAC 100.3 73.0 (27.2)% ASPAC 45.9 51.0 11.0% International 301.1 258.6 (14.1)% North America 120.0 132.4 10.4% Total Organic 421.1$ 391.0$ (7.1)% Acquisition Hypercom (acquired 8/4/2011) - - Point (acquired 12/30/2011) 4.1 [a] 38.3 Others - [b] 0.3 Total Acquisitions 4.1 38.6 Total VeriFone Total Non-GAAP Revenues 425.2 429.7 1.0% Deferred Revenue Adj. (5.7) (0.9) (84.0)% GAAP Net Revenues 419.5$ 428.7$ 2.2% [a] Sales by VeriFone to Point in periods twelve months prior to the acquisition are not included in Organic revenues. Point was a customer of VeriFone prior to the acquisition. This presentation provides consistency and comparability between periods because such sales post acquisition from VeriFone to Point would have been considered intercompany sales and thus would not have been included in consolidated results. [b] Reflects post-acquisition amounts for acquisitions made during the quarter. ORGANIC CONSTANT CURRENCY GROWTH FY12 Un-Adjusted Organic Growth Year-over-Year At Constant Exchange Rates ($ in millions) Q112 Q113 Q1 International: EMEA 154.9 135.5 (12.5)% LAC 100.3 78.9 (21.3)% ASPAC 45.9 50.7 10.3% International 301.1 265.1 (12.0)% North America 120.0 132.3 10.3% Total Organic 421.1$ 397.4$ (5.6)% [a] FY12 non-USD net revenues are adjusted to the average rates from the corresponding quarter in prior year, for year-over-year comparison. FY13 Constant Currency [a] Growth Year-over-Year FY12 Un-Adjusted FY13 Un-Adjusted At Reported Exchange Rates

C A S H F L O W O U T L O O K F O R F Y 1 3 U P D AT E D M A R C H 5 , 2 0 1 3 27 FY13 Outlook Comment Non-GAAP EPS $1.90 – 2.10 Range of guidance Non-GAAP Net Income $210 – 232 million Approximately 110.5 million shares + Depreciation & Amortization ~ 60 million Amount deducted from Non-GAAP Inc. (excludes amort. of intangibles) - Acquisition Integration, & Other Costs ~ (20) million Assumes no material new acquisitions beyond ENZ and Sektor +/- Working Capital Use ~ 0 million Working Capital will fluctuate with timing of activities = Cash flow from Operations * 250 – 270 million - Capital Expenditures ~ (80) million Spending for maintenance PP&E & Revenue Generating Assets ** = Free Cash Flow $170 – $190 million * Cash flow from Operations is net cash provided by operating activities as presented under GAAP. ** Capital Expenditures is comprised of approximately $35M for Maintenance PP&E and approximately $45M for Revenue Generating Assets in the Payment-as-a-Service (Point), Taxi, and Gas pump businesses. The recurring and high-margin revenue generated from these investments are expected to provide ROIs in excess of 20%.

THANK YOU


