
FINANCIAL RESULTS F O R T H E Q U A R T E R E N D E D A p r i l 3 0 , 2 0 1 3 Exhibit 99.2
F O R WA R D - L O O K I N G S TAT E M E N T S 2 Today’s discussion may include “forward-looking statements” within the meaning of the Private Securities Litigation Reform Act of 1995. Such statements relate to future events and expectations and involve known and unknown risks and uncertainties. VeriFone’s actual results or actions may differ materially from those projected in the forward-looking statements. For a summary of the specific risk factors that could cause results to differ materially from those expressed in the forward-looking statements, please refer to VeriFone’s filings with the Securities and Exchange Commission, including its annual report on Form 10-K and quarterly reports on Form 10-Q. VeriFone is under no obligation to, and expressly disclaims any obligation to, update or alter its forward-looking statements, whether as a result of new information, future events, changes in assumptions or otherwise.
N O N - G A A P F I N A N C I A L M E A S U R E S 3 With respect to any Non-GAAP financial measures presented in the information, reconciliations of Non-GAAP to GAAP financial measures may be found in VeriFone’s quarterly earnings release as filed with the Securities and Exchange Commission as well as the Appendix to these slides. Management uses Non-GAAP financial measures only in addition to and in conjunction with results presented in accordance with GAAP. Management believes that these Non-GAAP financial measures help it to evaluate VeriFone’s performance and to compare VeriFone’s current results with those for prior periods as well as with the results of peer companies. These Non-GAAP financial measures contain limitations and should be considered as a supplement to, and not as a substitute for, or superior to, disclosures made in accordance with GAAP.

INTRODUCTION Richard McGinn, Interim CEO
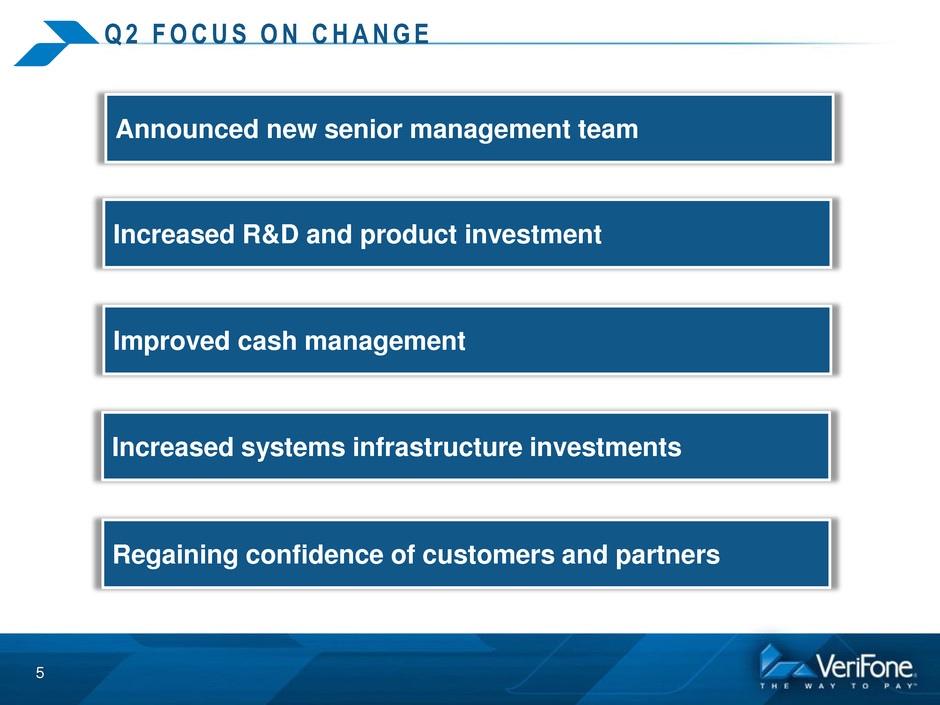
Q 2 F O C U S O N C H A N G E 5 Announced new senior management team Increased R&D and product investment Improved cash management Increased systems infrastructure investments Regaining confidence of customers and partners

FINANCIAL RESULTS AND GUIDANCE Marc Rothman, CFO
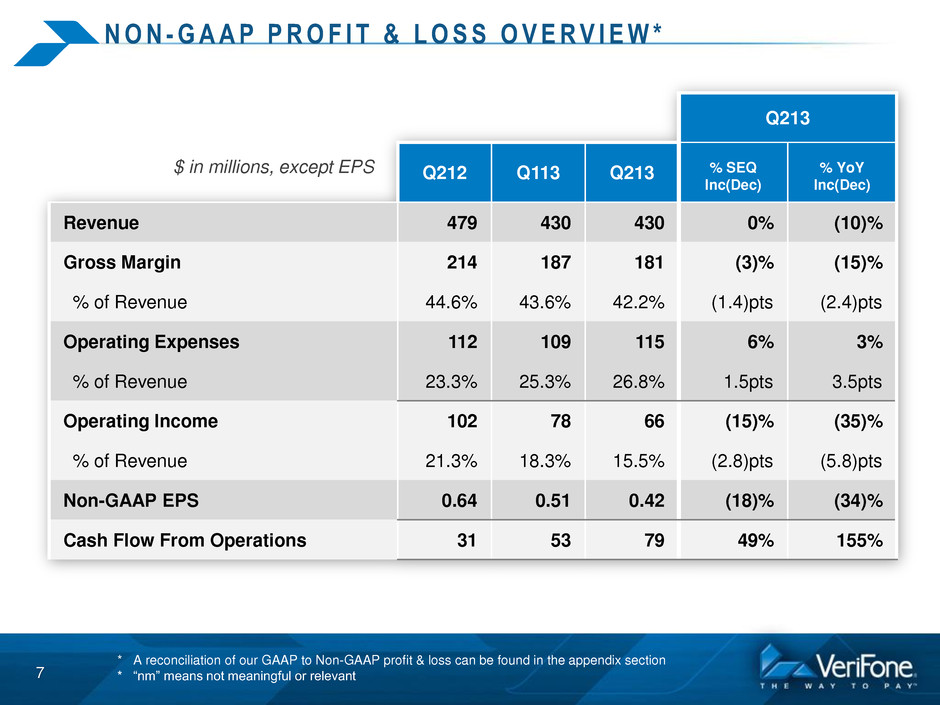
N O N - G A A P P R O F I T & L O S S O V E R V I E W * 7 * A reconciliation of our GAAP to Non-GAAP profit & loss can be found in the appendix section * “nm” means not meaningful or relevant Q213 Q212 Q113 Q213 % SEQ Inc(Dec) % YoY Inc(Dec) Revenue 479 430 430 0% (10)% Gross Margin 214 187 181 (3)% (15)% % of Revenue 44.6% 43.6% 42.2% (1.4)pts (2.4)pts Operating Expenses 112 109 115 6% 3% % of Revenue 23.3% 25.3% 26.8% 1.5pts 3.5pts Operating Income 102 78 66 (15)% (35)% % of Revenue 21.3% 18.3% 15.5% (2.8)pts (5.8)pts Non-GAAP EPS 0.64 0.51 0.42 (18)% (34)% Cash Flow From Operations 31 53 79 49% 155% $ in millions, except EPS
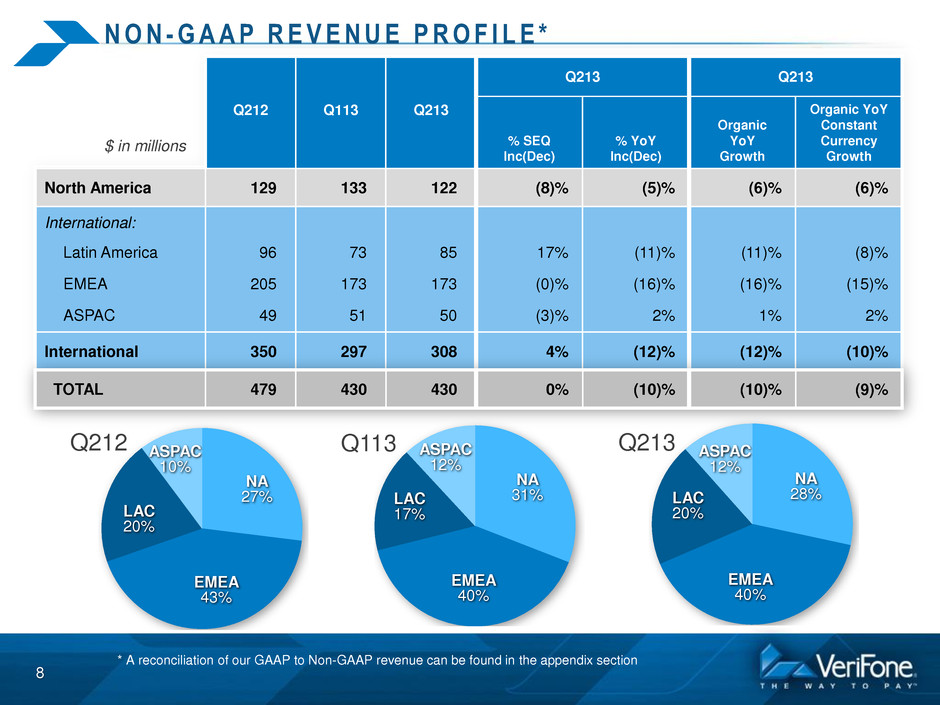
N O N - G A A P R E V E N U E P R O F I L E * 8 * A reconciliation of our GAAP to Non-GAAP revenue can be found in the appendix section Q213 Q213 Q212 Q4112 Q212 % SEQ Inc(DEC) % YoY Inc(DEC) Organic YoY Growth Organic YoY Constant Currency Growth International: EMEA 159.0 204.0 172.9 (15.2)% 8.7% (13.1)% (12.5)% LAC 100.3 80.0 73.0 (8.7)% (27.2)% (27.2)% (21.3)% ASPAC 45.9 59.3 51.0 (14.0)% 11.0% 11.0% 10.3% International 305.2 343.2 296.9 (13.5)% (2.7)% (14.1)% (12.0)% North America 120.0 145.3 132.7 (8.7)% 10.6% 10.4% 10.3% TOTAL 425.2 488.6 429.7 (12.1)% 1.0% (7.1)% (5.6)% Q113 Q213 Q212 NA 27% ASPAC 10% LAC 20% EMEA 43% NA 31% ASPAC 12% LAC 17% EMEA 40% NA 28% ASPAC 12% LAC 20% EMEA 40% 213 213 Q212 Q113 Q213 Inc(Dec) Inc(Dec) r ani r t r sta t rr r t North America 129 133 122 (8)% (5)% (6)% (6)% International: Latin America 96 73 85 17% (11)% (11)% (8)% EMEA 205 173 173 (0)% (16)% (16)% (15)% ASPAC 49 51 50 (3) 2 1 2 International 35 297 308 4 (12) (12) (10) $ in millions 479 430 430 0 (10) (10 (9)
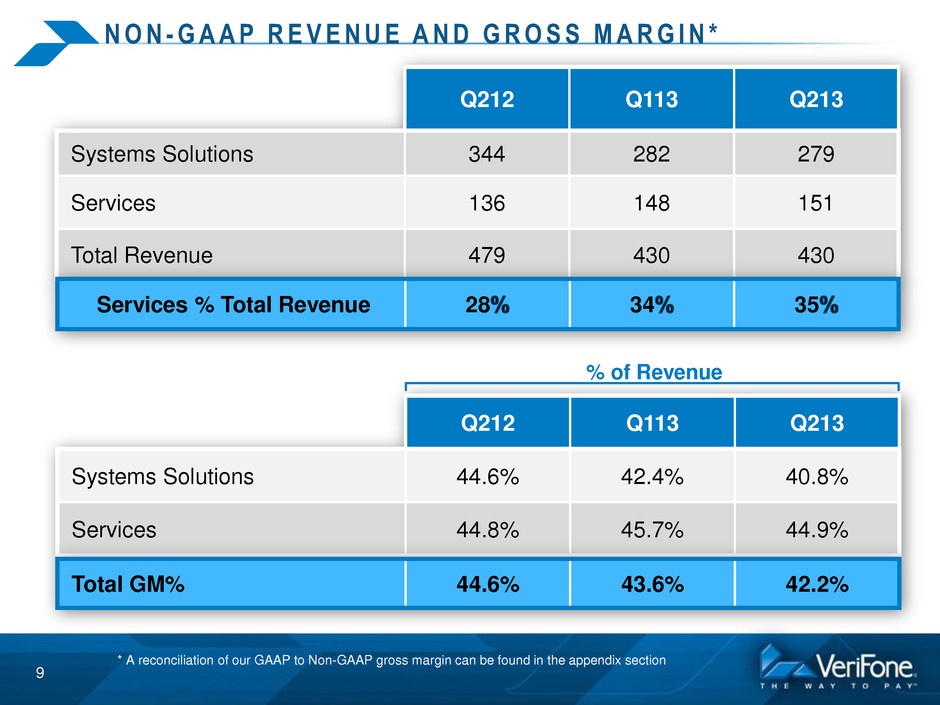
N O N - G A A P R E V E N U E A N D G R O S S M A R G I N * 9 * A reconciliation of our GAAP to Non-GAAP gross margin can be found in the appendix section Q212 Q113 Q213 Systems Solutions 44.6% 42.4% 40.8% Services 44.8% 45.7% 44.9% % of Revenue Total GM% 44.6% 43.6% 42.2% Q212 Q113 Q213 Systems Solutions 344 282 279 Services 136 148 151 Total Revenue 479 430 430 Services % Total Revenue 28 34 35

N O N - G A A P O P E R AT I N G E X P E N S E S * 10 * A reconciliation of our GAAP to Non-GAAP operating expenses can be found in the appendix section Q212 Q113 Q213 Research and Development 36 37 40 % of Revenue 7% 9% 9% Sales and Marketing 41 41 42 % of Revenue 9% 10% 10% General and Administrative 35 31 33 % of Revenue 7% 7% 8% Total Operating Expenses % of Revenue 23% 25% 27% $ in millions We expect operating expenses to increase to ~$130M per quarter 112 109 115
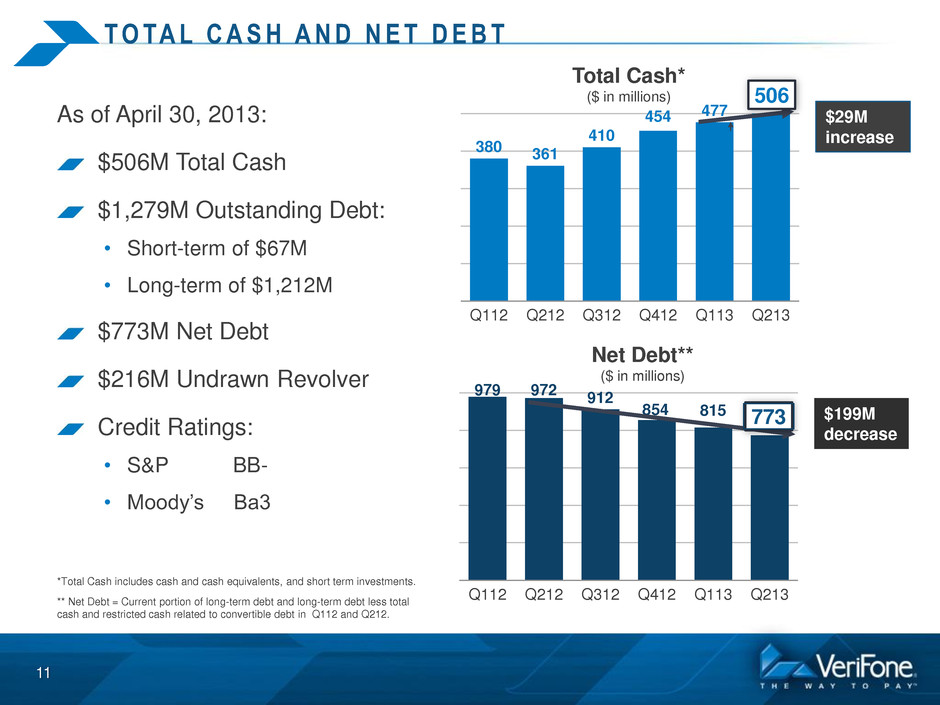
T O TA L C A S H A N D N E T D E B T 11 As of April 30, 2013: $506M Total Cash $1,279M Outstanding Debt: • Short-term of $67M • Long-term of $1,212M $773M Net Debt $216M Undrawn Revolver Credit Ratings: • S&P BB- • Moody’s Ba3 *Total Cash includes cash and cash equivalents, and short term investments. ** Net Debt = Current portion of long-term debt and long-term debt less total cash and restricted cash related to convertible debt in Q112 and Q212. 380 361 410 454 477 Q112 Q212 Q312 Q412 Q113 Q213 $29M increase Total Cash* ($ in millions) 979 972 912 854 815 773 Q112 Q212 Q312 Q412 Q113 Q213 $199M decrease Net Debt** ($ in millions) 506 7

B A L A N C E S H E E T S E L E C T D ATA 12 $ in millions, except days Q212 Q113 $ Days $ Days Accounts Receivables, net 337 63 355 74 Inventories, net 162 57 189 68 Accounts Payable 138 47 155 57 Cash Conversion Cycle 73 85 Q213 $ Days 316 66 181 67 151 55 78 Note: Accounts Receivable Days Sales Outstanding is calculated as Net Accounts Receivable divided by Total Non-GAAP Revenue / 90 days Days in Inventory is calculated as Average Net Inventory divided by Total Non-GAAP Cost of Goods Sold / 90 days Days in Accounts Payable is calculated as Accounts Payable divided by Total Non-GAAP Cost of Goods Sold / 90 days Cash Conversion Cycle is calculated as Accounts Receivable Days Sales Outstanding plus Days in Inventory less Days in Accounts Payable
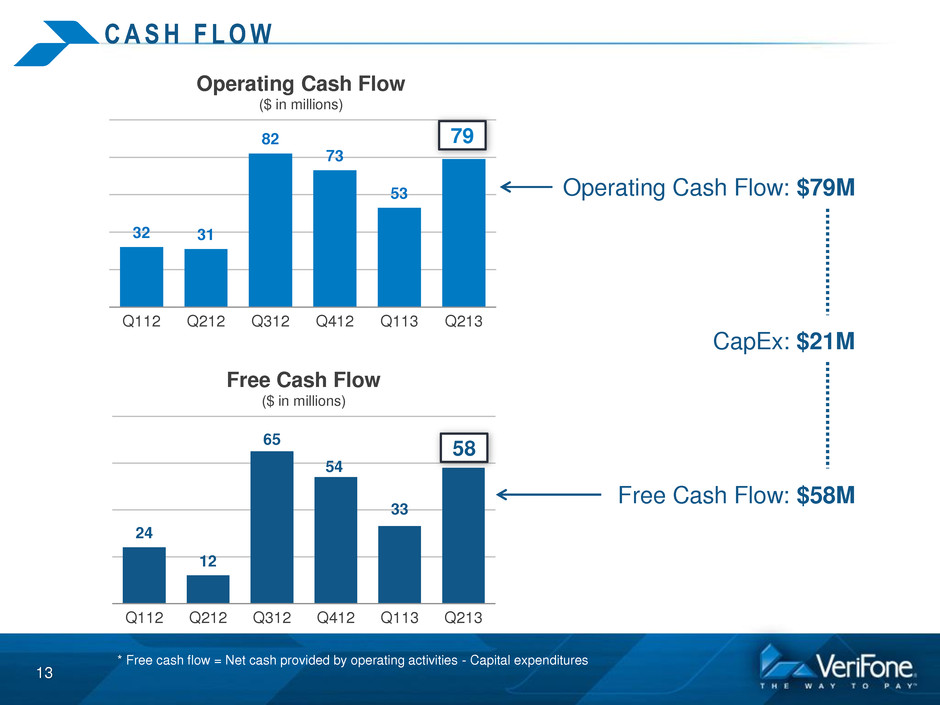
C A S H F L O W 13 * Free cash flow = Net cash provided by operating activities - Capital expenditures 32 31 82 73 53 79 Q112 Q212 Q312 Q412 Q113 Q213 Operating Cash Flow ($ in millions) 24 12 65 54 33 Q112 Q212 Q312 Q412 Q113 Q213 Free Cash Flow ($ in millions) 79 58 Operating Cash Flow: $79M Free Cash Flow: $58M CapEx: $21M
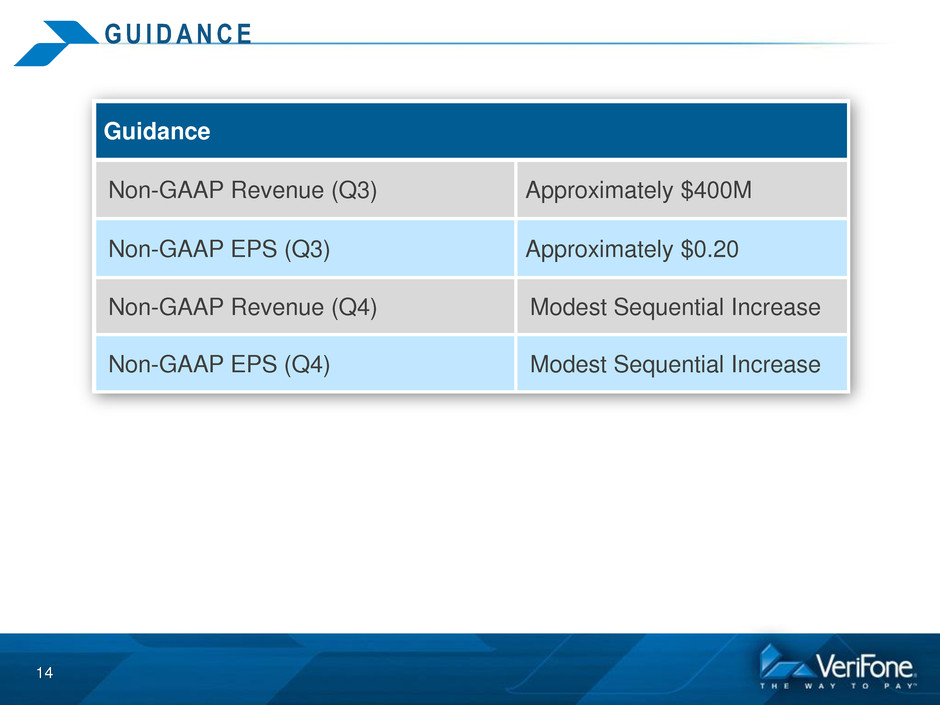
G U I D A N C E 14 Guidance Non-GAAP Revenue (Q3) Approximately $400M Non-GAAP EPS (Q3) Approximately $0.20 Non-GAAP Revenue (Q4) Modest Sequential Increase Non-GAAP EPS (Q4) Modest Sequential Increase

Q & A SESSION

APPENDIX
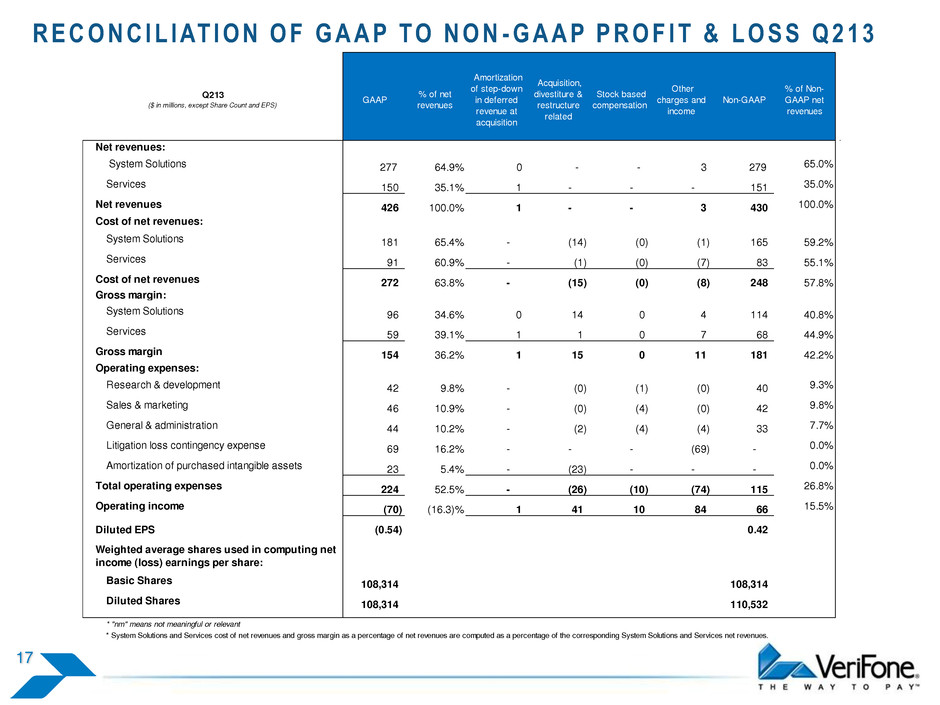
R E C O N C I L I AT I O N O F G A A P T O N O N - G A A P P R O F I T & L O S S Q 2 1 3 17 GAAP % of net revenues Amortization of step-down in deferred revenue at acquisition Acquisition, divestiture & restructure related Stock based compensation Other charges and income Non-GAAP % of Non- GAAP net revenues Net revenues: System Solutions 277 64.9% 0 - - 3 279 65.0% Services 150 35.1% 1 - - - 151 35.0% Net revenues 426 100.0% 1 - - 3 430 100.0% Cost of net revenues: System Solutions 181 65.4% - (14) (0) (1) 165 59.2% Services 91 60.9% - (1) (0) (7) 83 55.1% Cost of net revenues 272 63.8% - (15) (0) (8) 248 57.8% Gross margin: System Solutions 96 34.6% 0 14 0 4 114 40.8% Services 59 39.1% 1 1 0 7 68 44.9% Gross margin 154 36.2% 1 15 0 11 181 42.2% Operating expenses: Research & development 42 9.8% - (0) (1) (0) 40 9.3% Sales & marketing 46 10.9% - (0) (4) (0) 42 9.8% General & administration 44 10.2% - (2) (4) (4) 33 7.7% Litigation loss contingency expense 69 16.2% - - - (69) - 0.0% Amortization of purchased intangible assets 23 5.4% - (23) - - - 0.0% Total operating expenses 224 52.5% - (26) (10) (74) 115 26.8% Operating income (70) (16.3)% 1 41 10 84 66 15.5% Diluted EPS (0.54) 0.42 Basic Shares 108,314 108,314 Diluted Shares 108,314 110,532 * "nm" means not meaningful or relevant * System Solutions and Services cost of net revenues and gross margin as a percentage of net revenues are computed as a percentage of the corresponding System Solutions and Services net revenues. Q213 ($ in millions, except Share Count and EPS) Weighted average shares used in computing net income (loss) earnings per share:

R E C O N C I L I AT I O N O F G A A P T O N O N - G A A P P R O F I T & L O S S Q 11 3 18 GAAP % of net revenues Amortization of step-down in deferred revenue at acquisition Acquisition, divestiture & restructure related Stock based compensation Non-GAAP % of Non- GAAP net revenues Net revenues: System Solutions 282 65.7% 0 - - 282 65.6% Services 147 34.3% 1 (1) - 148 34.4% Net revenues 429 100.0% 1 (1) - 430 100.0% Cost of net revenues: System Solutions 174 61.9% - (12) (0) 162 57.6% Services 83 56.1% - (2) (0) 80 54.3% Cost of net revenues 257 59.9% - (14) (1) 243 56.4% Gross margin: System Solutions 107 38.1% 0 12 0 120 42.4% Services 64 43.9% 1 2 0 68 45.7% Gross margin 172 40.1% 1 13 1 187 43.6% Operating expenses: Research & development 40 9.3% - (2) (2) 37 8.5% Sales & marketing 46 10.7% - (0) (4) 41 9.6% General & administration 40 9.3% - (3) (6) 31 7.2% Amortization of purchased intangible assets 25 5.8% - (25) - - 0.0% Total operating expenses 150 35.0% - (29) (12) 109 25.3% Operating income 22 5.1% 1 43 12 78 18.3% Diluted EPS 0.11 0.51 Basic Shares 107,934 107,934 Diluted Shares 110,558 110,558 * "nm" means not meaningful or relevant * System Solutions and Services cost of net revenues and gross margin as a percentage of net revenues are computed as a percentage of the corresponding System Solutions and Services net revenues. Q113 ($ in millions, except Share Count and EPS) Weighted average shares used in computing net income (loss) earnings per share:
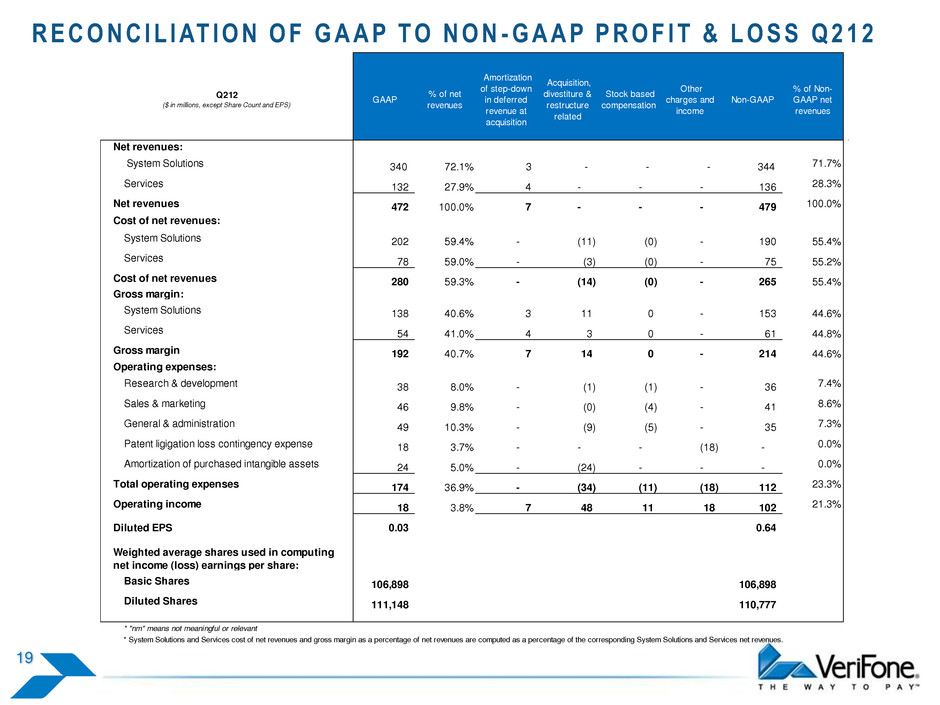
R E C O N C I L I AT I O N O F G A A P T O N O N - G A A P P R O F I T & L O S S Q 2 1 2 19 GAAP % of net revenues Amortization of step-down in deferred revenue at acquisition Acquisition, divestiture & restructure related Stock based compensation Other charges and income Non-GAAP % of Non- GAAP net revenues Net revenues: System Solutions 340 72.1% 3 - - - 344 71.7% Services 132 27.9% 4 - - - 136 28.3% Net revenues 472 100.0% 7 - - - 479 100.0% Cost of net revenues: System Solutions 202 59.4% - (11) (0) - 190 55.4% Services 78 59.0% - (3) (0) - 75 55.2% Cost of net revenues 280 59.3% - (14) (0) - 265 55.4% Gross margin: System Solutions 138 40.6% 3 11 0 - 153 44.6% Services 54 41.0% 4 3 0 - 61 44.8% Gross margin 192 40.7% 7 14 0 - 214 44.6% Operating expenses: Research & development 38 8.0% - (1) (1) - 36 7.4% Sales & marketing 46 9.8% - (0) (4) - 41 8.6% General & administration 49 10.3% - (9) (5) - 35 7.3% Patent ligigation loss contingency expense 18 3.7% - - - (18) - 0.0% Amortization of purchased intangible assets 24 5.0% - (24) - - - 0.0% Total operating expenses 174 36.9% - (34) (11) (18) 112 23.3% Operating income 18 3.8% 7 48 11 18 102 21.3% Diluted EPS 0.03 0.64 Basic Shares 106,898 106,898 Diluted Shares 111,148 110,777 * "nm" means not meaningful or relevant * System Solutions and Services cost of net revenues and gross margin as a percentage of net revenues are computed as a percentage of the corresponding System Solutions and Services net revenues. Q212 ($ in millions, except Share Count and EPS) Weighted average shares used in computing net income (loss) earnings per share:

R E C O N C I L I AT I O N O F G A A P T O N O N - G A A P R E V E N U E 20 ($ in millions) GAAP net Revenues Amortization of step-down in deferred revenue at acquisition Other adjustments to net revenues Non-GAAP net revenues Net revenues from businesses acquired in the past 12 months Non-GAAP organic net revenues Constant currency adjustment Non-GAAP organic net revenues at constant currency Q213 North America 122 0 - 122 (0) 122 0 122 International Latin America 83 - 3 85 - 85 3 89 EMEA 172 1 - 173 (0) 173 2 175 ASPAC 50 0 - 50 (0) 49 0 50 International 304 1 3 308 (1) 307 6 313 Total 426 1 3 430 (1) 429 6 435 Q113 North America 133 0 (1) 133 International Latin America 73 - - 73 EMEA 172 1 - 173 ASPAC 51 0 - 51 International 296 1 - 297 Total 429 1 (1) 430 Q212 North America 129 0 - 129 - 129 International Latin America 96 - - 96 - 96 EMEA 199 6 - 205 (0) 205 ASPAC 48 1 - 49 (0) 49 International 343 7 - 350 (0) 350 Total 472 7 - 479 (0) 479
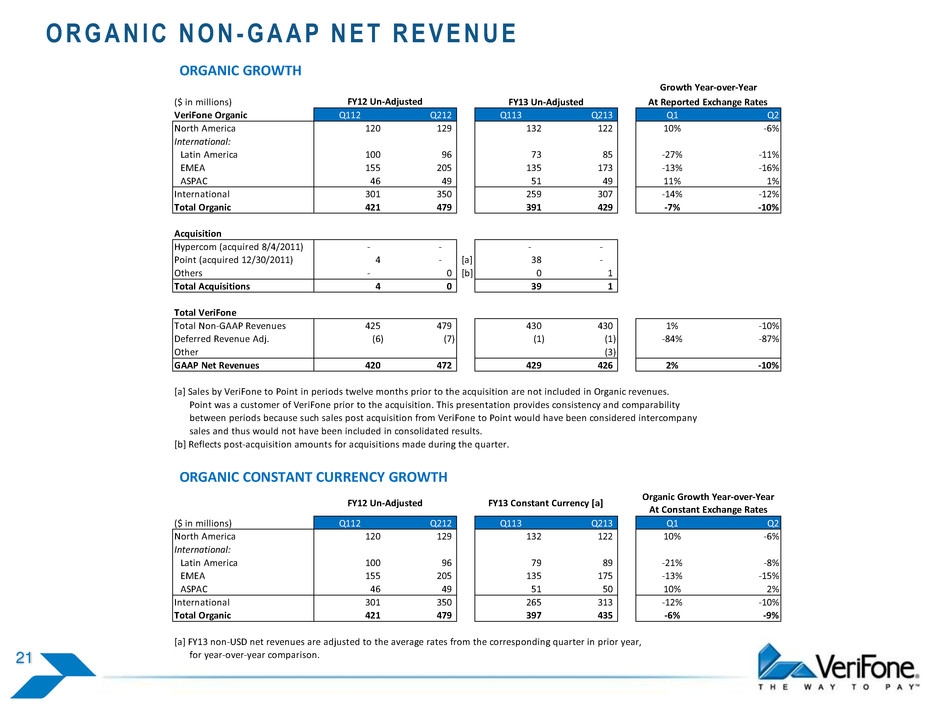
O R G A N I C N O N - G A A P N E T R E V E N U E 21 ORGANIC GROWTH ($ in millions) VeriFone Organic Q112 Q212 Q113 Q213 Q1 Q2 North America 120 129 132 122 10% -6% International: Latin America 100 96 73 85 -27% -11% EMEA 155 205 135 173 -13% -16% ASPAC 46 49 51 49 11% 1% International 301 350 259 307 -14% -12% Total Organic 421 479 391 429 -7% -10% Acquisition Hypercom (acquired 8/4/2011) - - - - Point (acquired 12/30/2011) 4 - [a] 38 - Others - 0 [b] 0 1 Total Acquisitions 4 0 39 1 Total VeriFone Total Non-GAAP Revenues 425 479 430 430 1% -10% Deferred Revenue Adj. (6) (7) (1) (1) -84% -87% Other (3) GAAP Net Revenues 420 472 429 426 2% -10% [a] Sales by VeriFone to Point in periods twelve months prior to the acquisition are not included in Organic revenues. Point was a customer of VeriFone prior to the acquisition. This presentation provides consistency and comparability between periods because such sales post acquisition from VeriFone to Point would have been considered intercompany sales and thus would not have been included in consolidated results. [b] Reflects post-acquisition amounts for acquisitions made during the quarter. ($ in millions) Q112 Q212 Q113 Q213 Q1 Q2 North America 120 129 132 122 10% -6% International: Latin America 100 96 79 89 -21% -8% EMEA 155 205 135 175 -13% -15% ASPAC 46 49 51 50 10% 2% International 301 350 265 313 -12% -10% Total Organic 421 479 397 435 -6% -9% [a] FY13 non-USD net revenues are adjusted to the average rates from the corresponding quarter in prior year, for year-over-year comparison. Growth Year-over-Year FY12 Un-Adjusted FY13 Un-Adjusted At Reported Exchange Rates ORGANIC CONSTANT CURRENCY GROWTH FY12 Un-Adjusted FY13 Constant Currency [a] Organic Growth Year-over-Year At Constant Exchange Rates

THANK YOU


