
FINANCIAL RESULTS F O R T H E F I R S T Q U A R T E R E N D E D J A N U A RY 3 1 , 2 0 1 4 Exhibit 99.2
F O R WA R D - L O O K I N G S TAT E M E N T S 2 Today’s discussion may include “forward-looking statements” within the meaning of the Private Securities Litigation Reform Act of 1995. Such statements relate to future events and expectations and involve known and unknown risks and uncertainties. VeriFone’s actual results or actions may differ materially from those projected in the forward-looking statements. For a summary of the specific risk factors that could cause results to differ materially from those expressed in the forward-looking statements, please refer to VeriFone’s filings with the Securities and Exchange Commission, including its annual report on Form 10-K and quarterly reports on Form 10-Q. VeriFone is under no obligation to, and expressly disclaims any obligation to, update or alter its forward-looking statements, whether as a result of new information, future events, changes in assumptions or otherwise.
N O N - G A A P F I N A N C I A L M E A S U R E S 3 With respect to any Non-GAAP financial measures presented in the information, reconciliations of Non-GAAP to GAAP financial measures may be found in VeriFone’s quarterly earnings release as filed with the Securities and Exchange Commission as well as the Appendix to these slides. Management uses Non-GAAP financial measures only in addition to and in conjunction with results presented in accordance with GAAP. Management believes that these Non-GAAP financial measures help it to evaluate VeriFone’s performance and to compare VeriFone’s current results with those for prior periods as well as with the results of peer companies. These Non-GAAP financial measures contain limitations and should be considered as a supplement to, and not as a substitute for, or superior to, disclosures made in accordance with GAAP.

INTRODUCTION Paul Galant, CEO
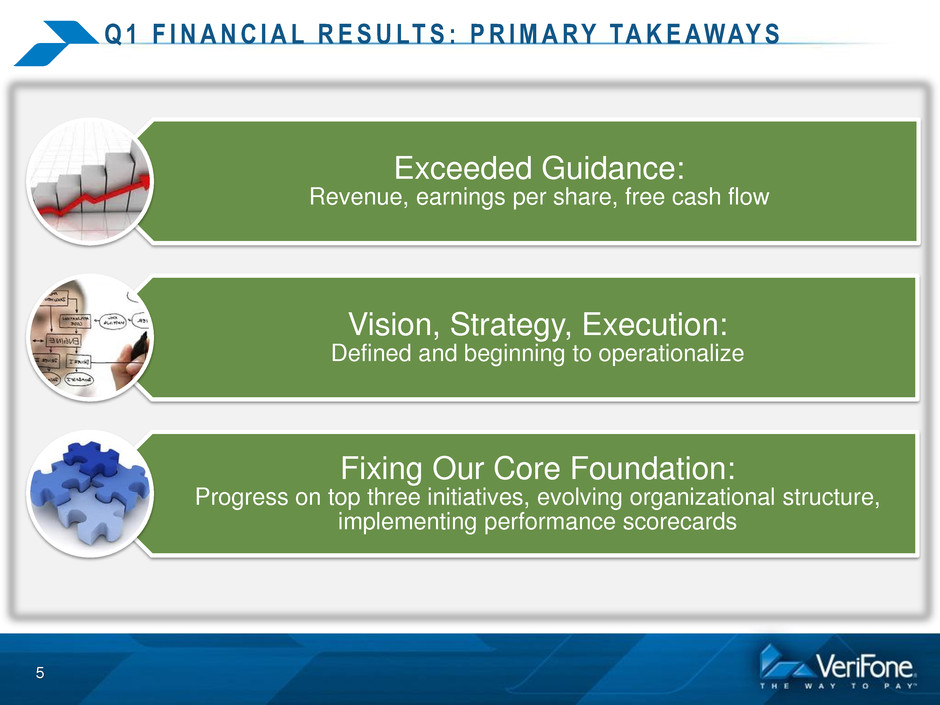
Q 1 F I N A N C I A L R E S U LT S : P R I M A RY TA K E AWAY S Exceeded Guidance: Revenue, earnings per share, free cash flow Vision, Strategy, Execution: Defined and beginning to operationalize Fixing Our Core Foundation: Progress on top three initiatives, evolving organizational structure, implementing performance scorecards 5
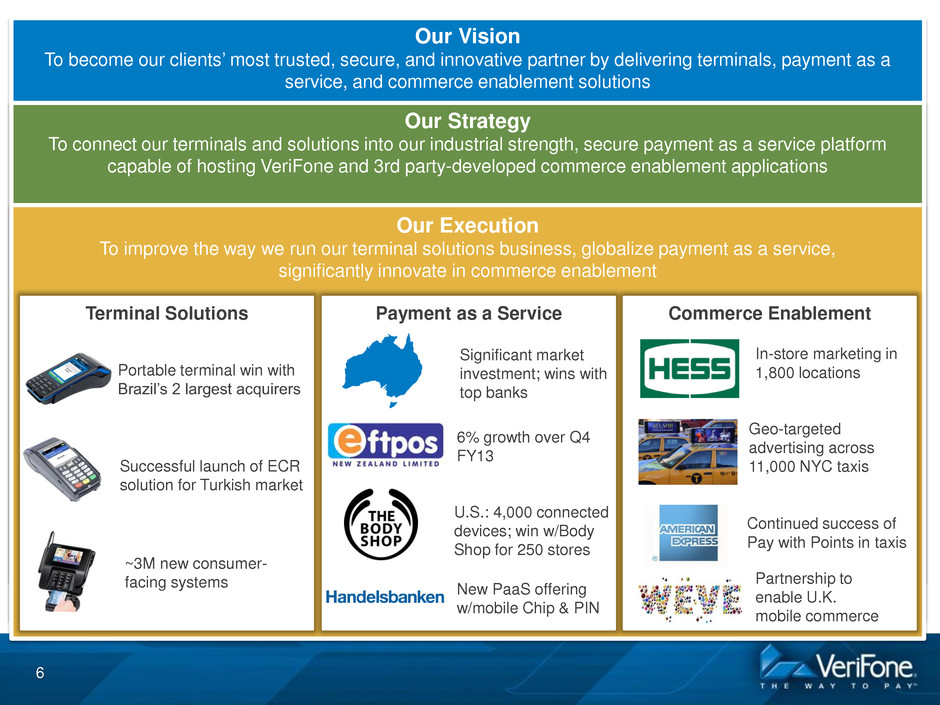
Our Vision To become our clients’ most trusted, secure, and innovative partner by delivering terminals, payment as a service, and commerce enablement solutions Our Strategy To connect our terminals and solutions into our industrial strength, secure payment as a service platform capable of hosting VeriFone and 3rd party-developed commerce enablement applications Our Execution To improve the way we run our terminal solutions business, globalize payment as a service, significantly innovate in commerce enablement Terminal Solutions 6 Payment as a Service Commerce Enablement Portable terminal win with Brazil’s 2 largest acquirers ~3M new consumer- facing systems New PaaS offering w/mobile Chip & PIN 6% growth over Q4 FY13 Successful launch of ECR solution for Turkish market U.S.: 4,000 connected devices; win w/Body Shop for 250 stores Geo-targeted advertising across 11,000 NYC taxis In-store marketing in 1,800 locations Partnership to enable U.K. mobile commerce Continued success of Pay with Points in taxis Significant market investment; wins with top banks
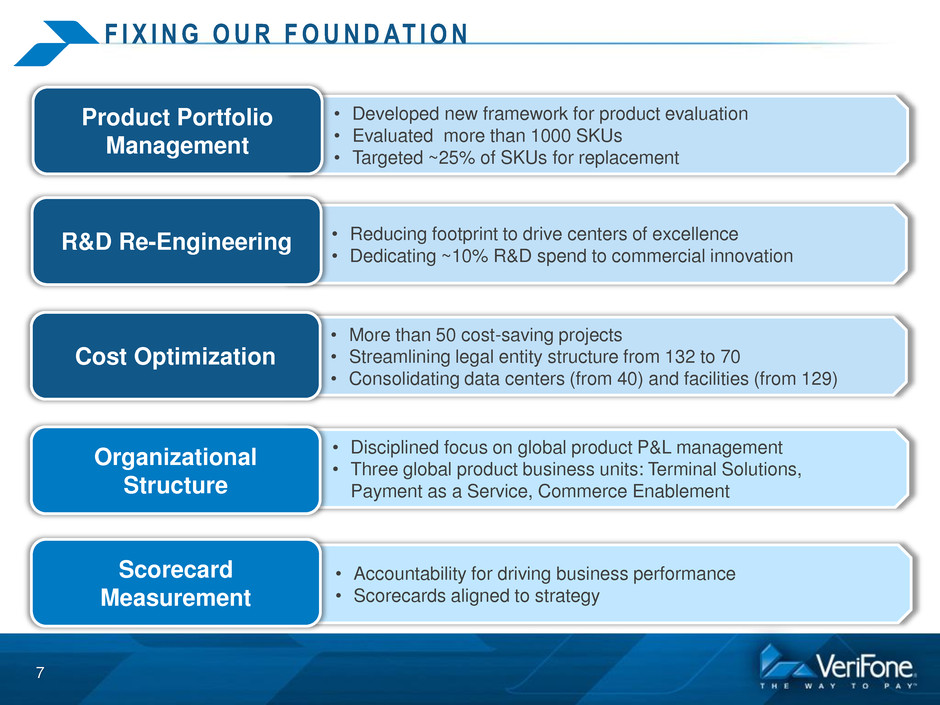
• Accountability for driving business performance • Scorecards aligned to strategy • Disciplined focus on global product P&L management • Three global product business units: Terminal Solutions, Payment as a Service, Commerce Enablement • Developed new framework for product evaluation • Evaluated more than 1000 SKUs • Targeted ~25% of SKUs for replacement F I X I N G O U R F O U N D AT I O N 7 Product Portfolio Management • Reducing footprint to drive centers of excellence • Dedicating ~10% R&D spend to commercial innovation R&D Re-Engineering • More than 50 cost-saving projects • Streamlining legal entity structure from 132 to 70 • Consolidating data centers (from 40) and facilities (from 129) Cost Optimization Organizational Structure Scorecard Measurement

Q 1 F I N A N C I A L R E S U LT S : P R I M A RY TA K E AWAY S Exceeded Guidance: Revenue, earnings per share, free cash flow Vision, Strategy, Execution: Defined and beginning to operationalize Fixing Our Core Foundation: Progress on top three initiatives, evolving organizational structure, implementing performance scorecards 8

Q1-14 FINANCIAL RESULTS AND GUIDANCE Marc Rothman, CFO
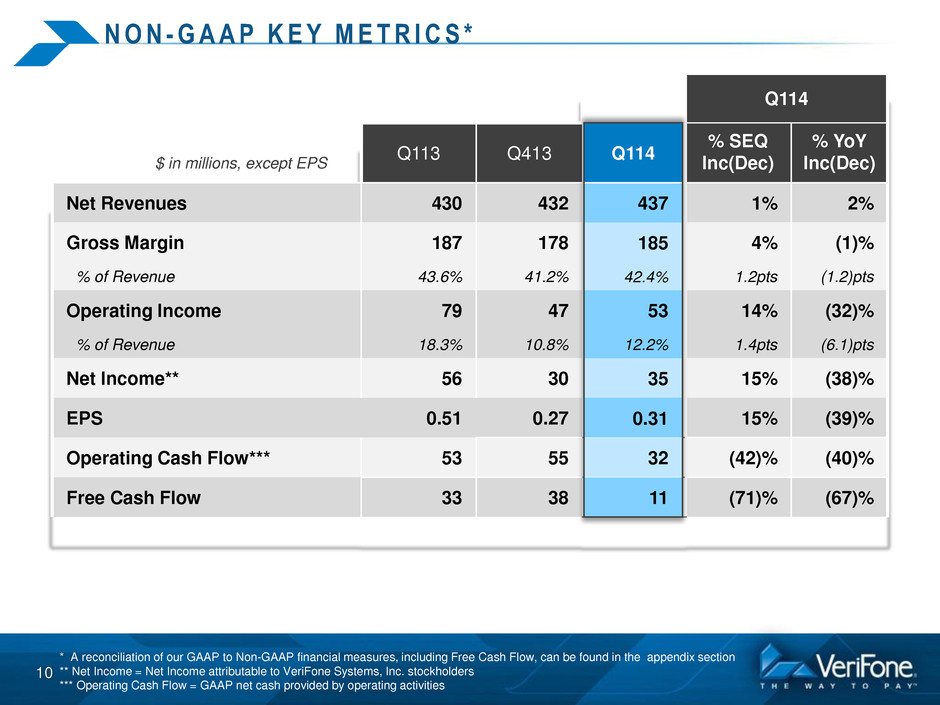
N O N - G A A P K E Y M E T R I C S * 10 * A reconciliation of our GAAP to Non-GAAP financial measures, including Free Cash Flow, can be found in the appendix section ** Net Income = Net Income attributable to VeriFone Systems, Inc. stockholders *** Operating Cash Flow = GAAP net cash provided by operating activities Q114 Q113 Q413 Q413 % SEQ Inc(Dec) % YoY Inc(Dec) Net Revenues 430 432 432 1% 2% Gross Margin 187 178 178 4% (1)% % of Revenue 43.6% 41.2% 41.2% 1.2pts (1.2)pts Operating Income 79 47 47 14% (32)% % of Revenue 18.3% 10.8% 10.9% 1.4pts (6.1)pts Net Income** 56 30 30 15% (38)% EPS 0.51 0.27 0.27 15% (39)% Operating Cash Flow*** 53 55 55 (42)% (40)% Free Cash Flow 33 38 38 (71)% (67)% $ in millions, except EPS 1 4 7 85 2.4 53 2.2 5 .31 32 11

N O N - G A A P N E T R E V E N U E S P R O F I L E * 11 * A reconciliation of our GAAP to Non-GAAP Net Revenues can be found in the appendix section Q413 Q114 Q113 NA 31% ASPAC 12% LAC 17% EMEA 40% NA 29% ASPAC 13% LAC 16% EMEA 42% NA 28% ASPAC 14% LAC 15% EMEA 43% Q114 Q114 Q113 Q413 Q413 % SEQ Inc(Dec) % YoY Inc(Dec) Organic YoY Growth Organic YoY Constant Currency Growth North America 133 124 125 (2)% (8)% (8)% (8)% LAC 73 71 71 (3)% (6)% (6)% 1% EMEA 173 180 179 3% 8% 6% 5% ASPAC 51 57 57 6% 18% 0% 5% $ in millions Total 430 432 432 1% 2% (1)% 0% 1 4 2 68 86 60 7
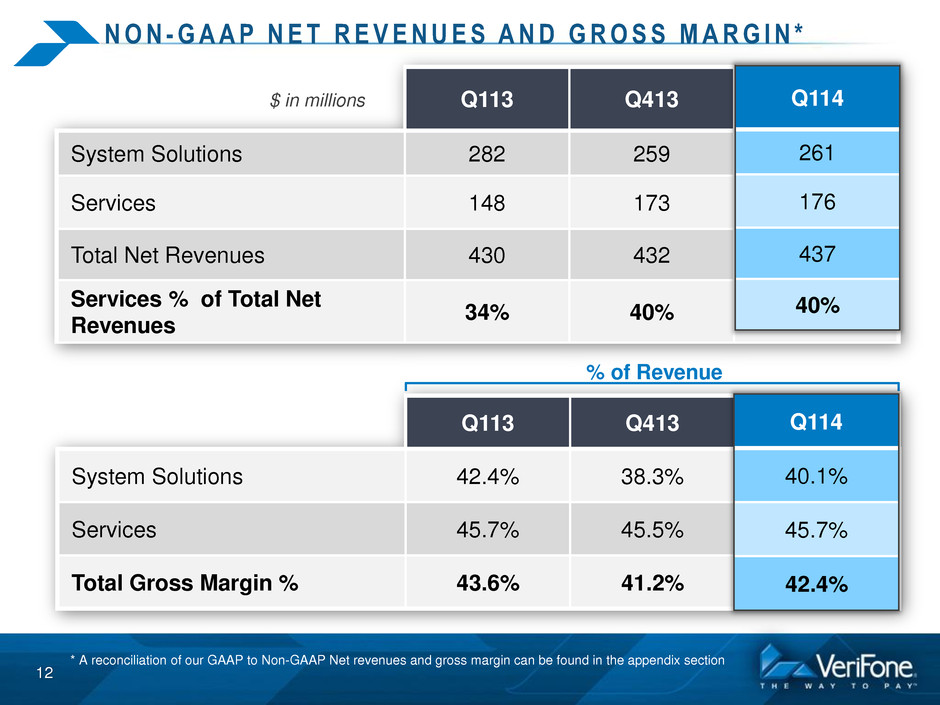
N O N - G A A P N E T R E V E N U E S A N D G R O S S M A R G I N * 12 * A reconciliation of our GAAP to Non-GAAP Net revenues and gross margin can be found in the appendix section Q113 Q413 Q413 System Solutions 42.4% 38.3% 38.2% Services 45.7% 45.5% 45.7% Total Gross Margin % 43.6% 41.2% 41.2% % of Revenue Q113 Q413 Q413 System Solutions 282 259 259 Services 148 173 173 Total Net Revenues 430 432 432 Services % of Total Net Revenues 34% 40% 40% $ in millions 114 61 6 7 40% 114 40.1 42.4
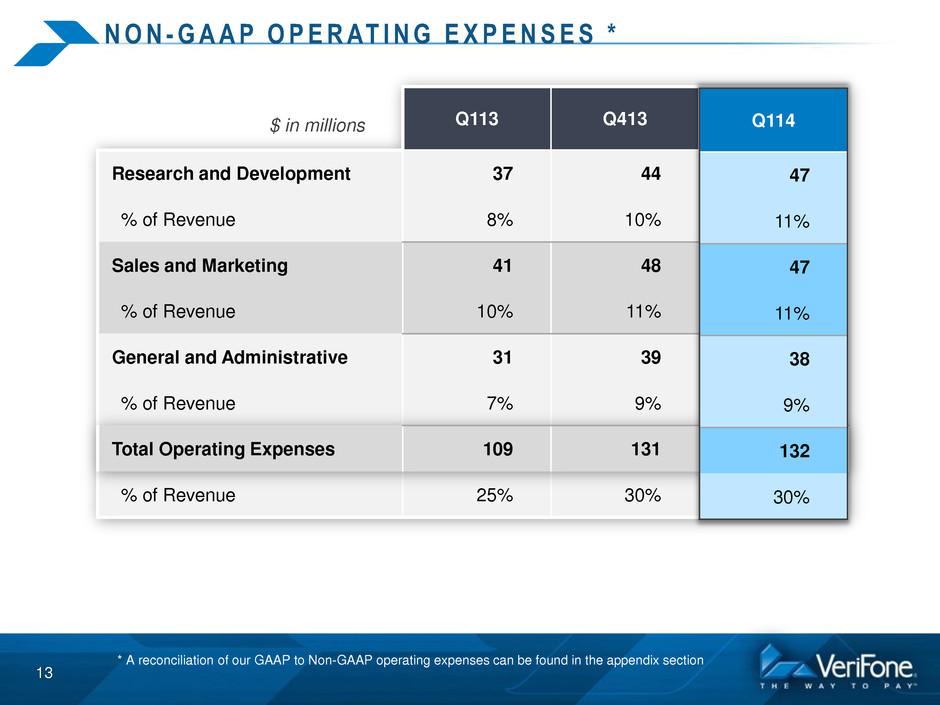
N O N - G A A P O P E R AT I N G E X P E N S E S * 13 * A reconciliation of our GAAP to Non-GAAP operating expenses can be found in the appendix section Q113 Q413 Q114 Research and Development 37 44 44 % of Revenue 8% 10% 10% Sales and Marketing 41 48 48 % of Revenue 10% 11% 11% General and Administrative 31 39 39 % of Revenue 7% 9% 9% Total Operating Expenses 131 % of Revenue 25% 30% 30% $ in millions 109 131 7 1 7 8 2
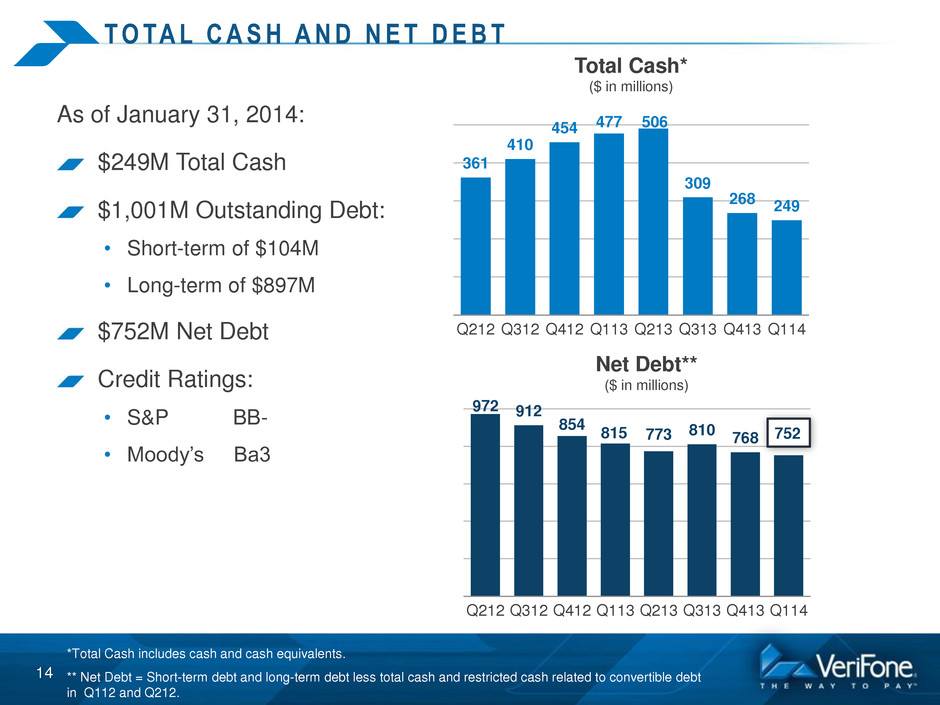
T O TA L C A S H A N D N E T D E B T 14 As of January 31, 2014: $249M Total Cash $1,001M Outstanding Debt: • Short-term of $104M • Long-term of $897M $752M Net Debt Credit Ratings: • S&P BB- • Moody’s Ba3 *Total Cash includes cash and cash equivalents. ** Net Debt = Short-term debt and long-term debt less total cash and restricted cash related to convertible debt in Q112 and Q212. 361 410 454 477 506 309 268 249 Q212 Q312 Q412 Q113 Q213 Q313 Q413 Q114 Total Cash* ($ in millions) 972 912 854 815 773 810 768 752 Q212 Q312 Q412 Q113 Q213 Q313 Q413 Q114 Net Debt** ($ in millions) 752
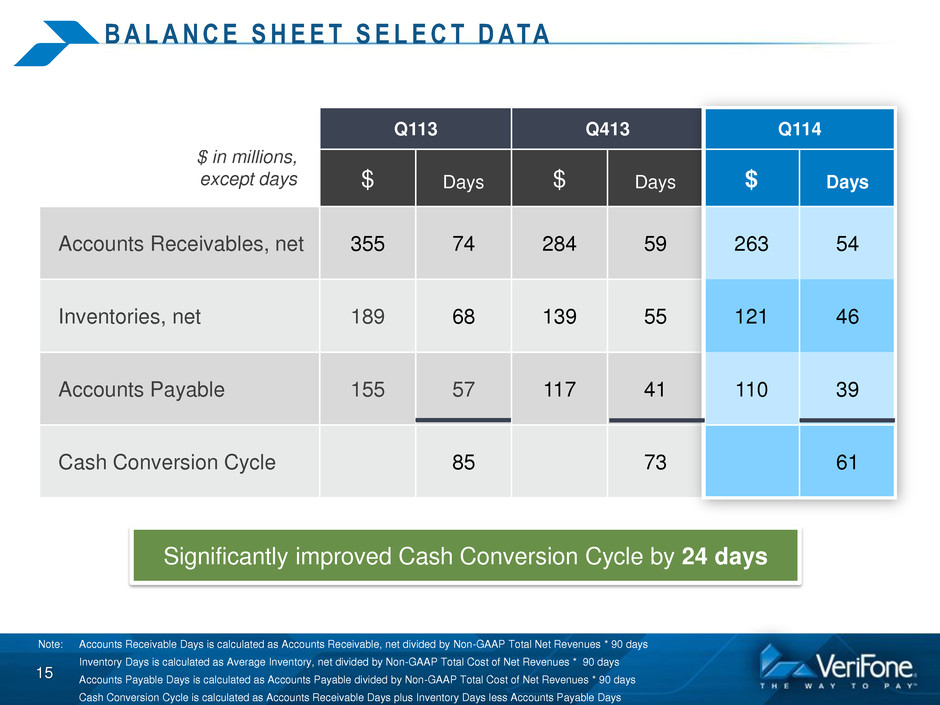
B A L A N C E S H E E T S E L E C T D ATA 15 $ in millions, except days Q113 Q413 $ Days $ Days Accounts Receivables, net 355 74 284 59 Inventories, net 189 68 139 55 Accounts Payable 155 57 117 41 Cash Conversion Cycle 85 73 Q114 $ Days 263 54 121 46 110 39 61 Note: Accounts Receivable Days is calculated as Accounts Receivable, net divided by Non-GAAP Total Net Revenues * 90 days Inventory Days is calculated as Average Inventory, net divided by Non-GAAP Total Cost of Net Revenues * 90 days Accounts Payable Days is calculated as Accounts Payable divided by Non-GAAP Total Cost of Net Revenues * 90 days Cash Conversion Cycle is calculated as Accounts Receivable Days plus Inventory Days less Accounts Payable Days Significantly improved Cash Conversion Cycle by 24 days
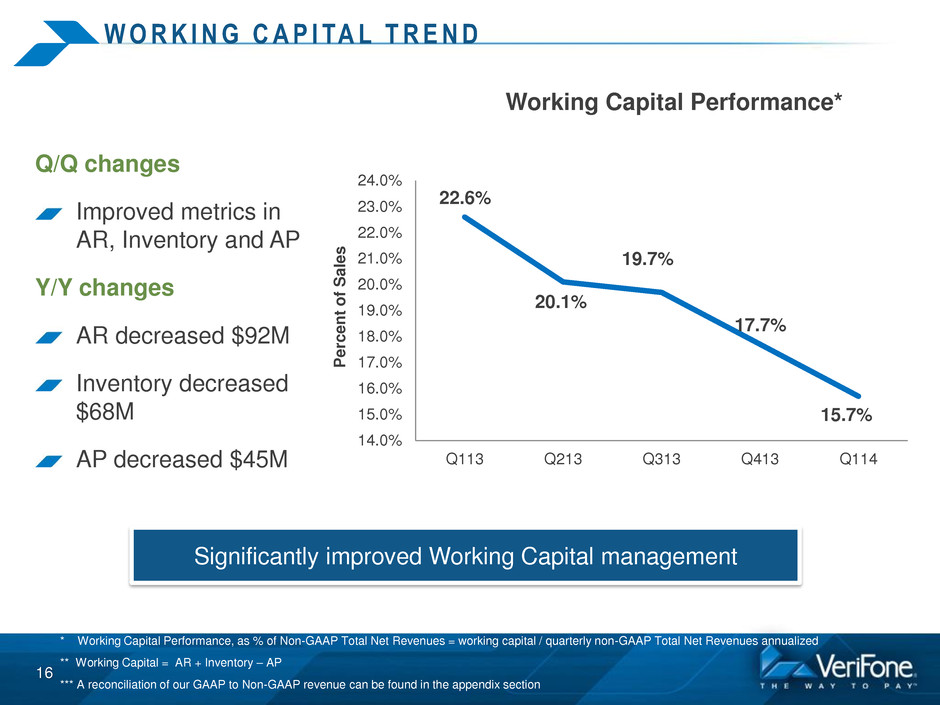
W O R K I N G C A P I TA L T R E N D 16 Q/Q changes Improved metrics in AR, Inventory and AP Y/Y changes AR decreased $92M Inventory decreased $68M AP decreased $45M * Working Capital Performance, as % of Non-GAAP Total Net Revenues = working capital / quarterly non-GAAP Total Net Revenues annualized ** Working Capital = AR + Inventory – AP *** A reconciliation of our GAAP to Non-GAAP revenue can be found in the appendix section Working Capital Performance* 22.6% 20.1% 19.7% 17.7% 15.7% 14.0% 15.0% 16.0% 17.0% 18.0% 19.0% 20.0% 21.0% 22.0% 23.0% 24.0% Q113 Q213 Q313 Q413 Q114 P e rc e n t o f S a le s Significantly improved Working Capital management
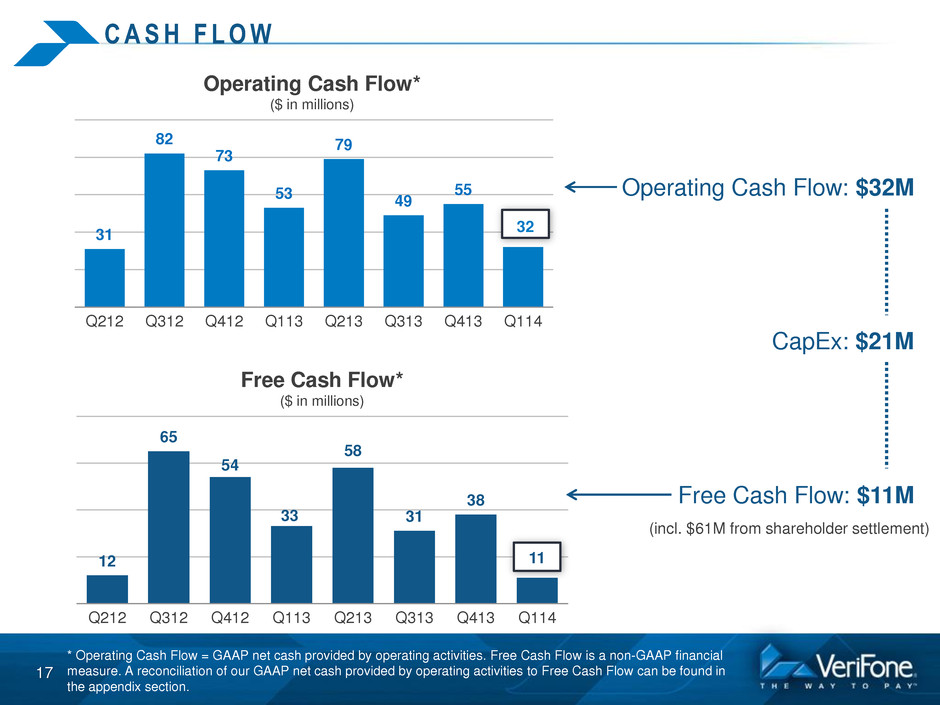
C A S H F L O W 17 31 82 73 53 79 49 55 32 Q212 Q312 Q412 Q113 Q213 Q313 Q413 Q114 Operating Cash Flow* ($ in millions) 12 65 54 33 58 31 38 11 Q212 Q312 Q412 Q113 Q213 Q313 Q413 Q114 Free Cash Flow* ($ in millions) 32 11 Operating Cash Flow: $32M Free Cash Flow: $11M CapEx: $21M * Operating Cash Flow = GAAP net cash provided by operating activities. Free Cash Flow is a non-GAAP financial measure. A reconciliation of our GAAP net cash provided by operating activities to Free Cash Flow can be found in the appendix section. (incl. $61M from shareholder settlement)
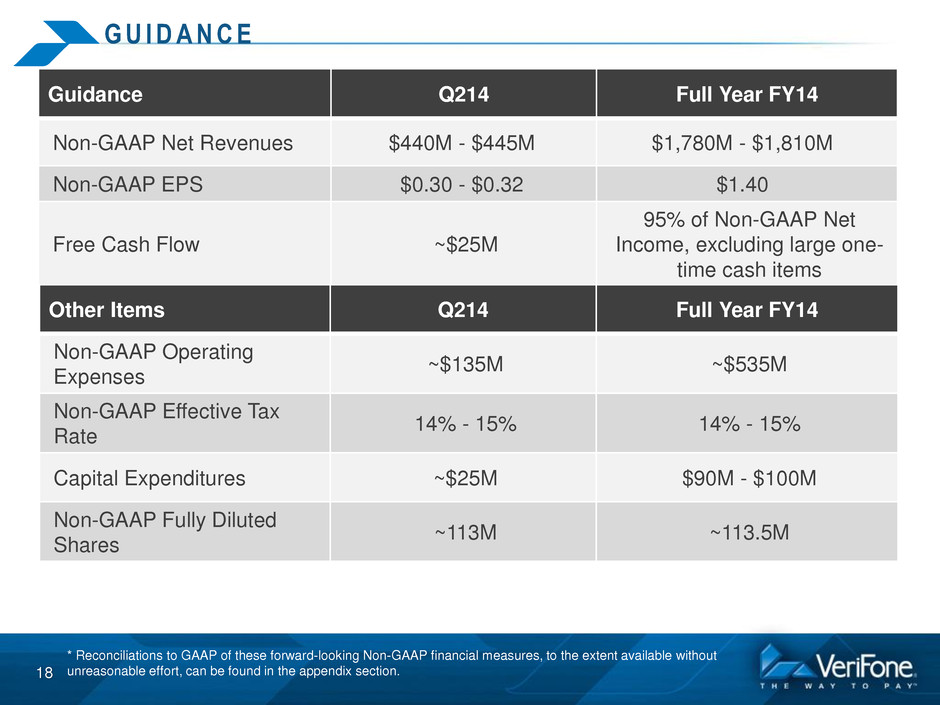
G U I D A N C E 18 Guidance Q214 Full Year FY14 Non-GAAP Net Revenues $440M - $445M $1,780M - $1,810M Non-GAAP EPS $0.30 - $0.32 $1.40 Free Cash Flow ~$25M 95% of Non-GAAP Net Income, excluding large one- time cash items Other Items Q214 Full Year FY14 Non-GAAP Operating Expenses ~$135M ~$535M Non-GAAP Effective Tax Rate 14% - 15% 14% - 15% Capital Expenditures ~$25M $90M - $100M Non-GAAP Fully Diluted Shares ~113M ~113.5M * Reconciliations to GAAP of these forward-looking Non-GAAP financial measures, to the extent available without unreasonable effort, can be found in the appendix section.

Q & A SESSION

APPENDIX
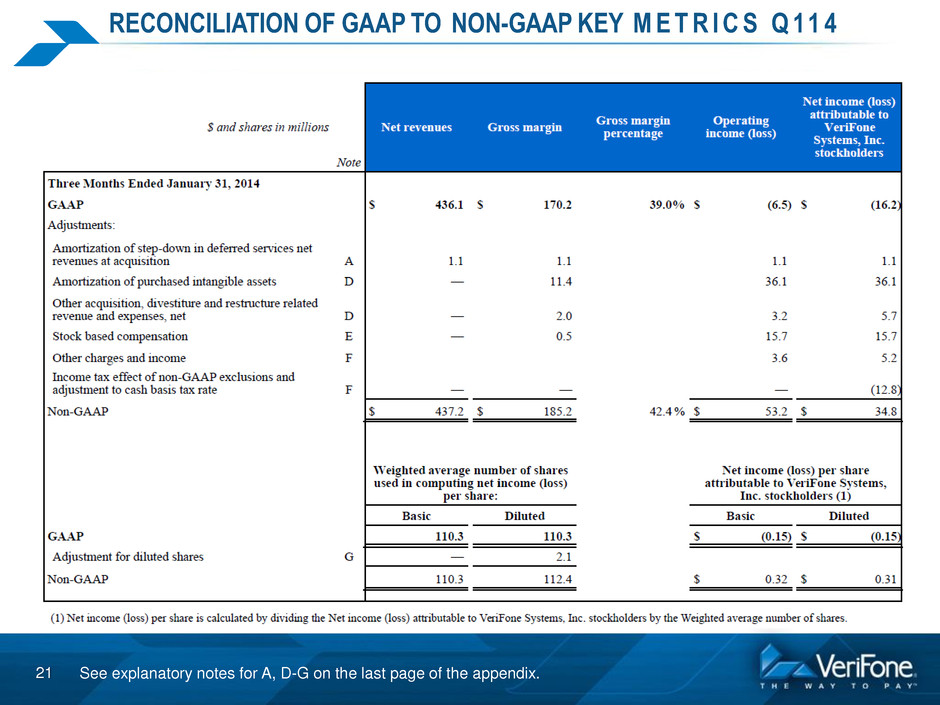
21 RECONCILIATION OF GAAP TO NON-GAAP KEY M E T R I C S Q 11 4 See explanatory notes for A, D-G on the last page of the appendix.
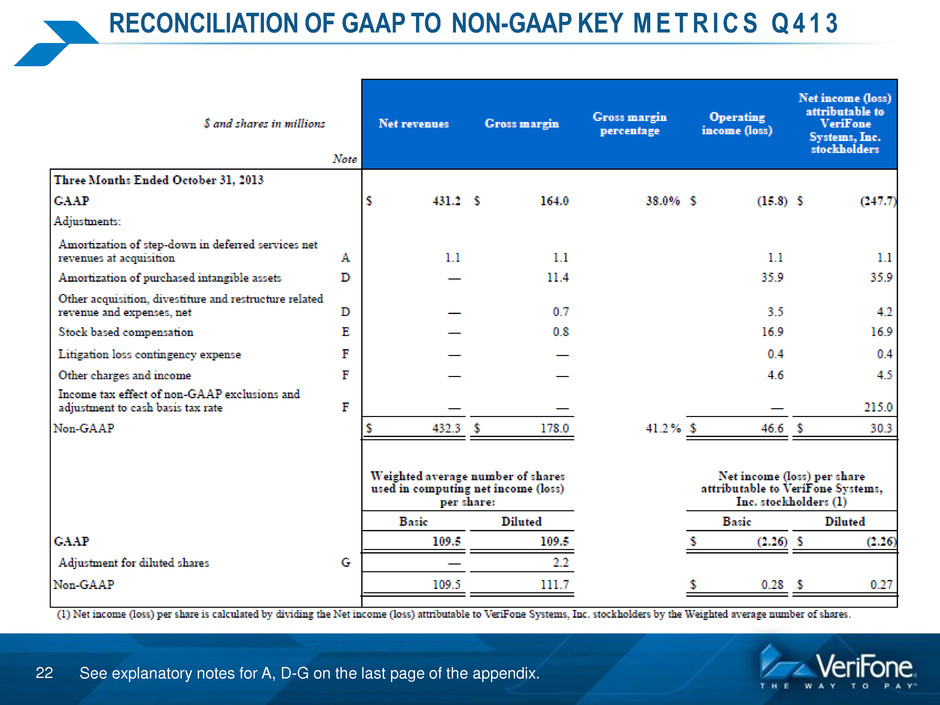
22 RECONCILIATION OF GAAP TO NON-GAAP KEY M E T R I C S Q 4 1 3 See explanatory notes for A, D-G on the last page of the appendix.
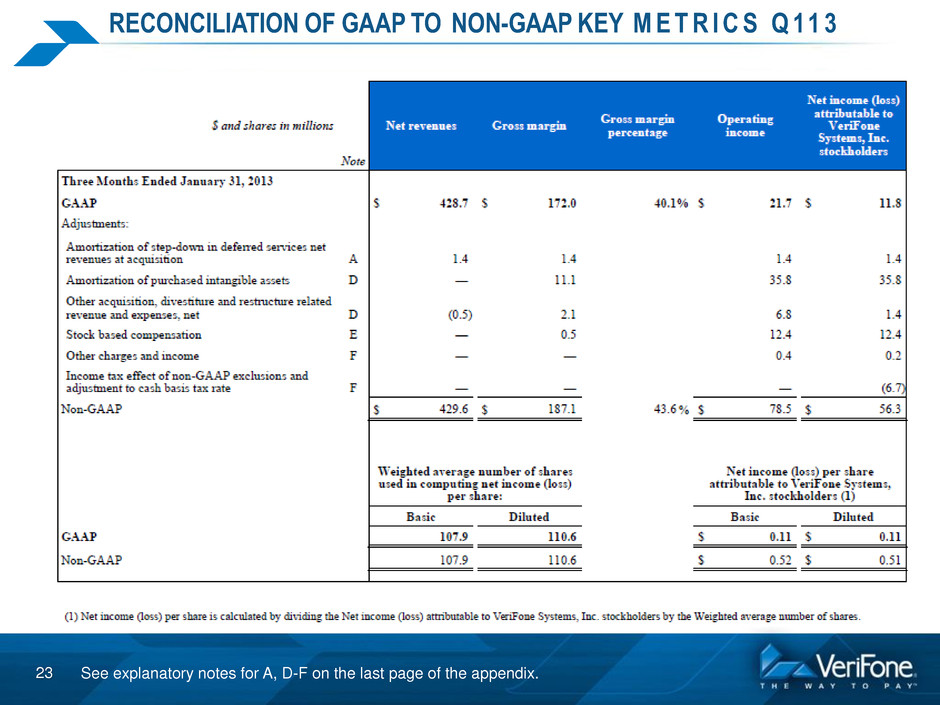
23 RECONCILIATION OF GAAP TO NON-GAAP KEY M E T R I C S Q 11 3 See explanatory notes for A, D-F on the last page of the appendix.
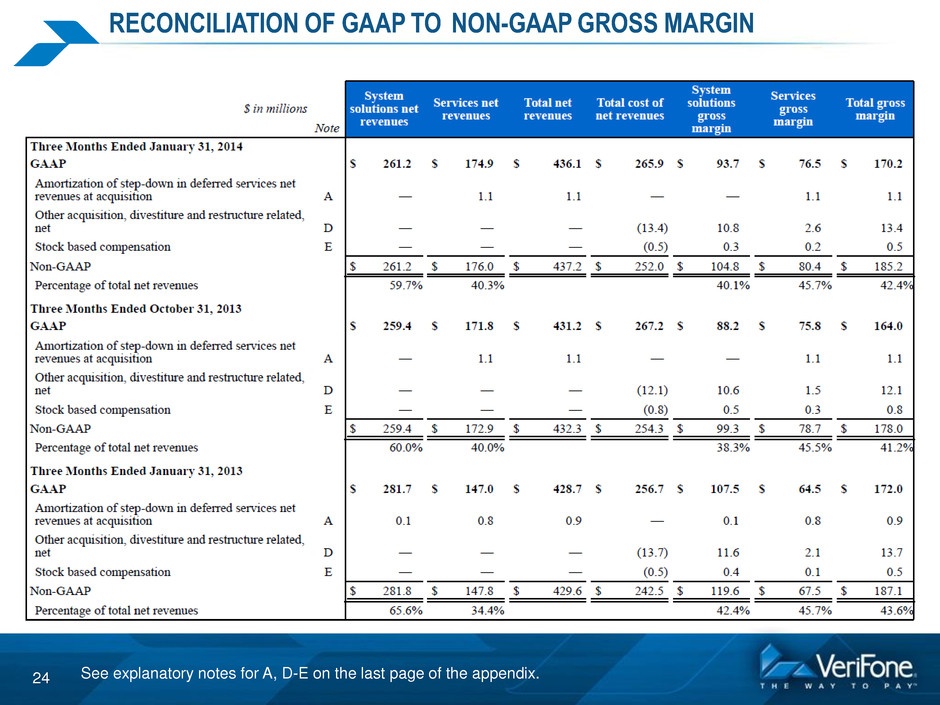
24 RECONCILIATION OF GAAP TO NON-GAAP GROSS MARGIN See explanatory notes for A, D-E on the last page of the appendix.
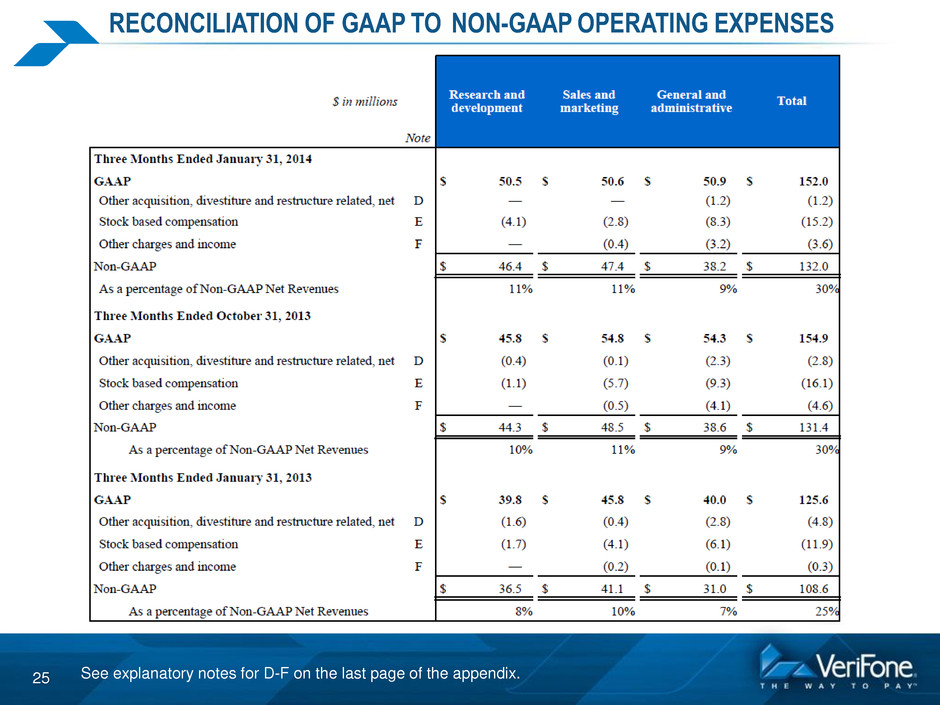
25 RECONCILIATION OF GAAP TO NON-GAAP OPERATING EXPENSES See explanatory notes for D-F on the last page of the appendix.
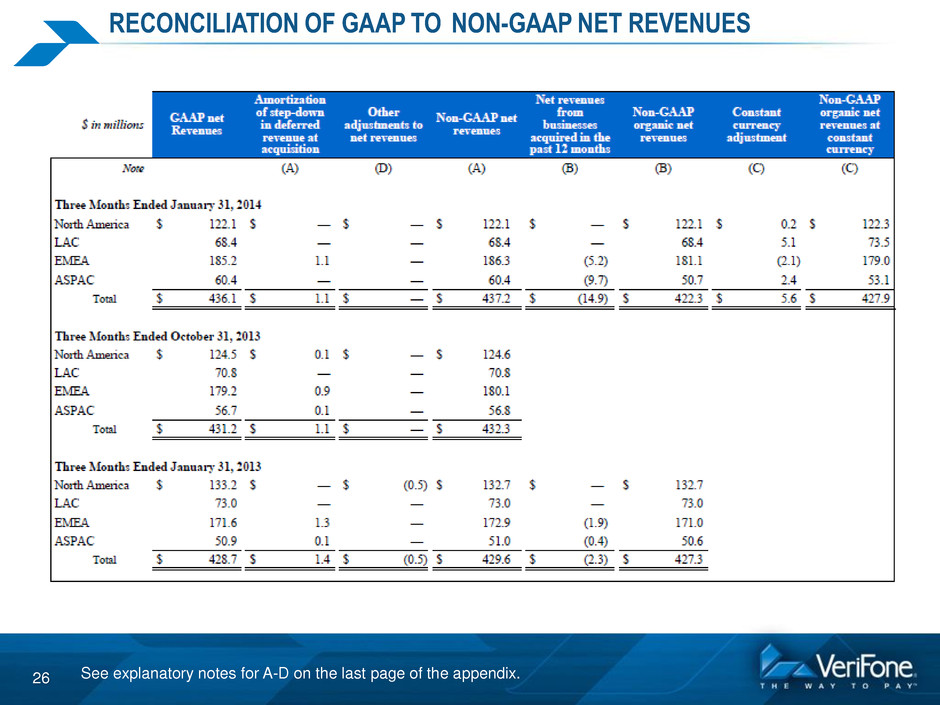
26 RECONCILIATION OF GAAP TO NON-GAAP NET REVENUES See explanatory notes for A-D on the last page of the appendix.
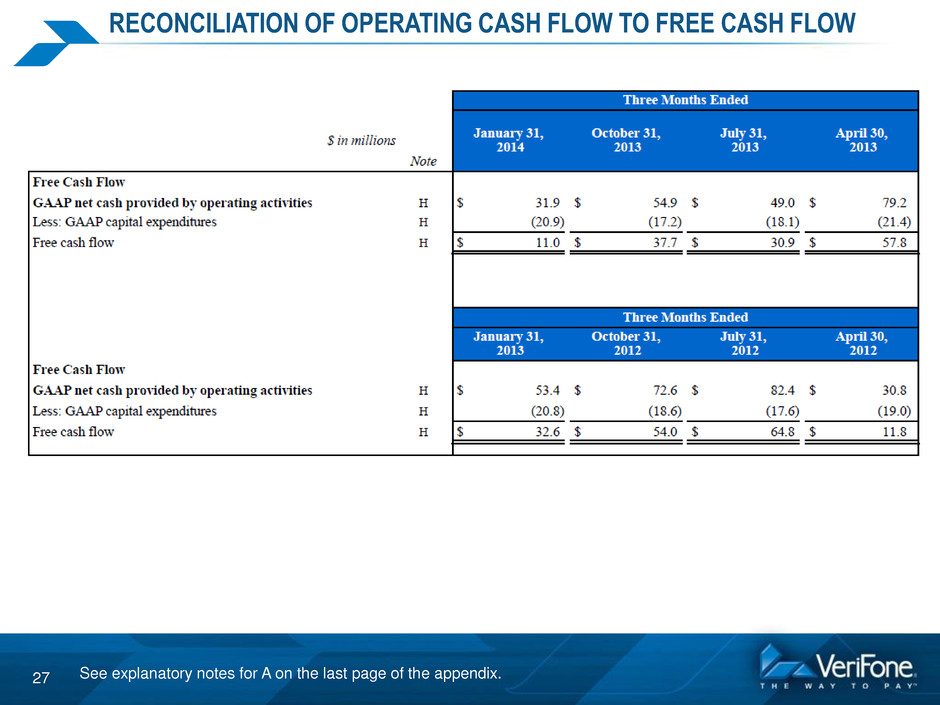
27 RECONCILIATION OF OPERATING CASH FLOW TO FREE CASH FLOW See explanatory notes for A on the last page of the appendix.
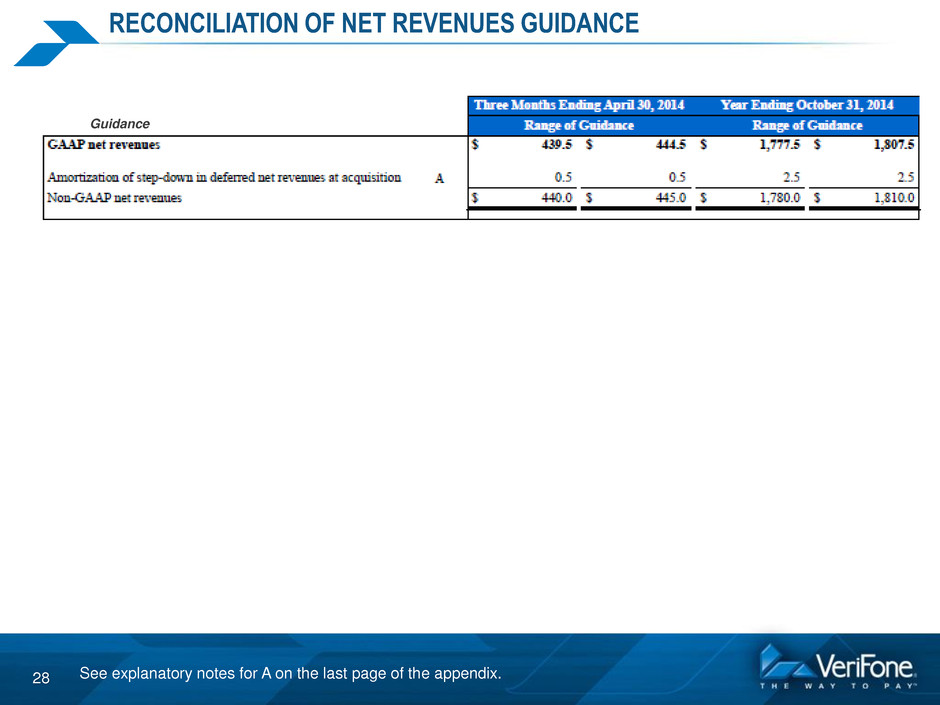
28 RECONCILIATION OF NET REVENUES GUIDANCE See explanatory notes for A on the last page of the appendix. Guidance
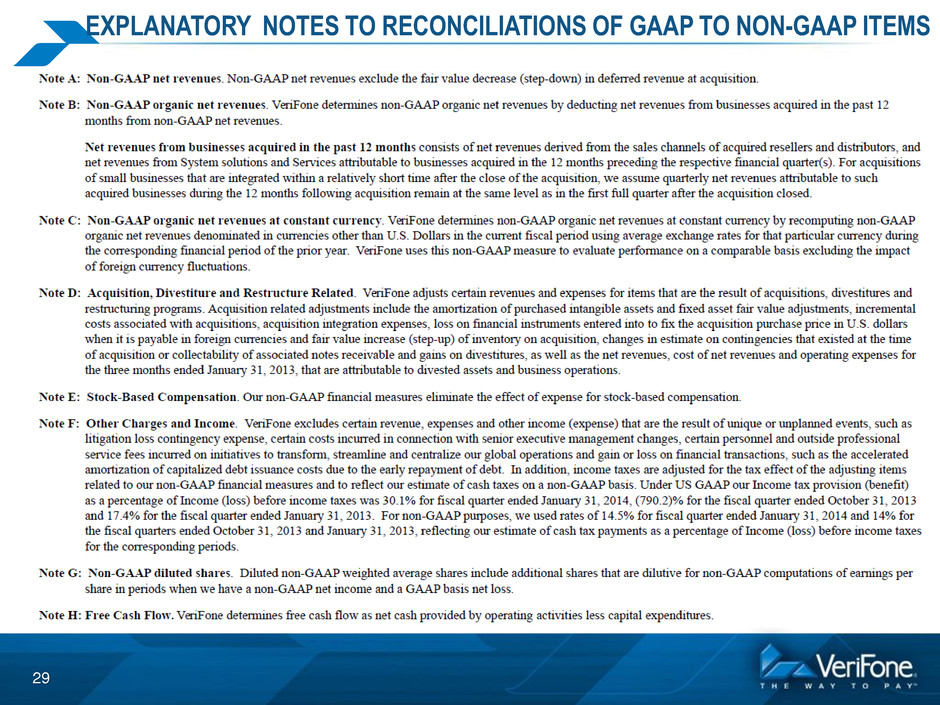
29 EXPLANATORY NOTES TO RECONCILIATIONS OF GAAP TO NON-GAAP ITEMS

THANK YOU


