
FINANCIAL RESULTS For the Second Quarter Ended April 30, 2014 EXHIBIT 99.2
2 F O R WA R D - L O O K I N G S TAT E M E N T S Today’s discussion may include “forward-looking statements” within the meaning of the Private Securities Litigation Reform Act of 1995. Such statements relate to future events and expectations and involve known and unknown risks and uncertainties. VeriFone’s actual results or actions may differ materially from those projected in the forward-looking statements. For a summary of the specific risk factors that could cause results to differ materially from those expressed in the forward-looking statements, please refer to VeriFone’s filings with the Securities and Exchange Commission, including its annual report on Form 10-K and quarterly reports on Form 10-Q. VeriFone is under no obligation to, and expressly disclaims any obligation to, update or alter its forward-looking statements, whether as a result of new information, future events, changes in assumptions or otherwise.
3 N O N - G A A P F I N A N C I A L M E A S U R E S With respect to any Non-GAAP financial measures presented in the information, reconciliations of Non-GAAP to GAAP financial measures may be found in VeriFone’s quarterly earnings release as filed with the Securities and Exchange Commission as well as the Appendix to these slides. Management uses Non-GAAP financial measures only in addition to and in conjunction with results presented in accordance with GAAP. Management believes that these Non-GAAP financial measures help it to evaluate VeriFone’s performance and to compare VeriFone’s current results with those for prior periods as well as with the results of peer companies. These Non-GAAP financial measures contain limitations and should be considered as a supplement to, and not as a substitute for, or superior to, disclosures made in accordance with GAAP.

INTRODUCTION Paul Galant, CEO 4
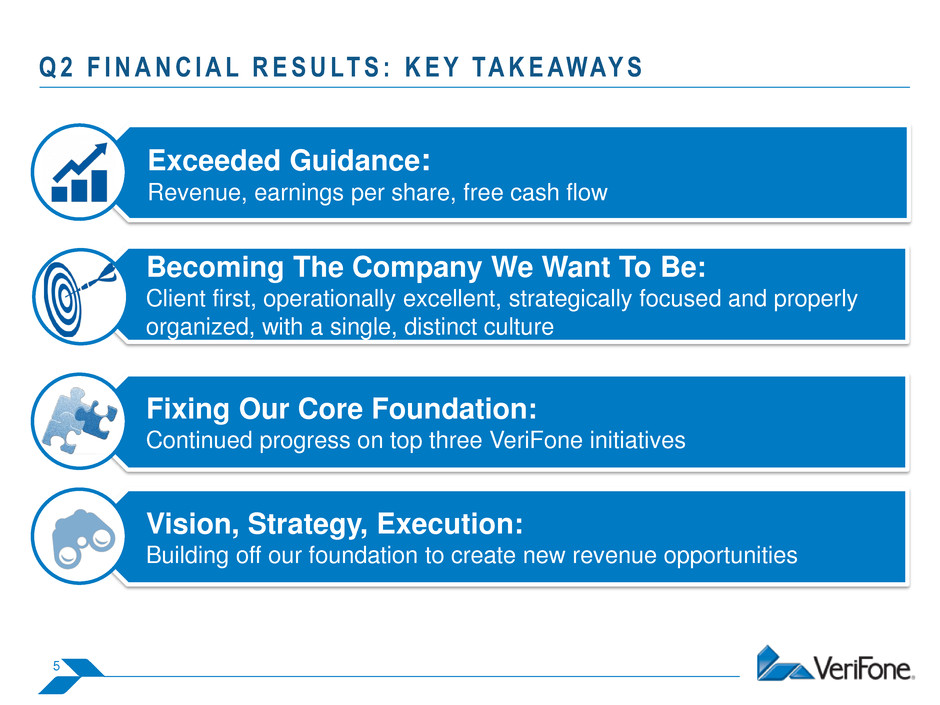
Exceeded Guidance: Revenue, earnings per share, free cash flow Becoming The Company We Want To Be: Client first, operationally excellent, strategically focused and properly organized, with a single, distinct culture Vision, Strategy, Execution: Building off our foundation to create new revenue opportunities Fixing Our Core Foundation: Continued progress on top three VeriFone initiatives 5 Q 2 F I N A N C I A L R E S U LT S : K E Y TA K E AWAY S
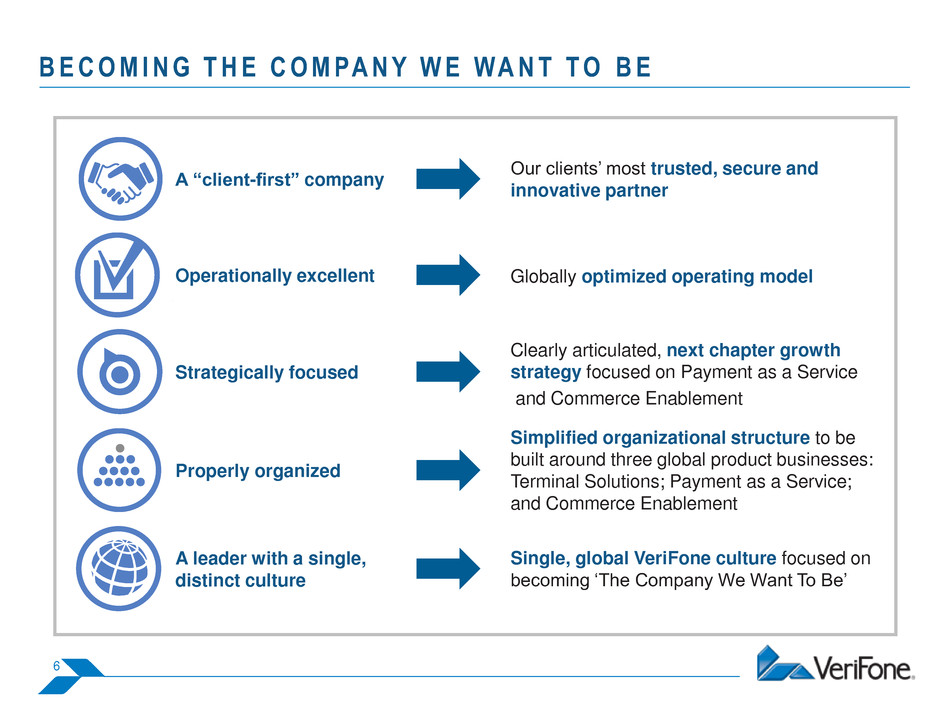
B E C O M I N G T H E C O M PA N Y W E WA N T T O B E A “client-first” company Our clients’ most trusted, secure and innovative partner Operationally excellent Globally optimized operating model Strategically focused Clearly articulated, next chapter growth strategy focused on Payment as a Service and Commerce Enablement Properly organized Simplified organizational structure to be built around three global product businesses: Terminal Solutions; Payment as a Service; and Commerce Enablement A leader with a single, distinct culture Single, global VeriFone culture focused on becoming ‘The Company We Want To Be’ 6
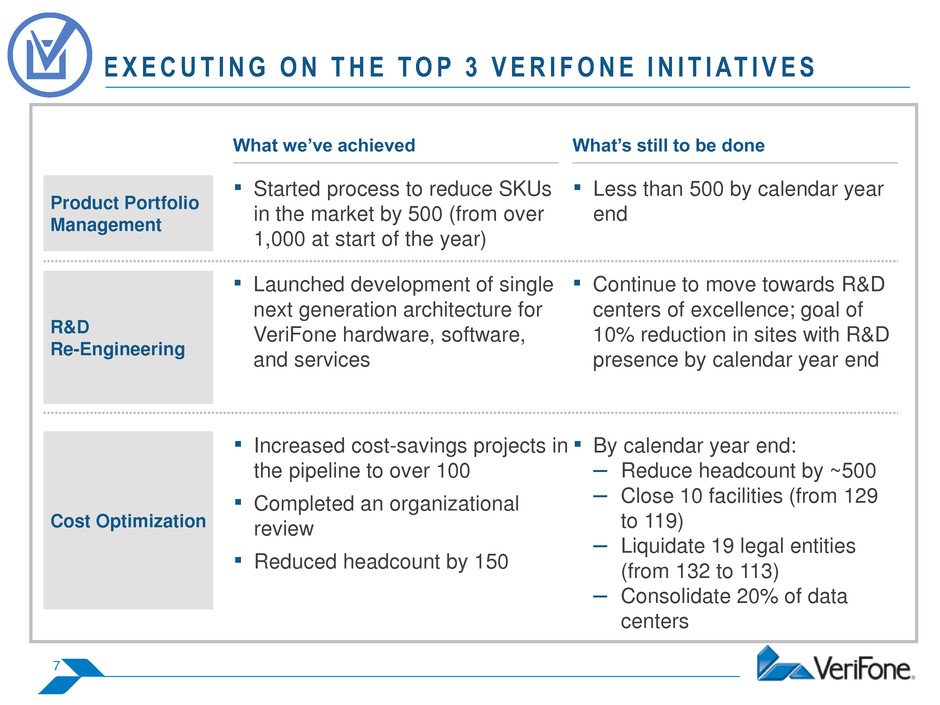
E X E C U T I N G O N T H E T O P 3 V E R I F O N E I N I T I AT I V E S 7 Cost Optimization ▪ By calendar year end: – Reduce headcount by ~500 – Close 10 facilities (from 129 to 119) – Liquidate 19 legal entities (from 132 to 113) – Consolidate 20% of data centers ▪ Increased cost-savings projects in the pipeline to over 100 ▪ Completed an organizational review ▪ Reduced headcount by 150 Product Portfolio Management ▪ Less than 500 by calendar year end ▪ Started process to reduce SKUs in the market by 500 (from over 1,000 at start of the year) R&D Re-Engineering ▪ Continue to move towards R&D centers of excellence; goal of 10% reduction in sites with R&D presence by calendar year end ▪ Launched development of single next generation architecture for VeriFone hardware, software, and services What’s still to be done What we’ve achieved

8 Our Vision To become our clients’ most trusted, secure, and innovative partner by delivering terminals, payment as a service, and commerce enablement solutions Our Strategy To connect our terminals and solutions into our industrial strength, secure payment as a service platform capable of hosting VeriFone and 3rd party-developed commerce enablement applications Terminal Solutions Payment as a Service Commerce Enablement Launched next- generation portable terminal in Australia MX 900: 15 existing client upgrades; 6 competitive takeaways; 3 clients with new consumer- facing systems Continued U.S. momentum with merchants and ISVs Grew in-store marketing network to 1,600 C-Store countertops Sold 100% of NYC digital taxi inventory; further expansion in NYC, Las Vegas; first pilot in Europe Strategic projects with two top Australian banks Signed agreements with two tier 1 retailers in Sweden; expanded H&M solution in Norway Grew at-the-pump targeted media network to nearly 4,800 screens Continued business growth with Spain’s largest processor Six new clients for enterprise mobile POS Extended Turkey, incl. 250 Turkish Airline branches, 1K+ agents
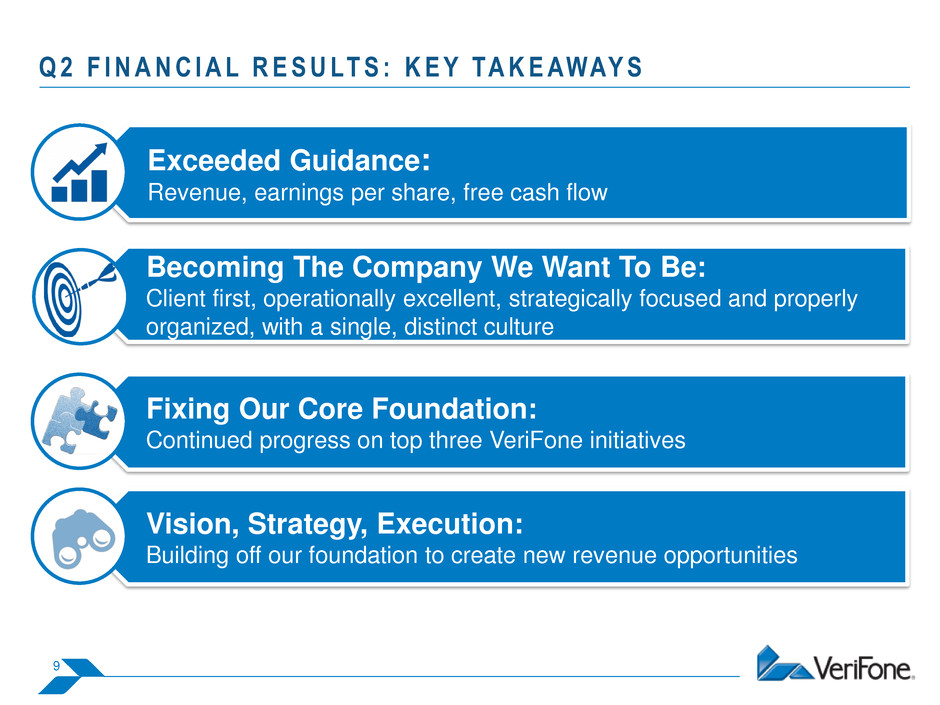
Exceeded Guidance: Revenue, earnings per share, free cash flow Becoming The Company We Want To Be: Client first, operationally excellent, strategically focused and properly organized, with a single, distinct culture Vision, Strategy, Execution: Building off our foundation to create new revenue opportunities Fixing Our Core Foundation: Continued progress on top three VeriFone initiatives 9 Q 2 F I N A N C I A L R E S U LT S : K E Y TA K E AWAY S

Q2-14 FINANCIAL RESULTS AND GUIDANCE Marc Rothman, CFO 10

11 N O N - G A A P K E Y M E T R I C S * * A reconciliation of our GAAP to Non-GAAP financial measures, including Free Cash Flow, can be found in the appendix section ** Net Income = Net Income attributable to VeriFone Systems, Inc. stockholders *** Operating Cash Flow = GAAP net cash provided by operating activities Q214 Q213 Q114 Q214 % SEQ Inc(Dec) % YoY Inc(Dec) Net Revenues 430 437 467 7% 9% Gross Margin 182 185 193 4% 6% % of Revenue 42.2% 42.4% 41.4% (1.0)pts (0.8)pts Operating Income 67 53 60 13% (10)% % of Revenue 15.5% 12.2% 12.8% 0.6pts (2.7)pts Net Income** 47 35 42 20% (11)% EPS 0.42 0.31 0.37 19% (12)% Operating Cash Flow*** 79 32 57 78% (28)% Free Cash Flow 58 11 36 227% (38)% $ in millions, except EPS
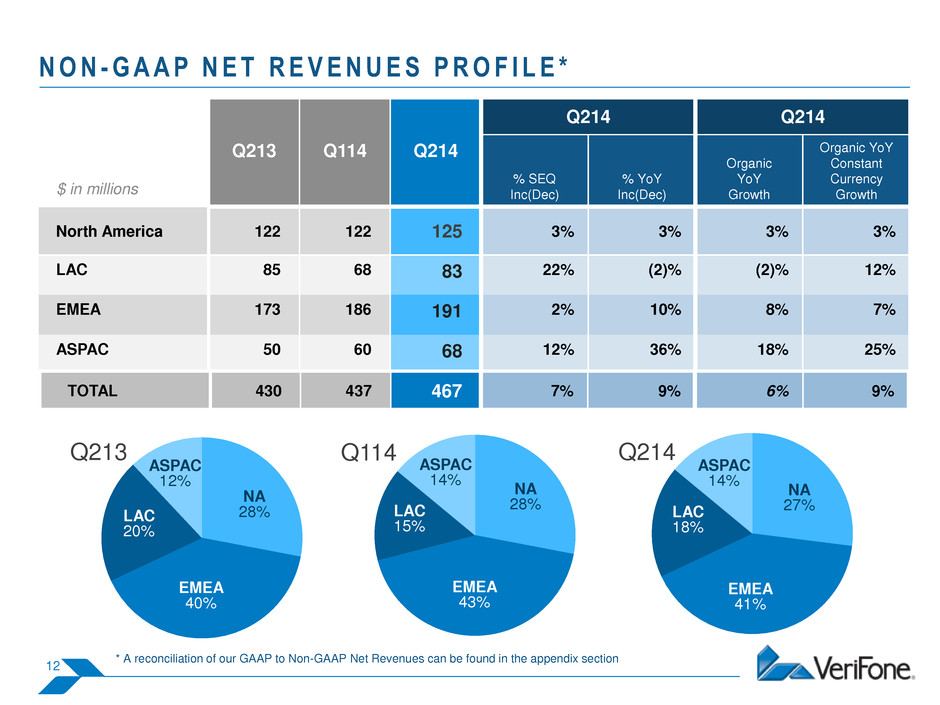
12 N O N - G A A P N E T R E V E N U E S P R O F I L E * * A reconciliation of our GAAP to Non-GAAP Net Revenues can be found in the appendix section Q114 Q214 Q213 NA 28% ASPAC 12% LAC 20% EMEA 40% NA 28% ASPAC 14% LAC 15% EMEA 43% NA 27% ASPAC 14% LAC 18% EMEA 41% Q214 Q214 Q213 Q114 Q214 % SEQ Inc(Dec) % YoY Inc(Dec) Organic YoY Growth Organic YoY Constant Currency Growth North America 122 122 125 3% 3% 3% 3% LAC 85 68 83 22% (2)% (2)% 12% EMEA 173 186 191 2% 10% 8% 7% ASPAC 50 60 68 12% 36% 18% 25% $ in millions TOTAL 430 437 467 7% 9% 6% 9%

13 N O N - G A A P N E T R E V E N U E S A N D G R O S S M A R G I N * * A reconciliation of our GAAP to Non-GAAP Net revenues and gross margin can be found in the appendix section Q213 Q114 Q214 System Solutions 279 261 291 Services 151 176 176 Total Net Revenues 430 437 467 Services % of Total Net Revenues 35% 40% 38% $ in millions Q213 Q114 Q214 System Solutions 40.8% 40.1% 40.4% Services 44.9% 45.7% 43.1% Total Gross Margin % 42.2% 42.4% 41.4% % of Revenue
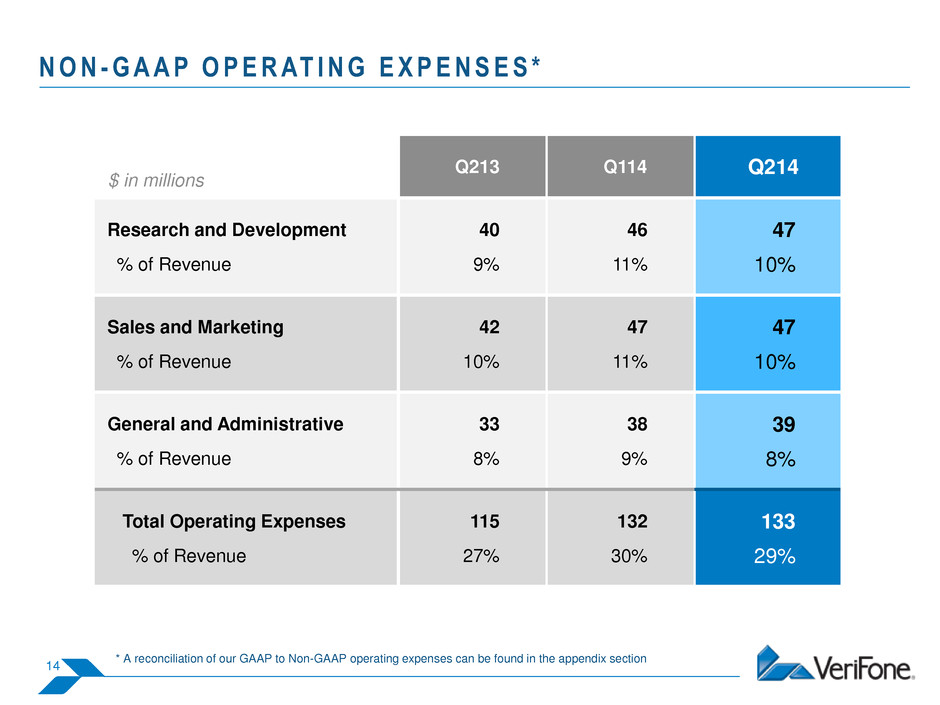
14 N O N - G A A P O P E R AT I N G E X P E N S E S * * A reconciliation of our GAAP to Non-GAAP operating expenses can be found in the appendix section Q213 Q114 Q214 Research and Development 40 46 47 % of Revenue 9% 11% 10% Sales and Marketing 42 47 47 % of Revenue 10% 11% 10% General and Administrative 33 38 39 % of Revenue 8% 9% 8% Total Operating Expenses 115 132 133 % of Revenue 27% 30% 29% $ in millions
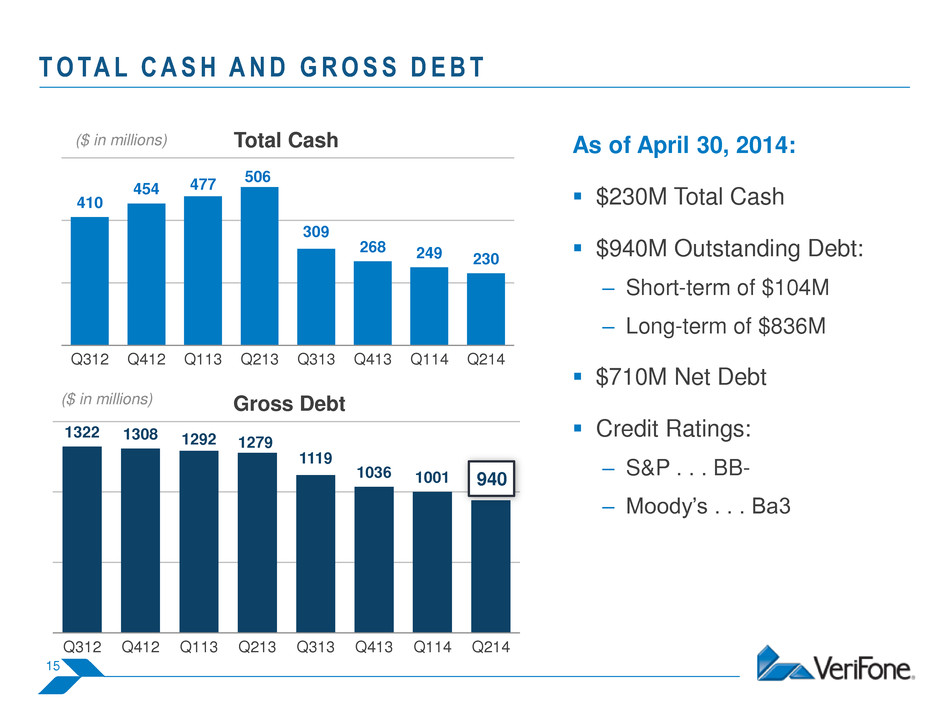
T O TA L C A S H A N D G R O S S D E B T As of April 30, 2014: $230M Total Cash $940M Outstanding Debt: – Short-term of $104M – Long-term of $836M $710M Net Debt Credit Ratings: – S&P . . . BB- – Moody’s . . . Ba3 Total Cash 1322 1308 1292 1279 1119 1036 1001 940 Q312 Q412 Q113 Q213 Q313 Q413 Q114 Q214 Gross Debt 940 ($ in millions) ($ in millions) 15 410 454 477 506 309 268 249 230 Q312 Q412 Q113 Q213 Q313 Q413 Q114 Q214
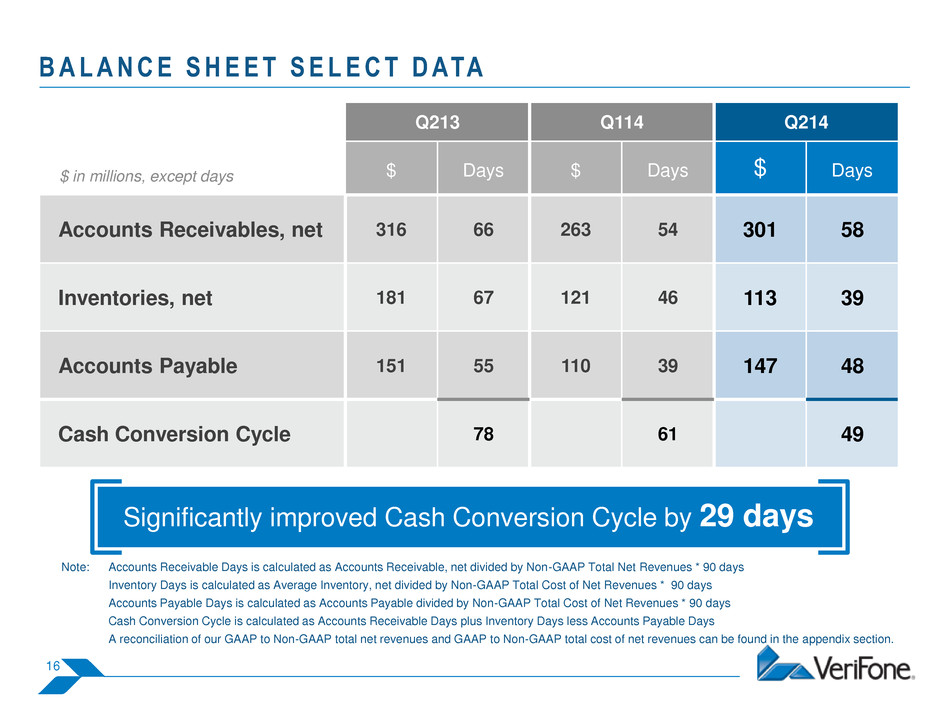
16 B A L A N C E S H E E T S E L E C T D ATA Note: Accounts Receivable Days is calculated as Accounts Receivable, net divided by Non-GAAP Total Net Revenues * 90 days Inventory Days is calculated as Average Inventory, net divided by Non-GAAP Total Cost of Net Revenues * 90 days Accounts Payable Days is calculated as Accounts Payable divided by Non-GAAP Total Cost of Net Revenues * 90 days Cash Conversion Cycle is calculated as Accounts Receivable Days plus Inventory Days less Accounts Payable Days A reconciliation of our GAAP to Non-GAAP total net revenues and GAAP to Non-GAAP total cost of net revenues can be found in the appendix section. Significantly improved Cash Conversion Cycle by 29 days Q213 Q114 Q214 $ Days $ Days $ Days Accounts Receivables, net 316 66 263 54 301 58 Inventories, net 181 67 121 46 113 39 Accounts Payable 151 55 110 39 147 48 Cash Conversion Cycle 78 61 49 $ in millions, except days

17 W O R K I N G C A P I TA L T R E N D Working Capital Performance* 22.6% 20.1% 19.7% 17.7% 15.7% 14.3% 14.0% 15.0% 16.0% 17.0% 18.0% 19.0% 20.0% 21.0% 22.0% 23.0% 24.0% Q113 Q213 Q313 Q413 Q114 Q214 Per c ent of Sa le s * Working Capital Performance, as % of Non-GAAP Total Net Revenues = working capital / quarterly non-GAAP Total Net Revenues annualized ** Working Capital = AR + Inventory – AP *** A reconciliation of our GAAP to Non-GAAP total net revenues can be found in the appendix section. Q/Q changes Improved metrics in AR, Inventory and AP Y/Y changes AR decreased $15M Inventory decreased $68M AP decreased $4M Significantly improved Working Capital management
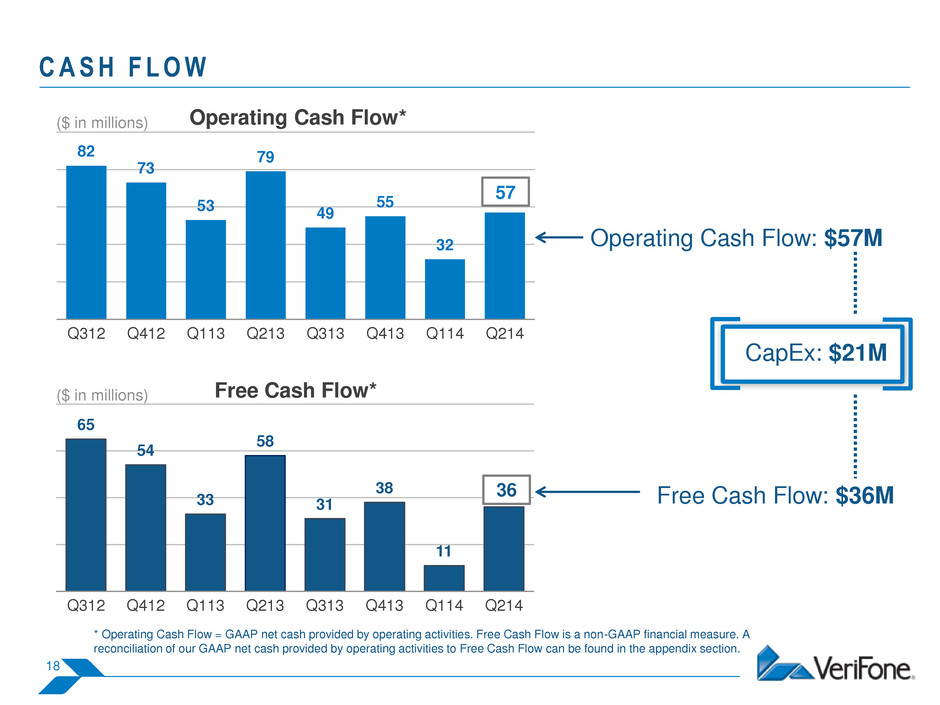
C A S H F L O W 82 73 53 79 49 55 32 57 Q312 Q412 Q113 Q213 Q313 Q413 Q114 Q214 Operating Cash Flow* 57 65 54 33 58 31 38 11 36 Q312 Q412 Q113 Q213 Q313 Q413 Q114 Q214 Free Cash Flow* 18 ($ in millions) ($ in millions) Operating Cash Flow: $57M Free Cash Flow: $36M CapEx: $21M * Operating Cash Flow = GAAP net cash provided by operating activities. Free Cash Flow is a non-GAAP financial measure. A reconciliation of our GAAP net cash provided by operating activities to Free Cash Flow can be found in the appendix section.
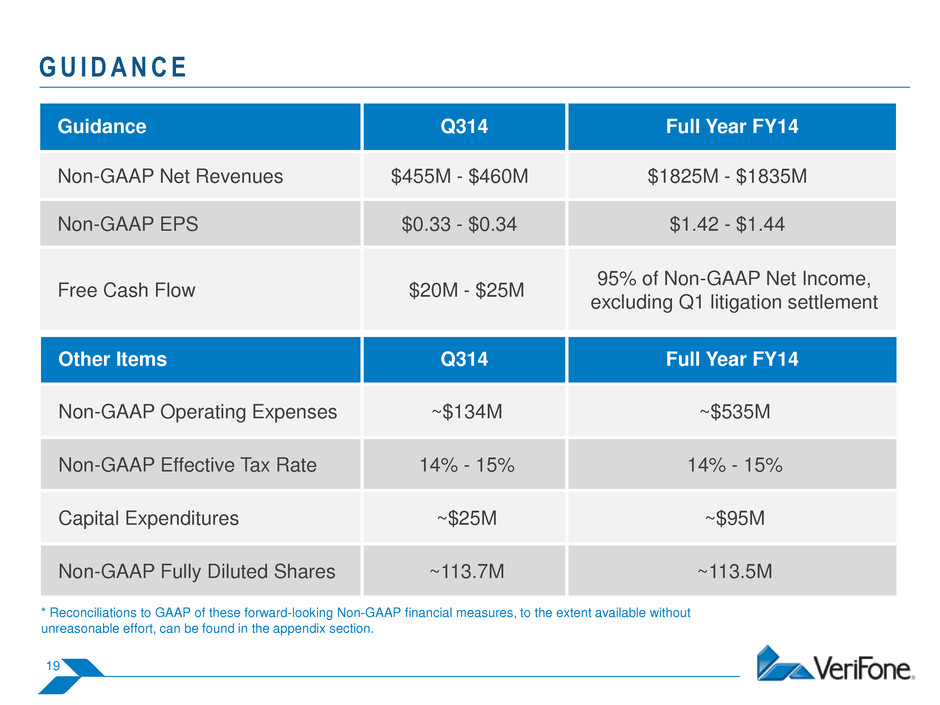
19 G U I D A N C E Guidance Q314 Full Year FY14 Non-GAAP Net Revenues $455M - $460M $1825M - $1835M Non-GAAP EPS $0.33 - $0.34 $1.42 - $1.44 Free Cash Flow $20M - $25M 95% of Non-GAAP Net Income, excluding Q1 litigation settlement Other Items Q314 Full Year FY14 Non-GAAP Operating Expenses ~$134M ~$535M Non-GAAP Effective Tax Rate 14% - 15% 14% - 15% Capital Expenditures ~$25M ~$95M Non-GAAP Fully Diluted Shares ~113.7M ~113.5M * Reconciliations to GAAP of these forward-looking Non-GAAP financial measures, to the extent available without unreasonable effort, can be found in the appendix section.

Q & A SESSION 20

APPENDIX 21
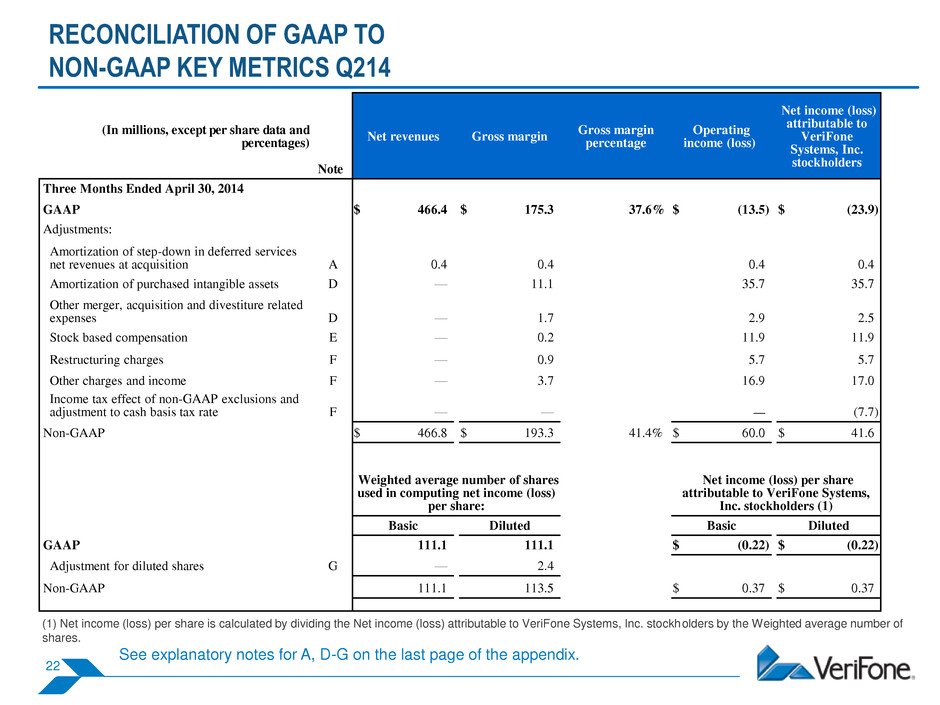
RECONCILIATION OF GAAP TO NON-GAAP KEY METRICS Q214 (In millions, except per share data and percentages) Note Net revenues Gross margin Gross margin percentage Operating income (loss) Net income (loss) attributable to VeriFone Systems, Inc. stockholders Three Months Ended April 30, 2014 GAAP $ 466.4 $ 175.3 37.6 % $ (13.5 ) $ (23.9 ) Adjustments: Amortization of step-down in deferred services net revenues at acquisition A 0.4 0.4 0.4 0.4 Amortization of purchased intangible assets D — 11.1 35.7 35.7 Other merger, acquisition and divestiture related expenses D — 1.7 2.9 2.5 Stock based compensation E — 0.2 11.9 11.9 Restructuring charges F — 0.9 5.7 5.7 Other charges and income F — 3.7 16.9 17.0 Income tax effect of non-GAAP exclusions and adjustment to cash basis tax rate F — — — (7.7 ) Non-GAAP $ 466.8 $ 193.3 41.4 % $ 60.0 $ 41.6 Weighted average number of shares used in computing net income (loss) per share: Net income (loss) per share attributable to VeriFone Systems, Inc. stockholders (1) Basic Diluted Basic Diluted GAAP 111.1 111.1 $ (0.22 ) $ (0.22 ) Adjustment for diluted shares G — 2.4 Non-GAAP 111.1 113.5 $ 0.37 $ 0.37 (1) Net income (loss) per share is calculated by dividing the Net income (loss) attributable to VeriFone Systems, Inc. stockholders by the Weighted average number of shares. See explanatory notes for A, D-G on the last page of the appendix. 22

RECONCILIATION OF GAAP TO NON-GAAP KEY METRICS Q114 (In millions, except per share data and percentages) Note Net revenues Gross margin Gross margin percentage Operating income (loss) Net income (loss) attributable to VeriFone Systems, Inc. stockholders Three Months Ended January 31, 2014 GAAP $ 436.1 $ 170.2 39.0 % $ (6.5 ) $ (16.2 ) Adjustments: Amortization of step-down in deferred services net revenues at acquisition A 1.1 1.1 1.1 1.1 Amortization of purchased intangible assets D — 11.4 36.1 36.1 Other merger, acquisition and divestiture related expenses D — 2.0 3.2 5.7 Stock based compensation E — 0.5 15.7 15.7 Other charges and income F — — 3.6 5.2 Income tax effect of non-GAAP exclusions and adjustment to cash basis tax rate F — — — (12.8 ) Non-GAAP $ 437.2 $ 185.2 42.4 % $ 53.2 $ 34.8 Weighted average number of shares used in computing net income (loss) per share: Net income (loss) per share attributable to VeriFone Systems, Inc. stockholders (1) Basic Diluted Basic Diluted GAAP 110.3 110.3 $ (0.15 ) $ (0.15 ) Adjustment for diluted shares G — 2.1 Non-GAAP 110.3 112.4 $ 0.32 $ 0.31 (1) Net income (loss) per share is calculated by dividing the Net income (loss) attributable to VeriFone Systems, Inc. stockholders by the Weighted average number of shares. See explanatory notes for A, D-G on the last page of the appendix. 23
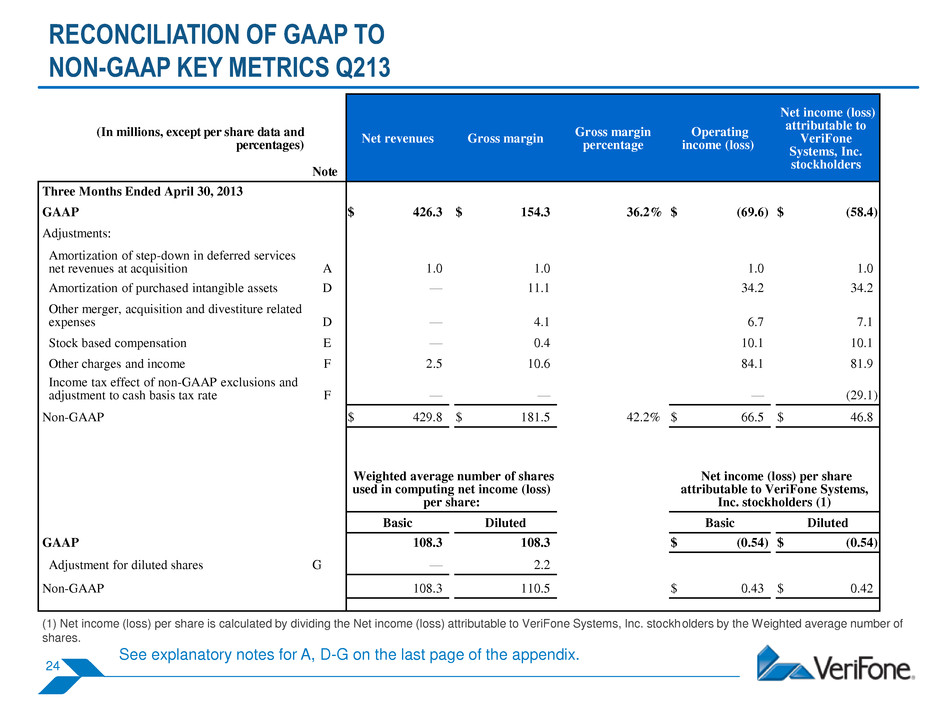
RECONCILIATION OF GAAP TO NON-GAAP KEY METRICS Q213 (In millions, except per share data and percentages) Note Net revenues Gross margin Gross margin percentage Operating income (loss) Net income (loss) attributable to VeriFone Systems, Inc. stockholders Three Months Ended April 30, 2013 GAAP $ 426.3 $ 154.3 36.2 % $ (69.6 ) $ (58.4 ) Adjustments: Amortization of step-down in deferred services net revenues at acquisition A 1.0 1.0 1.0 1.0 Amortization of purchased intangible assets D — 11.1 34.2 34.2 Other merger, acquisition and divestiture related expenses D — 4.1 6.7 7.1 Stock based compensation E — 0.4 10.1 10.1 Other charges and income F 2.5 10.6 84.1 81.9 Income tax effect of non-GAAP exclusions and adjustment to cash basis tax rate F — — — (29.1 ) Non-GAAP $ 429.8 $ 181.5 42.2 % $ 66.5 $ 46.8 Weighted average number of shares used in computing net income (loss) per share: Net income (loss) per share attributable to VeriFone Systems, Inc. stockholders (1) Basic Diluted Basic Diluted GAAP 108.3 108.3 $ (0.54 ) $ (0.54 ) Adjustment for diluted shares G — 2.2 Non-GAAP 108.3 110.5 $ 0.43 $ 0.42 (1) Net income (loss) per share is calculated by dividing the Net income (loss) attributable to VeriFone Systems, Inc. stockholders by the Weighted average number of shares. See explanatory notes for A, D-G on the last page of the appendix. 24
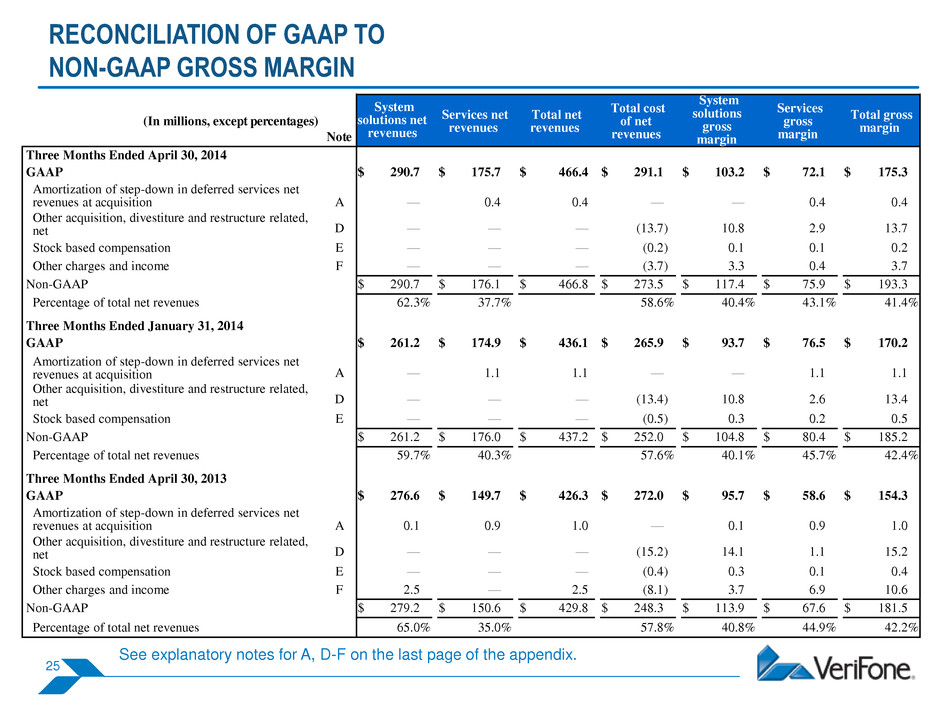
RECONCILIATION OF GAAP TO NON-GAAP GROSS MARGIN See explanatory notes for A, D-F on the last page of the appendix. (In millions, except percentages) Note System solutions net revenues Services net revenues Total net revenues Total cost of net revenues System solutions gross margin Services gross margin Total gross margin Three Months Ended April 30, 2014 GAAP $ 290.7 $ 175.7 $ 466.4 $ 291.1 $ 103.2 $ 72.1 $ 175.3 Amortization of step-down in deferred services net revenues at acquisition A — 0.4 0.4 — — 0.4 0.4 Other acquisition, divestiture and restructure related, net D — — — (13.7 ) 10.8 2.9 13.7 Stock based compensation E — — — (0.2 ) 0.1 0.1 0.2 Other charges and income F — — — (3.7 ) 3.3 0.4 3.7 Non-GAAP $ 290.7 $ 176.1 $ 466.8 $ 273.5 $ 117.4 $ 75.9 $ 193.3 Percentage of total net revenues 62.3 % 37.7 % 58.6 % 40.4 % 43.1 % 41.4 % Three Months Ended January 31, 2014 GAAP $ 261.2 $ 174.9 $ 436.1 $ 265.9 $ 93.7 $ 76.5 $ 170.2 Amortization of step-down in deferred services net revenues at acquisition A — 1.1 1.1 — — 1.1 1.1 Other acquisition, divestiture and restructure related, net D — — — (13.4 ) 10.8 2.6 13.4 Stock based compensation E — — — (0.5 ) 0.3 0.2 0.5 Non-GAAP $ 261.2 $ 176.0 $ 437.2 $ 252.0 $ 104.8 $ 80.4 $ 185.2 Percentage of total net revenues 59.7 % 40.3 % 57.6 % 40.1 % 45.7 % 42.4 % Three Months Ended April 30, 2013 GAAP $ 276.6 $ 149.7 $ 426.3 $ 272.0 $ 95.7 $ 58.6 $ 154.3 Amortization of step-down in deferred services net revenues at acquisition A 0.1 0.9 1.0 — 0.1 0.9 1.0 Other acquisition, divestiture and restructure related, net D — — — (15.2 ) 14.1 1.1 15.2 Stock based compensation E — — — (0.4 ) 0.3 0.1 0.4 Other charges and income F 2.5 — 2.5 (8.1 ) 3.7 6.9 10.6 Non-GAAP $ 279.2 $ 150.6 $ 429.8 $ 248.3 $ 113.9 $ 67.6 $ 181.5 Percentage of total net revenues 65.0 % 35.0 % 57.8 % 40.8 % 44.9 % 42.2 % 25

RECONCILIATION OF GAAP TO NON-GAAP OPERATING EXPENSES See explanatory notes for D-F on the last page of the appendix. (In millions, except percentages) Note Research and development Sales and marketing General and administrative Total Three Months Ended April 30, 2014 GAAP $ 50.0 $ 56.4 $ 48.7 $ 155.1 Other acquisition, divestiture and restructure related, net D (0.7 ) (2.6 ) (2.7 ) (6.0 ) Stock based compensation E (1.7 ) (5.9 ) (4.1 ) (11.7 ) Other charges and income F (0.1 ) (0.5 ) (3.4 ) (4.0 ) Non-GAAP $ 47.5 $ 47.4 $ 38.5 $ 133.4 As a percentage of Non-GAAP Net Revenues 10 % 10 % 8 % 29 % Three Months Ended January 31, 2014 GAAP $ 50.5 $ 50.6 $ 50.9 $ 152.0 Other acquisition, divestiture and restructure related, net D — — (1.2 ) (1.2 ) Stock based compensation E (4.1 ) (2.8 ) (8.3 ) (15.2 ) Other charges and income F — (0.4 ) (3.3 ) (3.7 ) Non-GAAP $ 46.4 $ 47.4 $ 38.1 $ 131.9 As a percentage of Non-GAAP Net Revenues 11 % 11 % 9 % 30 % Three Months Ended April 30, 2013 GAAP $ 41.6 $ 46.5 $ 43.7 $ 131.8 Other acquisition, divestiture and restructure related, net D (0.4 ) (0.2 ) (2.0 ) (2.6 ) Stock based compensation E (1.4 ) (3.8 ) (4.5 ) (9.7 ) Other charges and income F — (0.4 ) (4.1 ) (4.5 ) Non-GAAP $ 39.8 $ 42.1 $ 33.1 $ 115.0 As a percentage of Non-GAAP Net Revenues 9 % 10 % 8 % 27 % 26
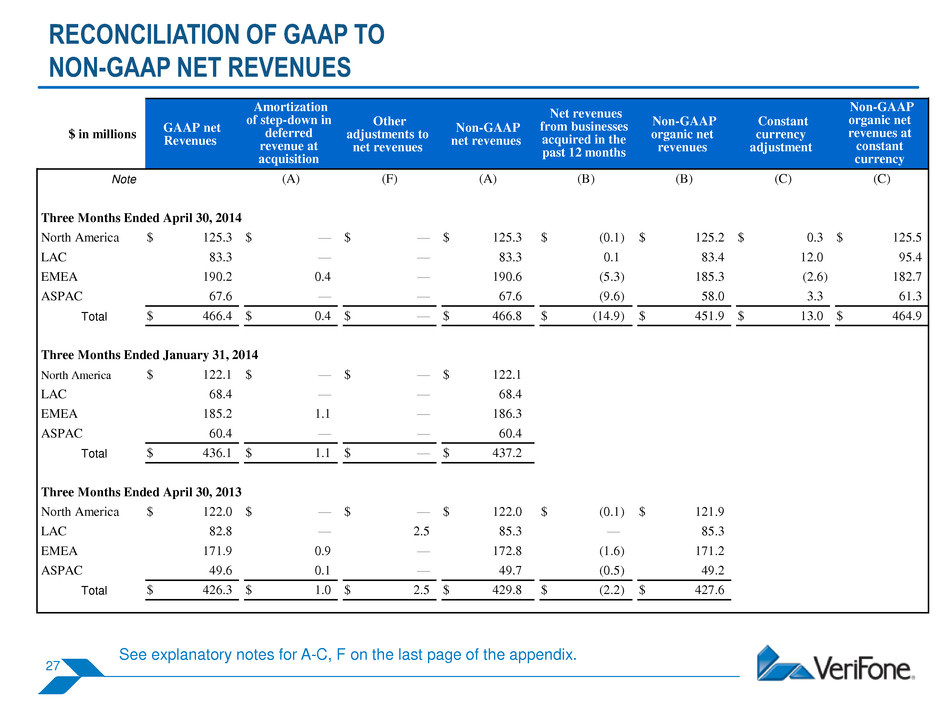
RECONCILIATION OF GAAP TO NON-GAAP NET REVENUES See explanatory notes for A-C, F on the last page of the appendix. $ in millions GAAP net Revenues Amortization of step-down in deferred revenue at acquisition Other adjustments to net revenues Non-GAAP net revenues Net revenues from businesses acquired in the past 12 months Non-GAAP organic net revenues Constant currency adjustment Non-GAAP organic net revenues at constant currency Note (A) (F) (A) (B) (B) (C) (C) Three Months Ended April 30, 2014 North America $ 125.3 $ — $ — $ 125.3 $ (0.1 ) $ 125.2 $ 0.3 $ 125.5 LAC 83.3 — — 83.3 0.1 83.4 12.0 95.4 EMEA 190.2 0.4 — 190.6 (5.3 ) 185.3 (2.6 ) 182.7 ASPAC 67.6 — — 67.6 (9.6 ) 58.0 3.3 61.3 Total $ 466.4 $ 0.4 $ — $ 466.8 $ (14.9 ) $ 451.9 $ 13.0 $ 464.9 Three Months Ended January 31, 2014 North America $ 122.1 $ — $ — $ 122.1 LAC 68.4 — — 68.4 EMEA 185.2 1.1 — 186.3 ASPAC 60.4 — — 60.4 Total $ 436.1 $ 1.1 $ — $ 437.2 Three Months Ended April 30, 2013 North America $ 122.0 $ — $ — $ 122.0 $ (0.1 ) $ 121.9 LAC 82.8 — 2.5 85.3 — 85.3 EMEA 171.9 0.9 — 172.8 (1.6 ) 171.2 ASPAC 49.6 0.1 — 49.7 (0.5 ) 49.2 Total $ 426.3 $ 1.0 $ 2.5 $ 429.8 $ (2.2 ) $ 427.6 27

RECONCILIATION OF OPERATING CASH FLOW TO FREE CASH FLOW See explanatory notes for H on the last page of the appendix. Three Months Ended $ in millions Note April 30, 2014 January 31, 2014 October 31, 2013 July 31, 2013 Free Cash Flow GAAP net cash provided by operating activities H $ 56.5 $ 31.9 $ 54.9 $ 49.0 Less: GAAP capital expenditures H (21.0 ) (20.9 ) (17.2 ) (18.1 ) Free cash flow H $ 35.5 $ 11.0 $ 37.7 $ 30.9 Three Months Ended April 30, 2013 January 31, 2013 October 31, 2012 July 31, 2012 Free Cash Flow GAAP net cash provided by operating activities H $ 79.2 $ 53.4 $ 72.6 $ 82.4 Less: GAAP capital expenditures H (21.4 ) (20.8 ) (18.6 ) (17.6 ) Free cash flow H $ 57.8 $ 32.6 $ 54.0 $ 64.8 28

RECONCILIATION OF NET REVENUES GUIDANCE See explanatory notes for A on the last page of the appendix. Three Months Ending July 31, 2014 Year Ending October 31, 2014 Range of Guidance Range of Guidance GAAP net revenues $ 454.6 $ 459.6 $ 1,822.6 $ 1,832.6 Amortization of step-down in deferred net revenues at acquisition A 0.4 0.4 2.4 2.4 Non-GAAP net revenues $ 455.0 $ 460.0 $ 1,825.0 $ 1,835.0 29
EXPLANATORY NOTES TO RECONCILIATIONS OF GAAP TO NON-GAAP ITEMS Note A: Non-GAAP net revenues. Non-GAAP net revenues exclude the fair value decrease (step-down) in deferred revenue at acquisition. Note B: Non-GAAP organic net revenues. VeriFone determines non-GAAP organic net revenues by deducting net revenues from businesses acquired in the past 12 months from non-GAAP net revenues. Net revenues from businesses acquired in the past 12 months consists of net revenues derived from the sales channels of acquired resellers and distributors, and net revenues from System solutions and Services attributable to businesses acquired in the 12 months preceding the respective financial quarter(s). For acquisitions of small businesses that are integrated within a relatively short time after the close of the acquisition, we assume quarterly net revenues attributable to such acquired businesses during the 12 months following acquisition remain at the same level as in the first full quarter after the acquisition closed. Note C: Non-GAAP organic net revenues at constant currency. VeriFone determines non-GAAP organic net revenues at constant currency by recomputing non-GAAP organic net revenues denominated in currencies other than U.S. Dollars in the current fiscal period using average exchange rates for that particular currency during the corresponding financial period of the prior year. VeriFone uses this non-GAAP measure to evaluate performance on a comparable basis excluding the impact of foreign currency fluctuations. Note D: Merger, Acquisition and Divestiture Related. VeriFone adjusts certain revenues and expenses for items that are the result of merger, acquisitions and divestitures. Acquisition related adjustments include the amortization of purchased intangible assets and fixed asset fair value adjustments, incremental costs associated with acquisitions, acquisition integration expenses, loss on financial instruments entered into to fix the acquisition purchase price in U.S. dollars when it is payable in foreign currencies and fair value increase (step-up) of inventory on acquisition, changes in estimate on contingencies that existed at the time of acquisition or collectability of associated notes receivable and gains on divestitures, as well as the net revenues, cost of net revenues and operating expenses for the three months ended January 31, 2013, that are attributable to divested assets and business operations. Note E: Stock-Based Compensation. Our non-GAAP financial measures eliminate the effect of expense for stock-based compensation. Note F: Other Charges and Income. VeriFone excludes certain revenue, expenses and other income (expense) that are the result of unique or unplanned events, such as litigation settlement and loss contingency expense, certain costs incurred in connection with senior executive management changes, certain personnel and outside professional service fees incurred on initiatives to transform, streamline and centralize our global operations, restructure and impairment charges related to certain exit activities initiated as part of our global transformation initiatives and gain or loss on financial transactions, such as the accelerated amortization of capitalized debt issuance costs due to the early repayment of debt. In addition, income taxes are adjusted for the tax effect of the adjusting items related to our non-GAAP financial measures and to reflect our estimate of cash taxes on a non-GAAP basis. Under GAAP our Income tax provision (benefit) as a percentage of Income (loss) before income taxes was 2.7% for the fiscal quarter ended April 30, 2014, 30.1% for the fiscal quarter ended January 31, 2014, 27.4% for the fiscal quarter ended April 30, 2013, 15.9% for the six months ended April 30, 2014 and 29.6% for the six months ended April 30, 2013. For non-GAAP purposes, we used a 14.5% rate for the fiscal quarters ended April 30, 2014 and January 31, 2014, as well as the six month period ended April 30, 2014, and we used a 14.0% rate for the fiscal quarter and six months ended April 30, 2013. These non-GAAP tax rates reflect our estimate of cash tax payments as a percentage of Income (loss) before income taxes for the corresponding periods. Note G: Non-GAAP diluted shares. Diluted non-GAAP weighted average shares include additional shares that are dilutive for non-GAAP computations of earnings per share in periods when we have a non-GAAP net income and a GAAP basis net loss. Note H: Free Cash Flow. VeriFone determines free cash flow as net cash provided by operating activities less capital expenditures. 30

THANK YOU 31


