
FINANCIAL RESULTS For the Second Quarter Ended April 30, 2015 Exhibit 99.2

Today’s discussion may include “forward-looking statements” within the meaning of the Private Securities Litigation Reform Act of 1995. Such statements relate to future events and expectations and involve known and unknown risks and uncertainties. Verifone’s actual results or actions may differ materially from those projected in the forward-looking statements. For a summary of the specific risk factors that could cause results to differ materially from those expressed in the forward-looking statements, please refer to Verifone’s filings with the Securities and Exchange Commission, including its annual report on Form 10-K and quarterly reports on Form 10-Q. Verifone is under no obligation to, and expressly disclaims any obligation to, update or alter its forward-looking statements, whether as a result of new information, future events, changes in assumptions or otherwise. FORWARD-LOOKING STATEMENTS 2

NON-GAAP FINANCIAL MEASURES 3 With respect to any Non-GAAP financial measures presented in the information, reconciliations of Non-GAAP to GAAP financial measures may be found in Verifone’s quarterly earnings release as filed with the Securities and Exchange Commission as well as the Appendix to these slides. Management uses Non-GAAP financial measures only in addition to and in conjunction with results presented in accordance with GAAP. Management believes that these Non-GAAP financial measures help it to evaluate Verifone’s performance and to compare Verifone’s current results with those for prior periods as well as with the results of peer companies. These Non-GAAP financial measures contain limitations and should be considered as a supplement to, and not as a substitute for, or superior to, disclosures made in accordance with GAAP.

INTRODUCTION Paul Galant Chief Executive Officer
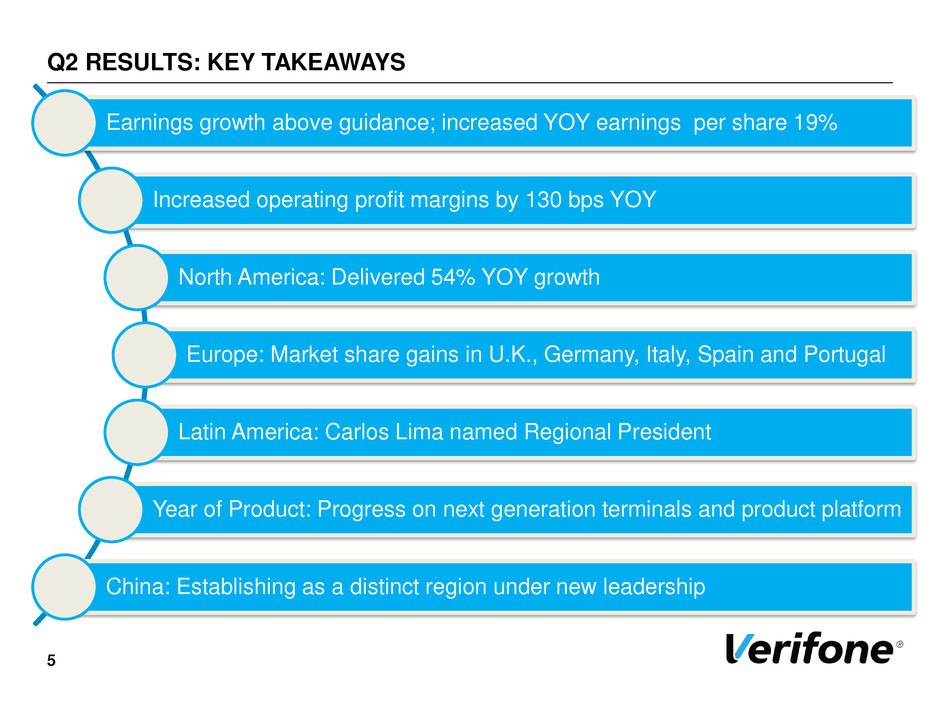
Q2 RESULTS: KEY TAKEAWAYS 5 Earnings growth above guidance; increased YOY earnings per share 19% Increased operating profit margins by 130 bps YOY North America: Delivered 54% YOY growth Europe: Market share gains in U.K., Germany, Italy, Spain and Portugal Latin America: Carlos Lima named Regional President Year of Product: Progress on next generation terminals and product platform China: Establishing as a distinct region under new leadership
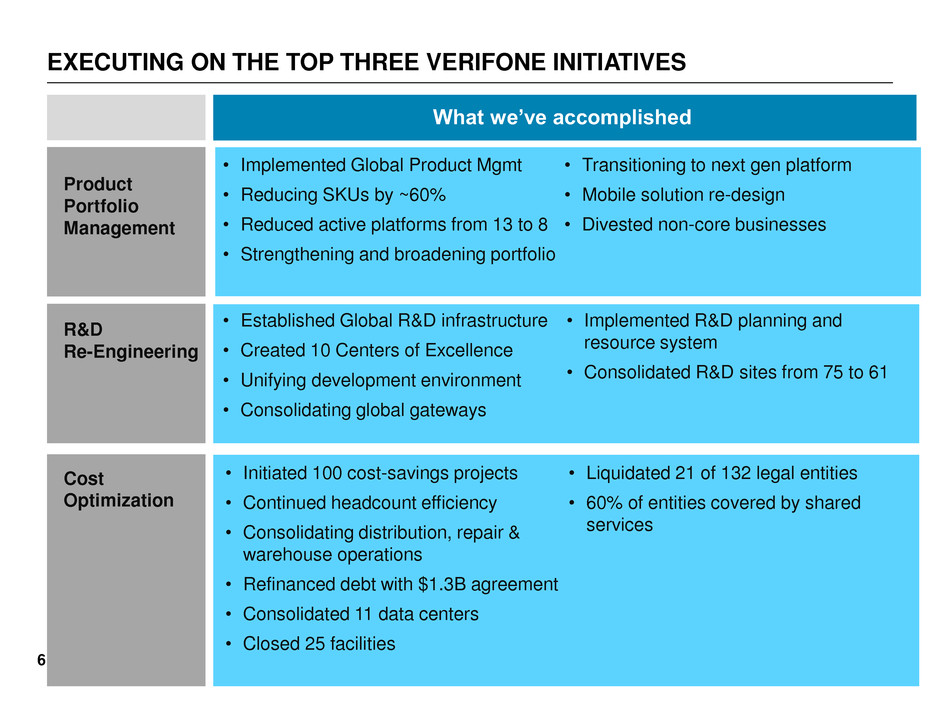
EXECUTING ON THE TOP THREE VERIFONE INITIATIVES 6 What we’ve accomplished Product Portfolio Management R&D Re-Engineering Cost Optimization • Implemented Global Product Mgmt • Reducing SKUs by ~60% • Reduced active platforms from 13 to 8 • Strengthening and broadening portfolio • Transitioning to next gen platform • Mobile solution re-design • Divested non-core businesses • Established Global R&D infrastructure • Created 10 Centers of Excellence • Unifying development environment • Consolidating global gateways • Implemented R&D planning and resource system • Consolidated R&D sites from 75 to 61 • Initiated 100 cost-savings projects • Continued headcount efficiency • Consolidating distribution, repair & warehouse operations • Refinanced debt with $1.3B agreement • Consolidated 11 data centers • Closed 25 facilities • Liquidated 21 of 132 legal entities • 60% of entities covered by shared services
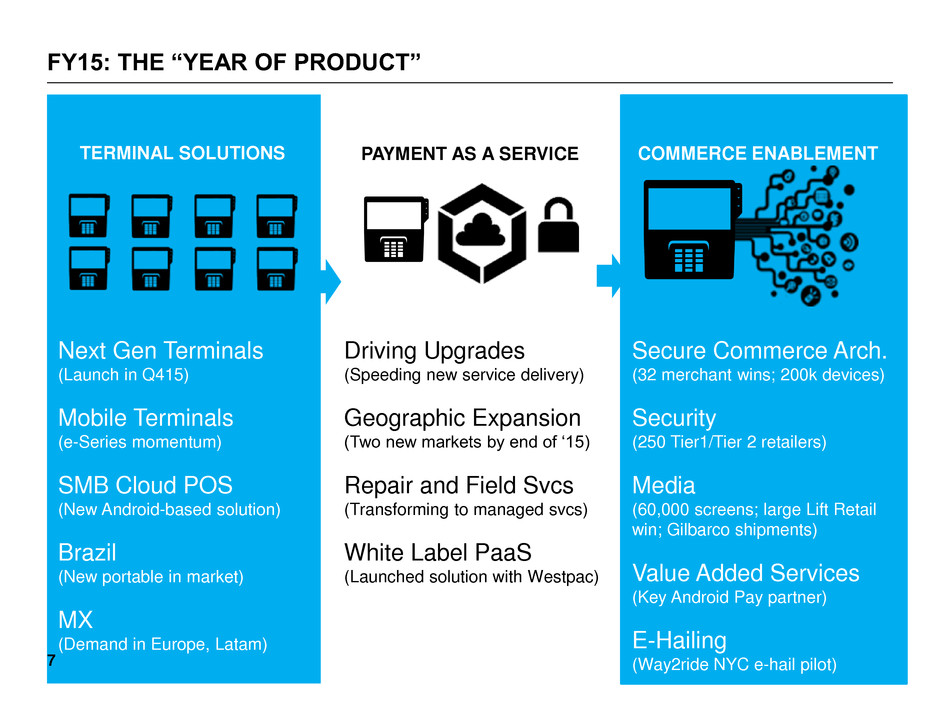
Next Gen Terminals (Launch in Q415) Mobile Terminals (e-Series momentum) SMB Cloud POS (New Android-based solution) Brazil (New portable in market) MX (Demand in Europe, Latam) COMMERCE ENABLEMENT FY15: THE “YEAR OF PRODUCT” 7 PAYMENT AS A SERVICE TERMINAL SOLUTIONS Driving Upgrades (Speeding new service delivery) Geographic Expansion (Two new markets by end of ‘15) Repair and Field Svcs (Transforming to managed svcs) White Label PaaS (Launched solution with Westpac) Secure Commerce Arch. (32 merchant wins; 200k devices) Security (250 Tier1/Tier 2 retailers) Media (60,000 screens; large Lift Retail win; Gilbarco shipments) Value Added Services (Key Android Pay partner) E-Hailing (Way2ride NYC e-hail pilot)
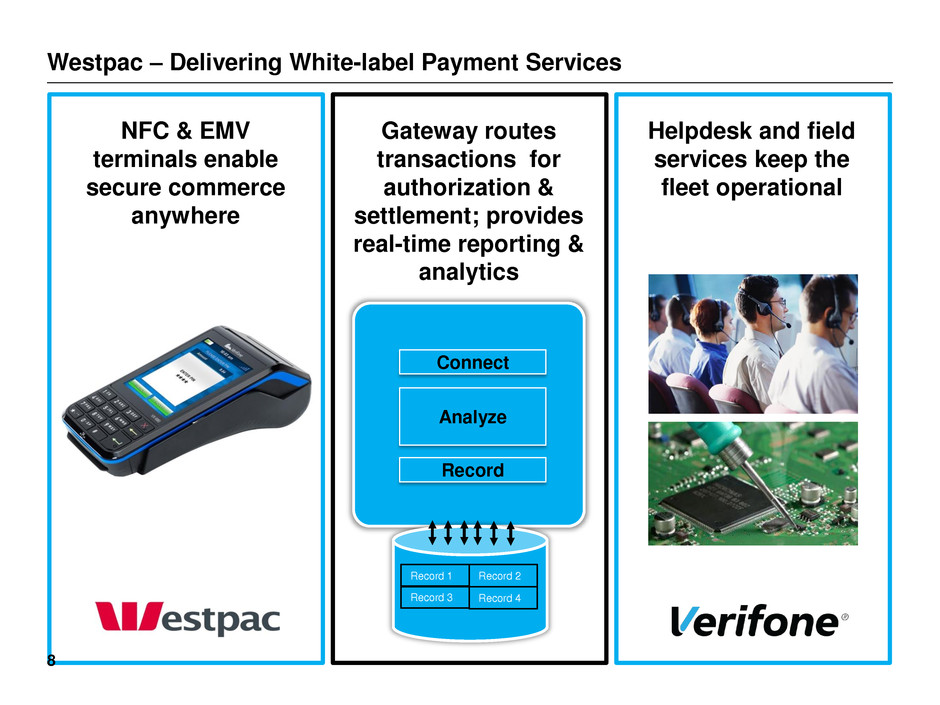
Westpac – Delivering White-label Payment Services NFC & EMV terminals enable secure commerce anywhere Gateway routes transactions for authorization & settlement; provides real-time reporting & analytics Helpdesk and field services keep the fleet operational Analyze Connect Record Record 1 Record 2 Record 3 Record 4 8
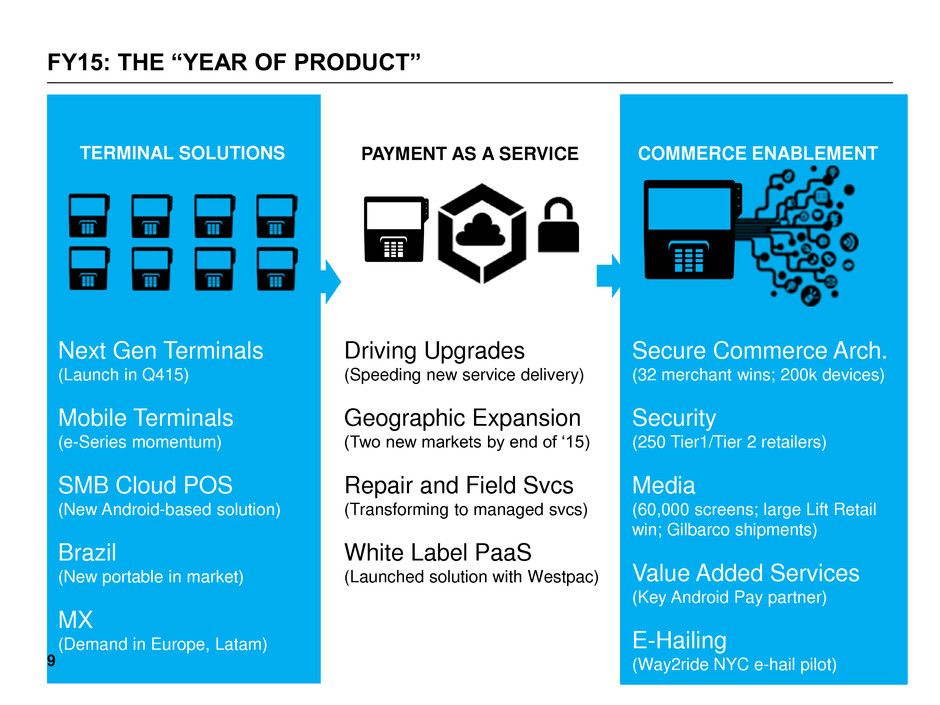
Next Gen Terminals (Launch in Q415) Mobile Terminals (e-Series momentum) SMB Cloud POS (New Android-based solution) Brazil (New portable in market) MX (Demand in Europe, Latam) COMMERCE ENABLEMENT FY15: THE “YEAR OF PRODUCT” 9 PAYMENT AS A SERVICE TERMINAL SOLUTIONS Driving Upgrades (Speeding new service delivery) Geographic Expansion (Two new markets by end of ‘15) Repair and Field Svcs (Transforming to managed svcs) White Label PaaS (Launched solution with Westpac) Secure Commerce Arch. (32 merchant wins; 200k devices) Security (250 Tier1/Tier 2 retailers) Media (60,000 screens; large Lift Retail win; Gilbarco shipments) Value Added Services (Key Android Pay partner) E-Hailing (Way2ride NYC e-hail pilot)

Verifone and Visa: Partnering to Drive Omni-Commerce Verifone and Visa to create a leading cross-channel payment solution, with extensive global reach 1 2 3 Visa and Verifone will refer clients to each other to enable faster gateway connectivity, easy integration across POS & digital commerce channels Visa and Verifone to jointly promote Verifone’s Secure Commerce Architecture to clients wishing to adopt Verifone terminals, for a more efficient, easier path to EMV + 10

Q2 FINANCIAL RESULTS AND GUIDANCE Marc Rothman Chief Financial Officer
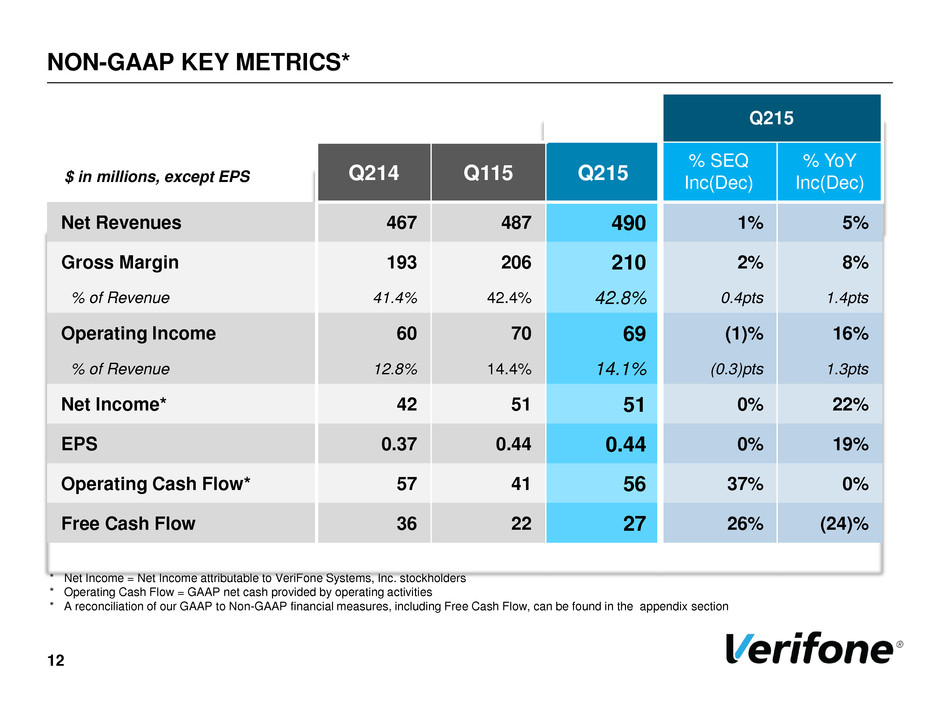
NON-GAAP KEY METRICS* 12 * Net Income = Net Income attributable to VeriFone Systems, Inc. stockholders * Operating Cash Flow = GAAP net cash provided by operating activities * A reconciliation of our GAAP to Non-GAAP financial measures, including Free Cash Flow, can be found in the appendix section Q215 Q214 Q115 Q215 % SEQ Inc(Dec) % YoY Inc(Dec) Net Revenues 467 487 490 1% 5% Gross Margin 193 206 210 2% 8% % of Revenue 41.4% 42.4% 42.8% 0.4pts 1.4pts Operating Income 60 70 69 (1)% 16% % of Revenue 12.8% 14.4% 14.1% (0.3)pts 1.3pts Net Income* 42 51 51 0% 22% EPS 0.37 0.44 0.44 0% 19% Operating Cash Flow* 57 41 56 37% 0% Free Cash Flow 36 22 27 26% (24)% $ in millions, except EPS
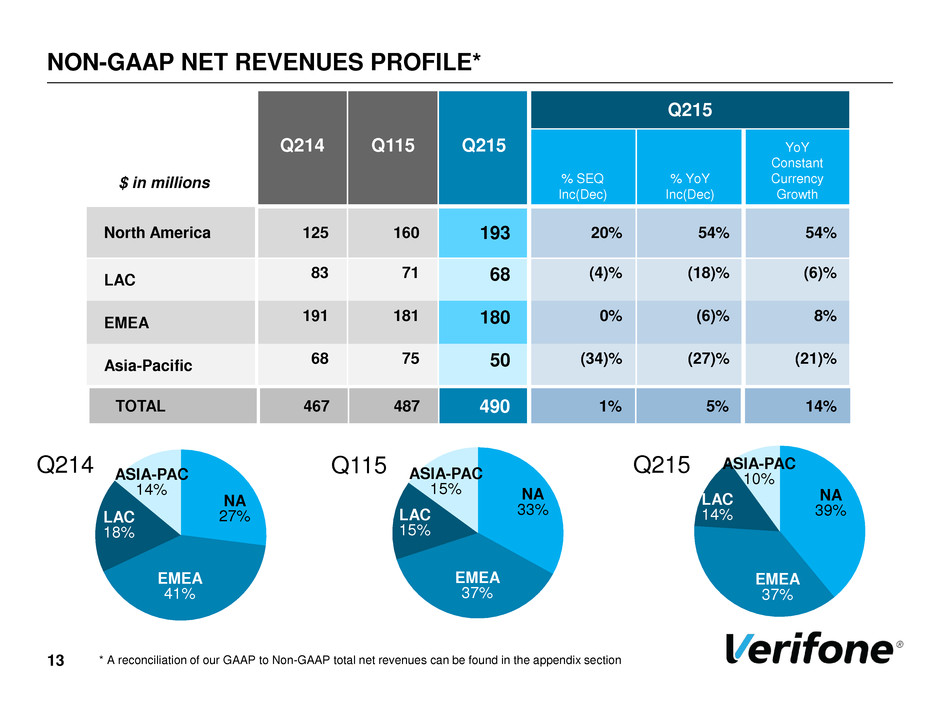
$ in millions NON-GAAP NET REVENUES PROFILE* Q215 Q214 Q115 Q215 % SEQ Inc(Dec) % YoY Inc(Dec) YoY Constant Currency Growth North America 125 160 193 20% 54% 54% LAC 83 71 68 (4)% (18)% (6)% EMEA 191 181 180 0% (6)% 8% Asia-Pacific 68 75 50 (34)% (27)% (21)% TOTAL 467 487 490 1% 5% 14% Q115 Q215 Q214 NA 27% ASIA-PAC 14% LAC 18% EMEA 41% NA 33% ASIA-PAC 15% LAC 15% EMEA 37% NA 39% ASIA-PAC 10% LAC 14% EMEA 37% 13 * A reconciliation of our GAAP to Non-GAAP total net revenues can be found in the appendix section
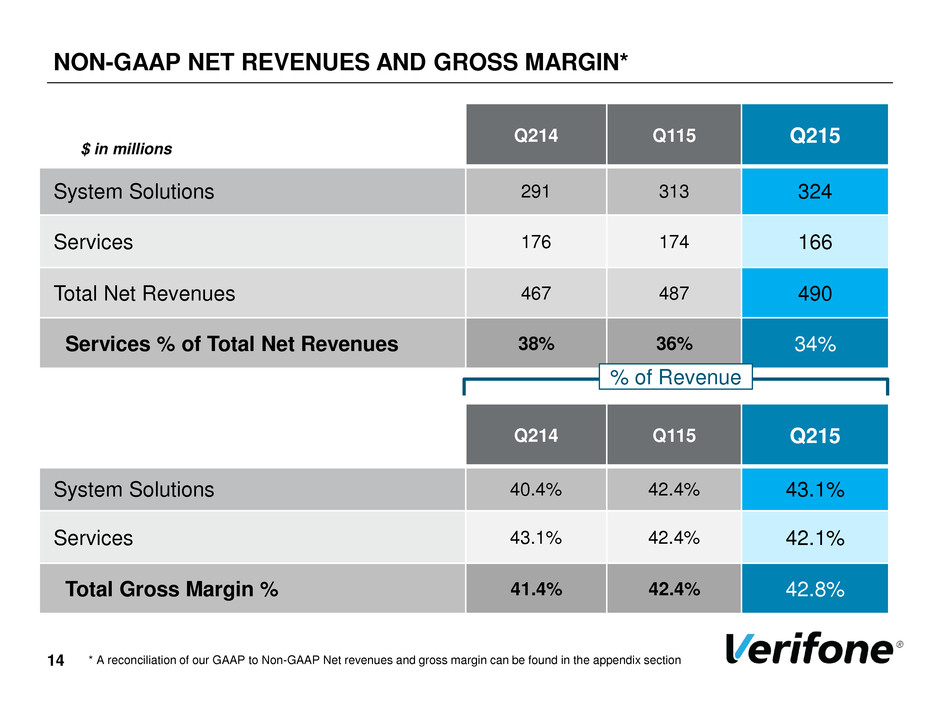
NON-GAAP NET REVENUES AND GROSS MARGIN* $ in millions Q214 Q115 Q215 System Solutions 291 313 324 Services 176 174 166 Total Net Revenues 467 487 490 Services % of Total Net Revenues 38% 36% 34% $ in millions % of Revenue Q214 Q115 Q215 System Solutions 40.4% 42.4% 43.1% Services 43.1% 42.4% 42.1% Total Gross Margin % 41.4% 42.4% 42.8% 14 * A reconciliation of our GAAP to Non-GAAP Net revenues and gross margin can be found in the appendix section
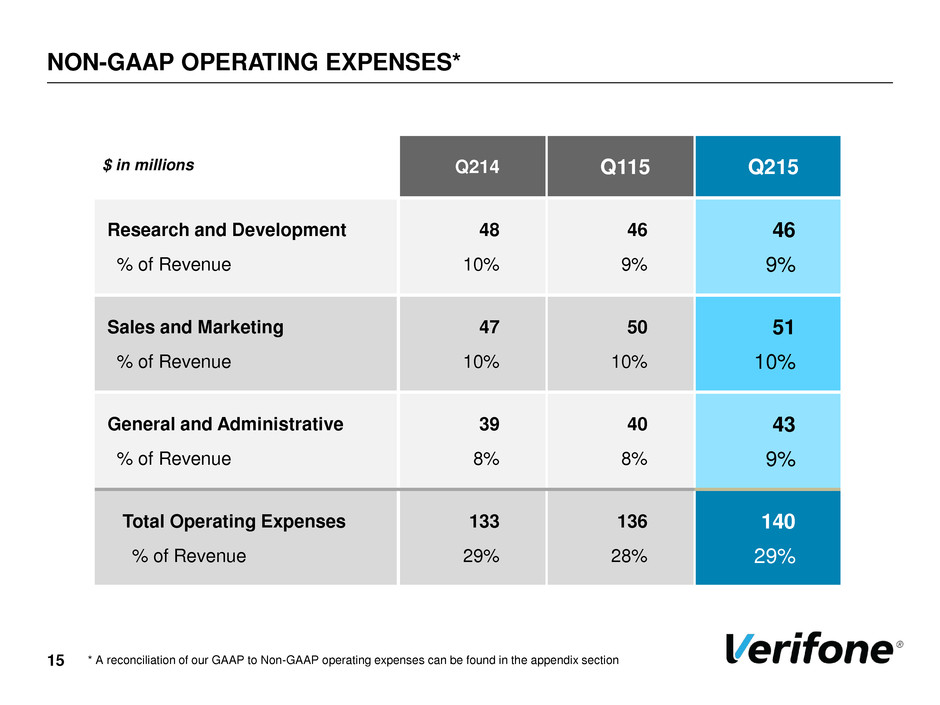
NON-GAAP OPERATING EXPENSES* 15 * A reconciliation of our GAAP to Non-GAAP operating expenses can be found in the appendix section $ in millions Q214 Q115 Q215 Research and Development 48 46 46 % of Revenue 10% 9% 9% Sales and Marketing 47 50 51 % of Revenue 10% 10% 10% General and Administrative 39 40 43 % of Revenue 8% 8% 9% Total Operating Expenses 133 136 140 % of Revenue 29% 28% 29%
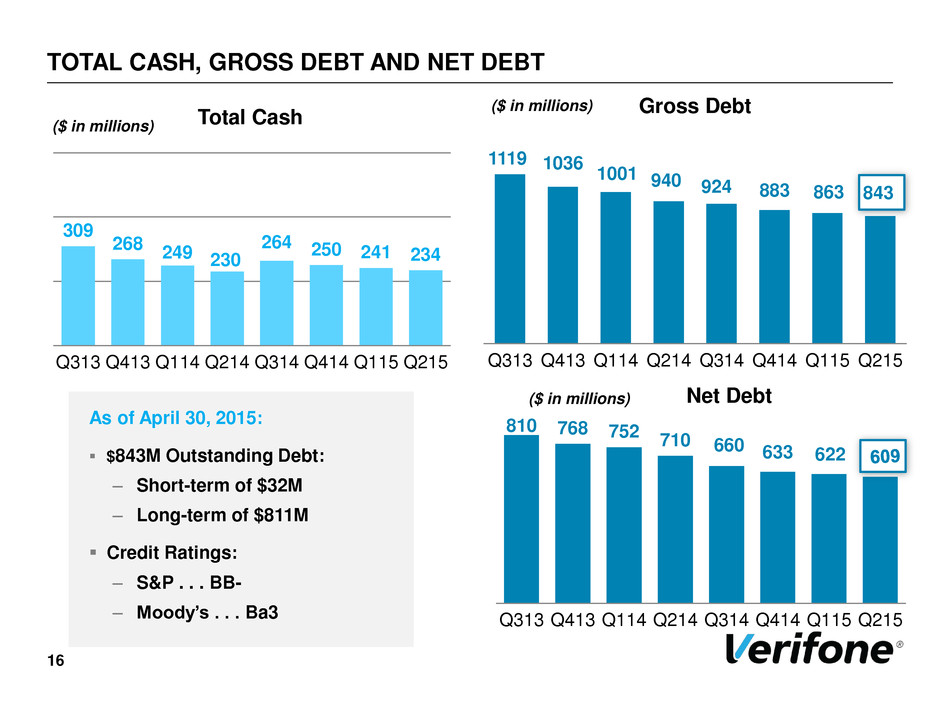
TOTAL CASH, GROSS DEBT AND NET DEBT Total Cash ($ in millions) 309 268 249 230 264 250 241 234 Q313 Q413 Q114 Q214 Q314 Q414 Q115 Q215 Gross Debt ($ in millions) 1119 1036 1001 940 924 883 863 843 Q313 Q413 Q114 Q214 Q314 Q414 Q115 Q215 843 As of April 30, 2015: $843M Outstanding Debt: – Short-term of $32M – Long-term of $811M Credit Ratings: – S&P . . . BB- – Moody’s . . . Ba3 Net Debt ($ in millions) 810 768 752 710 660 633 622 609 Q313 Q413 Q114 Q214 Q314 Q414 Q115 Q215 16
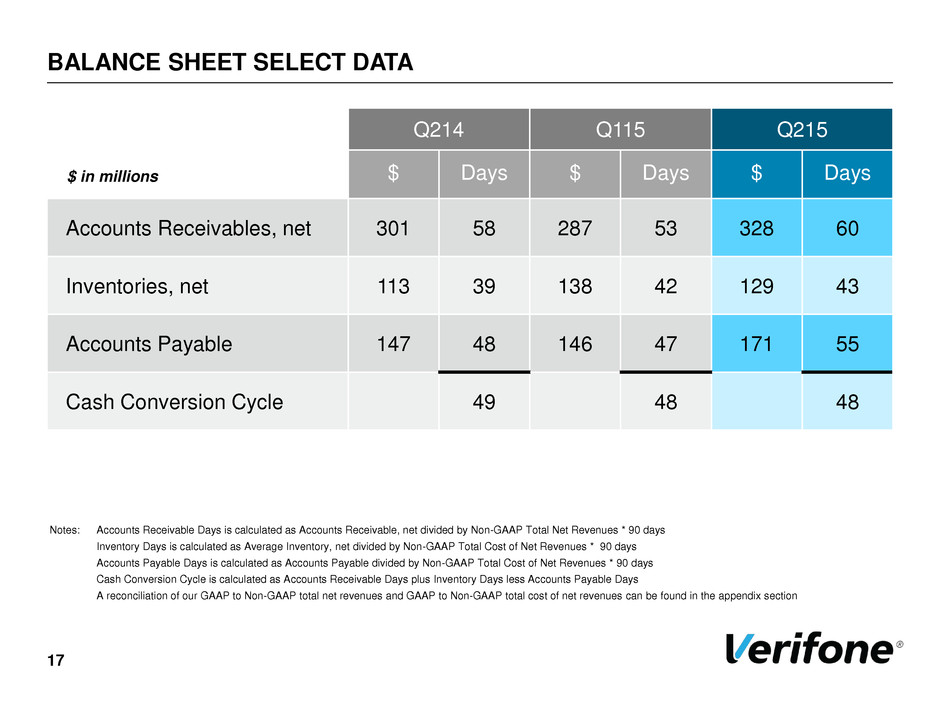
Q214 Q115 Q215 $ Days $ Days $ Days Accounts Receivables, net 301 58 287 53 328 60 Inventories, net 113 39 138 42 129 43 Accounts Payable 147 48 146 47 171 55 Cash Conversion Cycle 49 48 48 $ in millions Notes: Accounts Receivable Days is calculated as Accounts Receivable, net divided by Non-GAAP Total Net Revenues * 90 days Inventory Days is calculated as Average Inventory, net divided by Non-GAAP Total Cost of Net Revenues * 90 days Accounts Payable Days is calculated as Accounts Payable divided by Non-GAAP Total Cost of Net Revenues * 90 days Cash Conversion Cycle is calculated as Accounts Receivable Days plus Inventory Days less Accounts Payable Days A reconciliation of our GAAP to Non-GAAP total net revenues and GAAP to Non-GAAP total cost of net revenues can be found in the appendix section BALANCE SHEET SELECT DATA 17

WORKING CAPITAL TREND Working Capital Performance* 19.7% 17.7% 15.7% 14.3% 14.1% 13.7% 14.3% 14.6% 10.0% 12.0% 14.0% 16.0% 18.0% 20.0% 22.0% Q313 Q413 Q114 Q214 Q314 Q414 Q115 Q215 Percent of S a le s Y/Y changes • AR increased $27M • Inventory increased $16M • AP increased $24M 18 * Working Capital Performance, as % of Non-GAAP Total Net Revenues = working capital / quarterly non-GAAP Total Net Revenues annualized • Working Capital = AR + Inventory – AP • A reconciliation of our GAAP to Non-GAAP total net revenues can be found in the appendix section
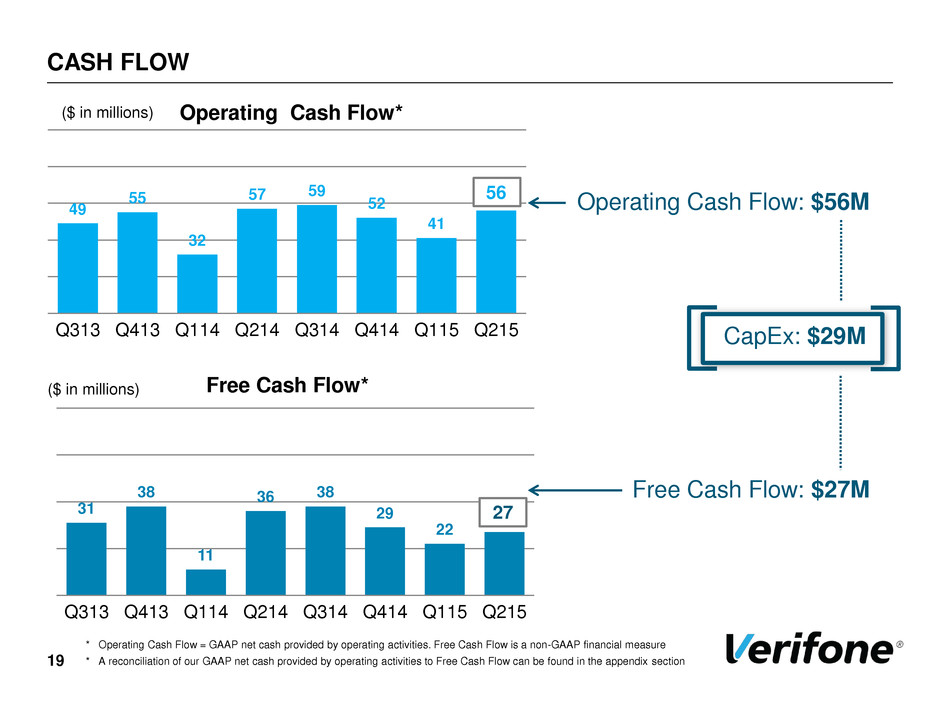
49 55 32 57 59 52 41 Q313 Q413 Q114 Q214 Q314 Q414 Q115 Q215 CASH FLOW 56 31 38 11 36 38 29 22 27 Q313 Q413 Q114 Q214 Q314 Q414 Q115 Q215 Free Cash Flow* 27 ($ in millions) ($ in millions) Operating Cash Flow: $56M Free Cash Flow: $27M CapEx: $29M Operating Cash Flow* 19 * Operating Cash Flow = GAAP net cash provided by operating activities. Free Cash Flow is a non-GAAP financial measure * A reconciliation of our GAAP net cash provided by operating activities to Free Cash Flow can be found in the appendix section
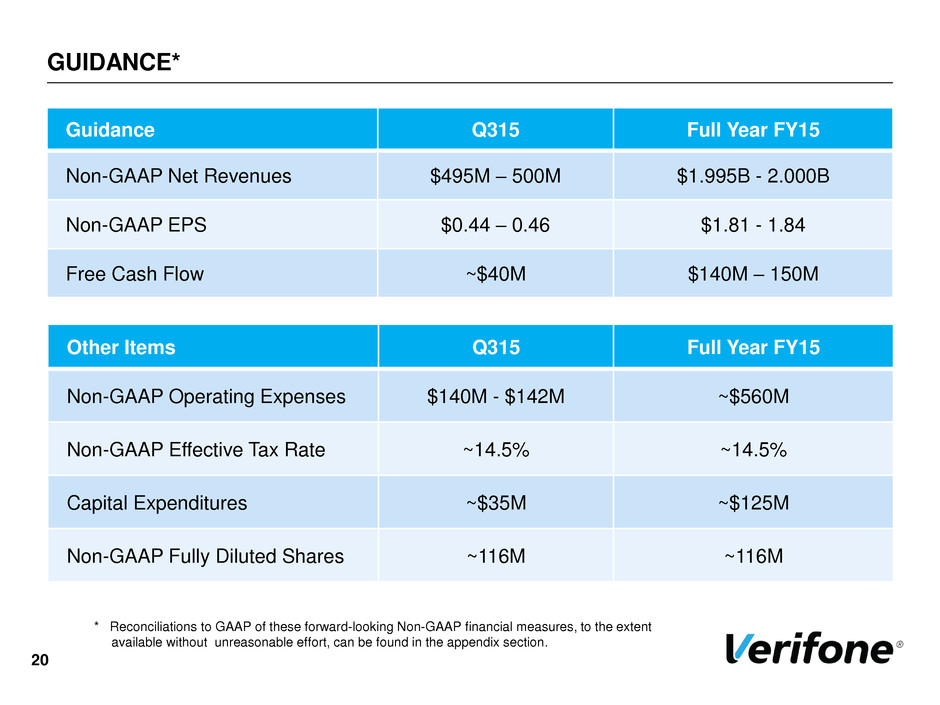
20 Guidance Q315 Full Year FY15 Non-GAAP Net Revenues $495M – 500M $1.995B - 2.000B Non-GAAP EPS $0.44 – 0.46 $1.81 - 1.84 Free Cash Flow ~$40M $140M – 150M Other Items Q315 Full Year FY15 Non-GAAP Operating Expenses $140M - $142M ~$560M Non-GAAP Effective Tax Rate ~14.5% ~14.5% Capital Expenditures ~$35M ~$125M Non-GAAP Fully Diluted Shares ~116M ~116M * Reconciliations to GAAP of these forward-looking Non-GAAP financial measures, to the extent available without unreasonable effort, can be found in the appendix section. GUIDANCE*
CONCLUSION Paul Galant Chief Executive Officer

Q&A SESSION
APPENDIX
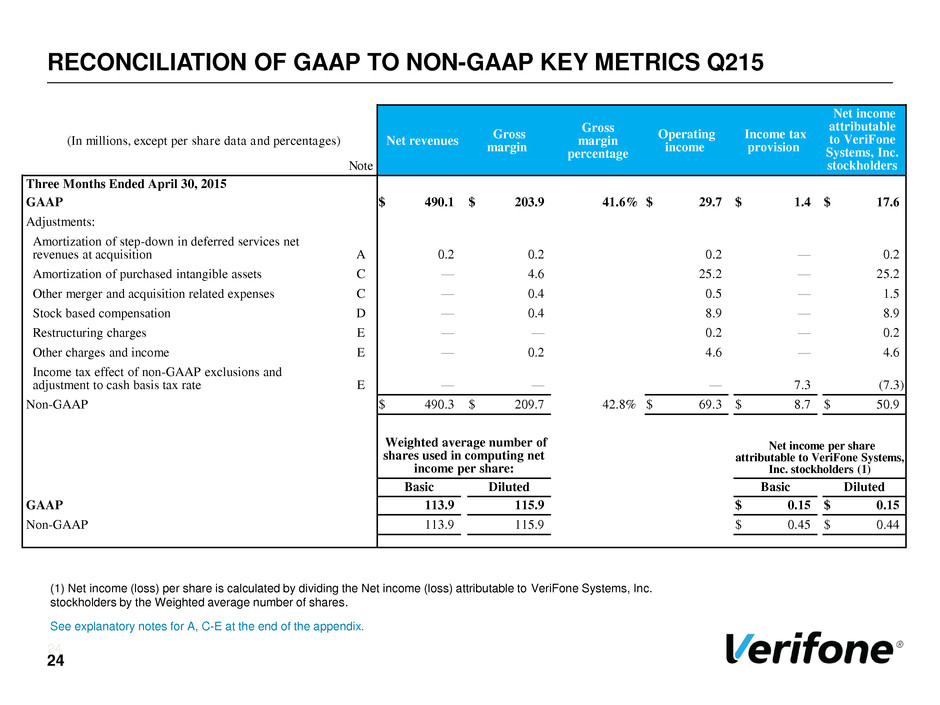
RECONCILIATION OF GAAP TO NON-GAAP KEY METRICS Q215 24 (1) Net income (loss) per share is calculated by dividing the Net income (loss) attributable to VeriFone Systems, Inc. stockholders by the Weighted average number of shares. See explanatory notes for A, C-E at the end of the appendix. 24 (In millions, except per share data and percentages) Note Net revenues Gross margin Gross margin percentage Operating income Income tax provision Net income attributable to VeriFone Systems, Inc. stockholders Three Months Ended April 30, 2015 GAAP $ 490.1 $ 203.9 41.6 % $ 29.7 $ 1.4 $ 17.6 Adjustments: Amortization of step-down in deferred services net revenues at acquisition A 0.2 0.2 0.2 — 0.2 Amortization of purchased intangible assets C — 4.6 25.2 — 25.2 Other merger and acquisition related expenses C — 0.4 0.5 — 1.5 Stock based compensation D — 0.4 8.9 — 8.9 Restructuring charges E — — 0.2 — 0.2 Other charges and income E — 0.2 4.6 — 4.6 Income tax effect of non-GAAP exclusions and adjustment to cash basis tax rate E — — — 7.3 (7.3 ) Non-GAAP $ 490.3 $ 209.7 42.8 % $ 69.3 $ 8.7 $ 50.9 Weighted average number of shares used in computing net income per share: Net income per share attributable to VeriFone Systems, Inc. stockholders (1) Basic Diluted Basic Diluted GAAP 113.9 115.9 $ 0.15 $ 0.15 Non-GAAP 113.9 115.9 $ 0.45 $ 0.44
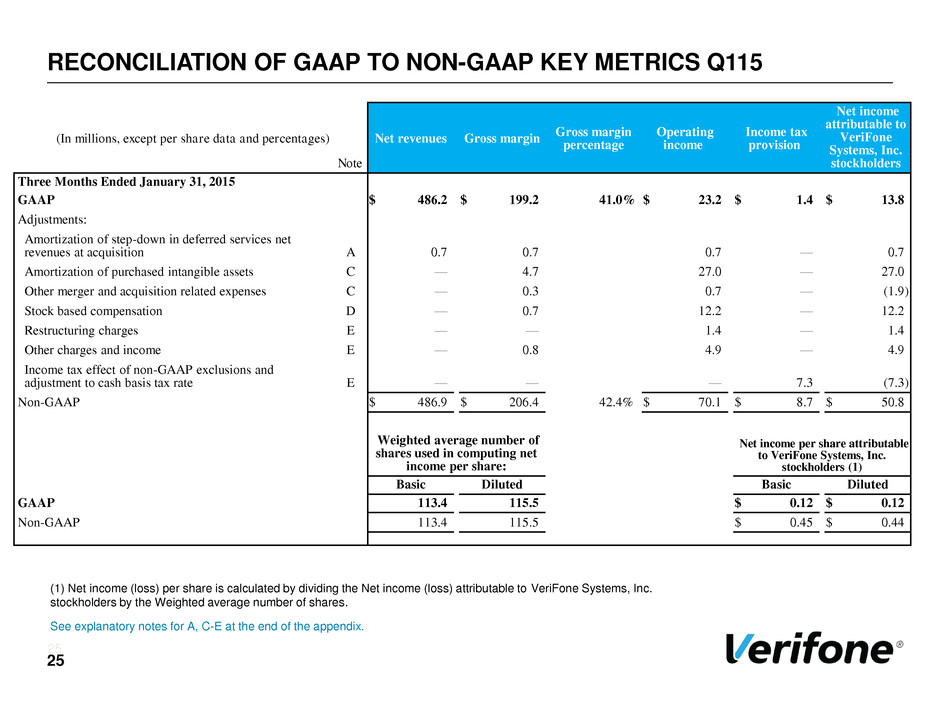
RECONCILIATION OF GAAP TO NON-GAAP KEY METRICS Q115 25 (1) Net income (loss) per share is calculated by dividing the Net income (loss) attributable to VeriFone Systems, Inc. stockholders by the Weighted average number of shares. See explanatory notes for A, C-E at the end of the appendix. 25 (In millions, except per share data and percentages) Note Net revenues Gross margin Gross margin percentage Operating income Income tax provision Net income attributable to VeriFone Systems, Inc. stockholders Three Months Ended January 31, 2015 GAAP $ 486.2 $ 199.2 41.0 % $ 23.2 $ 1.4 $ 13.8 Adjustments: Amortization of step-down in deferred services net revenues at acquisition A 0.7 0.7 0.7 — 0.7 Amortization of purchased intangible assets C — 4.7 27.0 — 27.0 Other merger and acquisition related expenses C — 0.3 0.7 — (1.9 ) Stock based compensation D — 0.7 12.2 — 12.2 Restructuring charges E — — 1.4 — 1.4 Other charges and income E — 0.8 4.9 — 4.9 Income tax effect of non-GAAP exclusions and adjustment to cash basis tax rate E — — — 7.3 (7.3 ) Non-GAAP $ 486.9 $ 206.4 42.4 % $ 70.1 $ 8.7 $ 50.8 Weighted average number of shares used in computing net income per share: Net income per share attributable to VeriFone Systems, Inc. stockholders (1) Basic Diluted Basic Diluted GAAP 113.4 115.5 $ 0.12 $ 0.12 Non-GAAP 113.4 115.5 $ 0.45 $ 0.44
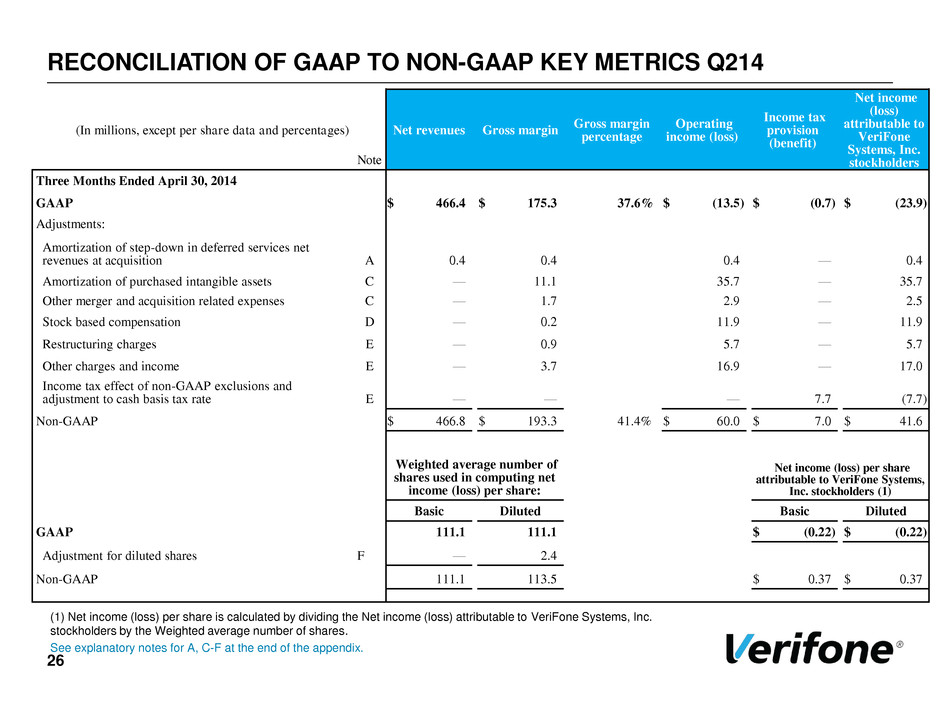
RECONCILIATION OF GAAP TO NON-GAAP KEY METRICS Q214 26 (1) Net income (loss) per share is calculated by dividing the Net income (loss) attributable to VeriFone Systems, Inc. stockholders by the Weighted average number of shares. See explanatory notes for A, C-F at the end of the appendix. (In millions, except per share data and percentages) Note Net revenues Gross margin Gross margin percentage Operating income (loss) Income tax provision (benefit) Net income (loss) attributable to VeriFone Systems, Inc. stockholders Three Months Ended April 30, 2014 GAAP $ 466.4 $ 175.3 37.6 % $ (13.5 ) $ (0.7 ) $ (23.9 ) Adjustments: Amortization of step-down in deferred services net revenues at acquisition A 0.4 0.4 0.4 — 0.4 Amortization of purchased intangible assets C — 11.1 35.7 — 35.7 Other merger and acquisition related expenses C — 1.7 2.9 — 2.5 Stock based compensation D — 0.2 11.9 — 11.9 Restructuring charges E — 0.9 5.7 — 5.7 Other charges and income E — 3.7 16.9 — 17.0 Income tax effect of non-GAAP exclusions and adjustment to cash basis tax rate E — — — 7.7 (7.7 ) Non-GAAP $ 466.8 $ 193.3 41.4 % $ 60.0 $ 7.0 $ 41.6 Weighted average number of shares used in computing net income (loss) per share: Net income (loss) per share attributable to VeriFone Systems, Inc. stockholders (1) Basic Diluted Basic Diluted GAAP 111.1 111.1 $ (0.22 ) $ (0.22 ) Adjustment for diluted shares F — 2.4 Non-GAAP 111.1 113.5 $ 0.37 $ 0.37
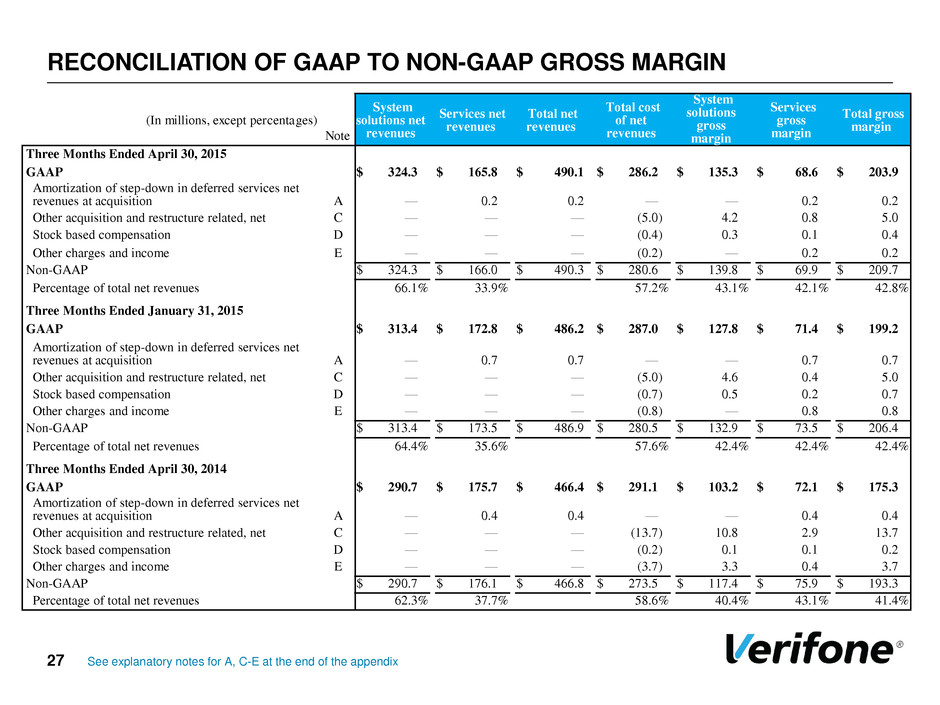
RECONCILIATION OF GAAP TO NON-GAAP GROSS MARGIN 27 See explanatory notes for A, C-E at the end of the appendix (In millions, except percentages) Note System solutions net revenues Services net revenues Total net revenues Total cost of net revenues System solutions gross margin Services gross margin Total gross margin Three Months Ended April 30, 2015 GAAP $ 324.3 $ 165.8 $ 490.1 $ 286.2 $ 135.3 $ 68.6 $ 203.9 Amortization of step-down in deferred services net revenues at acquisition A — 0.2 0.2 — — 0.2 0.2 Other acquisition and restructure related, net C — — — (5.0 ) 4.2 0.8 5.0 Stock based compensation D — — — (0.4 ) 0.3 0.1 0.4 Other charges and income E — — — (0.2 ) — 0.2 0.2 Non-GAAP $ 324.3 $ 166.0 $ 490.3 $ 280.6 $ 139.8 $ 69.9 $ 209.7 Percentage of total net revenues 66.1 % 33.9 % 57.2 % 43.1 % 42.1 % 42.8 % Three Months Ended January 31, 2015 GAAP $ 313.4 $ 172.8 $ 486.2 $ 287.0 $ 127.8 $ 71.4 $ 199.2 Amortization of step-down in deferred services net revenues at acquisition A — 0.7 0.7 — — 0.7 0.7 Other acquisition and restructure related, net C — — — (5.0 ) 4.6 0.4 5.0 Stock based compensation D — — — (0.7 ) 0.5 0.2 0.7 Other charges and income E — — — (0.8 ) — 0.8 0.8 Non-GAAP $ 313.4 $ 173.5 $ 486.9 $ 280.5 $ 132.9 $ 73.5 $ 206.4 Percentage of total net revenues 64.4 % 35.6 % 57.6 % 42.4 % 42.4 % 42.4 % Three Months Ended April 30, 2014 GAAP $ 290.7 $ 175.7 $ 466.4 $ 291.1 $ 103.2 $ 72.1 $ 175.3 Amortization of step-down in deferred services net revenues at acquisition A — 0.4 0.4 — — 0.4 0.4 Other acquisition and restructure related, net C — — — (13.7 ) 10.8 2.9 13.7 Stock based compensation D — — — (0.2 ) 0.1 0.1 0.2 Other charges and income E — — — (3.7 ) 3.3 0.4 3.7 Non-GAAP $ 290.7 $ 176.1 $ 466.8 $ 273.5 $ 117.4 $ 75.9 $ 193.3 Percentage of total net revenues 62.3 % 37.7 % 58.6 % 40.4 % 43.1 % 41.4 %
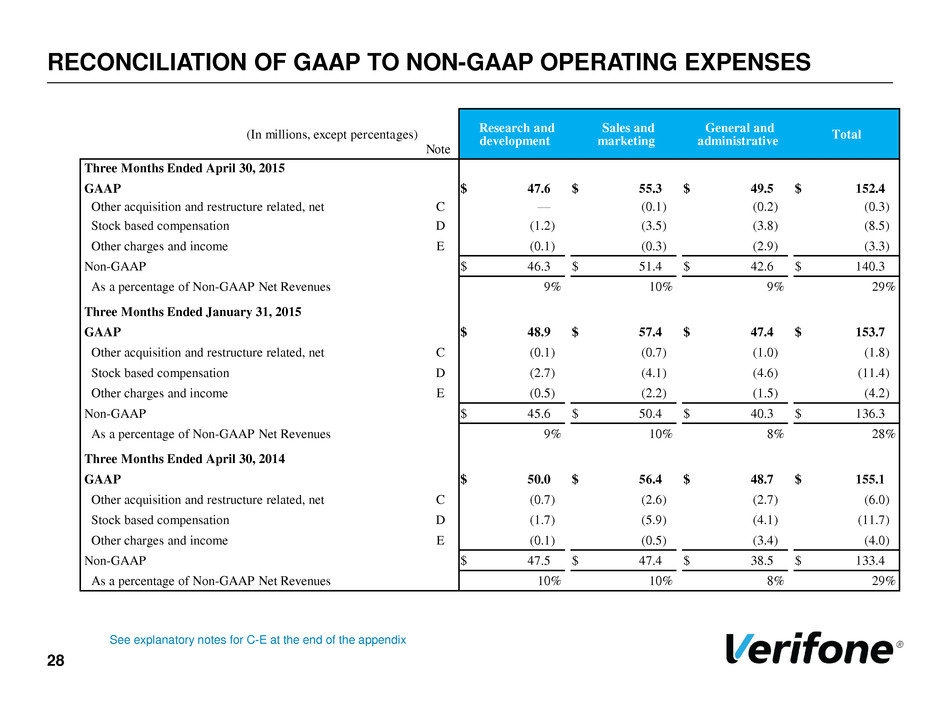
RECONCILIATION OF GAAP TO NON-GAAP OPERATING EXPENSES 28 See explanatory notes for C-E at the end of the appendix (In millions, except percentages) Note Research and development Sales and marketing General and administrative Total Three Months Ended April 30, 2015 GAAP $ 47.6 $ 55.3 $ 49.5 $ 152.4 Other acquisition and restructure related, net C — (0.1 ) (0.2 ) (0.3 ) Stock based compensation D (1.2 ) (3.5 ) (3.8 ) (8.5 ) Other charges and income E (0.1 ) (0.3 ) (2.9 ) (3.3 ) Non-GAAP $ 46.3 $ 51.4 $ 42.6 $ 140.3 As a percentage of Non-GAAP Net Revenues 9 % 10 % 9 % 29 % Three Months Ended January 31, 2015 GAAP $ 48.9 $ 57.4 $ 47.4 $ 153.7 Other acquisition and restructure related, net C (0.1 ) (0.7 ) (1.0 ) (1.8 ) Stock based compensation D (2.7 ) (4.1 ) (4.6 ) (11.4 ) Other charges and income E (0.5 ) (2.2 ) (1.5 ) (4.2 ) Non-GAAP $ 45.6 $ 50.4 $ 40.3 $ 136.3 As a percentage of Non-GAAP Net Revenues 9 % 10 % 8 % 28 % Three Months Ended April 30, 2014 GAAP $ 50.0 $ 56.4 $ 48.7 $ 155.1 Other acquisition and restructure related, net C (0.7 ) (2.6 ) (2.7 ) (6.0 ) Stock based compensation D (1.7 ) (5.9 ) (4.1 ) (11.7 ) Other charges and income E (0.1 ) (0.5 ) (3.4 ) (4.0 ) Non-GAAP $ 47.5 $ 47.4 $ 38.5 $ 133.4 As a percentage of Non-GAAP Net Revenues 10 % 10 % 8 % 29 %

RECONCILIATION OF GAAP TO NON-GAAP NET REVENUES 29 See explanatory notes for A-B at the end of the appendix. $ in millions GAAP net revenues Amortization of step-down in deferred revenue at acquisition Non-GAAP net revenues Constant currency adjustment Non-GAAP net revenues at constant currency Note (A) (A) (B) (B) Three Months Ended April 30, 2015 North America $ 193.0 $ — $ 193.0 $ 0.4 $ 193.4 LAC 68.1 — 68.1 10.2 78.3 EMEA 179.4 0.2 179.6 25.5 205.1 Asia-Pacific 49.6 — 49.6 3.6 53.2 Total $ 490.1 $ 0.2 $ 490.3 $ 39.7 $ 530.0 Three Months Ended January 31, 2015 North America $ 160.3 $ 0.1 $ 160.4 LAC 71.1 — 71.1 EMEA 180.0 0.5 180.5 Asia-Pacific 74.8 0.1 74.9 Total $ 486.2 $ 0.7 $ 486.9 Three Months Ended April 30, 2014 North America $ 125.3 $ — $ 125.3 LAC 83.3 — 83.3 EMEA 190.2 0.4 190.6 Asia-Pacific 67.6 — 67.6 Total $ 466.4 $ 0.4 $ 466.8

RECONCILIATION OF OPERATING CASH FLOW TO FREE CASH FLOW 30 See explanatory notes for G at the end of the appendix. Three Months Ended $ in millions Note April 30, 2015 January 31, 2015 October 31, 2014 July 31, 2014 Free Cash Flow GAAP net cash provided by operating activities G $ 56.3 $ 41.1 $ 51.6 $ 58.9 Less: GAAP capital expenditures G (29.3 ) (19.6 ) (22.2 ) (20.9 ) Free cash flow G $ 27.0 $ 21.5 $ 29.4 $ 38.0 Three Months Ended April 30, 2014 January 31, 2014 October 31, 2013 July 31, 2013 Free Cash Flow GAAP net cash provided by operating activities G $ 56.5 $ 31.9 $ 54.9 $ 49.0 Less: GAAP capital expenditures G (21.0 ) (20.9 ) (17.2 ) (18.1 ) Free cash flow G $ 35.5 $ 11.0 $ 37.7 $ 30.9
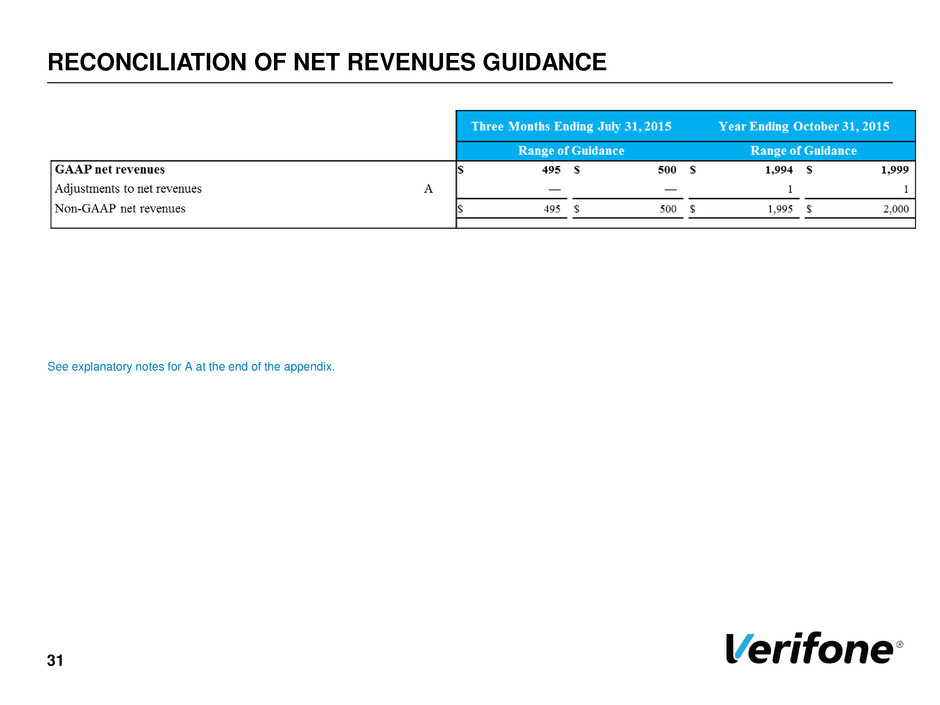
RECONCILIATION OF NET REVENUES GUIDANCE 31 See explanatory notes for A at the end of the appendix.
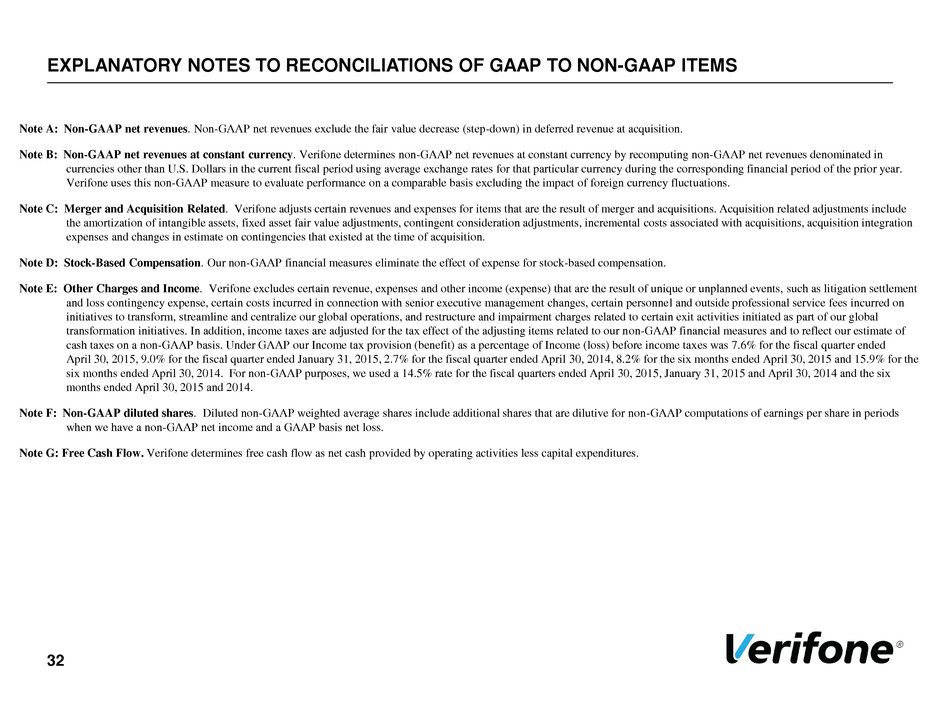
EXPLANATORY NOTES TO RECONCILIATIONS OF GAAP TO NON-GAAP ITEMS 32 Note A: Non-GAAP net revenues. Non-GAAP net revenues exclude the fair value decrease (step-down) in deferred revenue at acquisition. Note B: Non-GAAP net revenues at constant currency. Verifone determines non-GAAP net revenues at constant currency by recomputing non-GAAP net revenues denominated in currencies other than U.S. Dollars in the current fiscal period using average exchange rates for that particular currency during the corresponding financial period of the prior year. Verifone uses this non-GAAP measure to evaluate performance on a comparable basis excluding the impact of foreign currency fluctuations. Note C: Merger and Acquisition Related. Verifone adjusts certain revenues and expenses for items that are the result of merger and acquisitions. Acquisition related adjustments include the amortization of intangible assets, fixed asset fair value adjustments, contingent consideration adjustments, incremental costs associated with acquisitions, acquisition integration expenses and changes in estimate on contingencies that existed at the time of acquisition. Note D: Stock-Based Compensation. Our non-GAAP financial measures eliminate the effect of expense for stock-based compensation. Note E: Other Charges and Income. Verifone excludes certain revenue, expenses and other income (expense) that are the result of unique or unplanned events, such as litigation settlement and loss contingency expense, certain costs incurred in connection with senior executive management changes, certain personnel and outside professional service fees incurred on initiatives to transform, streamline and centralize our global operations, and restructure and impairment charges related to certain exit activities initiated as part of our global transformation initiatives. In addition, income taxes are adjusted for the tax effect of the adjusting items related to our non-GAAP financial measures and to reflect our estimate of cash taxes on a non-GAAP basis. Under GAAP our Income tax provision (benefit) as a percentage of Income (loss) before income taxes was 7.6% for the fiscal quarter ended April 30, 2015, 9.0% for the fiscal quarter ended January 31, 2015, 2.7% for the fiscal quarter ended April 30, 2014, 8.2% for the six months ended April 30, 2015 and 15.9% for the six months ended April 30, 2014. For non-GAAP purposes, we used a 14.5% rate for the fiscal quarters ended April 30, 2015, January 31, 2015 and April 30, 2014 and the six months ended April 30, 2015 and 2014. Note F: Non-GAAP diluted shares. Diluted non-GAAP weighted average shares include additional shares that are dilutive for non-GAAP computations of earnings per share in periods when we have a non-GAAP net income and a GAAP basis net loss. Note G: Free Cash Flow. Verifone determines free cash flow as net cash provided by operating activities less capital expenditures.
