UNITED STATES
SECURITIES AND EXCHANGE COMMISSION
SECURITIES AND EXCHANGE COMMISSION
Washington, D.C. 20549
FORM N-CSR
CERTIFIED SHAREHOLDER REPORT OF REGISTERED MANAGEMENT INVESTMENT COMPANIES
Investment Company Act file number 811-21705
Nuveen Tax-Advantaged Floating Rate Fund
(Exact name of registrant as specified in charter)
Nuveen Investments
333 West Wacker Drive
Chicago, IL 60606
(Address of principal executive offices) (Zip code)
333 West Wacker Drive
Chicago, IL 60606
Kevin J. McCarthy
Nuveen Investments
333 West Wacker Drive
Chicago, IL 60606
(Name and address of agent for service)
Nuveen Investments
333 West Wacker Drive
Chicago, IL 60606
Registrant’s telephone number, including area code: (312) 917-7700
Date of fiscal year end: June 30
Date of reporting period: December 31, 2010
Form N-CSR is to be used by management investment companies to file reports with the Commission not later than 10 days after the transmission to stockholders of any report that is required to be transmitted to stockholders under Rule 30e-1 under the Investment Company Act of 1940 (17 CFR 270.30e-1). The Commission may use the information provided on Form N-CSR in its regulatory, disclosure review, inspection, and policymaking roles.
A registrant is required to disclose the information specified by Form N-CSR, and the Commission will make this information public. A registrant is not required to respond to the collection of information contained in Form N-CSR unless the Form displays a currently valid Office of Management and Budget (“OMB”) control number. Please direct comments concerning the accuracy of the information collection burden estimate and any suggestions for reducing the burden to Secretary, Securities and Exchange Commission, 450 Fifth Street, NW, Washington, DC 20549-0609. The OMB has reviewed this collection of information under the clearance requirements of 44 U.S.C. SS. 3507.
ITEM 1. REPORTS TO SHAREHOLDERS

Closed-End Funds
| Nuveen Investments Closed-End Funds | ||
| Semi-Annual Report December 31, 2010 | ||
| Nuveen Tax-Advantaged Floating Rate Fund JFP |

INVESTMENT ADVISER NAME CHANGE
Effective January 1, 2011, Nuveen Asset Management, the Fund’s investment adviser, changed its name to Nuveen Fund Advisors, Inc. (“Nuveen Fund Advisors”). Concurrently, Nuveen Fund Advisors formed a wholly-owned subsidiary, Nuveen Asset Management, LLC, to house its portfolio management capabilities.
NUVEEN INVESTMENTS COMPLETES STRATEGIC COMBINATION WITH FAF ADVISORS
On December 31, 2010, Nuveen Investments completed the strategic combination between Nuveen Asset Management, LLC, the largest investment affiliate of Nuveen Investments, and FAF Advisors. As part of this transaction, U.S. Bancorp—the parent of FAF Advisors—received cash consideration and a 9.5% stake in Nuveen Investments in exchange for the long term investment business of FAF Advisors, including investment-management responsibilities for the non-money market mutual funds of the First American Funds family.
The approximately $27 billion of mutual fund and institutional assets managed by FAF Advisors, along with the investment professionals managing these assets and other key personnel, have become part of Nuveen Asset Management, LLC. With these additions to Nuveen Asset Management, LLC, this affiliate now manages more than $100 billion of assets across a broad range of strategies from municipal and taxable fixed income to traditional and specialized equity investments.
This combination does not affect the investment objectives or strategies of this Fund. Over time, Nuveen Investments expects that the combination will provide even more ways to meet the needs of investors who work with financial advisors and consultants by enhancing the multi-boutique model of Nuveen Investments, which also includes highly respected investment teams at HydePark, NWQ Investment Management, Santa Barbara Asset Management, Symphony Asset Management, Tradewinds Global Investors and Winslow Capital. Nuveen Investments managed approximately $195 billion of assets as of December 31, 2010.
Table of Contents
| Chairman’s Letter to Shareholders | 4 | |
| Portfolio Managers’ Comments | 5 | |
| Common Share Distribution and Share Price Information | 8 | |
| Performance Overview | 9 | |
| Shareholder Meeting Report | 10 | |
| Portfolio of Investments | 11 | |
| Statement of Assets & Liabilities | 13 | |
| Statement of Operations | 14 | |
| Statement of Changes in Net Assets | 15 | |
| Statement of Cash Flows | 16 | |
| Financial Highlights | 17 | |
| Notes to Financial Statements | 20 | |
| Reinvest Automatically Easily and Conveniently | 27 | |
| Glossary of Terms Used in this Report | 29 | |
| Other Useful Information | 31 |
Chairman’s
Letter to Shareholders
Letter to Shareholders

Dear Shareholders,
The global economy recorded another year of recovery from the financial and economic crises of 2008, but many of the factors that caused the crises still weigh on the prospects for continued recovery. In the U.S., ongoing weakness in housing values is putting pressure on homeowners and mortgage lenders. Similarly, the strong earnings recovery for corporations and banks has not been translated into increased hiring or more active lending. In addition, media and analyst reports on the fiscal conditions of various state and local entities have raised concerns with some investors. Globally, deleveraging by private and public borrowers is inhibiting economic growth and this process is far from complete.
Encouragingly, a variety of constructive actions are being taken by governments around the world to stimulate further recovery. In the U.S., the recent passage of a stimulatory tax bill relieves some of the pressure on the Federal Reserve System to promote economic expansion through quantitative easing and offers the promise of faster economic growth. A number of European governments are undertaking programs that could significantly reduce their budget deficits. Governments across the emerging markets are implementing various steps to deal with global capital flows without undermining international trade and investment.
The success of these government actions could have an important impact on whether 2011 brings further economic recovery and financial market progress. One risk associated with the extraordinary efforts to strengthen U.S. economic growth is that the debt of the U.S. government will continue to grow to unprecedented levels. Another risk is that over time there could be upward pressures on asset values in the U.S. and abroad, because what happens in the U.S. impacts the rest of the world economy. We must hope that the progress made on the fiscal front in 2010 will continue into 2011. In this environment, your Nuveen investment team continues to seek sustainable investment opportunities and to remain alert to potential risks in a recovery still facing many headwinds. On your behalf, we monitor their activities to assure they maintain their investment disciplines.
As you will note elsewhere in this report, on January 1, 2011, Nuveen Investments completed the acquisition of FAF Advisors, Inc., the manager of the First American Funds. The acquisition adds highly respected and distinct investment teams to meet the needs of investors and their advisors and is designed to benefit all fund shareholders by creating a fund organization with the potential for further economies of scale and the ability to draw from even greater talent and expertise to meet these investor needs.
As always, I encourage you to contact your financial consultant if you have any questions about your investment in a Nuveen fund. On behalf of the other members of your Fund Board, we look forward to continuing to earn your trust in the months and years ahead.
Sincerely,

Robert P. Bremner
Chairman of the Board and Lead Independent Director
February 22, 2011
| 4 | Nuveen Investments | |
Portfolio Managers’ Comments
Certain statements in this report are forward-looking statements. Discussions of specific investments are for illustration only and are not intended as recommendations of individual investments. The forward-looking statements and other views expressed herein are those of the portfolio managers as of the date of this report. Actual future results or occurrences may differ significantly from those anticipated in any forward-looking statements and the views expressed herein are subject to change at any time, due to numerous market and other factors. The Fund disclaims any obligation to update publicly or revise any forward-looking statements or views expressed herein.
Any reference to credit ratings for portfolio holdings denotes the highest rating assigned by a Nationally Recognized Statistical Rating Organization (NRSRO) such as Standard & Poor’s, Moody’s or Fitch. AAA, AA, A and BBB ratings are investment grade; BB, B, CCC, CC, C and D ratings are below investment grade. Holdings and ratings may change over time.
Nuveen Tax-Advantaged Floating Rate Fund (JFP)
The Nuveen Tax-Advantaged Floating Rate Fund (JFP) is sub-advised by a team of specialists at Spectrum Asset Management, a wholly-owned subsidiary of Principal Global Investors, LLC. Mark Lieb and Phil Jacoby, who have more than 50 years of combined experience in the preferred securities markets, lead the team. Here Mark and Phil talk about their management strategy and the performance of the Fund for the six-month period ended December 31, 2010.
What was your management strategy during the six-month period ended December 31, 2010?
The Fund was designed to invest in securities issued primarily by middle market banks, and its investment objectives are to provide an attractive level of after-tax current income and capital preservation. As in the past, our ability to actively manage the portfolio during this period in an effort to achieve these objectives was hampered by several factors. First, at period end the Fund held securities of twelve middle market banks, accounting for approximately 40% of the Fund’s assets. Of these twelve positions, only one was paying dividends. This severely and negatively impacted the prices of the non-paying holdings, giving them market values well below par and making them very difficult to sell. Second, many market participants seemed to believe that middle market bank holdings that were still paying dividends might not continue to do so in the future. This weakened the market for all such securities and generally made bids for these securities scarce and unattractive. Sellers with no other options were forced to accept very unappealing prices. Despite this challenging environment, we have positioned about 60% of the portfolio in securities issued by non-middle market banks. This has provided a more secure source of income and liquidity for this portion of the portfolio’s holdings.
How did the Fund perform over this six-month period?
The performance of the Fund, as well as the performance of two market indexes, is presented in the accompanying table.
| Nuveen Investments | 5 | |
Average Annual Total Return on Common Share Net Asset Value
For the periods ended 12/31/10
| 6-Month | 1-Year | 5-Year | ||||
| JFP | –3.52% | 10.84% | –23.82% | |||
Merrill Lynch Adjustable Rate Preferred Index1 | 12.42% | 2.86% | –7.70% | |||
Barclays Capital U.S. Aggregate Bond Index2 | 1.16% | 6.56% | 5.80% | |||
Six-month returns are cumulative; all other returns are annualized.
Past performance is not predictive of future results. Current performance may be higher or lower than the data shown. Returns do not reflect the deduction of taxes that shareholders may have to pay on Fund distributions or upon the sale of Fund shares.
For additional information, see the Performance Overview page in this report.
| 1 | The Merrill Lynch Adjustable Rate Preferred Index is an unmanaged index composed of dollar-denominated investment-grade preferred securities, predominantly from larger issuers. The Fund may invest a substantial portion of its assets in below-investment-grade securities, often from smaller issuers. Index returns do not include the effects of any sales charges or management fees. It is not possible to invest directly in an index. |
| 2 | The Barclays Capital U.S. Aggregate Bond Index is an unmanaged index that includes all investment-grade, publicly issued, fixed-rate, dollar denominated, nonconvertible debt issues and commercial mortgage-backed securities with maturities of at least one year and outstanding par values of $150 million or more. Index returns do not include the effects of any sales charges or management fees. It is not possible to invest directly in an index. |
As the performance numbers indicate, the six-month period ended December 31, 2010, proved to be particularly challenging for the Fund as it underperformed both of the shown indexes. It should be noted that the Barclays Capital U.S. Aggregate Bond Index is designed to track fixed income investments generally and not the preferred equity securities in which the Fund primarily invests. In addition, the Fund has a higher concentration of preferred stocks issued by middle market banks than the Merrill Lynch Adjustable Rate Preferred Index, which affected the Fund’s performance relative to this measure over the period.
One major factor impacting the Fund’s poor absolute and relative performance was the interruption in regular dividend payments by a number of the Fund’s holdings. As noted earlier, only one of the Fund’s twelve holdings of middle mark bank securities was paying a dividend at the end of the period. This had a direct impact on the income generated by the Fund, and the value of these positions within the Fund’s portfolio. Additionally, a significant portion of the other positions held by the Fund were shorter-term securities issued by other financial entities. In general, shorter-term securities tended to underperform the overall market during this reporting period. While the income generated by these positions helped the Fund’s absolute return, these holdings also were a drag on relative overall performance when compared with the index returns shown above.
RECENT EVENTS CONCERNING THE FUND’S REDEMPTION OF AUCTION RATE PREFERRED SHARES
Shortly after its inception, the Fund issued auction rate preferred shares (ARPS) to create financial leverage. As noted in past shareholder reports, the weekly auctions for those ARPS shares began in February 2008 to consistently fail, causing the Fund to pay the so-called “maximum rate” to ARPS shareholders under the terms of the ARPS in the Fund’s charter documents. The Fund redeemed its ARPS at par in 2009.
During 2010, certain Nuveen leveraged closed-end funds (including this Fund) received a demand letter from a law firm on behalf of purported holders of common shares of each such fund, alleging that Nuveen and the funds’ officers and Board of Directors/Trustees breached their fiduciary duties related to the redemption at par of the funds’ ARPS. In response, the Board established an ad hoc Demand Committee consisting of certain of its disinterested and independent Board members to investigate the claims. The Demand Committee retained independent counsel to assist it in conducting an extensive investigation. Based upon its investigation, the Demand Committee found that it was not in the best interests of each fund or its shareholders to take the actions suggested in the demand letters, and recommended that the full Board reject the demands made in the demand letters. After reviewing the findings and recommendation of the Demand
| 6 | Nuveen Investments | |
Committee, the full Board of each fund unanimously adopted the Demand Committee’s recommendation.
Subsequently, the funds that received demand letters (including this Fund) were named in a consolidated complaint as nominal defendants in a putative shareholder derivative action captioned Martin Safier, et al. v. Nuveen Asset Management, et al. that was filed in the Circuit Court of Cook County, Illinois, Chancery Division (the “Cook County Chancery Court”) on February 18, 2011 (the “Complaint”). The Complaint, filed on behalf of purported holders of each fund’s common shares, also name Nuveen Asset Management as a defendant, together with current and former Officers and interested Director/Trustees of each of the funds (together with the nominal defendants, collectively, the “Defendants”). The Complaint contains the same basic allegations contained in the demand letters. The suits seek a declaration that the Defendants have breached their fiduciary duties, an order directing the Defendants not to redeem any ARPS at their liquidation value using fund assets, indeterminate monetary damages in favor of the funds and an award of plaintiffs’ costs and disbursements in pursuing the action. Nuveen Asset Management believes that the Complaint is without merit, and intends to defend vigorously against these charges.
| Nuveen Investments | 7 | |
Common Share Distribution
and Share Price Information
and Share Price Information
The following information regarding your Fund’s distributions is current as of December 31, 2010, and likely will vary over time based on the Fund’s investment activities and portfolio investment value changes.
Over the six-month reporting period, the Fund’s monthly distribution to common shareholders remained stable. Eleven of the twenty-one preferred securities held by the Fund were not paying dividends as of the end of the period, and the dividend discontinuation for four of those eleven was announced during the six-month period, negatively impacting the income available to pay common share dividends.
The Fund has a managed distribution policy, which permits the Fund to include as part of its monthly distributions supplemental amounts from sources other than net investment income. However, the Fund’s monthly distributions during this period did not include any supplemental amounts representing actual or anticipated portfolio price appreciation. Rather, the fact that the Fund paid out substantially more in monthly distributions than the amount of its net earnings during the period was attributable to the discontinuation of dividends by four holdings during the period, as described above.
Common Share Repurchases and Share Price Information
Since the inception of the Fund’s repurchase program, the Fund has not repurchased any of its outstanding common shares.
As of December 31, 2010, the Fund was trading at a -3.54% discount to its NAV, compared with an average discount of 1.78% for the six-month period.
| 8 | Nuveen Investments | |
| JFP Performance OVERVIEW | Nuveen Tax-Advantaged Floating Rate Fund | ||
| as of December 31, 2010 |
| Fund Snapshot | ||
| Common Share Price | $2.18 | |
| Common Share Net Asset Value (NAV) | $2.26 | |
| Premium/(Discount) to NAV | -3.54% | |
| Market Yield1 | 8.26% | |
| Net Assets Applicable to Common Shares ($000) | $31,547 | |
| Average Annual Total Return | ||||
| (Inception 3/28/05) | ||||
| On Share Price | On NAV | |||
| 6-Month (Cumulative) | -10.95% | -3.52% | ||
| 1-Year | 9.91% | 10.84% | ||
| 5-Year | -21.75% | -23.82% | ||
| Since Inception | -21.31% | -20.61% | ||
| Portfolio Composition | ||
| (as a % of total investments)2 | ||
| Commercial Banks | 65.0% | |
| Capital Markets | 9.0% | |
| Insurance | 6.5% | |
| Thrifts & Mortgage Finance | 0.5% | |
| Diversified Financial Services | 0.4% | |
| Short-Term Investments | 18.6% | |
Portfolio Allocation (as a % of total investments)2
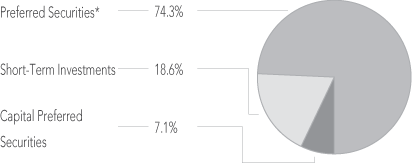
| * | 52.7% of total Preferred Securities are invested in Middle Market Banks. |
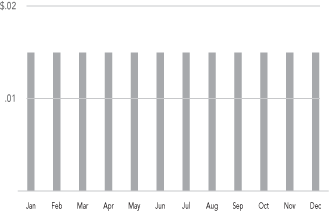
2010 Monthly Distributions Per Common Share
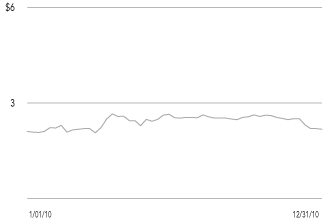
Common Share Price Performance—Weekly Closing Price
| Refer to the Glossary of Terms Used in this Report for further definition of the terms used within the Fund’s Performance Overview Page. | |
| 1 | Market Yield is based on the Fund’s current annualized monthly distribution divided by the Fund’s current market price. The Fund’s monthly distributions to its shareholders may be comprised of ordinary income, net realized capital gains and, if at the end of the fiscal year the Fund’s cumulative net ordinary income and net realized gains are less than the amount of the Fund’s distributions, a return of capital for tax purposes. |
| 2 | Holdings are subject to change. |
| Nuveen Investments | 9 | |
Shareholder Meeting Report
The annual meeting of shareholders was held in the offices of Nuveen Investments on November 16, 2010; at this meeting the shareholders were asked to vote on the election of Board Members.
| JFP | ||
| Approval of the Board Members was reached as follows: | ||
| Common shares | ||
| William C. Hunter | ||
| For | 12,603,158 | |
| Withhold | 462,997 | |
| Total | 13,066,155 | |
| Judith M. Stockdale | ||
| For | 12,546,305 | |
| Withhold | 519,850 | |
| Total | 13,066,155 | |
| Carole E. Stone | ||
| For | 12,590,635 | |
| Withhold | 475,520 | |
| Total | 13,066,155 | |
| 10 | Nuveen Investments | |
JFP | Nuveen Tax-Advantaged Floating Rate Fund Portfolio of Investments | ||||
| December 31, 2010 (Unaudited) | |||||
| Shares | Description (1) | Coupon | Ratings (2) | Value | ||||||||||||||||
Preferred Securities – 73.3% (74.3% of Total Investments) | ||||||||||||||||||||
Capital Markets – 8.9% | ||||||||||||||||||||
| 3,600 | Deutsche Bank Contingent Capital Trust III | 7.600% | BBB | $ | 91,548 | |||||||||||||||
| 65,800 | Goldman Sachs Group Inc. | 4.000% | (5) | Baa2 | 1,416,016 | |||||||||||||||
| 67,700 | Morgan Stanley, Series 2006A | 4.000% | (5) | BB+ | 1,305,256 | |||||||||||||||
| Total Capital Markets | 2,812,820 | |||||||||||||||||||
Commercial Banks – 59.1% | ||||||||||||||||||||
| 9,000 | ABN AMRO North America Capital Funding, 144A | 6.968% | (5) | BB | 5,464,688 | |||||||||||||||
| 7,000 | Barclays Bank PLC | 8.125% | A– | 179,900 | ||||||||||||||||
| 7,000 | City National Bancshares Corporation, Series F, (MMB), (3), (4) | 8.533% | (5) | N/R | 118,245 | |||||||||||||||
| 10,000 | Elmira Savings Bank, 144A, (MMB), (3), (4) | 8.998% | (5) | N/R | 8,297,316 | |||||||||||||||
| 10,000 | First Bank of Oak Park Corporation, Series 2005A, 144A, (MMB), (4) | 3.052% | (5) | N/R | 47,000 | |||||||||||||||
| 41,300 | HSBC USA Inc. | 4.500% | (5) | A | 1,025,066 | |||||||||||||||
| 5,000 | MidCarolina Financial Corporation, Series 144A, (MMB), (3), (4) | 8.342% | (5) | N/R | 2,497,510 | |||||||||||||||
| 10,000 | PedCor Bancorp., 144A, (MMB), (3), (4) | 4.009% | (5) | N/R | 494,436 | |||||||||||||||
| 5,000 | Pedcor Financial Bancorp., 144A, (MMB), (3), (4) | 4.008% | (5) | N/R | 230,883 | |||||||||||||||
| 5,000 | Regent Bancorp Inc., Series A, 144A, (MMB), (3), (4) | 8.481% | (5) | N/R | 84,905 | |||||||||||||||
| 10,000 | Rogers Bancshares Inc., 144A Series A, (MMB), (3), (4) | 4.252% | (5) | N/R | 135,000 | |||||||||||||||
| 10,000 | Shorebank Corporation, Series 144A, (MMB), (3), (4) | 4.090% | (5) | N/R | 47,000 | |||||||||||||||
| 700 | SunTrust Bank Inc. | 4.000% | (5) | Ba1 | 13,951 | |||||||||||||||
| 10,000 | Vineyard National Bancorp, Series C, 144A, (MMB), (3), (4) | 4.089% | (5) | N/R | 2,200 | |||||||||||||||
| Total Commercial Banks | 18,638,100 | |||||||||||||||||||
Diversified Financial Services – 0.4% | ||||||||||||||||||||
| 10,000 | Blossman Bancshares, Inc., 144A, (MMB), (3), (4) | 8.730% | (5) | N/R | 110,625 | |||||||||||||||
| 700 | Citigroup Capital XIII | 7.875% | (5) | BB+ | 18,837 | |||||||||||||||
| Total Diversified Financial Services | 129,462 | |||||||||||||||||||
Insurance – 4.5% | ||||||||||||||||||||
| 1,500 | Zurich RegCaPS Funding Trust VI, Series 144A | 0.996% | (5) | Baa1 | 1,422,656 | |||||||||||||||
Thrifts & Mortgage Finance – 0.4% | ||||||||||||||||||||
| 5,000 | RMG Capital Corporation, 144A, (MMB), (3), (4) | 4.253% | (5) | N/R | 135,902 | |||||||||||||||
Total Preferred Securities (cost $114,529,950) | 23,138,940 | |||||||||||||||||||
| | ||||||||||||||||||||
| Principal | ||||||||||||||||||||
| Amount (000)/ | ||||||||||||||||||||
| Shares | Description (1) | Coupon | Maturity | Ratings (2) | Value | |||||||||||||||
Capital Preferred Securities – 7.1% (7.1% of Total Investments) | ||||||||||||||||||||
Commercial Banks – 5.0% | ||||||||||||||||||||
| 2 | U.S. Bancorp | 7.189% | (5) | 4/15/11 | A3 | $ | 1,580,250 | |||||||||||||
Insurance – 2.0% | ||||||||||||||||||||
| 1,000 | Aegon N.V. Perpetual Capital Securities | 2.628% | (5) | 7/15/49 | BBB | 616,050 | ||||||||||||||
Thrifts & Mortgage Finance – 0.1% | ||||||||||||||||||||
| 5,322 | MM Community Funding Trust XVIII Limited, Class D, (3), (4) | 2.103% | (5) | 12/26/39 | N/R | 26,611 | ||||||||||||||
Total Capital Preferred Securities (cost $7,123,232) | 2,222,911 | |||||||||||||||||||
| | ||||||||||||||||||||
| Principal | ||||||||||||||||||||
| Amount (000) | Description (1) | Coupon | Maturity | Value | ||||||||||||||||
Short-Term Investments – 18.3% (18.6% of Total Investments) | ||||||||||||||||||||
| $ | 5,775 | Repurchase Agreement with Fixed Income Clearing Corporation, dated 12/31/10, repurchase price $5,774,949, collateralized by $5,585,000 U.S. Treasury Notes, 3.625%, due 8/15/19, value $5,892,175 | 0.040% | 1/03/11 | $ | 5,774,930 | ||||||||||||||
Total Short-Term Investments (cost $5,774,930) | 5,774,930 | |||||||||||||||||||
Total Investments (cost $127,428,111) – 98.7% | 31,136,781 | |||||||||||||||||||
Other Assets Less Liabilities – 1.3% | 410,082 | |||||||||||||||||||
Net Assets – 100% | $ | 31,546,863 | ||||||||||||||||||
| Nuveen Investments | 11 | |
JFP | Nuveen Tax-Advantaged Floating Rate Fund (continued) Portfolio of Investments December 31, 2010 (Unaudited) |
| For Fund portfolio compliance purposes, the Fund’s industry classifications refer to any one or more of the industry sub-classifications used by one or more widely recognized market indexes or ratings group indexes, and/or as definded by Fund management. This definition may not apply for purposes of this report, which may combine industry sub-classifications into sectors for reporting ease. | ||||||
| (1) | All percentages shown in the Portfolio of Investments are based on net assets. | |||||
| (2) | Ratings: Using the highest of Standard & Poor’s Group (“Standard & Poor’s”), Moody’s Investor Service, Inc. (“Moody’s”) or Fitch, Inc. (“Fitch”) rating. Ratings below BBB by Standard & Poor’s, Baa by Moody’s or BBB by Fitch are considered to be below investment grade. Holdings designated N/R are not rated by any of these national rating agencies. | |||||
| (3) | Non-income producing; issuer has not declared a dividend within the past twelve months. | |||||
| (4) | For fair value measurement disclosure purposes, investment categorized as Level 3. See Notes to Financial Statements, Footnote 1 – General Information and Significant Accounting Policies, Investment Valuation for more information. | |||||
| (5) | Security has a floating rate coupon, which is periodically reset based on a fixed percentage rate above a predetermined index or benchmark. The coupon rate disclosed is that in effect at the end of the reporting period. | |||||
| N/R | Not rated. | |||||
| (MMB) | Middle Market Bank. | |||||
| 144A | Investment is exempt from registration under Rule 144A of the Securities Act of 1933, as amended. These investments may only be resold in transactions exempt from registration, which are normally those transactions with qualified institutional buyers. |
See accompanying notes to financial statements.
| 12 | Nuveen Investments | |
| Statement of Assets & Liabilities | |||||
| December 31, 2010 (Unaudited) | |||||
Assets | ||||
| Long-term investments, at value (cost $121,653,182) | $ | 25,361,851 | ||
| Short-term investments (at cost, which approximates value) | 5,774,930 | |||
| Cash | 286 | |||
| Receivables: | ||||
| Dividends | 412,576 | |||
| Interest | 5,553 | |||
| Investments sold | 49,043 | |||
| Other assets | 23,170 | |||
| Total assets | 31,627,409 | |||
Liabilities | ||||
| Payable for investments purchased | 14,135 | |||
| Other accrued expenses | 66,411 | |||
| Total liabilities | 80,546 | |||
| Net assets applicable to Common shares | $ | 31,546,863 | ||
| Common shares outstanding | 13,977,245 | |||
| Net asset value per Common share outstanding (net assets applicable to Common shares, divided by Common shares outstanding) | $ | 2.26 | ||
Net assets applicable to Common shares consist of: | ||||
| Common shares, $.01 par value per share | $ | 139,772 | ||
| Paid-in surplus | 196,145,645 | |||
| Undistributed (Over-distribution of) net investment income | (193,478 | ) | ||
| Accumulated net realized gain (loss) | (68,253,745 | ) | ||
| Net unrealized appreciation (depreciation) | (96,291,331 | ) | ||
| Net assets applicable to Common shares | $ | 31,546,863 | ||
| Authorized shares: | ||||
| Common | Unlimited | |||
| FundPreferred | Unlimited | |||
See accompanying notes to financial statements.
| Nuveen Investments | 13 | |
| Statement of Operations | |||||
| Six Months Ended December 31, 2010 (Unaudited) | |||||
Investment Income | $ | 1,403,440 | ||
Expenses | ||||
| Management fees | 152,267 | |||
| Shareholders’ servicing agent fees and expenses | 126 | |||
| Custodian’s fees and expenses | 4,577 | |||
| Professional fees | 69,201 | |||
| Shareholders’ reports – printing and mailing expenses | 21,024 | |||
| Stock exchange listing fees | 4,582 | |||
| Investor relations expense | 47,450 | |||
| Other expenses | 399 | |||
| Total expenses before custodian fee credit and expense reimbursement | 299,626 | |||
| Custodian fee credit | (26 | ) | ||
| Expense reimbursement | (152,267 | ) | ||
| Net expenses | 147,333 | |||
| Net investment income | 1,256,107 | |||
Realized and Unrealized Gain (Loss) | ||||
| Net realized gain (loss) from investments | (13,089,115 | ) | ||
| Change in net unrealized appreciation (depreciation) of investments | 10,647,724 | |||
| Net realized and unrealized gain (loss) | (2,441,391 | ) | ||
| Net increase (decrease) in net assets applicable to Common shares from operations | $ | (1,185,284 | ) | |
See accompanying notes to financial statements.
| 14 | Nuveen Investments | |
| Statement of Changes in Net Assets (Unaudited) | |||||
| Six Months | ||||||||
| Ended | Year Ended | |||||||
| 12/31/10 | 6/30/10 | |||||||
Operations | ||||||||
| Net investment income | $ | 1,256,107 | $ | 2,864,766 | ||||
| Net realized gain (loss) from investments | (13,089,115 | ) | (1,121,370 | ) | ||||
| Change in net unrealized appreciation (depreciation) of investments | 10,647,724 | (4,899,990 | ) | |||||
| �� | ||||||||
| Net increase (decrease) in net assets applicable to Common shares from operations | (1,185,284 | ) | (3,156,594 | ) | ||||
Distributions to Common Shareholders | ||||||||
| From and in excess of net investment income | (1,256,483 | ) | – | |||||
| From net investment income | – | (2,578,379 | ) | |||||
| Return of capital | – | (609,498 | ) | |||||
| Decrease in net assets applicable to Common shares from distributions to Common shareholders | (1,256,483 | ) | (3,187,877 | ) | ||||
Capital Share Transactions | ||||||||
| Net proceeds from Common shares issued to shareholders due to reinvestment of distributions | 94,997 | 106,268 | ||||||
| Net increase (decrease) in net assets applicable to Common shares from capital share transactions | 94,997 | 106,268 | ||||||
| Net increase (decrease) in net assets applicable to Common shares | (2,346,770 | ) | (6,238,203 | ) | ||||
| Net assets applicable to Common shares at the beginning of period | 33,893,633 | 40,131,836 | ||||||
| Net assets applicable to Common shares at the end of period | $ | 31,546,863 | $ | 33,893,633 | ||||
| Undistributed (Over-distribution of) net investment income at the end of period | $ | (193,478 | ) | $ | (193,102 | ) | ||
See accompanying notes to financial statements.
| Nuveen Investments | 15 | |
| Statement of Cash Flows | |||||
| Six Months Ended December 31, 2010 (Unaudited) | |||||
Cash Flows from Operating Activities: | ||||
Net Increase (Decrease) in Net Assets Applicable to Common Shares from Operations | $ | (1,185,284 | ) | |
| Adjustments to reconcile the net increase (decrease) in net assets applicable to Common shares from operations to net cash provided by (used in) operating activities: | ||||
| Purchases of investments | (6,665,263 | ) | ||
| Proceeds from sales and maturities of investments | 7,620,723 | |||
| Proceeds from (Purchases of) short-term investments, net | (641,720 | ) | ||
| Amortization (Accretion) of premiums and discounts, net | (10 | ) | ||
| (Increase) Decrease in receivable for dividends | (401,326 | ) | ||
| (Increase) Decrease in receivable for interest | (5,553 | ) | ||
| (Increase) Decrease in receivable for investments sold | (49,043 | ) | ||
| (Increase) Decrease in other assets | 3,544 | |||
| Increase (Decrease) in payable for investments purchased | 14,135 | |||
| Increase (Decrease) in accrued other liabilities | (4,170 | ) | ||
| Net realized (gain) loss from investments | 13,089,115 | |||
| Change in net unrealized (appreciation) depreciation of investments | (10,647,724 | ) | ||
| Net cash provided by (used in) operating activities | 1,127,424 | |||
Cash Flows from Financing Activities: | ||||
| Cash distributions paid to Common shareholders | (1,354,588 | ) | ||
| Net cash provided by (used in) financing activities | (1,354,588 | ) | ||
Net Increase (Decrease) in Cash | (227,164 | ) | ||
| Cash at the beginning of period | 227,450 | |||
Cash at the End of Period | 286 | |||
Supplemental Disclosure of Cash Flow Information
Non-cash financing activities not included herein consists of reinvestments of Common share distributions of $94,997.
See accompanying notes to financial statements.
| 16 | Nuveen Investments | |
| Financial Highlights (Unaudited) | |||||
| Nuveen Investments | 17 | |
| Financial Highlights (Unaudited) | |||||
| Selected data for a Common share outstanding throughout each period: | |||||
| Investment Operations | Less Distributions | |||||||||||||||||||||||||||||||||||||||||||||||||||
| Offering Costs, | ||||||||||||||||||||||||||||||||||||||||||||||||||||
| Distributions | Fund | |||||||||||||||||||||||||||||||||||||||||||||||||||
| from Net | Distributions | Net | Structuring | |||||||||||||||||||||||||||||||||||||||||||||||||
| Beginning | Investment | from Capital | Investment | Capital | Return of | Fee and | Ending | |||||||||||||||||||||||||||||||||||||||||||||
| Common | Net | Income to | Gains to | Income to | Gains to | Capital to | FundPreferred | Common | ||||||||||||||||||||||||||||||||||||||||||||
| Share | Net | Realized/ | FundPreferred | FundPreferred | Common | Common | Common | Share | Share | Ending | ||||||||||||||||||||||||||||||||||||||||||
| Net Asset | Investment | Unrealized | Share- | Share- | Share- | Share- | Share- | Underwriting | Net Asset | Market | ||||||||||||||||||||||||||||||||||||||||||
| Value | Income(a) | Gain (Loss) | holders(b) | holders(b) | Total | holders(i) | holders | holders | Total | Discounts | Value | Value | ||||||||||||||||||||||||||||||||||||||||
| Year Ended 6/30: | ||||||||||||||||||||||||||||||||||||||||||||||||||||
| 2011(h) | $ | 2.43 | $ | .09 | $ | (.17 | ) | $ | – | $ | – | $ | (.08 | ) | $ | (.09 | ) | $ | – | $ | – | $ | (.09 | ) | $ | – | $ | 2.26 | $ | 2.18 | ||||||||||||||||||||||
| 2010 | 2.89 | .21 | (.44 | ) | – | – | (.23 | ) | (.19 | ) | – | (.04 | ) | (.23 | ) | – | 2.43 | 2.54 | ||||||||||||||||||||||||||||||||||
| 2009 | 7.58 | .51 | (4.55 | ) | (.05 | ) | – | (4.09 | ) | (.59 | ) | – | (.01 | ) | (.60 | ) | – | 2.89 | 3.14 | |||||||||||||||||||||||||||||||||
| 2008 | 14.66 | 1.24 | (6.98 | ) | (.25 | ) | (.01 | ) | (6.00 | ) | (1.03 | ) | (.05 | ) | – | (1.08 | ) | – | ** | 7.58 | 7.23 | |||||||||||||||||||||||||||||||
| 2007(f) | 14.46 | 1.24 | .14 | (.24 | ) | (.02 | ) | 1.12 | (.87 | ) | (.05 | ) | – | (.92 | ) | – | 14.66 | 14.42 | ||||||||||||||||||||||||||||||||||
| Year Ended 7/31: | ||||||||||||||||||||||||||||||||||||||||||||||||||||
| 2006 | 14.12 | 1.10 | .27 | (.23 | ) | – | 1.14 | (.80 | ) | – | – | (.80 | ) | – | 14.46 | 13.18 | ||||||||||||||||||||||||||||||||||||
| 2005(g) | 14.33 | .15 | .02 | (.03 | ) | – | .14 | (.20 | ) | – | – | (.20 | ) | (.15 | ) | 14.12 | 13.42 | |||||||||||||||||||||||||||||||||||
| 18 | Nuveen Investments | |
| Ratios/Supplemental Data | ||||||||||||||||||||||||||||||||||||||||||||
| Ratios to Average Net Assets | Ratios to Average Net Assets | |||||||||||||||||||||||||||||||||||||||||||
| Applicable to Common Shares | Applicable to Common Shares | |||||||||||||||||||||||||||||||||||||||||||
| Total Returns | Before Reimbursement(d) | After Reimbursement(d)(e) | FundPreferred Shares at End of Period | |||||||||||||||||||||||||||||||||||||||||
| Based on | ||||||||||||||||||||||||||||||||||||||||||||
| Common | Ending | |||||||||||||||||||||||||||||||||||||||||||
| Share | Net Assets | Aggregate | Liquidation | |||||||||||||||||||||||||||||||||||||||||
| Based on | Net | Applicable to | Net | Net | Portfolio | Amount | and Market | Asset | ||||||||||||||||||||||||||||||||||||
| Market | Asset | Common | Investment | Investment | Turnover | Outstanding | Value Per | Coverage | ||||||||||||||||||||||||||||||||||||
| Value(c) | Value(c) | Shares (000) | Expenses | Income | Expenses | Income | Rate | (000) | Share | Per Share | ||||||||||||||||||||||||||||||||||
| (10.95 | )% | (3.52 | )% | $ | 31,547 | 1.74 | %* | 6.41 | %* | .86 | %* | 7.29 | %* | 22 | % | $ | – | $ | – | $ | – | |||||||||||||||||||||||
| (11.59 | ) | (7.93 | ) | 33,894 | 1.44 | 7.47 | .97 | 7.94 | 2 | – | – | – | ||||||||||||||||||||||||||||||||
| (48.08 | ) | (55.30 | ) | 40,132 | 1.61 | 12.00 | 1.21 | 12.40 | – | *** | – | – | – | |||||||||||||||||||||||||||||||
| (44.63 | ) | (43.04 | ) | 105,103 | 1.54 | 9.81 | 1.09 | 10.26 | 10 | 78,000 | 25,000 | 58,687 | ||||||||||||||||||||||||||||||||
| 16.84 | 7.98 | 203,128 | 1.44 | * | 8.84 | * | 1.02 | * | 9.26 | * | 28 | 78,000 | 25,000 | 90,105 | ||||||||||||||||||||||||||||||
| 4.52 | 8.28 | 200,354 | 1.45 | 7.29 | 1.03 | 7.71 | 38 | 78,000 | 25,000 | 89,216 | ||||||||||||||||||||||||||||||||||
| (9.24 | ) | (.08 | ) | 195,645 | 1.26 | * | 2.88 | * | .90 | * | 3.25 | * | 19 | 78,000 | 25,000 | 87,707 | ||||||||||||||||||||||||||||
| (a) | Per share Net Investment Income is calculated using the average daily shares method. | |
| (b) | The amounts shown are based on Common share equivalents. | |
| (c) | Total Return Based on Market Value is the combination of changes in the market price per share and the effect of reinvested dividend income and reinvested capital gains distributions, if any, at the average price paid per share at the time of reinvestment. The last dividend declared in the period, which is typically paid on the first business day of the following month, is assumed to be reinvested at the ending market price. The actual reinvestment for the last dividend declared in the period may take place over several days, and in some instances may not be based on the market price, so the actual reinvestment price may be different from the price used in the calculation. Total returns are not annualized. | |
| Total Return Based on Common Share Net Asset Value is the combination of changes in Common share net asset value, reinvested dividend income at net asset value and reinvested capital gains distributions at net asset value, if any. The last dividend declared in the period, which is typically paid on the first business day of the following month, is assumed to be reinvested at the ending net asset value. The actual reinvest price for the last dividend declared in the period may often be based on the Fund’s market price (and not its net asset value), and therefore may be different from the price used in the calculation. Total returns are not annualized. | ||
| (d) | Ratios do not reflect the effect of dividend payments to FundPreferred shareholders; Net Investment Income ratios reflect income earned and expenses incurred on assets attributable to FundPreferred shares, where applicable. | |
| (e) | After expense reimbursement from the Adviser, where applicable. Ratios do not reflect the effect of custodian credits earned on the Fund’s net cash on deposit with the custodian bank, where applicable. | |
| (f) | For the eleven months ended June 30, 2007. | |
| (g) | For the period March 28, 2005 (commencement of operations) through July 31, 2005. | |
| (h) | For the six months ended December 31, 2010. | |
| (i) | Represents distributions paid “From and in excess of net investment income” for the six months ended December 31, 2010. | |
| * | Annualized. | |
| ** | Rounds to less than $.01 per share. | |
| *** | Calculates to less than 1%. |
See accompanying notes to financial statements.
| Nuveen Investments | 19 | |
| Notes to Financial Statements (Unaudited) | |||||
| 1. | General Information and Significant Accounting Policies |
General Information
Nuveen Tax-Advantaged Floating Rate Fund (the “Fund”) is a closed-end management investment company registered under the Investment Company Act of 1940, as amended. The Fund’s Common shares are listed on the New York Stock Exchange (“NYSE”) Amex and trade under the ticker symbol “JFP”. The Fund was organized as a Massachusetts business trust on December 29, 2004.
The Fund’s primary investment objective is to provide an attractive level of after-tax current income. The Fund’s secondary investment objective is capital preservation. The Fund intends to pursue its investment objectives by investing at least 80% of its managed assets in adjustable rate preferred stock and other adjustable rate securities that the Fund believes, at the time of investment, are eligible to pay dividends that qualify for favorable federal income tax treatment (eligibility for the “dividends received deductions” or classified as “qualified dividend income”). At least 90% of the Fund’s managed assets will be invested in securities that, at the time of investment, are rated investment grade, or are unrated but judged to be of comparable quality by the Fund’s sub-advisor, Spectrum Asset Management (“Spectrum”).
A substantial portion of the Fund’s investments will be invested in securities issued by banking companies and other financial institutions, including securities of middle market banking companies. The Fund’s concentration of investments in these institutions includes the risk that banking companies and other financial institutions may themselves have concentrated portfolios, changes in interest rates or competition that could affect their profitability, and there could be increased costs or setbacks due to changes in the regulatory and financial reporting requirements under which they operate. The Fund may invest up to 25% of its managed assets in investment-grade securities issued by non-financial companies.
Effective January 1, 2011, Nuveen Asset Management (the “Adviser”), a wholly-owned subsidiary of Nuveen Investments, Inc. (“Nuveen”) has changed its name to Nuveen Fund Advisors, Inc.
During the fiscal year ended June 30, 2010, the following changes were made to the Fund, as previously approved by the Fund’s Board of Trustees:
| • | Effective, March 1, 2010, the Adviser agreed to voluntarily waive all management fees effective until further notice. |
| • | Effective March 19, 2010, the Fund’s maximum average duration increased from one to 2.5 years. |
| • | Effective as of the open on Wednesday, March 24, 2010, listing of the Fund’s Common shares was transferred from the NYSE to the NYSE-Amex exchange. |
The following is a summary of significant accounting policies followed by the Fund in the preparation of its financial statements in accordance with U.S. generally accepted accounting principles (“U.S. GAAP”).
Significant Accounting Policies
Investment Valuation
The prices of preferred stocks issued by middle market and major banking companies and other securities in the Fund’s investment portfolio are generally provided by one or more independent pricing services approved by the Fund’s Board of Trustees. The pricing services typically value exchange-listed securities at the last sales price on that day; and value securities traded in the over-the-counter market at the mean of the last bona fide bid and bona fide ask prices when current quotations are readily available. These securities will generally be classified as Level 1 or as a Level 2 depending on the priority of the significant inputs. The pricing services may value preferred stocks issued by middle market and major banking companies and other securities for which current quotations are not readily available at fair value using a wide range of market data and other information and analysis, including the obligor’s credit characteristics considered relevant by such pricing service to determine valuations. The Fund’s Board of Trustees has approved procedures which permit the Adviser to determine the fair value of investments for which the applicable pricing service or services is not providing a price, using market data and other factors such as the obligor’s credit characteristics.
The preferred stocks issued by middle market and major banking companies in which the Fund invests are generally not listed on an organized exchange and the secondary market for such investments may be less liquid relative to markets for other securities. Consequently, the value of
| 20 | Nuveen Investments | |
preferred stocks issued by middle market and major banking companies, determined as described above, may differ significantly from the value that would have been determined had there been an active market for that preferred stock.
Prices of fixed-income securities are provided by a pricing service approved by the Fund’s Board of Trustees. These securities are generally classified as Level 2. Prices of fixed-income securities are based on the mean between the bid and asked price. When price quotes are not readily available, the pricing service establishes a security’s fair value using methods that may include consideration of the following: yields or prices of investments of comparable quality, type of issue, coupon, maturity and rating, market quotes or indications of value from security dealers, evaluations of anticipated cash flows or collateral, general market conditions and other information and analysis, including the obligor’s credit characteristics considered relevant. In pricing certain securities, particularly less liquid and lower quality securities, the pricing service may consider information about a security, its issuer, or market activity provided by the Adviser. These securities are generally classified as Level 2 or Level 3 depending on the priority of significant inputs.
Repurchase agreements are valued at contract amount plus accrued interest, which approximates market value. These securities are generally classified as Level 2.
Certain securities may not be able to be priced by the pre-established pricing methods as described above. Such securities may be valued by the Fund’s Board of Trustees or its designee at fair value. These securities generally include, but are not limited to, restricted securities (securities which may not be publicly sold without registration under the Securities Act of 1933, as amended) for which a pricing service is unable to provide a market price; securities whose trading has been formally suspended; debt securities that have gone into default and for which there is no current market quotation; a security whose market price is not available from a pre-established pricing source; a security with respect to which an event has occurred that is likely to materially affect the value of the security after the market has closed but before the calculation of a Fund’s net asset value (as may be the case in non-U.S. markets on which the security is primarily traded) or make it difficult or impossible to obtain a reliable market quotation; and a security whose price, as provided by the pricing service, is not deemed to reflect the security’s fair value. As a general principle, the fair value of a security would appear to be the amount that the owner might reasonably expect to receive for it in a current sale. A variety of factors may be considered in determining the fair value of such securities, which may include consideration of the following: yields or prices of investments of comparable quality, type of issue, coupon, maturity and rating, market quotes or indications of value from security dealers, evaluations of anticipated cash flows or collateral, general market conditions and other information and analysis, including the obligor’s credit characteristics considered relevant. These securities are classified as Level 2 or as Level 3 depending on the priority of the significant inputs. Regardless of the method employed to value a particular security, all valuations are subject to review by the Fund’s Board of Trustees or its designee.
Refer to Footnote 2–Fair Value Measurements for further details on the leveling of securities held by the Fund as of the end of the reporting period.
Investment Transactions
Investment transactions are recorded on a trade date basis. Realized gains and losses from investment transactions are determined on the specific identification method, which is the same basis used for federal income tax purposes. Investments purchased on a when-issued/delayed delivery basis may have extended settlement periods. Any investments so purchased are subject to market fluctuation during this period. The Fund has instructed the custodian to segregate assets with a current value at least equal to the amount of the when-issued/delayed delivery purchase commitments. At December 31, 2010, the Fund had no such outstanding purchase commitments.
Investment Income
Dividend income is recorded on the ex-dividend date. Interest income, which reflects the amortization of premiums and includes accretion of discounts for financial reporting purposes, is recorded on an accrual basis. Interest income also reflects paydown gains and losses, if any.
Income Taxes
The Fund intends to distribute substantially all of its net investment income and net capital gains to shareholders and to otherwise comply with the requirements of Subchapter M of the Internal Revenue Code applicable to regulated investment companies. Therefore, no federal income tax provision is required.
For all open tax years and all major taxing jurisdictions, management of the Fund has concluded that there are no significant uncertain tax positions that would require recognition in the financial statements. Open tax years are those that are open for examination by taxing authorities (i.e., generally the last four tax year ends and the interim tax period since then). Furthermore, management of the Fund is also not aware of any tax positions for which it is reasonably possible that the total amounts of unrecognized tax benefits will significantly change in the next twelve months.
Dividends and Distributions to Common Shareholders
Distributions to Common shareholders are recorded on the ex-dividend date. The amount and timing of distributions are determined in accordance with federal income tax regulations, which may differ from U.S. GAAP.
The Fund makes monthly cash distributions to Common shareholders of a stated dollar amount per share. Subject to approval and oversight by the Fund’s Board of Trustees, the Fund may make as part of its monthly distributions supplemental amounts from sources other than net investment income (“Managed Distribution Program”). However, during this period the Fund has not implemented its Managed Distribution Program, but rather
| Nuveen Investments | 21 | |
| Notes to Financial Statements (Unaudited) (continued) |
has sought to source its monthly distributions solely from its net investment income, and did not include any supplemental amounts representing actual or anticipated portfolio price appreciation.
If the Fund were to implement its Managed Distribution Program, the Fund would seek to establish a distribution rate that reflects not only the projected net income from its portfolio of floating-rate securities but potentially also a portion of any anticipated recovery over time in the value of these securities. In such an implementation, total distributions during a calendar year generally will be made from the Fund’s net investment income, net realized capital gains and net unrealized capital gains in the Fund’s portfolio, if any. The portion of distributions paid from net unrealized gains, if any, would be distributed from the Fund’s assets and would be treated by shareholders as a non-taxable distribution for tax purposes. In the event that total distributions during a calendar year were to exceed the Fund’s total return on net asset value, the difference would be treated as a return of capital for tax purposes and would reduce net asset value per share.
The final determination of the source and character of all distributions for the fiscal year ended June 30, 2010, is reflected in the accompanying financial statements.
The distributions made by the Fund during the six months ended December 31, 2010, are provisionally classified as being “From and in excess of net investment income,” and those distributions will be classified as being from net investment income, net realized capital gains and/or a return of capital for tax purposes after the fiscal year end. For purposes of calculating “Undistributed (Over-distribution of) net investment income” as of December 31, 2010, the distribution amounts provisionally classified as “From and in excess of net investment income” were treated as being entirely from net investment income. Consequently, the financial statements at December 31, 2010, reflect an over-distribution of net investment income.
FundPreferred Shares
The Fund is authorized to issue auction rate preferred (“FundPreferred”) shares. During the fiscal year ended June 30, 2009, the Fund redeemed all $78,000,000 of its outstanding 3,120 Series Th FundPreferred shares, at liquidation value.
During the six months ended December 31, 2010, lawsuits pursuing claims made in a demand letter alleging that the Fund’s Board of Trustees breached their fiduciary duties related to the redemption at par of the Fund’s FundPreferred shares had been filed on behalf of shareholders of the Fund and against the Adviser, together with current and former officers and interested director/trustees of the Fund. Nuveen and the other named defendants believe these lawsuits to be without merit, and all named parties intend to defend themselves vigorously. The Fund believes that these lawsuits will not have a material effect on the Fund or on the Adviser’s ability to serve as investment adviser to the Fund.
Derivative Financial Instruments
The Fund is authorized to invest in certain derivative instruments, including credit default swaps and interest rate swaps. Although the Fund is authorized to invest in such derivative instruments, and may do so in the future, it did make any such investments during the six months ended December 31, 2010.
Market and Counterparty Credit Risk
In the normal course of business the Fund may invest in financial instruments and enter into financial transactions where risk of potential loss exists due to changes in the market (market risk) or failure of the other party to the transaction to perform (counterparty credit risk). The potential loss could exceed the value of the financial assets recorded on the financial statements. Financial assets, which potentially expose the Fund to counterparty credit risk, consist principally of cash due from counterparties on forward, option and swap transactions, when applicable. The extent of the Fund’s exposure to counterparty credit risk in respect to these financial assets approximates their carrying value as recorded on the Statement of Assets and Liabilities. Futures contracts, when applicable, expose a Fund to minimal counterparty credit risk as they are exchange traded and the exchange’s clearinghouse, which is counterparty to all exchange traded futures, guarantees the futures contracts against default.
The Fund helps manage counterparty credit risk by entering into agreements only with counterparties the Adviser believes have the financial resources to honor their obligations and by having the Adviser monitor the financial stability of the counterparties. Additionally, counterparties may be required to pledge collateral daily (based on the daily valuation of the financial asset) on behalf of the Fund with a value approximately equal to the amount of any unrealized gain above a pre-determined threshold. Reciprocally, when the Fund has an unrealized loss, the Fund has instructed the custodian to pledge assets of the Fund as collateral with a value approximately equal to the amount of the unrealized loss above a pre-determined threshold. Collateral pledges are monitored and subsequently adjusted if and when the valuations fluctuate, either up or down, by at least the pre-determined threshold amount.
Repurchase Agreements
In connection with transactions in repurchase agreements, it is the Fund’s policy that its custodian take possession of the underlying collateral securities, the fair value of which exceeds the principal amount of the repurchase transaction, including accrued interest, at all times. If the counterparty defaults, and the fair value of the collateral declines, realization of the collateral may be delayed or limited.
| 22 | Nuveen Investments | |
Custodian Fee Credit
The Fund has an arrangement with the custodian bank whereby certain custodian fees and expenses are reduced by net credits earned on the Fund’s cash on deposit with the bank. Such deposit arrangements are an alternative to overnight investments. Credits for cash balances may be offset by charges for any days on which the Fund overdraws its account at the custodian bank.
Indemnifications
Under the Fund’s organizational documents, its officers and trustees are indemnified against certain liabilities arising out of the performance of their duties to the Fund. In addition, in the normal course of business, the Fund enters into contracts that provide general indemnifications to other parties. The Fund’s maximum exposure under these arrangements is unknown as this would involve future claims that may be made against the Fund that have not yet occurred. However, the Fund has not had prior claims or losses pursuant to these contracts and expects the risk of loss to be remote.
Use of Estimates
The preparation of financial statements in conformity with U.S. GAAP requires management to make estimates and assumptions that affect the reported amounts of assets and liabilities at the date of the financial statements and the reported amounts of increases and decreases in net assets applicable to Common shares from operations during the reporting period. Actual results may differ from those estimates.
| 2. | Fair Value Measurements |
In determining the fair value of the Fund’s investments, various inputs are used. These inputs are summarized in the three broad levels listed below:
| Level 1 | – | Quoted prices in active markets for identical securities. | ||
| Level 2 | – | Other significant observable inputs (including quoted prices for similar securities, interest rates, prepayment speeds, credit risk, etc.). | ||
| Level 3 | – | Significant unobservable inputs (including management’s assumptions in determining the fair value of investments). |
The inputs or methodologies used for valuing securities are not an indication of the risk associated with investing in those securities. The following is a summary of the Fund’s fair value measurements as of December 31, 2010:
| Level 1 | Level 2 | Level 3 | Total | |||||||||||||
| Investments: | ||||||||||||||||
| Preferred Securities | $ | 4,031,737 | $ | 6,906,181 | $ | 12,201,022 | $ | 23,138,940 | ||||||||
| Capital Preferred Securities | 1,580,250 | 616,050 | 26,611 | 2,222,911 | ||||||||||||
| Short-Term Investments | – | 5,774,930 | – | 5,774,930 | ||||||||||||
| Total | $ | 5,611,987 | $ | 13,297,161 | $ | 12,227,633 | $ | 31,136,781 | ||||||||
The following is a reconciliation of the Fund’s Level 3 investments held at the beginning and end of the measurement period:
| Level 3 | ||||||||||||
| Level 3 | Capital | |||||||||||
| Preferred | Preferred | Level 3 | ||||||||||
| Securities | Securities | Total | ||||||||||
| Balance at the beginning of period | $ | 21,794,928 | $ | 52,626 | $ | 21,847,554 | ||||||
| Gains (losses): | ||||||||||||
| Net realized gains (losses) | (13,090,551 | ) | – | (13,090,551 | ) | |||||||
| Net change in unrealized appreciation (depreciation) | 11,006,093 | (26,611 | ) | 10,979,482 | ||||||||
| Purchases at cost | – | 596 | 596 | |||||||||
| Sales at proceeds | (7,509,448 | ) | – | (7,509,448 | ) | |||||||
| Net discounts (premiums) | – | – | – | |||||||||
| Transfers in to | – | – | – | |||||||||
| Transfers out of | – | – | – | |||||||||
| Balance at the end of period | $ | 12,201,022 | $ | 26,611 | $ | 12,227,633 | ||||||
| Net change in unrealized appreciation (depreciation) during the period of Level 3 securities held as of December 31, 2010 | $ | (4,935,420 | ) | $ | (26,611 | ) | $ | (4,962,031 | ) | |||
During the period ended December 31, 2010, the Fund recognized no significant transfers to/from Level 1, Level 2 or Level 3.
| 3. | Derivative Instruments and Hedging Activities |
The Fund records derivative instruments at fair value, with changes in fair value recognized on the Statement of Operations, when applicable. Even though the Fund’s investments in derivatives may represent economic hedges, they are not considered to be hedge transactions for financial reporting purposes. The Fund did not invest in derivative instruments during the six months ended December 31, 2010.
| Nuveen Investments | 23 | |
| Notes to Financial Statements (Unaudited) (continued) |
| 4. | Fund Shares |
Common Shares
Since the inception of the Fund’s repurchase program, the Fund has not repurchased any of its outstanding Common shares.
Transactions in Common shares were as follows:
| Six Months | Year | |||||||
| Ended | Ended | |||||||
| 12/31/10 | 6/30/10 | |||||||
| Common shares issued to shareholders due to reinvestment of distributions | 38,359 | 40,643 | ||||||
FundPreferred Shares
The Fund redeemed all $78,000,000 of its outstanding FundPreferred shares during the fiscal year ended June 30, 2009.
| 5. | Investment Transactions |
Purchases and sales (including maturities but excluding short-term investments) during the six months ended December 31, 2010, were as follows:
| Purchases | $ | 6,665,263 | ||
| Sales and maturities | 7,620,723 | |||
| 6. | Income Tax Information |
The following information is presented on an income tax basis. Differences between amounts for financial statement and federal income tax purposes are primarily due to timing differences in recognizing certain gains and losses on investment transactions. To the extent that differences arise that are permanent in nature, such amounts are reclassified within the capital accounts as detailed below. Temporary differences do not require reclassification. Temporary and permanent differences do not impact the net asset value of the Fund.
At December 31, 2010, the cost and unrealized appreciation (depreciation) of investments, as determined on a federal income tax basis, were as follows:
| Cost of investments | $ | 127,428,112 | ||
| Gross unrealized: | ||||
| Appreciation | $ | 309,615 | ||
| Depreciation | (96,600,946 | ) | ||
| Net unrealized appreciation (depreciation) of investments | $ | (96,291,331 | ) | |
Permanent differences, primarily due to return of capital distributions resulted in reclassifications among the Fund’s components of common share net assets at June 30, 2010, the Fund’s last tax year, as follows:
| Paid–in surplus | $ | (609,498 | ) | |
| Undistributed (over–distribution of) net investment income | 609,498 | |||
| Accumulated net realized gain (loss) | – | |||
The tax components of undistributed net ordinary income and net long-term capital gains at June 30, 2010, the Fund’s last tax year end, were as follows:
| Undistributed net ordinary income* | $ | – | ||
| Undistributed net long-term capital gains | – | |||
| * | Net ordinary income consists of net taxable income derived from dividends, interest, and net short-term capital gains, if any. Undistributed net ordinary income (on a tax basis) has not been reduced for the dividend declared on June 1, 2010, paid on July 1, 2010. |
The tax character of distributions paid during the Fund’s last tax year ended June 30, 2010, was designated for purposes of the dividends paid deduction as follows:
| Distributions from net ordinary income* | $ | 2,864,766 | ||
| Distributions from net long-term capital gains | – | |||
| Return of capital | 609,498 | |||
| * | Net ordinary income consists of net taxable income derived from dividends, interest, and net short-term capital gains, if any. |
| 24 | Nuveen Investments | |
At June 30, 2010, the Fund’s last tax year end, the Fund had unused capital loss carryforwards available for federal income tax purposes to be applied against future capital gains, if any. If not applied, the carryforwards will expire as follows:
| Expiration: | ||||
| June 30, 2016 | $ | 350,745 | ||
| June 30, 2017 | 38,341,520 | |||
| June 30, 2018 | 16,472,367 | |||
| Total | $ | 55,164,632 | ||
| 7. | Management Fees and Other Transactions with Affiliates |
The Fund’s management fee consists of two components – a fund-level fee, based only on the amount of assets within the Fund, and a complex-level fee, based on the aggregate amount of all eligible fund assets managed by the Adviser. This pricing structure enables Fund shareholders to benefit from growth in the assets within their Fund as well as from growth in the amount of complex-wide assets managed by the Adviser.
The annual fund-level fee, payable monthly, is calculated according to the following schedule:
| Average Daily Managed Assets* | Fund-Level Fee Rate | |||
| For the first $500 million | .7000 | % | ||
| For the next $500 million | .6750 | |||
| For the next $500 million | .6500 | |||
| For the next $500 million | .6250 | |||
| For managed assets over $2 billion | .6000 | |||
The annual complex-level fee, payable monthly, is calculated according to the following schedule:
| Complex-Level Managed Asset Breakpoint Level* | Effective Rate at Breakpoint Level | |||
| $55 billion | .2000 | % | ||
| $56 billion | .1996 | |||
| $57 billion | .1989 | |||
| $60 billion | .1961 | |||
| $63 billion | .1931 | |||
| $66 billion | .1900 | |||
| $71 billion | .1851 | |||
| $76 billion | .1806 | |||
| $80 billion | .1773 | |||
| $91 billion | .1691 | |||
| $125 billion | .1599 | |||
| $200 billion | .1505 | |||
| $250 billion | .1469 | |||
| $300 billion | .1445 | |||
| * | For the fund-level and complex-level fees, managed assets include closed-end fund assets managed by the Adviser that are attributable to financial leverage. For these purposes, financial leverage includes the funds’ use of preferred stock and borrowings and certain investments in the residual interest certificates (also called inverse floating rate securities) in tender option bond (TOB) trusts, including the portion of assets held by a TOB trust that has been effectively financed by the trust’s issuance of floating rate securities, subject to an agreement by the Adviser as to certain funds to limit the amount of such assets for determining managed assets in certain circumstances. The complex-level fee is calculated based upon the aggregate daily managed assets of all Nuveen funds that constitute “eligible assets.” Eligible assets do not include assets attributable to investments in other Nuveen funds and assets in excess of $2 billion added to the Nuveen Fund complex in connection with the Adviser’s assumption of the management of the former First American Funds effective January 1, 2011. As of December 31, 2010, the complex-level fee rate was .1831%. |
The management fee compensates the Adviser for overall investment advisory and administrative services and general office facilities. The Adviser has entered into a Sub-Advisory Agreement with Spectrum, under which Spectrum manages the investment portfolio of the Fund. Spectrum is compensated for its services to the Fund from the management fees paid to the Adviser. Spectrum also receives compensation on certain portfolio transactions for providing brokerage services to the Fund.
The Fund pays no compensation directly to those of its trustees who are affiliated with the Adviser or to its officers, all of whom receive remuneration for their services to the Fund from the Adviser or its affiliates. The Board of Trustees has adopted a deferred compensation plan for independent trustees that enables trustees to elect to defer receipt of all or a portion of the annual compensation they are entitled to receive from certain Nuveen advised funds. Under the plan, deferred amounts are treated as though equal dollar amounts had been invested in shares of select Nuveen advised funds.
| Nuveen Investments | 25 | |
| Notes to Financial Statements (Unaudited) (continued) |
For the first eight years of the Fund’s operations, the Adviser has agreed to reimburse the Fund, as a percentage of average daily managed net assets, for fees and expenses in the amounts and for the time periods set forth below:
| Year Ending | Year Ending | |||||||||
| March 31, | March 31, | |||||||||
| 2005 * | .30 | % | 2010 | .30 | % | |||||
| 2006 | .30 | 2011 | .22 | |||||||
| 2007 | .30 | 2012 | .14 | |||||||
| 2008 | .30 | 2013 | .07 | |||||||
| 2009 | .30 | |||||||||
| * | From the commencement of operations. |
The Adviser has not agreed to reimburse the Fund for any portion of its fees and expenses beyond March 31, 2013.
For the six months ended December 31, 2010, the Adviser waived all of the Fund’s management fees.
| 26 | Nuveen Investments | |
Reinvest Automatically
Easily and Conveniently
Easily and Conveniently
Nuveen makes reinvesting easy. A phone call is all it takes to set up your reinvestment account.
Nuveen Closed-End Funds Automatic Reinvestment Plan
Your Nuveen Closed-End Fund allows you to conveniently reinvest distributions in additional Fund shares.
By choosing to reinvest, you’ll be able to invest money regularly and automatically, and watch your investment grow through the power of compounding. Just like distributions in cash, there may be times when income or capital gains taxes may be payable on distributions that are reinvested.
It is important to note that an automatic reinvestment plan does not ensure a profit, nor does it protect you against loss in a declining market.
Easy and convenient
To make recordkeeping easy and convenient, each month you’ll receive a statement showing your total distributions, the date of investment, the shares acquired and the price per share, and the total number of shares you own.
How shares are purchased
The shares you acquire by reinvesting will either be purchased on the open market or newly issued by the Fund. If the shares are trading at or above net asset value at the time of valuation, the Fund will issue new shares at the greater of the net asset value or 95% of the then-current market price. If the shares are trading at less than net asset value, shares for your account will be purchased on the open market. If the Plan Agent begins purchasing Fund shares on the open market while shares are trading below net asset value, but the Fund’s shares subsequently trade at or above their net asset value before the Plan Agent is able to complete its purchases, the Plan Agent may cease open-market purchases and may invest the uninvested portion of the distribution in newly-issued Fund shares at a price equal to the greater of the shares’ net asset value or 95% of the shares’ market value on the last business day immediately prior to the purchase date. Distributions received to purchase shares in the open market will normally be invested shortly after the distribution payment date. No interest will be paid on distributions awaiting reinvestment. Because the market price of the shares may increase before purchases are completed, the average purchase price per share may exceed the market price at the time of valuation, resulting in the acquisition of fewer shares than if the distribution had been paid in shares issued by the Fund. A pro rata portion of any applicable brokerage commissions on open market purchases will be paid by Plan participants. These commissions usually will be lower than those charged on individual transactions.
| Nuveen Investments | 27 | |
Flexible
You may change your distribution option or withdraw from the Plan at any time, should your needs or situation change.
You can reinvest whether your shares are registered in your name, or in the name of a brokerage firm, bank, or other nominee. Ask your financial advisor if his or her firm will participate on your behalf. Participants whose shares are registered in the name of one firm may not be able to transfer the shares to another firm and continue to participate in the Plan.
The Fund reserves the right to amend or terminate the Plan at any time. Although the Fund reserves the right to amend the Plan to include a service charge payable by the participants, there is no direct service charge to participants in the Plan at this time.
Call today to start reinvesting distributions
For more information on the Nuveen Automatic Reinvestment Plan or to enroll in or withdraw from the Plan, speak with your financial advisor or call us at (800) 257-8787.
| 28 | Nuveen Investments | |
Glossary of Terms
Used in this Report
Used in this Report
| n | Average Annual Total Return: This is a commonly used method to express an investment’s performance over a particular, usually multi-year time period. It expresses the return that would have been necessary each year to equal the investment’s actual cumulative performance (including change in NAV or market price and reinvested dividends and capital gains distributions, if any) over the time period being considered. |
| n | Current Distribution Rate: Current distribution rate is based on the Fund’s current annualized monthly distribution divided by the Fund’s current market price. The Fund’s monthly distributions to its shareholders may be comprised of ordinary income, net realized capital gains and, if at the end of the calendar year the Fund’s cumulative net ordinary income and net realized gains are less than the amount of the Fund’s distributions, a tax return of capital. |
| n | Net Asset Value (NAV): A Fund’s NAV per common share is calculated by subtracting the liabilities of the Fund from its total assets and then dividing the remainder by the number of common shares outstanding. Fund NAVs are calculated at the end of each business day. |
| Nuveen Investments | 29 | |
Notes
| 30 | Nuveen Investments | |
Other Useful Information
Board of Trustees
John P. Amboian
Robert P. Bremner
Jack B. Evans
William C. Hunter
David J. Kundert
William J. Schneider
Judith M. Stockdale
Carole E. Stone
Virginia L. Stringer
Terence J. Toth
Fund Manager
Nuveen Fund Advisors, Inc.
333 West Wacker Drive
Chicago, IL 60606
Custodian
State Street Bank & Trust Company
Boston, MA
Transfer Agent and
Shareholder Services
State Street Bank & Trust Company
Nuveen Funds
P.O. Box 43071
Providence, RI 02940-3071
(800) 257-8787
Legal Counsel
Chapman and Cutler LLP
Chicago, IL
Independent Registered
Public Accounting Firm
Ernst & Young LLP
Chicago, IL
Quarterly Portfolio of Investments and Proxy Voting Information
You may obtain (i) the Fund’s quarterly portfolio of investments, (ii) information regarding how the Fund voted proxies relating to portfolio securities held during the most recent twelve-month period ended June 30, and (iii) a description of the policies and procedures that the Fund used to determine how to vote proxies relating to portfolio securities without charge, upon request, by calling Nuveen Investments toll-free at (800) 257-8787 or on Nuveen’s website at www.nuveen.com.
You may also obtain this and other Fund information directly from the Securities and Exchange Commission (SEC). The SEC may charge a copying fee for this information. Visit the SEC on-line at http://www.sec.gov or in person at the SEC’s Public Reference Room in Washington, D.C. Call the SEC at (202) 942-8090 for room hours and operation. You may also request Fund information by sending an e-mail request to publicinfo@sec.gov or by writing to the SEC’s Public Reference Section at 100 F Street NE, Washington, D.C. 20549.
CEO Certification Disclosure
The Fund’s Chief Executive Officer has submitted to the New York Stock Exchange (NYSE) the annual CEO certification as required by Section 303A.12(a) of the NYSE Listed Company Manual.
The Fund has filed with the SEC the certification of its Chief Executive Officer and Chief Financial Officer required by Section 302 of the Sarbanes-Oxley Act.
Common Share Information
The Fund intends to repurchase shares of its own common stock in the future at such times and in such amounts as is deemed advisable. During the period covered by this report, the Fund repurchased shares of its common stock as shown in the accompanying table.
| Common Shares | ||||||||||
| Repurchased | ||||||||||
| – | ||||||||||
Any future repurchases will be reported to shareholders in the next annual or semi-annual report.
| Nuveen Investments | 31 | |
Nuveen Investments:
Serving Investors for Generations
Serving Investors for Generations
Since 1898, financial advisors and their clients have relied on Nuveen Investments to provide dependable investment solutions through continued adherence to proven, longterm investing principles. Today, we offer a range of high quality equity and fixed-income solutions designed to be integral components of a well-diversified core portfolio.
Focused on meeting investor needs.
Nuveen Investments is a global investment management firm that seeks to help secure the long-term goals of institutions and high net worth investors as well as the consultants and financial advisors who serve them. We market our growing range of specialized investment solutions under the high-quality brands of HydePark, NWQ, Nuveen Asset Management, Santa Barbara, Symphony, Tradewinds and Winslow Capital. In total, Nuveen Investments managed approximately $195 billion of assets as of December 31, 2010.
Find out how we can help you.
To learn more about how the products and services of Nuveen Investments may be able to help you meet your financial goals, talk to your financial advisor, or call us at (800) 257-8787. Please read the information provided carefully before you invest. Investors should consider the investment objective and policies, risk considerations, charges and expenses of any investment carefully. Where applicable, be sure to obtain a prospectus, which contains this and other relevant information. To obtain a prospectus, please contact your securities representative or Nuveen Investments, 333 W. Wacker Dr., Chicago, IL 60606. Please read the prospectus carefully before you invest or send money.
Learn more about Nuveen Funds at: www.nuveen.com/cef
Nuveen makes things e-simple.
It only takes a minute to sign up for e-Reports. Once enrolled, you’ll receive an e-mail as soon as your Nuveen Fund information is ready—no more waiting for delivery by regular mail. Just click on the link within the e-mail to see the report and save it on your computer if you wish.
Free e-Reports right to your e-mail!
www.investordelivery.com
If you receive your Nuveen Fund distributions and statements from your financial advisor or brokerage account.
If you receive your Nuveen Fund distributions and statements from your financial advisor or brokerage account.
OR
www.nuveen.com/accountaccess
If you receive your Nuveen Fund distributions and statements directly from Nuveen.
If you receive your Nuveen Fund distributions and statements directly from Nuveen.
| Distributed by Nuveen Investments, LLC 333 West Wacker Drive Chicago, IL 60606 www.nuveen.com |
ESA-A-1210D
ITEM 2. CODE OF ETHICS.
Not applicable to this filing.
ITEM 3. AUDIT COMMITTEE FINANCIAL EXPERT.
Not applicable to this filing.
ITEM 4. PRINCIPAL ACCOUNTANT FEES AND SERVICES.
Not applicable to this filing.
ITEM 5. AUDIT COMMITTEE OF LISTED REGISTRANTS.
Not applicable to this filing.
ITEM 6. SCHEDULE OF INVESTMENTS.
| (a) | See Portfolio of Investments in Item 1. | ||
| (b) | Not applicable. |
ITEM 7. DISCLOSURE OF PROXY VOTING POLICIES AND PROCEDURES FOR CLOSED-END MANAGEMENT INVESTMENT COMPANIES.
Not applicable to this filing.
ITEM 8. PORTFOLIO MANAGERS OF CLOSED-END MANAGEMENT INVESTMENT COMPANIES.
Not applicable to this filing.
ITEM 9. PURCHASES OF EQUITY SECURITIES BY CLOSED-END MANAGEMENT INVESTMENT COMPANY AND AFFILIATED PURCHASERS.
Not applicable.
ITEM 10. SUBMISSION OF MATTERS TO A VOTE OF SECURITY HOLDERS.
There have been no material changes to the procedures by which shareholders may recommend nominees to the Registrant’s Board implemented after the registrant last provided disclosure in response to this item.
ITEM 11. CONTROLS AND PROCEDURES.
| (a) | The registrant’s principal executive and principal financial officers, or persons performing similar functions, have concluded that the registrant’s disclosure controls and procedures (as defined in Rule 30a-3(c) under the Investment Company Act of 1940, as amended (the “1940 Act”) (17 CFR 270.30a-3(c))) are effective, as of a date within 90 days of the filing date of this report that includes the disclosure required by this paragraph, based on their evaluation of the controls and procedures required by Rule 30a-3(b) under the 1940 Act (17 CFR 270.30a-3(b)) and Rules 13a-15(b) or 15d-15(b) under the Securities Exchange Act of 1934, as amended (the “Exchange Act”)(17 CFR 240.13a-15(b) or 240.15d-15(b)). | ||
| (b) | There were no changes in the registrant’s internal control over financial reporting (as defined in Rule 30a-3(d) under the 1940 Act (17 CFR 270.30a-3(d)) that occurred during the second fiscal quarter of the period covered by this report that has materially affected, or is reasonably likely to materially affect, the registrant’s internal control over financial reporting. |
ITEM 12. EXHIBITS.
File the exhibits listed below as part of this Form.
(a)(1) Any code of ethics, or amendment thereto, that is the subject of the disclosure required by Item 2, to the extent that the registrant intends to satisfy the Item 2 requirements through filing of an exhibit: Not applicable to this filing.
(a)(2) A separate certification for each principal executive officer and principal financial officer of the registrant as required by Rule 30a-2(a) under the 1940 Act (17 CFR 270.30a-2(a)) in the exact form set forth below: Ex-99.CERT attached hereto.
(a)(3) Any written solicitation to purchase securities under Rule 23c-1 under the 1940 Act (17 CFR 270.23c-1) sent or given during the period covered by the report by or on behalf of the registrant to 10 or more persons: Not applicable.
(b) If the report is filed under Section 13(a) or 15(d) of the Exchange Act, provide the certifications required by Rule 30a-2(b) under the 1940 Act (17 CFR 270.30a-2(b)); Rule 13a-14(b) or Rule 15d-14(b) under the Exchange Act (17 CFR 240.13a-14(b) or 240.15d-14(b)), and Section 1350 of Chapter 63 of Title 18 of the United States Code (18 U.S.C. 1350) as an exhibit. A certification furnished pursuant to this paragraph will not be deemed “filed” for purposes of Section 18 of the Exchange Act (15 U.S.C. 78r), or otherwise subject to the liability of that section. Such certification will not be deemed to be incorporated by reference into any filing under the Securities Act of 1933 or the Exchange Act, except to the extent that the registrant specifically incorporates it by reference. Ex-99.906 CERT attached hereto.
SIGNATURES
Pursuant to the requirements of the Securities Exchange Act of 1934 and the Investment Company Act of 1940, the registrant has duly caused this report to be signed on its behalf by the undersigned, thereunto duly authorized.
| (Registrant) Nuveen Tax-Advantaged Floating Rate Fund | ||||
| By (Signature and Title) | /s/ Kevin J. McCarthy | |||
| Kevin J. McCarthy | ||||
| Vice President and Secretary | ||||
Date: March 11, 2011
Pursuant to the requirements of the Securities Exchange Act of 1934 and the Investment Company Act of 1940, this report has been signed below by the following persons on behalf of the registrant and in the capacities and on the dates indicated.
| By (Signature and Title) | /s/ Gifford R. Zimmerman | |||
| Gifford R. Zimmerman | ||||
| Chief Administrative Officer (principal executive officer) | ||||
Date: March 11, 2011
| By (Signature and Title) | /s/ Stephen D. Foy | |||
| Stephen D. Foy | ||||
| Vice President and Controller (principal financial officer) | ||||
Date: March 11, 2011