Use these links to rapidly review the document
TABLE OF CONTENTS
TABLE OF CONTENTS2
Table of Contents
UNITED STATES
SECURITIES AND EXCHANGE COMMISSION
Washington, D.C. 20549
FORM 10-K
| | |
| (Mark One) | | |
ý |
|
ANNUAL REPORT PURSUANT TO SECTION 13 OR 15(d) OF THE SECURITIES EXCHANGE ACT OF 1934 |
For the fiscal year ended January 31, 2014 |
OR |
o |
|
TRANSITION REPORT PURSUANT TO SECTION 13 OR 15(d) OF THE SECURITIES EXCHANGE ACT OF 1934 |
For the transition period from to
|
Commission File Number: 001-35868
RALLY SOFTWARE DEVELOPMENT CORP.
(Exact name of registrant as specified in its charter)
| | |
Delaware
(State or other jurisdiction of
incorporation or organization) | | 84-1597294
(I.R.S. Employer
Identification Number) |
3333 Walnut Street
Boulder, Colorado 80301
(Address of principal executive offices, including zip code)
(303) 565-2800
(Registrant's telephone number, including area code)
Securities registered pursuant to the Section 12(b) of the Act:
| | |
| Title of each class | | Name of each exchange on which registered |
|---|
| Common stock, par value $0.0001 per share | | New York Stock Exchange, LLC. |
Securities registered pursuant to section 12(g) of the Act:
None
Indicate by check mark if the registrant is a well-known seasoned issuer, as defined in Rule 405 of the Securities Act: Yes o No ý
Indicate by check mark if the registrant is not required to file reports pursuant to Section 13 or Section 15(d) of the Act: Yes o No ý
Indicate by check mark whether the registrant (1) has filed all reports required to be filed by Section 13 or 15(d) of the Securities Exchange Act of 1934 during the preceding 12 months (or for such shorter period that the registrant was required to file such reports), and (2) has been subject to such filing requirements for the past 90 days. Yes ý No o
Indicate by check mark whether the registrant has submitted electronically and posted on its corporate Web site, if any, every Interactive Data File required to be submitted and posted pursuant to Rule 405 of Regulation S-T (§232.405 of this chapter) during the preceding 12 months (or for such shorter period that the registrant was required to submit and post such files). Yes ý No o
Indicate by check mark if disclosure of delinquent filers pursuant to Item 405 of Regulation S-K (§229.405 of this chapter) is not contained herein, and will not be contained, to the best of registrant's knowledge, in definitive proxy or information statements incorporated by reference in Part III of this Form 10-K or any amendment to this Form 10-K.o
Indicate by check mark whether the registrant is a large accelerated filer, an accelerated filer, a non-accelerated filer, or a smaller reporting company. See the definitions of "large accelerated filer," "accelerated filer" and "smaller reporting company" in Rule 12b-2 of the Exchange Act.
| | | | | | |
| Large accelerated filer o | | Accelerated filer o | | Non-accelerated filer ý
(Do not check if a
smaller reporting company) | | Smaller reporting company o |
Indicate by check mark whether the registrant is a shell company (as defined in Rule 12b-2 of the Exchange Act). Yes o No ý
The aggregate market value of the voting and non-voting common equity held by non-affiliates of the registrant as of July 31, 2013, the last business day of the registrant's most recently completed second fiscal quarter, based upon the closing sale price of $28.19 per share as reported by the New York Stock Exchange on that date, was approximately $651,506,532. This calculation does not reflect a determination that certain persons are affiliates of the registrant for any other purpose.
The number of shares outstanding of the registrant's common stock as of March 31, 2014 was 24,845,321 shares.
DOCUMENTS INCORPORATED BY REFERENCE
Portions of the registrant's definitive Proxy Statement for its 2014 Annual Meeting of Stockholders to be filed with the Securities and Exchange Commission pursuant to Regulation 14A not later than 120 days after the end of the fiscal year covered by this Annual Report on Form 10-K are incorporated by reference in Part III, Items 10-14 of this Annual Report on Form 10-K.
Table of Contents
RALLY SOFTWARE DEVELOPMENT CORP.
FORM 10-K
For the Fiscal Year Ended January 31, 2014
TABLE OF CONTENTS
| | | | | | |
| |
| | Page | |
|---|
PART I. | | | | |
Item 1. | | Business | | |
4 | |
Item 1A. | | Risk Factors | | | 16 | |
Item 1B. | | Unresolved Staff Comments | | | 34 | |
Item 2. | | Properties | | | 34 | |
Item 3. | | Legal Proceedings | | | 34 | |
Item 4. | | Mine Safety Disclosures | | | 34 | |
PART II. | | |
| |
Item 5. | | Market for Registrant's Common Equity, Related Stockholder Matters and Issuer Purchases of Equity Securities | | |
35 | |
Item 6. | | Selected Financial Data | | | 37 | |
Item 7. | | Management's Discussion and Analysis of Financial Condition and Results of Operations | | | 39 | |
Item 7A. | | Quantitative and Qualitative Disclosures About Market Risk | | | 64 | |
Item 8. | | Financial Statements and Supplementary Data | | | 65 | |
Item 9. | | Changes in and Disagreements with Accountants on Accounting and Financial Disclosure | | | 65 | |
Item 9A. | | Controls and Procedures | | | 65 | |
Item 9B. | | Other Information | | | 66 | |
PART III. | | |
| |
Item 10. | | Directors, Executive Officers and Corporate Governance | | |
66 | |
Item 11. | | Executive Compensation | | | 66 | |
Item 12. | | Security Ownership of Certain Beneficial Owners and Management and Related Stockholder Matters | | | 66 | |
Item 13. | | Certain Relationships and Related Transactions, and Director Independence | | | 66 | |
Item 14. | | Principal Accountant Fees and Services | | | 66 | |
PART IV. | | |
| |
Item 15. | | Exhibits and Financial Statement Schedules | | |
67 | |
Signatures | | |
68 | |
FINANCIAL STATEMENTS | | |
| |
| | Report of Independent Registered Public Accounting Firm | | |
F-1 | |
| | Consolidated Financial Statements | | | | |
| | Consolidated Balance Sheets | | | F-2 | |
| | Consolidated Statements of Operations | | | F-3 | |
| | Consolidated Statements of Comprehensive Loss | | | F-4 | |
| | Consolidated Statements of Common Stockholders' Equity (Deficit) | | | F-5 | |
| | Consolidated Statements of Cash Flows | | | F-6 | |
| | Notes to the Consolidated Financial Statements | | | F-7 | |
1
Table of Contents
Unless the context requires otherwise, references in this Annual Report on Form 10-K to "Rally," "we," "company," "us" and "our" refer to Rally Software Development Corp. and its subsidiaries. We have a January 31 fiscal year-end. Accordingly, all references in this Annual Report on Form 10-K to a fiscal year refer to the twelve months ended January 31 of such year, and references to the first, second, third and fourth fiscal quarters refer to the three months ended April 30, July 31, October 31 and January 31, respectively.
Rally, the Rally logo and other trademarks or service marks of Rally Software Development Corp. appearing in this Annual Report on Form 10-K are the property of Rally Software Development Corp. Trade names, trademarks and service marks of other companies appearing in this report are the property of their respective holders.
2
Table of Contents
PART I
SPECIAL NOTE REGARDING FORWARD-LOOKING STATEMENTS
This Annual Report on Form 10-K contains forward-looking statements within the meaning of the Private Securities Litigation Reform Act of 1995. All statements contained in this Annual Report on Form 10-K other than statements of historical fact, including statements regarding our future results of operations and financial position, our business strategy and plans, and our objectives for future operations, are forward-looking statements. In some cases you can identify these statements by forward-looking words such as "anticipate," "believe," "continue," "could," "estimate," "expect," "intend," "may," "plan," "project," "will," "would" or the negative or plural of these words or similar expressions. These forward-looking statements include, but are not limited to, statements concerning the following:
- •
- our financial performance, including our revenue, costs, expenditures, growth rates, operating expenses and ability to generate positive cash flow to attain and sustain profitability;
- •
- the growth of demand for Agile software development;
- •
- expanding our relationships with our existing customers;
- •
- our ability to attract and retain customers;
- •
- our ability to adapt to changing market conditions and competition;
- •
- our ability to successfully enter new markets and manage our international expansion;
- •
- our ability to effectively manage our growth;
- •
- economic and financial conditions;
- •
- anticipated technology trends, such as the use of cloud-based software solutions;
- •
- the reliability of our third-party data centers;
- •
- our ability to adapt to technological change and continue to innovate;
- •
- our ability to integrate our solutions with other software applications;
- •
- our ability to maintain, protect and enhance our brand and intellectual property;
- •
- costs associated with defending intellectual property infringement and other claims;
- •
- our ability to attract and retain qualified employees and key personnel;
- •
- maintaining and expanding our relationships with third parties; and
- •
- other factors discussed in this Annual Report on Form 10-K in the sections titled "Business," "Risk Factors" and "Management's Discussion and Analysis of Financial Condition and Results of Operations."
These forward-looking statements are subject to a number of risks, uncertainties and assumptions, including those described in Part I, Item 1A, "Risk Factors" in this Annual Report on Form 10-K. Moreover, we operate in a very competitive and rapidly-changing environment. New risks emerge from time to time. It is not possible for our management to predict all risks, nor can we assess the impact of all factors on our business or the extent to which any factor, or combination of factors, may cause actual results to differ materially from those contained in any forward-looking statements we may make. In light of these risks, uncertainties and assumptions, the forward-looking events and circumstances discussed in this prospectus may not occur and actual results could differ materially and adversely from those anticipated or implied in the forward-looking statements.
3
Table of Contents
You should not rely upon forward-looking statements as predictions of future events. Although we believe that the expectations reflected in the forward-looking statements are reasonable, we cannot guarantee that the future results, levels of activity, performance or events and circumstances reflected in the forward-looking statements will be achieved or occur. Moreover, except as required by law, neither we nor any other person assumes responsibility for the accuracy and completeness of the forward-looking statements. We undertake no obligation to update publicly any forward-looking statements for any reason after the date of this prospectus to conform these statements to actual results or to changes in our expectations.
ITEM 1. BUSINESS
Company Overview
Rally Software is a leading global provider of cloud-based solutions for managing Agile software development. Our platform transforms the way organizations manage the software development lifecycle by enabling close alignment of software development and strategic business objectives, facilitating collaboration, increasing transparency, and automating manual processes. Organizations use our solutions to accelerate the pace of innovation, improve productivity and more effectively adapt to rapidly-changing customer needs and competitive dynamics. Our enterprise-class platform is extensible, cost-effective and designed to be easy to use. As of January 31, 2014, we had 214,047 paid users and more than 1,100 customers, including more than 35 of the Fortune 100 companies.
Software continues to rapidly proliferate, enabling product innovation and driving many of today's key technology trends, including cloud computing, mobility and social networking. Software has traditionally been developed using manual processes or legacy techniques, such as the "waterfall" method, which are often characterized by rigid and lengthy development cycles and frequently fail to produce software that meets customer needs. Today, these legacy methodologies are being disrupted and replaced by Agile practices that improve time-to-market, reduce development costs and produce higher quality software that better meets customer expectations.
Agile is a software development methodology characterized by short, iterative and highly-adaptable development cycles. Since its introduction in 2001, organizations have increasingly adopted Agile. We are a pioneer in management solutions for Agile software development. We provide a common platform on which organizations can collaborate across globally-distributed software development teams, solicit ideas and feedback from customers, and gain transparency into Agile software development projects. Our solutions automate and optimize activities such as project planning and scheduling, resource allocation, quality management and reporting on progress and cost, enabling users to manage the entire Agile software development lifecycle. Our cloud-based platform of management solutions is designed to address the application lifecycle market, which we define as comprising the software configuration management, IT project and portfolio management, and automated software quality markets. While the application lifecycle market today is largely served by legacy offerings, we believe that as enterprises increase their use of Agile techniques for new software development projects Agile software offerings will continue to see increased market adoption.
A majority of our revenue comes from large, global enterprises across diverse industries, including manufacturing, communications, energy, financial services, healthcare, insurance, retail, technology and transportation. We sell our solutions primarily through a direct sales force, both domestically and internationally. We employ a land-and-expand go-to-market strategy where we initially seek to land a new customer by helping them establish Agile practices within an initial team, project or business unit using a paid subscription. After demonstrating the value of our solutions to those first adopters, our sales team, in conjunction with our professional services team, works to expand the use of our solutions and sell additional subscriptions across the organization by targeting other development teams, departments and business units.
4
Table of Contents
From fiscal 2013 to fiscal 2014, our subscription and support revenue grew from $43.8 million to $57.9 million, representing a 32% year-over-year growth rate. From fiscal 2012 to fiscal 2013, our subscription and support revenue grew from $31.1 million to $43.8 million, representing a 41% year-over-year growth rate. We primarily sell our solutions through one-year subscriptions. For the fiscal years ended January 31, 2014, 2013 and 2012, our renewal rate among existing customers was 116%, 127% and 129%, respectively, taking into account paid seat nonrenewals, upgrades and downgrades. From fiscal 2013 to fiscal 2014, our professional services revenue increased from $7.2 million to $10.6 million, representing a 46% year-over-year growth rate. From fiscal 2012 to fiscal 2013, our professional services revenue increased from $6.7 million to $7.2 million, representing a 9% year-over-year growth rate.
From fiscal 2013 to fiscal 2014, our total revenue grew from $56.8 million to $74.3 million, representing a 31% year-over-year growth rate. From fiscal 2012 to fiscal 2013, our total revenue grew from $41.3 million to $56.8 million, representing a 38% year-over-year growth rate. We recorded net losses of $20.1 million, $10.8 million and $11.6 million in fiscal 2014, 2013 and 2012, respectively.
Our Solutions
Our cloud-based platform is designed to facilitate adoption of Agile practices by enabling organizations to manage the shorter, faster cycles that characterize Agile software development processes. Organizations use our solutions to accelerate the pace of innovation, improve productivity and more effectively adapt to rapidly-changing customer needs and competitive dynamics. We believe our solutions benefit customers in the following ways:
- •
- Accelerate the pace of innovation and improve software quality. Our solutions improve and enhance many aspects of the software development process by removing bottlenecks that can waste time. Organizations use our platform to optimize their software development activities and manage the greater frequency of software features and functions that are produced by using Agile techniques. Our platform also helps organizations identify errors earlier in the software development lifecycle and enables their prompt remediation, leading to higher-quality code and fewer process delays.
- •
- Provide greater transparency. Users of our platform gain transparency into the Agile software development process across development teams, functional lines and business units. Our solutions provide real-time visibility into a project's progress and costs, work streams, resource allocation, capacity and other aspects of the software development process. Our platform collects data from disparate sources and integrates it into a single repository, enabling a holistic view of the Agile software development lifecycle. We also offer analytics and reporting capabilities that transform this data into actionable intelligence, enabling users to make better business decisions. The use of our platform allows our customers to more quickly and effectively adapt to changing market dynamics, customer preferences and their competitive environment.
- •
- Enhance collaboration and facilitate rapid feedback. Our solutions empower development teams, business leaders and customers to collaborate and rapidly share ideas and content through an intuitive user interface. This allows development teams to obtain feedback earlier and more often so they can adapt to changing business and customer requirements. Users of our solutions can achieve increased productivity, closer alignment between software development and business initiatives, reduction in unused code and greater customer satisfaction.
- •
- Easy and cost-effective to try, use and adopt. Customers can easily access our cloud-based solutions with an Internet browser and begin using our platform in minutes. The cloud-based version of our platform is cost-effective to adopt compared to on-premise offerings as it avoids large up-front software expenditures and does not require significant infrastructure or IT support. In addition, we provide educational resources to help users learn and apply Agile
5
Table of Contents
Our Competitive Strengths
The following competitive strengths are key to our success:
- •
- Broad enterprise-class solutions portfolio. Our platform is designed to support organizations with thousands of distributed users and to easily scale to handle large and complex Agile software development projects. Our broad portfolio of enterprise-class solutions helps development organizations manage the entire software development lifecycle, from idea through quality testing. We believe this provides us with a significant advantage over competitors that focus on small and medium businesses or have discrete, point offerings.
- •
- Leader in Agile with deep domain expertise. Since our inception, we have focused on the management of Agile software development and we possess deep capabilities and expertise on the subject. For example, we believe we were the first vendor to offer a cloud-based Agile project management solution and an Agile portfolio management solution. We also employ professionals and Agile coaches with extensive experience in the implementation and deployment of Agile software development techniques across an organization.
- •
- Large, diverse base of enterprise customers. As of January 31, 2014, we had more than 1,100 customers, including more than 35 of the Fortune 100 companies. Our customer base is highly diverse and includes enterprises across many major industries around the world. We believe many of our enterprise customers view us as a key strategic solutions provider and we achieve high customer satisfaction. We believe this allowed us to maintain a renewal rate among existing customers of 116%, 127% and 129%, for fiscal 2014, 2013 and 2012, respectively, taking into account paid seat nonrenewals, upgrades and downgrades, and also to expand our footprint within enterprises and support the ongoing adoption of Agile software development. In addition, this provides us with a highly referenceable customer base, that we leverage to acquire new customers.
- •
- Cloud-based platform and subscription business model. Our cloud-based solutions are principally offered on a subscription basis over the Internet. Our multi-tenant architecture enables us to run a single instance of our software code, add subscribers with minimal incremental expense, and deploy new functionality and upgrades quickly and efficiently. Our cloud-based infrastructure is designed to provide our customers with high performance, security and availability.
- •
- Large direct sales organization with global reach. Our global sales organization is focused on adding new customers and expanding relationships with existing customers. We believe our team is the world's largest sales organization selling cloud-based solutions for the management of Agile software development. To enhance effectiveness and focus, our sales organization is segmented by size of customer and geography. Our sales teams focus on specific market segments, including enterprises and specific geographies. In addition, our sales teams partner
6
Table of Contents
Our Growth Strategy
Our objective is to be the world's leading provider of Agile management solutions. The key elements to our growth strategy include:
- •
- Increase sales to existing customers. We employ a land-and-expand go-to-market strategy where we initially seek to land a new customer by helping establish Agile practices within an initial team, project or business unit. After demonstrating the value of our solutions to those first adopters, we work to expand the use of our solutions and sell additional subscriptions across the organization. For example, our top 15 customers in fiscal 2014 increased the aggregate number of seats they purchased from us by 44% relative to the prior year. As of January 31, 2014, we had over 1,100 customers in a wide variety of industries and we believe a significant opportunity exists to sell them additional subscriptions and solutions.
- •
- Acquire new customers. We believe the market for Agile management solutions is large, growing and underpenetrated. We are recognized as a leader in Agile management solutions and we believe this market position and our brand helps support our new customer acquisition efforts. We offer several editions of our platform to encourage the trial and usage of our solutions and will continue to invest in other demand-generating activities, such as online marketing campaigns. We also plan to increase our global sales force and expand our partner ecosystem to accelerate new customer acquisition. Additionally, we intend to further utilize our web-based sales channel to attract new enterprise and mid-market customers.
- •
- Continue to innovate. We utilize Agile software development practices to rapidly innovate and bring new solutions to market. Our cloud-based platform enables us to quickly and efficiently deliver new solutions, updates and upgrades to our customers. We will continue to invest in research and development to further extend and enhance the functionality of our Agile management solutions. We will also continue to develop close working relationships with our customers and collect real-time feedback, which we believe allows us to better meet their specific and rapidly-changing needs.
- •
- Expand our international presence. For fiscal 2014, 2013 and 2012, approximately 14%, 13% and 14%, respectively, of our revenue was derived from international customers. We currently maintain international offices and have sales, marketing, support or research and development
7
Table of Contents
personnel in the United Kingdom, Australia, Finland, the Netherlands and Singapore. We also have sales personnel in Canada and Germany. We believe there is a significant opportunity to increase our revenue abroad, particularly in Europe and emerging markets in Asia, and we plan to open new sales offices in these regions.
- •
- Increase market awareness and drive adoption of Agile practices and our solutions. We offer a free version of our platform, which provides entry-level functionality and allows customers to evaluate the benefits of our solutions. We also provide Agile resources, such as analyst reports, webinars, blogs and videos that educate potential customers on Agile practices. In addition, we host our annual RallyON user conference and sponsor other regional and industry events. We believe these initiatives promote awareness of Agile practices, increase our potential customer base and encourage adoption of our solutions.
- •
- Pursue selective strategic acquisitions. We intend to opportunistically pursue acquisitions of complementary businesses, technologies and capabilities that expand the functionality of our solutions, provide access to new customers and markets, and support our Agile leadership.
Solutions and Services
Our Agile Management Solutions
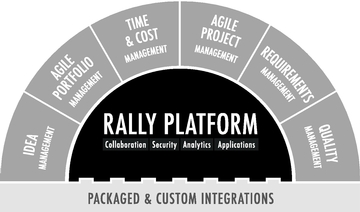
We offer Agile management solutions that our customers use for planning, collaborating, tracking and reporting on the creation of new software products and applications. Our solutions support the full software development lifecycle with key capabilities that include Idea Management, Agile Portfolio Management, Time and Cost Management, Agile Project Management, Requirements Management and Quality Management.
These capabilities operate on our programmable and extensible platform that incorporates analytics and reporting, security and administration, customizations and integrations. Our platform is built using a single code base and with a multi-tenant architecture that we host in third-party data centers.
The following diagram illustrates the capabilities of our solutions:
Idea Management. Our Idea Management capability, Rally Idea Manager, is used by our customers to engage with their end users to solicit ideas for products and manage feedback on proposed features and enhancements. This capability establishes a communication channel between our customers and their end-users. Teams and organizations use this capability to:
- •
- engage directly with end-users in an online community;
- •
- collect information to assess customer needs; and
8
Table of Contents
- •
- automatically communicate development status to end-users.
Agile Portfolio Management. Our Agile Portfolio Management capability, Rally Portfolio Manager, bridges the gap between business leaders and development teams. Business leaders are provided up-to-date and accurate information on the status of key projects while development teams are provided clear visibility into the priorities of the business in order to better align their feature backlogs. Teams and organizations use this capability to:
- •
- prioritize their work according to business value;
- •
- align development with investment plans;
- •
- see an overall business view of their Agile development status;
- •
- provide information to empower business leaders to make informed trade-off decisions; and
- •
- view realistic roadmaps of planned deliverables.
Time and Cost Management. Our Time and Cost Management capability, Rally Time Tracker, enables key financial functions related to software development, such as software capitalization, cost tracking, budget management and billing. This capability reduces double entry in other systems and ensures data is captured and aggregated into reports. Teams and organizations use this capability to:
- •
- reduce daily overhead of tracking time by integrating into the daily process;
- •
- design and generate aggregate timesheets to meet accounting, budgeting or billing requirements;
- •
- ensure that time entries meet audit and compliance requirements; and
- •
- integrate time tracking information into existing back office and time and attendance applications.
Agile Project Management. Our Agile Project Management capability allows cross-functional teams to efficiently plan and manage software releases. Teams and organizations use this capability to:
- •
- manage product and release backlogs that reflect the priorities of the business;
- •
- schedule all or parts of requirements from backlogs into releases based on capacity; and
- •
- gain real-time visibility into the status of features, quality, priorities, roadblocks and risks.
Requirements Management. Our Requirements Management capability enables business leaders and analysts to centrally manage and prioritize features for development. Users can elaborate requirements with needed details, break them up into smaller units and organize them to match the changing structures of their teams or technology components. Teams and organizations use this capability to:
- •
- centrally manage and prioritize requirement backlogs;
- •
- author requirements using rich media composers;
- •
- handle small single-team requirements and coordinate requirements for large, multi-team programs; and
- •
- trace requirement associations and dependencies to assess the impact of changes.
9
Table of Contents
Quality Management. Our Quality Management capability, Rally Quality Manager, enables testing engineers to integrate quality testing into the development process from the beginning of a project. This capability provides a full enterprise solution to plan and track the execution of test activities. Teams and organizations use this capability to:
- •
- design test plans;
- •
- schedule a set of tests into iterations or releases to accurately track the status of projects; and
- •
- view reports and dashboards to visualize the status of test coverage, including test results.
Platform Capabilities
Analytics and Reporting. Our platform employs a proprietary analytics and reporting engine. In addition to over 25 pre-built standard reports, our platform includes a custom reporting engine that allows customers to create reports to meet their unique needs. Our platform also includes dashboard technology to present personalized content and then share that content for consistent use across a team or organization.
Security and Administration. Our platform provides enterprise-class security capabilities simplifying the administration of thousands of users. We can integrate our platform with our customers' existing security infrastructure to provide end-users with the ability to have single-sign-on (SSO) and provide advanced security measures to reduce risk and meet the needs of enterprises.
Programmable Platform. Our capabilities reside within a programmable cloud-based platform. This enables our solutions to be adapted to the needs of individual organizations. This adaptability also ensures our solutions can be configured to meet the changing needs of an organization. Our programmable platform includes the following functionalities:
- •
- Open Web Services API. We offer an open web services application programming interface (WSAPI) providing full read-write access to all of the data within our platform. The WSAPI is versioned so that integrations or customizations are insulated from changes in the WSAPI, thereby preserving a customer's investment in custom functionality.
- •
- Customization via Apps. Apps customize and extend our platform's capabilities. Customers can select from our online catalog of over 90 Apps pre-built by us and our customers, or choose to author their own custom App. We also provide customization services that produce Apps for specific customer needs. Examples of Apps that are available in our catalog include:
- •
- Dependency Status Dashboard enables organizations to view dependencies between teams and forecast potential impediments and stoppages in a project.
- •
- System Requirement Validation Document generates a document for signature and archival typically used by customers in regulated industries to validate that the requirements of a system or application have been met.
- •
- Agile Earned-Value Management provides a report based on traditional project management practices that provide what-if scenarios for planning scope, schedule and budget.
- •
- Packaged and Custom Integrations. There are over 40 integrations available for our platform. We have over 25 pre-built integrations with complementary products that synchronize their data with our platform. Additionally, there are over 20 integrations that third parties have created with our platform that they offer to their customers. We also integrate with popular open-source development tools, including Subversion, Jenkins and Eclipse, as well as commercial products, including Microsoft Excel, Microsoft Visual Studio and HP QualityCenter.
10
Table of Contents
Editions
We currently offer three editions of our Agile management solution. Each edition is built on the same software code base.
Rally Community Edition is designed for an individual team that operates independently, even if it is part of a larger organization. Community Edition includes a basic version of Agile Project Management and Requirements Management capabilities and is available for free for 10 users and one project.
Rally Enterprise Edition is targeted at medium to large organizations focused on coordinating projects across multiple teams. Enterprise Edition includes Agile Project Management, Requirements Management and basic Quality Management capabilities. Enterprise Edition supports unlimited users and projects.
Rally Unlimited Edition is built for large organizations and offers our full set of capabilities for managing the entire software lifecycle, including Idea Management, Agile Portfolio Management, Time and Cost Management, Agile Project Management, Requirements Management and Quality Management. Unlimited Edition supports unlimited users and projects.
The following table illustrates the capabilities included in each of our editions:
| | | | | | |
Capability | | Community
Edition | | Enterprise
Edition | | Unlimited
Edition |
|---|
Agile Project Management | | Basic | | ü | | ü |
Requirements Management | | Basic | | ü | | ü |
Quality Management | | | | Basic | | ü |
Idea Management | | | | | | ü |
Agile Portfolio Management | | | | | | ü |
Time and Cost Management | | | | | | ü |
Number of Projects | | 1 | | Unlimited | | Unlimited |
Number of Users | | 10 | | Unlimited | | Unlimited |
On-Premise Deployment Option
A small percentage of our customers deploy our solutions on-premise. When our software is installed at the customer site, we specify the hardware requirements and deliver our solutions on a virtual software appliance.
Professional Services
We offer a broad array of professional services to our customers to assist them in the implementation of our platform and adoption of Agile techniques. We offer our services globally.
Our professional services include:
- •
- Agile Practices Training. We offer public and private courses educating customers on Agile practices. A number of our training courses are certified by the independent organization Scrum Alliance. Through our Agile University brand, we offer Agile-related education and coursework taught by our consultants and a network of instructors.
- •
- Agile Coaching Services. We offer a broad set of services that help customers implement Agile practices across their organization. We aim to make organizations self-sufficient so they can continue expanding their usage of Agile after we conclude our services engagement.
- •
- Implementation Services. Our implementation services combine workshops and training to help organizations incorporate our platform into their development process. These services include
11
Table of Contents
Customers
Our customers operate in a wide variety of industries including the manufacturing, communications, energy, financial services, healthcare, insurance, public, retail, technology and transportation sectors. As of January 31, 2014, we had over 1,100 customers. In fiscal 2014, no customer represented more than 4% of our revenue.
Sales and Marketing
Sales
We employ a land-and-expand go-to-market strategy where we initially seek to land a new customer by helping establish Agile practices within an initial team, project or business unit. After demonstrating the value of our solutions to those first adopters, we work to expand the use of our solutions and sell additional subscriptions across the organization by targeting other development teams, departments and business units.
We sell our solutions and professional services primarily through our direct sales force. As of January 31, 2014, we had 182 employees in sales and marketing worldwide.
Marketing
We leverage our brand and thought leadership in Agile software development to create and deliver education-based marketing campaigns. Our campaigns target software executives, project management professionals, development teams and senior technology leaders through demand generation programs, community building, sales pipeline development and engagement with industry experts. Our principal marketing initiatives include:
- •
- Demand Management. Our demand management activities include lead generation and nurturing, free trials of our platform, free online Agile resources and analyst reports, videos and case studies, webinars, email and sponsorship campaigns, regional field events, participation in industry and on-site customer events, and online and search marketing.
- •
- Customer Marketing. We educate our customers on Agile topics through webinars and on-site events to generate additional sales opportunities. Additionally, we sponsor regional meetings, and host our annual RallyON user conference. We also co-market with our strategic collaborators on programs, including joint press announcements, field events and demand generation activities.
- •
- Market Development. We devote marketing resources to blogging, social media engagement, analyst relations, press and media relations, event speaking opportunities and corporate communications activities.
Strategic Relationships
We have established a network of relationships to help extend additional functionality to our customers, broaden our geographic presence and drive incremental revenue. These relationships include
12
Table of Contents
technology integrations with vendors, joint sales and implementation opportunities with global system integrators and reselling relationships with regional consulting and services organizations. While we believe that our network of strategic relationships is important to promote the growth and adoption of Agile methodologies, to date these relationships have not contributed materially to our revenue.
Technology
Our cloud-based solutions utilize a multi-tenant architecture and our customers access our solutions through the Internet using a standard web browser. Our solutions use a single code base and are designed to be secure and easily scalable. All of our hosted customers run on the current version of our platform.
We employ a modular architecture to balance customer workloads across multiple servers and to provide a flexible method for scaling customers without impacting other parts of the server environment. This architecture is designed to allow us to provide the high levels of uptime required by our customers. Our existing infrastructure has been designed with sufficient capacity to meet our current and anticipated future needs. We employ capacity planning techniques to ensure we have required capacity for our forecasted growth.
We designed our solutions to meet rigorous industry security standards (ISO27001 and NIST 800-53 / FISMA Moderate) and assure customers' sensitive data is protected across our platform. We offer high levels of security by segregating each customer's data from the data of other customers and by limiting access to our platform to only those individuals authorized by our customers. Periodic security audits are conducted by an external third party and include code reviews, firewall penetration testing and vulnerability scans. In addition, customer data is encrypted.
Our technology is based on a multi-tenant operating model that applies common, consistent management practices for customers using the service. We have a standardized Java-based development environment and our software is written in industry-standard software programming languages. We utilize a proprietary combination of business logic and data server technology to enable multiple customer tenants to share one version of our application while isolating each customer's data. We built our solutions using service-oriented architecture (SOA) principles and employ proprietary and third-party technologies. The third-party technologies include the Linux operating system, Oracle database, Java programming language and Jetty application server. We utilize commercially available, industry-standard hardware and network components for our data-center servers.
Operations
Our operations team monitors our production system 24 hours a day, seven days a week. We serve our customers from two secure, third-party, American National Standards Institute Tier 3 data center facilities, one located in Denver, Colorado and the other located in the Seattle, Washington area. These facilities provide 24 hours a day, seven days a week manned security, biometric access controls, systems security, redundant power and environmental controls. We believe that these two data centers have sufficient capacity to meet our anticipated growth for the foreseeable future. Our agreements with the data center provider have a three-year term, expiring in October 2015. We received SSAE 16 attestation reports for both facilities for the twelve-month period ended September 30, 2013.
Infrastructure maintained by us within these facilities includes firewalls, switches, routers, load balancers, IDS/IPS and application firewalls that provide networking infrastructure and security. We use rack-mounted servers to run our platform and a network of edge servers for content caching. We use storage area network (SAN) hardware at both data center locations. These SAN systems have been designed for high performance and data-loss prevention. We believe these systems have the capability and scalability to enable us to grow for the foreseeable future.
13
Table of Contents
Our cloud-based infrastructure is designed to provide our customers with high performance and availability with 99.9% uptime, excluding planned downtime, for the twelve months ended January 31, 2014.
Research and Development
We work closely with our customers to continuously develop new functionality while enhancing and maintaining our existing solutions. We utilize Agile software development techniques, in combination with a cloud-based delivery model, which allows us to deliver enhanced software features across our customer base on a frequent basis.
Our research and development organization is located primarily in our Boulder, Colorado headquarters. We also employ research and development staff in our Denver, Colorado; Raleigh, North Carolina; Seattle, Washington and Helsinki, Finland area offices. Our research and development expenses were $20.8 million, $15.1 million and $11.1 million for fiscal 2014, 2013 and 2012, respectively. For fiscal 2015 and beyond, we expect that our research and development expenses will increase from these historical levels as we invest to further extend and enhance the functionality of our Agile management solutions.
Competition
The market for our solutions is extremely competitive, rapidly evolving and subject to changing technology. We primarily face competition from potential customers electing to use in-house offerings, privately-held Agile management vendors and software development tool providers, and providers of open source offerings. We also compete with large, diversified software and technology vendors and, as the market further adopts Agile practices, we expect increased competition from these vendors. Our competitors vary in size and in the breadth and scope of the products and services offered. Some of our competitors can bundle competing products and services with other software offerings, or offer them at a low price as part of a larger sale. Further, other companies not currently offering Agile management products may enter our market. We expect competition to persist and intensify in the future.
Our competitors include:
- •
- privately-held Agile management software vendors and software development tool providers, such as Atlassian, CollabNet and VersionOne;
- •
- providers of open source software; and
- •
- large, diversified, publicly-held software vendors, such as Hewlett-Packard, IBM and Microsoft.
We primarily target enterprises and believe the principal competitive factors on which we compete are total cost of ownership, functionality, performance, flexibility, scalability, security and reliability, extensibility and customizability, ease of adoption and customer support. We believe that we compete favorably with our competitors on each of these factors. However, some of our competitors and potential competitors have longer operating histories, larger customer bases, greater brand name recognition and greater financial, technical, marketing, intellectual property and other resources than we do.
Intellectual Property and Proprietary Rights
We primarily rely on a combination of copyright, trade secret, trademark and other rights in the United States and other jurisdictions, as well as confidentiality procedures and contractual provisions, to protect our intellectual property and proprietary rights. We have registered some of our trademarks, including RALLY and our Rally Software logo, in the United States and certain other jurisdictions. In addition, as of January 31, 2014, we owned one issued U.S. patent and one pending application for a U.S. patent.
14
Table of Contents
Though we rely in part on our registered intellectual property, we believe that the most important factor in protecting our technology, and the competitive advantage we believe it provides, is the skill and know-how embodied in the functionality and frequent enhancements we make to our solutions. Accordingly, in order to help prevent misuse and misappropriation of our technology, we include confidentiality and other protective provisions in our subscription agreements with customers and in our other agreements with employees, contractors, customers, and other third parties, which limit access to, use of and disclosure of our proprietary information and technology.
Employees
As of January 31, 2014, we had 458 employees, including 182 in sales and marketing and 130 in research and development. None of our employees are covered by a collective bargaining agreement. We have never experienced a strike or similar work stoppage, and we consider our relations with our employees to be good.
Seasonality
Our customers tend to follow budgeting cycles, buying solutions at the beginning and end of a calendar year. We tend to experience some seasonality associated with bookings, perpetual license revenue and cash flow from operations in the first and fourth quarters of each fiscal year. Our cash flow from operations has historically been higher in the first quarter of each fiscal year than in other quarters. We generally do not experience seasonality associated with subscription and support revenue due to the fact we recognize subscription and support revenue ratably over the term of the contract or support period.
Segments
We view our operations and manage our business as one operating segment. See our consolidated financial statements for a discussion of revenues, operating loss, net loss and total assets.
Geographic Revenue
See Note 11 of our consolidated financial statements.
Corporate Information
We were incorporated under the laws of the State of Delaware in July 2001 under the name F4 Technologies, Inc. and changed our name to Rally Software Development Corp. in April 2004. Our principal executive offices are located at 3333 Walnut Street, Boulder, Colorado. Our telephone number is (303) 565-2800. Our internet website address is www.rallydev.com. Our website and information included in or linked to our website are not part of this Annual Report on Form 10-K.
15
Table of Contents
Item 1A. RISK FACTORS
We have identified the following risks and uncertainties that may have a material adverse effect on our business, financial condition, results of operations and future growth prospects. Our business could be harmed by any of these risks. The risks and uncertainties described below are not the only ones we face. The trading price of our common stock could decline due to any of these risks, and you may lose all or part of your investment. In assessing these risks, you should also refer to the other information contained in this Annual Report on Form 10-K, including our consolidated financial statements and related notes.
Risks Related to Our Business and Our Industry
We have a history of losses, expect to incur future losses as we grow our company and may be unable to achieve or sustain profitability.
We have been in existence since 2001 and have experienced net losses in each year since our inception. We have experienced net losses of $20.1 million, $10.8 million and $11.6 million for fiscal 2014, 2013 and 2012, respectively. As of January 31, 2014 and 2013, we had an accumulated deficit of $95.7 million and $75.5 million, respectively. We are at an early stage in the development of our business and much of our growth has occurred in recent periods. Our historical rates of revenue growth may not be sustainable. We expect to make significant expenditures to support and grow our business, including expanding our sales force and research and development team, increasing our international presence and investing in our data center infrastructure. In addition, as a public company we incur significant legal, accounting and other expenses that we did not incur as a private company. Furthermore, we may encounter unforeseen expenses, complications and other difficulties. We expect to incur losses for the foreseeable future and may not be able to achieve or sustain profitability. Our limited operating history may make it difficult for our investors to evaluate our current business and our future prospects.
Our success depends on the continued adoption of Agile software development.
We do not know whether Agile adoption will continue to grow and displace traditional methods of software development. In particular, many organizations have invested substantial personnel and financial resources to integrate legacy software development techniques, such as waterfall techniques, into their businesses over time, and may be reluctant or unwilling to migrate to Agile practices because of the organizational changes often required to successfully implement this methodology. Further, some organizations may not realize the expected benefits from adoption of Agile practices and, as a result, may discontinue adoption of those practices. Agile adoption may also be limited if other software development techniques emerge. If Agile software development techniques are not adopted as broadly and quickly as we expect, our growth may slow or stall and our operating results would be harmed.
Demand for Agile management solutions may not grow as we anticipate.
Our solutions have not yet gained broad market acceptance. Even if adoption of Agile software development techniques continues to grow, the market for solutions that enable companies to manage software development processes may not increase at the pace we expect or at all. Organizations may choose to manage Agile software development manually or utilize other offerings that render our solutions uncompetitive or obsolete.
Our growth is largely dependent on our ability to retain and secure additional subscriptions from existing customers, and nonrenewals and downgrades could harm our future operating results.
We primarily sell our solutions through one-year subscriptions. We typically negotiate the total number of seats a customer is entitled to provision as part of their subscription, but these seats may not be fully utilized over the term of the agreement. Upon expiration, customers can renew their
16
Table of Contents
existing subscriptions, upgrade their subscriptions, downgrade their subscriptions or not renew. Our ability to grow revenue and achieve profitability depends in part on customer renewals and upgrades exceeding downgrades and nonrenewals. Our land-and-expand go-to-market strategy requires that a significant portion of our customers who initially purchase our solutions will subsequently upgrade their subscriptions. However, we may not be able to increase our penetration within our existing customers as anticipated and we may not otherwise retain subscriptions from existing customers. Customers may choose to not renew or upgrade their subscriptions, or may downgrade, because of several factors, including dissatisfaction with our prices or features relative to competitive offerings, reductions in our customers' spending levels, unused seats previously purchased, limited adoption by a customer of our solutions or Agile practices, departure of Agile users from the customer's organization or other causes. If our customers do not upgrade or renew their subscriptions, or they downgrade their subscriptions, our revenue may grow more slowly than expected or may decline, and our profitability and gross profit may be harmed.
If we are unable to continue to attract new customers, our growth could be slower than we expect.
We believe that our future growth depends in part upon increasing our customer base. Our ability to achieve significant growth in revenue in the future will depend, in part, upon continually attracting new customers and obtaining subscription renewals to our solutions from those customers. If we fail to attract new customers our revenue may grow more slowly than expected and our business may be harmed.
We recognize revenue from customer subscriptions over the term of a subscription agreement; therefore, a significant downturn in our business may not be immediately reflected in our operating results.
We recognize revenue from subscription agreements ratably over the terms of these agreements, which are typically one year. As a result, a significant portion of the revenue we report in each quarter is generated from customer agreements entered into during previous periods, which is reflected as deferred revenue on our balance sheet. Consequently, a decline in new or renewed subscriptions, or a downgrade of renewed subscriptions to fewer seats or less-expensive editions, in any one quarter may not be fully reflected in our revenue in that quarter, and may negatively affect our revenue in future quarters. If contracts having significant value expire and are not renewed or replaced at the beginning of a quarter or are downgraded, our revenue may decline significantly in that quarter and subsequent quarters.
Because we generally recognize revenue from our customers over the terms of their agreements but incur most costs associated with generating such agreements upfront, rapid growth in our customer base may reduce our profitability in the short term.
Expenses, such as sales commissions, are generally incurred upfront; however most of our revenue is recognized over the life of the applicable agreements. Therefore, increased sales will result in our recognition of proportionately more costs than revenue during the early periods covered by such agreements, even in cases where the agreements are expected to be profitable for us over their full terms. As a result, our short-term operating results may suffer.
Our gross profit attributable to professional services may fluctuate between quarters.
We generally recognize revenue from professional services on a time-and-materials basis as services are delivered. Costs associated with maintaining a professional services department are relatively fixed while professional services revenue is dependent on the amount of work actually billed to customers in a period, the combination of which may result in variability in our gross profit. Our gross profit can also be impacted depending on the type of services provided. In addition, the timing of the recognition of professional services revenue is dependent on several factors outside our control. If a customer
17
Table of Contents
deploys our solutions and utilizes our services more slowly than we expect, we may not be able to recognize the related revenue as quickly as we anticipated, but may have already incurred substantial costs related to such services, creating further variability in our gross profit.
We may not be able to compete successfully against current and future competitors.
We face intense competition in the market for our solutions and we expect competition to further intensify in the future. We primarily face competition from potential customers electing to use in-house offerings, privately-held Agile management vendors and software development tool providers, and providers of open source offerings. We also compete with large, diversified software and technology vendors and, as the market further adopts Agile practices, we expect increased competition from these vendors. Our competitors vary in size and in the breadth and scope of the products and services offered. Our primary competitors include private companies such as Atlassian, CollabNet and VersionOne and public companies such as Hewlett-Packard, IBM and Microsoft, some of which can bundle competing products and services with other software offerings, or offer them at a lower price as part of a larger sale. Further, other companies not currently offering Agile management tools may enter our market. Many of our current and potential competitors have substantially greater resources and brand recognition, established marketing relationships, access to larger customer bases, pre-existing customer relationships and major distribution agreements with consultants, system integrators and resellers. We also face competition from other companies that provide Agile consulting services and enterprises that develop in-house Agile training resources. To the extent competition intensifies; demand for our professional services may decline.
In addition, if one or more of our competitors were to merge or partner with another of our competitors, the change in the competitive landscape could adversely affect our ability to compete effectively. We may also lose customers that merge with or are acquired by companies using a competitor's offering, an internally-developed tool or a different software development methodology. If we cannot compete successfully against our current and future competitors, our business may be harmed.
Our growth and long-term success depends in part on our ability to expand our international sales.
A core component of our growth strategy is international expansion. For fiscal 2014, 2013 and 2012, approximately 14%, 13% and 14%, respectively, of our revenue was derived from international customers. We currently maintain international offices and have sales, marketing, support or research and development personnel in the United Kingdom, Australia, Finland, the Netherlands and Singapore. We also have sales personnel in Canada and Germany. We intend to further build out our international operations. Our international expansion efforts may not be successful. In addition, conducting international operations in new markets subjects us to new risks that we have not generally faced in the United States. These risks include:
- •
- uncertain political and economic climates;
- •
- lack of familiarity and burdens of complying with foreign laws, accounting and legal standards, regulatory requirements, tariffs, and other barriers;
- •
- unexpected changes in regulatory requirements, taxes, trade laws, tariffs, export quotas, custom duties or other trade restrictions;
- •
- lack of experience in connection with the localization of our solutions, including translation into foreign languages and adaptation for local practices and regulatory requirements;
- •
- difficulties in managing systems integrators and technology collaborators;
- •
- difficulties in adapting to differing technology standards;
18
Table of Contents
- •
- longer accounts receivable payment cycles and difficulties in collecting accounts receivable;
- •
- difficulties in managing and staffing international operations and differing legal and cultural expectations for employee relationships;
- •
- fluctuations in exchange rates that may increase the volatility of our foreign-based expenses;
- •
- potentially adverse tax consequences, including the complexities of foreign value-added tax, goods and services tax and other transactional taxes, and restrictions on the repatriation of earnings;
- •
- reduced or varied protection for intellectual property rights in some countries; and
- •
- difficulties in managing and adapting to differing cultures and customs.
Further, our international expansion efforts may be hindered by lower levels of Agile or cloud adoption and increased price sensitivity for our solutions or other cloud-based offerings in international markets. As a result of these and other factors, international expansion may be more difficult, take longer and not generate the results we anticipate, which could negatively impact our growth and business.
Prices for our solutions may face downward pressure, harming our operating results.
There are many factors that may lead to downward pressure on our prices, including competitors introducing lower-cost offerings, additional competitors entering the market, the use by potential or existing customers of alternative open source or other no or low cost offerings and larger competitors bundling competing offerings with additional products and services. In addition, we offer volume price discounts based on the number of seats purchased. As a result of these factors, we may be forced to reduce the prices we charge for our solutions, unable to renew existing customer agreements or enter into new customer agreements at the same prices and upon the same terms as we have historically been able to. If we experience downward pressure on pricing, our revenue, gross profit and other operating results could be harmed.
Sales cycles to our customers can be lengthy and variable, which may cause changes in our operating results.
Our sales cycle can vary substantially from customer to customer. A number of factors influence the length and variability of our sales cycles, including, for example:
- •
- the need to educate potential customers about the uses and benefits of Agile methods and our solutions;
- •
- the discretionary nature of potential customers' purchasing and budget cycles and decisions;
- •
- the competitive nature of potential customers' evaluation and purchasing processes;
- •
- the functionality demands of potential customers;
- •
- the announcement or planned introduction of new products by us or our competitors; and
- •
- the purchasing approval processes of potential customers.
Our sales cycles can make it difficult to predict the quarter in which revenue from a new customer may first be recognized. We may incur significant sales and marketing expenses and invest significant time and effort in anticipation of a sale that may never occur or only occur in a smaller amount or at a later date than anticipated. Delays inherent to our sales cycles could cause significant variability in our revenue and operating results for any particular period.
19
Table of Contents
The seasonality of our business can create significant variance in our quarterly bookings, perpetual license revenue and cash flow from operations.
Our customers tend to follow budgeting cycles, buying solutions at the beginning and end of a calendar year. We tend to experience some seasonality associated with bookings, perpetual license revenue and cash flow from operations in the first and fourth quarters of each fiscal year. As a result of these seasonal variations, our bookings, perpetual license revenue and cash flow from operations can fluctuate significantly between quarters. Our cash flow from operations has historically been higher in the first quarter of each fiscal year than in other quarters. If our quarterly operating results or outlook fall below the expectations of research analysts or investors, the price of our common stock could decline substantially.
If we fail to manage our growth effectively, we may be unable to execute our business plan and maintain high levels of service.
We increased our number of full-time employees from 285 as of January 31, 2012 to 360 as of January 31, 2013 and to 458 as of January 31, 2014. Our revenue grew from $41.3 million in fiscal 2012 to $56.8 million in fiscal 2013 and to $74.3 million in fiscal 2014. Our growth has placed, and is expected to continue to place, a significant strain on our managerial, administrative, operational, financial and other resources. We intend to add and expend additional resources in an effort to further expand our overall business, customer base, headcount and operations both domestically and internationally, but can give no assurance that our business or revenue will continue to grow at historical rates or at all. Creating a global organization and managing a geographically-dispersed workforce will require substantial management effort, the allocation of valuable management resources and significant additional investment in our infrastructure. If we are unable to successfully manage our anticipated growth, our financial results may suffer.
Failure to maintain and expand our direct sales team may negatively impact our revenue growth.
We primarily sell our solutions through our direct sales force. Growing sales to both new and existing customers is in part dependent on our ability to expand our sales force. Identifying, recruiting and training additional sales personnel require significant time, expenses and attention. If we are unable to hire, develop and retain sales personnel or if our new direct sales personnel are unable to achieve expected sales productivity levels in a reasonable period of time or at all, we may not be able to increase our revenue and grow our business.
If we are unable to increase market awareness of our company and our solutions, our revenue may not continue to grow, or may decline.
Market awareness of our capabilities and solutions is essential to our ability to generate new leads for expanding our business and our continued growth. If we fail to sufficiently invest in our marketing programs or they are unsuccessful in creating market awareness of our company and solutions, our business may be harmed.
Adverse economic conditions or reduced IT or enterprise software spending may adversely impact our business.
Our business depends on the overall demand for IT and enterprise software spend and on the economic health of our current and prospective customers. In general, worldwide economic conditions remain unstable, and these conditions make it difficult for us, and our existing customers and prospective customers, to forecast and plan future business activities accurately, and could cause our customers or prospective customers to reevaluate their decision to purchase our solutions. Weak global economic conditions, or a reduction in IT or enterprise software spending even if economic conditions
20
Table of Contents
improve, could harm our business in a number of ways, including longer sales cycles and lower prices for our solutions.
Security breaches may harm our business.
Any security breaches, cyber-attacks, unauthorized access, unauthorized usage, virus or similar breach or disruption could result in loss of confidential information, damage to our reputation, early termination of our contracts, litigation, regulatory investigations or other liabilities. If our security measures or those of our third-party data centers are breached as a result of third-party action, employee error, malfeasance or otherwise and, as a result, someone obtains unauthorized access to customer data, our reputation will be damaged, our business may suffer and we could incur significant liability.
Our business is substantially dependent upon the continued adoption of cloud-based software solutions.
We derive, and expect to continue to derive, substantially all of our revenue from the sale of subscriptions for our cloud-based platform. We do not know whether the trend of adoption of enterprise cloud-based software solutions we have experienced in the past will continue in the future. Many organizations have invested substantial personnel and financial resources to integrate on-premise software tools into their businesses, and some have been reluctant or unwilling to migrate to cloud-based software solutions. Furthermore, some organizations, particularly enterprises upon which we are dependent, have been reluctant or unwilling to use cloud-based solutions because they have concerns regarding the risks associated with the security of their data and the reliability of the technology delivery model associated with these solutions. In addition, if we or other cloud-based providers experience security incidents, loss of customer data, disruptions in delivery or other problems, the market for cloud-based software solutions as a whole, including for our solutions, may be negatively impacted. If the adoption of cloud-based software solutions does not continue at the rate we anticipate, the market for these solutions may stop developing or may develop more slowly than we expect, either of which would harm our operating results.
If we fail to adequately manage our data-center infrastructure capacity, our existing customers may experience service outages and our new customers may experience delays in the deployment of our platform.
We have experienced significant growth in the number of users and amount of data that our hosting infrastructure supports. We seek to maintain excess capacity to facilitate the rapid provision of new customer deployments and the expansion of existing customer deployments. However, the provisioning of new data-center infrastructure requires lead time. If we do not accurately predict our infrastructure capacity requirements with sufficient lead time, our customers could experience service impairment that may subject us to financial penalties and liabilities and cause us to lose customers. If our data-center infrastructure capacity fails to keep pace with increased subscriptions, customers may experience delays or reductions in the quality of our service as we seek to obtain additional capacity, which could harm our reputation and harm our business.
Any disruption of service at the two data centers that house our equipment and deliver our solutions could harm our business.
Our users expect to be able to access our solutions 24 hours a day, seven days a week, without interruption. We have computing and communications hardware operations located in co-location data centers owned and operated by a third party in Denver, Colorado and in the Seattle, Washington area. We do not control the operation of these data centers and we are therefore vulnerable to any security breaches, power outages or other issues the data centers experience. We have experienced and expect that we will in the future experience interruptions, delays and outages in service and availability from time to time. For example, we experienced an unscheduled partial data center outage for greater than
21
Table of Contents
30 minutes that affected all of our customers three times in fiscal 2013 and once in fiscal 2014 at our Denver, Colorado data center.
The owner of our data centers has no obligation to renew its agreements with us on commercially reasonable terms, or at all. If we are unable to renew these agreements on commercially reasonable terms, we may be required to move to new data centers, and we may incur significant costs and possible service interruption in connection with doing so.
Our data centers are vulnerable to damage or interruption from human error, malicious acts, cyber-attacks, earthquakes, hurricanes, tornados, floods, fires, war, terrorist attacks, power losses, hardware failures, systems failures, telecommunications failures and similar events. One of our data centers is located in an area known for seismic activity, increasing our susceptibility to the risk that an earthquake could significantly harm the operations of this facility. The occurrence of a natural disaster or an act of terrorism, vandalism or other misconduct, a decision to close the data centers without adequate notice or other unanticipated problems could result in lengthy interruptions in availability of our solutions.
Any changes in third-party service levels at our data centers or any errors, defects, disruptions or other performance problems with our solutions could harm our reputation and may damage our customers' businesses. Interruptions in availability of our solutions might reduce our revenue, cause us to issue credits to customers, subject us to potential liability, and cause customers to terminate their subscriptions or decide not to renew their subscriptions with us.
Our success depends on our ability to adapt to technological change and continue to innovate.
The market for Agile management solutions is characterized by rapid technological change, frequent new product and service introductions and evolving industry standards. Our ability to attract new customers and increase revenue from existing customers will depend in large part on our ability to introduce new solutions and enhance and improve existing solutions. To achieve market acceptance for our solutions, we must effectively anticipate and offer solutions that meet changing customer demands in a timely manner. Customers may require features and capabilities that our current solutions do not have. We may experience difficulties that could delay or prevent our development, introduction or implementation of new solutions and enhancements.
If we are unable to successfully develop or acquire new Agile management capabilities and functionality, enhance our existing solutions to anticipate and meet customer preferences, sell our solutions into new markets or adapt to changing industry standards in software development methodologies, our revenue and results of operations would be adversely affected.
If we fail to integrate our solutions with software applications and competitive or adjacent offerings that are developed by others, our solutions may become less marketable, less competitive or obsolete, and our operating results would be harmed.
Our solutions integrate with a variety of software applications, and also with competing and adjacent third-party offerings, and we need to continuously modify and enhance our platform to adapt to changes in cloud-enabled hardware, software, networking, browser and database technologies. Any failure of our solutions to interoperate effectively with software applications and other Agile management offerings could reduce the demand for our solutions or result in customer dissatisfaction and harm to our business. If we are unable to respond to changes in the applications and tools with which our solutions interoperate in a cost-effective manner, our solutions may become less marketable, less competitive or obsolete. Competitors may also impede our attempts to create interoperability between our solutions and competitive offerings, which may decrease demand for our solutions.
22
Table of Contents
We could incur substantial costs as a result of any claim of infringement of another party's intellectual property rights.
In recent years, there has been significant litigation involving patents and other intellectual property rights in the software industry. Companies providing software are increasingly bringing and becoming subject to suits alleging infringement of proprietary rights, particularly patent rights, and to the extent we gain greater market visibility, we face a higher risk of being the subject of intellectual property infringement claims. We do not have a significant patent portfolio, which could prevent us from deterring patent infringement claims through our own patent portfolio, and our competitors and others may now and in the future have significantly larger and more mature patent portfolios than we have. The risk of patent litigation has been amplified by the increase in the number of a type of patent holder, which we refer to as a non-practicing entity, whose sole business is to assert such claims and against whom our own intellectual property portfolio may provide little deterrent value. We could incur substantial costs in prosecuting or defending any intellectual property litigation. If we sue to enforce our rights or are sued by a third party that claims that our solutions infringe its rights, the litigation could be expensive and could divert our management resources.
In addition, in most instances, we have agreed to indemnify our customers against claims that our solutions infringe the intellectual property rights of third parties. From time to time we have in the past received, and may in the future receive, requests for indemnification from our customers based on such claims. Our business could be adversely affected by any significant disputes between us and our customers as to the applicability or scope of our indemnification obligations to them. Any intellectual property litigation to which we might become a party, or for which we are required to provide indemnification, may require us to do one or more of the following:
- •
- cease selling or using solutions that incorporate the intellectual property that we allegedly infringe;
- •
- make substantial payments for legal fees, settlement payments or other costs or damages;
- •
- obtain a license, which may not be available on reasonable terms or at all, to sell or use the relevant technology; or
- •
- redesign the allegedly infringing solutions to avoid infringement, which could be costly, time-consuming or impossible.
If we are required to make substantial payments or undertake any of the other actions noted above as a result of any intellectual property infringement claims against us or any obligation to indemnify our customers for such claims, such payments or actions could harm our business.
We could incur substantial costs in protecting our intellectual property from infringement, and any failure to protect our intellectual property could impair our business.
We seek to protect the source code for our proprietary software and other proprietary technology and information under a combination of copyright, trade secrets and patent law, and we seek to protect our brand through trademark law. Our policy is to enter into confidentiality agreements, or agreements with confidentiality provisions, with our employees, consultants, vendors and customers and to control access to our software, documentation and other proprietary information. Despite these precautions, it may be possible for unauthorized parties to copy our software or other proprietary technology or information, or to develop similar software independently.
Despite our efforts to protect our proprietary rights, unauthorized parties may attempt to copy aspects of our solutions or to obtain and use information that we regard as proprietary. Policing unauthorized use of our solutions, especially the on-premise, installed version of our solutions, is difficult, and we are unable to determine the extent to which piracy of our software exists or will occur
23
Table of Contents
in the future. Litigation may be necessary in the future to enforce our intellectual property rights, protect our trade secrets, determine the validity and scope of the proprietary rights of others or defend against claims of infringement or invalidity. Such litigation could be costly, time-consuming and distracting to management, result in a diversion of resources, the narrowing or invalidation of portions of our intellectual property and have a material adverse effect on our business, operating results and financial condition. Furthermore, our efforts to enforce our intellectual property rights may be met with defenses, counterclaims and countersuits attacking the validity and enforceability of our intellectual property rights or alleging that we infringe the counterclaimant's own intellectual property. These steps may be inadequate to protect our intellectual property. Third parties may challenge the validity or ownership of our intellectual property, and these challenges could cause us to lose our rights, in whole or in part, to such intellectual property or narrow its scope such that it no longer provides meaningful protection. We will not be able to protect our intellectual property if we are unable to enforce our rights or if we do not detect unauthorized use of our intellectual property. Despite our precautions, it may be possible for unauthorized third parties to copy our products and use information that we regard as proprietary to create products and services that compete with ours. Some license provisions protecting against unauthorized use, copying, transfer and disclosure of our solutions may be unenforceable under the laws of certain jurisdictions and foreign countries. Further, the laws of some countries do not protect proprietary rights to the same extent as the laws of the United States. To the extent we expand our international activities, our exposure to unauthorized copying, transfer and use of our solutions and proprietary technology or information may increase.
There can be no assurance that our means of protecting our proprietary rights will be adequate or that our competitors will not independently develop similar technology. If we fail to meaningfully protect our intellectual property, our business, brand, operating results and financial condition could be materially harmed.
We rely on third-party software that is required for the development and deployment of our solutions, which may be difficult to obtain or which could cause errors or failures of our solutions.
We rely on software licensed from or hosted by third parties to offer our solutions. In addition, we may need to obtain licenses from third parties to use intellectual property associated with the development of our solutions, which might not be available to us on acceptable terms, or at all. Any loss of the right to use any software required for the development, maintenance and delivery of our solutions could result in delays in the provision of our solutions until equivalent technology is either developed by us, or, if available, is identified, obtained and integrated, which could harm our business. Any errors or defects in third-party software could result in errors or a failure of our solutions which could harm our business.
If our solutions contain serious errors or defects we may lose revenue and market acceptance and may incur costs to defend or settle product liability claims.
Complex software applications such as ours often contain errors or defects, particularly when first introduced or when new versions or enhancements are released. Our current and future solutions may contain serious defects, which could result in lost revenue or a delay in market acceptance.
Since our customers use our solutions for critical business purposes, defects or other performance problems could negatively impact our customers. They could seek significant compensation from us for the losses they suffer. Although our customer agreements typically contain provisions designed to limit our exposure to such claims, existing or future laws or unfavorable judicial decisions could negate these limitations. Even if not successful, a product liability claim brought against us would likely be a distraction to management, time-consuming and costly to resolve, and could seriously damage our reputation in the marketplace, making it harder for us to sell our solutions and professional services.
24
Table of Contents
Our quarterly operating results may fluctuate in the future. As a result, we may fail to meet or exceed the expectations of research analysts or investors, which could cause our stock price to decline and you may lose part or all of your investment.
Our quarterly operating results may fluctuate as a result of a variety of factors, many of which are outside of our control. If our quarterly operating results or outlook fall below the expectations of research analysts or investors, the price of our common stock could decline substantially. Fluctuations in our quarterly operating results or outlook may be due to a number of factors, including, but not limited to, those listed below:
- •
- the extent to which our existing customers purchase additional subscriptions to our solutions or perpetual licenses to our solutions and the timing and terms of those purchases;
- •
- the extent to which our existing customers renew their subscriptions for our solutions or maintenance for our solutions and the timing and terms of those renewals;
- •
- the extent to which new customers are attracted to our solutions to satisfy their Agile management needs;
- •
- the rate of adoption and market acceptance of Agile management solutions;
- •
- the mix of our revenue, particularly between perpetual licenses and subscriptions for which the timing of revenue recognition is substantially different;
- •
- the extent to which we enter into multi-year contracts, in which the fees are typically paid upfront;
- •
- the addition or loss of large customers, including through acquisitions or consolidations;
- •
- the number and size of new customers and the number and size of renewals in a particular period;
- •
- changes in our pricing policies or those of our competitors;
- •
- changes in the gross profit we realize on our solutions and professional services due to our differing revenue recognition policies applicable to perpetual licenses and subscription and support revenue and other variables;
- •
- the amount and timing of operating expenses, including those related to the maintenance and expansion of our business, operations and infrastructure;
- •
- the timing and success of new solutions introduced by us or new offerings offered by our competitors;
- •
- the length of our sales cycles;
- •
- other changes in the competitive dynamics of our industry, including consolidation among competitors, customers or strategic collaborators;
- •
- the timing of expenses related to the development of new products and technologies, including enhancements to our solutions;
- •
- the timing of commissions earned by our sales personnel;
- •
- our ability to manage our existing business and future growth, including increases in the number of customers on our platform;
- •
- the seasonality of our business;
- •
- the timing and expenses related to any international expansion efforts we may undertake and the success of such efforts;
25
Table of Contents
- •
- various factors related to disruptions in our cloud-based infrastructure, defects in our solutions, privacy and data security and exchange rate fluctuations, each of which is described elsewhere in these risk factors; and
- •
- general economic, industry and market conditions.
We believe that our quarterly revenue and operating results may vary significantly in the future and that period-to-period comparisons of our operating results may not be meaningful. You should not rely on the results of one quarter as an indication of future performance.
Perpetual license revenue is unpredictable and a material increase or decrease in perpetual license revenue from period-to-period can produce substantial variation in the total revenue we recognize in a given period.
We generally recognize perpetual license revenue upon delivery of our solutions to the customer. The timing of sales of perpetual licenses is difficult to predict and, as a result, the timing of recognition of associated revenue is unpredictable. A material increase or decrease in the sale of perpetual licenses from period to period could produce substantial variation in the revenue we recognize. Accordingly, comparing our perpetual license revenue on a period-to-period basis may not be a meaningful indicator of a trend or future results.
Fluctuations in the exchange rate of foreign currencies could result in currency transactions losses.
We currently do not invoice customers in foreign currency but may decide to do so in the future. We incur a portion of our operating expenses in Euros, British pounds sterling, Australian dollars, Canadian dollars and Singaporean dollars, and in the future as we expand into other foreign countries, we expect to incur operating expenses in other foreign currencies. Any fluctuation in the exchange rate of these foreign currencies may negatively impact our business, financial condition and operating results. We have not previously engaged in foreign currency hedging. If we decide to hedge our foreign currency exposure, we may not be able to hedge effectively due to lack of experience, unreasonable costs or illiquid markets.
Changes in laws or regulations related to the Internet may diminish the demand for our solutions and could have a negative impact on our business.
We deliver our cloud-based solutions through the Internet. Federal, state or foreign government bodies or agencies have in the past adopted, and may in the future adopt, laws or regulations affecting data privacy and the use of the Internet. In addition, government agencies or private organizations may begin to impose taxes, fees or other charges for accessing the Internet or on commerce conducted via the Internet. These laws or charges could limit the viability of Internet-based solutions such as ours and reduce the demand for our solutions.
We are subject to governmental export and import controls that could impair our ability to compete in international markets due to licensing requirements and subject us to liability if we are not in compliance with applicable laws.
Our solutions are subject to export control and import laws and regulations, including the U.S. Export Administration Regulations, U.S. Customs regulations and various economic and trade sanctions regulations administered by the U.S. Treasury Department's Office of Foreign Assets Controls. Exports of our solutions must be made in compliance with these laws and regulations. If we fail to comply with these laws and regulations, we and certain of our employees could be subject to substantial civil or criminal penalties, including: the possible loss of export or import privileges; fines, which may be imposed on us and responsible employees or managers; and, in extreme cases, the incarceration of responsible employees or managers. Obtaining the necessary authorizations, including any required license, for a particular sale may be time-consuming, is not guaranteed and may result in the delay or
26
Table of Contents
loss of sales opportunities. In addition, changes in our solutions or changes in applicable export or import regulations may create delays in the introduction and sale of our solutions in international markets, prevent our customers with international operations from deploying our solutions or, in some cases, prevent the export or import of our solutions to certain countries, governments or persons altogether. Any change in export or import regulations, shift in the enforcement or scope of existing regulations, or change in the countries, governments, persons or technologies targeted by such regulations, could also result in decreased use of our solutions, or in our decreased ability to export or sell our solutions to existing or potential customers with international operations. Any decreased use of our solutions or limitation on our ability to export or sell our solutions would likely adversely affect our business.
Furthermore, we incorporate encryption technology into certain of our solutions. Various countries regulate the import of certain encryption technology, including through import permitting and licensing requirements, and have enacted laws that could limit our ability to distribute our solutions or could limit our customers' ability to implement our solutions in those countries. Encrypted solutions and the underlying technology may also be subject to export control restrictions. Governmental regulation of encryption technology and regulation of imports or exports of encryption products, or our failure to obtain required import or export approval for our solutions, when applicable, could harm our international sales and adversely affect our revenue. Compliance with applicable regulatory requirements regarding the export of our solutions, including with respect to new releases of our solutions, may create delays in the introduction of our solutions in international markets, prevent our customers with international operations from deploying our solutions throughout their globally-distributed systems or, in some cases, prevent the export of our solutions to some countries altogether.
Moreover, U.S. export control laws and economic sanctions programs prohibit the shipment of certain products and services to countries, governments and persons that are subject to U.S. economic embargoes and trade sanctions. Even though we take precautions to prevent our solutions from being shipped or provided to U.S. sanctions targets, our solutions and services could be shipped to those targets or provided by third parties despite such precautions. Any such shipment could have negative consequences, including government investigations, penalties and reputational harm.
Our use of open source software could negatively affect our ability to sell our solutions and subject us to possible litigation.
A portion of our technologies incorporate open source software, and we expect to continue to incorporate open source software in the future. Few of the licenses applicable to open source software have been interpreted by courts, and their application to the open source software integrated into our proprietary software may be uncertain. Moreover, we cannot provide assurance that we have not incorporated additional open source software in our software in a manner that is inconsistent with the terms of the license or our current policies and procedures. If we fail to comply with these licenses, we may be subject to certain requirements, including requirements that we offer our solutions that incorporate the open source software for no cost, that we make available source code for modifications or derivative works we create based upon, incorporating or using the open source software and that we license such modifications or derivative works under the terms of applicable open source licenses. If an author or other third party that distributes such open source software were to allege that we had not complied with the conditions of one or more of these licenses, we could be required to incur significant legal expenses defending against such allegations and could be subject to significant damages, enjoined from the sale of our solutions that contained the open source software and required to comply with the foregoing conditions, which could disrupt the distribution and sale of some of our solutions. In addition, there have been claims challenging the ownership of open source software against companies that incorporate open source software into their products. As a result, we could be subject to suits by parties claiming infringement due to the reliance by our solutions on certain open source software.
27
Table of Contents
Litigation could be costly for us to defend, have a negative effect on our operating results and financial condition or require us to devote additional research and development resources to change our solutions.
If we fail to maintain proper and effective internal controls, our ability to produce accurate and timely financial statements could be impaired, which could harm our operating results, our ability to operate our business and comply with SEC regulations and investors' views of us.
Ensuring that we have adequate internal financial and accounting controls and procedures in place so that we can produce accurate financial statements on a timely basis is a costly and time-consuming effort that needs to be re-evaluated frequently. Our internal control over financial reporting is a process designed to provide reasonable assurance regarding the reliability of financial reporting and the preparation of financial statements in accordance with generally accepted accounting principles. As a newly public company, we are continuing to develop and refine the process of documenting, reviewing and improving our internal controls and procedures for compliance with Section 404(a) of the Sarbanes-Oxley Act of 2002, or the Sarbanes-Oxley Act, which will require annual management assessment of the effectiveness of our internal control over financial reporting. We may need additional finance and accounting personnel with certain skill sets to assist us with our reporting requirements as a public company and to support our anticipated growth. Our independent registered public accounting firm will not be required to formally attest to the effectiveness of our internal control over financial reporting until the later of our second annual report or the first annual report required to be filed with the SEC following the date we are no longer an "emerging growth company" as defined in the JOBS Act. At such time, our independent registered public accounting firm may issue a report that is adverse in the event it is not satisfied with the level at which our controls are documented, designed or operating. Our remediation efforts may not enable us to avoid a material weakness in the future. We will remain an "emerging growth company" for up to five years following our initial public offering, although, we would cease to be an "emerging growth company" upon the earliest of (i) the first fiscal year following the fifth anniversary of our initial public offering, (ii) the first fiscal year after our annual gross revenue is $1 billion or more, (iii) the date on which we have, during the previous three-year period, issued more than $1 billion in non-convertible debt securities, or (iv) the date on which we are deemed to be a "large accelerated filer" as defined in the Securities Exchange Act of 1934, or the Exchange Act.
Implementing changes to our internal controls may distract our officers and employees, entail substantial costs to modify our existing processes and take significant time to complete. These changes may not, however, be effective in maintaining the adequacy of our internal controls, and any failure to maintain that adequacy, or consequent inability to produce accurate financial statements on a timely basis, could increase our operating costs and harm our business. In addition, investors' perceptions that our internal controls are inadequate or that we are unable to produce accurate financial statements on a timely basis may harm our stock price and make it more difficult for us to effectively market and sell our solutions to new and existing customers.
We are an "emerging growth company," and any decision on our part to comply with certain reduced disclosure requirements applicable to emerging growth companies could make our common stock less attractive to investors.
We are an "emerging growth company," as defined in the JOBS Act and, for as long as we continue to be an emerging growth company, we may choose to take advantage of exemptions from various reporting requirements applicable to other public companies including, but not limited to (i) not being required to have our internal control over financial reporting audited by our independent registered public accounting firm pursuant to Section 404(b) of the Sarbanes-Oxley Act; (ii) reduced disclosure obligations regarding executive compensation in our periodic reports and proxy statements;
28
Table of Contents
and (iii) exemptions from the requirements to hold a nonbinding advisory vote on executive compensation and to obtain stockholder approval of any golden parachute payments not previously approved. We cannot predict if investors will find our common stock less attractive if we choose to rely on these exemptions. We will incur additional expenses when we eventually are required to comply with the requirements applicable to a public company that is not an emerging growth company. If some investors find our common stock less attractive as a result of any choices to reduce future disclosure, there may be a less-active trading market for our common stock and our stock price may be more volatile.
Under Section 107(b) of the JOBS Act, emerging growth companies can delay adopting new or revised accounting standards until such time as those standards apply to private companies. We have irrevocably elected not to avail ourselves of this exemption from new or revised accounting standards and, therefore, we will be subject to the same new or revised accounting standards as other public companies that are not emerging growth companies.
We will continue to incur significant costs and devote substantial management time as a result of operating as a newly public company.
As a newly public company, we expect to continue to incur significant legal, accounting and other expenses that we did not incur as a private company. The Sarbanes-Oxley Act and other legislation and rules implemented by the SEC, and the New York Stock Exchange impose various requirements on public companies, including requiring changes in corporate governance practices. Our management and other personnel have and will continue to devote a substantial amount of time to these compliance requirements. These burdens may increase as new legislation is passed and implemented, including any new requirements that the Dodd-Frank Wall Street Reform and Consumer Protection Act of 2010 may impose on public companies. Moreover, despite recent reform made possible by the JOBS Act, compliance with these rules and regulations, along with compliance with accounting principles and regulatory interpretations of such principles, have increased and will continue to increase our legal, accounting and financial compliance costs and have made and will continue to make some activities more time-consuming and costly. These rules and regulations could also make it more difficult for us to attract and retain qualified persons to serve on our Board of Directors or committees, or as executive officers.
We may acquire companies which may divert our management's attention, result in additional dilution to our stockholders and consume resources that are necessary to sustain our business, and we may be unable to integrate acquired businesses and technologies successfully or achieve the expected benefits of such acquisitions.
We may evaluate and consider potential strategic transactions, including acquisitions of, or investments in, businesses, technologies, services, products and other assets in the future. Negotiating these transactions can be time-consuming, difficult and expensive, and our ability to close these transactions may often be subject to conditions or approvals that are beyond our control. Consequently, these transactions, even if undertaken and announced, may not close.
An acquisition may result in unforeseen operating difficulties and expenditures. In particular, we may encounter difficulties assimilating or integrating the businesses, technologies, products, personnel or operations of the acquired companies, particularly if the key personnel of the acquired company choose not to work for us, the company's software is not easily adapted to work with ours or we have difficulty retaining the customers of the acquired business due to changes in management or otherwise. Acquisitions may also disrupt our business, divert our resources and require significant management attention that would otherwise be available for development of our business. Moreover, the anticipated
29
Table of Contents
benefits of any acquisition, investment or business relationship may not be realized or we may be exposed to unknown risks or liabilities. For one or more of those transactions, we may:
- •
- issue additional equity securities that would dilute our stockholders;
- •
- use cash that we may otherwise need in the future to operate our business;
- •
- incur debt on terms unfavorable to us or that we are unable to repay;
- •
- incur large charges or substantial liabilities;
- •
- encounter difficulties retaining key employees of the acquired company or integrating diverse software codes or business cultures; and
- •
- become subject to adverse tax consequences, substantial depreciation or deferred compensation charges.
Any of these outcomes could harm our business and operating results.
The loss of key personnel or an inability to attract and retain highly skilled personnel may impair our ability to grow our business.
We are highly dependent upon the continued service and performance of our senior management team and other key personnel. These key employees may terminate employment with us at any time with no advance notice. The replacement of these employees likely would involve significant time and costs, and the loss of these employees may significantly delay or prevent the achievement of our business objectives.
We face intense competition for qualified individuals from numerous technology and software companies. If we fail to attract and retain suitably qualified individuals, including software engineers and sales personnel, our ability to implement our business plan and develop and maintain our solutions could be adversely affected. As a result, our ability to compete would decrease, our operating results would suffer and our revenue would decrease.
Unanticipated changes in our effective tax rate or challenges by tax authorities could harm our future results.
We are subject to income taxes in the United States and various foreign jurisdictions. Our effective tax rate could be adversely affected by changes in the mix of our pre-tax earnings and losses in countries with differing statutory tax rates, certain non-deductible expenses as a result of acquisitions, the valuation of deferred tax assets and liabilities, changes in federal, state or international tax laws and accounting principles, including increased tax rates, new tax laws or revised interpretations of existing tax laws and precedents. Increases in our effective tax rate would reduce our profitability or in some cases increase our losses.
In addition, we may be subject to income tax audits by many tax jurisdictions throughout the world, many of which have not established clear guidance on the tax treatment of cloud-based companies. Although we believe our income tax liabilities are reasonably estimated and accounted for in accordance with applicable laws and principles, an adverse resolution of one or more uncertain tax positions in any period could have a material impact on the results of operations for that period.
Taxing authorities could reallocate our taxable income among our subsidiaries, which could increase our consolidated tax liability.
We conduct integrated operations world-wide through subsidiaries in various tax jurisdictions pursuant to transfer pricing arrangements between our subsidiaries and between our subsidiaries and us. If two or more affiliated companies are located in different countries, the tax laws or regulations of each country generally require that transfer prices be the same as those between unrelated companies
30
Table of Contents
dealing at arms' length and that contemporaneous documentation is maintained to support the transfer prices. While we believe that we operate in compliance with applicable transfer pricing laws and intend to continue to do so, our transfer pricing procedures are not binding on applicable tax authorities. If tax authorities in any of these countries were to successfully challenge our transfer prices as not reflecting arms' length transactions, they could require us to adjust our transfer prices and thereby reallocate our income to reflect these revised transfer prices, which could result in a higher tax liability to us. Such reallocations may subject us to interest and penalties that would increase our consolidated tax liability and could adversely affect our financial condition, results of operations and cash flows.
If we fail to develop and maintain relationships with third parties, our business may be harmed.
Our business depends in part on the development and maintenance of technology integration, joint sales and reseller relationships. Maintaining relationships with third parties requires significant time and resources, as does integrating third-party content and technology. Further, third parties may not perform as expected under any relationships that we may enter into, and we may have disagreements or disputes with third parties that could negatively affect our brand and reputation. If we are unsuccessful in establishing or maintaining relationships with third parties, our ability to compete in the marketplace or to grow our revenue could be impaired and our operating results could suffer.
We use cloud-based services for critical business processes such as financial reporting and human resources, and our inability to access these systems or their inability to function as intended or as we expect them to function could harm our business.
We use cloud-based services for critical business processes, such as human-capital management and payroll processing, processing, approval and payment of employee expense reports, managing our reporting obligations related to stock-based compensation, and as our primary financial reporting and enterprise resource application system. If our vendors experience service impairments or outages, some of which may be related to third parties with which they partner, it may inhibit our ability to adhere to certain commitments we have made, both internally and externally, related to the delivery of financial information, including our reporting obligations as a public company, and, therefore, harm our business.
Risks Related to Ownership of Our Common Stock
The market price of our common stock is likely to be volatile and could subject us to litigation.
The trading price of our common stock has been, and is likely to continue to be, volatile and could be subject to wide fluctuations in response to various factors, some of which are beyond our control. Since shares of our common stock were sold in our initial public offering in April 2013 at a price of $14.00 per share, our stock price has ranged from $15.46 to $33.05 through January 31, 2014. In addition, the trading prices of the securities of technology companies in general have been highly volatile, and the volatility in market price and trading volume of securities is often unrelated or disproportionate to the financial performance of the companies issuing the securities. In addition to the factors discussed in this "Risk Factors" section and elsewhere in this Annual Report on Form 10-K, factors affecting the market price of our common stock include:
- •
- actual or anticipated changes in our earnings or fluctuations in our operating results or in the expectations of securities analysts;
- •
- price and volume fluctuations in the overall stock market from time to time;
- •
- significant volatility in the market price and trading volume of comparable companies;
- •
- changes in the market perception of Agile software development generally or in the effectiveness of our solutions in particular;
31
Table of Contents
- •
- announcements of technological innovations, new products, strategic alliances or significant agreements by us or by our competitors;
- •
- litigation involving us;
- •
- investors' general perception of us;
- •
- changes in general economic, industry and market conditions and trends; and
- •
- recruitment or departure of key personnel.
In addition, if the market for technology stocks or the stock market in general experiences uneven investor confidence, the market price of our common stock could decline for reasons unrelated to our business, operating results or financial condition. The market price of our common stock might also decline in reaction to events that affect other companies within, or outside, our industry even if these events do not directly affect us. Some companies that have experienced volatility in the trading price of their stock have been the subject of securities class action litigation. If we are the subject of such litigation, it could result in substantial costs and a diversion of our management's attention and resources from our business.
We may need financing in the future, and any additional financing may result in restrictions on our operations or substantial dilution to our stockholders.
We may need to raise funds in the future, for example, to develop new technologies, expand our business, respond to competitive pressures, acquire complementary businesses or respond to unanticipated situations. We may try to raise additional funds through public or private financings, strategic relationships or other arrangements. Our ability to obtain debt or equity funding will depend on a number of factors, including market conditions, our operating performance and investor interest. Additional funding may not be available to us on acceptable terms or at all. If adequate funds are not available, we may be required to reduce expenditures, including curtailing our growth strategies, reducing our product-development efforts or foregoing acquisitions. If we succeed in raising additional funds through the issuance of equity or convertible securities, it could result in substantial dilution to existing stockholders. If we raise additional funds through the issuance of debt securities or preferred stock, these new securities would have rights, preferences, and privileges senior to those of the holders of our common stock. The terms of these securities could impose restrictions on our operations.
If securities or industry analysts do not publish, or cease publishing, research or reports about us, our business or our market, if they publish negative evaluations of our stock, or if we fail to meet the expectations of analysts, the price of our stock and trading volume could decline.
The trading market for our common stock is influenced by the research and reports that industry or securities analysts publish about us, our business, our market or our competitors. If one or more of the analysts covering our business downgrade their evaluation of our stock, the price of our stock could decline. If one or more of these analysts cease to cover our stock or fail to regularly publish reports on us, we could lose visibility in the market for our stock, which in turn could cause our stock price to decline. Furthermore, if our operating results fail to meet analysts' expectations our stock price would likely decline.
Sales of a substantial number of shares of our common stock in the public market could cause our stock price to fall.
Sales of a substantial number of shares of our common stock in the public market or the perception that these sales might occur could depress the market price of our common stock and could impair our ability to raise capital through the sale of additional equity securities. We are unable to predict the effect that sales may have on the prevailing market price of our common stock.
32
Table of Contents
Certain holders of shares of our common stock are entitled to rights with respect to the registration of their shares under the Securities Act of 1933, as amended, or the Securities Act. Registration of these shares under the Securities Act would result in the shares becoming freely tradable without restriction under the Securities Act, except for shares held by our affiliates as defined in Rule 144 under the Securities Act. Any sales of securities by these stockholders could have a material adverse effect on the trading price of our common stock.
Sales of common stock by existing stockholders in the public market, the availability of these shares for sale, our issuance of securities, or the perception that any of these events might occur may materially and adversely affect could reduce the market price of our common stock. In addition, the sale of these securities could impair our ability to raise capital through the sale of additional stock.
Our directors, executive officers and their affiliates beneficially own a significant percentage of our stock and are able to exert substantial control over matters subject to stockholder approval.
As of January 31, 2014, our directors, executive officers, and their respective affiliates beneficially owned or controlled, directly or indirectly and including shares issuable upon the exercise of outstanding options and warrants exercisable within 60 days of January 31, 2014, in the aggregate approximately 14.1% of our outstanding common stock. As a result, these stockholders, if they act together, could have significant influence over the outcome of matters submitted to our stockholders for approval, including the election or removal of directors, any amendments to our certificate of incorporation or bylaws and any merger, consolidation or sale of all or substantially all of our assets, and over the management and affairs of our company. This concentration of ownership may also have the effect of delaying or preventing a change in control of our company or discouraging others from making tender offers for our shares, and might affect the market price of our common stock.
Because we do not expect to pay any dividends on our common stock for the foreseeable future, returns will be limited to changes in the value of our common stock.
We do not anticipate that we will pay any cash dividends to holders of our common stock in the foreseeable future. Instead, we plan to retain any earnings to maintain and expand our existing operations. In addition, any credit facility that we may obtain in the future may contain terms prohibiting or limiting the amount of dividends that may be declared or paid on our common stock. Accordingly, investors must rely on sales of their common stock after price appreciation, which may never occur, as the only way to realize any return on their investment.
Anti-takeover provisions in our amended and restated certificate of incorporation and our amended and restated bylaws, as well as provisions of Delaware law, might discourage, delay or prevent a change in control of our company or changes in our Board of Directors or management and, therefore, depress the trading price of our common stock.
Our amended and restated certificate of incorporation, amended and restated bylaws and Delaware law contain provisions that may depress the market price of our common stock by acting to discourage, delay or prevent a merger, acquisition or other change in control that stockholders may consider favorable, including transactions in which you might otherwise receive a premium for your shares of our common stock. These provisions may also prevent or frustrate attempts by our stockholders to replace or remove members of our Board of Directors or our management. Our corporate governance documents include provisions:
- •
- establishing a classified board of directors with staggered three-year terms so that not all members of our Board of Directors are elected at one time;
- •
- providing that directors may be removed by stockholders only for cause;
33
Table of Contents
- •
- limiting the ability of our stockholders to call and bring business before special meetings and to take action by written consent in lieu of a meeting;
- •
- requiring advance notice of stockholder proposals for business to be conducted at meetings of our stockholders and for nominations of candidates for election to our Board of Directors;
- •
- authorizing blank check preferred stock, which could be issued with voting, liquidation, dividend and other rights superior to our common stock; and
- •
- limiting the liability of, and providing indemnification to, our directors and officers.
As a Delaware corporation, we are also subject to provisions of Delaware law, including Section 203 of the Delaware General Corporation Law, which limits the ability of stockholders owning in excess of 15% of our outstanding voting stock from engaging in certain business combinations with us. Any provision of our amended and restated certificate of incorporation, amended and restated bylaws or Delaware law that has the effect of delaying or deterring a change in control could limit the opportunity for our stockholders to receive a premium for their shares of our common stock, and could also affect the price that some investors are willing to pay for our common stock.
The existence of the foregoing provisions and anti-takeover measures could limit the price that investors might be willing to pay in the future for shares of our common stock. They could also deter potential acquirers of our company, thereby reducing the likelihood that you could receive a premium for your common stock in an acquisition.
ITEM 1B. Unresolved Staff Comments
Not applicable
ITEM 2. Properties
Our principal offices are located in Boulder, Colorado. In June 2013, we entered into an amended and restated office lease that provides for the construction of a new 89,000 square foot office building adjacent to our existing approximately 65,000 square foot corporate headquarters. The occupancy date for the new building is anticipated to occur in June 2015. The lease term for both the new building and our existing corporate headquarters is currently expected to expire in May 2025. We occupy additional leased facilities of approximately 10,000 square feet in Raleigh, North Carolina and of approximately 5,200 square feet in the Seattle, Washington area. We also occupy additional leased facilities of less than 5,000 square feet each in Denver, Colorado; London, England; Melbourne, Australia; Helsinki, Finland; Amsterdam, the Netherlands and Singapore. On December 18, 2013, we entered into a lease for approximately 22,000 square feet of office space in Denver, Colorado with an anticipated occupancy to occur in July 2014. We believe that our facilities are adequate for our current needs and that suitable additional or substitute space will be available as needed to accommodate planned expansion of our operations. See Note 15 to the consolidated financial statements for more information about our lease commitments.
ITEM 3. Legal Proceedings
From time to time, we may become involved in legal proceedings arising in the ordinary course of our business. We are not presently a party to any legal proceedings that, if determined adversely to us, would individually or taken together have a material adverse effect on our business, operating results, financial condition or cash flows.
ITEM 4. Mine Safety Disclosure
Not applicable
34
Table of Contents
PART II
ITEM 5. Market for Registrant's Common Equity, Related Stockholder Matters and Issuer Purchases of Equity Securities
Market Information for Common Stock
Our common stock has traded on The New York Stock Exchange under the symbol "RALY" since April 12, 2013. Prior to that date, there was no public trading market for our common stock. Our initial public offering was priced at $14.00 per share on April 11, 2013. The following table sets forth for the periods indicated the high and low sales prices per share of our common stock as reported on The New York Stock Exchange:
| | | | | | | |
| | High | | Low | |
|---|
Fiscal Year Ended January 31, 2014 | | | | | | | |
First Quarter (from April 12, 2013) | | $ | 18.50 | | $ | 16.80 | |
Second Quarter | | $ | 28.35 | | $ | 17.25 | |
Third Quarter | | $ | 33.05 | | $ | 24.66 | |
Fourth Quarter | | $ | 27.15 | | $ | 15.46 | |
Holders of our Common Shares
As of March 31, 2014, we had 137 holders of record of our common stock. The actual number of stockholders is greater than this number of record holders, and includes stockholders who are beneficial owners, but whose shares are held in street name by brokers and other nominees. This number of holders of record also does not include stockholders whose shares may be held in trust by other entities.
Dividend Policy
We have never declared or paid any cash dividends on our common stock. We intend to retain future earnings, if any, to finance the operation and expansion of our business and do not anticipate paying any cash dividends in the foreseeable future. Any future determination to declare dividends will be subject to the discretion of our Board of Directors and will be dependent on a number of factors, including our operating results, capital requirements and overall financial condition and any other factors deemed relevant by our Board of Directors.
Recent Sale of Unregistered Securities
None
Use of Proceeds from Initial Public Offering of Common Stock
On April 17, 2013, we closed our initial public offering, in which we issued and sold 6,900,000 shares of common stock, including 900,000 shares of common stock sold pursuant to the underwriters' option to purchase additional shares, at a public offering price of $14.00 per share, for aggregate gross proceeds to us of $96.6 million. All of the shares issued and sold in our initial public offering were registered under the Securities Act pursuant to a registration statements on Form S-1 (File Nos. 333-187173 and 333-187876), which were declared effective by the SEC on April 11, 2013. Deutsche Bank Securities Inc., Piper Jaffray & Co., JMP Securities LLC, Needham & Company, LLC and William Blair & Company LLC acted as the underwriters. The offering commenced on April 11, 2013 and did not terminate before all of the securities registered in the registration statements were sold.
35
Table of Contents
The net offering proceeds to us, after deducting underwriting discounts and commissions totaling approximately $6.8 million and offering expenses totaling approximately $2.9 million, were approximately $87.0 million. No offering expenses were paid directly or indirectly to any of our directors or officers (or their associates) or persons owning ten percent or more of any class of our equity securities or to any other affiliates. At January 31, 2014, all expenses incurred in connection with our initial public offering have been paid.
There has been no material change in the planned use of proceeds from our initial public offering as described in our prospectus dated April 11, 2013 filed with the SEC on April 12, 2013 pursuant to Rule 424(b) of the Securities Act. As of January 31, 2014, we have used $8.6 million of the proceeds from our initial public offering for working capital and other general corporate purposes, including investing in our data center infrastructure and expanding our sales force. As of January 31, 2014, no portion of the proceeds from our initial public offering have been paid by us directly or indirectly to any of our directors or officers (or their associates) or persons owning ten percent or more of any class of our equity securities or to any other affiliates, other than payments in the ordinary course of business to officers for salaries and bonuses, and payments to our directors for service on our Board of Directors. Our management team has significant discretion in the application of the net proceeds from the initial public offering.
Purchases of Equity Securities by Issuer and Affiliated Parties
None
36
Table of Contents
Stock Performance Graph
The following shall not be deemed incorporated by reference into any of our other filings under the Exchange Act or the Securities Act, except to the extent we specifically incorporate it by reference into such filing.
The graph below compares the cumulative total stockholder return on our common stock with the cumulative total return on the NYSE Composite Index and the Standard & Poor Systems Software Index for the period beginning on April 12, 2013 (the date our common stock commenced trading on the New York Stock Exchange) through January 31, 2014, assuming an initial investment of $100. Data for the NYSE Composite Index and the Standard &Poor Systems Software Index assume reinvestment of dividends.
The comparisons in the graph below are based upon historical data and are not indicative of, nor intended to forecast, future performance of our common stock.
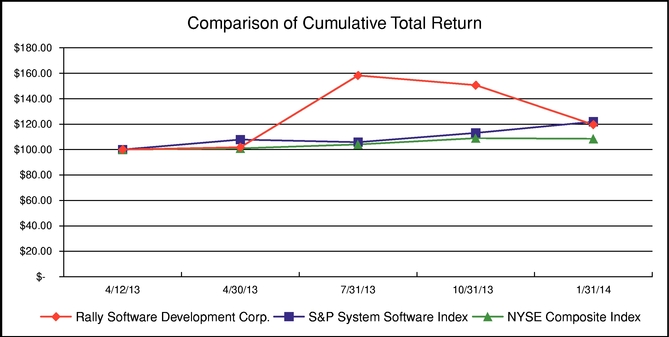
| | | | | | | | | | | | | | | | |
| | 4/12/2013 | | 4/30/2013 | | 7/31/2013 | | 10/31/2013 | | 1/31/2014 | |
|---|
Rally Software Development Corp. | | | 100.00 | | | 101.80 | | | 158.28 | | | 150.65 | | | 119.60 | |
NYSE Composite | | | 100.00 | | | 100.96 | | | 104.03 | | | 108.94 | | | 108.48 | |
S&P Systems Software | | | 100.00 | | | 107.85 | | | 105.81 | | | 113.08 | | | 121.87 | |
ITEM 6. Selected Financial Data
The following selected consolidated financial data should be read together with our consolidated financial statements and related notes and the section titled "Management's Discussion and Analysis of Financial Condition and Results of Operations" contained elsewhere in this Annual Report on Form 10-K. The selected consolidated financial data in this section are not intended to replace our consolidated financial statements and the related notes. Our historical results are not necessarily indicative of our future results.
We derived the consolidated statements of operations data for the years ended January 31, 2014, 2013, and 2012, and the consolidated balance sheet data as of January 31, 2014 and 2013 from our audited consolidated financial statements included elsewhere in this Annual Report on Form 10-K. We derived the consolidated statements of operations data for the years ended January 31, 2011 and 2010
37
Table of Contents
and the consolidated balance sheet data as of January 31, 2012, 2011 and 2010 from our audited consolidated financial statements not included in this Annual Report on Form 10-K.
| | | | | | | | | | | | | | | | |
| | Fiscal Year Ended January 31, | |
|---|
| | 2014 | | 2013 | | 2012 | | 2011 | | 2010 | |
|---|
| | (in thousands, except per share data)
| |
|---|
Consolidated Statements of Operations Data: | | | | | | | | | | | | | | | | |
Revenue: | | | | | | | | | | | | | | | | |
Subscription and support | | $ | 57,852 | | $ | 43,794 | | $ | 31,124 | | $ | 19,902 | | $ | 12,897 | |
Perpetual license | | | 5,914 | | | 5,815 | | | 3,546 | | | 4,260 | | | 1,334 | |
| | | | | | | | | | | | |
| | | | | | | | | | | | | | | | | |
Total product revenue | | | 63,766 | | | 49,609 | | | 34,670 | | | 24,162 | | | 14,231 | |
Professional services | | | 10,563 | | | 7,237 | | | 6,655 | | | 5,548 | | | 4,142 | |
| | | | | | | | | | | | |
| | | | | | | | | | | | | | | | | |
Total revenue | | | 74,329 | | | 56,846 | | | 41,325 | | | 29,710 | | | 18,373 | |
| | | | | | | | | | | | |
| | | | | | | | | | | | | | | | | |
Cost of revenue: | | | | | | | | | | | | | | | | |
Product(1) | | | 7,567 | | | 5,242 | | | 4,096 | | | 3,033 | | | 1,990 | |
Professional services(1) | | | 9,105 | | | 7,005 | | | 5,679 | | | 4,846 | | | 3,373 | |
| | | | | | | | | | | | |
| | | | | | | | | | | | | | �� | | | |
Total cost of revenue | | | 16,672 | | | 12,247 | | | 9,775 | | | 7,879 | | | 5,363 | |
| | | | | | | | | | | | |
| | | | | | | | | | | | | | | | | |
Gross profit | | | 57,657 | | | 44,599 | | | 31,550 | | | 21,831 | | | 13,010 | |
| | | | | | | | | | | | |
| | | | | | | | | | | | | | | | | |
Operating expenses: | | | | | | | | | | | | | | | | |
Sales and marketing(1) | | | 39,628 | | | 29,445 | | | 23,552 | | | 18,526 | | | 13,407 | |
Research and development(1) | | | 20,812 | | | 15,121 | | | 11,074 | | | 7,979 | | | 5,230 | |
General and administrative(1) | | | 16,708 | | | 10,810 | | | 8,170 | | | 5,074 | | | 3,875 | |
Sublease termination income(2) | | | — | | | (839 | ) | | — | | | — | | | — | |
| | | | | | | | | | | | |
| | | | | | | | | | | | | | | | | |
Total operating expenses | | | 77,148 | | | 54,537 | | | 42,796 | | | 31,579 | | | 22,512 | |
| | | | | | | | | | | | |
| | | | | | | | | | | | | | | | | |
Loss from operations | | | (19,491 | ) | | (9,938 | ) | | (11,246 | ) | | (9,748 | ) | | (9,502 | ) |
Interest and other income (expense), net | | | (467 | ) | | (714 | ) | | (346 | ) | | (191 | ) | | (244 | ) |
| | | | | | | | | | | | |
| | | | | | | | | | | | | | | | | |
Loss before provision for income taxes | | | (19,958 | ) | | (10,652 | ) | | (11,592 | ) | | (9,939 | ) | | (9,746 | ) |
Provision for income taxes | | | 173 | | | 128 | | | — | | | — | | | — | |
| | | | | | | | | | | | |
| | | | | | | | | | | | | | | | | |
Net loss | | | (20,131 | ) | | (10,780 | ) | | (11,592 | ) | | (9,939 | ) | | (9,746 | ) |
Preferred stock accretion | | | — | | | — | | | (22 | ) | | (81 | ) | | (67 | ) |
Preferred stock deemed dividend(3) | | | — | | | — | | | (762 | ) | | — | | | — | |
| | | | | | | | | | | | |
| | | | | | | | | | | | | | | | | |
Net loss attributable to common stockholders | | $ | (20,131 | ) | $ | (10,780 | ) | $ | (12,376 | ) | $ | (10,020 | ) | $ | (9,813 | ) |
| | | | | | | | | | | | |
| | | | | | | | | | | | | | | | | |
| | | | | | | | | | | | | | | | | |
| | | | | | | | | | | | |
Net loss per common share, basic and diluted(4) | | $ | (1.01 | ) | $ | (5.13 | ) | $ | (6.62 | ) | $ | (6.94 | ) | $ | (7.95 | ) |
| | | | | | | | | | | | |
| | | | | | | | | | | | | | | | | |
| | | | | | | | | | | | | | | | | |
| | | | | | | | | | | | |
Weighted-average common shares outstanding, basic and diluted(4) | | | 19,840,685 | | | 2,100,790 | | | 1,868,771 | | | 1,443,551 | | | 1,234,385 | |
Key Metrics (unaudited): | | | | | | | | | | | | | | | | |
Total paid seats(5) | | | 214,047 | | | 168,562 | | | 116,714 | | | 79,375 | | | 49,883 | |
Renewal rate(6) | | | 116 | % | | 127 | % | | 129 | % | | 132 | % | | 129 | % |
- (1)
- Includes stock-based compensation as follows:
| | | | | | | | | | | | | | | | |
| | Fiscal Year Ended January 31, | |
|---|
| | 2014 | | 2013 | | 2012 | | 2011 | | 2010 | |
|---|
| | (in thousands, except per share data)
| |
|---|
Cost of product revenue | | $ | 250 | | $ | 16 | | $ | 10 | | $ | 6 | | $ | 5 | |
Cost of professional services revenue | | | 181 | | | 27 | | | 17 | | | 9 | | | 6 | |
Sales and marketing | | | 1,316 | | | 198 | | | 124 | | | 57 | | | 46 | |
Research and development | | | 1,239 | | | 193 | | | 93 | | | 56 | | | 48 | |
General and administrative | | | 1,465 | | | 523 | | | 324 | | | 65 | | | 66 | |
| | | | | | | | | | | | |
| | | | | | | | | | | | | | | | | |
| | $ | 4,451 | | $ | 957 | | $ | 568 | | $ | 193 | | $ | 171 | |
| | | | | | | | | | | | |
| | | | | | | | | | | | | | | | | |
| | | | | | | | | | | | | | | | | |
| | | | | | | | | | | | |
38
Table of Contents
- (2)
- In April 2012, the sublease for our corporate headquarters was terminated as a result of the sale of the building by the building's owner. The transaction was deemed a termination of the original lease and we derecognized the remaining deferred rent expense.
- (3)
- In August 2011, we repurchased 151,122 shares of our preferred stock. The difference between the carrying value of the shares of preferred stock and their estimated fair value was deemed to be a dividend.
- (4)
- See Note 14 of our consolidated financial statements for a discussion and reconciliation of historical net loss attributable to common stockholders and weighted-average common shares outstanding for historical basic and diluted net loss per share calculations.
- (5)
- Represents the number of total paid seats at period end. We define a paid seat as a seat with a subscription or support contract as of the measurement date. In the case of a contract that allows a customer to provision an unlimited number of seats, total paid seats includes an estimate of the total number of seats to be provisioned during the term of the contract. Total paid seats as of January 31, 2014 includes 22,414 seats in seat upgrades and as of January 31, 2013 includes 10,081 seats in seat upgrades, in each case, pursuant to such contracts. For more information, see the section titled "Management's Discussion and Analysis of Financial Condition and Results of Operations—Key Metrics."
- (6)
- Represents our renewal rate for the trailing twelve-month period ended as of the specified period end. We calculate our renewal rate by comparing the number of paid seats of all of our existing customers at the beginning of a twelve-month period to the number of paid seats for those same customers at the end of such period, taking into account nonrenewals, upgrades and downgrades. We exclude seats sold to new customers. For more information, see the section titled "Management's Discussion and Analysis of Financial Condition and Results of Operations—Key Metrics."
| | | | | | | | | | | | | | | | |
| | As of January 31, | |
|---|
| | 2014 | | 2013 | | 2012 | | 2011 | | 2010 | |
|---|
| | (in thousands)
| |
|---|
Consolidated Balance Sheet Data: | | | | | | | | | | | | | | | | |
Cash and cash equivalents | | $ | 88,891 | | $ | 17,609 | | $ | 19,452 | | $ | 4,566 | | $ | 15,906 | |
Working capital, excluding current deferred revenue | | | 105,030 | | | 30,393 | | | 28,052 | | | 13,360 | | | 18,331 | |
Total assets | | | 129,083 | | | 41,855 | | | 35,472 | | | 20,458 | | | 24,043 | |
Deferred revenue, current and long-term | | | 40,785 | | | 38,190 | | | 25,109 | | | 18,338 | | | 12,423 | |
Notes payable and capital lease obligations, current and long-term | | | — | | | — | | | 31 | | | 132 | | | 2,973 | |
Preferred stock warrant liability | | | — | | | 1,604 | | | 925 | | | 591 | | | 436 | |
Convertible preferred stock | | | — | | | 68,410 | | | 68,410 | | | 49,131 | | | 49,051 | |
Total stockholders' equity (deficit) | | | 78,374 | | | (73,022 | ) | | (63,671 | ) | | (52,133 | ) | | (42,662 | ) |
ITEM 7. Management's Discussion and Analysis of Financial Condition and Results of Operations
You should read the following discussion and analysis of our financial condition and results of operations together with the consolidated financial statements and related notes that are included elsewhere in this Annual Report on Form 10-K. This discussion contains information with respect to our plans and strategy as well as forward-looking statements based upon current expectations that involve risks and uncertainties. Forward looking statements are often identified by the use of words such as "anticipate," "believe," "continue," "could," "estimate," "expect," "intend," "may," "plan," "project," "will," "would" or negative or plural of these words or similar expressions or variations. Our actual results may differ materially from those anticipated in these forward-looking statements as a result of various factors, including those set forth under "Risk Factors" or in other parts of this Annual Report on Form 10-K. You should not rely upon forward-looking statements as predictions of future events. Furthermore, such forward-looking statements speak only as of the date of this report. Except as required by law, we undertake no obligation to update any forward-looking statements to reflect events or circumstances after the date of such statements. The last day of our fiscal year is January 31. Our fiscal quarters end on April 30, July 31, October 31 and January 31. Throughout this management's discussion and analysis of financial condition and results of operations we
39
Table of Contents
may from time to time refer to fiscal years and the reference relates to the fiscal year end; for example, fiscal 2014 would represent the fiscal year that ended on January 31, 2014.
Overview
Rally Software is a leading global provider of cloud-based solutions for managing Agile software development. Agile is a software development methodology characterized by short, iterative and highly-adaptable development cycles. Our platform transforms the way organizations manage the software development lifecycle by enabling close alignment of software development and strategic business objectives, facilitating collaboration, increasing transparency, and automating manual processes. Organizations use our solutions to accelerate the pace of innovation, improve productivity and more effectively adapt to rapidly-changing customer needs and competitive dynamics. Our enterprise-class platform is extensible, cost-effective and designed to be easy to use. Since its introduction in 2001, organizations have increasingly adopted Agile. As of January 31, 2014, we had 214,047 paid users and more than 1,100 customers, including more than 35 of the Fortune 100 companies. We were founded in 2001 and until 2004 our activities were primarily focused on research and development. In late 2004, we released our first commercial, cloud-based solution. Initially, we focused on the U.S. market, targeted small- and medium-sized businesses and sold our solutions primarily to software companies. Over time we have successfully grown our business by diversifying our customer base across numerous industry verticals and geographies and shifting our sales focus to enterprises. Concurrent with this change in customer composition, we began providing deployment flexibility with an on-premise option and three editions of our solutions, a free Community Edition, an Enterprise Edition and an Unlimited Edition. Since 2010, we have made significant investments in our sales force and broadened our solutions and international presence in response to the growing market opportunity for Agile management solutions. In December 2011, we introduced our Rally Portfolio Manager solution, which helped us to attract greater interest and drive adoption of our Unlimited Edition. Our operating results in a given period can fluctuate based on the mix of subscription and support, perpetual license and professional services revenue. For the fiscal years ended January 31, 2014, 2013 and 2012, subscription and support revenue accounted for 78%, 77% and 75% of total revenue, respectively. Our subscription contracts are typically sold on a per-seat basis with a one-year term paid upfront and provide us with revenue visibility over a number of quarters. We typically negotiate the total number of seats a customer is entitled to provision as part of their subscription, but these seats may not be fully utilized over the term of the agreement. However, we have from time to time, and may in the future, enter into multi-year contracts in which the fees are paid upfront and the customer is entitled to an unlimited number of seats. These contracts may lead to significant fluctuations in cash flow from operations and will positively impact cash flow from operations in the period in which the cash is received. To a lesser extent, we sell perpetual licenses, which are also paid upfront and include support agreements, which are one year in duration and entitle the customer to support and upgrades. For the fiscal years ended January 31, 2014, 2013 and 2012, perpetual license revenue accounted for 8%, 10% and 9% of total revenue, respectively. We also offer professional services, which include training on Agile software development methodologies and the use of our solutions. For the fiscal years ended January 31, 2014, 2013 and 2012, professional services accounted for 14%, 13% and 16% of total revenue, respectively.
We employ a land-and-expand go-to-market strategy, which is designed to encourage adoption of our solutions by helping establish Agile practices within an initial team, project or business unit. After demonstrating the value of our solutions to those first adopters, we work to expand the use of our solutions and sell additional subscriptions across the organization by targeting other development teams, departments and business units. We believe that our enterprise-level customers are underpenetrated and represent a significant growth opportunity for us to increase our seat count. Our growth has also been driven by selling to new enterprise customers, as Agile software development practices continue to be adopted. While part of our growth strategy is to promote adoption of Agile practices through the use of our free Community Edition, to date the conversion of customers of our
40
Table of Contents
free edition to one of our paid editions has not had a material impact on our revenue. We also continue to invest in our sales and marketing efforts worldwide. During the fiscal years ended January 31, 2014, 2013 and 2012, revenue from international customers accounted for 14%, 13% and 14%, respectively, of total revenue. During fiscal 2014, no customer accounted for more than 4% of our total revenue. We sell our solutions primarily through a direct sales force, both domestically and internationally.
As we grow our business, we continue to face many challenges and risks. Specifically, our growth is dependent on the continued adoption of Agile software development techniques and investment in our business, including expanding our data center infrastructure capacity and sales and engineering teams, as well as continuing to grow our international presence. We might encounter difficulties growing our international presence if we are unable to localize our solutions and successfully compete with regional companies. Over time, as competition increases we expect to face pricing pressure. In addition, we offer volume price discounts based on the number of seats purchased. We may also experience seat downgrades that could negatively impact our total seat count. Seat downgrades occur for several reasons, including dissatisfaction with our prices or features relative to competitive offerings, reductions in our customers' spending levels, unused seats, limited adoption by a customer of our solutions or Agile practices, or departure of Agile users. Our strategic initiatives will require expenditure of capital and the attention of management and we may be unsuccessful as we execute on our growth plan.
We have achieved significant growth since inception. From fiscal 2013 to fiscal 2014, our subscription and support revenue grew from $43.8 million to $57.9 million, representing a 32% year-over-year growth rate. From fiscal 2012 to fiscal 2013, our subscription and support revenue grew from $31.1 million to $43.8 million, representing a 41% year-over-year growth rate. From fiscal 2013 to fiscal 2014, our total revenue grew from $56.8 million to $74.3 million, representing a 31% year-over-year growth rate. From fiscal 2012 to fiscal 2013, our total revenue grew from $41.3 million to $56.8 million, representing a 38% year-over-year growth rate. Our historical rates of revenue growth may not be sustainable. We expect to continue to make significant expenditures to support and grow our business, including investing in our data center infrastructure, expanding our sales force, expanding our research and development teams and increasing our international presence. In addition, as a public company we will continue to incur significant legal, accounting and other expenses that we did not incur as a private company. Furthermore, we may encounter unforeseen expenses, complications and other difficulties. We expect to incur losses for the foreseeable future and we may not be able to achieve or sustain profitability.
On April 17, 2013, we issued and sold 6,900,000 shares of common stock in our initial public offering. The net offering proceeds to us, after deducting underwriting discounts and commissions totaling approximately $6.8 million and offering expenses totaling approximately $2.9 million, were approximately $87.0 million.
On July 30, 2013, we closed our follow-on public offering in which we and certain of our stockholders sold an aggregate of 5,589,455 shares of common stock. Of the 5,589,455 shares of common stock sold in the offering, 250,000 shares were sold by us and 5,339,455 shares were sold by selling stockholders. The net offering proceeds to us, after deducting underwriting discounts and commissions totaling approximately $0.3 million and offering expenses totaling approximately $0.6 million, were approximately $5.3 million. All offering costs related to our initial public offering and follow-on public offering have been paid as of January 31, 2014.
Key Metrics
We regularly review the following key metrics to evaluate our business, measure our performance, identify trends in our business, prepare financial projections and make strategic decisions.
41
Table of Contents
Total paid seats. We believe total paid seats are a key indicator of our market penetration, growth and future revenue. We define a paid seat as a seat with a subscription or support contract as of the measurement date. Our total paid seats were 214,047, 168,562 and 116,714 as of January 31, 2014, 2013 and 2012, respectively. In the case of a contract that allows a customer to provision an unlimited number of seats, total paid seats includes an estimate of the total number of seats to be provisioned during the term of the contract. Total paid seats as of January 31, 2014 include 22,414 seats in aggregate seat upgrades pursuant to such contracts with eight different enterprise customers. Total paid seats as of January 31, 2013 include 10,081 seats in aggregate seat upgrades pursuant to such contracts with three different enterprise customers.
Renewal rate. We believe our renewal rate is an important metric to measure the long-term value of customer agreements and our ability to upsell or expand in our existing customer base. We calculate our renewal rate by comparing the number of paid seats of all of our existing customers at the beginning of a twelve-month period to the number of paid seats for those same customers at the end of such period, taking into account nonrenewals, upgrades and downgrades. We exclude seats sold to new customers. For the fiscal years ended January 31, 2014, 2013 and 2012, our renewal rate was 116%, 127% and 129%, respectively.
Components of Operating Results
Revenue
Subscription and support revenue. We derive our subscription revenue from fees paid to us by our customers for access to our cloud-based solutions. We recognize the revenue associated with subscription agreements ratably on a straight-line basis over the term of the agreement, provided all criteria required for revenue recognition have been met.
Our support revenue consists of maintenance associated with our perpetual licenses and hosting fees paid to us by our customers. Typically, when purchasing a perpetual license, a customer also purchases maintenance for which we charge a fee, priced as a percentage of the perpetual license fee. Maintenance agreements include the right to support and unspecified product upgrades. We recognize the revenue associated with maintenance ratably, on a straight-line basis, over the term of the contract. In limited instances, at the customer's option, we may host the software purchased by a customer under a perpetual license on systems at our third-party data centers. For hosting, we charge a fee, priced as a percentage of the perpetual license fee, and we recognize the revenue associated with hosting ratably on a straight-line basis over the associated hosting period.
Perpetual license revenue. Perpetual license revenue reflects the revenue recognized from sales of perpetual licenses to new customers and additional licenses to existing customers. We generally recognize the license fee portion of the arrangement upfront, provided all revenue recognition criteria are satisfied.
Professional services revenue. Professional services revenue consists primarily of fees related to the instruction of customers in Agile software development methodologies and training on our solutions as well as reimbursable expenses. We generally recognize the revenue associated with these professional services on a time-and-materials basis as we deliver the services or provide the training to our customers.
Cost of Revenue
Cost of product revenue. Cost of product revenue consists primarily of personnel and related costs of our support and operations teams, including salaries, benefits, bonuses, payroll taxes, stock-based compensation and allocated overhead, as well as software license fees, hosting costs, Internet connectivity and depreciation expenses directly related to delivering our solutions. As we add data
42
Table of Contents
center capacity and support personnel in advance of anticipated growth, our cost of product revenue will increase and if such anticipated revenue growth does not occur, our product gross profit will be adversely affected. In February 2013, we purchased Flowdock Oy, a company based in Helsinki, Finland, for approximately $4.4 million. A meaningful potion of the purchase consideration has been allocated to intangible assets that will be capitalized and amortized over time to cost of product revenue, thereby increasing our cost of product revenue. Our cost of product revenue is generally expensed as the costs are incurred.
Cost of professional services revenue. Cost of professional services revenue consists primarily of personnel and related costs, including salaries, benefits, bonuses, payroll taxes, stock-based compensation, the costs of contracted third-party vendors, reimbursable expenses and allocated overhead. As most of our personnel are employed on a full-time basis, our cost of professional services is largely fixed in the short-term, while our professional services revenue may fluctuate, leading to fluctuations in professional services gross profit. Our cost of professional services revenue is generally expensed as costs are incurred.
Operating Expenses
Our operating expenses are classified into three categories: sales and marketing, research and development and general and administrative. For each category, the largest expense component is personnel and related costs, which includes salaries, employee benefit costs, bonuses, commissions, stock-based compensation and payroll taxes. Operating expenses also include allocated overhead costs for facilities and depreciation of equipment, which are allocated to each department based on relative department headcount. Operating expenses are generally recognized as incurred.
Sales and marketing. Sales and marketing expenses primarily consist of personnel and related costs for our sales and marketing staff, including salaries, benefits, commissions, bonuses, payroll taxes, stock-based compensation and costs of promotional events, corporate communications, online marketing, product marketing and other brand-building activities, in addition to allocated overhead. We expense sales commissions when the initial customer contract is signed and upon any renewal as our obligation to pay a sales commission arises at these times. We expect that sales and marketing expenses will continue to increase both in absolute dollars and as a percentage of revenue, partially as a result of our international expansion, and will continue to be the largest expense component of our operating expenses.
Research and development. Research and development expenses primarily consist of personnel and related costs of our research and development staff, including salaries, benefits, bonuses, payroll taxes, stock-based compensation and costs of certain third-party contractors, as well as allocated overhead. Research and development costs related to the development of our software products are generally expensed as incurred as development costs that have qualified for capitalization are not significant. We have devoted our product development efforts primarily to enhancing the functionality and expanding the capabilities of our solutions. We expect that our research and development expenses will continue to increase both in absolute dollars and as a percentage of revenue as we increase our research and development headcount to further strengthen and enhance our solutions. For example, in February 2013 we increased our research and development headcount by eight employees with the purchase of Flowdock Oy.
General and administrative. General and administrative expenses primarily consist of personnel and related costs for our executive, administrative, finance, information technology, legal, accounting and human resource staffs, including salaries, benefits, bonuses, payroll taxes and stock-based compensation, professional fees, other corporate expenses and allocated overhead. We have recently incurred, and expect to continue to incur, additional expenses as we grow our operations and transition to operating as a public company, including higher legal, corporate insurance, accounting and auditing
43
Table of Contents
expenses, and the additional costs of enhancing and maintaining our internal control environment through the adoption of new corporate policies. We also expect that general and administrative expenses will continue to increase both in absolute dollars and as a percentage of revenue as we expand our operations, including internationally.
Other Income (Expense)
Other income (expense) consists primarily of interest income on our cash balances, changes in the estimated fair value of our preferred stock warrants, which are recorded as interest expense because the warrants were issued in conjunction with debt facilities, and foreign exchange gains (losses) that relate to expenses and transactions denominated in currencies other than our functional currency. Our functional currency is the U.S. dollar. On April 17, 2013, our preferred stock warrants converted to common stock warrants upon the closing of our initial public offering and, as such, we are no longer required to present the warrants at fair value.
Provision for Income Taxes
Because we have generated net losses in all periods to date and recorded a full valuation allowance against our deferred tax assets, we have historically not recorded a provision for federal or state income taxes. Foreign income taxes prior to the fiscal year ended January 31, 2013 have not been material. The tax provision for the fiscal years ended January 31, 2014 and 2013 is exclusively related to foreign income taxes and is a result of the cost-plus transfer pricing agreements we have in place with our foreign subsidiaries. Realization of any of our deferred tax assets depends upon future earnings, the timing and amount of which are uncertain. Utilization of our net operating losses may be subject to annual limitations due to the ownership change rules under the Internal Revenue Code of 1986, as amended, and similar state provisions. We completed an analysis covering the period through April 30, 2013 to determine whether an ownership change had occurred since our inception. The analysis indicated that although an ownership change had occurred in 2003, the net operating losses and research and development credits remained available to offset future taxable income, if any. However, in the event we have subsequent changes in ownership the availability of net operating losses and research and development credit carryovers could be limited.
44
Table of Contents
Results of Operations
The following tables set forth our results of operations for the periods presented as dollars and as a percentage of our total revenue for those periods. The period-to-period comparison of financial results is not necessarily indicative of financial results to be achieved in future periods.
| | | | | | | | | | |
| | Fiscal Year Ended January 31, | |
|---|
| | 2014 | | 2013 | | 2012 | |
|---|
| | (in thousands)
| |
|---|
Consolidated Statements of Operations Data: | | | | | | | | | | |
Revenue: | | | | | | | | | | |
Subscription and support | | $ | 57,852 | | $ | 43,794 | | $ | 31,124 | |
Perpetual license | | | 5,914 | | | 5,815 | | | 3,546 | |
| | | | | | | | |
| | | | | | | | | | | |
Total product revenue | | | 63,766 | | | 49,609 | | | 34,670 | |
Professional services | | | 10,563 | | | 7,237 | | | 6,655 | |
| | | | | | | | |
| | | | | | | | | | | |
Total revenue | | | 74,329 | | | 56,846 | | | 41,325 | |
| | | | | | | | |
| | | | | | | | | | | |
Cost of revenue: | | | | | | | | | | |
Product | | | 7,567 | | | 5,242 | | | 4,096 | |
Professional services | | | 9,105 | | | 7,005 | | | 5,679 | |
| | | | | | | | |
| | | | | | | | | | | |
Total cost of revenue | | | 16,672 | | | 12,247 | | | 9,775 | |
| | | | | | | | |
| | | | | | | | | | | |
Gross profit | | | 57,657 | | | 44,599 | | | 31,550 | |
| | | | | | | | |
| | | | | | | | | | | |
Operating expenses: | | | | | | | | | | |
Sales and marketing | | | 39,628 | | | 29,445 | | | 23,552 | |
Research and development | | | 20,812 | | | 15,121 | | | 11,074 | |
General and administrative | | | 16,708 | | | 10,810 | | | 8,170 | |
Sublease termination income | | | — | | | (839 | ) | | — | |
| | | | | | | | |
| | | | | | | | | | | |
Total operating expenses | | | 77,148 | | | 54,537 | | | 42,796 | |
| | | | | | | | |
| | | | | | | | | | | |
Loss from operations | | | (19,491 | ) | | (9,938 | ) | | (11,246 | ) |
Other (expense) income: | | | | | | | | | | |
Interest and other income | | | 128 | | | 56 | | | 53 | |
Interest expense | | | (464 | ) | | (683 | ) | | (349 | ) |
Loss on foreign currency transactions and other gain (loss) | | | (131 | ) | | (87 | ) | | (50 | ) |
| | | | | | | | |
| | | | | | | | | | | |
Loss before provision for income taxes | | | (19,958 | ) | | (10,652 | ) | | (11,592 | ) |
Provision for income taxes | | | 173 | | | 128 | | | — | |
| | | | | | | | |
| | | | | | | | | | | |
Net loss | | $ | (20,131 | ) | $ | (10,780 | ) | $ | (11,592 | ) |
| | | | | | | | |
| | | | | | | | | | | |
| | | | | | | | | | | |
| | | | | | | | |
45
Table of Contents
| | | | | | | | | | |
| | Fiscal Year Ended
January 31, | |
|---|
| | 2014 | | 2013 | | 2012 | |
|---|
| | (as a percentage of
total revenue)
| |
|---|
Consolidated Statements of Operations Data: | | | | | | | | | | |
Revenue: | | | | | | | | | | |
Subscription and support | | | 78 | % | | 77 | % | | 75 | % |
Perpetual license | | | 8 | | | 10 | | | 9 | |
| | | | | | | | |
| | | | | | | | | | | |
Total product revenue | | | 86 | | | 87 | | | 84 | |
Professional services | | | 14 | | | 13 | | | 16 | |
| | | | | | | | |
| | | | | | | | | | | |
Total revenue | | | 100 | | | 100 | | | 100 | |
| | | | | | | | |
| | | | | | | | | | | |
Cost of revenue: | | | | | | | | | | |
Product | | | 10 | | | 10 | | | 10 | |
Professional services | | | 12 | | | 12 | | | 14 | |
| | | | | | | | |
| | | | | | | | | | | |
Total cost of revenue | | | 22 | | | 22 | | | 24 | |
| | | | | | | | |
| | | | | | | | | | | |
Gross profit | | | 78 | | | 78 | | | 76 | |
| | | | | | | | |
| | | | | | | | | | | |
Operating expenses: | | | | | | | | | | |
Sales and marketing | | | 54 | | | 51 | | | 57 | |
Research and development | | | 28 | | | 27 | | | 26 | |
General and administrative | | | 22 | | | 19 | | | 20 | |
Sublease termination income | | | — | | | (1 | ) | | — | |
| | | | | | | | |
| | | | | | | | | | | |
Total operating expenses | | | 104 | | | 96 | | | 103 | |
| | | | | | | | |
| | | | | | | | | | | |
Loss from operations | | | (26 | ) | | (18 | ) | | (27 | ) |
Other (expense) income: | | | | | | | | | | |
Interest and other income | | | — | | | — | | | — | |
Interest expense | | | (1 | ) | | (1 | ) | | (1 | ) |
Loss on foreign currency transactions and other gain (loss) | | | — | | | — | | | — | |
| | | | | | | | |
| | | | | | | | | | | |
Loss before provision for income taxes | | | (27 | ) | | (19 | ) | | (28 | ) |
Provision for income taxes | | | — | | | — | | | — | |
| | | | | | | | |
| | | | | | | | | | | |
Net loss | | | (27 | )% | | (19 | )% | | (28 | )% |
| | | | | | | | |
| | | | | | | | | | | |
| | | | | | | | | | | |
| | | | | | | | |
46
Table of Contents
Comparison of the Fiscal Years Ended January 31, 2014 and 2013
Revenue
| | | | | | | | | | |
| | Fiscal Year Ended
January 31, | |
| |
|---|
| | 2014 | | 2013 | | % Change | |
|---|
| | (dollars in thousands)
| |
| |
|---|
Revenue: | | | | | | | | | | |
Subscription and support | | $ | 57,852 | | $ | 43,794 | | | 32 | % |
Perpetual license | | | 5,914 | | | 5,815 | | | 2 | % |
| | | | | | | | | |
| | | | | | | | | | | |
Total product revenue | | | 63,766 | | | 49,609 | | | 29 | % |
Professional services | | | 10,563 | | | 7,237 | | | 46 | % |
| | | | | | | | | |
| | | | | | | | | | | |
Total revenue | | $ | 74,329 | | $ | 56,846 | | | 31 | % |
| | | | | | | | | |
| | | | | | | | | | | |
| | | | | | | | | | | |
| | | | | | | | | |
Percentage of revenue: | | | | | | | | | | |
Subscription and support | | | 78 | % | | 77 | % | | | |
Perpetual license | | | 8 | % | | 10 | % | | | |
| | | | | | | | | |
| | | | | | | | | | | |
Total product revenue | | | 86 | % | | 87 | % | | | |
Professional services | | | 14 | % | | 13 | % | | | |
| | | | | | | | | |
| | | | | | | | | | | |
Total | | | 100 | % | | 100 | % | | | |
| | | | | | | | | |
| | | | | | | | | | | |
| | | | | | | | | | | |
| | | | | | | �� | | |
Subscription and support revenue increased $14.1 million from fiscal 2013 to fiscal 2014. Of the total increase in subscription and support revenue, approximately $3.2 million, or 23%, represented revenue from new customers acquired after January 31, 2013, and approximately $10.9 million, or 77%, represented revenue from existing customers at or prior to January 31, 2013. The increase in revenue from existing customers was due primarily to sales of additional seats, which we believe is attributable to increased adoption of Agile practices by our customers.
Perpetual license revenue increased $0.1 million from fiscal 2013 to fiscal 2014. We believe that the increase in perpetual license revenue was primarily due to further adoption of Agile practices by our customers, which resulted in purchases of additional seats, partially offset by pricing increases instituted during the quarter ended July 31, 2013 in order to encourage customers to transition to subscription-based solutions.
Professional services revenue increased $3.3 million from fiscal 2013 to fiscal 2014. The increase was driven by higher demand for our services to assist companies implement Agile software development methodologies.
47
Table of Contents
Cost of Revenue and Gross Profit Percentage
| | | | | | | | | | |
| | Fiscal Year Ended
January 31, | |
| |
|---|
| | 2014 | | 2013 | | % Change | |
|---|
| | (dollars in thousands)
| |
| |
|---|
Cost of revenue: | | | | | | | | | | |
Product | | $ | 7,567 | | $ | 5,242 | | | 44 | % |
Professional services | | | 9,105 | | | 7,005 | | | 30 | % |
| | | | | | | | | |
| | | | | | | | | | | |
Total cost of revenue | | $ | 16,672 | | $ | 12,247 | | | | |
| | | | | | | | | |
| | | | | | | | | | | |
| | | | | | | | | | | |
| | | | | | | | | |
Percentage of total revenue: | | | | | | | | | | |
Product | | | 10 | % | | 10 | % | | | |
Professional services | | | 12 | % | | 12 | % | | | |
| | | | | | | | | |
| | | | | | | | | | | |
Total cost of revenue | | | 22 | % | | 22 | % | | | |
| | | | | | | | | |
| | | | | | | | | | | |
Total gross profit | | | 78 | % | | 78 | % | | | |
Cost of product revenue increased $2.3 million from fiscal 2013 to fiscal 2014. The increase was primarily comprised of a $0.9 million increase in personnel and related expenses, a $0.5 million increase in depreciation expense as a result of computer equipment purchases and amortization of intangible assets acquired in business combinations, a $0.2 million increase in internet expenses associated with obtaining additional capacity to support our solutions, a $0.6 million increase in additional software licenses and a $0.1 million increase in third-party consulting services.
Cost of professional services revenue increased $2.1 million from fiscal 2013 to fiscal 2014. The increase was primarily due to an increase of $0.8 million in personnel and related expenses, an increase of $0.5 million in reimbursements for out of pocket expenses and an increase of $0.8 million in third-party consulting services.
Operating Expenses
Sales and Marketing
| | | | | | | | | | |
| | Fiscal Year Ended
January 31, | |
| |
|---|
| | 2014 | | 2013 | | % Change | |
|---|
| | (dollars in thousands)
| |
| |
|---|
Sales and marketing | | $ | 39,628 | | $ | 29,445 | | | 35 | % |
Percentage of total revenue | | | 54 | % | | 51 | % | | | |
Sales and marketing expenses increased $10.2 million from fiscal 2013 to fiscal 2014. The increase was primarily due to an increase of $7.1 million in personnel and related expenses. Rent expense increased $0.3 million as a result of an increase in allocated rent expense and an increase associated with opening new foreign sales offices. Travel and entertainment expenses increased $0.7 million as a result of our larger sales and marketing teams, an increase in travel related to our international expansion and an increased number of marketing events. Our use of third-party consultants increased by $0.3 million as we continued to expand into international markets and partner referral fees increased by $0.3 million. Marketing expense for outside promotions increased $0.8 million as a result of a shift in marketing strategy to focus on new customer acquisitions and large account expansion. Sales and marketing events increased $0.6 million as a result of an increased number and level of participation in events and sponsorships and additional expense for the RallyON event held in June 2013.
48
Table of Contents
Research and Development
| | | | | | | | | | |
| | Fiscal Year Ended
January 31, | |
| |
|---|
| | 2014 | | 2013 | | % Change | |
|---|
| | (dollars in thousands)
| |
| |
|---|
Research and development | | $ | 20,812 | | $ | 15,121 | | | 38 | % |
Percentage of total revenue | | | 28 | % | | 27 | % | | | |
Research and development expenses increased $5.7 million from fiscal 2013 to fiscal 2014. The increase was primarily due to an increase of $4.5 million in personnel and related expenses to enhance existing solutions and add new functionality to our solutions, an increase of $0.4 million for third party consulting services, an increase of $0.1 million in additional software licenses and a $0.3 million increase in allocated rent expense. Depreciation expense increased $0.2 million as a result of computer equipment purchases to accommodate our growth.
General and Administrative
| | | | | | | | | | |
| | Fiscal Year Ended
January 31, | |
| |
|---|
| | 2014 | | 2013 | | % Change | |
|---|
| | (dollars in thousands)
| |
| |
|---|
General and administrative | | $ | 16,708 | | $ | 10,810 | | | 55 | % |
Percentage of total revenue | | | 22 | % | | 19 | % | | | |
General and administrative expenses increased $5.9 million from fiscal 2013 to fiscal 2014. The increase was partially due to an increase of $2.5 million in personnel and related expenses. Professional fees also increased $0.5 million for accounting, audit, legal and tax related services incurred as a result of our growth, changes we made in connection with the transition to operating as a public company and expenses we incurred in connection with our acquisition of Flowdock Oy. As a result of services provided in relation to operating as a public company and our overall growth, third party consulting services increased $1.0 million. Insurance expense increased $0.5 million primarily due to increased insurance costs related to being a public company. As we continued to increase our overall headcount, recruiting expenses increased $0.3 million, expenses associated with the utilization of software licenses increased $0.3 million and allocated rent expense increased $0.2 million. Travel and entertainment expenses increased $0.2 million as a result of increased travel related to meetings with potential investors and to support our international expansion into new markets.
Other (Expense) Income
| | | | | | | |
| | Fiscal Year
Ended
January 31, | |
|---|
| | 2014 | | 2013 | |
|---|
| | (dollars
in thousands)
| |
|---|
Other (expense) income | | | | | | | |
Interest and other income | | $ | 128 | | $ | 56 | |
Interest expense | | | (464 | ) | | (683 | ) |
Loss on foreign currency transactions and other gain (loss) | | | (131 | ) | | (87 | ) |
| | | | | | |
| | | | | | | | |
Total | | $ | (467 | ) | $ | (714 | ) |
| | | | | | |
| | | | | | | | |
| | | | | | | | |
| | | | | | |
Other (expense) income decreased $0.2 million from fiscal 2013 to fiscal 2014 as a result of the automatic conversion of each of our preferred stock warrants into a warrant to purchase shares of
49
Table of Contents
common stock in connection with the closing of our initial public offering. Upon conversion, recording changes in the fair value of the preferred stock warrants as of the balance sheet date as a component of interest expense was no longer necessary.
Comparison of the Fiscal Years Ended January 31, 2013 and 2012
Revenue
| | | | | | | | | | |
| | Fiscal Year Ended
January 31, | |
| |
|---|
| | 2013 | | 2012 | | % Change | |
|---|
| | (dollars
in thousands)
| |
| |
|---|
Revenue: | | | | | | | | | | |
Subscription and support | | $ | 43,794 | | $ | 31,124 | | | 41 | % |
Perpetual license | | | 5,815 | | | 3,546 | | | 64 | % |
| | | | | | | | | |
| | | | | | | | | | | |
Total product revenue | | | 49,609 | | | 34,670 | | | 43 | % |
Professional services | | | 7,237 | | | 6,655 | | | 9 | % |
| | | | | | | | | |
| | | | | | | | | | | |
Total revenue | | $ | 56,846 | | $ | 41,325 | | | 38 | % |
| | | | | | | | | |
| | | | | | | | | | | |
| | | | | | | | | | | |
| | | | | | | | | |
Percentage of revenue: | | | | | | | | | | |
Subscription and support | | | 77 | % | | 75 | % | | | |
Perpetual license | | | 10 | % | | 9 | % | | | |
| | | | | | | | | |
| | | | | | | | | | | |
Total product revenue | | | 87 | % | | 84 | % | | | |
Professional services | | | 13 | % | | 16 | % | | | |
| | | | | | | | | |
| | | | | | | | | | | |
Total | | | 100 | % | | 100 | % | | | |
| | | | | | | | | |
| | | | | | | | | | | |
| | | | | | | | | | | |
| | | | | | | | | |
Subscription and support revenue increased $12.7 million from fiscal 2012 to fiscal 2013. Of the total increase in subscription and support revenue, approximately $2.9 million, or 23%, represented revenue from new customers acquired after January 31, 2012, and approximately $9.8 million, or 77%, represented revenue from existing customers at or prior to January 31, 2012. The increase in revenue from existing customers was due primarily to sales of additional seats, which we believe is attributable to increased adoption of Agile practices by our customers.
Perpetual license revenue increased $2.3 million from fiscal 2012 to fiscal 2013. The overall increase in perpetual license revenue was the result of increased perpetual license purchases by certain large enterprise customers. Although perpetual license revenue increased in terms of absolute dollars, it remained relatively flat as a percentage of total revenue.
Professional services revenue increased $0.6 million from fiscal 2012 to fiscal 2013. The increase was driven by higher demand for our services to help companies implement Agile software development methodologies.
50
Table of Contents
Cost of Revenue and Gross Profit Percentage
| | | | | | | | | | |
| | Fiscal Year Ended
January 31, | |
| |
|---|
| | 2013 | | 2012 | | % Change | |
|---|
| | (dollars
in thousands)
| |
| |
|---|
Cost of revenue: | | | | | | | | | | |
Product | | $ | 5,242 | | $ | 4,096 | | | 28 | % |
Professional services | | | 7,005 | | | 5,679 | | | 23 | % |
| | | | | | | | | |
| | | | | | | | | | | |
Total cost of revenue | | $ | 12,247 | | $ | 9,775 | | | | |
| | | | | | | | | |
| | | | | | | | | | | |
| | | | | | | | | | | |
| | | | | | | | | |
Percentage of total revenue: | | | | | | | | | | |
Product | | | 10 | % | | 10 | % | | | |
Professional services | | | 12 | % | | 14 | % | | | |
| | | | | | | | | |
| | | | | | | | | | | |
Total cost of revenue | | | 22 | % | | 24 | % | | | |
| | | | | | | | | |
| | | | | | | | | | | |
Total gross profit | | | 78 | % | | 76 | % | | | |
Cost of product revenue increased $1.1 million from fiscal 2012 to fiscal 2013. The increase was primarily comprised of a $0.5 million increase in personnel and related expenses, a $0.1 million increase in allocated rent expense, a $0.1 million increase in depreciation expense as a result of computer equipment purchases and a $0.1 million increase in additional software licenses.
Cost of professional services revenue increased $1.3 million from fiscal 2012 to fiscal 2013 primarily due to an increase of $0.8 million in personnel and related expenses and an increase of $0.4 million in third-party consulting services.
Operating Expenses
Sales and Marketing
| | | | | | | | | | |
| | Fiscal Year Ended
January 31, | |
| |
|---|
| | 2013 | | 2012 | | % Change | |
|---|
| | (dollars
in thousands)
| |
| |
|---|
Sales and marketing | | $ | 29,445 | | $ | 23,552 | | | 25 | % |
Percentage of total revenue | | | 51 | % | | 57 | % | | | |
Sales and marketing expenses increased $5.9 million from fiscal 2012 to fiscal 2013. The increase was primarily due to an increase of $4.8 million in personnel and related expenses. We also incurred $0.2 million of increased marketing expenses, mainly in the form of sponsorships and marketing events. Travel and entertainment expenses increased $0.4 million as a result of our larger sales and marketing teams and an increase in travel related to our international expansion and an increased number of marketing events.
Research and Development
| | | | | | | | | | |
| | Fiscal Year Ended
January 31, | |
| |
|---|
| | 2013 | | 2012 | | % Change | |
|---|
| | (dollars
in thousands)
| |
| |
|---|
Research and development | | $ | 15,121 | | $ | 11,074 | | | 37 | % |
Percentage of total revenue | | | 27 | % | | 27 | % | | | |
51
Table of Contents
Research and development expenses increased $4.0 million from fiscal 2012 to fiscal 2013. The increase was primarily due to an increase of $3.1 million in personnel and related expenses to enhance existing solutions and add new functionality to our solutions and a $0.4 million increase in allocated rent expense.
General and Administrative
| | | | | | | | | | |
| | Fiscal Year Ended
January 31, | |
| |
|---|
| | 2013 | | 2012 | | % Change | |
|---|
| | (dollars
in thousands)
| |
| |
|---|
General and administrative | | $ | 10,810 | | $ | 8,170 | | | 32 | % |
Percentage of total revenue | | | 19 | % | | 20 | % | | | |
General and administrative expenses increased $2.6 million from fiscal 2012 to fiscal 2013. The increase was primarily due to an increase of $1.5 million in personnel and related expenses. Professional fees also increased $1.0 million for accounting, audit, legal and tax services incurred as a result of our growth, changes we made in anticipation of becoming a public company and expenses we incurred in anticipation of our acquisition of Flowdock Oy.
Other (Expense) Income
| | | | | | | |
| | Fiscal Year
Ended
January 31, | |
|---|
| | 2013 | | 2012 | |
|---|
| | (dollars
in thousands)
| |
|---|
Other (expense) income | | | | | | | |
Interest and other income | | $ | 56 | | $ | 53 | |
Interest expense | | | (683 | ) | | (349 | ) |
Loss on foreign currency transactions and other gain (loss) | | | (87 | ) | | (50 | ) |
| | | | | | |
| | | | | | | | |
Total | | $ | (714 | ) | $ | (346 | ) |
| | | | | | |
| | | | | | | | |
| | | | | | | | |
| | | | | | |
Other (expense) income increased $0.4 million from fiscal 2012 to fiscal 2013. The increase was due to an increase in interest expense related to our preferred stock warrants.
Quarterly Results of Operations
The following tables set forth selected unaudited quarterly statements of operations data for the last eight fiscal quarters, as well as the percentage of total revenue that each line item represents. The information for each of these quarters has been prepared on the same basis as the audited annual financial statements included elsewhere in this Annual Report on Form 10-K and, in the opinion of management, includes all adjustments, consisting of only normal recurring adjustments, necessary for the fair statement of the results of operations for these periods. This data should be read in conjunction with our audited consolidated financial statements and related notes included elsewhere in
52
Table of Contents
this Annual Report on Form 10-K. These quarterly operating results are not necessarily indicative of operating results for future periods.
| | | | | | | | | | | | | | | | | | | | | | | | | |
| | Quarter Ended | |
|---|
| | January 31,
2014 | | October 31,
2013 | | July 31,
2013 | | April 30,
2013 | | January 31,
2013 | | October 31,
2012 | | July 31,
2012 | | April 30,
2012 | |
|---|
| | (unaudited)
| |
|---|
| | (in thousands)
| |
|---|
Revenue: | | | | | | | | | | | | | | | | | | | | | | | | | |
Subscription and support | | $ | 15,371 | | $ | 14,888 | | $ | 14,220 | | $ | 13,373 | | $ | 12,387 | | $ | 11,419 | | $ | 10,457 | | $ | 9,530 | |
Perpetual license | | | 1,495 | | | 1,055 | | | 2,735 | | | 629 | | | 1,546 | | | 1,252 | | | 1,407 | | | 1,611 | |
| | | | | | | | | | | | | | | | | | |
| | | | | | | | | | | | | | | | | | | | | | | | | | |
Total product revenue | | | 16,866 | | | 15,943 | | | 16,955 | | | 14,002 | | | 13,933 | | | 12,671 | | | 11,864 | | | 11,141 | |
Professional services | | | 2,739 | | | 2,936 | | | 2,840 | | | 2,047 | | | 1,559 | | | 2,078 | | | 1,763 | | | 1,837 | |
| | | | | | | | | | | | | | | | | | |
| | | | | | | | | | | | | | | | | | | | | | | | | | |
Total revenue | | | 19,605 | | | 18,879 | | | 19,795 | | | 16,049 | | | 15,492 | | | 14,749 | | | 13,627 | | | 12,978 | |
| | | | | | | | | | | | | | | | | | |
| | | | | | | | | | | | | | | | | | | | | | | | | | |
Cost of revenue: | | | | | | | | | | | | | | | | | | | | | | | | | |
Product | | | 2,085 | | | 1,997 | | | 1,800 | | | 1,684 | | | 1,426 | | | 1,437 | | | 1,226 | | | 1,153 | |
Professional services | | | 2,319 | | | 2,577 | | | 2,336 | | | 1,873 | | | 1,709 | | | 1,880 | | | 1,830 | | | 1,586 | |
| | | | | | | | | | | | | | | | | | |
| | | | | | | | | | | | | | | | | | | | | | | | | | |
Total cost of revenue | | | 4,404 | | | 4,574 | | | 4,136 | | | 3,557 | | | 3,135 | | | 3,317 | | | 3,056 | | | 2,739 | |
| | | | | | | | | | | | | | | | | | |
| | | | | | | | | | | | | | | | | | | | | | | | | | |
Gross profit | | | 15,201 | | | 14,305 | | | 15,659 | | | 12,492 | | | 12,357 | | | 11,432 | | | 10,571 | | | 10,239 | |
| | | | | | | | | | | | | | | | | | |
| | | | | | | | | | | | | | | | | | | | | | | | | | |
Operating expenses: | | | | | | | | | | | | | | | | | | | | | | | | | |
Sales and marketing | | | 10,876 | | | 10,832 | | | 9,085 | | | 8,835 | | | 8,676 | | | 7,226 | | | 6,537 | | | 7,005 | |
Research and development | | | 5,515 | | | 5,167 | | | 5,051 | | | 5,079 | | | 4,423 | | | 4,153 | | | 3,505 | | | 3,041 | |
General and administrative | | | 5,064 | | | 4,008 | | | 3,782 | | | 3,854 | | | 3,203 | | | 2,739 | | | 2,567 | | | 2,302 | |
Sublease termination income(1) | | | — | | | — | | | — | | | — | | | — | | | — | | | — | | | (839 | ) |
| | | | | | | | | | | | | | | | | | |
| | | | | | | | | | | | | | | | | | | | | | | | | | |
Total operating expenses | | | 21,455 | | | 20,007 | | | 17,918 | | | 17,768 | | | 16,302 | | | 14,118 | | | 12,609 | | | 11,509 | |
| | | | | | | | | | | | | | | | | | |
| | | | | | | | | | | | | | | | | | | | | | | | | | |
Loss from operations | | | (6,254 | ) | | (5,702 | ) | | (2,259 | ) | | (5,276 | ) | | (3,945 | ) | | (2,686 | ) | | (2,038 | ) | | (1,270 | ) |
Other (expense) income: | | | | | | | | | | | | | | | | | | | | | | | | | |
Interest expense | | | — | | | — | | | (2 | ) | | (462 | ) | | 39 | | | (46 | ) | | (237 | ) | | (438 | ) |
Other (expense) income and (losses) gains | | | 17 | | | (45 | ) | | 32 | | | (6 | ) | | (14 | ) | | (19 | ) | | 15 | | | (13 | ) |
| | | | | | | | | | | | | | | | | | |
| | | | | | | | | | | | | | | | | | | | | | | | | | |
Loss before provision for income taxes | | | (6,237 | ) | | (5,747 | ) | | (2,229 | ) | | (5,744 | ) | | (3,920 | ) | | (2,751 | ) | | (2,260 | ) | | (1,721 | ) |
Provision for income taxes | | | 40 | | | 39 | | | 49 | | | 46 | | | 128 | | | — | | | — | | | — | |
| | | | | | | | | | | | | | | | | | |
| | | | | | | | | | | | | | | | | | | | | | | | | | |
Net loss | | $ | (6,277 | ) | $ | (5,786 | ) | $ | (2,278 | ) | $ | (5,790 | ) | $ | (4,048 | ) | $ | (2,751 | ) | $ | (2,260 | ) | $ | (1,721 | ) |
| | | | | | | | | | | | | | | | | | |
| | | | | | | | | | | | | | | | | | | | | | | | | | |
| | | | | | | | | | | | | | | | | | | | | | | | | | |
| | | | | | | | | | | | | | | | | | |
53
Table of Contents
| | | | | | | | | | | | | | | | | | | | | | | | | |
| | Quarter Ended | |
|---|
| | January 31,
2014 | | October 31,
2013 | | July 31,
2013 | | April 30,
2013 | | January 31,
2013 | | October 31,
2012 | | July 31,
2012 | | April 30,
2012 | |
|---|
| | (unaudited)
| |
|---|
| | (in thousands)
| |
|---|
Revenue: | | | | | | | | | | | | | | | | | | | | | | | | | |
Subscription and support | | | 78 | % | | 79 | % | | 72 | % | | 83 | % | | 80 | % | | 77 | % | | 77 | % | | 73 | % |
Perpetual license | | | 8 | | | 5 | | | 14 | | | 4 | | | 10 | | | 9 | | | 10 | | | 13 | |
| | | | | | | | | | | | | | | | | | |
| | | | | | | | | | | | | | | | | | | | | | | | | | |
Total product revenue | | | 86 | | | 84 | | | 86 | | | 87 | | | 90 | | | 86 | | | 87 | | | 86 | |
Professional services | | | 14 | | | 16 | | | 14 | | | 13 | | | 10 | | | 14 | | | 13 | | | 14 | |
| | | | | | | | | | | | | | | | | | |
| | | | | | | | | | | | | | | | | | | | | | | | | | |
Total revenue | | | 100 | | | 100 | | | 100 | | | 100 | | | 100 | | | 100 | | | 100 | | | 100 | |
| | | | | | | | | | | | | | | | | | |
| | | | | | | | | | | | | | | | | | | | | | | | | | |
Cost of revenue: | | | | | | | | | | | | | | | | | | | | | | | | | |
Product | | | 11 | | | 10 | | | 9 | | | 10 | | | 9 | | | 9 | | | 9 | | | 9 | |
Professional services | | | 12 | | | 14 | | | 12 | | | 12 | | | 11 | | | 13 | | | 13 | | | 12 | |
| | | | | | | | | | | | | | | | | | |
| | | | | | | | | | | | | | | | | | | | | | | | | | |
Total cost of revenue | | | 23 | | | 24 | | | 21 | | | 22 | | | 20 | | | 22 | | | 22 | | | 21 | |
| | | | | | | | | | | | | | | | | | |
| | | | | | | | | | | | | | | | | | | | | | | | | | |
Gross profit | | | 77 | | | 76 | | | 79 | | | 78 | | | 80 | | | 78 | | | 78 | | | 79 | |
| | | | | | | | | | | | | | | | | | |
| | | | | | | | | | | | | | | | | | | | | | | | | | |
Operating expenses: | | | | | | | | | | | | | | | | | | | | | | | | | |
Sales and marketing | | | 55 | | | 58 | | | 46 | | | 55 | | | 56 | | | 49 | | | 48 | | | 54 | |
Research and development | | | 28 | | | 27 | | | 25 | | | 32 | | | 29 | | | 28 | | | 26 | | | 23 | |
General and administrative | | | 26 | | | 21 | | | 19 | | | 24 | | | 20 | | | 19 | | | 19 | | | 18 | |
Sublease termination income(1) | | | — | | | — | | | — | | | — | | | — | | | — | | | — | | | (6 | ) |
| | | | | | | | | | | | | | | | | | |
| | | | | | | | | | | | | | | | | | | | | | | | | | |
Total operating expenses | | | 109 | | | 106 | | | 90 | | | 111 | | | 105 | | | 96 | | | 93 | | | 89 | |
| | | | | | | | | | | | | | | | | | |
| | | | | | | | | | | | | | | | | | | | | | | | | | |
Loss from operations | | | (32 | ) | | (30 | ) | | (11 | ) | | (33 | ) | | (25 | ) | | (18 | ) | | (15 | ) | | (10 | ) |
Other (expense) income: | | | | | | | | | | | | | | | | | | | | | | | | | |
Interest expense | | | — | | | — | | | — | | | (3 | ) | | — | | | (1 | ) | | (2 | ) | | (3 | ) |
Other (expense) income and (losses) gains | | | — | | | — | | | — | | | — | | | — | | | — | | | — | | | — | |
| | | | | | | | | | | | | | | | | | |
| | | | | | | | | | | | | | | | | | | | | | | | | | |
Loss before provision for income taxes | | | (32 | ) | | (30 | ) | | (11 | ) | | (36 | ) | | (25 | ) | | (19 | ) | | (17 | ) | | (13 | ) |
Provision for income taxes | | | — | | | — | | | — | | | — | | | 1 | | | — | | | — | | | — | |
| | | | | | | | | | | | | | | | | | |
| | | | | | | | | | | | | | | | | | | | | | | | | | |
Net loss | | | (32 | )% | | (30 | )% | | (11 | )% | | (36 | )% | | (26 | )% | | (19 | )% | | (17 | )% | | (13 | )% |
| | | | | | | | | | | | | | | | | | |
| | | | | | | | | | | | | | | | | | | | | | | | | | |
| | | | | | | | | | | | | | | | | | | | | | | | | | |
| | | | | | | | | | | | | | | | | | |
- (1)
- In April 2012, the sublease for our corporate headquarters was terminated as a result of the sale of the building by the building's owner. The transaction was deemed a termination of the original lease and we derecognized the remaining deferred rent expense.
Seasonality and Quarterly Trends
Our customers tend to follow budgeting cycles, buying solutions at the beginning and end of a calendar year. We tend to experience some seasonality associated with bookings, perpetual license revenue and cash flow from operations in the first and fourth quarters of each fiscal year. Our cash flow from operations has historically been higher in the first quarter of each fiscal year than in other quarters. We generally do not experience seasonality associated with subscription and support revenue due to the fact we recognize subscription and support revenue ratably over the term of the contract or support period.
54
Table of Contents
Liquidity and Capital Resources
| | | | | | | | | | |
| | Fiscal Year Ended January 31, | |
|---|
| | 2014 | | 2013 | | 2012 | |
|---|
| | (in thousands)
| |
|---|
Net cash provided by (used in) operating activities | | $ | (18,478 | ) | $ | 1,821 | | $ | (1,704 | ) |
Net cash used in investing activities | | | (6,820 | ) | | (2,813 | ) | | (1,925 | ) |
Net cash provided by (used in) financing activities | | | 96,580 | | | (851 | ) | | 18,515 | |
| | | | | | | | |
| | | | | | | | | | | |
Net increase (decrease) in cash and cash equivalents | | $ | 71,282 | | $ | (1,843 | ) | $ | 14,886 | |
| | | | | | | | |
| | | | | | | | | | | |
| | | | | | | | | | | |
| | | | | | | | |
| | | | | | | | | | |
| | Fiscal Year Ended January 31, | |
|---|
| | 2014 | | 2013 | | 2012 | |
|---|
| | (in thousands)
| |
|---|
Cash and cash equivalents | | $ | 88,891 | | $ | 17,609 | | $ | 19,452 | |
| | | | | | | | |
| | | | | | | | | | | |
| | | | | | | | | | | |
| | | | | | | | |
To date, we have financed our operations primarily through sales of our capital stock, including through our initial public offering, and to a lesser extent, borrowing on our credit facilities.
At January 31, 2014, our cash and cash equivalents of $88.9 million were held for working capital purposes. We believe that our cash and cash equivalents will be sufficient to meet our anticipated cash needs for at least the next twelve months. Our future capital requirements will depend on many factors, including our growth rate, the timing and extent of spending to support research and development efforts, the expansion of sales and marketing activities, particularly internationally, and the introduction of new and enhanced solutions and professional service offerings. In the event that additional financing is required from outside sources, we may be unable to raise the funds on acceptable terms, if at all. If we are unable to raise additional capital when desired, our business, operating results and financial condition could be adversely affected.
Loan and Security Agreement
Through January 31, 2014, we maintained a loan and security agreement with Square 1 Bank with a maximum borrowing availability of $12.0 million, of which $3.0 million was available for our corporate credit card line and letters of credit. On February 1, 2014, we allowed the line of credit to expire and it was not renewed. At January 31, 2014 and 2013, the amount available under the loan and security agreement, considering the borrowing base calculation, was $12.0 million. At January 31, 2013, we had a letter of credit outstanding for $2.5 million that reduced the amount available pursuant to the revolving line of credit to $9.5 million. The letter of credit represented the security deposit associated with the ten-year operating lease commitment we executed in the first quarter of fiscal 2013. In September 2013, as required by our amended and restated office lease described more fully below, we placed $4.2 million in a bank account that is pledged to the landlord as a security deposit. The restricted cash is reflected as restricted long-term cash on our balance sheet and replaces the former security deposit, which was a $2.5 million letter of credit that has been cancelled.
No amounts were outstanding on the revolving line of credit as of January 31, 2014 and 2013, respectively. Advances under the loan and security agreement bore interest at the prime rate then in effect plus 3.00%, with a floor of 5.25%.
The loan was secured by substantially all of our assets and included a restriction on our ability to pledge our intellectual property. The loan and security agreement included financial covenants and other customary affirmative and negative covenants. The primary financial covenant was an adjusted quick ratio. The adjusted quick ratio was defined as the cash at the bank plus accounts receivable less than 90 days old from invoice date as compared to current liabilities excluding deferred revenue. We were required to maintain an adjusted quick ratio of at least 1.10 to 1.00. Other restrictive covenants
55
Table of Contents
under the loan and security agreement included covenants with respect to creating liens on our assets, incurring additional debt, paying dividends or making other distributions, making investments, consummating certain mergers or acquisitions, making payments on subordinate debt, entering into certain transactions with affiliates, transferring funds to other financial institutions and effecting sales or other dispositions of our assets or business without the prior consent of Square 1 Bank. We were in compliance with our covenants as of January 31, 2014 and 2013. The loan and security agreement also contained usual and customary events of default (subject to certain threshold amounts and grace periods) on the occurrence of events such as nonpayment of amounts due under the loan and security agreement, violation of the restrictive covenants referred to above, violation of other contractual provisions, a material adverse change in our business, attachment of our assets, our insolvency or certain other events.
Components of Liquidity and Capital Resources
Operating Activities
For fiscal 2014, cash used in operating activities was $18.5 million, which reflects our net loss of $20.1 million, adjusted by non-cash charges of $7.6 million consisting primarily of $4.5 million for stock-based compensation, $0.5 million for the change in valuation of preferred stock warrants, and $2.7 million for depreciation and amortization. Sources of cash outflows were from fluctuations in our working capital of $5.9 million. The favorable fluctuations in our working capital were attributable to an increase in deferred revenue as a result of an increase in sales, which was offset by an increase in accounts receivable. The favorable fluctuations were also attributable to an increase in accounts payable and accrued liabilities primarily related to employee related compensation accruals such as a severance obligation accrual and withholding for our 2013 Employee Stock Purchase Plan. The favorable fluctuations were offset by an increase in prepaid expenses and other current assets primarily related to payment timing and an increase in headcount and infrastructure capacity. We used $4.2 million, which is reflected as restricted long-term cash on our balance sheet, to fund a security deposit for our new building. This security deposit replaced the former security deposit, which was a $2.5 million letter of credit that has been cancelled. Our days sales outstanding were 75 days at January 31, 2014 compared to 62 days at January 31, 2013.
For fiscal 2013, cash provided by operating activities was $1.8 million, which reflects our net loss of $10.8 million, adjusted by non-cash charges of $2.7 million consisting primarily of $0.9 million for stock-based compensation, $0.7 million for the change in valuation of preferred stock warrants, and $1.9 million for depreciation and amortization, partially offset by $0.8 million in non-cash income related to the early termination of our sublease. Sources of cash inflows were from fluctuations in our working capital of $9.9 million. The fluctuations in our working capital were primarily attributable to an increase in deferred revenue as a result of an increase in sales, which was partially offset by an increase in accounts receivable. The fluctuations were also partially attributable to an increase in accounts payable and accrued liabilities primarily related to employee related compensation accruals, and an increase in deferred rent expense primarily due to an $0.8 million lease incentive payment we received in connection with entering into our new ten-year lease for our corporate headquarters, which were partially offset by an increase in prepaid expenses and other current assets primarily related to payment timing and an increase in headcount that required us to purchase additional seats and licenses for subscription software. Our days sales outstanding were 62 days at January 31, 2013 compared to 66 days at January 31, 2012.
For fiscal 2012, cash used in operating activities was $1.7 million, which reflects our net loss of $11.6 million, adjusted by non-cash charges of $2.9 million consisting primarily of $0.6 million for stock-based compensation, $1.9 million for depreciation and amortization, $0.1 million for a non-cash charitable contribution and $0.3 million for the change in valuation of preferred stock warrants. Sources of cash inflows were from fluctuations in our working capital of $7.0 million. The fluctuations in our working capital were primarily attributable to an increase in accounts receivable with a correspondingly larger increase in deferred revenue as a result of new sales. Our days sales outstanding were 66 days at January 31, 2012 compared to 68 days at January 31, 2011.
56
Table of Contents
A significant portion of our subscription renewals are invoiced in December and January of each year, which under our typical customer payment terms generally creates positive cash flow from operations in the first quarter of each fiscal year, which is, in turn, historically offset in subsequent quarters, resulting in cash used in operations for the full fiscal year. Historically, cash flow from operations has been negative in the second quarter through the fourth quarter of a fiscal year. We used $3.3 million, $8.7 million and $7.9 million in cash flow from operations in the second, third and fourth quarter of fiscal 2014, respectively. Our cash used in operations increased by $3.5 million from fiscal 2012 to fiscal 2013 and decreased $20.3 million from fiscal 2013 to fiscal 2014. Our headcount increased from 285 at the end of fiscal 2012 to 360 at the end of fiscal 2013 to 458 as of January 31, 2014. We expect to continue to make investments in headcount, and our ability to consistently generate positive cash flow from operations for a full fiscal year will depend on revenue and the resulting cash receipts increasing at a rate that is faster than our on-going investment in personnel, facilities and our systems.
Investing Activities
Our investing activities consist primarily of capital expenditures to purchase computer equipment and software, furniture and fixtures, as well as leasehold improvements and business combinations. In the future, we expect to continue to invest in capital expenditures to support our expanding operations and seek complimentary, accretive acquisitions.
During fiscal 2014, cash used in investing activities of $6.8 million was attributable to capital expenditures for computer hardware primarily to support our increase in headcount during the period and data center hardware to support our growth during the period and the acquisition of Flowdock Oy.
During fiscal 2013, cash used in investing activities of $2.8 million was attributable to capital expenditures for computer hardware primarily to support our increase in headcount during the period and data center hardware to support our growth during the period and the acquisition of Agile Advantage, Inc.
During fiscal 2012, cash used in investing activities of $1.9 million was attributable to capital expenditures for hardware and software for our data centers to support our growth as well as computer hardware and leasehold improvements attributable to our increase in headcount and our move into our new corporate office. We received a payment from our sub-landlord to reimburse us for leasehold improvements expenditures that we incurred, which is classified within cash flow from operations.
Financing Activities
Our financing activities consist primarily of proceeds from the sale of common stock in our initial public offering and follow-on public offering, offset by payments for offering costs associated with both offerings, preferred stock private placements, proceeds from debt financing offset by debt repayments, and proceeds from the exercises of common stock options offset by a disbursement associated with a preferred stock repurchase and capital lease payments.
During fiscal 2014, cash provided by financing activities of $96.6 million was attributable to $89.8 million of proceeds from our initial public offering, net of underwriting discounts and commissions but before offering expenses, $5.9 million of proceeds from our follow-on public offering, net of underwriting discounts and commissions but before offering expenses, and $1.2 million of proceeds from common stock option exercises and $1.9 million of proceeds from our 2013 Employee Stock Purchase Plan partially offset by approximately $2.3 million of offering costs.
During fiscal 2013, cash used in financing activities of $0.9 million was attributable to $0.4 million in proceeds from common stock option exercises offset by $1.3 million in deferred offering costs related to our pending initial public offering.
57
Table of Contents
During fiscal 2012, cash provided by financing activities of $18.5 million was attributable to proceeds from the closing of our Series E preferred stock financing of $19.9 million, net of offering costs, and $0.1 million from the exercise of common stock options partially offset by a payment representing a preferred stock repurchase of $1.4 million and $0.1 million in payments on our capital lease obligations.
Contractual Payment Obligations
The following summarizes our contractual commitments and obligations as of January 31, 2014:
| | | | | | | | | | | | | | | | |
| | Payment Due by Period | |
|---|
| | Total | | 1 Year | | 1 - 3 Years | | 3 - 5 Years | | More than
5 Years | |
|---|
| | (in thousands)
| |
|---|
Operating lease obligations | | $ | 49,949 | | $ | 2,730 | | $ | 8,789 | | $ | 8,939 | | $ | 29,491 | |
| | | | | | | | | | | | |
| | | | | | | | | | | | | | | | | |
| | | | | | | | | | | | | | | | | |
| | | | | | | | | | | | |
On June 10, 2013, we entered into an amended and restated office lease, which superseded and replaced our lease for our corporate headquarters located in Boulder, Colorado. In addition to the office space we currently occupy, the amended and restated office lease provides for the lease by us of an additional 89,000 square feet of office space in a building to be constructed adjacent to our current office space.
The initial term of the amended and restated office lease is ten years and will commence upon the occupancy date of the new building, currently expected to be on or about June 1, 2015, and extend through May 31, 2025, in each case subject to change based on the construction schedule. The lease term for the current office space has been extended to end contemporaneously with the end of the initial term for the amended and restated office lease. We have the option to extend the term of the lease for two periods of five years each.
Off-Balance Sheet Arrangements
During fiscal 2014, 2013 and 2012, we did not have any relationships with unconsolidated financial partnerships, such as structured finance or special-purpose entities, that would have been established for the purpose of facilitating off-balance sheet arrangements or other contractually narrow or limited purposes.
Critical Accounting Policies
We prepare our consolidated financial statements in accordance with generally accepted accounting principles in the United States. The preparation of consolidated financial statements also requires us to make estimates and assumptions that affect the reported amounts of assets, liabilities, revenue, costs and expenses and related disclosures. We base our estimates on historical experience and on various other assumptions that we believe to be reasonable under the circumstances. Actual results could differ significantly from the estimates made by our management. To the extent that there are differences between our estimates and actual results, our future financial statement presentation, financial condition, results of operations and cash flows will be affected. We believe that the accounting policies discussed below are critical to understanding our historical and future performance, as these policies relate to the more significant areas involving management's judgments and estimates.
The following critical accounting policies reflect significant judgments and estimates used in the preparation of our consolidated financial statements:
- •
- revenue recognition and deferred revenue;
- •
- stock-based compensation;
58
Table of Contents
- •
- capitalized software costs; and
- •
- income taxes.
Revenue Recognition and Deferred Revenue
Revenue Recognition. We generate revenue primarily from three sources: (1) subscription and support; (2) perpetual licenses; and (3) professional services.
Revenue is recognized when all of the following conditions have been met:
- •
- there is persuasive evidence of an arrangement;
- •
- the service has been provided or the product has been delivered;
- •
- the price is fixed or determinable; and
- •
- collection of the fees is sufficiently assured.
Signed agreements, which may include purchase orders, are used as evidence of an arrangement. In cases where both a signed contract and a purchase order exist, we consider the signed contract to be persuasive evidence of the arrangement. Product delivery occurs when we provide the customer with access to the software via an electronic notification or license key. We assess whether a fee is fixed or determinable at the outset of the arrangement, primarily based on the payment terms associated with the transaction. We assess collectability of the fee based on a number of factors such as collection history and creditworthiness of the customer. If we determine that collectability is not sufficiently assured, revenue is deferred until collectability becomes sufficiently assured, generally upon receipt of cash.
Subscription and support revenue is recognized ratably over the contract term beginning on the commencement date of each contract.
When multiple deliverables included in an arrangement are separable into different units of accounting, the arrangement consideration is allocated to the identified separate units of accounting based on their relative selling prices. Multiple deliverable arrangement accounting guidance provides a hierarchy to use when determining the relative selling price for each unit of accounting. This guidance provides that vendor-specific objective evidence, or VSOE, of selling price, based on the price at which the item is regularly sold by the vendor on a stand-alone basis, should be used if it exists. We use VSOE to determine the stand-alone selling prices of subscription, hosting, maintenance and professional services because substantially all separate sales of these deliverables fall within a reasonable range of prices. All unique product offerings are grouped based upon size of customer as a result of our tiered volume pricing. VSOE for professional services is determined regardless of customer size as customer size does not significantly impact the prices charged. We have concluded that all products and services for each single unit of accounting have VSOE, other than perpetual licenses discussed below.
We monitor compliance with VSOE by using a bell curve approach. Sales of subscription, hosting, maintenance and professional services are analyzed to determine whether 80% of the transactions are within plus or minus 15% of the median of the transactions for an appropriate group of customers.
When VSOE exists for all undelivered elements of the contract, perpetual license fee revenue is generally recognized upon delivery of the software product to the customer, provided the other conditions above are met. We have established VSOE for all undelivered elements of our perpetual license arrangements. Maintenance revenue consists of fees for providing unspecified software updates on a when and if available basis and technical support for software products. Hosting revenue relates to fees for hosting the software the customer has purchased at our data centers. Our perpetual license customers who purchase hosting have the right to take possession of the software at any time. Hosting
59
Table of Contents
and maintenance revenue as well as enhanced support is recognized ratably over the term of the agreement.
Professional services revenue is accounted for separately from subscription and perpetual license revenue when they have VSOE and, for subscriptions, stand-alone value to the customer. Professional services are generally provided on a time-and-materials basis. The services that are provided on a time-and-materials basis are recognized as services are provided. However, professional services that do not have stand-alone value to the customer are recognized ratably over the remaining subscription period.
Deferred Revenue. Our deferred revenue comprises unrecognized subscription and support, which includes hosting and maintenance, perpetual licenses, tool training, enhanced support and prepaid professional services revenue. With the exception of perpetual licenses, these arrangements are initially recorded as deferred revenue upon the commencement of the subscription and maintenance period, and revenue is recognized in the consolidated statements of operations ratably over the term of the arrangement. Perpetual licenses are generally recognized upon delivery of the software product to the customer. Prepaid professional services arrangements are recorded initially as deferred revenue and are recognized when the services are performed.
Stock-Based Compensation
We account for stock-based compensation in accordance with the authoritative guidance on stock compensation. Under the fair value recognition provisions of this guidance, stock-based compensation is measured at the grant date based on the fair value of the award and is recognized as expenses, net of estimated forfeitures, over the requisite service period, which is generally the vesting period of the respective award.
Determining the fair value of stock-based awards at the grant date requires judgment. We use the Black-Scholes option-pricing model to determine the fair value of stock options. The determination of the grant date fair value of options using an option-pricing model is affected by our estimated common stock fair value as well as assumptions regarding a number of other complex and subjective variables. These variables include the fair value of our common stock, the expected term of the options, our expected stock price volatility, risk-free interest rates, and expected dividends, which are estimated as follows:
- •
- Fair value of our common stock. Because our stock was not publicly traded prior to our initial public offering, we estimated the fair value of common stock, as discussed in "—Common Stock Valuations" below. Following our initial public offering in April 2013, our common stock was valued by reference to its publicly-traded price.
- •
- Expected term. The expected term represents the period that our stock-based awards are expected to be outstanding. As we do not have sufficient historical experience for determining the expected term of the stock option awards granted, we have based our expected term on historical exercise patterns.
- •
- Expected volatility. The expected stock price volatility for our common stock was estimated by taking the average historic price volatility for industry peers based on daily price observations over a period equivalent to the expected term of the stock option grants. We did not rely on implied volatilities of traded options in our industry peers' common stock because the volume of activity was relatively low. We intend to continue to consistently apply this process using the same or similar public companies until a sufficient amount of historical information regarding the volatility of our own common stock share price becomes available.
- •
- Risk-free rate. The risk-free interest rate is based on the yields of U.S. Treasury securities with maturities similar to the expected term of the options for each option group.
60
Table of Contents
- •
- Dividend yield. We have never declared or paid any cash dividends and do not presently plan to pay cash dividends in the foreseeable future. Consequently, we used an expected dividend yield of zero.
If any of the assumptions used in the Black-Scholes model change significantly, stock-based compensation for future awards may differ materially compared with the awards granted previously.
The following table presents the weighted-average assumptions used to estimate the fair value of options granted during the periods presented:
| | | | | | |
| | Fiscal Year Ended January 31, |
|---|
| | 2014 | | 2013 | | 2012 |
|---|
Risk-free interest rate | | 1.01% - 1.94% | | 0.79% - 1.40% | | 1.08% - 2.70% |
Expected life | | 5.27 - 6.08 years | | 5.91 - 6.08 years | | 5.69 - 6.08 years |
Expected dividend yield | | — | | — | | — |
Expected volatility | | 48.3% - 56.8% | | 57.9% - 59.9% | | 58.3% - 59.2% |
The following weighted average assumptions were used to calculate our stock-based compensation for each stock purchase right granted under our 2013 Employee Stock Purchase Plan, which became effective on April 11, 2013:
| | |
| | Fiscal Year Ended
January 31, 2014 |
|---|
Expected volatility | | 45.6% |
Expected life | | 0.67 - 1.17 years |
Risk-free interest rate | | 0.09% - 0.11% |
Expected dividend yield | | — |
Common Stock Valuations
Prior to our initial public offering, the fair value of the common stock underlying our stock options was determined by our Board of Directors, which intended that all options granted have an exercise price that is not less than the estimated fair value of a share of our common stock underlying those options on the date of grant. The valuations of our common stock were determined in accordance with the guidelines outlined in the American Institute of Certified Public Accountants Practice Aid,Valuation of Privately-Held-Company Equity Securities Issued as Compensation. The assumptions we used in the valuation model were based on future expectations combined with management judgment. In the absence of a public trading market, our Board of Directors, with input from management, exercised significant judgment and considered numerous objective and subjective factors to determine the fair value of our common stock as of the date of each option grant, including the following factors:
- •
- contemporaneous third-party valuations performed at periodic intervals by a valuation firm;
- •
- the prices, rights, preferences and privileges of our preferred stock relative to the common stock;
- •
- the purchases of shares of preferred stock by unaffiliated venture capital firms;
- •
- our operating and financial performance and forecast;
- •
- current business conditions;
- •
- significant new customer wins;
- •
- the hiring of key personnel;
- •
- our stage of development;
61
Table of Contents
- •
- the likelihood of achieving a liquidity event for the shares of common stock underlying these stock options, such as an initial public offering or sale of our company, given prevailing market conditions;
- •
- any adjustment necessary to recognize a lack of marketability for our common stock;
- •
- the market performance of comparable publicly-traded technology companies; and
- •
- the U.S. and global capital market conditions.
In order to determine the fair value of our common stock underlying option grants prior to our initial public offering, we considered contemporaneous valuations of our stock from an independent valuation firm that provided us with their estimation of our enterprise value and the allocation of that value to each element of our capital structure (preferred stock, common stock, warrants and options). For stock options granted in February 2011, our enterprise value was estimated using the market-based approach and, within the market-based approach, the comparable company method and the recent transaction method. The market-based approach considers multiples of financial metrics based on both acquisitions and trading multiples of a selected peer group of technology companies.
A database of all publically traded companies was screened to determine a broad industry sector and potential peer-group companies. This initial screen selected companies that primarily operated in the information technology software and services industry and that (i) traded on one of the major U.S. stock exchanges, (ii) traded at a common per share value of greater than one dollar, and (iii) exhibited average six month daily trading volume of greater than 50,000 shares. From this industry sector list, comparable companies were selected based on several factors, including business description, business model, primary industry and revenue growth. More specifically, the comparable company selection focused on companies that provide cloud-based offerings. Furthermore, companies with historical and projected revenue growth comparable to that of Rally were selected.
The selected group of comparable companies was consistently used in both the market and income approaches. Additionally, this same comparable company group was partially relied upon in determining appropriate multiples in the initial public offering scenario of the probability-weighted expected return model, or PWERM, described more fully below. Where relevant, the comparable company group was held constant in determining per share value for all equity classes. For the March 31, 2012 valuation completed in May 2012, the comparable companies were reassessed due to changes in our outlook and industry. Two of the ten comparable companies were changed. The only other changes to the comparable companies occurred when companies were acquired. In such instances, where data was available, these companies were included in the recent transaction method of the market-based approach.
For stock options granted in or after August 2011 and prior to our initial public offering, our Board of Directors determined the best approach was to use a blend of market and income approaches to determine our enterprise value and PWERM to determine the related allocation. Future and present values for the common stock were calculated taking into consideration the preferred share liquidation and conversion rights. PWERM models potential future liquidity events and applies probabilities to each scenario. These future liquidity events are then discounted to present value and, after applying the relevant probability for each potential event, result in a probability-weighted equity value of the company.
Stock Options and Restricted Stock Units Granted Subsequent to our Initial Public Offering
For stock options and restricted stock units granted subsequent to our initial public offering, our Board of Directors determined the fair value based on the closing price of our common stock as reported on The New York Stock Exchange on the date of grant.
62
Table of Contents
Capitalized Software Costs
Our research and development efforts include both software created for our internal use as well as costs of software to be sold or marketed to customers. As such, we consider both ASC 350-40 and ASC 985-20 when accounting for our research and development costs.
ASC 350-40,Internal-Use Software, contains the following provisions: (1) preliminary project costs are expensed as incurred; (2) all costs associated with the development of the application are to be capitalized; and (3) all costs associated with the post-implementation operation of the software shall be expensed as incurred. In addition, the costs for all upgrades and enhancements to the originally developed software may be capitalized if additional functionality is added. Accordingly, we capitalize certain software development costs, including the costs to develop new solutions or significant enhancements to existing solutions, which are developed or obtained for internal use. We capitalize software development costs when application development begins, it is probable that the project will be completed, and the software will be used as intended. Such capitalized costs are amortized on a straight-line basis over the estimated useful life of the related asset, which is generally three years. Costs associated with preliminary project stage activities, training, maintenance and all post-implementation stage activities are expensed as incurred. Through January 31, 2014, we have capitalized costs of approximately $0.1 million in aggregate under ASC 350-40. It is difficult to predict the amount of Internal-Use Software that will be capitalized in the future as it is project specific and as such each project will be reviewed on a case-by-case basis.
ASC 985-20,Costs of Software to be Sold, Leased, or Marketed, contains the following provisions: (1) all costs to establish the technological feasibility shall be expensed when incurred; (2) costs of producing product masters incurred subsequent to establishing technological feasibility shall be capitalized; and (3) capitalization of computer software costs shall cease when the product is available for general release to customers. Accordingly, software development costs related to software services to be distributed and sold are capitalized once technological feasibility has been established and prior to the general availability of the solution, with amortization determined for each individual solution based on the solution's expected economic life. For all development projects subject to this accounting guidance, the costs to establish technological feasibility have been expensed as incurred. To date, all costs subsequent to technological feasibility but prior to general availability have not been material and as such we have not capitalized any costs associated with projects subject to ASC 985-20. All costs subsequent to general availability have been expensed as incurred.
Income Taxes
Income taxes are accounted for under the asset and liability method in accordance with authoritative guidance for income taxes. Deferred tax assets and liabilities are recognized for the future tax consequences attributable to differences between the financial statement carrying amounts of existing assets and liabilities and their respective tax basis and operating loss and tax credit carry forwards. Deferred tax assets and liabilities are measured using enacted tax rates expected to apply to taxable income in the years in which those temporary differences are expected to be recovered or settled. The effect on deferred tax assets and liabilities of a change in tax rates is recognized in income in the period that includes the enactment date.
We adopted the provisions of ASC 740-10,Accounting for Uncertainty in Income Tax, on February 1, 2009. There was no impact upon adoption of ASC 740-10 as we have not identified any uncertain tax positions. We have adopted the accounting policy that interest expenses and penalties relating to income tax position are classified within the provision for income taxes.
63
Table of Contents
ITEM 7A. Quantitative and Qualitative Disclosures about Market Risk
We have operations both within the United States and internationally, and we are exposed to market risks in the ordinary course of our business. These risks primarily include interest rate, foreign exchange and inflation risks, as well as risks relating to changes in the general economic conditions in the countries where we conduct business. To reduce certain of these risks, we monitor the financial condition of our large customers and also have the ability to restrict their access to our system, which generally encourages payment. The statement of operations impact is mitigated by having an offsetting liability in deferred revenue to partially or completely offset against the outstanding receivable if an account should become uncollectible. In addition, our investment strategy has been to invest in financial instruments that are highly liquid, readily convertible into cash and mature within three months from the date of purchase. To date, we have not used derivative instruments to mitigate the impact of our market risk exposures. We have also not used, nor do we intend to use, derivatives for trading or speculative purposes.
Interest Rate Risk
Our exposure to market risk for changes in interest rates primarily relates to our cash equivalents and any variable rate indebtedness.
The primary objective of our investment activities is to preserve principal while maximizing yields without significantly increasing risk. This objective is accomplished currently by making investments, consisting only of money market mutual funds, a money market bank account and certificates of deposit At January 31, 2014 and 2013, we had $50.0 million and $12.5 million, respectively, in certificates of deposits at various financial institutions, all of which are fully insured by the Federal Deposit Insurance Corporation. At January 31, 2014 was had approximately $25.4 million held in a money market mutual fund that invests primarily in short-term United States Treasury securities. Primarily all of the remaining amount of cash and cash equivalents were held in demand deposits, a certificate of deposit or a bank money market account at two financial institutions that we believe to be creditworthy.
Foreign Currency Exchange Risk
Our results of operations and cash flows are subject to fluctuations due to changes in foreign currency exchange rates. All of our customers are currently invoiced in U.S. dollars. Our expenses are generally denominated in the currencies of the countries where our operations are located, which is primarily in the United States and to a lesser extent in the United Kingdom, Australia, Canada, Finland, Singapore and other Euro-zone countries within mainland Europe. Our results of operations and cash flows are, therefore, subject to fluctuations due to changes in foreign currency exchange rates and may be adversely affected in the future due to changes in foreign currency exchange rates. The effect of a hypothetical 10% change in foreign currency exchanges rates applicable to our business would not have a material impact on our historical consolidated financial statements. To date, we have not engaged in any hedging strategies. As our international operations grow, we will continue to reassess our approach to manage our risk relating to fluctuations in foreign currency rates.
Inflation
We do not believe that inflation had a material effect on our business, financial condition or results of operations in fiscal 2014, 2013 or 2012. If our costs were to become subject to significant inflationary pressures, we may not be able to fully offset such higher costs through price increases. Our inability or failure to do so could harm our business, financial condition and results of operations.
64
Table of Contents
ITEM 8. Financial Statements and Supplementary Data
Our financial statements and the report of our independent registered public accounting firm are included in this Annual Report on Form 10-K beginning on page F-1. The index to these reports and our financial statements is included in Part IV, Item 15 below. Selected quarterly financial data is included in Item 7 under the heading Management's Discussion and Analysis of Financial Condition and Results of Operations.
ITEM 9. Changes in and Disagreements with Accountants on Accounting and Financial Disclosure
None
ITEM 9A. Controls and Procedures
Evaluation of Disclosure Controls and Procedures
We maintain "disclosure controls and procedures," as defined in Rules 13a-15(e) and 15d-15(e) under the Exchange Act, that are designed to ensure that information required to be disclosed by a company in the reports that it files or submits under the Exchange Act is recorded, processed, summarized and reported, within the time periods specified in the SEC's rules and forms. Disclosure controls and procedures include, without limitation, controls and procedures designed to ensure that information required to be disclosed by a company in the reports that it files or submits under the Exchange Act is accumulated and communicated to the company's management, including its principal executive and principal financial officers, as appropriate to allow timely decisions regarding required disclosure.
Our management, with the participation of our Chief Executive Officer and our Chief Financial Officer, evaluated the effectiveness of our disclosure controls and procedures as of January 31, 2014. Based on the evaluation of our disclosure controls and procedures as of January 31, 2014, our Chief Executive Officer and Chief Financial Officer concluded that, as of such date, our disclosure controls and procedures were effective at the reasonable assurance level.
Management's Report on Internal Control Over Financial Reporting
This Annual Report on Form 10-K does not include a report of management's assessment regarding internal control over financial reporting or an attestation report of our registered public accounting firm due to a transition period established by rules of the SEC for newly public companies.
Changes in Internal Control over Financial Reporting
There was no change in our internal control over financial reporting identified in connection with the evaluation required by Rules 13a-15(d) and 15d-15(d) of the Exchange Act that occurred during the most recent fiscal quarter that materially affected, or is reasonably likely to materially affect, our internal control over financial reporting.
Inherent Limitations on Effectiveness of Controls
Our management, including our Chief Executive Officer and Chief Financial Officer, believes that our disclosure controls and procedures and internal control over financial reporting are designed to provide reasonable assurance of achieving their objectives and are effective at the reasonable assurance level. However, our management does not expect that our disclosure controls and procedures or our internal control over financial reporting will prevent all errors and all fraud. A control system, no matter how well conceived and operated, can provide only reasonable, not absolute, assurance that the objectives of the control system are met. Further, the design of a control system must reflect the fact that there are resource constraints, and the benefits of controls must be considered relative to their
65
Table of Contents
costs. Because of the inherent limitations in all control systems, no evaluation of controls can provide absolute assurance that all control issues and instances of fraud, if any, have been detected. These inherent limitations include the realities that judgments in decision making can be faulty, and that breakdowns can occur because of a simple error or mistake. Additionally, controls can be circumvented by the individual acts of some persons, by collusion of two or more people or by management override of the controls. The design of any system of controls also is based in part upon certain assumptions about the likelihood of future events, and there can be no assurance that any design will succeed in achieving its stated goals under all potential future conditions; over time, controls may become inadequate because of changes in conditions, or the degree of compliance with policies or procedures may deteriorate. Because of the inherent limitations in a cost-effective control system, misstatements due to error or fraud may occur and not be detected.
ITEM 9B. Other Information
None
PART III
ITEM 10. Directors, Executive Officers and Corporate Governance
The information required by this Item 10 will be set forth under the headings "Proposal 1 Election of Directors," "Executive Officers," "Information Regarding the Board of Directors and Corporate Governance" and "Section 16(a) Beneficial Ownership Compliance" in the definitive Proxy Statement for our 2014 Annual Meeting of Stockholders, or the Proxy Statement and is incorporated into this report by reference.
We have adopted a written code of business conduct and ethics that applies to our directors, officers and employees, including our principal executive officer, principal financial officer, principal accounting officer and controller, or persons performing similar functions. We have posted the code of business conduct and ethics, and intend to post any amendments that may be adopted from time to time and any waivers of the requirements of the code of business conduct and ethics, on the "Investor Relations" page of our website, www.rallydev.com.
ITEM 11. Executive Compensation
The information required by this Item 11 will be set forth under the headings "Executive Compensation" and "Information Regarding the Board of Directors and Corporate Governance" in the Proxy Statement and is incorporated into this report by reference.
ITEM 12. Security Ownership of Certain Beneficial Owners and Management and Related Stockholder Matters
The information required by this Item 12 will be set forth under the headings "Security Ownership of Certain Beneficial Owners and Management" and "Securities Authorized for Issuance under the Equity Compensation Plans" in the Proxy Statement and is incorporated into this report by reference.
ITEM 13. Certain Relationships and Related Transactions, and Director Independence
The information required by this Item 13 will be set forth under the headings "Information Regarding the Board of Directors and Corporate Governance" and "Transactions with Related Persons" in the Proxy Statement and is incorporated into this report by reference.
ITEM 14. Principal Accountant Fees and Services
The information required by this Item 14 will be set forth under the headings "Proposal 2 Ratification of Selection of Independent Registered Public Accounting Firm" in the Proxy Statement and is incorporated into this report by reference.
66
Table of Contents
PART IV
ITEM 15. Exhibits and Financial Statement Schedules
- (a)
- 1. Financial Statements
Our consolidated financial statements and the Report of Independent Registered Public Accounting Firm are included herein on the pages indicated:
| | | | |
| | Page | |
|---|
Report of Independent Registered Public Accounting Firm | | | F-1 | |
Consolidated Financial Statements | | | | |
Consolidated Balance Sheets | | | F-2 | |
Consolidated Statements of Operations | | | F-3 | |
Consolidated Statements of Comprehensive Loss | | | F-4 | |
Consolidated Statements of Common Stockholders' Equity (Deficit) | | | F-5 | |
Consolidated Statements of Cash Flows | | | F-6 | |
Notes to Consolidated Financial Statements | | | F-7 | |
- 2.
- Financial Statement Schedules
All schedules are omitted as information required is inapplicable or the information is presented in the consolidated financial statements and the related notes.
- (b)
- Exhibits
A list of exhibits filed with this report or incorporated herein by reference is found in the Exhibit Index immediately following the signature page of this Annual Report on Form 10-K.
67
Table of Contents
SIGNATURES
Pursuant to the requirements of Section 13 or 15(d) of the Securities Exchange Act of 1934, the Registrant has duly caused this report to be signed on its behalf by the undersigned, thereunto duly authorized.
| | | | |
| RALLY SOFTWARE DEVELOPMENT CORP. |
By: |
|
/s/ TIMOTHY A. MILLER
Timothy A. Miller
President, Chief Executive Officer and Chairman
(Principal Executive Officer) |
|
|
Date: April 11, 2014
POWER OF ATTORNEY
KNOW ALL BY THESE PRESENTS, that each person whose signature appears below constitutes and appoints Timothy A. Miller and James M. Lejeal, and each of them, as his true and lawful attorneys-in-fact and agents, each with the full power of substitution, for him and in his name, place or stead, in any and all capacities, to sign any and all amendments to this report, with exhibits thereto and other documents in connection therewith, with the Securities and Exchange Commission, granting unto said attorneys-in-fact and agents, and each of them, full power and authority to do and perform each and every act and thing requisite and necessary to be done in and about the premises, as fully to all intents and purposes as he might or could do in person, hereby ratifying and confirming all that said attorneys-in-fact and agents, or their, his substitute or substitutes, may lawfully do or cause to be done by virtue hereof.
Pursuant to the requirements of the Securities Act of 1934, this report has been signed below by the following persons on behalf of the Registrant and in the capacities and on the dates indicated.
| | | | |
Signature | | Title | | Date |
|---|
|
|
|
|
|
/s/ TIMOTHY A. MILLER
Timothy A. Miller | | President, Chief Executive Officer and Chairman (Principal Executive Officer) | | April 11, 2014 |
/s/ JAMES M. LEJEAL
James M. Lejeal |
|
Chief Financial Officer and Treasurer (Principal Financial Officer ) |
|
April 11, 2014 |
/s/ KENNETH M. MESIKAPP
Kenneth M. Mesikapp |
|
Chief Accounting Officer, Vice President and Assistant Secretary (Principal Accounting Officer) |
|
April 11, 2014 |
/s/ THOMAS F. BOGAN
Thomas F. Bogan |
|
Director |
|
April 11, 2014 |
68
Table of Contents
| | | | |
Signature | | Title | | Date |
|---|
|
|
|
|
|
/s/ MARK T. CARGES
Mark T. Carges | | Director | | April 11, 2014 |
/s/ BRYAN D. STOLLE
Bryan D. Stolle |
|
Director |
|
April 11, 2014 |
/s/ TIMOTHY V. WOLF
Timothy V. Wolf |
|
Director |
|
April 11, 2014 |
69
Table of Contents
Report of Independent Registered Public Accounting Firm
The Board of Directors and Stockholders
Rally Software Development Corp.:
We have audited the accompanying consolidated balance sheets of Rally Software Development Corp. and subsidiaries (the Company) as of January 31, 2014 and 2013, and the related consolidated statements of operations, comprehensive loss, common stockholders' equity (deficit), and cash flows for each of the years in the three-year period ended January 31, 2014. These consolidated financial statements are the responsibility of the Company's management. Our responsibility is to express an opinion on these consolidated financial statements based on our audits.
We conducted our audits in accordance with the standards of the Public Company Accounting Oversight Board (United States). Those standards require that we plan and perform the audit to obtain reasonable assurance about whether the financial statements are free of material misstatement. An audit includes examining, on a test basis, evidence supporting the amounts and disclosures in the financial statements. An audit also includes assessing the accounting principles used and significant estimates made by management, as well as evaluating the overall financial statement presentation. We believe that our audits provide a reasonable basis for our opinion.
In our opinion, the consolidated financial statements referred to above present fairly, in all material respects, the financial position of Rally Software Development Corp. and subsidiaries as of January 31, 2014 and 2013, and the results of their operations and their cash flows for each of the years in the three-year period ended January 31, 2014, in conformity with U.S. generally accepted accounting principles.
/s/ KPMG LLP
Boulder, Colorado
April 11, 2014
F-1
Table of Contents
RALLY SOFTWARE DEVELOPMENT CORP.
Consolidated Balance Sheets
(in thousands, except share and per share data)
| | | | | | | |
| | January 31,
2014 | | January 31,
2013 | |
|---|
Assets | | | | | | | |
Current assets: | | | | | | | |
Cash and cash equivalents | | $ | 88,891 | | $ | 17,609 | |
Restricted cash, short-term | | | 16 | | | — | |
Accounts receivable, net | | | 21,771 | | | 16,318 | |
Other receivables | | | 78 | | | 288 | |
Prepaid expenses and other current assets | | | 3,310 | | | 1,912 | |
| | | | | | |
| | | | | | | | |
Total current assets | | | 114,066 | | | 36,127 | |
Property and equipment, net (note 5) | | | 5,569 | | | 3,789 | |
Goodwill | | | 2,529 | | | — | |
Intangible assets, net (note 4) | | | 1,909 | | | 367 | |
Restricted cash, long-term | | | 4,200 | | | — | |
Other assets | | | 810 | | | 1,572 | |
| | | | | | |
| | | | | | | | |
Total assets | | $ | 129,083 | | $ | 41,855 | |
| | | | | | |
| | | | | | | | |
| | | | | | | | |
| | | | | | |
Liabilities, Redeemable Convertible Preferred Stock and Stockholders' Equity (Deficit) | | | | | | | |
Current liabilities: | | | | | | | |
Accounts payable | | $ | 2,170 | | $ | 1,945 | |
Accrued liabilities (note 6) | | | 4,812 | | | 3,062 | |
Deferred revenue | | | 38,352 | | | 32,984 | |
Other current liabilities | | | 2,054 | | | 727 | |
| | | | | | |
| | | | | | | | |
Total current liabilities | | | 47,388 | | | 38,718 | |
| | | | | | |
| | | | | | | | |
Deferred revenue, net of current portion | | | 2,433 | | | 5,206 | |
Deferred rent expense, net of current portion | | | 888 | | | 939 | |
Warrants for redeemable convertible preferred stock, at estimated fair value (note 8) | | | — | | | 1,604 | |
| | | | | | |
| | | | | | | | |
Total liabilities | | | 50,709 | | | 46,467 | |
| | | | | | |
| | | | | | | | |
Commitments and contingencies | | | | | | | |
Redeemable convertible preferred stock, $0.0001 par value per share: | | | | | | | |
Series E redeemable convertible preferred stock: | | | | | | | |
At January 31, 2014 and 2013, authorized, zero and 1,600,000 shares, respectively; issued and outstanding, zero and 1,553,393 shares, respectively (liquidation value of $20,000 at January 31, 2013). | | | — | | | 19,882 | |
Series D redeemable convertible preferred stock: | | | | | | | |
At January 31, 2014 and 2013, authorized, zero and 2,247,941 shares, respectively; issued and outstanding, zero and 2,226,860 shares, respectively (liquidation value $15,850 at January 31, 2013). | | | — | | | 15,803 | |
Series A-1 redeemable convertible preferred stock: | | | | | | | |
At January 31, 2014 and 2013, authorized, zero and 3,409,977 shares, respectively; issued and outstanding, zero and 3,368,552 shares, respectively (liquidation value of $8,421 at January 31, 2013). | | | — | | | 8,395 | |
Series B redeemable convertible preferred stock: | | | | | | | |
At January 31, 2014 and 2013, authorized, zero and 2,882,062 shares, respectively; issued and outstanding, zero and 2,836,586 shares, respectively (liquidation value of $7,985 at January 31, 2013). | | | — | | | 7,957 | |
Series C redeemable convertible preferred stock: | | | | | | | |
At January 31, 2014 and 2013, authorized, zero and 4,531,291 shares, respectively; issued and outstanding, zero and 4,350,478 shares, respectively (liquidation value of $16,412 at January 31, 2013). | | | — | | | 16,373 | |
| | | | | | |
| | | | | | | | |
Total redeemable convertible preferred stock (note 9) | | | — | | | 68,410 | |
| | | | | | |
| | | | | | | | |
Stockholders' equity (deficit): | | | | | | | |
Preferred stock, $0.0001 par value per share. At January 31, 2014 and 2013, authorized, 10,000,000 and zero shares, respectively; issued and outstanding, zero shares | | | — | | | — | |
Common stock, $0.0001 par value per share. At January 31, 2014 and 2013, authorized, 200,000,000 and 50,000,000 shares, respectively; issued and outstanding, 24,786,413 and 2,398,895 shares, respectively | | | 3 | | | 1 | |
Additional paid-in capital | | | 174,027 | | | 2,503 | |
Accumulated deficit | | | (95,660 | ) | | (75,529 | ) |
Accumulated other comprehensive income | | | 4 | | | 3 | |
| | | | | | |
| | | | | | | | |
Total stockholders' equity (deficit) | | | 78,374 | | | (73,022 | ) |
| | | | | | |
| | | | | | | | |
Total liabilities, redeemable convertible preferred stock and stockholder's equity (deficit) | | $ | 129,083 | | $ | 41,855 | |
| | | | | | |
| | | | | | | | |
| | | | | | | | |
| | | | | | |
See accompanying notes to consolidated financial statements
F-2
Table of Contents
RALLY SOFTWARE DEVELOPMENT CORP.
Consolidated Statements of Operations
(in thousands, except per share data)
| | | | | | | | | | |
| | Fiscal Year Ended January 31, | |
|---|
| | 2014 | | 2013 | | 2012 | |
|---|
Revenue: | | | | | | | | | | |
Subscription and support | | $ | 57,852 | | $ | 43,794 | | $ | 31,124 | |
Perpetual license | | | 5,914 | | | 5,815 | | | 3,546 | |
| | | | | | | | |
| | | | | | | | | | | |
Total product revenue | | | 63,766 | | | 49,609 | | | 34,670 | |
Professional services | | | 10,563 | | | 7,237 | | | 6,655 | |
| | | | | | | | |
| | | | | | | | | | | |
Total revenue | | | 74,329 | | | 56,846 | | | 41,325 | |
| | | | | | | | |
| | | | | | | | | | | |
Cost of revenue(1): | | | | | | | | | | |
Product | | | 7,567 | | | 5,242 | | | 4,096 | |
Professional services | | | 9,105 | | | 7,005 | | | 5,679 | |
| | | | | | | | |
| | | | | | | | | | | |
Total cost of revenue | | | 16,672 | | | 12,247 | | | 9,775 | |
| | | | | | | | |
| | | | | | | | | | | |
Gross profit | | | 57,657 | | | 44,599 | | | 31,550 | |
| | | | | | | | |
| | | | | | | | | | | |
Operating expenses(1): | | | | | | | | | | |
Sales and marketing | | | 39,628 | | | 29,445 | | | 23,552 | |
Research and development | | | 20,812 | | | 15,121 | | | 11,074 | |
General and administrative | | | 16,708 | | | 10,810 | | | 8,170 | |
Sublease termination income (note 15) | | | — | | | (839 | ) | | — | |
| | | | | | | | |
| | | | | | | | | | | |
Total operating expenses | | | 77,148 | | | 54,537 | | | 42,796 | |
| | | | | | | | |
| | | | | | | | | | | |
Loss from operations | | | (19,491 | ) | | (9,938 | ) | | (11,246 | ) |
Other (expense) income: | | | | | | | | | | |
Interest and other income | | | 128 | | | 56 | | | 53 | |
Interest expense | | | (464 | ) | | (683 | ) | | (349 | ) |
Loss on foreign currency transactions and other gain (loss) | | | (131 | ) | | (87 | ) | | (50 | ) |
| | | | | | | | |
| | | | | | | | | | | |
Loss before provision for income taxes | | | (19,958 | ) | | (10,652 | ) | | (11,592 | ) |
Provision for income taxes | | | 173 | | | 128 | | | — | |
| | | | | | | | |
| | | | | | | | | | | |
Net loss | | | (20,131 | ) | | (10,780 | ) | | (11,592 | ) |
Accretion of redeemable convertible preferred stock | | | — | | | — | | | (22 | ) |
Preferred stock deemed dividend | | | — | | | — | | | (762 | ) |
| | | | | | | | |
| | | | | | | | | | | |
Net loss attributable to common stockholders | | $ | (20,131 | ) | $ | (10,780 | ) | $ | (12,376 | ) |
| | | | | | | | |
| | | | | | | | | | | |
| | | | | | | | | | | |
| | | | | | | | |
Net loss per common share: | | | | | | | | | | |
Basic and diluted | | $ | (1.01 | ) | $ | (5.13 | ) | $ | (6.62 | ) |
| | | | | | | | |
| | | | | | | | | | | |
| | | | | | | | | | | |
| | | | | | | | |
Weighted-average common shares outstanding: | | | | | | | | | | |
Basic and diluted | | | 19,841 | | | 2,101 | | | 1,869 | |
| | | | | | | | |
| | | | | | | | | | | |
| | | | | | | | | | | |
| | | | | | | | |
- (1)
- Includes stock-based compensation expense as follows:
| | | | | | | | | | |
| | Fiscal Year Ended
January 31, | |
|---|
| | 2014 | | 2013 | | 2012 | |
|---|
Cost of product revenue | | $ | 250 | | $ | 16 | | $ | 10 | |
Cost of professional services revenue | | | 181 | | | 27 | | | 17 | |
Sales and marketing | | | 1,316 | | | 198 | | | 124 | |
Research and development | | | 1,239 | | | 193 | | | 93 | |
General and administrative | | | 1,465 | | | 523 | | | 324 | |
| | | | | | | | |
| | | | | | | | | | | |
| | $ | 4,451 | | $ | 957 | | $ | 568 | |
| | | | | | | | |
| | | | | | | | | | | |
| | | | | | | | | | | |
| | | | | | | | |
See accompanying notes to consolidated financial statements
F-3
Table of Contents
RALLY SOFTWARE DEVELOPMENT CORP.
Consolidated Statements of Comprehensive Loss
(in thousands)
| | | | | | | | | | |
| | Fiscal Year Ended January 31, | |
|---|
| | 2014 | | 2013 | | 2012 | |
|---|
Net loss | | $ | (20,131 | ) | $ | (10,780 | ) | $ | (11,592 | ) |
Other comprehensive income (loss), net of tax: | | | | | | | | | | |
Foreign currency translation adjustments | | | 1 | | | 5 | | | (4 | ) |
| | | | | | | | |
| | | | | | | | | | | |
Comprehensive loss | | $ | (20,130 | ) | $ | (10,775 | ) | $ | (11,596 | ) |
| | | | | | | | |
| | | | | | | | | | | |
| | | | | | | | | | | |
| | | | | | | | |
See accompanying notes to consolidated financial statements
F-4
Table of Contents
RALLY SOFTWARE DEVELOPMENT CORP.
Consolidated Statements of Common Stockholders' Equity (Deficit)
(in thousands)
| | | | | | | | | | | | | | | | | | | |
| | Common Stock | |
| | Accumulated
Other
Comprehensive
Income (Loss) | |
| | Total
Stockholders'
Equity
(Deficit) | |
|---|
| | Additional
Paid-In
Capital | | Accumulated
Deficit | |
|---|
| | Shares | | Amount | |
|---|
Balance, February 1, 2011 | | | 1,786 | | $ | 1 | | $ | 1,021 | | $ | 2 | | $ | (53,157 | ) | $ | (52,133 | ) |
Deemed dividend in connection with purchase and cancellation of preferred stock | | | — | | | — | | | (762 | ) | | — | | | — | | | (762 | ) |
Common stock issued in connection with stock incentive plans | | | 190 | | | — | | | 152 | | | — | | | — | | | 152 | |
Estimated fair value of warrant issued as a charitable contribution | | | — | | | — | | | 122 | | | — | | | — | | | 122 | |
Share-based compensation | | | — | | | — | | | 568 | | | — | | | — | | | 568 | |
Preferred stock cost accretion | | | — | | | — | | | (22 | ) | | — | | | — | | | (22 | ) |
Net loss | | | — | | | — | | | — | | | — | | | (11,592 | ) | | (11,592 | ) |
Other comprehensive loss | | | — | | | — | | | — | | | (4 | ) | | — | | | (4 | ) |
| | | | | | | | | | | | | | |
| | | | | | | | | | | | | | | | | | | | |
Balance, January 31, 2012 | | | 1,976 | | | 1 | | | 1,079 | | | (2 | ) | | (64,749 | ) | | (63,671 | ) |
Common stock issued in connection with stock incentive plans | | | 423 | | | — | | | 467 | | | — | | | — | | | 467 | |
Share-based compensation | | | — | | | — | | | 957 | | | — | | | — | | | 957 | |
Net loss | | | — | | | — | | | — | | | — | | | (10,780 | ) | | (10,780 | ) |
Other comprehensive income | | | — | | | — | | | — | | | 5 | | | — | | | 5 | |
| | | | | | | | | | | | | | |
| | | | | | | | | | | | | | | | | | | | |
Balance, January 31, 2013 | | | 2,399 | | | 1 | | | 2,503 | | | 3 | | | (75,529 | ) | | (73,022 | ) |
Common stock issued in connection with stock incentive plans | | | 617 | | | — | | | 3,117 | | | — | | | — | | | 3,117 | |
Estimated fair value of common stock issued as partial consideration to acquire Flowdock Oy | | | 120 | | | — | | | 1,293 | | | — | | | — | | | 1,293 | |
Issuance of common stock upon initial public offering, net of issuance costs | | | 6,900 | | | 1 | | | 86,954 | | | — | | | — | | | 86,955 | |
Conversion of preferred stock to common stock upon initial public offering | | | 14,336 | | | 1 | | | 68,409 | | | — | | | — | | | 68,410 | |
Reclassification of preferred stock warrant liability into additional paid-in capital upon initial public offering | | | — | | | — | | | 2,066 | | | — | | | — | | | 2,066 | |
Cashless exercise of common stock warrants upon initial public offering | | | 47 | | | — | | | — | | | — | | | — | | | — | |
Cashless exercise of common stock warrants | | | 107 | | | — | | | — | | | — | | | — | | | — | |
Lapse of vesting restrictions on restricted stock. | | | 10 | | | — | | | — | | | — | | | — | | | — | |
Issuance of common stock upon follow-on offering, net of issuance costs | | | 250 | | | — | | | 5,234 | | | — | | | — | | | 5,234 | |
Share-based compensation | | | — | | | — | | | 4,451 | | | — | | | — | | | 4,451 | |
Net loss | | | — | | | — | | | — | | | — | | | (20,131 | ) | | (20,131 | ) |
Other comprehensive income (loss) | | | — | | | — | | | — | | | 1 | | | — | | | 1 | |
| | | | | | | | | | | | | | |
| | | | | | | | | | | | | | | | | | | | |
Balance, January 31, 2014 | | | 24,786 | | $ | 3 | | $ | 174,027 | | $ | 4 | | $ | (95,660 | ) | $ | 78,374 | |
| | | | | | | | | | | | | | |
| | | | | | | | | | | | | | | | | | | | |
| | | | | | | | | | | | | | | | | | | | |
| | | | | | | | | | | | | | |
See accompanying notes to consolidated financial statements
F-5
Table of Contents
RALLY SOFTWARE DEVELOPMENT CORP.
Consolidated Statements of Cash Flows
(in thousands)
| | | | | | | | | | |
| | Fiscal Year Ended January 31, | |
|---|
| | 2014 | | 2013 | | 2012 | |
|---|
Cash flow from operating activities: | | | | | | | | | | |
Net loss | | $ | (20,131 | ) | $ | (10,780 | ) | $ | (11,592 | ) |
Adjustments to reconcile net loss to net cash provided by (used in) operating activities: | | | | | | | | | | |
Depreciation and amortization | | | 2,686 | | | 1,893 | | | 1,863 | |
Noncash share-based compensation expense | | | 4,451 | | | 957 | | | 568 | |
Noncash interest expense | | | 462 | | | 679 | | | 336 | |
Noncash sublease termination income | | | — | | | (839 | ) | | — | |
Noncash charitable contribution | | | — | | | — | | | 122 | |
Loss (gain) on disposition of property and equipment | | | 3 | | | (15 | ) | | 12 | |
Changes in operating assets and liabilities: | | | | | | | | | | |
Accounts receivable | | | (5,454 | ) | | (4,414 | ) | | (1,182 | ) |
Other receivables | | | 213 | | | (246 | ) | | 898 | |
Prepaid expenses and other current assets | | | (1,374 | ) | | (1,091 | ) | | (112 | ) |
Other assets | | | (427 | ) | | (106 | ) | | (37 | ) |
Accounts payable and accrued liabilities | | | 1,958 | | | 1,318 | | | 592 | |
Deferred revenue | | | 2,595 | | | 13,082 | | | 6,771 | |
Other current liabilities | | | 806 | | | 491 | | | 476 | |
Deferred rent expense, net of current portion | | | (50 | ) | | 892 | | | (356 | ) |
Other long-term liabilities | | | — | | | — | | | (63 | ) |
Restricted cash, short-term | | | (16 | ) | | — | | | — | |
Restricted cash, long-term | | | (4,200 | ) | | — | | | — | |
| | | | | | | | |
| | | | | | | | | | | |
Net cash provided by (used in) operating activities | | | (18,478 | ) | | 1,821 | | | (1,704 | ) |
| | | | | | | | |
| | | | | | | | | | | |
Cash flows from investing activities: | | | | | | | | | | |
Purchase of property and equipment | | | (3,963 | ) | | (2,405 | ) | | (1,925 | ) |
Proceeds from sale of assets | | | — | | | 12 | | | — | |
Purchase of Agile Advantage, Inc. assets | | | — | | | (420 | ) | | — | |
Purchase of Flowdock Oy, net of cash received | | | (2,857 | ) | | — | | | — | |
| | | | | | | | |
| | | | | | | | | | | |
Net cash used in investing activities | | | (6,820 | ) | | (2,813 | ) | | (1,925 | ) |
| | | | | | | | |
| | | | | | | | | | | |
Cash flows from financing activities: | | | | | | | | | | |
Proceeds from initial public offering, net of underwriting discounts and commissions | | | 89,838 | | | — | | | — | |
Proceeds from follow-on offering, net of underwriting discounts and commissions | | | 5,884 | | | — | | | — | |
Proceeds from exercise of common stock options | | | 1,233 | | | 451 | | | 122 | |
Proceeds from issuance of common stock under employee stock purchase program | | | 1,884 | | | — | | | — | |
Proceeds from issuance of preferred stock | | | — | | | — | | | 20,000 | |
Payments of offering costs | | | (2,259 | ) | | (1,271 | ) | | — | |
Purchase and cancelation of preferred stock | | | — | | | — | | | (1,388 | ) |
Payments on capital lease obligations | | | — | | | (31 | ) | | (101 | ) |
Payments of preferred stock offering costs | | | — | | | — | | | (118 | ) |
| | | | | | | | |
| | | | | | | | | | | |
Net cash provided by (used in) financing activities | | | 96,580 | | | (851 | ) | | 18,515 | |
| | | | | | | | |
| | | | | | | | | | | |
Net increase (decrease) in cash and cash equivalents | | | 71,282 | | | (1,843 | ) | | 14,886 | |
Cash and cash equivalents-beginning of year | | | 17,609 | | | 19,452 | | | 4,566 | |
| | | | | | | | |
| | | | | | | | | | | |
Cash and cash equivalents-end of year | | $ | 88,891 | | $ | 17,609 | | $ | 19,452 | |
| | | | | | | | |
| | | | | | | | | | | |
| | | | | | | | | | | |
| | | | | | | | |
Supplementary information: | | | | | | | | | | |
Cash paid for interest | | $ | 2 | | $ | 4 | | $ | 12 | |
Cash paid for income taxes | | | 127 | | | 57 | | | — | |
Noncash investing and financing activities: | | | | | | | | | | |
Conversion of redeemable convertible preferred stock to common stock | | $ | 68,410 | | $ | — | | $ | — | |
Conversion of preferred stock warrants to common stock warrants | | | 2,066 | | | — | | | — | |
Common stock issued as partial consideration to acquire Flowdock Oy | | | 1,293 | | | — | | | — | |
Property and equipment purchases in accounts payable | | | 34 | | | 81 | | | 99 | |
Offering costs included in accounts payable | | | — | | | 181 | | | — | |
See accompanying notes to consolidated financial statements
F-6
Table of Contents
RALLY SOFTWARE DEVELOPMENT CORP.
Notes to Consolidated Financial Statements
(1) Description and Nature of Business and Operations
Rally Software Development Corp. (we, our or us) is a provider of cloud-based solutions for managing Agile software development. Our platform transforms the way organizations manage the software development lifecycle by enabling close alignment of software development and strategic business objectives, facilitating collaboration, increasing transparency, and automating manual processes. Organizations use our solutions to accelerate the pace of innovation, improve productivity and more effectively adapt to rapidly-changing customer needs and competitive dynamics. Our enterprise-class platform is extensible, cost-effective and designed to be easy to use. Agile is a software development methodology characterized by short, iterative and highly-adaptable development cycles. We also provide consulting services to help customers adopt and succeed with Agile software development practices as well as to learn to use our solutions.
Our headquarters are located in Boulder, Colorado. We were incorporated in Delaware on July 12, 2001. At January 31, 2014, we had six subsidiaries: Rally Software Development International Corp. (RSDI); Rally Software Development Australia Pty Limited; Rally Software Development Netherlands B.V.; Rally Software Development Canada B.C. Ltd.; Rally Singapore Pte Ltd.; and Flowdock Oy.
Our fiscal year ends on January 31. Our fiscal quarters end April 30, July 31, October 31 and January 31.
(2) Summary of Significant Accounting Policies
The accompanying consolidated financial statements included the accounts of us and our wholly-owned subsidiaries. All significant intercompany balances have been eliminated in consolidation.
On April 17, 2013, we closed our initial public offering (IPO) of 6,900,000 shares of common stock, including 900,000 shares sold pursuant to the underwriters' option to purchase additional shares. The public offering price of the shares sold in our IPO was $14.00 per share. All outstanding shares of our redeemable convertible preferred stock converted to 14,335,869 shares of common stock and all outstanding preferred stock warrants converted into warrants to purchase common stock at the closing of our IPO. Our shares of common stock are traded on the New York Stock Exchange under the symbol "RALY". We received proceeds from our IPO of $89.8 million, net of underwriting discounts and commissions, but before offering expenses of $2.9 million. Deferred offering expenses at January 31, 2013 of $1.5 million were recorded as other assets. These offering expenses, and additional expenses incurred from February 2013 through the closing of our IPO of approximately $1.4 million, have been reclassified to additional paid-in capital. All offering costs associated with the IPO have been paid as of January 31, 2014.
On July 30, 2013, we closed our follow-on public offering in which we and certain of our stockholders sold an aggregate of 5,589,455 shares of common stock, including 729,058 shares sold pursuant to the underwriters' option to purchase additional shares. The public offering price of the shares sold in the offering was $24.75 per share. Of the 5,589,455 shares of common stock sold in the offering, 250,000 shares were sold by us and 5,339,455 shares were sold by selling stockholders. We received proceeds from the offering of $5.9 million, net of underwriting discounts and commissions, but
F-7
Table of Contents
RALLY SOFTWARE DEVELOPMENT CORP.
Notes to Consolidated Financial Statements (Continued)
(2) Summary of Significant Accounting Policies (Continued)
before offering expenses of $0.6 million. All offering costs associated with the follow-on offering have been paid as of January 31, 2014.
On March 27, 2013, our Board of Directors approved a 1-for-2.5 reverse stock split of our then-outstanding common stock and redeemable convertible preferred stock. The reverse stock split became effective upon filing of an amended and restated certificate of incorporation with the Secretary of State of the State of Delaware on April 1, 2013. Upon the effectiveness of the reverse stock split, (i) every two and one-half shares of then-outstanding common stock and redeemable convertible preferred stock were decreased to one share of common stock and redeemable convertible preferred stock, respectively, (ii) the number of shares of common stock into which each outstanding option and warrant to purchase common stock is exercisable was proportionally decreased on a 1-for-2.5 basis and the exercise price of each outstanding option and warrant to purchase common stock was proportionately increased on a 1-for-2.5 basis and (iii) the number of shares of then-outstanding redeemable convertible preferred stock into which each then outstanding warrant to purchase redeemable convertible preferred stock is exercisable was proportionally decreased on a 1-for-2.5 basis and the exercise price of each outstanding warrant to purchase then outstanding redeemable convertible preferred stock was proportionately increased on a 1-for-2.5 basis. All of the share numbers, share prices, and exercise prices have been retroactively adjusted to reflect the reverse stock split in the accompanying consolidated financial statements and these notes.
The preparation of consolidated financial statements in conformity with generally accepted accounting principles in the United States of America (GAAP) requires management to make estimates and assumptions that affect the reported amounts of assets and liabilities and disclosure of contingent assets and liabilities at the date of the consolidated financial statements and the reported amounts of revenue and expenses during the reporting period. Actual results could differ from these estimates. The more critical estimates and related assumptions that affect our consolidated financial condition and results of operations are in the areas of revenue recognition; measurement of the fair value of equity instruments; capitalization of software development costs and income taxes. We have engaged, and may in the future engage, third-party valuation specialists to assist with estimates related to the valuation of our equity instruments. Such estimates often require the selection of appropriate valuation methodologies and models, and significant judgment in evaluating ranges of assumptions and financial inputs. Actual results may differ from those estimates.
Operating segments are defined as components of an enterprise about which discrete financial information is available that is evaluated on a regular basis by the chief operating decision maker, or decision making group, in deciding how to allocate resources and assess performance. Our chief operating decision makers are the Chief Executive Officer and Chief Financial Officer. Our Chief Executive and Chief Financial Officer review consolidated operating results to make decisions about allocating resources and assessing performance for the entire company. We view our operations and manage our business as one operating segment.
F-8
Table of Contents
RALLY SOFTWARE DEVELOPMENT CORP.
Notes to Consolidated Financial Statements (Continued)
(2) Summary of Significant Accounting Policies (Continued)
We consider all highly liquid investments purchased with an original maturity of three months or less to be cash equivalents. Cash equivalents consist primarily of investments in a money market mutual fund that invests primarily in short-term United States Treasury Securities, a bank money market account and certificates of deposit. Cash equivalents are carried at cost, which approximates fair value.
Trade accounts receivable represent trade receivables from customers when we have invoiced for subscriptions, support, perpetual software licenses or professional services and have not received payment. Receivables are recorded at the invoiced amount and do not bear interest. We maintain an allowance for doubtful accounts for estimated losses inherent in our accounts receivable portfolio. In establishing the required allowance, management considers historical losses adjusted to take into account current market conditions and our customers' financial condition, the amount of receivables in dispute, and the current receivables' aging and current payment patterns. Account balances are charged off against the allowance after all means of collection have been exhausted and the potential for recovery is considered remote.
Allowance for doubtful accounts activity and balances are presented below (in thousands):
| | | | | | | | | | |
| | Fiscal Year Ended
January 31, | |
|---|
| | 2014 | | 2013 | | 2012 | |
|---|
Balance at beginning of year | | $ | 48 | | $ | 42 | | $ | 39 | |
Charges for bad debts | | | 29 | | | 83 | | | 11 | |
Write-offs and adjustments | | | (10 | ) | | (77 | ) | | (8 | ) |
| | | | | | | | |
| | | | | | | | | | | |
Balance at end of year | | $ | 67 | | $ | 48 | | $ | 42 | |
| | | | | | | | |
| | | | | | | | | | | |
| | | | | | | | | | | |
| | | | | | | | |
Property and equipment are recorded at cost. Property and equipment under capital leases are recorded at the present value of future minimum lease payments. Property and equipment are depreciated using the straight-line method over the following estimated useful lives:
| | |
Asset class | | Useful life |
|---|
| Computer equipment | | 3 years |
| Office equipment | | 5 years |
| Office furniture | | 5 years |
| Computer software | | 3 years |
| Leasehold improvements | | The shorter of the estimated useful life or the term of the lease |
Upon retirement or sale, the costs of assets disposed of and the related accumulated depreciation are removed from the accounts and any resulting gain or loss is recognized in other gain (loss) in the consolidated statements of operations. Maintenance and repairs that do not improve or extend the lives of the respective assets are expensed in the period incurred.
F-9
Table of Contents
RALLY SOFTWARE DEVELOPMENT CORP.
Notes to Consolidated Financial Statements (Continued)
(2) Summary of Significant Accounting Policies (Continued)
Our acquired intangible assets consist of developed software technology and trademark and domain names. The values assigned to our intangible assets are based on estimates and judgments. Intangible assets are amortized on a straight-line basis over the following estimated useful lives.
| | |
Asset class | | Useful life |
|---|
Developed software technology | | 5 years |
Trademark and domain names | | 15 years |
Through January 31, 2013, we incurred approximately $1.5 million in costs related to our initial public offering. These costs had been deferred and were recorded as a reduction to the proceeds from the offering at the time of closing. Deferred offering costs were included in other assets in the accompanying consolidated balance sheet as of January 31, 2013. We did not have any deferred offering costs as of January 31, 2014.
Long lived assets consist primarily of property and equipment. Long lived assets are reviewed for possible impairment whenever events or circumstances indicate that the carrying amount of such assets may not be recoverable. If this evaluation indicates the carrying value will not be recoverable, based on the undiscounted expected future cash flows estimated to be generated by these assets, we reduce the carrying amount to the estimated fair value. Fair value is determined through various valuation techniques including discounted cash flow modeling. To date, no such impairment has occurred.
Deferred tax assets and liabilities are recognized for the future tax consequences attributable to differences between the financial statement carrying amounts of existing assets and liabilities and their respective tax bases. A valuation allowance is recorded to the extent it is more likely than not that a deferred tax asset will not be realized. Deferred tax assets and liabilities are measured using enacted tax rates expected to apply to taxable income in the years in which those temporary differences are expected to be recovered or settled. The effect on deferred tax assets and liabilities of a change in tax rates is recognized in operations in the period that includes the enactment date. Our net deferred tax asset has been completely reduced by a valuation allowance as management cannot conclude that realization of the deferred tax asset is assured, on a more likely than not basis, at each balance sheet date, due primarily to our history of operating losses.
We recognize the effect of income tax positions only if those positions are more likely than not of being sustained. Recognized income tax positions are measured at the largest amount that is greater than 50% likely of being realized. Changes in recognition or measurement are reflected in the period in which the change in judgment occurred. All current tax positions are considered more likely than not of being sustained.
F-10
Table of Contents
RALLY SOFTWARE DEVELOPMENT CORP.
Notes to Consolidated Financial Statements (Continued)
(2) Summary of Significant Accounting Policies (Continued)
Deferred revenue comprises unrecognized subscription and support, which includes hosting and maintenance, perpetual licenses, tool training, enhanced support and prepaid professional services revenue. With the exception of perpetual licenses, these arrangements are initially recorded as deferred revenue upon the commencement of the subscription, hosting or maintenance period, and revenue is recognized in the consolidated statements of operations ratably over the term of the arrangement. Perpetual licenses are generally recognized upon delivery of the software product to the customer. Prepaid professional services arrangements are recorded initially as deferred revenue and are recognized as the services are performed.
We generate revenue primarily from three sources: (1) subscriptions and support; (2) perpetual licenses; and (3) professional services. Subscription and support revenue is primarily comprised of fees that give customers access to our suite of cloud-based solutions, as well as optional hosting and maintenance related to perpetual licenses. Professional services revenue largely encompasses fees related to the instruction of Agile software development methodologies and training related directly to the product.
Revenue is recognized when all of the following conditions have been met:
- •
- there is persuasive evidence of an arrangement;
- •
- the service has been provided or the product has been delivered;
- •
- the price is fixed or determinable; and
- •
- collection of the fees is sufficiently assured.
Signed agreements, which may include purchase orders, are used as evidence of an arrangement. In cases where both a signed contract and a purchase order exist, we consider the signed contract to be persuasive evidence of the arrangement. Product delivery occurs when we provide the customer with access to the software via an electronic notification or license key. We assess whether a fee is fixed or determinable at the outset of the arrangement, primarily based on the payment terms associated with the transaction. We assess collectability of the fee based on a number of factors, such as the collection history and creditworthiness of the customer. If we determine that collectability is not sufficiently assured, revenue is deferred until collectability becomes sufficiently assured, generally upon receipt of cash.
Subscription and support revenue is recognized ratably over the contract term beginning on the commencement date of each contract.
When multiple deliverables included in an arrangement are separable into different units of accounting, the arrangement consideration is allocated to the identified separate units of accounting based on their relative selling prices. Multiple deliverable arrangement accounting guidance provides a hierarchy to use when determining the relative selling price for each unit of accounting. This guidance provides that vendor-specific objective evidence (VSOE) of selling price, based on the price at which the item is regularly sold by the vendor on a stand-alone basis, should be used if it exists. We use VSOE to determine the stand-alone selling prices of subscription, hosting, maintenance, and
F-11
Table of Contents
RALLY SOFTWARE DEVELOPMENT CORP.
Notes to Consolidated Financial Statements (Continued)
(2) Summary of Significant Accounting Policies (Continued)
professional services because substantially all separate sales of these deliverables fall within a reasonable range of prices. All unique product offerings are grouped based upon size of customer as a result of our tiered volume pricing. VSOE for professional services is determined regardless of customer size as customer size does not significantly impact the prices charged. We have concluded that all products and services for each single unit of accounting have VSOE, other than perpetual licenses discussed below.
We monitor compliance with VSOE by using a bell curve approach. Sales of subscription, hosting, maintenance and professional services are analyzed to determine whether 80% of the transactions are within a range of 15% of the median of the transactions for an appropriate group of customers.
When VSOE exists for all undelivered elements of the contract, perpetual license fee revenue is generally recognized upon delivery of the software product to the customer, provided the other revenue recognition conditions are met. We have established VSOE for all undelivered elements of our perpetual license arrangements. Maintenance revenue consists of fees for providing unspecified software updates on a when and if available basis and technical support for software products. Hosting revenue relates to fees for hosting perpetual license software that the customer has purchased at our third-party data centers. Our perpetual license customers who purchase hosting have the right to take possession of the software at any time. Hosting and maintenance revenue as well as enhanced support is recognized ratably over the term of the agreement.
Professional services revenue is accounted for separately from subscription and perpetual license revenue when VSOE exists and, for subscriptions, has stand-alone value to the customer. Professional services are generally provided on a time-and-materials basis. The services that are provided on a time-and-materials basis are recognized as services are provided. However, professional services that do not have stand-alone value to the customer are recognized ratably over the remaining subscription period. We present reimbursements received for out of pocket expenses within professional services revenue. Reimbursements received were approximately $1.2 million, $0.7 million and $0.6 million for the fiscal years ended January 31, 2014, 2013 and 2012, respectively.
Research and development expenses consist primarily of personnel and related expenses for our research and development staff, including salaries, benefits, bonuses and stock based compensation, certain software licenses and allocated overhead, including depreciation. Research and development costs are expensed as incurred. We develop software, which is sold as a subscription or licensed for a stated term or in perpetuity. Qualifying software development costs are required to be capitalized once technological feasibility of the software has been established. Costs incurred prior to establishing technological feasibility are expensed as incurred. Technological feasibility is established when we have completed all planning, designing, coding, and testing activities that are necessary to determine that a product can be produced to meet its design specifications, including functions, features, and technical performance requirements. Capitalization of costs ceases when the product is available for general use.
To date, the period between achieving technological feasibility and the general availability of such software has been short. Consequently, software development costs qualifying for capitalization have been insignificant, and therefore, we have not capitalized any software development costs to date.
F-12
Table of Contents
RALLY SOFTWARE DEVELOPMENT CORP.
Notes to Consolidated Financial Statements (Continued)
(2) Summary of Significant Accounting Policies (Continued)
We lease our facilities under operating leases. For leases that contain rent escalation or rent concession provisions, we record the total rent expense during the lease term on a straight line basis over the term of the lease. We record the difference between the rent paid and the straight line rent expense as a current liability in other current liabilities and the noncurrent portion in deferred rent expense in the accompanying consolidated balance sheets. Rent expense was $2.3 million, $1.6 million and $0.4 million for the fiscal years ended January 31, 2014, 2013 and 2012, respectively.
Advertising costs are expensed as incurred and include search engine fees, banner ads, digital marketing and events. Advertising expense was $2.8 million, $1.7 million and $1.4 million for the fiscal years ended January 31, 2014, 2013 and 2012, respectively. Advertising costs are recorded in sales and marketing expense within the accompanying consolidated statements of operations.
Commissions are recorded as a component of sales and marketing expense and consist of the variable compensation paid to our sales force. Sales commissions are earned and recorded at the time that a customer has entered into a binding purchase agreement. Commissions paid to sales personnel are recoverable only in cases where we cannot collect the invoiced amounts associated with a sales order. Commission expense was $8.5 million, $7.9 million and $5.8 million for the fiscal years ended January 31, 2014, 2013 and 2012, respectively.
Stock-based compensation to employees and members of our Board of Directors is measured at the grant-date fair values of the respective options to purchase our common stock, and expensed on a straight-line basis over the period in which the holder is required to provide services, which is usually the vesting period. We determine the grant-date fair value of all stock options using the Black-Scholes option pricing model. An estimate of forfeitures is applied when calculating compensation expense. Restricted stock and restricted stock units are measured at intrinsic value at the date of grant and expensed on a straight-line basis over the period in which the holder is required to provide services, which is generally the vesting period. We recognize compensation expense related to shares issued pursuant to our 2013 Employee Stock Purchase Plan (the 2013 ESPP), on a straight-line basis over the offering period, which is generally one year.
We accounted for warrants to purchase redeemable convertible preferred stock as a liability. The warrants were recorded at fair value, estimated using the Black Scholes option pricing model and revalued at each balance sheet date. The change in the fair value of the warrants was recorded as a component of interest expense. The preferred stock warrant liability was reclassified to additional paid-in capital upon the closing of our initial public offering in April 2013.
F-13
Table of Contents
RALLY SOFTWARE DEVELOPMENT CORP.
Notes to Consolidated Financial Statements (Continued)
(2) Summary of Significant Accounting Policies (Continued)
The functional currency of our foreign subsidiaries is the local currency. We conduct business in the United Kingdom (UK) through a branch of RSDI and in Australia, Canada, Finland, the Netherlands and Singapore through subsidiaries of RSDI. The functional currency of the branch and subsidiaries are the British pound, the Australian dollar, the Canadian dollar, the Euro and the Singaporean dollar. All assets and liabilities for the branch and subsidiaries denominated in a foreign currency are translated into U.S. dollars based on the exchange rate on the balance sheet date, and revenue and expenses are translated at the average exchange rates during the period. The effects of foreign exchange gains and losses arising from the translation of assets and liabilities of foreign subsidiaries are included as a component of other comprehensive income (loss).
We maintain short-term intercompany payables denominated in each subsidiary's functional currency. Gains and losses associated with remeasurement of these payables into U.S. dollars are presented within loss on foreign currency transactions included in the consolidated statements of operations.
In general, asset and liability fair values are determined using the following inputs:
Level 1 inputs utilize quoted prices in active markets for identical assets that we have the ability to access at period-end.
Level 2 inputs include quoted prices for similar assets in active markets and inputs other than quoted prices that are observable for the asset, either directly or indirectly.
Level 3 inputs are unobservable inputs and include situations where there is little, if any, market activity for the balance sheet items at period-end. Pricing inputs are unobservable for the terms and are based on our own assumptions about the assumptions that a market participant would use.
We believe that the carrying amounts of our financial instruments, including cash equivalents and restricted cash, approximate their fair value due to the short-term maturities of these instruments. The carrying amount of cash equivalents, which consists of a money market mutual fund, a bank money market account and certificates of deposits, was $86.3 million and $15.1 million as of January 31, 2014 and 2013, respectively, and approximates fair value based on quoted market prices, which are Level 1 inputs. The carrying amount of restricted cash, which consists of certificates of deposits, approximates fair value based on quoted market prices, which are Level 1 inputs.
In conjunction with entering into term loans and revolving lines of credit, we issued warrants to purchase shares of our redeemable, convertible preferred stock. At January 31, 2013, the warrants were reported as liabilities at their estimated fair value as determined using the Black Scholes pricing model (based on Level 3 inputs). Changes in fair value were reflected in the consolidated statements of operations as interest expense.
F-14
Table of Contents
RALLY SOFTWARE DEVELOPMENT CORP.
Notes to Consolidated Financial Statements (Continued)
(2) Summary of Significant Accounting Policies (Continued)
Financial instruments that potentially subject us to concentrations of credit risk consist primarily of cash and cash equivalents and accounts receivable. At January 31, 2014 and 2013, we had $50.0 million and $12.5 million, respectively, in certificates of deposits at various financial institutions, all of which are fully insured by the Federal Deposit Insurance Corporation. At January 31, 2014 we had approximately $25.4 million held in a money market mutual fund that invests primarily in short-term United States Treasury securities. Primarily all of the remaining amount of cash and cash equivalents were held in demand deposits, a certificate of deposit or a bank money market account at two financial institutions that we believe to be creditworthy. We perform ongoing evaluations of our customers' financial condition and do not require any collateral to support receivables. As of January 31, 2014 and 2013, no customer accounted for more than 10% of accounts receivable. During the fiscal years ended January 31, 2014, 2013 and 2012, no customer represented more than 10% of revenue.
Under the Jumpstart Our Business Startups Act (JOBS Act), we believe we meet the definition of an emerging growth company. We have irrevocably elected to opt out of the extended transition period for complying with new or revised accounting standards pursuant to Section 107(b) of the JOBS Act.
In February 2013, the Financial Accounting Standards Board (FASB) issued new accounting guidance clarifying the accounting for obligations resulting from joint and several liability arrangements for which the total amount under the arrangement is fixed at the reporting date. The new standard is effective for fiscal years, and interim periods within those fiscal years, beginning on or after December 15, 2013. We do not anticipate that this adoption will have a significant impact on our financial position, results of operations or cash flows.
In March 2013, FASB issued new accounting guidance clarifying the accounting for the release of cumulative translation adjustment into net income when a parent either sells a part or all of its investment in a foreign entity or no longer holds a controlling financial interest in a subsidiary or group of assets that is a nonprofit activity or a business within a foreign entity. The new standard is effective for fiscal years, and interim periods within those fiscal years, beginning on or after December 15, 2013. We do not anticipate that this adoption will have a significant impact on our financial position, results of operations or cash flows.
(3) Acquisitions
On March 31, 2010, we completed the acquisition of Enkari, Ltd. (Enkari) and the results of Enkari's operations have been included in the consolidated financial statements since that date. The total consideration paid by us was $350,000 consisting of $300,000 in cash and 30,000 shares of our common stock valued at $50,000.
The acquisition of Enkari has been accounted for as a purchase of a business, and accordingly, the total purchase price has been allocated to the tangible and identifiable intangible assets acquired and the liabilities assumed based on their respective fair values on the acquisition date. As a result of the acquisition of Enkari, we recorded intangible assets of $365,000, which comprised $300,000 related to developed software technology and $65,000 related to the customer relationships and net liabilities of
F-15
Table of Contents
RALLY SOFTWARE DEVELOPMENT CORP.
Notes to Consolidated Financial Statements (Continued)
(3) Acquisitions (Continued)
$15,000. The estimated useful life of the acquired customer relationships was 14 months and the estimated useful life of the acquired developed software technology was 36 months. These identified intangible assets are amortized on a straight-line basis over their estimated useful lives.
(b) Agile Advantage, Inc.
On July 18, 2012, we completed the acquisition of Agile Advantage, Inc. (Agile) and the results of Agile's operations have been included in the consolidated financial statements since that date. The total consideration paid by us was $420,000 all of which was paid in cash.
The acquisition of Agile has been accounted for as a purchase of a business, and accordingly, the total purchase price has been allocated to the tangible and identifiable intangible assets acquired and the liabilities assumed based on their respective fair values on the acquisition date. As a result of the acquisition of Agile, we recorded an intangible asset related to developed software technology for $420,000. The estimated useful life of the acquired developed software technology was 3 years which is being amortized on a straight line basis.
On February 5, 2013, we completed the acquisition of Flowdock Oy (Flowdock), a company based in Helsinki, Finland, and the results of Flowdock's operations have been included in the consolidated financial statements since that date. The acquisition provides us with a stand-alone unified communication and team-based chat collaboration product offering that is also complimentary to existing Rally solutions. The total consideration paid by us was approximately $4.4 million, which consisted of $3.0 million in cash, $0.1 million in net assumed liabilities and 119,993 shares of common stock valued at $10.78 per share. Cash of $0.1 million and 23,998 shares of common stock were held back for one year to satisfy any potential indemnification claims and subsequent to the fiscal year ended January 31, 2014, were released in full. Transaction costs of $0.5 million were expensed as incurred, $0.3 million of which were incurred in the fourth quarter of fiscal 2013 and $0.2 million of which were incurred in the first quarter of fiscal 2014.
The acquisition of Flowdock was accounted for as a purchase of a business, and accordingly, the total purchase price has been allocated to the tangible and identifiable intangible assets acquired and the liabilities assumed based on their respective fair values on the acquisition date. As a result of the acquisition of Flowdock, we recorded intangible assets of $4.4 million, which was comprised of $1.9 million related to developed software and technology, $0.2 million related to trademark and domain names and $2.3 million related to goodwill. The estimated useful life of the acquired developed software and technology is five years and the estimated useful life of the trademark and domain names is 15 years.
In the fourth quarter of fiscal year ended January 31, 2014 we finalized the purchase accounting for the acquisition of Flowdock as it relates to deferred taxes. We recorded an additional $0.2 million in goodwill and a net deferred tax liability of $0.3 million primarily related to the acquired developed software and technology.
F-16
Table of Contents
RALLY SOFTWARE DEVELOPMENT CORP.
Notes to Consolidated Financial Statements (Continued)
(4) Goodwill and Acquired Intangible Assets
Goodwill represents the excess of the purchase price of the acquired enterprise over the fair value of identifiable assets acquired and liabilities assumed. We apply ASC 350, "Intangibles—Goodwill and Other," and will perform an annual goodwill impairment test during the fourth quarter of our fiscal year and more frequently if an event or circumstance indicates that an impairment may have occurred. For the purposes of impairment testing, we have determined that we have one reporting unit and we make a qualitative assessment to determine if goodwill may be impaired. If it is more likely than not that a reporting unit's fair value is less than its carrying value, we then compare the fair value of the reporting unit to its respective carrying amount. If the carrying value of a reporting unit were to exceed its fair value, we would then compare the implied fair value of the reporting unit's goodwill to its carrying amount, and any excess of the carrying amount over the fair value would be charged to operations as an impairment loss. Any excess of the carrying value over the fair value of indefinite-lived intangible assets is also charged to operations as an impairment loss. The identification and measurement of goodwill impairment involves the estimation of the fair value of the company. The estimate of our fair value, based on the best information available as of the date of the assessment, is subjective and requires judgment, including management assumptions about expected future revenue forecasts and discount rates.
In connection with the acquisition of Flowdock in the first quarter of fiscal 2014, we recorded goodwill of $2.5 million.
Intangible assets excluding goodwill, consist of the following (in thousands):
| | | | | | | |
| | January 31,
2014 | | January 31,
2013 | |
|---|
Developed software technology | | $ | 2,578 | | $ | 720 | |
Trademark and domain names | | | 226 | | | — | |
| | | | | | |
| | | | | | | | |
| | | 2,804 | | | 720 | |
Less accumulated amortization | | | (895 | ) | | (353 | ) |
| | | | | | |
| | | | | | | | |
| | $ | 1,909 | | $ | 367 | |
| | | | | | |
| | | | | | | | |
| | | | | | | | |
| | | | | | |
Amortization expense related to acquired intangible assets for the fiscal years ended January 31, 2014, 2013, and 2012 was $0.5 million, $0.2 million and $0.2 million, respectively.
As of January 31, 2014, future estimated amortization expenses related to acquired intangible assets were as follows (in thousands):
| | | | |
Fiscal year ended January 31: | | | | |
2015 | | $ | 527 | |
2016 | | | 457 | |
2017 | | | 387 | |
2018 | | | 387 | |
2019 | | | 15 | |
Thereafter | | | 136 | |
| | | | |
| | | | | |
Total future estimated amortization expense | | $ | 1,909 | |
| | | | |
| | | | | |
| | | | | |
| | | | |
F-17
Table of Contents
RALLY SOFTWARE DEVELOPMENT CORP.
Notes to Consolidated Financial Statements (Continued)
(5) Property and Equipment
Property and equipment are stated at cost, net of accumulated depreciation and amortization. These assets are depreciated and amortized using the straight-line method over their estimated useful lives with the exception of leasehold improvements, which are depreciated over the shorter of the useful life of the asset or the related lease term.
As of January 31, 2014 and 2013, property and equipment consisted of the following (in thousands):
| | | | | | | |
| | January 31,
2014 | | January 31,
2013 | |
|---|
Computers, peripherals and software | | $ | 8,935 | | $ | 5,290 | |
Office furniture and equipment | | | 1,523 | | | 1,332 | |
Leasehold improvements | | | 1,453 | | | 1,371 | |
| | | | | | |
| | | | | | | | |
| | | 11,911 | | | 7,993 | |
Less accumulated depreciation and amortization | | | (6,342 | ) | | (4,204 | ) |
| | | | | | |
| | | | | | | | |
| | $ | 5,569 | | $ | 3,789 | |
| | | | | | |
| | | | | | | | |
| | | | | | | | |
| | | | | | |
Depreciation expense related to property and equipment, for the fiscal years ended January 31, 2014, 2013, and 2012 was $2.2 million, $1.7 million and $1.7 million, respectively.
(6) Accrued Liabilities
Accrued liabilities as of January 31, 2014 and 2013 consisted of the following (in thousands):
| | | | | | | |
| | January 31,
2014 | | January 31,
2013 | |
|---|
Accrued vacation and employee benefits | | $ | 1,731 | | $ | 992 | |
Accrued bonuses | | | 733 | | | 354 | |
Accrued commissions and salary | | | 2,348 | | | 1,716 | |
| | | | | | |
| | | | | | | | |
| | $ | 4,812 | | $ | 3,062 | |
| | | | | | |
| | | | | | | | |
| | | | | | | | |
| | | | | | |
(7) Revolving Line of Credit
In February 2012, we amended our loan and security agreement (LSA) with Square 1 Bank to increase the availability to $12.0 million and to increase the amount available pursuant to the corporate credit card line and letters of credit to $3.0 million. In January 2013, we amended the LSA to extend the maturity from February 2013 to February 2014. On February 1, 2014, we allowed the line of credit to expire and it was not renewed.
Any advances would have borne interest at the prime rate then in effect plus 3.00%, with a floor of 5.25%. This facility was subject to borrowing base calculations based on eligible accounts receivable. At January 31, 2014 and 2013, availability under the LSA, considering the borrowing base calculation, was $12.0 million and $12.0 million, respectively.
At January 31, 2013, we had a letter of credit outstanding for $2.5 million, which represented the security deposit on the operating lease for our corporate headquarters and reduced the amount available pursuant to the revolving line of credit to $9.5 million. In September 2013, and as required in
F-18
Table of Contents
RALLY SOFTWARE DEVELOPMENT CORP.
Notes to Consolidated Financial Statements (Continued)
(7) Revolving Line of Credit (Continued)
our amended and restated office lease (see Note 15), we placed $4.2 million in a bank account that is pledged to the landlord as a security deposit. This restricted cash is reflected as restricted long-term cash on our balance sheet and replaces the former security deposit, which was a $2.5 million letter of credit that has been cancelled.
No amounts were outstanding on the revolving line of credit as of January 31, 2014 and 2013, respectively.
The loan was secured by substantially all of our assets and included a restriction on our ability to pledge our intellectual property. The LSA included financial covenants and other customary affirmative and negative covenants. The primary financial covenant was an adjusted quick ratio. The adjusted quick ratio was defined as cash at the bank plus accounts receivable less than 90 days old from invoice date as compared to current liabilities excluding deferred revenue. We were required to maintain an adjusted quick ratio of at least 1.10 to 1.00. The LSA also contained customary event of default provisions. We believe we were in compliance with all covenants at January 31, 2014 and 2013, respectively
(8) Warrants
The following table summarizes information about preferred stock warrants outstanding at January 31, 2013 and April 17, 2013 (close of IPO):
| | | | | | |
| | Preferred Stock Warrants |
|---|
| | A-1 | | B | | C |
|---|
Number of warrants outstanding | | 32,750 | | 40,141 | | 64,755 |
Exercise price | | $2.50 | | $2.82 | | $3.78 |
Expiration | | July 2015 | | May 2014 - June 2018 | | October 2015 - June 2018 |
Preferred stock warrants were reported as liabilities at their estimated fair value. Changes in fair value were reflected in the consolidated statements of operations as a component of interest expense. We computed the fair value of warrants using a Black Scholes option pricing model. In order to calculate the fair value of the warrants, certain assumptions were made regarding components of the model, including volatility, risk free interest rates, and the fair value of preferred stock underlying the warrant. The use of different assumptions could cause significant changes to fair value. Our estimated volatility utilized an average of the stock volatility of peer, publicly traded companies. The risk free interest rates were based on U.S. Treasury yields for treasury securities of similar maturity. The fair value of preferred stock underlying the warrants was estimated using the probability weighted expected return method (PWERM). Under the PWERM, share value was based upon the probability weighted present value of expected future net cash flows (distributions to stockholders), considering each of the possible future events and giving consideration for the rights and preferences of each class of stock. Accordingly, we computed the fair value of warrants to purchase preferred stock at January 31, 2013
F-19
Table of Contents
RALLY SOFTWARE DEVELOPMENT CORP.
Notes to Consolidated Financial Statements (Continued)
(8) Warrants (Continued)
and April 17, 2013 based on Level 3 inputs. At January 31, 2013 and April 17, 2013, the fair value of the warrant liability was calculated using the following underlying assumptions:
| | | | | | |
| |
| | April 17, 2013 |
|---|
| | January 31,
2013 |
|---|
| | (Close of IPO) |
|---|
Risk-free interest rate | | | 0.88% | | | 0.71% |
Expected term | | | Remaining contractual term | | | Remaining contractual term |
Expected dividend yield | | | — | | | — |
Expected volatility | | | 49.0% | | | 49.0% |
In connection with the closing of our IPO, each of the preferred stock warrants automatically converted into a warrant to purchase shares of common stock with substantially the same terms. So long as the warrants remained outstanding and exercisable for redeemable convertible preferred stock, the warrant liability was recorded at fair value at each balance sheet date with any change in fair value included as a component of interest expense. We recognized $0.5 million, $0.7 million and $0.3 million for the fiscal years ended January 31, 2014, 2013 and 2012, respectively, for the change in fair market value of the warrants. At the time of conversion of the warrants upon the closing of our IPO, the fair value of the warrants was $2.1 million, which was reclassified as a component of additional paid-in capital.
The following table presents our activity for preferred stock warrants for the fiscal years ended January 31, 2014, 2013 and 2012 (in thousands):
| | | | |
| | Warrant
Liability | |
|---|
Balance at February 1, 2011 | | $ | 591 | |
Mark to estimated fair value through interest expense | | | 334 | |
| | | | |
| | | | | |
Balance at January 31, 2012 | | | 925 | |
Mark to estimated fair value through interest expense | | | 679 | |
| | | | |
| | | | | |
Balance at January 31, 2013 | | | 1,604 | |
Mark to estimated fair value through interest expense | | | 462 | |
Reclassification of preferred stock warrant liability into additional paid-in capital upon closing of IPO on April 17, 2013 | | | (2,066 | ) |
| | | | |
| | | | | |
Balance at January 31, 2014 | | $ | — | |
| | | | |
| | | | | |
| | | | | |
| | | | |
Prior to the closing of our IPO, we also had two outstanding common stock warrants exercisable for 26,000 and 22,400 shares of common stock at $0.65 and $0.0025 per share, which were scheduled to expire in November 2016 and May 2021, respectively. The warrant for 22,400 shares of common stock was issued on May 20, 2011 and was deemed to have a fair value of $5.48 per share. The estimated fair value of the warrant on the issuance date of $0.1 million was recorded as a general and administrative expense with a corresponding offset to additional paid in capital. The warrants automatically net exercised at the closing of our IPO on April 17, 2013 for 24,793 and 22,396 shares of common stock, respectively.
F-20
Table of Contents
RALLY SOFTWARE DEVELOPMENT CORP.
Notes to Consolidated Financial Statements (Continued)
(8) Warrants (Continued)
During the fiscal year ended January 31, 2014, we issued 107,435 shares of our common stock upon the net exercise of common stock warrants to acquire 123,918 shares having a weighted average exercise price of $3.13 per share. We did not receive any cash proceeds in connection with these exercises. At January 31, 2014, 13,728 common stock warrants were outstanding with a weighted average exercise price of $3.78 per share.
(9) Redeemable Convertible Preferred Stock
In May 2011, in anticipation of our Series E preferred stock financing, our Board of Directors and stockholders amended and restated our certificate of incorporation to increase the authorized shares of our common and preferred stock to 20,000,000 and 14,671,269 shares, respectively.
We closed the Series E preferred stock financing in May 2011, issuing 1,553,393 shares of Series E preferred stock at a price of $12.88 per share for gross proceeds of $20.0 million. We incurred approximately $0.1 million in offering costs.
In August 2011, we repurchased and retired 151,122 shares of preferred stock at $12.23 per share for a total repurchase price of $1.8 million. We repurchased 8,670, 5,328, 116,050, and 21,074 shares of Series A-1, Series B, Series C, and Series D preferred stock, respectively. The consideration in excess of the fair value was considered compensation expense and amounted to $0.5 million. The fair value aggregated to $1.4 million and the amount in excess of the carrying value of $0.6 million totaled $0.8 million and was considered a deemed preferred stock dividend and reduced additional paid-in capital.
There was no change in preferred stock during the fiscal year ended January 31, 2013. On April 17, 2013, upon the closing of our IPO, all outstanding shares of redeemable convertible preferred stock were automatically converted to 14,335,869 shares of common stock.
The following tables present our activity for redeemable convertible preferred stock for the fiscal year ended January 31, 2014 (in thousands except shares):
| | | | | | | | | | | | | | | | | | | |
| | Redeemable Convertible Preferred Stock | |
|---|
| | Series A-1 | | Series B | | Series C | |
|---|
| | Shares | | Amount | | Shares | | Amount | | Shares | | Amount | |
|---|
Balance, February 1, 2013 | | | 3,368,552 | | | 8,395 | | | 2,836,586 | | | 7,957 | | | 4,350,478 | | | 16,373 | |
Conversion of preferred stock into common stock upon initial public offering | | | (3,368,552 | ) | | (8,395 | ) | | (2,836,586 | ) | | (7,957 | ) | | (4,350,478 | ) | | (16,373 | ) |
| | | | | | | | | | | | | | |
| | | | | | | | | | | | | | | | | | | | |
Balance, January 31, 2014 | | | — | | $ | — | | | — | | $ | — | | | — | | $ | — | |
| | | | | | | | | | | | | | |
| | | | | | | | | | | | | | | | | | | | |
| | | | | | | | | | | | | | | | | | | | |
| | | | | | | | | | | | | | |
F-21
Table of Contents
RALLY SOFTWARE DEVELOPMENT CORP.
Notes to Consolidated Financial Statements (Continued)
(9) Redeemable Convertible Preferred Stock (Continued)
| | | | | | | | | | | | | | | | |
| | Redeemable Convertible Preferred Stock | |
|---|
| | Series D | | Series E | |
| |
|---|
| | Shares | | Amount | | Shares | | Amount | | Total | |
|---|
Balance, February 1, 2013 | | | 2,226,860 | | | 15,803 | | | 1,553,393 | | $ | 19,882 | | | 68,410 | |
Conversion of preferred stock into common stock upon initial public offering | | | (2,226,860 | ) | | (15,803 | ) | | (1,553,393 | ) | | (19,882 | ) | | (68,410 | ) |
| | | | | | | | | | | | |
| | | | | | | | | | | | | | | | | |
Balance, January 31, 2014 | | | — | | $ | — | | | — | | $ | — | | $ | — | |
| | | | | | | | | | | | |
| | | | | | | | | | | | | | | | | |
| | | | | | | | | | | | | | | | | |
| | | | | | | | | | | | |
As of January 31, 2013, the Series A-1, Series B, Series C, Series D, and Series E preferred stock (collectively, the preferred stock) had the following characteristics in accordance with our amended and restated certificate of incorporation. As of January 31, 2012, the preferred stock was no longer accreted to its aggregate liquidation value as redemption was not considered probable.
i) Conversion
Each share of preferred stock may, at the option of the holder, be converted at any time into the number of fully paid, nonassessable shares of common stock determined by the applicable conversion rate, as described more fully below.
Each share of preferred stock automatically converted into common stock at the then effective and applicable conversion rate (1) at any time upon the affirmative election of the holders of at least 55% of the preferred stock; provided that if the automatic conversion was in connection with a Liquidation Event (as defined in our amended and restated certificate of incorporation to include certain asset transfers, acquisitions or mergers) in which the proceeds to the holders of Series E preferred stock as holders of common stock (after such an automatic conversion) would be less in the aggregate than the proceeds the holders of Series E preferred stock would receive in such Liquidation Event as holders of Series E preferred stock (and assuming no such automatic conversion), then the Series E preferred stockholders would receive in such an automatic conversion the applicable number of shares of Common Stock as would be distributable to the holders of Series E preferred stock in the Liquidation Event had the automatic conversion not occurred; or (2) immediately upon the closing of a firmly underwritten public offering with aggregate gross proceeds of at least $40.0 million at a price per share of at least $16.48 (as adjusted for stock splits, stock dividends, recapitalizations, and the like).
Each share of preferred stock was convertible, as described above, into the number of fully paid and nonassessable shares of common stock at a conversion rate determined by dividing the applicable original issue price per share by the applicable conversion price per share at the time of conversion. The per share conversion price was subject to certain antidilution and adjustment provisions. The original issue price per share of the Series A-1, Series B, Series C, Series D, and Series E preferred stock was $2.50, $2.82, $3.77, $7.12, and $12.88, respectively. As of January 31, 2013 the split adjusted issue price was equal to the conversion price; therefore, the rate at which each share converted into common stock at such times was one-for-one.
F-22
Table of Contents
RALLY SOFTWARE DEVELOPMENT CORP.
Notes to Consolidated Financial Statements (Continued)
(9) Redeemable Convertible Preferred Stock (Continued)
ii) Voting Rights
All shares of preferred stock generally had the same voting rights as common stock. The holders of preferred stock were entitled to vote, together with the holders of common stock, on all matters submitted to stockholders for vote. Each holder of preferred stock was entitled to the number of votes equal to the number of shares of common stock into which each share of preferred stock was convertible immediately after the close of business on the record date, or the effective date of such written consent, as applicable.
For so long as at least 100,000 shares of preferred stock (as adjusted for stock dividends, combinations, splits, recapitalizations, and the like) remained outstanding, the vote or consent of the holders of at least 55% of outstanding preferred stock voting as a single class on an as-converted basis shall be necessary for effecting or validating: (i) any change or waiver of the amended and restated certificate of incorporation or the bylaws that changed the voting or other rights of the holders of preferred stock; (ii) any action or event that altered or changed the voting or other powers, preferences, or other special rights, privileges, or restrictions of the preferred stock; (iii) any increase or decrease in the authorized number of shares of common or preferred stock; (iv) authorization of any new class of stock or securities ranking on parity with or senior to the then outstanding shares of preferred stock; (v) any redemption, repurchase, payment of dividends, or other purchase or distributions with respect to common stock, subject to certain limited exceptions; (vi) the consummation of any Liquidation Event; (vii) any declaration or payment of a dividend; (viii) the incurrence of any indebtedness in excess of $500,000; (ix) any issuance of securities of any subsidiary of us to anyone other than us; (x) any voluntary dissolution or liquidation of us; (xi) any increase or decrease in the authorized number of members of the Board of Directors; or (xii) permitting any of our subsidiaries to effect any of the foregoing actions.
For so long as at least 100,000 shares of Series D preferred stock (as adjusted for stock dividends, combinations, splits, recapitalizations, and the like) remained outstanding, in addition to any other vote or consent required under the terms of the preferred stock or by law, the vote or written consent of the holders of at least 55% of the outstanding Series D preferred stock voting together as a single class shall be required for effecting or validating: (i) any change or waiver of the amended and restated certificate of incorporation or the bylaws that changed the voting or other rights of the holders of the Series D preferred stock; (ii) any action or event that altered or changed the voting or other powers, preferences, or other special rights, privileges, or restrictions of the Series D preferred stock; or (iii) any increase or decrease in the authorized number of shares of Series D preferred stock.
For so long as at least 100,000 shares of Series E preferred stock (as adjusted for stock dividends, combinations, splits, recapitalizations, and the like) remained outstanding, in addition to any other vote or consent required under the terms of the preferred stock or by law, the vote or written consent of the holders of at least 60% of the outstanding Series E preferred stock voting together as a single class shall be required for effecting or validating: (i) any change or waiver of the amended and restated certificate of incorporation or the bylaws that changed the voting or other rights of the holders of the Series E preferred stock; (ii) any action or event that altered or changed the voting or other powers, preferences, or other special rights, privileges, or restrictions of the Series E preferred stock; (iii) any increase or decrease in the authorized number of shares of Series E preferred stock; (iv) amending any of the foregoing rights held by the Series E preferred stock; or (v) permitting any of our subsidiaries to effect any of the foregoing actions. The holders of the preferred stock, voting as a separate class, were
F-23
Table of Contents
RALLY SOFTWARE DEVELOPMENT CORP.
Notes to Consolidated Financial Statements (Continued)
(9) Redeemable Convertible Preferred Stock (Continued)
entitled to elect, and consequently remove, four of the seven members of the Board of Directors. The holders of common stock, voting as a separate class, are entitled to elect, and consequently remove, one member of the Board of Directors. The holders of common stock and preferred stock, voting together as a single class on an as-converted basis, were entitled to elect all remaining members of the Board of Directors.
iii) Dividends
The holders of preferred stock were entitled to receive noncumulative dividends out of any funds legally available in preference to any common stock at a rate of 8% of the original issue price per annum on each outstanding share of preferred stock, when and if declared by the Board of Directors. In the event dividends were paid on common stock, we would pay an additional dividend equal to that paid on common stock on all outstanding shares of preferred stock on an as-converted basis. Through January 31, 2014 no dividends have been declared or paid on our preferred stock or common stock.
iv) Liquidation Preferences
In the event of any liquidation, dissolution, or winding up of us, either voluntary or involuntary, or any Acquisition or Asset Transfer (as defined in our amended and restated certificate of incorporation), the holders of Series E preferred stock would be entitled to receive on a pari passu basis, prior to and in preference to any distribution of any assets of ours to the holders of Series A-1, Series B, Series C or Series D preferred stock, or common stock, an amount equal to the applicable original purchase price (as adjusted for any stock dividends, combinations, splits, recapitalizations, and the like) plus all declared and unpaid dividends on such preferred stock, if any. If, upon the occurrence of such event, the assets and funds available for distribution among the holders of Series E preferred stock were insufficient to make the payment of these preferential amounts in full, the entire assets and funds legally available for distribution would be distributed ratably among the holders of the Series E preferred stock in proportion to the full amounts to which they would otherwise be respectively entitled for such Series E preferred stock. After completion of the distribution to the Series E preferred stockholders, the holders of Series D preferred stock would be entitled to receive on a pari passu basis, prior to and in preference to any distribution of any assets of ours to the holders of Series A-1, Series B or Series C preferred stock, or common stock, an amount equal to the applicable original purchase price (as adjusted for any stock dividends, combinations, splits, recapitalizations, and the like) plus all declared and unpaid dividends on such preferred stock, if any. If, upon the occurrence of such event, the assets and funds available for distribution among the holders of Series D preferred stock were insufficient to make the payment of these preferential amounts in full, the entire assets and funds legally available for distribution would be distributed ratably among the holders of the Series D preferred stock in proportion to the full amounts to which they would otherwise be respectively entitled for such Series D preferred stock. After completion of distribution to the Series E and D preferred stockholders, the remaining assets of ours would be distributed ratably to the holders of the Series C preferred stock, Series B preferred stock, and Series A-1 preferred stock on a pari passu basis, prior to and in preference to any distribution of any assets of ours to the holders of common stock, an amount equal to the applicable original purchase price (as adjusted for any stock dividends, combinations, splits, recapitalizations, and the like) plus all declared and unpaid dividends on such preferred stock, if any. If, upon the occurrence of such event, the assets and funds available for distribution among the holders of Series A-1, Series B and Series C preferred stock were insufficient to make the payment of
F-24
Table of Contents
RALLY SOFTWARE DEVELOPMENT CORP.
Notes to Consolidated Financial Statements (Continued)
(9) Redeemable Convertible Preferred Stock (Continued)
these preferential amounts in full, the entire assets and funds legally available for distribution would be distributed ratably among the holders of the Series A-1, Series B and Series C preferred stock in proportion to the full amounts to which they would otherwise be respectively entitled for such shares of preferred stock. After completion of the foregoing preferential distribution to the preferred stock, the remaining assets of ours would be distributed ratably to the holders of the common stock and preferred stock on an as-converted to common stock basis.
(10) Stock Awards
In April 2002, we established our 2002 Stock Option Plan (the 2002 Plan). The 2002 Plan provides for the grant of incentive stock options, nonstatutory stock options, stock appreciation rights, restricted stock awards and restricted stock unit awards. Incentive stock options may only be granted to employees. All other awards may be granted to employees, directors and consultants. On February 4, 2013 and on March 1, 2013 our Board of Directors increased the shares authorized for grant pursuant to the 2002 Plan by 180,000 and 152,000, respectively. Our stockholders approved these increases on February 5, 2013 and March 1, 2013, respectively. As of January 31, 2014, we had 3,727,891shares of common stock reserved for issuance under the 2002 Plan, of which 2,176,979 had been issued upon the exercise of options and the issuance of restricted stock awards, 1,202,531 were subject to outstanding options, 119,998 were subject to outstanding restricted stock unit awards, and 228,383 were available for grant. Under the 2002 Plan, incentive stock options may be granted at an exercise price not less than 100% of the fair value of common stock on the date of grant, as determined by our Board of Directors.
On March 19, 2013, our Board of Directors approved our 2013 Equity Incentive Plan (the 2013 Plan) and the 2013 ESPP. On March 29, 2013, our stockholders also approved the 2013 Plan and the 2013 ESPP, each of which became effective on April 11, 2013.
The 2013 Plan provides for the grant of incentive stock options, nonstatutory stock options, stock appreciation rights, restricted stock awards, restricted stock unit awards, performance-based stock awards and other forms of equity compensation. The 2013 Plan also provides for the grant of performance cash awards. Incentive stock options may only be granted to employees. All other awards may be granted to employees, directors and consultants. As of January 31, 2014, we had 2,346,695 shares of common stock reserved for issuance under the 2013 Plan, of which 315,412 were subject to outstanding options, 318,454 were subject to outstanding restricted stock unit awards and 1,712,829 were available for grant. The number of shares of common stock reserved for issuance under the 2013 Plan will automatically increase on February 1 of each fiscal year, starting on February 1, 2014 and continuing through February 1, 2023, by the lesser of 5% of the total number shares of our common stock outstanding on the immediately preceding January 31, or a lesser amount of shares determined by our Board of Directors.
Pursuant to the evergreen provision of the 2013 Plan, on February 1, 2014, common stock reserved for issuance under the 2013 Plan automatically increased 1,239,320 shares to 3,586,015 shares of common stock.
The 2013 ESPP authorizes the issuance of shares of common stock pursuant to purchase rights granted to our employees. As of January 31, 2014, we had 469,339 shares of common stock reserved for issuance under the 2013 ESPP. The number of shares of common stock reserved for issuance will automatically increase on February 1 of each fiscal year, starting on February 1, 2014 and continuing
F-25
Table of Contents
RALLY SOFTWARE DEVELOPMENT CORP.
Notes to Consolidated Financial Statements (Continued)
(10) Stock Awards (Continued)
through February 1, 2023, by the least of (i) 2% of the total number of shares of our common stock outstanding on the immediately preceding January 31; (ii) 1,408,017 shares of common stock; or (iii) a lesser amount of shares determined by our Board of Directors.
Pursuant to the evergreen provision of the 2013 ESPP, on February 1, 2014, common stock reserved for issuance under the 2013 ESPP automatically increased 495,728 shares to 965,067 shares of common stock.
Stock Options
Options granted generally vest over four years with 25% vesting on the first year anniversary and the remainder continuing to vest ratably every month thereafter, and expire no more than 10 years from the date of grant. We recognize compensation cost on a straight-line basis over the requisite service period of the award.
During the fiscal years ended January 31, 2014, 2013 and 2012, we granted options to employees and nonemployees to purchase 497,163, 185,400 and 922,794 shares of common stock at a weighted-average exercise price of $19.95, $9.23 and $5.28 per share, and a weighted-average fair value on the date of grant of $10.34, $4.98 and $2.88 per share, respectively. The intrinsic value of stock options exercised during the fiscal years ended January 31, 2014, 2013 and 2012 was $7.1 million, $3.7 million and $0.6 million, respectively. The 2002 Plan allows certain holders to exercise their options prior to completion of the vesting period. In the event of termination of employment prior to completion of the vesting period, we reserve the right to repurchase the unvested shares at the original price paid by the holder. During fiscal 2008 and 2011, employees exercised 85,786 and 54,474 options, respectively, prior to completion of the vesting period. Cash received in exchange for the unvested shares was classified as other liabilities, the share options are not deemed exercised, and the related shares are not considered outstanding until they become vested. As of January 31, 2012, 15,564 restricted shares associated with the early exercise provision were outstanding. As of January 31, 2014 and 2013, there were no restricted shares associated with the early exercise provision outstanding.
F-26
Table of Contents
RALLY SOFTWARE DEVELOPMENT CORP.
Notes to Consolidated Financial Statements (Continued)
(10) Stock Awards (Continued)
The following table is a summary of stock option activity for the fiscal years ended January 31, 2014, 2013 and 2012:
| | | | | | | |
| | Number
of Shares | | Weighted-Average
Exercise Price | |
|---|
Outstanding at February 1, 2011 | | | 1,145,038 | | $ | 0.90 | |
Granted | | | 922,794 | | | 5.28 | |
Exercised | | | (159,102 | ) | | 0.78 | |
Forfeited | | | (36,639 | ) | | 2.60 | |
| | | | | | | |
| | | | | | | | |
Outstanding at January 31, 2012 | | | 1,872,091 | | | 3.05 | |
Granted | | | 185,400 | | | 9.23 | |
Exercised | | | (417,267 | ) | | 1.33 | |
Forfeited | | | (42,870 | ) | | 4.05 | |
| | | | | | | |
| | | | | | | | |
Outstanding at January 31, 2013 | | | 1,597,354 | | | 4.19 | |
Granted | | | 497,163 | | | 19.95 | |
Exercised | | | (459,137 | ) | | 2.68 | |
Forfeited | | | (117,437 | ) | | 8.64 | |
| | | | | | | |
| | | | | | | | |
Outstanding at January 31, 2014 | | | 1,517,943 | | | 9.46 | |
| | | | | | | |
| | | | | | | | |
| | | | | | | | |
| | | | | | | |
The following table summarizes information about stock options outstanding and exercisable as of January 31, 2014:
| | | | | | | | | | | | | | | | |
| | Options Outstanding | | Options Exercisable | |
|---|
Exercise Price | | Number
of Shares
Outstanding | | Weighted-
Average
Remaining
Contractual
Life (Years) | | Weighted-
Average
Exercise
Price | | Number
of Shares
Exercisable | | Weighted-
Average
Exercise
Price | |
|---|
$0.55 - 2.23 | | | 303,132 | | | 4.94 | | $ | 1.17 | | | 281,900 | | $ | 1.10 | |
5.48 | | | 528,626 | | | 7.46 | | | 5.48 | | | 332,193 | | | 5.48 | |
5.93 - 10.78 | | | 370,773 | | | 8.50 | | | 9.09 | | | 125,923 | | | 8.31 | |
16.33 - 28.54 | | | 309,662 | | | 9.46 | | | 24.45 | | | 23,810 | | | 24.83 | |
29.96 | | | 5,750 | | | 9.66 | | | 29.96 | | | — | | | — | |
| | | | | | | | | | | | | | | |
| | | | | | | | | | | | | | | | | |
| | | 1,517,943 | | | | | | | | | 763,826 | | | | |
| | | | | | | | | | | | | | | |
| | | | | | | | | | | | | | | | | |
| | | | | | | | | | | | | | | | | |
| | | | | | | | | | | | | | | |
Options outstanding at January 31, 2014 have a weighted-average remaining contractual life of 7.6 years and a weighted-average exercise price of $9.46 per share and options exercisable have a weighted-average exercise price of $4.93 per share. As of January 31, 2014, 2013 and 2012, the aggregate intrinsic value of options outstanding was $19.1 million, $10.5 million and $5.4 million, respectively. As of January 31, 2014, 2013 and 2012, the aggregate intrinsic value of options exercisable was $12.6 million, $7.0 million and $3.9 million, respectively.
We have computed the fair value of all options granted during the fiscal years ended January 31, 2014, 2013 and 2012 using the Black-Scholes option pricing model. In order to calculate the fair value of the options, certain assumptions are made regarding components of the model, including risk-free interest rates, volatility, expected dividend yield, and expected option life. The use of different
F-27
Table of Contents
RALLY SOFTWARE DEVELOPMENT CORP.
Notes to Consolidated Financial Statements (Continued)
(10) Stock Awards (Continued)
assumptions could cause significant adjustments to fair value. We estimated a volatility factor based on the common stock of peer companies, and have estimated forfeiture rates based on past historical experience. The expected life input is based on historical exercise patterns and the risk-free interest rate is based on the U.S. Treasury yield in effect at the time of the grant for treasury securities of similar maturity. Accordingly, we have computed the fair value of all options granted during the fiscal years ended January 31, 2014, 2013 and 2012 using the following weighted-average assumptions:
| | | | | | |
| | Fiscal Year Ended January 31, |
|---|
| | 2014 | | 2013 | | 2012 |
|---|
Risk-free interest rate | | 1.01% - 1.94% | | 0.79% - 1.40% | | 1.08% - 2.70% |
Expected life | | 5.27 - 6.08 years | | 5.91 - 6.08 years | | 5.69 - 6.08 years |
Expected dividend yield | | — | | — | | — |
Expected volatility | | 48.3% - 56.8% | | 57.9% - 59.9% | | 58.3% - 59.2% |
No income tax benefit has been recognized relating to stock-based compensation expense and no tax benefits realized from exercised stock options. As of January 31, 2014, we had $4.5 million of unrecognized compensation costs related to unvested stock options granted pursuant to the 2002 Plan and the 2013 Plan, and the cost was expected to be recognized over a weighted-average period of 2.45 years.
On February 5, 2013, we granted 119,998 restricted stock units (RSUs) to certain employees under the 2002 Plan. 50% of the RSUs become fully vested in April 2014 and the remaining 50% becomes fully vested in February 2015. 50,000 of the RSUs were subject to cancellation or forfeiture in satisfaction of certain indemnification obligations under the share purchase agreement entered into in connection with the purchase of Flowdock. Subsequent to the fiscal year ended January 31, 2014, the 50,000 RSUs were released in full.
During the fiscal year ended January 31, 2014, we also granted an additional 344,944 RSUs to certain employees under the 2013 Plan. The RSUs generally vest in annual or semiannual installments over four years.
The following table is a summary of restricted stock unit activity for the fiscal year ended January 31, 2014:
| | | | | | | |
| | Number
of Shares | | Weighted-Average
Grant Date Fair Value | |
|---|
Non-vested at February 1, 2013 | | | — | | $ | — | |
Granted | | | 464,942 | | | 20.93 | |
Vested | | | — | | | — | |
Forfeited | | | (5,960 | ) | | 24.77 | |
| | | | | | | |
| | | | | | | | |
Non-vested at January 31, 2014 | | | 458,982 | | $ | 20.88 | |
| | | | | | | |
| | | | | | | | |
| | | | | | | | |
| | | | | | | |
Unvested RSUs at January 31, 2014 have a weighted-average remaining contractual life of 1.7 years and a weighted-average grant date fair value of $20.88 per share, which is expected to be recognized over the applicable vesting period. Unrecognized stock-based compensation with respect to all RSUs was $7.3 million as of January 31, 2014 and the cost was expected to be recognized over a weighted-average period of 2.86 years.
F-28
Table of Contents
RALLY SOFTWARE DEVELOPMENT CORP.
Notes to Consolidated Financial Statements (Continued)
(10) Stock Awards (Continued)
On July 31, 2012 and in connection with our acquisition of Agile Advantage, Inc., we issued 9,600 shares of restricted stock. All of such shares vested in full on July 19, 2013. The fair value of approximately $0.1 million was recorded as compensation expense over twelve months. The restricted stock was issued from the 2002 Plan and reduced the number of shares available for grant.
The price at which common stock is purchased under the 2013 ESPP is equal to 85% of the fair market value of the common stock on the first day of an offering period or on a purchase date, whichever is lower. The initial offering commenced on April 11, 2013 and the initial purchase date was December 13, 2013. During the fiscal year ended January 31, 2014, 158,329 shares were issued under the 2013 ESPP for an aggregate purchase price of $1.8 million. Accumulated employee withholdings of $0.5 million at January 31, 2014 associated with the next purchase date on June 13, 2014 were included in other current liabilities.
The following weighted-average assumptions were used to calculate our stock-based compensation for each stock purchase right granted under the 2013 ESPP:
| | |
| | Fiscal Year Ended
January 31, 2014 |
|---|
Expected volatility | | 45.6% |
Expected life | | 0.67 - 1.17 years |
Risk-free interest rate | | 0.09% - 0.11% |
Expected dividend yield | | — |
As of January 31, 2014, we had $0.2 million of unrecognized compensation costs related to the 2013 ESPP and the cost was expected to be recognized over a weighted-average period of 0.4 years.
(11) Information by Geographic Areas
Revenue by geography is based on the ship-to address of the customer, which is intended to approximate where the customer's seats are provisioned. The ship-to country is generally the same as the billing country. The following table presents our revenue by geographic region for the fiscal years ended January 31, 2014, 2013 and 2012 (in thousands):
| | | | | | | | | | |
| | Fiscal Year Ended January 31, | |
|---|
| | 2014 | | 2013 | | 2012 | |
|---|
United States | | $ | 63,575 | | $ | 49,233 | | $ | 35,660 | |
International | | | 10,754 | | | 7,613 | | | 5,665 | |
| | | | | | | | |
| | | | | | | | | | | |
| | $ | 74,329 | | $ | 56,846 | | $ | 41,325 | |
| | | | | | | | |
| | | | | | | | | | | |
| | | | | | | | | | | |
| | | | | | | | |
Other than the United States, no other individual country exceeded 6% of total revenue during any of the periods presented. Primarily all of our property and equipment is located in the United States.
F-29
Table of Contents
RALLY SOFTWARE DEVELOPMENT CORP.
Notes to Consolidated Financial Statements (Continued)
(12) Income Taxes
The domestic and foreign components of net loss, and the provision for income taxes for the fiscal years ended January 31, 2014, 2013 and 2012 consists of the following (in thousands):
| | | | | | | | | | |
| | Fiscal Year Ended January 31, | |
|---|
| | 2014 | | 2013 | | 2012 | |
|---|
Net loss before income taxes: | | | | | | | | | | |
Domestic | | $ | (22,249 | ) | $ | (11,059 | ) | $ | (11,615 | ) |
Foreign | | | 2,291 | | | 407 | | | 23 | |
| | | | | | | | |
| | | | | | | | | | | |
| | $ | (19,958 | ) | $ | (10,652 | ) | $ | (11,592 | ) |
| | | | | | | | |
| | | | | | | | | | | |
| | | | | | | | | | | |
| | | | | | | | |
Current provision: | | | | | | | | | | |
Federal | | $ | — | | $ | — | | $ | — | |
State | | | — | | | — | | | — | |
Foreign | | | 173 | | | 128 | | | — | |
| | | | | | | | |
| | | | | | | | | | | |
| | | 173 | | | 128 | | | — | |
| | | | | | | | |
| | | | | | | | | | | |
Deferred provision: | | | | | | | | | | |
Federal | | | — | | | — | | | — | |
State | | | — | | | — | | | — | |
Foreign | | | — | | | — | | | — | |
| | | | | | | | |
| | | | | | | | | | | |
| | | — | | | — | | | — | |
| | | | | | | | |
| | | | | | | | | | | |
Income tax provision (benefit) | | $ | 173 | | $ | 128 | | $ | — | |
| | | | | | | | |
| | | | | | | | | | | |
| | | | | | | | | | | |
| | | | | | | | |
The difference in total provision for income taxes that would result from applying the 35% federal statutory rate to the net loss before provision for income taxes and the reported provision for income taxes are as follows:
| | | | | | | | | | |
| | Fiscal Year Ended January 31, | |
|---|
| | 2014 | | 2013 | | 2012 | |
|---|
Reconciliation of effective tax rate: | | | | | | | | | | |
Federal taxes at statutory rate | | | 35.0 | % | | 35.0 | % | | 35.0 | % |
State taxes, net of federal benefit | | | 3.6 | | | 2.5 | | | 2.7 | |
Permanent items | | | (9.2 | ) | | (8.4 | ) | | (4.7 | ) |
Valuation allowance | | | (34.3 | ) | | (40.6 | ) | | (39.7 | ) |
Research and experimentation credits | | | — | | | 10.1 | | | 6.5 | |
Foreign rate differential | | | 1.2 | | | 0.3 | | | (0.3 | ) |
Other | | | 2.8 | | | (0.1 | ) | | 0.5 | |
| | | | | | | | |
| | | | | | | | | | | |
Effective income tax rate | | | (0.9 | )% | | (1.2 | )% | | — | % |
| | | | | | | | |
| | | | | | | | | | | |
| | | | | | | | | | | |
| | | | | | | | |
F-30
Table of Contents
RALLY SOFTWARE DEVELOPMENT CORP.
Notes to Consolidated Financial Statements (Continued)
(12) Income Taxes (Continued)
Components of the net deferred tax assets as of January 31, 2014 and 2013 are as follows (in thousands):
| | | | | | | |
| | January 31, | |
|---|
| | 2014 | | 2013 | |
|---|
Deferred tax assets: | | | | | | | |
Research and experimentation carryforwards | | $ | 3,704 | | $ | 3,704 | |
Net operating loss carryforwards | | | 28,390 | | | 24,312 | |
Deferred compensation | | | 587 | | | 397 | |
Deferred revenue | | | 2,052 | | | 356 | |
Intangible assets | | | 293 | | | 134 | |
Deferred rent | | | 618 | | | 374 | |
Other | | | 836 | | | 318 | |
| | | | | | |
| | | | | | | | |
Gross deferred tax assets | | | 36,480 | | | 29,595 | |
| | | | | | |
| | | | | | | | |
Deferred tax liabilities: | | | | | | | |
Fixed assets | | | 229 | | | 240 | |
Other | | | — | | | — | |
| | | | | | |
| | | | | | | | |
Gross deferred tax liabilities | | | 229 | | | 240 | |
| | | | | | |
| | | | | | | | |
Net deferred tax assets before valuation allowance | | | 36,251 | | | 29,355 | |
Valuation allowance | | | (36,251 | ) | | (29,355 | ) |
| | | | | | |
| | | | | | | | |
Deferred tax assets (liabilities), net | | $ | — | | $ | — | |
| | | | | | |
| | | | | | | | |
| | | | | | | | |
| | | | | | |
In the fourth quarter of fiscal year ended January 31, 2014, we completed an intercompany sale of certain intangible assets between our Finland subsidiary and us. In connection with this sale, we incurred a $0.6 million current tax liability in Finland. A deferred charge of $0.3 million related to the sale is presented in other assets in accordance with the intercompany asset sale guidance required by GAAP.
We have historically incurred operating losses in the United States and, given our cumulative losses and limited history of profits, we have recorded a full valuation allowance against our United States deferred tax assets for all periods to date.
Our ability to use the operating loss carryforwards to offset future taxable income is subject to restrictions enacted in the U.S. Internal Revenue Code of 1986, as amended. These restrictions limit the future use of the operating loss carryforwards if certain ownership changes described in the Internal Revenue Code occur.
During the fiscal years ended January 31, 2014 and 2013, the valuation allowance increased by $6.9 million and $4.3 million, respectively, due to the increase in deferred tax assets, primarily the net operating loss and research and experimentation tax credit carryforwards.
As of January 31, 2014, we had federal and state net operating loss carryforwards of approximately $75.3 million and $56.5 million, respectively. At January 31, 2014, we also had federal research and experimentation tax credit carryforwards of $3.7 million. The net operating loss carryforwards and tax credits expire at various dates through January 31, 2034.
F-31
Table of Contents
RALLY SOFTWARE DEVELOPMENT CORP.
Notes to Consolidated Financial Statements (Continued)
(12) Income Taxes (Continued)
We believe that we have not taken an uncertain tax position on prior tax filings and therefore have not recorded a liability for unrecognized tax benefits.
We file federal, state, and foreign income tax returns in jurisdictions with varying statutes of limitations. With few exceptions, tax years 2001 through 2013 remain subject to examination by federal and most state tax authorities due to our net operating loss carryforwards. In the foreign jurisdictions, the 2009 through 2013 tax years remain subject to examination.
(13) Net Loss Per Share Attributable to Common Stockholders
We calculate basic and diluted net loss per share of common stock by dividing net loss attributed to common stockholders by the weighted-average number of shares of common stock outstanding during the period. We have excluded all potentially dilutive shares, which include redeemable convertible preferred stock, warrants for redeemable convertible preferred stock and common stock, outstanding common stock options, outstanding restricted stock units and restricted common stock, from the weighted-average number of shares of common stock outstanding as their inclusion in the computation for all periods would be antidilutive due to net losses. Our redeemable, convertible preferred stock and unvested common stock issued pursuant to the "early exercise" of options are participating securities and are excluded from the earnings per share calculation as they do not have an obligation to share or fund in our net losses.
The following common stock equivalents were excluded from consideration in diluted net loss per share because they had an antidilutive impact:
| | | | | | | | | | |
| | Fiscal Year Ended January 31, | |
|---|
| | 2014 | | 2013 | | 2012 | |
|---|
Options to purchase common stock(1) | | | 1,218,531 | | | 1,597,354 | | | 1,872,091 | |
Warrants to purchase redeemable convertible preferred stock | | | — | | | 137,646 | | | 137,646 | |
Warrants to purchase common stock | | | 13,728 | | | 48,400 | | | 48,400 | |
Restricted common stock | | | — | | | 9,600 | | | 15,564 | |
Restricted stock units | | | 458,982 | | | — | | | — | |
Redeemable convertible preferred stock | | | — | | | 14,335,869 | | | 14,335,869 | |
ESPP obligations(2) | | | 43,364 | | | — | | | — | |
| | | | | | | | |
| | | | | | | | | | | |
| | | 1,734,605 | | | 16,128,869 | | | 16,409,570 | |
| | | | | | | | |
| | | | | | | | | | | |
| | | | | | | | | | | |
| | | | | | | | |
- (1)
- Options to purchase common stock represent options in-the-money at January 31, 2014, 2013 and 2012.
- (2)
- ESPP obligation for the fiscal year ending January 31, 2014 represents an estimate, which includes the employee contributions withheld as of January 31, 2014.
F-32
Table of Contents
RALLY SOFTWARE DEVELOPMENT CORP.
Notes to Consolidated Financial Statements (Continued)
(13) Net Loss Per Share Attributable to Common Stockholders (Continued)
Basic and diluted net loss per share is calculated as follows (in thousands, except per share data):
| | | | | | | | | | |
| | Fiscal Year Ended January 31, | |
|---|
| | 2014 | | 2013 | | 2012 | |
|---|
Numerator: | | | | | | | | | | |
Net loss | | $ | (20,131 | ) | $ | (10,780 | ) | $ | (11,592 | ) |
Accretion of redeemable convertible preferred stock | | | — | | | — | | | (22 | ) |
Preferred stock deemed dividend | | | — | | | — | | | (762 | ) |
| | | | | | | | |
| | | | | | | | | | | |
Net loss attributable to common stockholders | | $ | (20,131 | ) | $ | (10,780 | ) | $ | (12,376 | ) |
| | | | | | | | |
| | | | | | | | | | | |
| | | | | | | | | | | |
| | | | | | | | |
Denominator: | | | | | | | | | | |
Weighted-average shares of common stock outstanding, basic and diluted | | | 19,841 | | | 2,101 | | | 1,869 | |
| | | | | | | | |
| | | | | | | | | | | |
| | | | | | | | | | | |
| | | | | | | | |
Net loss per share of common stock, basic and diluted | | $ | (1.01 | ) | $ | (5.13 | ) | $ | (6.62 | ) |
| | | | | | | | |
| | | | | | | | | | | |
| | | | | | | | | | | |
| | | | | | | | |
(14) Employee Benefit Plan
In 2004, we adopted the Rally Software Development Corp. 401(k) Plan (the 401(k) Plan). The 401(k) Plan is available to all full-time employees with eligibility commencing on the first day of employment following attainment of age 21. Employees may contribute up to 90% of their eligible compensation, not to exceed the amounts allowed by law. Currently, there is no employer contribution or matching provisions in the 401(k) Plan.
(15) Commitments and Contingencies
We lease office space and certain equipment under operating leases having terms that expire at various dates through May 2025. On June 10, 2013, we entered into an amended and restated office lease, which superseded and replaced our lease for our corporate headquarters located in Boulder, Colorado. In addition to the office space we currently occupy, the amended and restated office lease provides for the lease by us of an additional 89,000 square feet of office space in a building to be constructed adjacent to our current office space.
The initial term of the amended and restated office lease is ten years and will commence upon the occupancy date of the new building, currently expected to be on or about June 1, 2015, and extend through May 31, 2025, in each case subject to change based on the construction schedule. The lease term for the current office space has been extended to end contemporaneously with the end of the initial term for the amended and restated office lease. We have the option to extend the term of the lease for two periods of five years each.
In September 2013, and as required in the amended and restated office lease, we placed $4.2 million in a bank account that is pledged to the landlord as a security deposit. This restricted cash is reflected as restricted long-term cash on our balance sheet and replaces the former security deposit, which was a $2.5 million letter of credit that has been cancelled. Provided that we have not been in
F-33
Table of Contents
RALLY SOFTWARE DEVELOPMENT CORP.
Notes to Consolidated Financial Statements (Continued)
(15) Commitments and Contingencies (Continued)
default under the amended and restated office lease and have met certain financial covenants during the five-year period commencing upon our occupancy of the new building, we have the right to reduce the cash security deposit to $2.1 million. The amended and restated lease also provides us with a tenant finish allowance of approximately $4.6 million.
We occupy additional leased facilities of approximately 10,000 square feet in Raleigh, North Carolina and approximately 5,200 square feet in the Seattle, Washington area.
We also occupy additional leased facilities of less than 5,000 square feet each in Denver, Colorado; London, England; Melbourne, Australia; Helsinki, Finland; Singapore; and Amsterdam, the Netherlands.
Total rent expense for the fiscal years ended January 31, 2014, 2013 and 2012 was $2.3 million, $1.6 million and $0.4 million, respectively.
As of January 31, 2014, future minimum lease payments under operating leases (assuming a June 1, 2015 commencement date for the amended and restated office lease) were as follows (in thousands):
| | | | |
Fiscal year ended January 31: | | | | |
2015 | | $ | 2,730 | |
2016 | | | 4,164 | |
2017 | | | 4,625 | |
2018 | | | 4,520 | |
2019 | | | 4,419 | |
Thereafter | | | 29,491 | |
| | | | |
| | | | | |
Total future minimum lease payments | | $ | 49,949 | |
| | | | |
| | | | | |
| | | | | |
| | | | |
In the normal course of business, we may, from time to time, be subject to pending and threatened legal actions and proceedings. While the results of any litigation or other legal proceedings are uncertain, management does not believe the ultimate resolution of any pending legal matters is likely to have a material adverse effective on our financial position, results of operations or cash flows, except for those matters for which we have recorded a loss contingency. We accrue for loss contingencies when it is both probable that we will incur the loss and when the amount of the loss can be reasonably estimated. As of January 31, 2014, there were no material pending or threatened legal actions or proceedings against us.
Our arrangements with customers generally include an indemnification provision that we will indemnify and defend a customer in actions brought against the customer that claim our solutions and services infringe upon a valid patent, copyright, or trademark. Historically, we have not incurred any costs related to indemnification claims.
F-34
Table of Contents
RALLY SOFTWARE DEVELOPMENT CORP.
Notes to Consolidated Financial Statements (Continued)
(15) Commitments and Contingencies (Continued)
Effective January 1, 2013, we use a combination of insurance and self-insurance plans to provide for the potential liabilities for employee medical health care benefits. Claims with dates of service prior to January 1, 2013 were covered and paid by our prior premium-based medical insurance plan. Liabilities associated with the risks that are retained by us are estimated by considering historical claims experience and severity factors. We have individual employee stop-loss as well as overall stop-loss coverage to limit our total exposure. Our estimated self-insurance liability for claims incurred but not reported was approximately $0.1 million and $0.2 million at January 31, 2014 and 2013, respectively, which amount was included in accrued liabilities in the accompanying consolidated balance sheets.
During the fiscal year ended January 31, 2014, we recorded in sales and marketing expense severance obligations of approximately $1.1 million consisting of $1.0 million in cash and $0.1 million in stock-based compensation. As of January 31, 2014, approximately $0.2 million was included in accrued liabilities in the accompanying consolidated balance sheet. The remaining balance will be paid in the first quarter of the fiscal year ended January 31, 2015.
(16) Subsequent Event
We have evaluated subsequent events that occurred after January 31, 2014 through April 11, 2014, the date at which the consolidated financial statements were issued. No material events were identified.
F-35
Table of Contents
EXHIBIT INDEX
| | | |
Exhibit
No. | | Description |
|---|
| | 3.1 | | Amended and Restated Certificate of Incorporation of Rally Software Development Corp. (incorporated by reference to Exhibit 3.1 to the Registrant's Quarterly Report on Form 10-Q (File No. 001-35868) as filed with the Securities and Exchange Commission on June 13, 2013) |
|
3.2 |
|
Amended and Restated Bylaws of Rally Software Development Corp. as currently in effect (incorporated by reference to Exhibit 3.2 to the Registrant's Quarterly Report on Form 10-Q (File No. 001-35868) as filed with the Securities and Exchange Commission on June 13, 2013) |
|
4.1 |
|
Form of Rally Software Development Corp.'s Common Stock Certificate (incorporated herein by reference to Exhibit 4.1 of the Registrant's Registration Statement on Form S-1, as amended (File No. 333-187173), originally filed with the Securities and Exchange Commission on March 11, 2013) |
|
10.1.1 |
|
Fourth Amended and Restated Investor Rights Agreement, by and among Rally Software Development Corp. and the investors named therein, dated as of May 27, 2011 (incorporated by reference to Exhibit 10.1 of the Registrant's Registration Statement on Form S-1, as amended (File No. 333-187173), originally filed with the Securities and Exchange Commission on March 11, 2013) |
|
10.1.2 |
|
Amendment No. 1 to Fourth Amended and Restated Investor Rights Agreement, by and among Rally Software Development Corp. and the stockholders named therein, dated as of April 1, 2013 (incorporated by reference to Exhibit 10.1.1 to the Registrant's Registration Statement on Form S-1, as amended (File No. 333-187173), originally filed with the Securities and Exchange Commission on March 11, 2013) |
|
10.2.1 |
+ |
Rally Software Development Corp. Amended and Restated 2002 Stock Option Plan (incorporated by reference to Exhibit 99.1 to the Registrant's Registration Statement on Form S-8 (File No. 333-187889), as filed with the Securities and Exchange Commission on April 12, 2013) |
|
10.2.2 |
+ |
Forms of Stock Option Agreement and Option Grant Notice under Amended and Restated 2002 Stock Option Plan (incorporated herein by reference to Exhibit 10.2.2 to the Registrant's Registration Statement on Form S-1, as amended (File No. 333-187173), originally filed with the Securities and Exchange Commission on March 11, 2013) |
|
10.3.1 |
+ |
Rally Software Development Corp. 2013 Equity Incentive Plan (incorporated by reference to Exhibit 99.2 to the Registrant's Registration Statement on Form S-8 (File No. 333-187889), as filed with the Securities and Exchange Commission on April 12, 2013) |
|
10.3.2 |
+ |
Form of Stock Option Agreement and Option Grant Notice under 2013 Equity Incentive Plan (incorporated herein by reference to Exhibit 10.3.2 to the Registrant's Registration Statement on Form S-1, as amended (File No. 333-187173), originally filed with the Securities and Exchange Commission on March 11, 2013) |
|
10.3.3 |
+ |
Form of Restricted Stock Unit Award Agreement and Notice of Grant Award under 2013 Equity Incentive Plan (incorporated herein by reference to Exhibit 10.3.3 to the Registrant's Registration Statement on Form S-1, as amended (File No. 333-187173), originally filed with the Securities and Exchange Commission on March 11, 2013) |
|
10.4 |
+ |
Rally Software Development Corp. 2013 Employee Stock Purchase Plan, as amended |
Table of Contents
| | | |
Exhibit
No. | | Description |
|---|
| | 10.5 | + | Form of Indemnification Agreement made by and between Rally Software Development Corp. and each of its directors and officers(incorporated herein by reference to Exhibit 10.5 to the Registrant's Registration Statement on Form S-1, as amended (File No. 333-187173), originally filed with the Securities and Exchange Commission on March 11, 2013) |
|
10.6 |
|
Amended and Restated Office Lease by and between Rally Software Development Corp. and 3333 Walnut, LLC, dated as of June 10, 2013 (incorporated by reference to Exhibit 10.12 to the Registrant's Quarterly Report on Form 10-Q (File No. 001-35868) as filed with the Securities and Exchange Commission on June 13, 2013) |
|
10.7.1 |
|
Amended and Restated Loan and Security Agreement by and between Rally Software Development Corp. and Square 1 Bank, dated as of December 22, 2010, as amended on July 28, 2011, December 16, 2011, February 3, 2012, April 24, 2012 and January 30, 2013 (incorporated herein by reference to Exhibit 10.7 to the Registrant's Registration Statement on Form S-1, as amended (File No. 333-187173), originally filed with the Securities and Exchange Commission on March 11, 2013) |
|
10.7.2 |
|
Sixth Amendment to Amended and Restated Loan and Security Agreement by and between Rally Software Development Corp. and Square 1 Bank, dated as of June 19, 2013 (incorporated herein by reference to Exhibit 10.7.2 to the Registrant's Registration Statement on Form S-1, as amended (File No. 333-189928), originally filed with the Securities and Exchange Commission on July 12, 2013) |
|
10.7.3 |
|
Seventh Amendment to Amended and Restated Loan and Security Agreement by and between Rally Software Development Corp. and Square 1 Bank, dated October 2, 2013 (incorporated by reference to Exhibit 10.2 to the Registrant's Quarterly Report on Form 10-Q (File No. 001-35868) as filed with the Securities and Exchange Commission on December 11, 2013) |
|
10.7.4 |
|
Eighth Amendment to Amended and Restated Loan and Security Agreement by and between Rally Software Development Corp. and Square 1 Bank, dated December 13, 2013 |
|
10.8 |
|
Amended and Restated Warrant to Purchase Stock dated May 15, 2013, held by SVB Financial Group (incorporated herein by reference to Exhibit 10.10 to the Registrant's Registration Statement on Form S-1, as amended (File No. 333-189928), originally filed with the Securities and Exchange Commission on July 12, 2013) |
|
10.9 |
|
Amended and Restated Warrant to Purchase Stock dated May 16, 2013, issued to Square 1 Bank (incorporated herein by reference to Exhibit 10.11 to the Registrant's Registration Statement on Form S-1, as amended (File No. 333-189928), originally filed with the Securities and Exchange Commission on July 12, 2013) |
|
10.10 |
|
Amended and Restated Warrant to Purchase Stock, dated May 16, 2013 issued to Square 1 Bank (incorporated herein by reference to Exhibit 10.13 to the Registrant's Registration Statement on Form S-1, as amended (File No. 333-189928), originally filed with the Securities and Exchange Commission on July 12, 2013) |
|
10.11 |
|
Form of Warrant to purchase Common Stock, dated May 20, 2008, and a schedule of warrant holders (incorporated herein by reference to Exhibit 10.12 to the Registrant's Registration Statement on Form S-1, as amended (File No. 333-187173), originally filed with the Securities and Exchange Commission on March 11, 2013) |
|
10.12 |
+ |
Rally Software Development Corp. Change in Control Severance Plan, as amended |
|
10.13.1 |
+ |
Management bonus program for the second quarter of fiscal 2012 (incorporated herein by reference to Exhibit 10.14.2 to the Registrant's Registration Statement on Form S-1, as amended (File No. 333-187173), originally filed with the Securities and Exchange Commission on March 11, 2013) |
Table of Contents
| | | |
Exhibit
No. | | Description |
|---|
| | 10.13.2 | + | Written description of management bonus program for the third quarter of fiscal 2012 (incorporated herein by reference to Exhibit 10.14.3 to the Registrant's Registration Statement on Form S-1, as amended (File No. 333-187173), originally filed with the Securities and Exchange Commission on March 11, 2013) |
|
10.13.3 |
+ |
Management bonus program for the fourth quarter of fiscal 2012 (incorporated herein by reference to Exhibit 10.14.4 to the Registrant's Registration Statement on Form S-1, as amended (File No. 333-187173), originally filed with the Securities and Exchange Commission on March 11, 2013) |
|
10.13.4 |
+ |
Management bonus program for the first half of fiscal 2013 (incorporated herein by reference to Exhibit 10.14.5 to the Registrant's Registration Statement on Form S-1, as amended (File No. 333-187173), originally filed with the Securities and Exchange Commission on March 11, 2013) |
|
10.13.5 |
+ |
Management bonus program for the second half of fiscal 2013 (incorporated herein by reference to Exhibit 10.14.6 to the Registrant's Registration Statement on Form S-1, as amended (File No. 333-187173), originally filed with the Securities and Exchange Commission on March 11, 2013) |
|
10.13.6 |
+ |
Management bonus program for the first half of fiscal 2014 (incorporated herein by reference to Exhibit 10.14.7 to the Registrant's Registration Statement on Form S-1, as amended (File No. 333-187173), originally filed with the Securities and Exchange Commission on March 11, 2013) |
|
10.13.7 |
+ |
FY2014 Metric Based Bonus Plan of Rally Software Development Corp (incorporated by reference to Exhibit 10.1 to the Registrant's Quarterly Report on Form 10-Q (File No. 001-35868) as filed with the Securities and Exchange Commission on December 11, 2013) |
|
10.13.8 |
+ |
FY2015 Metric Based Bonus—Executive Plan of Rally Software Development Corp (incorporated by reference to Exhibit 10.1 to the Registrant's Current Report on Form 8-K (File No. 001-35868) as filed with the Securities and Exchange Commission on April 1, 2014. |
|
10.14.1 |
+ |
Sales Compensation Plan between Rally Software Development Corp. and Don F. Hazell for the second quarter of fiscal 2012 (incorporated herein by reference to Exhibit 10.15.2 to the Registrant's Registration Statement on Form S-1, as amended (File No. 333-187173), originally filed with the Securities and Exchange Commission on March 11, 2013) |
|
10.14.2 |
+ |
Sales Compensation Plan between Rally Software Development Corp. and Don F. Hazell for the third quarter of fiscal 2012 (incorporated herein by reference to Exhibit 10.15.3 to the Registrant's Registration Statement on Form S-1, as amended (File No. 333-187173), originally filed with the Securities and Exchange Commission on March 11, 2013) |
|
10.14.3 |
+ |
Sales Compensation Plan between Rally Software Development Corp. and Don F. Hazell for the fourth quarter of fiscal 2012 (incorporated herein by reference to Exhibit 10.15.4 to the Registrant's Registration Statement on Form S-1, as amended (File No. 333-187173), originally filed with the Securities and Exchange Commission on March 11, 2013) |
|
10.14.4 |
+ |
Sales Compensation Plan between Rally Software Development Corp. and Don F. Hazell for the first quarter of fiscal 2013 (incorporated herein by reference to Exhibit 10.15.5 to the Registrant's Registration Statement on Form S-1, as amended (File No. 333-187173), originally filed with the Securities and Exchange Commission on March 11, 2013) |
Table of Contents
| | | |
Exhibit
No. | | Description |
|---|
| | 10.14.5 | + | Sales Compensation Plan between Rally Software Development Corp. and Don F. Hazell for the second quarter of fiscal 2013 (incorporated herein by reference to Exhibit 10.15.6 to the Registrant's Registration Statement on Form S-1, as amended (File No. 333-187173), originally filed with the Securities and Exchange Commission on March 11, 2013) |
|
10.14.6 |
+ |
Sales Compensation Plan between Rally Software Development Corp. and Don F. Hazell for the third quarter of fiscal 2013 (incorporated herein by reference to Exhibit 10.15.7 to the Registrant's Registration Statement on Form S-1, as amended (File No. 333-187173), originally filed with the Securities and Exchange Commission on March 11, 2013) |
|
10.14.7 |
+ |
Sales Compensation Plan between Rally Software Development Corp. and Don F. Hazell for the fourth quarter of fiscal 2013 (incorporated herein by reference to Exhibit 10.15.8 to the Registrant's Registration Statement on Form S-1, as amended (File No. 333-187173), originally filed with the Securities and Exchange Commission on March 11, 2013) |
|
10.14.8 |
+ |
Sales Compensation Plan between Rally Software Development Corp. and Don F. Hazell for the first quarter of fiscal 2014 (incorporated herein by reference to Exhibit 10.15.9 to the Registrant's Registration Statement on Form S-1, as amended (File No. 333-187173), originally filed with the Securities and Exchange Commission on March 11, 2013) |
|
10.14.9 |
+ |
Sales Compensation Plan between Rally Software Development Corp. and Don F. Hazell for the second quarter of fiscal 2014 (incorporated by reference to Exhibit 10.1 to the Registrant's Current Report on Form 8-K (File No. 001-35868) as filed with the Securities and Exchange Commission on June 6, 2013) |
|
10.15 |
+ |
Separation Agreement and General Release by and between Rally Software Development Corp. and Don Hazell, dated November 13, 2013 (incorporated by reference to Exhibit 10.3 to the Registrant's Quarterly Report on Form 10-Q (File No. 001-35868) as filed with the Securities and Exchange Commission on December 11, 2013) |
|
10.16 |
+ |
Sales Compensation Plan between Rally Software Development Corp. and Daniel A. Patton for the fourth quarter of fiscal 2014 |
|
21.1 |
|
List of subsidiaries (incorporated herein by reference to Exhibit 21.1 to the Registrant's Registration Statement on Form S-1, as amended (File No. 333-187173), originally filed with the Securities and Exchange Commission on March 11, 2013) |
|
23.1 |
|
Consent of Independent Registered Public Accounting Firm |
|
24.1 |
|
Power of Attorney (included on signature page) |
|
31.1 |
|
Certification of Principal Executive Officer pursuant to Rule 13a-14(a) or Rule 15d-14(a) of the Securities Exchange Act of 1934, as amended |
|
31.2 |
|
Certification of Principal Financial Officer pursuant Rule 13a-14(a) or Rule 15d-14(a) of the Securities Exchange Act of 1934, as amended |
|
32.1 |
|
Certification of Principal Executive Officer pursuant to 18 U.S.C. 1350 (1) |
|
32.2 |
|
Certification of Principal Financial Officer pursuant to 18 U.S.C. 1350 (1) |
|
101.INS |
* |
XBRL Instance Document. |
|
101.SCH |
* |
XBRL Taxonomy Extension Schema Document |
|
101.CAL |
* |
XBRL Taxonomy Calculation Linkbase Document |
|
101.DEF |
* |
XBRL Taxonomy Extension Definition Linkbase Document |
|
101.LAB |
* |
XBRL Taxonomy Label Linkbase Document |
Table of Contents
| | | |
Exhibit
No. | | Description |
|---|
| | 101.PRE | * | XBRL Taxonomy Presentation Linkbase Document |
- +
- Indicates management contract or compensatory plan.
- *
- Attached as Exhibit 101 to this report are the following formatted in XBRL (Extensible Business Reporting Language): (i) Consolidated Balance Sheets at January 31, 2013 and January 31, 2014, (ii) Consolidated Statements of Operations for each of the years in the three-year period ended January 31, 2014, (iii) Consolidated Statements of Comprehensive Loss for each of the years in the three-year period ended January 31, 2014, (iv) Consolidated Statements of Cash Flows for each of the years in the three-year period ended January 31, 2014, and (v) Notes to Consolidated Financial Statements.
In accordance with Rule 406T of Regulation S-T, the XBRL-related information in Exhibit 101 to this Annual Report on Form 10-K is deemed not filed or part of a registration statement or prospectus for purposes of sections 11 or 12 of the Securities Act, is deemed not filed for purposes of section 18 of the Exchange Act, and otherwise is not subject to liability under these sections.
- (1)
- This certification accompanies the Annual Report on Form 10-K to which it relates, is not deemed filed with the SEC and is not to be incorporated by reference into any filing of the Registrant under the Securities Act or the Exchange Act (whether made before or after the date of the Annual Report on Form 10-K), irrespective of any general incorporation language contained in such filing.