UNITED STATES
SECURITIES AND EXCHANGE COMMISSION
Washington, D.C. 20549
FORM N-CSR
CERTIFIED SHAREHOLDER REPORT OF REGISTERED
MANAGEMENT INVESTMENT COMPANIES
Investment Company Act file number 811-21700
Tortoise North American Energy Corporation
(Exact name of registrant as specified in charter)
11550 Ash Street, Suite 300, Leawood, KS 66211
(Address of principal executive offices) (Zip code)
Terry Matlack
Diane Bono
11550 Ash Street, Suite 300, Leawood, KS 66211
(Name and address of agent for service)
913-981-1020
Registrant's telephone number, including area code
Date of fiscal year end: November 30
Date of reporting period: November 30, 2013
Item 1. Report to Stockholders.
![]()
Tortoise North American Energy Corp. (NYSE: TYN) is a non-diversified closed-end investment company focused primarily on investing in equity securities of companies in the energy sector with their primary operations in North America, including oil and gas exploitation, energy infrastructure and energy shipping companies. Our investments are primarily in Master Limited Partnerships (MLPs) and their affiliates, but may also include Canadian royalty and income trusts, common stock, debt and other securities issued by energy companies that are not MLPs.
Investment Goals: Yield, Growth and Quality
TYN seeks a high level of total return with an emphasis on current distributions paid to stockholders.
In seeking to achieve yield, we target distributions to our stockholders that are roughly equal to the underlying yield on a direct investment in MLPs. In order to accomplish this, we maintain our strategy of investing primarily in companies in the energy sector with attractive current yields and growth potential.
We seek to achieve distribution growth as revenues of our underlying companies grow with the economy, with the population and through rate increases. This revenue growth generally leads to increased operating profits, and when combined with internal expansion projects and acquisitions, is expected to provide attractive growth in distributions to us.
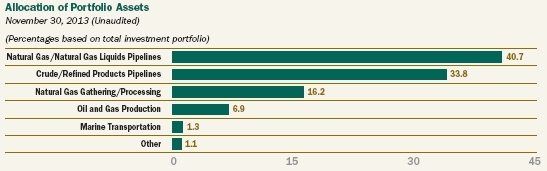
TYN seeks to achieve quality by investing in companies operating energy infrastructure assets that are critical to the North American economy. Often these assets would be difficult to replicate. We also back experienced management teams with successful track records. By investing in TYN, our stockholders have access to a portfolio that is diversified through geographic regions and across product lines, including natural gas, natural gas liquids, crude oil and refined products.
About U.S. Energy Infrastructure Master Limited Partnerships (MLPs)
MLPs are limited partnerships whose units trade on public exchanges such as the New York Stock Exchange (NYSE), the NYSE Alternext US and the NASDAQ. Buying MLP units makes an investor a limited partner in the MLP. There are currently more than 100 MLPs in the market in industries related to energy and natural resources. We invest primarily in MLPs in the energy infrastructure sector. Energy infrastructure MLPs are engaged in the transportation, storage and processing of crude oil, natural gas and refined products from production points to the end users.
TYN Investment Features
We provide stockholders an alternative to investing directly in MLPs and their affiliates. We offer investors the opportunity to receive an attractive distribution return with a historically low return correlation to returns on stocks and bonds.
Additional features include:
- One Form 1099 per stockholder at the end of the year, multiple K-1s and multiple state filings for individual partnership investments;
- A professional management team, with more than 130 years combined investment experience;
- The ability to access investment grade credit markets to enhance stockholder return; and
- Access to direct placements and other investments not available through the public market.

December 31, 2013
Dear Fellow Stockholders,
The fiscal year ending Nov. 30, 2013 was an upbeat one for MLPs, which continued to benefit from strong oil and natural gas production that drove substantial energy infrastructure build-out across North America. MLPs’ performance, and particularly that of midstream MLPs, during the year was again reflective of the strength of their underlying fundamentals.
Despite some periods of volatility, the broad equity market also enjoyed a positive year, supported by continued low interest rates, strengthening corporate balance sheets and improvements in employment and manufacturing. The year also presented some macroeconomic challenges, chief among them geopolitical tension at times in the Middle East and continued partisan gridlock in Washington that resulted in a partial shutdown of the government in the final fiscal quarter of the year. Despite these transitory headwinds, investors remained upbeat about the domestic energy renewal underway in North America, where increasing production requires additional pipeline infrastructure to connect the growing volumes of newly discovered oil and gas from production areas to end users.
Master Limited Partnership Sector Review
The Tortoise MLP Index® posted a strong 24.1 percent total return for the fiscal year ending Nov. 30, 2013, but nonetheless trailed the broad market as represented by the S&P 500 Index®, which posted a 30.3 percent total return for the same period. MLPs enjoyed generally upward momentum during the fiscal year, although performance slowed a bit in the third quarter in response to the looming government shutdown and interest rate uncertainty. However, those concerns abated as the fiscal year wound to a close, with both equities and MLPs ending the year solidly in positive territory. During the fiscal year, midstream MLPs significantly outperformed upstream MLPs, as reflected by the Tortoise Midstream MLP Index’s 27.2 percent gain relative to the Tortoise Upstream MLP Index’s 2.2 percent total return. Some upstream MLPs continued to battle significant market and regulatory headwinds from concerns around accounting for hedging and maintenance capital spending, which ultimately restrained their performance.
Both the upstream and midstream sectors of the energy value chain continued to benefit from escalating production out of North America’s resource-rich shales. According to the U.S. Energy Information Administration, U.S. crude oil production is up 50 percent since 2008, with production topping 8 million barrels per day by fiscal year end. This production continues to drive growth activity for midstream MLPs, which are responding to the critical need for additional infrastructure. We project approximately $60 billion in MLP projects in the three years ending 2015. The project backlog for crude oil and liquids pipelines continues to be healthy. The latest projects include debottlenecking along the Gulf Coast refining complex and additional capacity being added out of the Permian basin.
Capital markets continued to underpin sector strength, with MLPs raising nearly $73 billion in equity and debt offerings during the fiscal year, surpassing the total for 2012. There were 18 MLP IPOs in fiscal 2013, six of them occurring in the fourth quarter, bringing the total raised for the year to approximately $4.6 billion. Merger and acquisition (M&A) activity has also been healthy; approximately $59 billion in MLP transactions were announced during the fiscal year, also surpassing 2012 totals. The largest transactions announced during the year include Spectra Energy’s drop-down of its U.S. midstream assets to its MLP in a deal valued at $12.3 billion, Regency Energy Partners’ plans to acquire PVR Partners, a natural gas midstream pipeline MLP, for $5.6 billion, and Kinder Morgan Energy Partners’ $5 billion acquisition of Copano Energy, L.L.C., a gathering and processing MLP.
(Unaudited)
2013 Annual Report 1

Fund Performance Review
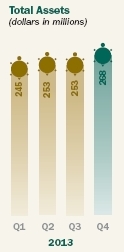
The fund’s total assets increased from approximately $226.0 million on Nov. 30, 2012 to $267.5 million on Nov. 30, 2013, primarily from net realized and unrealized gains on investments as well as approximately $4 million in new leverage proceeds. For the fiscal year, the fund’s market-based total return was 15.6 percent and its NAV-based total return was 20.1 percent (both including the reinvestment of distributions). The difference between the market value total return and the NAV total return reflected a widening in the discount of the fund’s stock price relative to its NAV over the year.
The fund’s asset performance during the fiscal year was boosted by its exposure to gathering and processing MLPs that benefited from solid fee-based growth profiles related to the increasing demand for and production of natural gas liquids. Additional contributors during the fiscal year included crude oil pipeline MLPs whose success was tied to greater volumes transported due to the robust production and refined products pipeline MLPs whose performance was supported by an attractive tariff and increasing exports. Performance also was helped on an absolute basis by natural gas pipeline MLPs benefiting from the infrastructure build-out, particularly in the gas-rich Marcellus shale. Although they contributed positively, they underperformed the broader MLP index during the year due to lower relative short-term growth and some recontracting headwinds. We continue to believe in their longer-term opportunity, particularly tied to the long-term demand potential discussed above. As noted earlier, upstream MLPs experienced some headwinds that restrained relative performance, mitigated to some degree by a partial reallocation earlier in the year to midstream names.
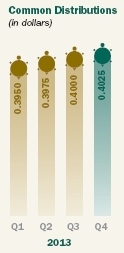
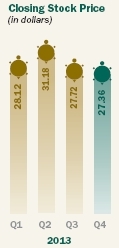
The fund paid a distribution of $0.4025 per common share ($1.61 annualized) to stockholders on Nov. 29, 2013, an increase of 0.6 percent quarter over quarter and of 2.5 percent year over year. This distribution represented an annualized distribution rate of 5.9 percent based on the fund’s fiscal year closing price of $27.36 per share. The distribution payout coverage (distributable cash flow divided by distributions) for the fiscal year was 109.1 percent, reflective of our emphasis on sustainability. For tax purposes, distributions to stockholders for 2013 were 100 percent qualified dividend income.
The fund ended the fiscal year with leverage (bank debt) at 14.4 percent of total assets. Additional information about the fund’s financial performance, distributions and leverage is available in the Key Financial Data and Management’s Discussion sections of this report.
In Remembrance
We are deeply saddened by the recent loss of our founding board member, Dr. John R. Graham, who died on Dec. 20, 2013 after a courageous battle with cancer. John leaves a lasting legacy of being a diligent board member who cared passionately about the investors he represented. During his decade of service, John played an integral role in creating a high standard of governance as the nominating and governance committee chair for the fund. As importantly, John was a respectful, humble person who enriched the lives of those who knew him. We are extremely grateful for his service. He will be missed.
Sincerely,
The Managing Directors
Tortoise Capital Advisors, L.L.C.
The adviser to Tortoise North American Energy Corp.
 |  |  |
| P. Bradley Adams | H. Kevin Birzer | Zachary A. Hamel |
 |  |  |
| Kenneth P. Malvey | Terry Matlack | David J. Schulte |
The Tortoise MLP Index® is a float-adjusted, capitalization-weighted index of energy master limited partnerships (MLPs). The Tortoise Midstream MLP Index, a sub-index of the Tortoise MLP Index®, is comprised of all constituents included in the following sub sectors: Crude Oil Pipelines, Gathering & Processing, Natural Gas Pipelines and Refined Products Pipelines. The Tortoise Upstream MLP Index is comprised of all constituents included in the Tortoise MLP Index’s Coal and Oil & Gas Production sub sector indices. The S&P 500 Index® is a unmanaged market-value-weighted index of stocks, which is widely regarded as the standard for measuring large-cap U.S. stock market performance.
(Unaudited)
2 Tortoise North American Energy Corp.
| Key Financial Data (Supplemental Unaudited Information) (dollar amounts in thousands unless otherwise indicated) |
The information presented below regarding Distributable Cash Flow and Selected Financial Information is supplemental non-GAAP financial information, which we believe is meaningful to understanding our operating performance. The Distributable Cash Flow Ratios include the functional equivalent of EBITDA for non-investment companies, and we believe they are an important supplemental measure of performance and promote comparisons from period-to-period. This information is supplemental, is not inclusive of required financial disclosures (e.g. Total Expense Ratio), and should be read in conjunction with our full financial statements.
| Year Ended November 30, | 2012 | 2013 | ||||||||||||||||||||
| 2012 | 2013 | Q4(1) | Q1(1) | Q2(1) | Q3(1) | Q4(1) | ||||||||||||||||
| Total Income from Investments | ||||||||||||||||||||||
| Distributions received from master limited partnerships | $ | 12,633 | $ | 13,603 | $ | 3,257 | $ | 3,298 | $ | 3,423 | $ | 3,352 | $ | 3,530 | ||||||||
| Dividends paid in stock | 871 | 885 | 241 | 250 | 205 | 211 | 219 | |||||||||||||||
| Dividends from common stock | 467 | 242 | 79 | 53 | 63 | 65 | 61 | |||||||||||||||
| Interest and dividend income | 1 | — | 1 | — | — | — | — | |||||||||||||||
| Other income | — | 13 | — | — | — | — | 13 | |||||||||||||||
| Total from investments | 13,972 | 14,743 | 3,578 | 3,601 | 3,691 | 3,628 | 3,823 | |||||||||||||||
| Operating Expenses Before Leverage Costs and | ||||||||||||||||||||||
| Current Taxes | ||||||||||||||||||||||
| Advisory fees, net of fees waived | 2,178 | 2,504 | 559 | 570 | 640 | 649 | 645 | |||||||||||||||
| Other operating expenses | 493 | 492 | 111 | 129 | 123 | 121 | 119 | |||||||||||||||
| 2,671 | 2,996 | 670 | 699 | 763 | 770 | 764 | ||||||||||||||||
| Distributable cash flow before leverage costs and current taxes | 11,301 | 11,747 | 2,908 | 2,902 | 2,928 | 2,858 | 3,059 | |||||||||||||||
| Leverage costs(2) | 753 | 766 | 190 | 189 | 193 | 192 | 192 | |||||||||||||||
| Current income tax expense(3) | — | — | — | — | — | — | — | |||||||||||||||
| Distributable Cash Flow(4) | $ | 10,548 | $ | 10,981 | $ | 2,718 | $ | 2,713 | $ | 2,735 | $ | 2,666 | $ | 2,867 | ||||||||
| As a percent of average total assets(5) | ||||||||||||||||||||||
| Total from investments | 6.32 | % | 5.85 | % | 6.33 | % | 6.24 | % | 5.77 | % | 5.59 | % | 5.87 | % | ||||||||
| Operating expenses before leverage costs and current taxes | 1.21 | % | 1.19 | % | 1.19 | % | 1.21 | % | 1.19 | % | 1.19 | % | 1.17 | % | ||||||||
| Distributable cash flow before leverage costs and current taxes | 5.11 | % | 4.66 | % | 5.14 | % | 5.03 | % | 4.58 | % | 4.40 | % | 4.70 | % | ||||||||
| As a percent of average net assets(5) | ||||||||||||||||||||||
| Total from investments | 8.69 | % | 8.37 | % | 8.86 | % | 8.83 | % | 8.19 | % | 8.01 | % | 8.50 | % | ||||||||
| Operating expenses before leverage costs and current taxes | 1.66 | % | 1.70 | % | 1.66 | % | 1.71 | % | 1.69 | % | 1.70 | % | 1.70 | % | ||||||||
| Leverage costs and current taxes | 0.47 | % | 0.43 | % | 0.47 | % | 0.46 | % | 0.43 | % | 0.42 | % | 0.43 | % | ||||||||
| Distributable cash flow | 6.56 | % | 6.24 | % | 6.73 | % | 6.66 | % | 6.07 | % | 5.89 | % | 6.37 | % | ||||||||
| Selected Financial Information | ||||||||||||||||||||||
| Distributions paid on common stock | $ | 9,792 | $ | 10,062 | $ | 2,473 | $ | 2,489 | $ | 2,507 | $ | 2,524 | $ | 2,542 | ||||||||
| Distributions paid on common stock per share | 1.5550 | 1.5950 | 0.3925 | 0.3950 | 0.3975 | 0.4000 | 0.4025 | |||||||||||||||
| Distribution coverage percentage for period(6) | 107.7 | % | 109.1 | % | 109.9 | % | 109.0 | % | 109.1 | % | 105.6 | % | 112.8 | % | ||||||||
| Net realized gain, net of income taxes, for the period | 12,025 | 12,732 | 7,239 | 1,513 | 6,156 | 2,661 | 2,402 | |||||||||||||||
| Total assets, end of period | 225,988 | 267,518 | 225,988 | 244,726 | 252,597 | 253,294 | 267,518 | |||||||||||||||
| Average total assets during period(7) | 221,188 | 251,979 | 227,259 | 234,107 | 253,747 | 257,322 | 261,286 | |||||||||||||||
| Leverage(8) | 34,800 | 38,600 | 34,800 | 32,400 | 32,900 | 32,900 | 38,600 | |||||||||||||||
| Leverage as a percent of total assets | 15.4 | % | 14.4 | % | 15.4 | % | 13.2 | % | 13.0 | % | 13.0 | % | 14.4 | % | ||||||||
| Net unrealized appreciation, end of period | 58,204 | 78,978 | 58,204 | 70,500 | 71,249 | 72,694 | 78,978 | |||||||||||||||
| Net assets, end of period | 160,717 | 182,746 | 160,717 | 171,777 | 175,468 | 176,768 | 182,746 | |||||||||||||||
| Average net assets during period(9) | 160,825 | 176,118 | 162,512 | 165,339 | 178,907 | 179,673 | 180,367 | |||||||||||||||
| Net asset value per common share | 25.51 | 28.93 | 25.51 | 27.26 | 27.82 | 28.01 | 28.93 | |||||||||||||||
| Market value per common share | 25.06 | 27.36 | 25.06 | 28.12 | 31.18 | 27.72 | 27.36 | |||||||||||||||
| Shares outstanding (000’s) | 6,301 | 6,316 | 6,301 | 6,301 | 6,306 | 6,311 | 6,316 | |||||||||||||||
| (1) | Q1 is the period from December through February. Q2 is the period from March through May. Q3 is the period from June through August. Q4 is the period from September through November. |
| (2) | Leverage costs include interest expense, interest rate swap expenses and other recurring leverage expenses. |
| (3) | Includes taxes paid on net investment income and foreign taxes, if any. Taxes related to realized gains are excluded from the calculation of Distributable Cash Flow (“DCF”). |
| (4) | “Net investment income (loss), before income taxes” on the Statement of Operations is adjusted as follows to reconcile to DCF: increased by the return of capital on MLP distributions and the value of paid-in-kind distributions; and decreased by realized and unrealized gains (losses) on interest rate swap settlements. |
| (5) | Annualized for periods less than one full year. |
| (6) | Distributable Cash Flow divided by distributions paid. |
| (7) | Computed by averaging month-end values within each period. |
| (8) | Leverage consists of short-term borrowings. |
| (9) | Computed by averaging daily net assets within each period. |
2013 Annual Report 3
Management’s Discussion (Unaudited) |
The information contained in this section should be read in conjunction with our Financial Statements and the Notes thereto. In addition, this report contains certain forward-looking statements. These statements include the plans and objectives of management for future operations and financial objectives and can be identified by the use of forward-looking terminology such as “may,” “will,” “expect,” “intend,” “anticipate,” “estimate,” or “continue” or the negative thereof or other variations thereon or comparable terminology. These forward-looking statements are subject to the inherent uncertainties in predicting future results and conditions. Certain factors that could cause actual results and conditions to differ materially from those projected in these forward-looking statements are set forth in the “Risk Factors” section of our public filings with the SEC.
Overview
Tortoise North American Energy Corp.’s (“TYN” or the “Company”) investment objective is to seek a high level of total return for our stockholders, with an emphasis on distribution income paid to stockholders. Our investment strategy requires us to invest at least 80 percent of our total assets in equity securities of companies in the energy sector with their primary operations in North America, including energy infrastructure, oil and gas production and energy shipping companies. The equity securities of the energy companies purchased by TYN consist primarily of interests in MLPs. MLPs are publicly traded partnerships whose equity interests are traded in the form of units on public exchanges, such as the NYSE or NASDAQ. We invest primarily in MLPs through public market and private purchases. While we are a registered investment company under the Investment Company Act of 1940, as amended (the “1940 Act”), we are not a “regulated investment company” for federal tax purposes. Our distributions do not typically generate unrelated business taxable income (“UBTI”) and our stock may therefore be suitable for holding by pension funds, IRAs and mutual funds, as well as taxable accounts. Tortoise Capital Advisors, L.L.C. serves as our investment adviser.
Company Update
Total assets increased approximately $14.2 million during the 4th quarter, primarily as a result of increased market values of our MLP investments. Average total assets for the quarter increased as compared to 3rd quarter 2013. Distribution increases from our MLP investments were in-line with our expectations. Total leverage as a percent of total assets increased during the quarter and we increased our quarterly distribution to $0.4025 per share. Additional information on these events and results of our operations are discussed in more detail below.
Critical Accounting Policies
The financial statements are based on the selection and application of critical accounting policies, which require management to make significant estimates and assumptions. Critical accounting policies are those that are both important to the presentation of our financial condition and results of operations and require management’s most difficult, complex, or subjective judgments. Our critical accounting policies are those applicable to the valuation of investments, tax matters and certain revenue recognition matters as discussed in Note 2 in the Notes to Financial Statements.
Determining Distributions to Stockholders
Our portfolio generates cash flow from which we pay distributions to stockholders. Our Board of Directors has adopted a policy of declaring what it believes to be sustainable distributions. In determining distributions, our Board of Directors considers a number of current and anticipated factors, including, among others, distributable cash flow (“DCF”), realized and unrealized gains, leverage amounts and rates, current and deferred taxes payable, and potential volatility in returns from our investments and the overall market. While the Board considers many factors in determining distributions to stockholders, particular emphasis is given to DCF and distribution coverage. Distribution coverage is DCF divided by distributions paid to stockholders and is discussed in more detail below. Over the long-term, we expect to distribute substantially all of our DCF to holders of common stock. Our Board of Directors reviews the distribution rate quarterly and may adjust the quarterly distribution throughout the year.
Determining DCF
DCF is distributions received from investments, less expenses. The total distributions received from our investments include the amount received by us as cash distributions from MLPs, paid-in-kind distributions, and dividend and interest payments. The total expenses include current or anticipated operating expenses, leverage costs and current income taxes. Current income taxes include taxes paid on our net investment income in addition to foreign taxes, if any. Taxes incurred from realized gains on the sale of investments, expected tax benefits and deferred taxes are not included in DCF.
The Key Financial Data table discloses the calculation of DCF and should be read in conjunction with this discussion. The difference between distributions received from investments in the DCF calculation and total investment income as reported in the Statement of Operations, is reconciled as follows: the Statement of Operations, in conformity with U.S. generally accepted accounting principles (“GAAP”), recognizes distribution income from MLPs and common stock on their ex-dates, whereas the DCF calculation may reflect distribution income on their pay dates; GAAP recognizes that a significant portion of the cash distributions received from MLPs are characterized as a return of capital and therefore excluded from investment income, whereas the DCF calculation includes the return of capital; and distributions received from investments in the DCF calculation include the value of dividends paid-in-kind (additional stock or MLP units), whereas such amounts are not included as income for GAAP purposes, and includes distributions related to direct investments when the purchase price is reduced in lieu of receiving cash distributions. The treatment of expenses in the DCF calculation also differs from what is reported in the Statement of Operations. In addition to the total operating expenses, including fee waiver, as disclosed in the Statement of Operations, the DCF calculation reflects interest expense,
4 Tortoise North American Energy Corp.
Management’s Discussion (Unaudited) (Continued) |
realized and unrealized gains (losses) on interest rate swap settlements, other leverage expenses, and taxes paid on net investment income. A reconciliation of Net Investment Loss, before Income Taxes to DCF is included below.
Distributions Received from Investments
Our ability to generate cash is dependent on the ability of our portfolio of investments to generate cash flow from their operations. In order to maintain and grow distributions to our stockholders, we evaluate each holding based upon its contribution to our investment income, our anticipation of its growth rate, and its risk relative to other potential investments.
We concentrate on investments we believe can expect an increasing demand for services from economic and population growth. We seek well-managed businesses with hard assets and stable recurring revenue streams.
Total distributions received from our investments for the 4th quarter 2013 were approximately $3.8 million. This represents a 5.4 percent increase as compared to 3rd quarter 2013 and an increase of 6.8 percent as compared to 4th quarter 2012. These changes reflect increases in per share distribution rates on our MLP investments, the distributions received from additional investments funded from leverage proceeds and the impact of various portfolio trading activity. These changes also reflect the receipt of non-recurring distributions and other income in 4th quarter 2013 of approximately $44,000. In addition, one portfolio company changed the timing of its distribution payment which shifted approximately $49,900 of distributions to TYN from the 3rd quarter 2013 to the 4th quarter 2013.
Expenses
We incur two types of expenses: (1) operating expenses, consisting primarily of the advisory fee, and (2) leverage costs. On a percentage basis, operating expenses before leverage costs and current taxes were an annualized 1.17 percent of average total assets for the 4th quarter 2013 as compared to 1.19 percent for the 4th quarter 2012 and 1.19 percent for the 3rd quarter 2013.
Advisory fees and other operating expenses for the 4th quarter 2013 decreased slightly as compared to 3rd quarter 2013.
Leverage costs consist of two major components: (1) the direct interest expense, which will vary from period to period as our margin borrowing facility has a variable interest rate, and (2) the realized and unrealized gain or loss on our interest rate swap settlements. Detailed information on our margin borrowing facility is included in the Liquidity and Capital Resources section below.
Total leverage costs for DCF purposes were approximately $192,000 for the 4th quarter 2013, unchanged as compared to the 3rd quarter 2013. Our average annualized total cost of leverage, including interest rate swaps, was 2.02 percent as of November 30, 2013.
As indicated in Note 9 of our Notes to Financial Statements, we have entered into $25 million notional amount of interest rate swap contracts with The Bank of Nova Scotia in an attempt to reduce a portion of the interest rate risk arising from our leveraged capital structure. TYN has agreed to pay The Bank of Nova Scotia a fixed rate while receiving a floating rate based upon the 1-month U.S. Dollar London Interbank Offered Rate (“LIBOR”). The spread between the fixed swap rate and LIBOR is reflected in our Statement of Operations as a realized or unrealized gain when LIBOR exceeds the fixed rate (The Bank of Nova Scotia pays TYN the net difference) or a realized or unrealized loss when the fixed rate exceeds LIBOR (TYN pays The Bank of Nova Scotia the net difference). The interest rate swap contracts have a weighted average fixed rate of 1.70 percent and weighted average remaining maturity of approximately 4.8 years at November 30, 2013. This swap arrangement effectively fixes the cost of approximately 65 percent of our outstanding leverage as of November 30, 2013 over the remaining swap period.
Interest accrues on the margin facility at a rate equal to 1-month LIBOR plus 0.85 percent and unused balances are subject to a fee of 0.25 percent. The annual rate of leverage may vary in future periods as a result of changes in LIBOR, the utilization of our margin facility, and maturity of our interest rate swap contracts. Additional information on our leverage is disclosed below in Liquidity and Capital Resources and in our Notes to Financial Statements.
Distributable Cash Flow
For 4th quarter 2013, our DCF was approximately $2.9 million, an increase of 5.5 percent as compared to 4th quarter 2012 and an increase of 7.5 percent as compared to 3rd quarter 2013. The changes are the net result of changes to distributions and expenses as outlined above. We declared a distribution of $2.5 million, or $0.4025 per share, during the quarter. This represents an increase of $0.01 per share as compared to 4th quarter 2012 and an increase of $0.0025 per share as compared to 3rd quarter 2013.
Our distribution coverage ratio was 112.8 percent for 4th quarter 2013. Excluding non-recurring income received during 4th quarter 2013, our coverage ratio was 111.0 percent, an increase in the coverage ratio of 1.1 percent as compared to 4th quarter 2012 and an increase of 5.4 percent as compared to 3rd quarter 2013.Our goal is to pay what we believe to be sustainable distributions with any increases safely covered by earned DCF. A distribution coverage ratio of greater than 100 percent provides flexibility for on-going management of the portfolio, changes in leverage costs, the impact of taxes from realized gains and other expenses. An on-going distribution coverage ratio of less than 100 percent will, over time, erode the earning power of a portfolio and may lead to lower distributions. We expect to allocate a portion of the projected future growth in DCF to increase distributions to stockholders while also continuing to build critical distribution coverage to help preserve the sustainability of distributions to stockholders for the years ahead.
2013 Annual Report 5
Management’s Discussion (Unaudited) (Continued) |
Net investment loss before income taxes on the Statement of Operations is adjusted as follows to reconcile to DCF for 2013 YTD and 4th quarter 2013 (in thousands):
| 2013 YTD | 4th Qtr 2013 | |||||||
| Net Investment Loss, before Income Taxes | $ | (2,802 | ) | $ | (503 | ) | ||
| Adjustments to reconcile to DCF: | ||||||||
| Dividends paid in stock | 885 | 219 | ||||||
| Distributions characterized as return of capital | 13,279 | 3,247 | ||||||
| Interest rate swap expenses | (381 | ) | (96 | ) | ||||
| DCF | $ | 10,981 | $ | 2,867 | ||||
Liquidity and Capital Resources
We had total assets of approximately $268 million at year-end. Our total assets reflect the value of our investments, which are itemized in the Schedule of Investments. It also reflects cash, interest and receivables and any expenses that may have been prepaid. During 4th quarter 2013, total assets increased by approximately $14.2 million. This change was primarily the result of a $10.8 million increase in the value of our investments as reflected by the change in realized and unrealized gains on investments (excluding return of capital on distributions) and net purchases of $3.4 million during the quarter.
Total leverage outstanding at November 30, 2013 was $38.6 million, an increase of $5.7 million as compared to August 31, 2013. On an adjusted basis to reflect the payment of the 3rd quarter distribution at the beginning of the 4th quarter, total leverage increased approximately $3.2 million. Total leverage represented 14.4 percent of total assets at November 30, 2013, an increase from 13.0 percent at August 31, 2013 and a decrease from 15.4 percent at November 30, 2012. Our leverage as a percent of total assets remains below our long-term target level of 20 percent of total assets. This allows the opportunity to add leverage when compelling investment opportunities arise. Temporary increases to up to 25 percent of our total assets may be permitted, provided that such leverage is consistent with the limits set forth in the 1940 Act, and that such leverage is expected to be reduced over time in an orderly fashion to reach our long-term target. Our leverage ratio is impacted by increases or decreases in MLP values, issuance of equity and/or the sale of securities where proceeds are used to reduce leverage.
Subsequent to year-end, we entered into an amendment to our margin facility to increase the borrowing capacity under the facility from $40 million to $65 million. Under the amendment, outstanding balances generally will accrue interest at a variable annual rate equal to one-month LIBOR plus 0.925 percent and unused portions of the facility will accrue a fee equal to an annual rate of 0.25 percent.
We have used leverage to acquire securities consistent with our investment philosophy. The terms of our leverage are governed by regulatory and contractual asset coverage requirements that arise from the use of leverage. Additional information on our leverage and asset coverage requirements is discussed in Note 8 in the Notes to Financial Statements. Our coverage ratio is updated each week on our Web site at www.tortoiseadvisors.com.
Taxation of our Distributions and Income Taxes
We invest in partnerships that generally have cash distributions in excess of their income for accounting and tax purposes. Accordingly, the distributions include a return of capital component for accounting and tax purposes. Distributions declared and paid by us in a year generally differ from taxable income for that year, as such distributions may include the distribution of current year taxable income or return of capital.
The taxability of the distribution you receive depends on whether we have annual earnings and profits (“E&P”). E&P is primarily comprised of the taxable income from MLPs with certain specified adjustments as reported on annual K-1s, fund operating expenses and net realized gains. If we have E&P, it is first allocated to preferred shares (if any) and then to the common shares.
In the event we have E&P allocated to our common shares, all or a portion of our distribution will be taxable at the Qualified Dividend Income (“QDI”) rate, assuming various holding requirements are met by the stockholder. The QDI rate is variable based on the taxpayer’s taxable income. The portion of our distribution that is taxable may vary for either of two reasons. First, the characterization of the distributions we receive from MLPs could change annually based upon the K-1 allocations and result in less return of capital and more in the form of income. Second, we could sell an MLP investment and realize a gain or loss at any time. It is for these reasons that we inform you of the tax treatment after the close of each year as the ultimate characterization of our distributions is undeterminable until the year is over.
E&P for 2013 exceeded total distributions to stockholders. As a result, for tax purposes, distributions to common stockholders for the year ended 2013 were 100 percent qualified dividend income. This information is reported to stockholders on Form 1099-DIV and is available on our Web site at www.tortoiseadvisors.com. For book purposes, the source of distributions to common stockholders for the year ended 2013 was 100 percent return of capital.
As of November 30, 2013, we estimate that we have utilized our capital loss carryforward of approximately $7 million. For the fiscal year, we realized net capital gains which were offset first by capital loss carryforwards and then by net operating losses. As of November 30, 2013, we had approximately $10 million in net operating losses. To the extent we have taxable income in the future that is not offset by net operating losses, we will owe federal and state income taxes. Tax payments can be funded from investment earnings, fund assets or borrowings. Details of our taxes are disclosed in Note 5 in our Notes to Financial Statements.
The unrealized gain or loss we have in the portfolio is reflected in the Statement of Assets and Liabilities. At November 30, 2013, our investments are valued at $267.4 million, with an adjusted cost of $162.1 million. The $105.3 million difference reflects unrealized gain that would be realized for financial statement purposes if those investments were sold at those values. The Statement of Assets and Liabilities also reflects a net deferred tax liability primarily due to unrealized gains (losses) on investments. At November 30, 2013, the balance sheet reflects a net deferred tax liability of approximately $45.2 million or $7.16 per share. Accordingly, our net asset value per share represents the amount which would be available for distribution to stockholders after payment of taxes.
6 Tortoise North American Energy Corp.
Schedule of Investments November 30, 2013 |
| Shares | Fair Value | |||||
| Master Limited Partnerships and | ||||||
| Related Companies — 143.3%(1) | ||||||
| Crude/Refined Products Pipelines — 48.7%(1) | ||||||
| United States — 48.7%(1) | ||||||
| Arc Logistics Partners LP | 100,000 | $ | 2,015,000 | |||
| Buckeye Partners, L.P.(2) | 199,200 | 13,563,528 | ||||
| Enbridge Energy Partners, L.P.(2) | 290,604 | 8,744,274 | ||||
| Genesis Energy L.P. | 21,706 | 1,126,107 | ||||
| Holly Energy Partners, L.P.(2) | 95,360 | 2,999,072 | ||||
| Magellan Midstream Partners, L.P.(2)(3) | 301,400 | 18,728,996 | ||||
| MPLX LP | 86,500 | 3,297,380 | ||||
| NuStar Energy L.P.(2) | 100,700 | 5,372,345 | ||||
| Oiltanking Partners, L.P. | 24,900 | 1,491,261 | ||||
| Phillips 66 Partners LP | 40,200 | 1,324,188 | ||||
| Plains All American Pipeline, L.P.(2) | 301,900 | 15,568,983 | ||||
| Rose Rock Midstream, L.P. | 19,042 | 683,037 | ||||
| Sunoco Logistics Partners L.P.(2) | 158,440 | 11,214,383 | ||||
| Tesoro Logistics L.P.(2) | 57,800 | 2,962,250 | ||||
| 89,090,804 | ||||||
| Natural Gas/Natural Gas Liquids Pipelines — 59.6%(1) | ||||||
| United States — 59.6%(1) | ||||||
| Boardwalk Pipeline Partners, L.P.(2) | 165,400 | 4,356,636 | ||||
| El Paso Pipeline Partners, L.P.(2) | 340,100 | 14,141,358 | ||||
| Energy Transfer Equity, L.P.(2) | 110,400 | 8,254,608 | ||||
| Energy Transfer Partners, L.P.(2) | 206,800 | 11,200,288 | ||||
| Enterprise Products Partners L.P.(2) | 293,700 | 18,494,289 | ||||
| EQT Midstream Partners, L.P. | 60,200 | 3,310,398 | ||||
| Kinder Morgan Energy Partners, L.P.(2) | 51,300 | 4,205,061 | ||||
| Kinder Morgan Management, L.L.C.(2)(4) | 165,365 | 12,661,995 | ||||
| ONEOK Partners, L.P.(2) | 93,800 | 5,023,928 | ||||
| Regency Energy Partners L.P.(2) | 392,400 | 9,566,712 | ||||
| Spectra Energy Partners, L.P.(2) | 139,500 | 6,271,920 | ||||
| TC PipeLines, L.P.(2) | 27,000 | 1,323,000 | ||||
| Williams Partners L.P.(2) | 196,900 | 10,118,691 | ||||
| 108,928,884 | ||||||
| Natural Gas Gathering/Processing — 23.7%(1) | ||||||
| United States — 23.7%(1) | ||||||
| Access Midstream Partners, L.P.(2) | 139,200 | 7,818,864 | ||||
| Crestwood Midstream Partners, L.P. | 188,589 | 4,269,655 | ||||
| Crosstex Energy, L.P. | 48,900 | 1,302,696 | ||||
| DCP Midstream Partners, L.P.(2) | 130,100 | 6,268,218 | ||||
| MarkWest Energy Partners, L.P.(2) | 110,500 | 7,632,235 | ||||
| Summit Midstream Partners, LP | 45,300 | 1,521,174 | ||||
| Targa Resources Partners L.P.(2) | 134,400 | 6,861,120 | ||||
| Western Gas Equity Partners, LP | 41,104 | 1,775,693 | ||||
| Western Gas Partners L.P.(2) | 90,700 | 5,775,776 | ||||
| 43,225,431 | ||||||
| Oil and Gas Production — 10.1%(1) | ||||||
| United States — 10.1%(1) | ||||||
| BreitBurn Energy Partners L.P.(2) | 241,200 | 4,561,092 | ||||
| EV Energy Partners, L.P.(2) | 72,900 | 2,383,830 | ||||
| Legacy Reserves, L.P.(2) | 182,100 | 4,914,879 | ||||
| Pioneer Southwest Energy Partners L.P. | 47,800 | 1,969,360 | ||||
| Vanguard Natural Resources, LLC(2) | 160,100 | 4,569,254 | ||||
| 18,398,415 | ||||||
| Marine Transportation — 1.2%(1) | ||||||
| Republic of the Marshall Islands — 1.2%(1) | ||||||
| Teekay LNG Partners L.P.(2) | 53,500 | 2,198,850 | ||||
| Total Master Limited Partnerships and | ||||||
| Related Companies (Cost $157,838,093) | 261,842,384 | |||||
| Common Stock — 3.0%(1) | ||||||
| Crude/Refined Products Pipelines — 0.7%(1) | ||||||
| United States — 0.7%(1) | ||||||
| Plains GP Holdings, L.P. | 51,570 | 1,211,895 | ||||
| Marine Transportation — 0.8%(1) | ||||||
| Republic of the Marshall Islands — 0.8%(1) | ||||||
| Teekay Offshore Partners L.P.(2) | 42,400 | 1,391,568 | ||||
| Other — 1.5%(1) | ||||||
| Republic of the Marshall Islands — 1.5%(1) | ||||||
| Seadrill Partners LLC | 90,000 | 2,842,200 | ||||
| Total Common Stock (Cost $4,127,900) | 5,445,663 | |||||
| Short-Term Investment — 0.0%(1) | ||||||
| United States Investment Company — 0.0%(1) | ||||||
| Fidelity Institutional Money Market Portfolio — | ||||||
| Class I, 0.05%(5) (Cost $104,651) | 104,651 | 104,651 | ||||
| Total Investments — 146.3%(1) | ||||||
| (Cost $162,070,644) | 267,392,698 | |||||
| Interest Rate Swap Contracts — (0.2%)(1) | ||||||
| $25,000,000 notional — Unrealized Depreciation(6) | (374,076 | ) | ||||
| Other Assets and Liabilities — (46.1%)(1) | (84,272,911 | ) | ||||
| Total Net Assets Applicable to Common | ||||||
| Stockholders — 100.0%(1) | $ | 182,745,711 | ||||
| (1) | Calculated as a percentage of net assets applicable to common stockholders. |
| (2) | All or a portion of the security is segregated as collateral for the margin borrowing facility. See Note 8 to the financial statements for further disclosure. |
| (3) | All or a portion of the security is segregated as collateral for the unrealized depreciation of interest rate swap contracts of $374,076. |
| (4) | Security distributions are paid-in-kind. |
| (5) | Rate reported is the current yield as of November 30, 2013. |
| (6) | See Note 9 to the financial statements for further disclosure. |
See accompanying Notes to Financial Statements.
2013 Annual Report 7
Statement of Assets & Liabilities November 30, 2013 |
| Assets | |||
| Investments at fair value (cost $162,070,644) | $ | 267,392,698 | |
| Distributions receivable from master limited partnerships | 33,220 | ||
| Prepaid expenses and other assets | 92,535 | ||
| Total assets | 267,518,453 | ||
| Liabilities | |||
| Payable to Adviser | 437,143 | ||
| Accrued expenses and other liabilities | 151,937 | ||
| Unrealized depreciation of interest rate swap contracts | 374,076 | ||
| Deferred tax liability | 45,209,586 | ||
| Short-term borrowings | 38,600,000 | ||
| Total liabilities | 84,772,742 | ||
| Net assets applicable to common stockholders | $ | 182,745,711 | |
| Net Assets Applicable to Common Stockholders Consist of: | |||
| Capital stock, $0.001 par value; 6,316,079 shares issued | |||
| and outstanding (100,000,000 shares authorized) | $ | 6,316 | |
| Additional paid-in capital | 87,464,423 | ||
| Accumulated net investment loss, net of income taxes | (3,851,072 | ) | |
| Undistributed net realized gain, net of income taxes | 20,148,103 | ||
| Net unrealized appreciation of investments and interest rate | |||
| swap contracts, net of income taxes | 78,977,941 | ||
| Net assets applicable to common stockholders | $ | 182,745,711 | |
| Net Asset Value per common share outstanding | |||
| (net assets applicable to common stock, | |||
| divided by common shares outstanding) | $ | 28.93 | |
| Statement of Operations Year Ended November 30, 2013 |
| Investment Income | |||
| Distributions from master limited partnerships | $ | 13,603,024 | |
| Less return of capital on distributions | (13,278,826 | ) | |
| Net distributions from master limited partnerships | 324,198 | ||
| Dividend income | 241,727 | ||
| Dividends from money market mutual funds | 176 | ||
| Other income | 12,981 | ||
| Total Investment Income | 579,082 | ||
| Operating Expenses | |||
| Advisory fees | 2,503,792 | ||
| Professional fees | 157,635 | ||
| Administrator fees | 100,204 | ||
| Stockholder communication expenses | 49,990 | ||
| Directors’ fees | 48,309 | ||
| Fund accounting fees | 39,756 | ||
| Registration fees | 24,572 | ||
| Custodian fees and expenses | 13,701 | ||
| Stock transfer agent fees | 11,463 | ||
| Other operating expenses | 46,344 | ||
| Total Operating Expenses | 2,995,766 | ||
| Leverage Expenses | |||
| Interest expense | 385,430 | ||
| Total Expenses | 3,381,196 | ||
| Net Investment Loss, before Income Taxes | (2,802,114 | ) | |
| Deferred tax benefit | 970,011 | ||
| Net Investment Loss | (1,832,103 | ) | |
| Realized and Unrealized Gain on Investments | |||
| and Interest Rate Swaps | |||
| Net realized gain on investments | 19,854,861 | ||
| Net realized loss on interest rate swap settlements | (382,245 | ) | |
| Net realized gain, before income taxes | 19,472,616 | ||
| Deferred tax expense | (6,740,862 | ) | |
| Net realized gain on investments | |||
| and interest rate swaps | 12,731,754 | ||
| Net unrealized appreciation of investments | 30,784,535 | ||
| Net unrealized appreciation of interest rate swap contracts | 988,237 | ||
| Net unrealized appreciation, before income taxes | 31,772,772 | ||
| Deferred tax expense | (10,998,824 | ) | |
| Net unrealized appreciation of investments | |||
| and interest rate swap contracts | 20,773,948 | ||
| Net Realized and Unrealized Gain on Investments | |||
| and Interest Rate Swaps | 33,505,702 | ||
| Net Increase in Net Assets Applicable to Common Stockholders | |||
| Resulting from Operations | $ | 31,673,599 |
See accompanying Notes to Financial Statements.
8 Tortoise North American Energy Corp.
Statement of Changes in Net Assets Year Ended November 30 |
| 2013 | 2012 | ||||||
| Operations | |||||||
| Net investment loss | $ | (1,832,103 | ) | $ | (1,439,536 | ) | |
| Net realized gain on investments and interest rate swaps | 12,731,754 | 12,025,458 | |||||
| Net unrealized appreciation of investments and interest rate swap contracts | 20,773,948 | 3,842,041 | |||||
| Net increase in net assets applicable to common stockholders resulting from operations | 31,673,599 | 14,427,963 | |||||
| Distributions to Common Stockholders | |||||||
| Return of capital | (10,062,211 | ) | (9,792,027 | ) | |||
| Capital Stock Transactions | |||||||
| Issuance of 14,888 and 5,441 common shares from reinvestment of distributions to stockholders, respectively | 417,784 | 138,963 | |||||
| Total increase in net assets applicable to common stockholders | 22,029,172 | 4,774,899 | |||||
| Net Assets | |||||||
| Beginning of year | 160,716,539 | 155,941,640 | |||||
| End of year | $ | 182,745,711 | $ | 160,716,539 | |||
| Accumulated net investment loss, net of income taxes, end of year | $ | (3,851,072 | ) | $ | (2,018,969 | ) | |
See accompanying Notes to Financial Statements.
2013 Annual Report 9
Statement of Cash Flows Year Ended November 30, 2013 |
| Cash Flows from Operating Activities | |||
| Distributions received from master limited partnerships | $ | 13,585,599 | |
| Dividend income received | 241,912 | ||
| Purchases of long-term investments | (43,433,520 | ) | |
| Proceeds from sales of long-term investments | 39,312,315 | ||
| Purchases of short-term investments, net | (33,046 | ) | |
| Payments on interest rate swap contracts, net | (382,245 | ) | |
| Other income received | 12,981 | ||
| Interest expense paid | (384,292 | ) | |
| Operating expenses paid | (2,936,534 | ) | |
| Net cash provided by operating activities | 5,983,170 | ||
| Cash Flows from Financing Activities | |||
| Advances from margin loan facility | 28,600,000 | ||
| Repayments on margin loan facility | (24,800,000 | ) | |
| Distributions paid to common stockholders | (9,783,170 | ) | |
| Net cash used in financing activities | (5,983,170 | ) | |
| Net change in cash | — | ||
| Cash — beginning of year | — | ||
| Cash — end of year | $ | — | |
| Reconciliation of net increase in net assets applicable to | |||
| common stockholders resulting from operations to net cash | |||
| provided by operating activities | |||
| Net increase in net assets applicable to common | |||
| stockholders resulting from operations | $ | 31,673,599 | |
| Adjustments to reconcile net increase in net assets | |||
| applicable to common stockholders resulting from | |||
| operations to net cash provided by operating activities: | |||
| Purchases of long-term investments | (43,433,520 | ) | |
| Proceeds from sales of long-term investments | 39,312,315 | ||
| Purchases of short-term investments, net | (33,046 | ) | |
| Return of capital on distributions received | 13,278,826 | ||
| Deferred tax expense | 16,769,675 | ||
| Net unrealized appreciation of investments and | |||
| interest rate swap contracts | (31,772,772 | ) | |
| Net realized gain on investments | (19,854,861 | ) | |
| Changes in operating assets and liabilities: | |||
| Increase in distributions receivable from | |||
| master limited partnerships | (17,425 | ) | |
| Decrease in prepaid expenses and other assets | 1,712 | ||
| Increase in payable to Adviser | 60,855 | ||
| Increase in accrued expenses and other liabilities | (2,188 | ) | |
| Total adjustments | (25,690,429 | ) | |
| Net cash provided by operating activities | $ | 5,983,170 | |
| Non-Cash Financing Activities | |||
| Reinvestment of distributions by common stockholders | |||
| in additional common shares | $ | 417,784 | |
See accompanying Notes to Financial Statements.
10 Tortoise North American Energy Corp.
Financial Highlights Year Ended November 30 |
| 2013 | 2012 | 2011 | 2010 | 2009 | ||||||||||||||||
| Per Common Share Data(1) | ||||||||||||||||||||
| Net Asset Value, beginning of year | $ | 25.51 | $ | 24.77 | $ | 24.51 | $ | 20.22 | $ | 10.78 | ||||||||||
| Income from Investment Operations | ||||||||||||||||||||
| Net investment income (loss)(2) | (0.29 | ) | (0.23 | ) | (0.12 | ) | (0.09 | ) | 0.25 | |||||||||||
| Net realized and unrealized gain on investments | ||||||||||||||||||||
| and interest rate swaps contracts(2) | 5.31 | 2.53 | 1.89 | 5.86 | 10.67 | |||||||||||||||
| Total income from investment operations | 5.02 | 2.30 | 1.77 | 5.77 | 10.92 | |||||||||||||||
| Distributions to Common Stockholders | ||||||||||||||||||||
| Return of capital | (1.60 | ) | (1.56 | ) | (1.51 | ) | (1.48 | ) | (1.48 | ) | ||||||||||
| Net Asset Value, end of year | $ | 28.93 | $ | 25.51 | $ | 24.77 | $ | 24.51 | $ | 20.22 | ||||||||||
| Per common share market value, end of year | $ | 27.36 | $ | 25.06 | $ | 24.05 | $ | 24.44 | $ | 19.49 | ||||||||||
| Total Investment Return Based on Market Value(3) | 15.62 | % | 10.87 | % | 4.77 | % | 33.62 | % | 131.66 | % | ||||||||||
| Supplemental Data and Ratios | ||||||||||||||||||||
| Net assets applicable to common stockholders, end of year (000’s) | $ | 182,746 | $ | 160,717 | $ | 155,942 | $ | 154,289 | $ | 126,609 | ||||||||||
| Average net assets (000’s) | $ | 176,118 | $ | 160,825 | $ | 157,410 | $ | 141,986 | $ | 80,041 | ||||||||||
| Ratio of Expenses to Average Net Assets | ||||||||||||||||||||
| Advisory fees | 1.42 | % | 1.36 | % | 1.28 | % | 1.19 | % | 1.13 | % | ||||||||||
| Other expenses | 0.28 | 0.31 | 0.32 | 0.38 | 1.01 | |||||||||||||||
| Fee waiver | — | (0.01 | ) | (0.07 | ) | (0.12 | ) | (0.12 | ) | |||||||||||
| Subtotal | 1.70 | 1.66 | 1.53 | 1.45 | 2.02 | |||||||||||||||
| Leverage expenses | 0.22 | 0.24 | 0.47 | 0.75 | 1.17 | |||||||||||||||
| Income tax expense (benefit)(4) | 9.52 | 5.31 | 4.30 | 13.10 | (4.70 | ) | ||||||||||||||
| Total expenses | 11.44 | % | 7.21 | % | 6.30 | % | 15.30 | % | (1.51 | )% | ||||||||||
See accompanying Notes to Financial Statements.
2013 Annual Report 11
Financial Highlights (Continued) Year Ended November 30 |
| 2013 | 2012 | 2011 | 2010 | 2009 | |||||||||||||||||
| Ratio of net investment income (loss) to average | |||||||||||||||||||||
| net assets before fee waiver | (1.04 | )% | (0.90 | )% | (0.54 | )% | (0.50 | )% | 1.82 | % | |||||||||||
| Ratio of net investment income (loss) to average | |||||||||||||||||||||
| net assets after fee waiver | (1.04 | )% | (0.89 | )% | (0.47 | )% | (0.38 | )% | 1.94 | % | |||||||||||
| Portfolio turnover rate | 15.65 | % | 22.37 | % | 27.34 | % | 27.89 | % | 41.90 | % | |||||||||||
| Short-term borrowings, end of year (000’s) | $ | 38,600 | $ | 34,800 | $ | 31,300 | $ | 10,400 | $ | 5,900 | |||||||||||
| Long-term debt obligations, end of year (000’s) | — | — | — | $ | 15,000 | $ | 15,000 | ||||||||||||||
| Per common share amount of long-term debt | |||||||||||||||||||||
| obligations outstanding, end of year | — | — | — | $ | 2.38 | $ | 2.40 | ||||||||||||||
| Per common share amount of net assets, | |||||||||||||||||||||
| excluding long-term debt obligations, end of year | $ | 28.93 | $ | 25.51 | $ | 24.77 | $ | 26.89 | $ | 22.61 | |||||||||||
| Asset coverage, per $1,000 of principal amount | |||||||||||||||||||||
| of long-term debt obligations and short-term borrowings(5) | $ | 5,734 | $ | 5,618 | $ | 5,982 | $ | 7,074 | $ | 7,058 | |||||||||||
| Asset coverage ratio of long-term debt obligations and short-term borrowings(5) | 573 | % | 562 | % | 598 | % | 707 | % | 706 | % | |||||||||||
| (1) | Information presented relates to a share of common stock outstanding for the entire year. |
| (2) | The per common share data for the years ended November 30, 2012, 2011, 2010, and 2009 do not reflect the change in estimate of investment income and return of capital, for the respective year. See Note 2E to the financial statements for further disclosure. |
| (3) | Total investment return is calculated assuming a purchase of common stock at the beginning of the year and a sale at the closing price on the last day of the year reported (excluding broker commissions). The calculation also assumes reinvestment of distributions at actual prices pursuant to the Company’s dividend reinvestment plan. |
| (4) | For the year ended November 30, 2013, the Company accrued $16,769,675 for net deferred income tax expense. For the year ended November 30, 2012, the Company accrued $13,102 for current income tax expense and $8,530,007 for net deferred income tax expense. For the year ended November 30, 2011, the Company accrued $44,786 for current and foreign tax expense and $6,732,194 for net deferred income tax expense. For the year ended November 30, 2010, the Company accrued $39,097 for current and foreign tax expense and $18,559,864 for net deferred income tax expense. For the year ended November 30, 2009, the Company accrued $28,837 for current and foreign tax benefit and $3,732,366 for net deferred income tax benefit, which included $5,488,509 of deferred income tax benefit for the timing differences at December 1, 2008 when the Company converted to a taxable corporation. |
| (5) | Represents value of total assets less all liabilities and indebtedness not represented by long-term debt obligations, short-term borrowings and preferred stock at the end of the year divided by long-term debt obligations and short-term borrowings outstanding at the end of the year. |
See accompanying Notes to Financial Statements.
12 Tortoise North American Energy Corp.
Notes to Financial Statements November 30, 2013 |
1. Organization
Tortoise North American Energy Corporation (the “Company”) was organized as a Maryland corporation on January 13, 2005, and is a non-diversified, closed-end management investment company under the Investment Company Act of 1940, as amended (the “1940 Act”). The Company’s investment objective is to seek a high level of total return with an emphasis on distribution income paid to stockholders. The Company seeks to provide its stockholders with a vehicle to invest in a portfolio consisting primarily of publicly traded U.S. master limited partnerships (“MLPs”), including oil and gas exploitation, energy infrastructure and energy shipping companies. The Company commenced operations on October 31, 2005. The Company’s stock is listed on the New York Stock Exchange under the symbol “TYN.”
2. Significant Accounting Policies
A. Use of Estimates
The preparation of financial statements in conformity with U.S. generally accepted accounting principles requires management to make estimates and assumptions that affect the reported amount of assets and liabilities, recognition of distribution income and disclosure of contingent assets and liabilities at the date of the financial statements. Actual results could differ from those estimates.
B. Investment Valuation
The Company primarily owns securities that are listed on a securities exchange or over-the-counter market. The Company values those securities at their last sale price on that exchange or over-the-counter market on the valuation date. If the security is listed on more than one exchange, the Company uses the price from the exchange that it considers to be the principal exchange on which the security is traded. Securities listed on the NASDAQ will be valued at the NASDAQ Official Closing Price, which may not necessarily represent the last sale price. If there has been no sale on such exchange or over-the-counter market on such day, the security will be valued at the mean between the last bid price and last ask price on such day.
The Company may invest up to 50 percent of its total assets in restricted securities. Restricted securities are subject to statutory and contractual restrictions on their public resale, which may make it more difficult to obtain a valuation and may limit the Company’s ability to dispose of them. Investments in restricted securities and other securities for which market quotations are not readily available will be valued in good faith by using fair value procedures approved by the Board of Directors. Such fair value procedures consider factors such as discounts to publicly traded issues, time until conversion date, securities with similar yields, quality, type of issue, coupon, duration and rating. If events occur that affect the value of the Company’s portfolio securities before the net asset value has been calculated (a “significant event”), the portfolio securities so affected will generally be priced using fair value procedures. The Company did not hold any restricted securities at November 30, 2013.
An equity security of a publicly traded company acquired in a direct placement transaction may be subject to restrictions on resale that can affect the security’s liquidity and fair value. Such securities that are convertible or otherwise will become freely tradable will be valued based on the market value of the freely tradable security less an applicable discount. Generally, the discount will initially be equal to the discount at which the Company purchased the securities. To the extent that such securities are convertible or otherwise become freely tradable within a time frame that may be reasonably determined, an amortization schedule may be used to determine the discount.
The Company generally values debt securities at prices based on market quotations for such securities, except those securities purchased with 60 days or less to maturity are valued on the basis of amortized cost, which approximates market value.
The Company generally values its interest rate swap contracts using industry-accepted models which discount the estimated future cash flows based on the stated terms of the interest rate swap agreement by using interest rates currently available in the market, or based on dealer quotations, if available.
C. Foreign Currency Translation
For foreign currency, investments in foreign securities, and other assets and liabilities denominated in a foreign currency, the Company translates these amounts into U.S. dollars on the following basis: (1) market value of investment securities, assets and liabilities at the current rate of exchange on the valuation date and (2) purchases and sales of investment securities, income and expenses at the relevant rates of exchange on the respective dates of such transactions. The Company does not isolate that portion of gains and losses on investments that is due to changes in the foreign exchange rates from that which is due to changes in market prices of equity securities.
D. Foreign Withholding Taxes
The Company may be subject to taxes imposed by countries in which it invests with respect to its investment in issuers existing or operating in such countries. Such taxes are generally based on income earned. The Company accrues such taxes when the related income is earned.
E. Security Transactions and Investment Income
Security transactions are accounted for on the date the securities are purchased or sold (trade date). Realized gains and losses are reported on an identified cost basis. Interest income is recognized on the accrual basis, including amortization of premiums and accretion of discounts. Dividend and distribution income is recorded on the ex-dividend date. Distributions received from the Company’s investments in MLPs generally are comprised of ordinary income and return of capital from the MLPs. The Company allocates distributions between investment income and return of capital based on estimates made at the time such distributions are received. Such estimates are based on information provided by each MLP and other industry sources. These estimates may subsequently be revised based on actual allocations received from MLPs after their tax reporting periods are concluded, as the actual character of these distributions is not known until after the fiscal year end of the Company.
During the year ended November 30, 2013, the Company reallocated the amount of 2012 investment income and return of capital it recognized based on the 2012 tax reporting information received from the individual MLPs. This reclassification amounted to a decrease in pre-tax net investment income of approximately $775,000 or $0.123 per share ($493,000 or $0.078 per share, net of deferred tax benefit), an increase in unrealized appreciation of investments of approximately $726,000 or $0.115 per share ($461,000 or $0.073 per share, net of deferred tax expense), and an increase in realized gains of approximately $49,000 or $0.008 per share ($32,000 or $0.005 per share, net of deferred tax expense) for the year ended November 30, 2013.
2013 Annual Report 13
Notes to Financial Statements (Continued) |
F. Distributions to Stockholders
Distributions to common stockholders are recorded on the ex-dividend date. The Company may not declare or pay distributions to its common stockholders if it does not meet asset coverage ratios required under the 1940 Act or the rating agency guidelines for its debt and preferred stock (if any) following such distribution. The character of distributions to stockholders made during the year may differ from their ultimate characterization for federal income tax purposes. For tax purposes, the Company’s distributions to common stockholders for the year ended November 30, 2013 were 100 percent qualified dividend income. For book purposes, the source of the Company’s distributions to common stockholders for the year ended November 30, 2013 was 100 percent return of capital.
G. Federal Income Taxation
From the Company’s inception through November 30, 2008, the Company qualified as a regulated investment company (“RIC”) under the U.S. Internal Revenue Code of 1986, as amended (the “Code”). Effective December 1, 2008, the Company is treated as a taxable corporation for federal and state income tax purposes. The Company, as a corporation, is obligated to pay federal and state income tax on its taxable income. Currently, the highest regular marginal federal income tax rate for a corporation is 35 percent. The Company may be subject to a 20 percent federal alternative minimum tax (“AMT”) on its federal alternative minimum taxable income to the extent that its AMT exceeds its regular federal income tax.
The Company invests in MLPs, which generally are treated as partnerships for federal income tax purposes. As a limited partner in the MLPs, the Company reports its allocable share of the MLP’s taxable income in computing its own taxable income. The Company’s tax expense or benefit is included in the Statement of Operations based on the component of income or gains (losses) to which such expense or benefit relates. Deferred income taxes reflect the net tax effects of temporary differences between the carrying amounts of assets and liabilities for financial reporting purposes and the amounts used for income tax purposes. A valuation allowance is recognized if, based on the weight of available evidence, it is more likely than not that some portion or all of the deferred income tax asset will not be realized.
H. Offering and Debt Issuance Costs
Offering costs related to the issuance of common and preferred stock are charged to additional paid-in capital when the stock is issued. Debt issuance costs related to long-term debt obligations are capitalized and amortized over the period the debt is outstanding.
I. Derivative Financial Instruments
The Company uses derivative financial instruments (principally interest rate swap contracts) to manage interest rate risk. The Company has established policies and procedures for risk assessment and the approval, reporting and monitoring of derivative financial instrument activities. The Company does not hold or issue derivative financial instruments for speculative purposes. All derivative financial instruments are recorded at fair value with changes in fair value during the reporting period, and amounts accrued under the agreements, included as unrealized gains or losses in the accompanying Statement of Operations. The fair value of derivative financial instruments in a loss position are offset against the fair value of derivative financial instruments in a gain position, with the net fair value appropriately reflected as an asset or liability within the accompanying Statement of Assets & Liabilities. Cash settlements under the terms of the interest rate swap contracts and termination of such contracts are recorded as realized gains or losses in the accompanying Statement of Operations.
J. Indemnifications
Under the Company’s organizational documents, its officers and directors are indemnified against certain liabilities arising out of the performance of their duties to the Company. In addition, in the normal course of business, the Company may enter into contracts that provide general indemnification to other parties. The Company’s maximum exposure under these arrangements is unknown, as this would involve future claims that may be made against the Company that have not yet occurred, and may not occur. However, the Company has not had prior claims or losses pursuant to these contracts and expects the risk of loss to be remote.
K. Recent Accounting Pronouncements
In December 2011, the Financial Accounting Standards Board issued ASU 2011-11 “Balance Sheet (Topic 210) Disclosures about Offsetting Assets and Liabilities”. ASU 2011-11 requires new disclosures for recognized financial instruments and derivative instruments that are either offset on the balance sheet in accordance with the offsetting guidance in ASC 210-20-45 or ASC 815-10-45 or are subject to an enforceable master netting arrangement or similar arrangement. ASU 2011-11 is effective for periods beginning on or after January 1, 2013 and must be applied retrospectively.
In January 2013, the Financial Accounting Standards Board issued Accounting Standards Update No. 2013-01 “Clarifying the Scope of Disclosures about Offsetting Assets and Liabilities” (“ASU 2013-01”) which amended Accounting Standards Codification Subtopic 210-20, Balance Sheet Offsetting. ASU 2013-01 clarified the scope of ASU No. 2011-11 “Disclosures about Offsetting Assets and Liabilities” (“ASU 2011-11”). ASU 2013-01 clarifies the scope of ASU 2011-11 as applying to derivatives accounted for in accordance with Topic 815, Derivatives and Hedging, including bifurcated embedded derivatives, repurchase agreements and reverse repurchase agreements, and securities borrowing and securities lending transactions that are offset either in accordance with other requirements of U.S. GAAP or subject to an enforceable master netting arrangement or similar agreement. The guidance in ASU 2013-01 and ASU 2011-11 is effective for interim and annual periods beginning on or after January 1, 2013. The additional disclosures required by these amendments are reflected within the financial statements.
3. Concentration Risk
Under normal conditions, the Company will have at least 80 percent of its total assets in equity securities of companies in the energy sector with their primary operations in North America (“Energy Companies”). Energy Companies include companies that derive more than 50 percent of their revenues from transporting, processing, storing, distributing or marketing natural gas, natural gas liquids, electricity, coal, crude oil or refined petroleum products, or exploring, developing, managing or producing such commodities. The Company may invest up to 50 percent of its total assets in restricted securities. In determining application of these policies, the term “total assets” includes assets obtained through leverage. Companies that primarily invest in a particular sector may experience greater volatility than companies investing in a broad range of industry sectors. The Company may, for defensive purposes, temporarily invest all or a significant portion of its assets in investment grade securities, short-term debt securities and cash or cash equivalents. To the extent the Company uses this strategy, it may not achieve its investment objective.
14 Tortoise North American Energy Corp.
Notes to Financial Statements (Continued) |
4. Agreements
The Company has entered into an Investment Advisory Agreement with Tortoise Capital Advisors, L.L.C. (the “Adviser”). Under the terms of the agreement, the Company pays the Adviser a fee equal to an annual rate of 1.00 percent of the Company’s average monthly total assets (including any assets attributable to leverage) minus accrued liabilities (other than debt entered into for purposes of leverage and the aggregate liquidation preference of outstanding preferred stock, if any) (“Managed Assets”), in exchange for the investment advisory services provided.
U.S. Bancorp Fund Services, LLC serves as the Company’s administrator. The Company pays the administrator a monthly fee computed at an annual rate of 0.04 percent of the first $1,000,000,000 of the Company’s Managed Assets, 0.01 percent on the next $500,000,000 of Managed Assets and 0.005 percent on the balance of the Company’s Managed Assets.
Computershare Trust Company, N.A. serves as the Company’s transfer agent and registrar and Computershare Inc. serves as the Company’s dividend paying agent and agent for the automatic dividend reinvestment plan.
U.S. Bank, N.A. serves as custodian of the Company’s cash and investment securities. The Company pays the custodian a monthly fee computed at an annual rate of 0.004 percent of the Company’s portfolio assets, plus portfolio transaction fees.
5. Income Taxes
Deferred income taxes reflect the net tax effect of temporary differences between the carrying amount of assets and liabilities for financial reporting and tax purposes. Components of the Company’s deferred tax assets and liabilities as of November 30, 2013, are as follows:
| Deferred tax assets: | ||
| Net operating loss carryforwards | $ | 3,796,917 |
| AMT credit | 33,959 | |
| Organization costs | 35,645 | |
| State of Kansas credit | 4,055 | |
| 3,870,576 | ||
| Deferred tax liabilities: | ||
| Basis reduction of investment in MLPs | 10,837,164 | |
| Net unrealized gains on investment securities | 38,242,998 | |
| 49,080,162 | ||
| Total net deferred tax liability | $ | 45,209,586 |
At November 30, 2013, a valuation allowance on deferred tax assets was not deemed necessary because the Company believes it is more likely than not that there is an ability to realize its deferred tax assets through future taxable income. Any adjustments to the Company’s estimates of future taxable income will be made in the period such determination is made. The Company recognizes the tax benefits of uncertain tax positions only when the position is “more likely than not” to be sustained upon examination by the tax authorities based on the technical merits of the tax position. The Company’s policy is to record interest and penalties on uncertain tax positions as part of tax expense. As of November 30, 2013, the Company had no uncertain tax positions and no penalties and interest were accrued. The Company does not expect any change to its unrecognized tax positions in the twelve months subsequent to November 30, 2013. Tax years subsequent to the year ending November 30, 2008 remain open to examination by federal and state tax authorities.
Total income tax expense differs from the amount computed by applying the federal statutory income tax rate of 35 percent to net investment loss and net realized and unrealized gains on investments for the year ended November 30, 2013, as follows:
| Application of statutory income tax rate | $ | 16,955,146 | |
| State income taxes, net of federal tax benefit | 692,738 | ||
| Change in deferred tax liability due to change in overall tax rate | (813,355 | ) | |
| Dividends received deduction | (64,854 | ) | |
| Total income tax expense | $ | 16,769,675 |
Total income taxes are computed by applying the federal statutory rate plus a blended state income tax rate. During the year, the Company re-evaluated its overall federal and state income tax rate, revising it from 37.25 percent to 36.43 percent, due to (1) an anticipated 35 percent federal rate and (2) anticipated state apportionment of income and gains.
For the year ended November 30, 2013, the components of income tax expense include deferred federal and state income tax expense (net of federal tax benefit) of $16,111,409 and $658,266, respectively.
The Company acquired all of the net assets of Tortoise Gas and Oil Corporation (“TGO”) on September 14, 2009 in a tax-free reorganization under Section 368(a)(1)(C) of the Internal Revenue Code. As of November 30, 2013, the Company had net operating losses for federal income tax purposes of approximately $10,320,000. This amount includes net operating losses of approximately $7,935,000 from TGO. The net operating losses may be carried forward for 20 years. If not utilized, these net operating losses will expire in the years ending November 30, 2027 through November 30, 2032. Utilization of the net operating losses from TGO is further subject to Section 382 limitations of the Internal Revenue Code, which limit tax attributes subsequent to ownership changes.
As of November 30, 2013, the Company estimated that it utilized its capital loss carryforward of approximately $6,500,000. This amount includes a capital loss of approximately $1,400,000 from TGO. The capital gains for the year ended November 30, 2013 have been estimated based on information currently available. Such estimate is subject to revision upon receipt of the 2013 tax reporting information from the individual MLPs. For corporations, capital losses can only be used to offset capital gains and cannot be used to offset ordinary income. As of November 30, 2013, an AMT credit of $33,959 was available, which may be credited in the future against regular income tax. This credit may be carried forward indefinitely.
As of November 30, 2013, the aggregate cost of securities for federal income tax purposes was $132,322,735. The aggregate gross unrealized appreciation for all securities in which there was an excess of fair value over tax cost was $135,069,963, the aggregate gross unrealized depreciation for all securities in which there was an excess of tax cost over fair value was $0 and the net unrealized appreciation was $135,069,963.
6. Fair Value of Financial Instruments
Various inputs are used in determining the fair value of the Company’s financial instruments. These inputs are summarized in the three broad levels listed below:
| Level 1 — | quoted prices in active markets for identical investments | |
| Level 2 — | other significant observable inputs (including quoted prices for similar investments, market corroborated inputs, etc.) | |
| Level 3 — | significant unobservable inputs (including the Company’s own assumptions in determining the fair value of investments) |
2013 Annual Report 15
Notes to Financial Statements (Continued) |
The inputs or methodology used for valuing securities are not necessarily an indication of the risk associated with investing in those securities.
The following table provides the fair value measurements of applicable Company assets and liabilities by level within the fair value hierarchy as of November 30, 2013. These assets and liabilities are measured on a recurring basis.
| Fair Value at | |||||||||||||
| Description | November 30, 2013 | Level 1 | Level 2 | Level 3 | |||||||||
| Assets | |||||||||||||
| Equity Securities: | |||||||||||||
| Common Stock(a) | $ | 5,445,663 | $ | 5,445,663 | $ | — | $ | — | |||||
| Master Limited Partnerships | |||||||||||||
| and Related Companies(a) | 261,842,384 | 261,842,384 | — | — | |||||||||
| Total Equity Securities | 267,288,047 | 267,288,047 | — | — | |||||||||
| Other Securities: | |||||||||||||
| Short-Term Investment(b) | 104,651 | 104,651 | — | — | |||||||||
| Total Assets | $ | 267,392,698 | $ | 267,392,698 | $ | — | $ | — | |||||
| Liabilities | |||||||||||||
| Interest Rate Swap Contracts | $ | 374,076 | $ | — | $ | 374,076 | $ | — | |||||
| (a) | All other industry classifications are identified in the Schedule of Investments. |
| (b) | Short-term investment is a sweep investment for cash balances in the Company at November 30, 2013. |
The Company did not hold any Level 3 securities during the year ended November 30, 2013. The Company utilizes the beginning of reporting period method for determining transfers between levels. There were no transfers between levels during the year ended November 30, 2013.
Valuation Techniques
In general, and where applicable, the Company uses readily available market quotations based upon the last updated sales price from the principal market to determine fair value. This pricing methodology applies to the Company’s Level 1 investments.
An equity security of a publicly traded company acquired in a private placement transaction without registration under the Securities Act of 1933, as amended (the “1933 Act”), is subject to restrictions on resale that can affect the security’s fair value. If such a security is convertible into publicly-traded common shares, the security generally will be valued at the common share market price adjusted by a percentage discount due to the restrictions and categorized as Level 2 in the fair value hierarchy. If the security has characteristics that are dissimilar to the class of security that trades on the open market, the security will generally be valued and categorized as Level 3 in the fair value hierarchy.
Interest rate swap contracts are valued by using industry-accepted models which discount the estimated future cash flows based on a forward rate curve and the stated terms of the interest rate swap agreement by using interest rates currently available in the market, or based on dealer quotations, if available, which applies to the Company’s Level 2 liabilities.
7. Investment Transactions
For the year ended November 30, 2013, the Company purchased (at cost) and sold securities (proceeds received) in the amount of $43,433,520 and $39,312,315 (excluding short-term debt securities), respectively.
8. Credit Facility
As of November 30, 2013, the Company has a 270-day rolling evergreen margin loan facility with Bank of America, N.A. The terms of the agreement provide for a $40,000,000 facility that is secured by certain of the Company’s assets. Outstanding balances generally accrue interest at a variable rate equal to one-month LIBOR plus 0.85 percent and unused portions of the facility accrue a fee equal to an annual rate of 0.25 percent.
The average principal balance and interest rate for the period during which the margin loan facility was utilized during the year ended November 30, 2013, was approximately $35,400,000 and 1.04 percent, respectively. At November 30, 2013, the principal balance outstanding was $38,600,000 at an interest rate of 1.02 percent.
Under the terms of the margin loan facility, the Company must maintain asset coverage required under the 1940 Act. If the Company fails to maintain the required coverage, it may be required to repay a portion of an outstanding balance until the coverage requirement has been met. At November 30, 2013, the Company was in compliance with the terms of the margin loan facility.
9. Interest Rate Swap Contracts
The Company has entered into interest rate swap contracts in an attempt to protect itself from increasing interest expense on its leverage resulting from increasing short-term interest rates. A decline in interest rates may result in a decline in the value of the swap contracts, which may result in a decline in the net assets of the Company. At the time the interest rate swap contracts reach their scheduled termination, there is a risk that the Company would not be able to obtain a replacement transaction, or that the terms of the replacement would not be as favorable as on the expiring transaction. In addition, if the Company is required to terminate any swap contract early due to the net assets of the Company falling below $48,000,000 or the Company failing to maintain a required 300 percent asset coverage of the liquidation value of the outstanding debt, then the Company could be required to make a termination payment to the extent of the Company’s net liability position, in addition to redeeming all or some of the debt. The Company segregates a portion of its assets as collateral for the amount of any net liability of its interest rate swap contracts. Details of the interest rate swap contracts outstanding as of November 30, 2013, are as follows:
| Fixed Rate | Floating Rate | |||||||||||||
| Maturity | Notional | Paid by the | Received by | Unrealized | ||||||||||
| Counterparty | Date | Amount | Company | the Company | Depreciation | |||||||||
| The Bank of Nova Scotia | 09/02/2014 | $ | 5,000,000 | 0.654% | 1-month U.S. Dollar LIBOR | $ | (19,599 | ) | ||||||
| The Bank of Nova Scotia | 09/02/2016 | 5,000,000 | 1.258% | 1-month U.S. Dollar LIBOR | (110,770 | ) | ||||||||
| The Bank of Nova Scotia | 09/02/2018 | 5,000,000 | 1.815% | 1-month U.S. Dollar LIBOR | (135,141 | ) | ||||||||
| The Bank of Nova Scotia | 09/02/2021 | 10,000,000 | 2.381% | 1-month U.S. Dollar LIBOR | (108,566 | ) | ||||||||
| $ | 25,000,000 | $ | (374,076 | ) | ||||||||||
The Company is exposed to credit risk on the interest rate swap contracts if the counterparty should fail to perform under the terms of the interest rate swap contracts. The amount of credit risk is limited to the net appreciation of the interest rate swap contracts, if any, as no collateral is pledged by the counterparty. In addition, if the counterparty to the interest rate swap contracts defaults, the Company would incur a loss in the amount of the receivable and would not receive amounts due from the counterparty to offset the interest payments on the Company’s leverage.
16 Tortoise North American Energy Corp.
Notes to Financial Statements (Continued) |
The unrealized appreciation of interest rate swap contracts in the amount of $988,237 for the year ended November 30, 2013 is included in the Statement of Operations. Cash settlement payments under the terms of the interest rate swap contracts in the amount of $382,245 are recorded as realized losses for the year ended November 30, 2013. The total notional amount of all open swap agreements at November 30, 2013 is indicative of the volume of this derivative type for the year ended November 30, 2013.
| Net Amounts | ||||||||||||||||||||||
| Gross Amounts | of Liabilities | Gross Amounts Not Offset | ||||||||||||||||||||
| Gross | Offset in the | Presented in | in the Statement of Assets | |||||||||||||||||||
| Amounts of | Statement | the Statement | & Liabilities | |||||||||||||||||||
| Recognized | of Assets & | of Assets & | Financial | Cash Collateral | Net | |||||||||||||||||
| Description | Liabilities | Liabilities | Liabilities | Instruments | Received | Amount | ||||||||||||||||
| Interest Rate Swap | ||||||||||||||||||||||
| Contracts | $374,076 | $ | — | $374,076 | $ | — | $ | — | $ | 374,076 | ||||||||||||
10. Common Stock
The Company has 100,000,000 shares of capital stock authorized and 6,316,079 shares outstanding at November 30, 2013. Transactions in common stock for the year ended November 30, 2013, were as follows:
| Shares at November 30, 2012 | 6,301,191 |
| Shares issued through reinvestment of distributions | 14,888 |
| Shares at November 30, 2013 | 6,316,079 |
11. Subsequent Events
On December 11, 2013, the Company entered into an amendment to its margin loan facility. The terms of the amendment provide for a $65,000,000 facility that is secured by certain of the Company’s assts. Outstanding balances generally will accrue interest at a variable annual rate equal to one-month LIBOR plus 0.925 percent and unused portions of the facility will accrue a fee equal to an annual rate of 0.25 percent.
The Company has performed an evaluation of subsequent events through the date the financial statements were issued and has determined that no additional items require recognition or disclosure.
2013 Annual Report 17
Report of Independent Registered Public Accounting Firm |
The Board of Directors and Stockholders
Tortoise North American Energy Corporation
We have audited the accompanying statement of assets and liabilities of Tortoise North American Energy Corporation (the Company), including the schedule of investments, as of November 30, 2013, and the related statements of operations and cash flows for the year then ended, the statements of changes in net assets for each of the two years in the period then ended, and the financial highlights for each of the five years in the period then ended. These financial statements and financial highlights are the responsibility of the Company’s management. Our responsibility is to express an opinion on these financial statements and financial highlights based on our audits.
We conducted our audits in accordance with the standards of the Public Company Accounting Oversight Board (United States). Those standards require that we plan and perform the audit to obtain reasonable assurance about whether the financial statements and financial highlights are free of material misstatement. We were not engaged to perform an audit of the Company’s internal control over financial reporting. Our audits included consideration of internal control over financial reporting as a basis for designing audit procedures that are appropriate in the circumstances, but not for the purpose of expressing an opinion on the effectiveness of the Company’s internal control over financial reporting. Accordingly, we express no such opinion. An audit also includes examining, on a test basis, evidence supporting the amounts and disclosures in the financial statements and financial highlights, assessing the accounting principles used and significant estimates made by management, and evaluating the overall financial statement presentation. Our procedures included confirmation of securities owned as of November 30, 2013, by correspondence with the custodian and brokers or by other appropriate auditing procedures where replies from brokers were not received. We believe that our audits provide a reasonable basis for our opinion.
In our opinion, the financial statements and financial highlights referred to above present fairly, in all material respects, the financial position of Tortoise North American Energy Corporation at November 30, 2013, the results of its operations and its cash flows for the year then ended, the changes in its net assets for each of the two years in the period then ended, and the financial highlights for each of the five years in the period then ended, in conformity with U.S. generally accepted accounting principles.

Kansas City, Missouri
January 21, 2014
18 Tortoise North American Energy Corp.
Company Officers and Directors (Unaudited) November 30, 2013 |
| Name and Age* | Position(s) Held with Company, Term of Office and Length of Time Served | Principal Occupation During Past Five Years | Number of Portfolios in Fund Complex Overseen by Director(1) | Other Public Company Directorships Held | ||||
| Independent Directors** | ||||||||
| Conrad S. Ciccotello (Born 1960) | Director since 2005 | Associate Professor of Risk Management and Insurance, Robinson College of Business, Georgia State University (faculty member since 1999); Director of Personal Financial Planning Program; Investment Consultant to the University System of Georgia for its defined contribution retirement plan; Formerly Faculty Member, Pennsylvania State University (1997-1999); Published a number of academic and professional journal articles on investment company performance and structure, with a focus on MLPs. | 7 | CorEnergy Infrastructure Trust, Inc. (formerly Tortoise Capital Resources Corporation) | ||||
| John R. Graham (Born 1945) | Director since 2005 | Executive-in-Residence and Professor of Finance (Part-time), College of Business Administration, Kansas State University (has served as a professor or adjunct professor since 1970); Chairman of the Board, President and CEO, Graham Capital Management, Inc. (primarily a real estate development, investment and venture capital company) and Owner of Graham Ventures (a business services and venture capital firm); Part-time Vice President Investments, FB Capital Management, Inc. (a registered investment adviser), since 2007. Formerly, CEO, Kansas Farm Bureau Financial Services, including seven affiliated insurance or financial service companies (1979-2000). | 7 | CorEnergy Infrastructure Trust, Inc. (formerly Tortoise Capital Resources Corporation) | ||||
| Charles E. Heath (Born 1942) | Director since 2005 | Retired in 1999. Formerly, Chief Investment Officer, GE Capital’s Employers Reinsurance Corporation (1989-1999). Chartered Financial Analyst (“CFA”) designation since 1974. | 7 | CorEnergy Infrastructure Trust, Inc. (formerly Tortoise Capital Resources Corporation) | ||||
| (1) | This number includes Tortoise Energy Infrastructure Corporation (“TYG”), Tortoise Energy Capital Corporation (“TYY”), Tortoise Power and Energy Infrastructure Fund, Inc. (“TPZ”), Tortoise MLP Fund, Inc. (“NTG”), Tortoise Pipeline & Energy Fund, Inc. (“TTP”), Tortoise Energy Independence Fund, Inc. (“NDP”) and the Company. Our Adviser also serves as the investment adviser to TYG, TYY, TPZ, NTG, TTP and NDP. |
| * | The address of each director and officer is 11550 Ash Street, Suite 300, Leawood, Kansas 66211. |
| ** | Subsequent to fiscal year-end, Mr. Graham passed away. Effective January 1, 2014, Mr. Rand C. Berney joined the Company’s Board of Directors as an independent director. Mr. Berney also joined the Board of Directors of each of TYG, TYY, TPZ, NTG, TTP and NDP. Mr. Berney was born in 1955. Mr. Berney is Executive-in-Residence and Professor for Professional Financial Planning course and Professional Ethics course, College of Business Administration, Kansas State University since 2012. He was formerly Senior Vice President of Corporate Shared Services of ConocoPhillips from April 2009 to 2012, Vice President and Controller of ConocoPhillips from 2002 to April 2009, and Vice President and Controller of Phillips Petroleum Company from 1997 to 2002. Mr. Berney is a member of the Oklahoma Society of CPAs, the Financial Executive Institute, American Institute of Certified Public Accountants, the Institute of Internal Auditors and the Institute of Management Accountants. |
2013 Annual Report 19
Company Officers and Directors (Unaudited) (Continued) November 30, 2013 |
| Name and Age* | Position(s) Held with Company, Term of Office and Length of Time Served | Principal Occupation During Past Five Years | Number of Portfolios in Fund Complex Overseen by Director(1) | Other Public Company Directorships Held | ||||
| Interested Directors and Officers(2) | ||||||||
| H. Kevin Birzer (Born 1959) | Director and Chairman of the Board since 2005 | Managing Director of our Adviser and member of the Investment Committee of the Adviser since 2002; Member, Fountain Capital Management, LLC (“Fountain Capital”) (1990-May 2009); Director and Chairman of the Board of each of TYG, TYY, TPZ, NTG, TTP and NDP since its inception; Director and Chairman of the Board of Tortoise Capital Resources Corporation (“TTO”) from its inception through November 30, 2011. CFA designation since 1988. | 7 | None | ||||
| Terry Matlack (Born 1956) | Chief Executive Officer since May 2011; Director since November 12, 2012 | Managing Director of our Adviser and member of the Investment Committee of the Adviser since 2002; Director of each of the Company, TYY, TYG, TPZ, and TTO from its inception to September 15, 2009; Director of each of TYG, TYY, TPZ, NTG, TTP and NDP since November 12, 2012; Chief Executive Officer of NTG since 2010, of each of TYG, TYY, and TPZ since May 2011, and of each of TTP and NDP since its inception; Chief Financial Officer of each of TYY, TYG, TPZ, and the Company from its inception to May 2011 and of TTO from its inception to June 2012. CFA designation since 1985. | 7 | None | ||||
| P. Bradley Adams (Born 1960) | Chief Financial Officer since May 2011 | Managing Director of the Adviser since January 2013; Director of Financial Operations of the Adviser from 2005 to January 2013; Chief Financial Officer of NTG since 2010, of each of TYG, TYY and TPZ since May 2011, and of each of TTP and NDP since its inception; Assistant Treasurer of each of the Company, TYG and TYY from November 2005 to May 2011, of TPZ from its inception to May 2011, and of TTO from its inception to June 2012. | N/A | None | ||||
| Zachary A. Hamel (Born 1965) | Senior Vice President since April 2007 | Managing Director of our Adviser and member of the Investment Committee of the Adviser since 2002; Joined Fountain Capital in 1997and was a Partner there from 2001 through September 2012; President of NTG since 2010, of each of TYG, TYY and TPZ since May 2011, and of each of TTP and NDP since its inception; Senior Vice President of each of TYY and TPZ from its inception to May 2011, of TYG from 2007 to May 2011 and of TTO from 2005 through November 2011. CFA designation since 1998. | N/A | None | ||||
| Kenneth P. Malvey (Born 1965) | Senior Vice President since April 2007; Treasurer since November 2005 | Managing Director of our Adviser and member of the Investment Committee of the Adviser since 2002; Joined Fountain Capital in 2002 and was a Partner there from 2004 through September 2012; Treasurer of each of TYG and TYY since 2005, of each of TPZ, NTG, TTP and NDP since its inception and of TTO from 2005 through November 2011; Senior Vice President of each of TYY, TPZ, NTG, TTP and NDP since its inception, of TYG since 2007, and of TTO from inception through November 2011. CFA designation since 1996. | N/A | None | ||||
| Robert Thummel (Born 1972) | President since September 2008 | Portfolio Manager/Senior Investment Analyst of the Adviser; Member of Investment Committee for NDP; Joined the Adviser in 2004 as an Investment Analyst; Previously, Director of Finance at KLT Inc., a subsidiary of Great Plains Energy (1998-2004); Senior Auditor at Ernst & Young LLP (1995-1998). | N/A | None | ||||
| David J. Schulte (Born 1961) | Senior Vice President since May 2011 | Managing Director of our Adviser and member of the Investment Committee of the Adviser since 2002; Managing Director of Corridor InfraTrust Management, LLC, an affiliate of the Adviser; President and Chief Executive Officer of each of TYG, TYY and TPZ from its inception to May 2011; Chief Executive Officer of the Company from 2005 to May 2011; President of the Company from 2005 to September 2008; Chief Executive Officer of TTO (now CORR) since 2005 and President from 2005 to April 2007 and since June 2012; Senior Vice President of NTG since 2010, of each of TYG, TYY and TPZ since May 2011, and of each of TTP and NDP since its inception. CFA designation since 1992. | N/A | CorEnergy | ||||
| (1) | This number includes TYG, TYY, TPZ, NTG, TTP, NDP and the Company. Our Adviser also serves as the investment adviser to TYG, TYY, TPZ, NTG, TTP and NDP. |
| (2) | As a result of their respective positions held with our Adviser or its affiliates, these individuals are considered “interested persons” within the meaning of the 1940 Act. |
| * | The address of each director and officer is 11550 Ash Street, Suite 300, Leawood, Kansas 66211. |
20 Tortoise North American Energy Corp.
Additional Information (Unaudited) |
Director and Officer Compensation
The Company does not compensate any of its directors who are “interested persons,” as defined in Section 2(a)(19) of the 1940 Act, nor any of its officers. For the year ended November 30, 2013, the aggregate compensation paid by the Company to the independent directors was $47,500. The Company did not pay any special compensation to any of its directors or officers.
Forward-Looking Statements
This report contains “forward-looking statements” within the meaning of the Securities Act of 1933 and the Securities Exchange Act of 1934. By their nature, all forward-looking statements involve risks and uncertainties, and actual results could differ materially from those contemplated by the forward-looking statements. Several factors that could materially affect the Company’s actual results are the performance of the portfolio of stocks held by it, the conditions in the U.S. and international financial, petroleum and other markets, the price at which shares of the Company will trade in the public markets and other factors discussed in filings with the SEC.
Proxy Voting Policies
A description of the policies and procedures that the Company uses to determine how to vote proxies relating to portfolio securities owned by the Company and information regarding how the Company voted proxies relating to the portfolio of securities during the 12-month period ended June 30, 2013 is available to stockholders (i) without charge, upon request by calling the Company at (913) 981-1020 or toll-free at (866) 362-9331 and on the Company’s Web site at www.tortoiseadvisors.com; and (ii) on the SEC’s Web site at www.sec.gov.
Form N-Q
The Company files its complete schedule of portfolio holdings for the first and third quarters of each fiscal year with the SEC on Form N-Q. The Company’s Form N-Q is available without charge upon request by calling the Company at (866) 362-9331 or by visiting the SEC’s Web site at www.sec.gov. In addition, you may review and copy the Company’s Form N-Q at the SEC’s Public Reference Room in Washington, D.C. You may obtain information on the operation of the Public Reference Room by calling (800) SEC-0330.
The Company’s Form N-Qs are also available on the Company’s Web site at www.tortoiseadvisors.com.
Statement of Additional Information
The Statement of Additional Information (“SAI”) includes additional information about the Company’s directors and is available upon request without charge by calling the Company at (866) 362-9331 or by visiting the SEC’s Web site at www.sec.gov.
Certifications
The Company’s Chief Executive Officer submitted to the New York Stock Exchange the annual CEO certification as required by Section 303A.12(a) of the NYSE Listed Company Manual.
The Company has filed with the SEC, as an exhibit to its most recently filed Form N-CSR, the certification of its Chief Executive Officer and Chief Financial Officer required by Section 302 of the Sarbanes-Oxley Act.
Privacy Policy
In order to conduct its business, the Company collects and maintains certain nonpublic personal information about its stockholders of record with respect to their transactions in shares of the Company’s securities. This information includes the stockholder’s address, tax identification or Social Security number, share balances, and dividend elections. We do not collect or maintain personal information about stockholders whose share balances of our securities are held in “street name” by a financial institution such as a bank or broker.
We do not disclose any nonpublic personal information about you, the Company’s other stockholders or the Company’s former stockholders to third parties unless necessary to process a transaction, service an account, or as otherwise permitted by law.
To protect your personal information internally, we restrict access to nonpublic personal information about the Company’s stockholders to those employees who need to know that information to provide services to our stockholders. We also maintain certain other safeguards to protect your nonpublic personal information.
Automatic Dividend Reinvestment Plan
If a stockholder’s shares are registered directly with the Company or with a brokerage firm that participates in the Company’s Automatic Dividend Reinvestment Plan (the “Plan”), all distributions are automatically reinvested for stockholders by the Plan Agent in additional shares of common stock of the Company (unless a stockholder is ineligible or elects otherwise). Stockholders holding shares that participate in the Plan in a brokerage account may not be able to transfer the shares to another broker and continue to participate in the Plan. Stockholders who elect not to participate in the Plan will receive all distributions payable in cash paid by check mailed directly to the stockholder of record (or, if the shares are held in street or other nominee name, then to such nominee) by Computershare, as dividend paying agent. Distributions subject to tax (if any) are taxable whether or not shares are reinvested.
If, on the distribution payment date, the net asset value per share of the common stock is equal to or less than the market price per share of common stock plus estimated brokerage commissions, the Company will issue additional shares of common stock to participants. The number of shares will be determined by the greater of the net asset value per share or 95 percent of the market price. Otherwise, shares generally will be purchased on the open market by the Plan Agent as soon as possible following the payment date or purchase date, but in no event later than 30 days after such date except as necessary to comply with applicable law. There are no brokerage charges with respect to shares issued directly by the Company as a result of distributions payable either in shares or in cash. However, each participant will pay a pro rata share of brokerage commissions incurred with respect to the Plan Agent’s open-market purchases in connection with the reinvestment of distributions. If a participant elects to have the Plan Agent sell part or all of his or her common stock and remit the proceeds, such participant will be charged a transaction fee of $15.00 plus his or her pro rata share of brokerage commissions on the shares sold.
Participation is completely voluntary. Stockholders may elect not to participate in the Plan, and participation may be terminated or resumed at any time without penalty, by giving notice in writing, by telephone or Internet to Computershare, the Plan Agent, at the address set forth below. Such termination will be effective with respect to a particular distribution if notice is received prior to such record date.
Additional information about the Plan may be obtained by writing to Computershare Trust Company, N.A., P.O. Box 30170, College Station, TX 77842-3170. You may also contact Computershare by phone at (800) 426-5523 or visit their Web site at www.computershare.com.
2013 Annual Report 21
Additional Information (Unaudited) (Continued) |
Approval of the Investment Advisory Agreement
In approving the renewal of the Investment Advisory Agreement in November 2013, the directors who are not “interested persons” (as defined in the Investment Company Act of 1940) of the Company (“Independent Directors”) requested and received extensive data and information from the Adviser concerning the Company and the services provided to it by the Adviser under the Investment Advisory Agreement. In addition, the Independent Directors requested and received data and information from the Adviser, which also included information from independent, third-party sources, regarding the factors considered in their evaluation.
Factors Considered
The Independent Directors considered and evaluated all the information provided by the Adviser. The Independent Directors did not identify any single factor as being all-important or controlling, and each Independent Director may have attributed different levels of importance to different factors. In deciding to renew the agreement, the Independent Directors’ decision was based on the following factors.
Nature, Extent and Quality of Services Provided. The Independent Directors considered information regarding the history, qualification and background of the Adviser and the individuals responsible for the Adviser’s investment program, the adequacy of the number of the Adviser personnel and other Adviser resources and plans for growth, use of affiliates of the Adviser, and the particular expertise with respect to energy infrastructure companies, MLP markets and financing (including private financing). The Independent Directors concluded that the nature of the Company and the specialized expertise of the Adviser in the niche market of MLPs made it qualified to serve as the adviser. Further, the Independent Directors recognized that the Adviser’s commitment to a long-term investment horizon correlated well to the investment strategy of the Company.
Investment Performance of the Company and the Adviser, Costs of the Services To Be Provided and Profits To Be Realized by the Adviser and its Affiliates from the Relationship, and Fee Comparisons. The Independent Directors reviewed and evaluated information regarding the Company’s performance (including quarterly, last twelve months, and from inception) and the performance of the other Adviser accounts (including other investment companies), and information regarding the nature of the markets during the performance period, with a particular focus on the MLP sector. The Independent Directors also considered the Company’s performance as compared to comparable closed-end funds for the relevant periods.
The Adviser provided detailed information concerning its cost of providing services to the Company, its profitability in managing the Company, its overall profitability, and its financial condition. The Independent Directors reviewed with the Adviser the methodology used to prepare this financial information. This financial information regarding the Adviser is considered in order to evaluate the Adviser’s financial condition, its ability to continue to provide services under the Investment Advisory Agreement, and the reasonableness of the current management fee, and was, to the extent possible, evaluated in comparison to other investment advisers to closed-end funds with similar investment objectives and strategies.
The Independent Directors considered and evaluated information regarding fees charged to, and services provided to, other investment companies advised by the Adviser (including the impact of any fee waiver or reimbursement arrangements and any expense reimbursement arrangements), fees charged to separate institutional accounts by the Adviser, and comparisons of fees of closed-end funds with similar investment objectives and strategies, including other MLP investment companies, to the Company. The Independent Directors concluded that the fees and expenses that the Company is paying under the Investment Advisory Agreement, as well as the operating expense ratios of the Company, are reasonable given the quality of services provided under the Investment Advisory Agreement and that such fees and expenses are reasonable compared to the fees charged by advisers to comparable funds.
Economies of Scale. The Independent Directors considered information from the Adviser concerning whether economies of scale would be realized as the Company grows, and whether fee levels reflect any economies of scale for the benefit of the Company’s stockholders. The Independent Directors concluded that economies of scale are difficult to measure and predict overall. Accordingly, the Independent Directors reviewed other information, such as year-over-year profitability of the Adviser generally, the profitability of its management of the Company specifically, and the fees of competitive funds not managed by the Adviser over a range of asset sizes. The Independent Directors concluded the Adviser is appropriately sharing any economies of scale through its reasonable fee structure and through reinvestment in its business resources to provide stockholders additional content and services.
Collateral Benefits Derived by the Adviser. The Independent Directors reviewed information from the Adviser concerning collateral benefits it receives as a result of its relationship with the Company. They concluded that the Adviser generally does not use the Company’s or stockholder information to generate profits in other lines of business, and therefore does not derive any significant collateral benefits from them.
The Independent Directors did not, with respect to their deliberations concerning their approval of the continuation of the Investment Advisory Agreement, consider the benefits the Adviser may derive from relationships the Adviser may have with brokers through soft dollar arrangements because the Adviser does not employ any such arrangements in rendering its advisory services to the Company. Although the Adviser may receive research from brokers with whom it places trades on behalf of clients, the Adviser does not have soft dollar arrangements or understandings with such brokers regarding receipt of research in return for commissions.
Conclusions of the Directors
As a result of this process, the Independent Directors, assisted by the advice of legal counsel that is independent of the Adviser, and taking into account all of the factors discussed above and the information provided by the Adviser, unanimously concluded that the Investment Advisory Agreement between the Company and the Adviser is fair and reasonable in light of the services provided and should be renewed.
22 Tortoise North American Energy Corp.
![]()

Office of the Company Managing Directors of Board of Directors of H. Kevin Birzer, Chairman Terry Matlack Rand C. Berney Conrad S. Ciccotello Charles E. Heath | ADMINISTRATOR U.S. Bancorp Fund Services, LLC 615 East Michigan St. Milwaukee, Wis. 53202 CUSTODIAN TRANSFER, DIVIDEND DISBURSING LEGAL COUNSEL INVESTOR RELATIONS STOCK SYMBOL This report is for stockholder information. This is not a prospectus intended for use in the purchase or sale of fund shares. Past performance is no guarantee of future results and your investment may be worth more or less at the time you sell. |
Tortoise Capital Advisors’ Closed-end Funds
| Pureplay MLP Funds | Broader Funds | |||||||||||
| Name | Ticker | Focus | Total Assets(1) ($ in millions) | Name | Ticker | Focus | Total Assets(1) ($ in millions) | |||||
| Tortoise Energy Infrastructure Corp. |  | Midstream Equity | $2,257 | Tortoise Pipeline & Energy Fund, Inc. |  | Pipeline Equity | $409 | |||||
| Tortoise Energy Capital Corp. |  | Midstream Equity | $1,064 | Tortoise Energy Independence Fund, Inc. |  | North American Upstream Equity | $454 | |||||
| Tortoise MLP Fund, Inc. |  | Natural Gas Infrastructure Equity | $1,982 | Tortoise Power and Energy Infrastructure Fund, Inc. |  | Power & Energy Infrastructure Debt & Dividend Paying Equity | $235 | |||||
| Tortoise North American Energy Corp. |  | Midstream/Upstream Equity | $285 | |||||||||
(1) As of 12/31/13

Item 2. Code of Ethics.
The Registrant has adopted a code of ethics that applies to the Registrant’s Chief Executive Officer and its Chief Financial Officer. The Registrant has not made any amendments to this code of ethics during the period covered by this report. The Registrant has not granted any waivers from any provisions of this code of ethics during the period covered by this report.
Item 3. Audit Committee Financial Expert.
The Registrant’s Board of Directors has determined that there is at least one “audit committee financial expert” serving on its audit committee. Mr. Conrad Ciccotello is the “audit committee financial expert” and is considered to be “independent” as each term is defined in Item 3 of Form N-CSR. In addition to his experience overseeing or assessing the performance of companies or public accountants with respect to the preparation, auditing or evaluation of financial statements, Mr. Ciccotello has a Ph.D. in Finance.
Item 4. Principal Accountant Fees and Services.
The Registrant has engaged its principal accountant to perform audit services, audit-related services and tax services during the past two fiscal years. “Audit services” refer to performing an audit of the Registrant's annual financial statements or services that are normally provided by the accountant in connection with statutory and regulatory filings or engagements for those fiscal years. “Audit-related services” refer to the assurance and related services by the principal accountant that are reasonably related to the performance of the audit. “Tax services” refer to professional services rendered by the principal accountant for tax compliance, tax advice, and tax planning. The following table details the approximate amounts of aggregate fees billed to the Registrant for the last two fiscal years for audit fees, audit-related fees, tax fees and other fees by the principal accountant.
| FYE 11/30/2013 | FYE 11/30/2012 | |||||||
| Audit Fees | $ | 110,000 | $ | 107,000 | ||||
| Audit-Related Fees | — | — | ||||||
| Tax Fees | $ | 37,000 | $ | 36,000 | ||||
| All Other Fees | — | — | ||||||
| Aggregate Non-Audit Fees | $ | 37,000 | $ | 36,000 | ||||
The audit committee has adopted pre-approval policies and procedures that require the audit committee to pre-approve (i) the selection of the Registrant’s independent registered public accounting firm, (ii) the engagement of the independent registered public accounting firm to provide any non-audit services to the Registrant, (iii) the engagement of the independent registered public accounting firm to provide any non-audit services to the Adviser or any entity controlling, controlled by, or under common control with the Adviser that provides ongoing services to the Registrant, if the engagement relates directly to the operations and financial reporting of the Registrant, and (iv) the fees and other compensation to be paid to the independent registered public accounting firm. The Chairman of the audit committee may grant the pre-approval of any engagement of the independent registered public accounting firm for non-audit services of less than $10,000, and such delegated pre-approvals will be presented to the full audit committee at its next meeting. Under certain limited circumstances, pre-approvals are not required under securities law regulations for certain non-audit services below certain de minimus thresholds. Since the adoption of these policies and procedures, the audit committee has pre-approved all audit and non-audit services provided to the Registrant by the principal accountant. None of these services provided by the principal accountant were approved by the audit committee pursuant to the de minimus exception under Rule 2.01(c)(7)(i)(C) or Rule 2.01(c)(7)(ii) of Regulation S-X. All of the principal accountant’s hours spent on auditing the Registrant’s financial statements were attributed to work performed by full-time permanent employees of the principal accountant.
In the Registrant’s fiscal years ended November 30, 2013 and 2012, the Adviser paid approximately $70,500 and $15,000 in fees, respectively, for tax and other non-audit services provided to the Adviser. These non-audit services were not required to be preapproved by the Registrant’s audit committee. No entity controlling, controlled by, or under common control with the Adviser that provides ongoing services to the Registrant, has paid to, or been billed for fees by, the principal accountant for non-audit services rendered to the Adviser or such entity during the Registrant’s last two fiscal years. The audit committee has considered whether the principal accountant’s provision of services (other than audit services) to the Registrant, the Adviser or any entity controlling, controlled by, or under common control with the Adviser that provides services to the Registrant is compatible with maintaining the principal accountant’s independence in performing audit services.
Item 5. Audit Committee of Listed Registrants.
The Registrant has a separately-designated standing audit committee established in accordance with Section 3(a)(58)(A) of the Securities Exchange Act of 1934, and at November 30, 2013 was comprised of Mr. Conrad S. Ciccotello, Mr. John R. Graham and Mr. Charles E. Heath. Mr. Graham died in December 2013, and effective January 1, 2014, Mr. Rand C. Berney joined the Registrant's Board of Directors and became a member of the audit committee. As of the date of filing of this report, the Registrant's audit committee consists of Mr. Ciccotello, Mr. Heath and Mr. Berney.
Item 6. Schedule of Investments.
Schedule of Investments is included as part of the report to shareholders filed under Item 1.
Item 7. Disclosure of Proxy Voting Policies and Procedures for Closed-End Management Investment Companies.
Copies of the proxy voting policies and procedures of the Registrant and the Adviser are attached hereto as Exhibit 99.VOTEREG and Exhibit 99.VOTEADV, respectively.
Item 8. Portfolio Managers of Closed-End Management Investment Companies.
Unless otherwise indicated, information is presented as of November 30, 2013.
Portfolio Managers
As of the date of this filing, management of the Registrant’s portfolio is the responsibility of a team of portfolio managers consisting of H. Kevin Birzer, Terry Matlack, David J. Schulte, Zachary A. Hamel and Kenneth P. Malvey, all of whom are Managers of the Adviser, comprise the investment committee of the Adviser and share responsibility for such investment management. All decisions to invest in a portfolio company must be approved by the unanimous decision of the Adviser’s investment committee and any one member of the Adviser’s investment committee can require the Adviser to sell a portfolio company or can veto the investment committee’s decision to invest in a portfolio company. Biographical information about each member of the Adviser’s investment committee as of the date of this filing is set forth below.
| Name and Age* | Position(s) Held with Company and Length of Time Served | Principal Occupation During Past Five Years | ||
H. Kevin Birzer | Director and | Managing Director of the Adviser and member of the Investment Committee of the Adviser since 2002; Member, Fountain Capital Management, LLC (“Fountain Capital”), a registered investment adviser, (1990-May 2009); Director and Chairman of the Board of each of Tortoise Energy Infrastructure Corporation (“TYG”), Tortoise Energy Capital Corporation (“TYY”), Tortoise Power and Energy Infrastructure Fund, Inc. (“TPZ”), Tortoise MLP Fund, Inc. (“NTG”), Tortoise Pipeline & Energy Fund, Inc. (“TTP”), and Tortoise Energy Independence Fund, Inc. (“NDP”) since its inception; Director and Chairman of the Board of Tortoise Capital Resources Corporation (“TTO”) from its inception through November 30, 2011. CFA designation since 1988. | ||
Terry Matlack | Chief Executive Officer | Managing Director of our Adviser and member of the Investment Committee of the Adviser since 2002; Director of each of the Company, TYY, TYG, TPZ, and TTO from its inception to September 15, 2009; Director of each of TYG, TYY, TPZ, NTG, TTP and NDP since November 12, 2012; Chief Executive Officer of NTG since 2010, of each of TYG, TYY, and TPZ since May 2011, and of each of TTP and NDP since its inception; Chief Financial Officer of each of TYY, TYG, TPZ, and the Company from its inception to May 2011 and of TTO from its inception to June 2012. CFA designation since 1985. | ||
Zachary A. Hamel | Senior Vice President | Managing Director of our Adviser and member of the Investment Committee of the Adviser since 2002; Joined Fountain Capital in 1997and was a Partner there from 2001 through September 2012; President of NTG since 2010, of each of TYG, TYY and TPZ since May 2011, and of each of TTP and NDP since its inception; Senior Vice President of each of TYY and TPZ from its inception to May 2011, of TYG from 2007 to May 2011 and of TTO from 2005 through November 2011. CFA designation since 1998. | ||
Kenneth P. Malvey | Senior Vice President | Managing Director of our Adviser and member of the Investment Committee of the Adviser since 2002; Joined Fountain Capital in 2002 and was a Partner there from 2004 through September 2012; Treasurer of each of TYG and TYY since 2005, of each of TPZ, NTG, TTP and NDP since its inception and of TTO from 2005 through November 2011; Senior Vice President of each of TYY, TPZ, NTG, TTP and NDP since its inception, of TYG since 2007, and of TTO from inception through November 2011. CFA designation since 1996. | ||
David J. Schulte | Senior Vice President | Managing Director of our Adviser and member of the Investment Committee of the Adviser since 2002; Managing Director of Corridor InfraTrust Management, LLC, an affiliate of the Adviser; President and Chief Executive Officer of each of TYG, TYY and TPZ from its inception to May 2011; Chief Executive Officer of the Company from 2005 to May 2011; President of the Company from 2005 to September 2008; Chief Executive Officer of TTO (now CorEnergy Infrastructure Trust, Inc. (“CORR”)) since 2005 and President of TTO from 2005 to April 2007 and since June 2012; Senior Vice President of NTG since 2010, of each of TYG, TYY and TPZ since May 2011, and of each of TTP and NDP since its inception. CFA designation since 1992. |
*The address of each member of the investment committee is 11550 Ash Street, Suite 300, Leawood, Kansas 66211.
The Adviser also serves as the investment adviser to TYG, TYY, TPZ, NTG, TTP and NDP.
The following table provides information about the other accounts managed on a day-to-day basis by each of the portfolio managers as of November 30, 2013:
| Number of | ||||||||||||
| Accounts | Total Assets of | |||||||||||
| Paying a | Accounts Paying | |||||||||||
| Number of | Total Assets of | Performance | a Performance | |||||||||
| Name of Manager | Accounts | Accounts | Fee | Fee | ||||||||
| H. Kevin Birzer | ||||||||||||
| Registered investment companies | 11 | $8,165,818,119 | 0 | — | ||||||||
| Other pooled investment vehicles | 11 | $104,084,561 | 1 | $14,923,585 | ||||||||
| Other accounts | 831 | $5,155,526,368 | 0 | — | ||||||||
| Zachary A. Hamel | ||||||||||||
| Registered investment companies | 11 | $8,165,818,119 | 0 | — | ||||||||
| Other pooled investment vehicles | 11 | $104,084,561 | 1 | $14,923,585 | ||||||||
| Other accounts | 831 | $5,155,526,368 | 0 | — | ||||||||
| Kenneth P. Malvey | ||||||||||||
| Registered investment companies | 11 | $8,165,818,119 | 0 | — | ||||||||
| Other pooled investment vehicles | 11 | $104,084,561 | 1 | $14,923,585 | ||||||||
| Other accounts | 831 | $5,155,526,368 | 0 | — | ||||||||
| Terry Matlack | ||||||||||||
| Registered investment companies | 11 | $8,165,818,119 | 0 | — | ||||||||
| Other pooled investment vehicles | 11 | $104,084,561 | 1 | $14,923,585 | ||||||||
| Other accounts | 831 | $5,155,526,368 | 0 | — | ||||||||
| David J. Schulte | ||||||||||||
| Registered investment companies | 11 | $8,165,818,119 | 0 | — | ||||||||
| Other pooled investment vehicles | 11 | $104,084,561 | 1 | $14,923,585 | ||||||||
| Other accounts | 831 | $5,155,526,368 | 0 | — | ||||||||
Material Conflicts of Interest
Conflicts of interest may arise from the fact that the Adviser and its affiliates carry on substantial investment activities for other clients, in which the Registrant has no interest, some of which may have investment strategies similar to the Registrant. The Adviser or its affiliates may have financial incentives to favor certain of these accounts over the Registrant. For example, the Adviser may have an incentive to allocate potentially more favorable investment opportunities to other funds and clients that pay the Adviser an incentive or performance fee. Performance and incentive fees also create the incentive to allocate potentially riskier, but potentially better performing, investments to such funds and other clients in an effort to increase the incentive fee. The Adviser also may have an incentive to make investments in one fund, having the effect of increasing the value of a security in the same issuer held by another fund. Any of their proprietary accounts or other customer accounts may compete with the Registrant for specific trades. The Adviser or its affiliates may give advice and recommend securities to, or buy or sell securities for, other accounts and customers, which advice or securities recommended may differ from advice given to, or securities recommended or bought or sold for, the Registrant, even though their investment objectives may be the same as, or similar to, the Registrant’s objectives. The Adviser has written allocation policies and procedures designed to address potential conflicts of interest. For instance, when two or more clients advised by the Adviser or its affiliates seek to purchase or sell the same publicly traded securities, the securities actually purchased or sold will be allocated among the clients on a good faith equitable basis by the Adviser in its discretion and in accordance with the clients’ various investment objectives and the Adviser’s procedures. In some cases, this system may adversely affect the price or size of the position the Registrant may obtain or sell. In other cases, the Registrant’s ability to participate in volume transactions may produce better execution for it. When possible, the Adviser combines all of the trade orders into one or more block orders, and each account participates at the average unit or share price obtained in a block order. When block orders are only partially filled, the Adviser considers a number of factors in determining how allocations are made, with the overall goal to allocate in a manner so that accounts are not preferred or disadvantaged over time. The Adviser also has allocation policies for transactions involving private placement securities, which are designed to result in a fair and equitable participation in offerings or sales for each participating client.
The Adviser also serves as investment adviser for six other publicly traded management investment companies, all of which invest in the energy sector.
The Adviser will evaluate a variety of factors in determining whether a particular investment opportunity or strategy is appropriate and feasible for the relevant account at a particular time, including, but not limited to, the following: (1) the nature of the investment opportunity taken in the context of the other investments at the time; (2) the liquidity of the investment relative to the needs of the particular entity or account; (3) the availability of the opportunity (i.e., size of obtainable position); (4) the transaction costs involved; and (5) the investment or regulatory limitations applicable to the particular entity or account. Because these considerations may differ when applied to the Registrant and relevant accounts under management in the context of any particular investment opportunity, the Registrant’s investment activities, on the one hand, and other managed accounts, on the other hand, may differ considerably from time to time. In addition, the Registrant’s fees and expenses will differ from those of the other managed accounts. Accordingly, stockholders should be aware that the Registrant’s future performance and the future performance of the other accounts of the Adviser may vary.
Situations may occur when the Registrant could be disadvantaged because of the investment activities conducted by the Adviser and its affiliates for their other accounts. Such situations may be based on, among other things, the following: (1) legal or internal restrictions on the combined size of positions that may be taken for the Registrant or the other accounts, thereby limiting the size of the Registrant’s position; (2) the difficulty of liquidating an investment for the Registrant or the other accounts where the market cannot absorb the sale of the combined position; or (3) limits on co-investing in negotiated transactions under the Investment Company Act of 1940.
Under the Investment Company Act of 1940, the Registrant and its affiliated companies may be precluded from co-investing in negotiated private placements of securities. As such, the Registrant will not co-invest with its affiliates in negotiated private placement transactions. The Adviser will observe a policy for allocating negotiated private investment opportunities among its clients that takes into account the amount of each client’s available cash and its investment objectives. These allocation policies may result in the allocation of investment opportunities to an affiliated company rather than to the Registrant.
To the extent that the Adviser sources and structures private investments in master limited partnerships (“MLPs”), certain employees of the Adviser may become aware of actions planned by MLPs, such as acquisitions, which may not be announced to the public. It is possible that the Registrant could be precluded from investing in or selling securities of an MLP about which the Adviser has material, non-public information; however, it is the Adviser’s intention to ensure that any material, non-public information available to certain employees of the Adviser is not shared with the employees responsible for the purchase and sale of publicly traded MLP securities or to confirm prior to receipt of any material non-public information that the information will shortly be made public. The Registrant’s investment opportunities also may be limited by affiliations of the Adviser or its affiliates with energy infrastructure companies.
The Adviser and its principals, officers, employees, and affiliates may buy and sell securities or other investments for their own accounts and may have actual or potential conflicts of interest with respect to investments made on the Registrant’s behalf. As a result of differing trading and investment strategies or constraints, positions may be taken by principals, officers, employees, and affiliates of the Adviser that are the same as, different from, or made at a different time than positions taken for the Registrant. Further, the Adviser may at some time in the future, manage additional investment funds with the same investment objective as the Registrant’s.
Compensation
None of Messrs. Birzer, Hamel, Malvey, Matlack or Schulte receives any direct compensation from the Registrant or any other of the managed accounts reflected in the table above. All such accounts are managed by the Adviser. Each of Messrs. Birzer, Hamel, Malvey, Matlack and Schulte has a services agreement with the Adviser and receives a base guaranteed payment from the Adviser for the services he provides. They are also eligible for an annual cash bonus based on the Adviser’s earnings and the satisfaction of certain other conditions. Additional benefits received by Messrs. Birzer, Hamel, Malvey, Matlack and Schulte are normal and customary employee benefits generally available to all salaried employees. Each of Messrs. Birzer, Hamel, Malvey, Matlack and Schulte own an equity interest in Tortoise Holdings, LLC which wholly owns the Adviser, and each thus benefits from increases in the net income of the Adviser.
Securities Owned in the Registrant by Portfolio Managers
The following table provides information about the dollar range of equity securities in the Registrant beneficially owned by each of the portfolio managers as of November 30, 2013:
| Aggregate Dollar Range of | |||
| Portfolio Manager | Holdings in the Registrant | ||
| H. Kevin Birzer | $100,001-$500,000 | ||
| Zachary A. Hamel | $10,001-$50,000 | ||
| Kenneth P. Malvey | $50,001-$100,000 | ||
| Terry Matlack | $100,001-$500,000 | ||
| David J. Schulte | $1-$10,000 | ||
Item 9. Purchases of Equity Securities by Closed-End Management Investment Company and Affiliated Purchasers.
| Period | (a) Total Number of Shares (or Units) Purchased | (b) Average Price Paid per Share (or Unit) | (c) Total Number of Shares (or Units) Purchased as Part of Publicly Announced Plans or Programs | (d) Maximum Number (or Approximate Dollar Value) of Shares (or Units) that May Yet Be Purchased Under the Plans or Programs |
| Month #1 | 0 | 0 | 0 | 0 |
| 6/1/13-6/30/13 | ||||
| Month #2 | 0 | 0 | 0 | 0 |
| 7/1/13-7/31/13 | ||||
| Month #3 | 0 | 0 | 0 | 0 |
| 8/1/13-8/31/13 | ||||
| Month #4 | 0 | 0 | 0 | 0 |
| 9/1/13-9/30/13 | ||||
| Month #5 | 0 | 0 | 0 | 0 |
| 10/1/13-10/31/13 | ||||
| Month #6 | 0 | 0 | 0 | 0 |
| 11/1/13-11/30/13 | ||||
| Total | 0 | 0 | 0 | 0 |
Item 10. Submission of Matters to a Vote of Security Holders.
None.
Item 11. Controls and Procedures.
(a) The Registrant’s Chief Executive Officer and its Chief Financial Officer have concluded that the Registrant's disclosure controls and procedures (as defined in Rule 30a-3(c) under the Investment Company Act of 1940 (the “1940 Act”)) are effective as of a date within 90 days of the filing date of this report, based on the evaluation of these controls and procedures required by Rule 30a-3(b) under the 1940 Act and Rules 13a-15(b) or 15d-15(b) under the Securities Exchange Act of 1934, as amended.
(b) There were no changes in the Registrant’s internal control over financial reporting (as defined in Rule 30a-3(d) under the 1940 Act) that occurred during the Registrant’s second fiscal quarter of the period covered by this report that have materially affected, or are reasonably likely to materially affect, the Registrant’s internal control over financial reporting.
Item 12. Exhibits.
(a)(1) Any code of ethics or amendment thereto, that is the subject of the disclosure required by Item 2, to the extent that the Registrant intends to satisfy Item 2 requirements through filing of an exhibit. Filed herewith.
(2) Certifications pursuant to Section 302 of the Sarbanes-Oxley Act of 2002. Filed herewith.
(3) Any written solicitation to purchase securities under Rule 23c-1 under the Act sent or given during the period covered by the report by or on behalf of the Registrant to 10 or more persons. None.
(b) Certification pursuant to Section 906 of the Sarbanes-Oxley Act of 2002. Furnished herewith.
SIGNATURES
Pursuant to the requirements of the Securities Exchange Act of 1934 and the Investment Company Act of 1940, the Registrant has duly caused this report to be signed on its behalf by the undersigned, thereunto duly authorized.
| (Registrant) | Tortoise North American Energy Corporation |
| By (Signature and Title) | /s/ Terry Matlack |
| Terry Matlack, Chief Executive Officer | |
| Date January 21, 2014 | |
Pursuant to the requirements of the Securities Exchange Act of 1934 and the Investment Company Act of 1940, this report has been signed below by the following persons on behalf of the Registrant and in the capacities and on the dates indicated.
| By (Signature and Title) | /s/ Terry Matlack | |
| Terry Matlack, Chief Executive Officer | ||
| Date January 21, 2014 | ||
| By (Signature and Title) | /s/ P. Bradley Adams | |
| P. Bradley Adams, Chief Financial Officer | ||
| Date January 21, 2014 | ||