united states
securities and exchange commission
washington, d.c. 20549
form n-csr
certified shareholder report of registered management
investment companies
Investment Company Act file number 811-21720
Northern Lights Fund Trust
(Exact name of registrant as specified in charter)
225 Pictoria Drive, Suite 450 Cincinnati, OH 45246
(Address of principal executive offices) (Zip code)
Stephanie Shearer, Gemini Fund Services, LLC.
17605 Wright Street, Omaha, Nebraska 68130
(Name and address of agent for service)
Registrant's telephone number, including area code: 631-470-2600
Date of fiscal year end: 12/31
Date of reporting period: 6/30/20
Item 1. Reports to Stockholders.
Beginning on January 1, 2021, as permitted by regulations adopted by the Securities and Exchange Commission, paper copies of the Fund’s shareholder reports like this one will no longer be sent by mail, unless you specifically request paper copies of the reports. Instead, the reports will be made available on the Fund’s website www.thebiondogroup.com, and you will be notified by mail each time a report is posted and provided with a website link to access the report.
If you already elected to receive shareholder reports electronically, you will not be affected by this change and you need not take any action. You may elect to receive shareholder reports and other communications from the Fund electronically or to continue receiving paper copies of shareholder reports, which are available free of charge, by contacting your financial intermediary (such as a broker-dealer or bank) or, if you are a direct investor, by following the instructions included with paper Fund documents that have been mailed to you.
Dear Fellow Shareholders,
We hope that this letter finds you and your loved ones well. Although it has been only six months since our last writing, it has felt like much longer. While we are gradually resuming normal operations at Biondo Investment Advisors, a lot has happened during three long months of quarantine.
After dropping 19.6% in a brutal first quarter, the S&P 500 Index rebounded and finished down 3.08% YTD at 6/30/20. International equity markets lagged the US a little bit, with the Bloomberg World Index down 4.46% YTD. Bonds fared well up 6.14% YTD.
The Biondo Focus Fund had a very strong second quarter, up 27.37%, and finished the first half of the year up 3.82%. Both of these returns are after the reduction of fees.
The Fund fared well in the face of the COVID-19 pandemic due to stock selection and sector weightings. As discussed below, large-cap growth, and in particular large-cap tech stocks, outperformed significantly during the second quarter. The Fund has an overweight position in both technology as well as healthcare, which also benefited from the threats of the pandemic. The market saw significant money flows into those stocks that represented the “stay at home” economy. Many of the Fund’s top performing stocks fall into that category. Also, sectors such as transportation, leisure and energy suffered greatly during the first half of the year while the Fund has limited exposure to these groups.
The Fund benefited from strong performances from many of our holdings such as Apple, Vertex, Abiomed and Square. There were two major detractors from performance Reata Pharmaceuticals and Boeing. Reata Pharmaceuticals was down significantly due to negative drug trial data from one of its smaller drugs and Boeing suffered greatly from the pandemic’s impact on commercial air travel. Derivative activity had some positive impact on performance as options positions in Abiomed, Square and Boeing had positive returns in the first half.
Significant purchases in the year include ServiceNow, which provides enterprise information technology services; Regeneron, a biopharmaceutical company that develops drugs for various medical conditions; and Bed Bath & Beyond, a retailer of home and bath products. We sold positions in a few companies, including Amarin Corp., SB One Bancorp, and VF Corp.
In the first half of the year, the S&P 500 was down roughly 3%. In a normal year, many would be asking what has gone wrong to produce such poor YTD performance. In fact, it’s not too common for the market to post even such modest losses through mid-year. But, as we all can agree, this is not a normal year. All things considered, many of us have probably taken a deep sigh of relief that market performance isn’t much worse than it is.
This relief is due to some of the best quarterly market returns in decades, led by the NASDAQ, which was up 31% during the second quarter, Its best quarterly return since 1999. The S&P 500
and Dow Jones didn’t fare too shabby either, up 20% and 18%, respectively, the best in at least a couple decades.
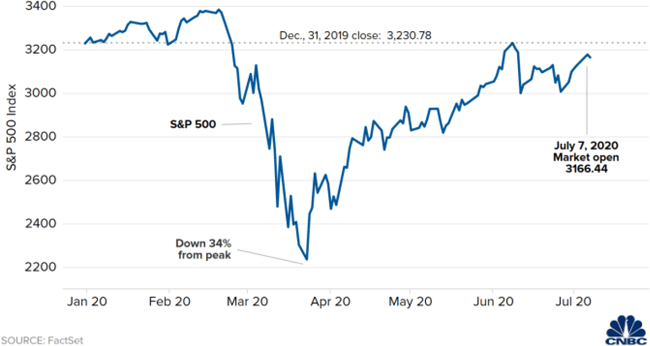
This second quarter rally, while an upward trajectory, was very rocky with wild swings occurring even on a daily basis. Much of this choppiness came as a result of the virus news cycle, with the market focused on daily case reports, testing capabilities and both advancements and setbacks in vaccine and therapeutic development. While there have been many up and down movements in the progression of the virus, the gradual reopening of the economy has helped spur the market back upwards from the lows on March 23. A better than expected June jobs report gave hope to some that the recovery would be more rapid than initially feared.
While many of these developments are welcome news, the overall economic and public health picture is still troublesome. U.S. real GDP contracted at a seasonally adjusted annual rate of 4.8% in the first quarter of 2020, the worst outcome since the fourth quarter of 2008. The second quarter is likely to be much worse, with forecasts pointing to a real GDP decline of around 40%. While the unemployment rate ticked down from the April high of 14.7%, it sits at 11.1% as of this writing, a level that would have been unimaginable only a few short months ago. The economy added 4.8 million jobs in June, yet it is still unknown how many jobs will never come back as the economy reshapes itself from the effects of the pandemic.
The virus’s progression is still the focal point for much of the market. As we write, many states have halted or partially reversed reopening guidelines as cases spike upwards, particularly in the South. Many states have mandated wearing masks in public places and restaurants are closing again in some areas. The vaccine development, while promising, is still a late 2020 or 2021 story according to most experts. The market doesn’t seem to have fully priced in a vaccine as of yet due to this uncertain timeline. The reopening of schools in the fall is still a huge question mark.
Given all the negative news, many would wonder how the market managed this huge rally. The answer lies in a common market axiom that has proven the test of time: “Don’t fight the Fed.” Especially when they are on a mission. Make no mistake about it; this Fed is on a mission. Like Ben Bernanke during the Great Financial Crisis, Jay Powell and company are going to do everything and anything in order to prop up the economy.
There have been numerous times when the economy and the stock market were out of sync. It is a mistake to equate the two. The stock market doesn’t necessarily tell us anything about the economy, or vice versa. When the Federal Reserve pumps $5 trillion into the system, it is going to find a home. “Money goes to where it is treated best.”
It is pretty clear where it has been treated best. As we have written a few times now, recent market returns have been dominated by a select few mega cap growth companies. Currently, the 10 biggest companies represent 28.30% of the S&P 500 market capitalization, the highest percentage in modern stock market history. Excluding these 10 biggest stocks of the market, the S&P 500 would actually be down ~10%, which better reflects the long-range impact of this crisis. These are led by the world’s five largest tech companies: Microsoft, Apple, Amazon, Google and Facebook.
Quite often, market recoveries are instigated by a new group of stock leaders. This time around that has not been the case. While growth outperformed value across all market cap sizes during the quarter, large-cap growth especially dominated and has outpaced large-cap value by 25% since March 31. Certainly, technology and the cloud were two giant beneficiaries of the pandemic. The prevailing leadership of large-cap growth and technology not only has continued but accelerated.
The question now is, how much more can be expected of the expensive growth stock goliaths in pushing the indexes forward as investors wait for the recovery to gain traction? After the recent surge, the S&P 500’s P/E ratio reached 21.4x, which is significantly higher compared to the long-term P/E of 15.7x over the past 15 years. Without digging deeper, one could indeed state that the market is getting overheated. This is even more the case when we take into account the uncertain disruption of the COVID-19 pandemic on the economy in the longer term.
However, the high stock market P/E ratio is a lot lower if we exclude the biggest companies, which on average are not impacted by the crisis. The other 490 S&P 500 companies are valued at a P/E ratio of 16.9x, which is more in-line with the historical averages. We believe the
expanded outlook for the market, therefore, depends on some level of participation from these companies. So far, the market hasn’t priced in the prospects for many of these companies and industries and demonstrates the lack of visibility in the economic recovery. The impact of the virus and the shutdowns is far from being uncovered and will likely be a multi-year story.
Beyond markets being potentially overvalued, we have our share of concerns. The narrow leadership of the largest growth stocks, the shape and timing of an economic recovery, social unrest and the November elections all serve as potential reasons for caution. In the meantime, we would welcome broader participation, more signs of an improving economy and/or some resolution on the social and political fronts in order to feel less nervous about markets.
As money managers, we have emphasized the importance of holding to our investment process in environments like this. While strategically employing cash when opportunities arise, the focus has and will continue to be on holding core positions in quality companies. We are firm believers in sustainable growth companies that emphasize long-term value creation. These firms consider all stakeholders – shareholders, employees, customers and community, especially during uncertain times. These are the companies that not only generate wealth over the long run, but often come out of downturns with stronger, more dominant market positions. This methodology has served us well over time and throughout this pandemic. Much of our recent success can be attributed to actions taken well before these recent events.
As always, we value the trust you have placed in us, particularly during these periods of uncertainty. While we can’t predict when this will be all over, we can say for certain this too shall pass. We look forward to the days of seeing you all again and to continued peace and prosperity.
Very Truly Yours,
 |  |  |
| | | |
| Scott A. Goginsky | Joseph P. Biondo | Joseph R. Biondo |
| Partner | Chief Executive Officer | Founder |
| Research Analyst | Chief Investment Officer | Senior Portfolio Manager |
| Portfolio Manager | Portfolio Manager | |
Sources: Seeking Alpha, CNBC
The information set forth regarding investments was obtained from sources that we believe reliable but we do not guarantee its accuracy or completeness. Neither the information nor opinion expressed constitutes a solicitation by us of the purchase or sale of any securities. Past performance does not guarantee future results.
1134-NLD-7/21/2020
| The Biondo Focus Fund |
| PORTFOLIO REVIEW (Unaudited) |
| June 30, 2020 |
The Fund’s performance figures* for the periods ended June 30, 2020, compared to its benchmarks:
| | | | | | | | | Annualized |
| | | Six | | One | | Annualized | | Inception**- |
| | | Months | | Year | | Five Year | | June 30, 2020 |
| The Biondo Focus Fund - Investor Shares | | 3.82% | | 9.47% | | 9.02% | | 9.67% |
| Dow Jones Industrial Average Total Return Index | | (8.43)% | | (0.54)% | | 10.62% | | 11.66% |
| S&P 500 Total Return Index | | (3.08)% | | 7.51% | | 10.73% | | 12.27% |
| * | The performance data quoted is historical. Past performance is no guarantee of future results. Current performance may be higher or lower than the performance data quoted. The principal value and investment return of an investment will fluctuate so that your shares, when redeemed, may be worth more or less than their original cost. The returns shown do not reflect the deduction of taxes that a shareholder would pay on Fund distributions or on the redemptions of Fund shares. Per the fee table in the Fund’s May 1, 2020 prospectus, the Fund’s total annual operating expense ratio before waivers is 1.67%. Shares redeemed within 30 days of purchase are subject to a redemption fee of 2.00%. For performance information current to the most recent month-end, please call 1-800-672-9152. |
| ** | Inception date is March 17, 2010. |
The Dow Jones Industrial Average Total Return Index represents large and well-known U.S. companies and covers all industries with the exception of Transportation and Utilities. Investors cannot invest directly in an index.
The S&P 500 Total Return Index is an unmanaged capitalization weighted index of 500 stocks designed to measure performance of the broad domestic economy through changes in the aggregated market value of the 500 stocks representing all major industries. Investors cannot invest directly in an index.
| *** | The Fund’s fiscal year end changed from January 31 to December 31, effective February 1, 2012. |
The Fund’s top 10 sectors are as follows, as of June 30, 2020:
| Sectors | | % of Net Assets | | | Sectors | | % of Net Assets | |
| Biotechnology | | | 17.5 | % | | Diversified Financial Services | | | 7.1 | % |
| Healthcare - Products | | | 14.7 | % | | Pharmaceuticals | | | 6.2 | % |
| Internet | | | 11.2 | % | | Medical Instruments | | | 2.8 | % |
| Software | | | 10.1 | % | | Retail | | | 2.5 | % |
| Computers | | | 8.7 | % | | Other, Cash & Cash Equivalents | | | 12.1 | % |
| Commercial Services | | | 7.1 | % | | | | | 100.0 | % |
Please refer to the Portfolio of Investments in this semi-annual report for a detailed listing of the Fund’s holdings.
| The Biondo Focus Fund |
| PORTFOLIO OF INVESTMENTS (Unaudited) |
| June 30, 2020 |
| Shares | | | | | Fair Value | |
| | | | | COMMON STOCK - 90.9% | | | | |
| | | | | AEROSPACE - 1.2% | | | | |
| | 4,000 | | | Boeing Co. | | $ | 733,200 | |
| | | | | | | | | |
| | | | | BANKS - 1.8% | | | | |
| | 5,375 | | | SVB Financial Group * | | | 1,158,474 | |
| | | | | | | | | |
| | | | | BIOTECHNOLOGY - 17.5% | | | | |
| | 22,500 | | | Exact Sciences Corp. * | | | 1,956,150 | |
| | 65,000 | | | Iovance Biotherapeutics, Inc. * | | | 1,784,250 | |
| | 3,000 | | | Regeneron Pharmaceuticals, Inc. * | | | 1,870,950 | |
| | 18,500 | | | Vertex Pharmaceuticals, Inc. * | | | 5,370,735 | |
| | | | | | | | 10,982,085 | |
| | | | | COMMERCIAL SERVICES - 7.1% | | | | |
| | 42,500 | | | Square, Inc. * | | | 4,459,950 | |
| | | | | | | | | |
| | | | | COMPUTERS - 8.7% | | | | |
| | 15,000 | | | Apple, Inc. ^ | | | 5,472,000 | |
| | | | | | | | | |
| | | | | DIVERSIFIED FINANCIAL SERVICES - 7.1% | | | | |
| | 15,075 | | | MasterCard, Inc. - Class A ^ | | | 4,457,678 | |
| | | | | | | | | |
| | | | | HEALTHCARE - PRODUCTS - 14.7% | | | | |
| | 20,000 | | | ABIOMED, Inc. * | | | 4,831,200 | |
| | 22,500 | | | Edwards Lifesciences Corp. * | | | 1,554,975 | |
| | 5,000 | | | Intuitive Surgical, Inc. * ^ | | | 2,849,150 | |
| | | | | | | | 9,235,325 | |
| | | | | INTERNET - 11.2% | | | | |
| | 6,500 | | | Alibaba Group Holding Ltd. - ADR * | | | 1,402,050 | |
| | 2,000 | | | Alphabet, Inc. - Class A * | | | 2,836,100 | |
| | 1,000 | | | Amazon.com, Inc. * | | | 2,758,820 | |
| | | | | | | | 6,996,970 | |
| | | | | MEDICAL INSTRUMENTS - 2.8% | | | | |
| | 4,750 | | | Illumina, Inc. * ^ | | | 1,759,163 | |
| | | | | | | | | |
| | | | | PHARMACEUTICALS - 6.2% | | | | |
| | 25,000 | | | Reata Pharmaceuticals, Inc. * | | | 3,900,500 | |
| | | | | | | | | |
| | | | | RETAIL - 2.5% | | | | |
| | 150,000 | | | Bed Bath & Beyond, Inc. | | | 1,590,000 | |
| | | | | | | | | |
| | | | | SOFTWARE - 10.1% | | | | |
| | 6,500 | | | Adobe, Inc. * | | | 2,829,515 | |
| | 10,000 | | | Atlassian Corp PLC * | | | 1,802,700 | |
| | 7,500 | | | salesforce.com, Inc. * | | | 1,404,975 | |
| | 700 | | | ServiceNow, Inc. * | | | 283,541 | |
| | | | | | | | 6,320,731 | |
| | | | | | | | | |
| | | | | TOTAL COMMON STOCK (Cost - $29,393,339) | | | 57,066,076 | |
| | | | | | | | | |
See accompanying notes to financial statements.
| The Biondo Focus Fund |
| PORTFOLIO OF INVESTMENTS (Unaudited) (Continued) |
| June 30, 2020 |
| Shares | | | | | | | | | | | | | | | | | Fair Value | |
| | | | | EXCHANGE TRADED FUND - 0.5% | | | | | |
| | 15,000 | | | ProShares UltraShort S&P500 | | | $ | 291,000 | |
| | | | | TOTAL EXCHANGE TRADED FUND (Cost - $361,650) | | | | | |
| | | | | | | | | | | | | | | | | | | | | |
| | | | | SHORT-TERM INVESTMENTS - 2.3% | | | | | |
| | | | | MONEY MARKET FUND - 2.3% | | | | | |
| | 1,419,596 | | | Dreyfus Treasury Prime Cash Management - Institutional Class, 0.08% ** | | | | 1,419,596 | |
| | | | | TOTAL SHORT-TERM INVESTMENTS (Cost - $1,419,596) | | | | | | | |
| | | | | | | | | | | | | | | | | | | | | |
| Contracts *** | | | | | Counterparty | | Notional Value | | | Expiration Date | | Exercise Price | | | | |
| | | | | CALL OPTIONS PURCHASED * - 1.1% | | | | | | | | | | |
| | 40 | | | ABIOMED, Inc. | | Cowen & Co. | | $ | 600,000 | | | 1/21/2022 | | $ | 150.00 | | | | 438,800 | |
| | 20 | | | Boeing Co. | | Cowen & Co. | | | 220,000 | | | 1/21/2022 | | | 110.00 | | | | 184,200 | |
| | 25 | | | Square, Inc. | | Cowen & Co. | | | 225,000 | | | 9/18/2020 | | | 90.00 | | | | 49,925 | |
| | | | | TOTAL CALL OPTIONS PURCHASED - (Cost - $324,478) | | | | | 672,925 | |
| | | | | | | | | | | | | | | | | | | | | |
| | | | | TOTAL INVESTMENTS - 94.8% (Cost - $31,499,063) | | $ | 59,449,597 | |
| | | | | OTHER ASSETS LESS LIABILITIES - NET - 5.2% | | | | 3,274,366 | |
| | | | | TOTAL NET ASSETS - 100.0% | | | $ | 62,723,963 | |
| | | | | | | | | | | | | | | | | | | | | |
| * | Non-income producing security. |
| ^ | All or a portion of the security is pledged as collateral for the line of credit. Total value of pledged securities at June 30, 2020 is $14,373,355. |
| ** | Money market fund; interest rate reflects seven-day effective yield on June 30, 2020. |
| *** | Each option contract allows the holder of the option to purchase 100 shares of the underlying security. |
ADR - American Depositary Receipt
PLC - Public Limited Co.
See accompanying notes to financial statements.
| The Biondo Focus Fund |
| STATEMENT OF ASSETS AND LIABILITIES (Unaudited) |
| June 30, 2020 |
| ASSETS | | | | |
| Investment securities: | | | | |
| At cost | | $ | 31,499,063 | |
| At value | | $ | 59,449,597 | |
| Receivable for Fund shares sold | | | 7,034 | |
| Receivable for investments sold | | | 3,402,122 | |
| Dividends and interest receivable | | | 141 | |
| Prepaid expenses & other assets | | | 9,798 | |
| TOTAL ASSETS | | | 62,868,692 | |
| | | | | |
| LIABILITIES | | | | |
| Payable for Fund shares redeemed | | | 42,054 | |
| Investment advisory fees payable | | | 41,872 | |
| Payable to related parties | | | 17,920 | |
| Distribution (12b-1) fees payable | | | 24,930 | |
| Accrued audit fees | | | 7,812 | |
| Accrued expenses and other liabilities | | | 10,141 | |
| TOTAL LIABILITIES | | | 144,729 | |
| NET ASSETS | | $ | 62,723,963 | |
| | | | | |
| Net Assets Consist Of: | | | | |
| Paid in capital ($0 par value, unlimited shares authorized) | | $ | 32,263,098 | |
| Accumulated earnings | | | 30,460,865 | |
| NET ASSETS | | $ | 62,723,963 | |
| | | | | |
| Net Asset Value Per Share: | | | | |
| Investor Class Shares: | | | | |
| Net Assets | | $ | 62,723,963 | |
| Shares of beneficial interest outstanding | | | 3,202,294 | |
| Net asset value (Net Assets ÷ Shares Outstanding), offering price and redemption price per share (a) | | $ | 19.59 | |
| | | | | |
| (a) | Redemptions of shares held less than 30 days may be assessed a redemption fee of 2.00%. |
See accompanying notes to financial statements.
| The Biondo Focus Fund |
| STATEMENT OF OPERATIONS (Unaudited) |
| For the Six Months Ended June 30, 2020 |
| INVESTMENT INCOME | | | | |
| Dividends | | $ | 53,886 | |
| Interest | | | 15,992 | |
| TOTAL INVESTMENT INCOME | | | 69,878 | |
| | | | | |
| EXPENSES | | | | |
| Investment advisory fees | | | 293,438 | |
| Distribution (12b-1) fees - Investor Class | | | 73,360 | |
| Administration fees | | | 32,032 | |
| Fund accounting fees | | | 16,484 | |
| Transfer agent fees | | | 15,086 | |
| Legal fees | | | 14,482 | |
| Compliance officer fees | | | 11,236 | |
| Shareholder reporting expense | | | 10,353 | |
| Audit fees | | | 9,712 | |
| Registration fees | | | 9,709 | |
| Trustees’ fees and expenses | | | 7,589 | |
| Custody fees | | | 4,258 | |
| Third party administrative service fees | | | 182 | |
| Insurance expense | | | 182 | |
| Other expenses | | | 328 | |
| TOTAL EXPENSES | | | 498,431 | |
| | | | | |
| Less: Fees waived by the Advisor | | | (58,370 | ) |
| | | | | |
| NET EXPENSES | | | 440,061 | |
| NET INVESTMENT LOSS | | | (370,183 | ) |
| | | | | |
| REALIZED AND UNREALIZED GAIN (LOSS) ON INVESTMENTS | | | | |
| Net realized gain (loss) on transactions from: | | | | |
| Investments | | | 3,349,502 | |
| Options written | | | (235,804 | ) |
| Net realized gain | | | 3,113,698 | |
| | | | | |
| Net change in unrealized appreciation (depreciation) on: | | | | |
| Investments | | | (1,093,390 | ) |
| Options purchased | | | 348,447 | |
| Options written | | | 7,904 | |
| Net change in unrealized appreciation (depreciation) on: | | | (737,039 | ) |
| | | | | |
| NET REALIZED AND UNREALIZED GAIN ON INVESTMENTS | | | 2,376,659 | |
| | | | | |
| NET INCREASE IN NET ASSETS RESULTING FROM OPERATIONS | | $ | 2,006,476 | |
| | | | | |
See accompanying notes to financial statements.
| The Biondo Focus Fund |
| STATEMENTS OF CHANGES IN NET ASSETS |
| | | For the | | | For the | |
| | | Six Months Ended | | | Year Ended | |
| | | June 30, 2020 | | | December 31, 2019 | |
| | | (Unaudited) | | | | |
| FROM OPERATIONS | | | | | | | | |
| Net investment loss | | $ | (370,183 | ) | | $ | (654,112 | ) |
| Net realized gain from investments and options written | | | 3,113,698 | | | | 4,643,786 | |
| Net change in unrealized appreciation (depreciation) of investments, options purchased and options written | | | (737,039 | ) | | | 8,862,995 | |
| Net increase in net assets resulting from operations | | | 2,006,476 | | | | 12,852,669 | |
| | | | | | | | | |
| DISTRIBUTIONS TO SHAREHOLDERS | | | | | | | | |
| Total distributions paid | | | — | | | | (5,503,730 | ) |
| | | | | | | | | |
| FROM SHARES OF BENEFICIAL INTEREST | | | | | | | | |
| Proceeds from shares sold | | | 1,673,867 | | | | 1,405,766 | |
| Payments for shares redeemed | | | (5,315,365 | ) | | | (6,302,173 | ) |
| Net asset value of shares issued in reinvestment of distributions | | | — | | | | 5,411,129 | |
| Redemption fee proceeds | | | 35 | | | | 92 | |
| Net increase (decrease) in net assets from shares of beneficial interest | | | (3,641,463 | ) | | | 514,814 | |
| | | | | | | | | |
| TOTAL INCREASE (DECREASE) IN NET ASSETS | | | (1,634,987 | ) | | | 7,863,753 | |
| | | | | | | | | |
| NET ASSETS | | | | | | | | |
| Beginning of Period | | | 64,358,950 | | | | 56,495,197 | |
| End of Period | | $ | 62,723,963 | | | $ | 64,358,950 | |
| | | | | | | | | |
| SHARE ACTIVITY - INVESTOR CLASS | | | | | | | | |
| Shares Sold | | | 95,800 | | | | 74,813 | |
| Shares Reinvested | | | — | | | | 294,083 | |
| Shares Redeemed | | | (304,375 | ) | | | (337,536 | ) |
| Net increase (decrease) in shares of beneficial interest outstanding | | | (208,575 | ) | | | 31,360 | |
| | | | | | | | | |
See accompanying notes to financial statements.
| The Biondo Focus Fund |
| FINANCIAL HIGHLIGHTS |
| |
| The table sets forth financial data for one share of beneficial interest outstanding throughout each period presented. |
| | | Investor Class | |
| | | Six Months Ended | | | Year Ended | | | Year Ended | | | Year Ended | | | Year Ended | | | Year Ended | |
| | | June 30, | | | December 31, | | | December 31, | | | December 31, | | | December 31, | | | December 31, | |
| | | 2020 | | | 2019 | | | 2018 | | | 2017 | | | 2016 | | | 2015 | |
| | | (Unaudited) | | | | | | | | | | | | | | | | |
| | | | | | | | | | | | | | | | | | | |
| Net asset value, beginning of period | | $ | 18.87 | | | $ | 16.72 | | | $ | 16.74 | | | $ | 14.40 | | | $ | 14.20 | | | $ | 16.18 | |
| Activity from investment operations: | | | | | | | | | | | | | | | | | | | | | | | | |
| Net investment loss (1) | | | (0.11 | ) | | | (0.20 | ) | | | (0.25 | ) | | | (0.38 | ) | | | (0.33 | ) | | | (0.33 | ) |
| Net realized and unrealized gain (loss) on investments and option transactions | | | 0.83 | | | | 4.11 | | | | 1.37 | (8) | | | 4.90 | | | | 0.53 | | | | (1.65 | ) |
| Total income (loss) from investment operations | | | 0.72 | | | | 3.91 | | | | 1.12 | | | | 4.52 | | | | 0.20 | | | | (1.98 | ) |
| Paid-in-Capital from redemption fees (1,2) | | | 0.00 | | | | 0.00 | | | | 0.00 | | | | 0.00 | | | | 0.00 | | | | 0.00 | |
| Less distributions from: | | | | | | | | | | | | | | | | | | | | | | | | |
| Net realized gains | | | — | | | | (1.76 | ) | | | (1.14 | ) | | | (2.18 | ) | | | — | | | | — | |
| Total distributions | | | — | | | | (1.76 | ) | | | (1.14 | ) | | | (2.18 | ) | | | — | | | | — | |
| Net asset value, end of period | | $ | 19.59 | | | $ | 18.87 | | | $ | 16.72 | | | $ | 16.74 | | | $ | 14.40 | | | $ | 14.20 | |
| Total return (3) | | | 3.82 | % (9) | | | 23.67 | % (6) | | | 6.47 | % (6) | | | 31.29 | % (6) | | | 1.41 | % | | | (12.24 | )% (4) |
| Net assets, end of period (in 000s) | | $ | 62,724 | | | $ | 64,359 | | | $ | 56,495 | | | $ | 27,336 | | | $ | 22,154 | | | $ | 25,407 | |
| Ratio of gross expenses to average net assets including interest expense (5) | | | 1.70 | % (10) | | | 1.65 | % | | | 1.98 | % | | | 2.75 | % | | | 3.17 | % | | | 2.62 | % |
| Ratio of gross expenses to average net assets excluding interest expense (5) | | | 1.70 | % (10) | | | 1.65 | % | | | 1.93 | % | | | 2.45 | % | | | 2.59 | % | | | 2.36 | % |
| Ratio of net expenses to average net assets including interest expense | | | 1.50 | % (10) | | | 1.50 | % | | | 1.78 | % | | | 2.55 | % | | | 3.14 | % | | | 2.62 | % |
| Ratio of net expenses to average net assets excluding interest expense | | | 1.50 | % (10) | | | 1.50 | % | | | 1.73 | % (7) | | | 2.25 | % | | | 2.56 | % | | | 2.36 | % |
| Ratio of net investment loss to average net assets | | | (1.26 | )% (10) | | | (1.08 | )% | | | (1.34 | )% | | | (2.20 | )% | | | (2.55 | )% | | | (2.06 | )% |
| Portfolio turnover rate | | | 15 | % (9) | | | 43 | % | | | 56 | % | | | 48 | % | | | 60 | % | | | 55 | % |
| | | | | | | | | | | | | | | | | | | | | | | | | |
| (1) | Per share amounts calculated using average shares method which appropriately presents the per share data for the year. |
| (2) | Amount represents less than $0.01 per share. |
| (3) | Total return represents aggregate total return based on Net Asset Value. Total returns would have been lower absent waived fees and reimbursed expenses. Total returns are historical in nature and assume changes in share price. The returns shown exclude the effect of applicable redemption fees. Had the Advisor not waived a portion of its fees, total return would have been lower. |
| (4) | There was no effect on total return due to a trade error. |
| (5) | Represents the ratio of expenses to average net assets absent fee waivers by the Advisor. |
| (6) | Includes adjustments in accordance with accounting principles generally accepted in the United States and consequently, the net asset value for financial reporting purposes and the returns based upon those net asset may differ from the net asset values and returns for shareholder processing. |
| (7) | Effective June 1, 2018, the expense limitation was reduced to 1.50%. |
| (8) | Net realized and unrealized gain on investments and option transactions does not accord with the amount reported in the Statement of Operations due to the timing of shareholder subscriptions and redemptions relative to fluctuating net asset values during the year. |
See accompanying notes to financial statements.
| The Biondo Focus Fund |
| NOTES TO FINANCIAL STATEMENTS (Unaudited) |
| June 30, 2020 |
The Biondo Focus Fund (the “Fund”) is a non-diversified series of shares of beneficial interest of Northern Lights Fund Trust (the “Trust”), a statutory trust organized under the laws of the State of Delaware on January 19, 2005. The Fund is registered under the Investment Company Act of 1940, as amended (the “1940 Act”), an open-end management investment companies. The Fund currently offers Investor Class shares.
The Fund seeks long-term capital appreciation, which it pursues by investing primarily in a combination of long and short positions in (1) common stock of US companies of any capitalization; (2) American Depositary Receipts (“ADRs”) representing common stock of foreign companies; (3) investment grade fixed income securities; (4) exchange-traded funds (“ETFs”) that invest primarily in (i) common stocks of US companies, (ii) ADRs or (iii) investment grade fixed income securities; and (5) options on common stock, ADRs and ETFs.
| 2. | SIGNIFICANT ACCOUNTING POLICIES |
The following is a summary of significant accounting policies followed by the Fund in preparation of its financial statements. These policies are in conformity with accounting principles generally accepted in the United States of America (“GAAP”). The Fund is an investment company and accordingly follows the investment company accounting and reporting guidance of the Financial Accounting Standards Board (“FASB”) Accounting Standards Codification Topic 946 “Financial Services – Investment Companies” including FASB Accounting Standards Update (“ASU”) 2013-08.
Security Valuation – Securities listed on an exchange are valued at the last reported sale price at the close of the regular trading session of the primary exchange on the business day the value is being determined, or in the case of securities listed on NASDAQ at the NASDAQ Official Closing Price (“NOCP”). In the absence of a sale, such securities shall be valued at the mean between the current bid and ask prices on the primary exchange on the day of valuation. Options contracts listed on a securities exchange or board of trade for which market quotations are readily available shall be valued at the last quoted sales price or, in the absence of a sale, at the mean between the current bid and ask prices on the day of valuation. Option contracts not listed on a securities exchange or board of trade for which over-the-counter market quotations are not readily available shall be valued at the mean between the current bid and ask prices on the day of valuation. Index options shall be valued at the mean between the current bid and ask prices on the day of valuation. Debt securities (other than short term obligations) are valued each day by an independent pricing service approved by the Trust’s Board of Trustees (the “Board”) using methods which include current market quotations from a major market maker in the securities and based on methods which include the consideration of yields or prices of securities of comparable quality, coupon, maturity and type. The independent pricing service does not distinguish between smaller-sized bond positions known as “odd lots” and larger institutional-sized bond positions known as “round lots”. The Fund may “fair value” a particular bond if the advisor does not believe that the round lot value provided by the independent pricing service reflects fair value of the Fund’s holding. Short-term debt obligations with remaining maturities in excess of sixty days are valued at current market prices by an independent pricing service approved by the Board. Short-term debt obligations having 60 days or less remaining until maturity, at time of purchase, may be valued at amortized cost. Investments in open-end investment companies are valued at net asset value.
The Fund may hold securities, such as private investments, interests in commodity pools, other non-traded securities or temporarily illiquid securities, for which market quotations are not readily available or are determined to be unreliable. These securities will be valued using the “fair value” procedures approved by the Board. The Board has delegated execution of these procedures to a fair value committee composed of one or more
| The Biondo Focus Fund |
| NOTES TO FINANCIAL STATEMENTS (Unaudited) (Continued) |
| June 30, 2020 |
representatives from each of the (i) Trust, (ii) administrator, and (iii) advisor. The committee may also enlist third party consultants such as a valuation specialist at a public accounting firm, valuation consultant or financial officer of a security issuer on an as-needed basis to assist in determining a security-specific fair value. The Board has also engaged a third party valuation firm to attend valuation meetings held by the Trust, review minutes of such meetings and report to the Board on a quarterly basis. The Board reviews and ratifies the execution of this process and the resultant fair value prices at least quarterly to assure the process produces reliable results.
Fair Valuation Process. As noted above, the fair value committee is composed of one or more representatives from each of the (i) Trust, (ii) administrator, and (iii) advisor. The applicable investments are valued collectively via inputs from each of these groups. For example, fair value determinations are required for the following securities: (i) securities for which market quotations are insufficient or not readily available on a particular business day (including securities for which there is a short and temporary lapse in the provision of a price by the regular pricing source), (ii) securities for which, in the judgment of the advisor, the prices or values available do not represent the fair value of the instrument. Factors which may cause the advisor to make such a judgment include, but are not limited to, the following: only a bid price or an ask price is available; the spread between bid and ask prices is substantial; the frequency of sales; the thinness of the market; the size of reported trades; and actions of the securities markets, such as the suspension or limitation of trading; (iii) securities determined to be illiquid; (iv) securities with respect to which an event that will affect the value thereof has occurred (a “significant event”) since the closing prices were established on the principal exchange on which they are traded, but prior to the Fund’s calculation of its net asset value. Specifically, interests in commodity pools or managed futures pools are valued on a daily basis by reference to the closing market prices of each futures contract or other asset held by a pool, as adjusted for pool expenses. Restricted or illiquid securities, such as private placements or non-traded securities are valued via inputs from the advisor based upon the current bid for the security from two or more independent dealers or other parties reasonably familiar with the facts and circumstances of the security (who should take into consideration all relevant factors as may be appropriate under the circumstances). If the advisor is unable to obtain a current bid from such independent dealers or other independent parties, the fair value committee shall determine the fair value of such security using the following factors: (i) the type of security; (ii) the cost at date of purchase; (iii) the size and nature of the Fund’s holdings; (iv) the discount from market value of unrestricted securities of the same class at the time of purchase and subsequent thereto; (v) information as to any transactions or offers with respect to the security; (vi) the nature and duration of restrictions on disposition of the security and the existence of any registration rights; (vii) how the yield of the security compares to similar securities of companies of similar or equal creditworthiness; (viii) the level of recent trades of similar or comparable securities; (ix) the liquidity characteristics of the security; (x) current market conditions; and (xi) the market value of any securities into which the security is convertible or exchangeable.
The Fund utilizes various methods to measure the fair value of all of their investments on a recurring basis. GAAP establishes a hierarchy that prioritizes inputs to valuation methods. The three levels of input are:
Level 1 – Unadjusted quoted prices in active markets for identical assets and liabilities that the Fund has the ability to access.
Level 2 – Observable inputs other than quoted prices included in Level 1 that are observable for the asset or liability, either directly or indirectly. These inputs may include quoted prices for the identical instrument in an inactive market, prices for similar instruments, interest rates, prepayment speeds, credit risk, yield curves, default rates and similar data.
Level 3 – Unobservable inputs for the asset or liability, to the extent relevant observable inputs are not available,
| The Biondo Focus Fund |
| NOTES TO FINANCIAL STATEMENTS (Unaudited) (Continued) |
| June 30, 2020 |
representing the Fund’s own assumptions about the assumptions a market participant would use in valuing the asset or liability, and would be based on the best information available.
The availability of observable inputs can vary from security to security and is affected by a wide variety of factors, including, for example, the type of security, whether the security is new and not yet established in the marketplace, the liquidity of markets, and other characteristics particular to the security. To the extent that valuation is based on models or inputs that are less observable or unobservable in the market, the determination of fair value requires more judgment. Accordingly, the degree of judgment exercised in determining fair value is greatest for instruments categorized in Level 3.
The inputs used to measure fair value may fall into different levels of the fair value hierarchy. In such cases, for disclosure purposes, the level in the fair value hierarchy within which the fair value measurement falls in its entirety, is determined based on the lowest level input that is significant to the fair value measurement in its entirety.
The inputs or methodology used for valuing securities are not necessarily an indication of the risk associated with investing in those securities. The following tables summarize the inputs used as of June 30, 2020 for the Fund’s investments measured at fair value:
| Assets * | | Level 1 | | | Level 2 | | | Level 3 | | | Total | |
| Common Stock | | $ | 57,066,076 | | | $ | — | | | $ | — | | | $ | 57,066,076 | |
| Exchange Traded Fund | | | 291,000 | | | | — | | | | — | | | | 291,000 | |
| Short-Term Investment | | | 1,419,596 | | | | — | | | | — | | | | 1,419,596 | |
| Call Options Purchased | | | 49,925 | | | | 623,000 | | | | — | | | | 672,925 | |
| Total | | $ | 58,826,597 | | | $ | 623,000 | | | $ | — | | | $ | 59,449,597 | |
The Fund did not hold any Level 3 securities during the period.
| * | Refer to the Portfolio of Investments for security classifications. |
Security Transactions and Related Income – Security transactions are accounted for on the trade date. Interest income is recognized on an accrual basis. Discounts are accreted and premiums are amortized on securities purchased over the lives of the respective securities. Dividend income is recorded on the ex-dividend date. Realized gains or losses from sales of securities are determined by comparing the identified cost of the security lot sold with the net sales proceeds.
Exchange Traded Funds – The Fund may invest in ETFs. ETFs are a type of fund that are bought and sold on a securities exchange. An ETF trades like common stock and represents a fixed portfolio of securities. The Fund may purchase an ETF to gain exposure to a portion of the U.S. or a foreign market. The risks of owning an ETF generally reflect the risks of owning the underlying securities in which the ETF invests, although the lack of liquidity on an ETF could result in it being more volatile. Additionally, ETFs have fees and expenses that reduce their value.
Dividends and Distributions to Shareholders – Dividends from net investment income and distributable net realized capital gains, if any, are declared and paid annually. Dividends from net investment income and distributions from net realized gains are determined in accordance with federal income tax regulations, which may differ from GAAP. These “book/tax” differences are considered either temporary (i.e., deferred losses, capital loss carry forwards) or permanent in nature. To the extent these differences are permanent in nature, such amounts are reclassified within the composition of net assets based on their federal tax-basis treatment; temporary
| The Biondo Focus Fund |
| NOTES TO FINANCIAL STATEMENTS (Unaudited) (Continued) |
| June 30, 2020 |
differences do not require reclassification. Dividends and distributions to shareholders are recorded on the ex-dividend date.
Federal Income Taxes – The Fund complies with the requirements of the Internal Revenue Code applicable to regulated investment companies and distributes all of its taxable income to its shareholders. Therefore, no provision for federal income tax is required. The Fund recognizes the tax benefits of uncertain tax positions only where the position is “more likely than not” to be sustained assuming examination by tax authorities. Management has analyzed the Fund’s tax positions, and has concluded that no liability for unrecognized tax benefits should be recorded related to uncertain tax positions taken on returns filed for open tax years (December 2017 - December 2019), or expected to be taken in the Fund’s 2020 tax returns. The Fund identifies its major tax jurisdictions as U.S. federal, Ohio (Nebraska in prior years) and foreign jurisdictions where the Fund makes significant investments. The Fund is not aware of any tax positions for which it is reasonably possible that the total amounts of unrecognized tax benefits will change materially in the next twelve months.
Options Transactions – The Fund is subject to equity price risk in the normal course of pursuing its investment objectives and may purchase or sell options to help hedge against this risk.
The Fund may write call options only if it (i) owns an offsetting position in the underlying security or (ii) has an absolute or immediate right to acquire that security without additional cash consideration or exchange of other securities held in its portfolio.
When the Fund writes a call option, an amount equal to the premium received is included in the Statement of Assets and Liabilities as a liability. The amount of the liability is subsequently marked-to-market to reflect the current market value of the option. If an option expires on its stipulated expiration date or if the Fund enters into a closing purchase transaction, a gain or loss is realized. If a written call option is exercised, a gain or loss is realized for the sale of the underlying security and the proceeds from the sale are increased by the premium originally received. As writer of an option, the Fund has no control over whether the option will be exercised and, as a result, retain the market risk of an unfavorable change in the price of the security underlying the written option.
The Fund may purchase put and call options. Call options are purchased to hedge against an increase in the value of securities held in the Fund’s portfolio. If such an increase occurs, the call options will permit the Fund to purchase the securities underlying such options at the exercise price, not at the current market price. Put options are purchased to hedge against a decline in the value of securities held in a Fund’s portfolio. If such a decline occurs, the put options will permit the Fund to sell the securities underlying such options at the exercise price, or to close out the options at a profit. The premium paid for a put or call option plus any transaction costs will reduce the benefit, if any, realized by the Fund upon exercise of the option, and, unless the price of the underlying security rises or declines sufficiently, the option may expire worthless to the Fund. In addition, in the event that the price of the security in connection with which an option was purchased moves in a direction favorable to the Fund, the benefits realized by the Fund as a result of such favorable movement will be reduced by the amount of the premium paid for the option and related transaction costs. Written and purchased options are non-income producing securities. With purchased options, there is minimal counterparty credit risk to the Fund since these options are exchange traded and the exchange’s clearinghouse, as counterparty to all exchange traded options, guarantees against a possible default.
For the six months ended June 30, 2020, the Fund had a net realized loss of $235,804 and change in unrealized appreciation of $7,904 on written options and change in unrealized appreciation of $348,447 on purchased options
| The Biondo Focus Fund |
| NOTES TO FINANCIAL STATEMENTS (Unaudited) (Continued) |
| June 30, 2020 |
subject to equity price risk. These realized and unrealized gains and losses are included in the line items marked “Net realized loss on transactions from options written” and “Net change in unrealized appreciation (depreciation) on options written and options purchased” on the Statement of Operations.
The amounts of realized and changes in unrealized gains and losses on derivative instruments during the period as disclosed in the Statement of Operations serve as indicators of the volume of derivative activity.
Sector Risk – The value of securities from a specific sector can be more volatile than the market as a whole and may be subject to economic or regulatory risks different than the economy as a whole.
Use of Estimates – The preparation of financial statements in conformity with GAAP requires management to make estimates and assumptions that affect the reported amounts of assets and liabilities and disclosure of contingent assets and liabilities at the date of the financial statements and the reported amounts of increases and decreases in net assets from operations during the reporting year. Actual results could differ from those estimates.
Expenses – Expenses of the Trust that are directly identifiable to a specific fund are charged to that fund. Expenses which are not readily identifiable to a specific fund are allocated in such a manner as deemed equitable (as determined by the Board), taking into consideration the nature and type of expense and the relative sizes of the funds in the Trust.
Indemnification – The Trust indemnifies its officers and Trustees for certain liabilities that may arise from the performance of their duties to the Trust. Additionally, in the normal course of business, the Fund enters into contracts that contain a variety of representations and warranties and which provide general indemnities. The Fund’s maximum exposure under these arrangements is unknown, as this would involve future claims that may be made against the Fund that have not yet occurred. However, based on experience, the Fund expects the risk of loss due to these warranties and indemnities to be remote.
| 3. | INVESTMENT TRANSACTIONS |
For the six months ended June 30, 2020, cost of purchases and proceeds from sales of portfolio securities, other than short-term investments and U.S. Government securities, amounted to the following:
| Purchases | | | Sales | |
| $ | 8,359,611 | | | $ | 15,196,173 | |
| | | | | | | |
| 4. | AGGREGATE TAX UNREALIZED APPRECIATION AND DEPRECIATION |
At June 30, 2020 the aggregate cost for federal tax purposes, which differs from fair value by net unrealized appreciation(depreciation) of securities, are as follows:
| | | | Gross Unrealized | | | Gross Unrealized | | | Net Unrealized | |
| Tax Cost | | | Appreciation | | | Depreciation | | | Appreciation | |
| $ | 31,647,389 | | | $ | 28,864,131 | | | $ | (1,061,923 | ) | | $ | 27,802,208 | |
| | | | | | | | | | | | | | | |
| 5. | INVESTMENT ADVISORY AGREEMENT AND TRANSACTIONS WITH RELATED PARTIES |
Biondo Investment Advisors, LLC serves as the Fund’s investment advisor (the “Advisor”). Pursuant to an
| The Biondo Focus Fund |
| NOTES TO FINANCIAL STATEMENTS (Unaudited) (Continued) |
| June 30, 2020 |
investment advisory agreement between the Advisor and the Trust, on behalf of the Fund, the Advisor, under the oversight of the Board, directs the daily operations of the Fund and supervises the performance of administrative and professional services provided by others. As compensation for its services and the related expenses borne by the Advisor, the Fund pays the Advisor a management fee, computed and accrued daily and paid monthly, at an annual rate of 1.00% the Fund’s average daily net assets. For the six months ended June 30, 2020, the Advisor earned fees of $293,438 for its service to the Fund.
Effective June 1, 2018, pursuant to a written contract (the “Waiver Agreement”), the Advisor has agreed, at least until April 30, 2021, to waive a portion of its advisory fee and has agreed to reimburse a portion of the Fund’s other expenses to the extent necessary so that the total expenses incurred by the Fund (excluding any front-end or contingent deferred loads; brokerage fees and commissions; acquired fund fees and expenses; fees and expenses associated with investments in other collective investment vehicles or derivative instruments (including for example option and swap fees and expenses); borrowing costs (such as interest and dividend expense on securities sold short); taxes; and extraordinary expenses such as litigation expenses (which may include indemnification of Fund officers and Trustees, contractual indemnification of Fund service providers (other than the Advisor)) does not exceed 1.50% per annum of the Fund’s average daily net assets. This amount will herein be referred to as the “expense limitation.” For the six months ended June 30, 2020, the Advisor waived fees in the amount of $58,370 for the Fund pursuant to the Waiver Agreement and a prior expense limitation agreement.
If the Advisor waives any fee or reimburses any expense pursuant to the Waiver Agreement (or a prior expense limitation agreement), and the Fund’s operating expenses are subsequently lower than its expense limitation, the Advisor shall be entitled to reimbursement by the Fund for such waived fees or reimbursed expenses provided that such reimbursement does not cause the Fund’s expenses to exceed the expense limitation. If operating expenses subsequently exceed the expense limitation, the reimbursements for the Fund shall be suspended. The Advisor may seek reimbursement only for expenses waived or paid by it during the three years or prior to such reimbursement; provided, however, that such expenses may only be reimbursed to the extent they were waived or paid after the date of the Waiver Agreement (or any similar agreement). The Board may terminate this expense reimbursement arrangement at any time.
As of December 31, 2019, the Advisor had $212,518 of waived expenses that may be recovered by the following dates:
| December 31, 2020 | | | December 31, 2021 | | | December 31, 2022 | | | Total | |
| $ | 51,146 | | | $ | 75,415 | | | $ | 85,957 | | | $ | 212,518 | |
The Trust, with respect to the Fund, has adopted the Trust’s Master Distribution and Shareholder Servicing Plan (or “Plan”) for Investor Class shares. The Plan provides that a monthly service fee is calculated by the Fund at an annual rate of 0.25% of the average daily net assets attributable to the Investor Class shares for the Fund. Pursuant to the Plan, the Fund may compensate the securities dealers or other financial intermediaries, financial institutions, investment advisors, and others for activities primarily intended to result in the sale of Fund shares and for maintenance and personal service provided to existing shareholders. The Plan further provides for periodic payments to brokers, dealers and other financial intermediaries, including insurance companies, for providing shareholder services and for promotional and other sales-related costs. During the six months ended June 30, 2020, the Fund was charged $73,360 pursuant to the Plan.
Northern Lights Distributors, LLC (the “Distributor”) acts as the Fund’s principal underwriter in a continuous public offering of the Fund’s shares. For the six months ended June 30, 2020, the Distributor received no underwriting commissions.
| The Biondo Focus Fund |
| NOTES TO FINANCIAL STATEMENTS (Unaudited) (Continued) |
| June 30, 2020 |
In addition, certain affiliates of the Distributor provide services to the Fund as follows:
Gemini Fund Services, LLC (“GFS”),
GFS, an affiliate of the Distributor, provides administration, fund accounting, and transfer agent services to the Trust. Pursuant to a separate servicing agreement with GFS, the Fund pays GFS customary fees for providing administration, fund accounting and transfer agency services to the Fund. Certain officers of the Trust are also officers of GFS, and are not paid any fees directly by the Fund for serving in such capacities.
Northern Lights Compliance Services, LLC (“NLCS”)
NLCS, an affiliate of GFS and the Distributor, provides a Chief Compliance Officer to the Trust, as well as related compliance services, pursuant to a consulting agreement between NLCS and the Trust. Under the terms of such agreement, NLCS receives customary fees from the Fund.
Blu Giant, LLC (“Blu Giant”)
Blu Giant, an affiliate of GFS and the Distributor, provides EDGAR conversion and filing services as well as print management services for the Fund on an ad-hoc basis. For the provision of these services, Blu Giant receives customary fees from the Fund.
Effective February 1, 2019, NorthStar Financial Services Group, LLC, the parent company of Gemini Fund Services, LLC (“GFS”) and its affiliated companies including the Distributor, NLCS and Blu Giant (collectively, the “Gemini Companies”), sold its interest in the Gemini Companies to a third party private equity firm that contemporaneously acquired Ultimus Fund Solutions, LLC (an independent mutual fund administration firm) and its affiliates (collectively, the “Ultimus Companies”). As a result of these separate transactions, the Gemini Companies and the Ultimus Companies are now indirectly owned through a common parent entity, The Ultimus Group, LLC.
The Fund has a secured $5,000,000 bank line of credit through Lakeland Bank (“the Bank”) for the purpose of investment purchases, subject to the limitations of the 1940 Act for borrowings. The Fund has until September 1, 2020 to pay back the line of credit. Borrowings under this arrangement bear interest at the greater of i) the lender’s prime rate minus 0.50% or ii) 3.00% per annum at the time of borrowing. During the six months ended June 30, 2020, the Fund had no outstanding borrowings.
As collateral security for the bank line of credit, the Fund grants the Bank a first position security interest in and lien on all securities of any kind or description pledged by the Fund. As of June 30, 2020, the Fund had $14,373,355 in securities pledged as collateral for the line of credit.
The Fund may assess a short-term redemption fee of 2.00% of the total redemption amount if shareholders sell their shares after holding them for less than 30 days. The redemption fee is paid directly to the Fund. For the six months ended June 30, 2020 the Fund assessed $35 in redemption fees.
| The Biondo Focus Fund |
| NOTES TO FINANCIAL STATEMENTS (Unaudited) (Continued) |
| June 30, 2020 |
The beneficial ownership, either directly or indirectly, of more than 25% of the voting securities of a Fund creates presumption of control of the Fund, under Section 2(a)(9) of the 1940 Act. As of June 30, 2020, National Financial Services LLC held approximately 88.2% of the Fund. The Fund has no knowledge as to whether all or any portion of the shares owned of record by National Financial Services LLC are also owned beneficially.
| 9. | TAX COMPONENTS OF CAPITAL |
The tax character of fund distributions paid for the years ended December 31, 2019 and December 31, 2018 were as follows:
| | | Fiscal Year Ended | | | Fiscal Year Ended | |
| | | December 31, 2019 | | | December 31, 2018 | |
| Long-Term Capital Gains | | $ | 5,503,730 | | | $ | 3,637,864 | |
As of December 31, 2019, the components of accumulated earnings on a tax basis were as follows:
| Undistributed | | | Other | | | | | | Total | |
| Long-Term | | | Book/Tax | | | Unrealized | | | Accumulated | |
| Capital Gains | | | Differences | | | Appreciation | | | Earnings | |
| $ | 142,099 | | | $ | (226,957 | ) | | $ | 28,539,247 | | | $ | 28,454,389 | |
The difference between book basis and tax basis accumulated earnings, unrealized appreciation and accumulated net realized gains from security and options transactions is primarily attributable to the tax deferral of losses on wash sales and straddles. Amounts listed under other book/tax differences are primarily attributable to the tax deferral of losses on straddles.
Permanent book and tax differences, primarily attributable to the tax treatment of net operating losses, resulted in reclassification for the Fund for the year ended December 31, 2019 as follows:
| | | | Accumulated | |
| Paid In Capital | | | Earnings (Losses) | |
| $ | (654,112 | ) | | $ | 654,112 | |
Subsequent events after the date of the Statement of Assets and Liabilities have been evaluated through the date the financial statements were issued. Management has determined that no events or transactions occurred requiring adjustment or disclosure in the financial statements.
| The Biondo Focus Fund |
| EXPENSE EXAMPLES (Unaudited) |
| June 30, 2020 |
As a shareholder of the Fund, you incur two types of costs: (1) transaction costs, including redemption fees; and (2) ongoing costs, including management fees; distribution and/or service (12b-1) fees; and other Fund expenses. This example is intended to help you understand your ongoing costs (in dollars) of investing in the Fund and to compare these costs with the ongoing costs of investing in other mutual funds.
The example is based on an investment of $1,000 invested at the beginning of the period and held for the entire period from January 1, 2020 through June 30, 2020.
Actual Expenses
The “Actual” line in the table below provides information about actual account values and actual expenses. You may use the information below together with the amount you invested, to estimate the expenses that you paid over the period. Simply divide your account value by $1,000 (for example, an $8,600 account value divided by $1,000 = 8.6), then multiply the result by the number in the table under the heading entitled “Expenses Paid During Period” to estimate the expenses you paid on your account during this period.
Hypothetical Example for Comparison Purposes
The “Hypothetical” line in the table below provides information about hypothetical account values and hypothetical expenses based on the Biondo Funds’ actual expense ratios and an assumed rate of return of 5% per year before expenses, which is not the Funds’ actual return. The hypothetical account values and expenses may not be used to estimate the actual ending account balances or expenses you paid for the period. You may use this information to compare this 5% hypothetical example with the 5% hypothetical examples that appear in the shareholder reports of other funds.
Please note that the expenses shown in the table are meant to highlight your ongoing costs only and do not reflect any transactional costs, such as sales charges (loads), or redemption fees. Therefore, the table is useful in comparing ongoing costs only, and will not help you determine the relative total costs of owning different funds. In addition, if these transactional costs were included, your costs would have been higher.
| | | Beginning | | Ending | | Expenses Paid | | Expense Ratio |
| | | Account Value | | Account Value | | During Period* | | During Period |
| Actual | | 1/1/20 | | 6/30/20 | | 1/1/20-6/30/20 | | 1/1/20-6/30/20 |
| The Biondo Focus Fund | | $1,000.00 | | $1,038.20 | | $7.60 | | 1.50% |
| | | | | | | | | |
| | | Beginning | | Ending | | Expenses Paid | | Expense Ratio |
| Hypothetical (5% return before | | Account Value | | Account Value | | During Period** | | During Period |
| expenses) | | 1/1/20 | | 6/30/20 | | 1/1/20-6/30/20 | | 1/1/20-6/30/20 |
| The Biondo Focus Fund | | $1,000.00 | | $1,017.40 | | $7.52 | | 1.50% |
| * | “Actual” expenses are equal to the average account value over the period, multiplied by the Fund’s annualized expense ratio, multiplied by the number of days in the period (182) divided by the number of days in the fiscal year (366). |
| ** | “Hypothetical” expense information for each Fund is presented on the basis of the full one-half year period to enable comparison to other funds. Expenses are equal to the average account value over the period, multiplied by the Fund’s annualized expense ratio, multiplied by the number of days in the period (182) divided by the number of days in the fiscal year (366). |
PRIVACY NOTICE
Northern Lights Fund Trust
Rev. February 2014
| FACTS | WHAT DOES NORTHERN LIGHTS FUND TRUST DO WITH YOUR PERSONAL INFORMATION? |
| Why? | Financial companies choose how they share your personal information. Federal law gives consumers the right to limit some, but not all sharing. Federal law also requires us to tell you how we collect, share, and protect your personal information. Please read this notice carefully to understand what we do. |
| What? | The types of personal information we collect and share depends on the product or service that you have with us. This information can include: ● Social Security number and wire transfer instructions ● account transactions and transaction history ● investment experience and purchase history When you are no longer our customer, we continue to share your information as described in this notice. |
| How? | All financial companies need to share customers’ personal information to run their everyday business. In the section below, we list the reasons financial companies can share their customers’ personal information; the reasons Northern Lights Fund Trust chooses to share; and whether you can limit this sharing. |
Reasons we can share your
personal information: | Does Northern Lights Fund Trust
share information? | Can you limit this sharing? |
| For our everyday business purposes - such as to process your transactions, maintain your account(s), respond to court orders and legal investigations, or report to credit bureaus. | YES | NO |
| For our marketing purposes - to offer our products and services to you. | NO | We don’t share |
| For joint marketing with other financial companies. | NO | We don’t share |
| For our affiliates’ everyday business purposes - information about your transactions and records. | NO | We don’t share |
| For our affiliates’ everyday business purposes - information about your credit worthiness. | NO | We don’t share |
| For nonaffiliates to market to you | NO | We don’t share |
| QUESTIONS? | Call 1-402-493-4603 |
PRIVACY NOTICE
Northern Lights Fund Trust
| What we do: |
How does Northern Lights Fund Trust protect my personal information? | To protect your personal information from unauthorized access and use, we use security measures that comply with federal law. These measures include computer safeguards and secured files and buildings. Our service providers are held accountable for adhering to strict policies and procedures to prevent any misuse of your nonpublic personal information. |
How does Northern Lights Fund Trust collect my personal information? | We collect your personal information, for example, when you ● open an account or deposit money ● direct us to buy securities or direct us to sell your securities ● seek advice about your investments We also collect your personal information from others, such as credit bureaus, affiliates, or other companies. |
Why can’t I limit all sharing? | Federal law gives you the right to limit only: ● sharing for affiliates’ everyday business purposes – information about your creditworthiness. ● affiliates from using your information to market to you. ● sharing for nonaffiliates to market to you. State laws and individual companies may give you additional rights to limit sharing. |
| Definitions |
| Affiliates | Companies related by common ownership or control. They can be financial and nonfinancial companies. ● Northern Lights Fund Trust does not share with our affiliates. |
| Nonaffiliates | Companies not related by common ownership or control. They can be financial and nonfinancial companies. ● Northern Lights Fund Trust does not share with nonaffiliates so they can market to you. |
| Joint marketing | A formal agreement between nonaffiliated financial companies that together market financial products or services to you. ● Northern Lights Fund Trust doesn’t jointly market. |
PROXY VOTING POLICY
Information regarding how the Fund voted proxies relating to portfolio securities for the most recent twelve month period ended June 30 as well as a description of the policies and procedures that the Fund use to determine how to vote proxies is available without charge, upon request, by calling 1-800-672-9152 or by referring to the Securities and Exchange Commission’s (“SEC”) website at http://www.sec.gov.
PORTFOLIO HOLDINGS
The Fund files a complete schedule of portfolio holdings with the Securities and Exchange Commission (the “SEC”) for the first and third quarters of each fiscal year as an exhibit to its reports on Form N-PORT, within sixty days after the end of the period. Form N-PORT reports are available at the SEC’s website at www.sec.gov.
| |
| |
| |
| |
| |
| |
| |
| |
| |
| |
| |
| |
| |
| |
| |
| |
| |
| |
| |
| |
| |
| |
| INVESTMENT ADVISOR |
| Biondo Investment Advisors, LLC |
| 540 Routes 6 & 209, PO Box 909 |
| Milford, PA 18337 |
| |
| ADMINISTRATOR |
| Gemini Fund Services, LLC |
| 4221 North 203rd Street, Suite 100 |
| Elkhorn, NE 68022 |
Item 2. Code of Ethics. Not applicable.
Item 3. Audit Committee Financial Expert. Not applicable.
Item 4. Principal Accountant Fees and Services. Not applicable.
Item 5. Audit Committee of Listed Companies. Not applicable to open-end investment companies.
Item 6. Schedule of Investments. Schedule of investments in securities of unaffiliated issuers is included under Item 1.
Item 7. Disclosure of Proxy Voting Policies and Procedures for Closed-End Funds. Not applicable to open-end investment companies.
Item 8. Portfolio Managers of Closed-End Management Investment Companies. Not applicable to open-end investment companies.
Item 9. Purchases of Equity Securities by Closed-End Funds. Not applicable to open-end investment companies.
Item 10. Submission of Matters to a Vote of Security Holders. None
Item 11. Controls and Procedures.
(a) Based on an evaluation of the Registrant’s disclosure controls and procedures as of a date within 90 days of filing date of this Form N-CSR, the principal executive officer and principal financial officer of the Registrant have concluded that the disclosure controls and procedures of the Registrant are reasonably designed to ensure that the information required in filings on Form N-CSR is recorded, processed, summarized, and reported by the filing date, including that information required to be disclosed is accumulated and communicated to the Registrant’s management, including the Registrant’s principal executive officer and principal financial officer, as appropriate to allow timely decisions regarding required disclosure.
(b) There were no significant changes in the Registrant’s internal control over financial reporting that occurred during the Registrant’s last fiscal half-year that have materially affected, or are reasonably likely to materially affect, the Registrant’s internal control over financial reporting.
Item 12. Disclosure of Securities Lending Activities for Closed-End Management Investment Companies. Not applicable.
Item 13. Exhibits.
(a)(1) Not applicable.
(a)(2) Certifications required by Section 302 of the Sarbanes-Oxley Act of 2002 (and Item 11(a)(2) of Form N-CSR) are filed herewith.
(a)(3) Not applicable for open-end investment companies.
(b) Certifications required by Section 906 of the Sarbanes-Oxley Act of 2002 (and Item 11(b) of Form N-CSR) are filed herewith.
SIGNATURES
Pursuant to the requirements of the Securities Exchange Act of 1934 and the Investment Company Act of 1940, the registrant has duly caused this report to be signed on its behalf by the undersigned, thereunto duly authorized.
(Registrant) Northern Lights Fund Trust
By (Signature and Title)
/s/ Kevin E. Wolf
Kevin E. Wolf, Principal Executive Officer/President
Date 8/19/20
Pursuant to the requirements of the Securities Exchange Act of 1934 and the Investment Company Act of 1940, this report has been signed below by the following persons on behalf of the registrant and in the capacities and on the dates indicated.
By (Signature and Title)
/s/ Kevin E. Wolf
Kevin E. Wolf, Principal Executive Officer/President
Date 8/19/20
By (Signature and Title)
/s/ James Colantino
James Colantino, Principal Financial Officer/Treasurer
Date 8/19/20