united states
securities and exchange commission
washington, d.c. 20549
form n-csr
certified shareholder report of registered management
investment companies
Investment Company Act file number 811-21720
Northern Lights Fund Trust
(Exact name of registrant as specified in charter)
225 Pictoria Drive, Suite 450, Cincinnati, OH 45246
(Address of principal executive offices) (Zip code)
The Corporation Trust Company
1209 Orange Street, Wilmington, DE 19801
(Name and address of agent for service)
Registrant's telephone number, including area code: 631-470-2600
Date of fiscal year end: 7/31
Date of reporting period: 7/31/21
Item 1. Reports to Stockholders.
| (a) |
Astor Dynamic Allocation Fund
Class A: ASTLX Class C: ASTZX Class I: ASTIX
Astor Sector Allocation Fund
Class A: ASPGX Class C: CSPGX Class I: STARX
Astor Macro Alternative Fund
Class A: ASTMX Class I: GBLMX
Annual Report
July 31, 2021
1-877-738-0333
Distributed by Northern Lights Distributors, LLC
Member FINRA
Market Overview
As the globe reached the back side of the first Covid-19 wave, the world began to comprehend how to manage the pandemic conditions better. The global economic situation improved dramatically during the second half of 2020 and into 2021, even as the second wave worked its way through the U.S. in the winter. Domestically, national output measurements hit pre-Covid levels in Q3 2020 and remained at very high overall levels for the remainder of the period through July 2021. International markets have been somewhat in contrast to one another. While staging marked recoveries from Q2 2020 levels, international developed economies dealt with an early second wave of Covid, derailing the recovery in Q4. At the same time, emerging markets economic activity hit its highest levels in Q4. However, emerging market economic activity has since dipped back below pre-pandemic levels while developed economies outside of the U.S. continued to gain steam.
U.S. equity markets fared the best globally for the calendar year period ending July ’21. Within the universe of broad equity indexes, the small cap Russell 2000 was up just under 52%, compared to the S&P 500 large cap index, was up approximately 36%. The outperformance was driven largely by a near 64% return in small cap value stocks, which were hit hard during the pandemic sell off. International developed markets were up over 30% as these economies also began the process of recovery from the pandemic effects. Emerging markets however posted the worst returns of the major broad market indexes. Chinese equity markets posted essentially flat returns for the period after ending 2020 on a high note.
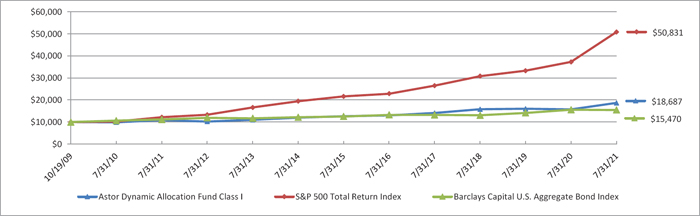
Astor Dynamic Allocation Fund – The Fund returned 18.49% (I share) for the period of 8.1.2020 – 7.31.2021. This compares to 11.22% for the HFRI Macro Total Index. It also compares up 36.45% for the S&P 500 large cap equity market index and -0.70% for the Bloomberg Barclays U.S. Aggregate Bond Index. The fund had reduced equity exposure substantially in the wake of the pandemic onset and subsequent economic suppression. During Q3 and Q4 of 2020, the fund added back exposure as the economic conditions thawed. This put beta (equity market risk level) above levels the portfolio had moving into the pandemic. Heading into Q3, the fund had an approximate 0.7 beta (to the S&P 500) as economic conditions improved materially. Both service and manufacturing indexes reflect broad economic activity domestically.
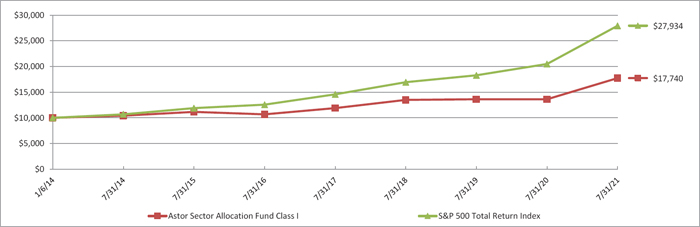
Astor Sector Allocation Fund – The Fund was up 30.18% (I share) for the period of 8.1.2020 – 7.31.2021. This compares to 36.45% for the S&P 500 large cap equity market index. The fund had taken risk off in the wake of the pandemic, moving equity allocations to the lower end of its range. During Q3 2020, the fund reestablished overall equity exposure above 90% as economic conditions improved post-pandemic. Technology remained the largest fund exposure during this period and was the biggest contributor to return overall. Communications and Healthcare were two of the biggest contributors as well, as these sectors were beneficiaries from the ‘pandemic normal’.
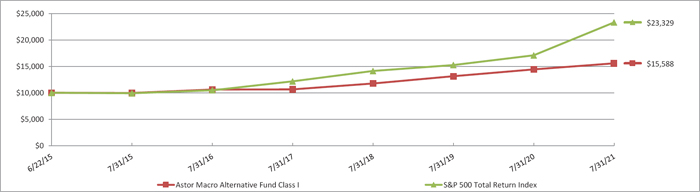
Astor Macro Alternative Fund – The Fund was up 7.94% for the period 8.1.20 to 7.31.21. This compares to up 11.22% for the HFRI Macro Total Index. Equity markets were, overall, the strongest performing
1
asset class for the period. The equity asset allocation component of the fund was the best performing segment. This includes the emerging market component of the equity allocation. The Bond and Forex value strategies were also solid contributors, though nothing overwhelming. Ten-year treasury yields surged through Q1 2021 to just under 1.8%, before backing off to the 1.2-1.3% level in early Q3 2021. The economic reflation trade from pandemic closures priced in a spike in inflation. While data suggested elevated price levels, the reflation trade lost steam in Q2 2021, confounding many analyst views on the true impact of inflation (transitory or not). Commodities also became and expensive inflation hedge during this period. The S&P GSCI Commodity Index was up over 50% during the 7.31.20 – 7.31.21 period, driven much by a surge in Crude Oil prices. These prices have remained elevated, even as the reflation trade lost its shine. The Macro Alternative fund lagged the HFRI Macro Total Index, mainly driven by an underperformance in the Commodity-specific model components, which were a drag on fund performance.
Market and Economy Looking Forward
The economy has clearly bounced back. Domestically, manufacturing and services have both experienced a surge in activity, as measured by the ISM Manufacturing and Non-manufacturing indexes. The catalyst for an elevated manufacturing reading was in large part from a back log in orders and supply chain constraints that developed as the pandemic took hold. From consumer products to microchips used in cars, demand appears to be consistent. The Eurozone did recover at the same pace as the U.S. but has picked up steam as 2021 has progressed. Emerging markets have been a different story of late, driven in good part to China. A declining composite Purchasing Managers Index (PMI) reading illustrates a more sanguine picture of economic activity. As a result, emerging markets, which started the year strong, have been a drag.
While the macro foundation appears solid, what could be the risks to economic conditions and subsequently financial markets? Interest rates have been at the top of that list, as inflation appeared to be a real threat. Long end rates backing off have conveyed that most believe the inflation threat to be transitory. Regardless, a move higher in rates through inflation concerns or through function of Fed activity always have to be watched. While not the death knell that some perpetually forecast, higher rates can (and should) impact asset prices through discount modeling. With as much cheap liquidity and sensitivity to rate moves in recent years (see Q4 2018), it would not be a surprise to see markets behave erratically at the onset of this. The Fed is well aware of this. Tapering asset purchases in 2021 seems to be the initial path, with rate hikes out in 2022, if all stays well.
Covid is clearly a lingering issue. This need not be stated. How society proceeds to handle subsequent breakouts, variant discoveries, etc., will determine how the economy moves along. With the Delta variant the most vigorous concern since our initiation to this infection, the overall economy has appeared to handle things ‘OK’. States have taken different measures, with some more cautious than others. Infection rates surged for sure across the U.S. To this point, no derailment of economic activity appears evident, even if some mode of slowdown has taken place. This appears to be the model moving forward. There are many caveats to something new, however.
AIM-9/24/21-OP454 9179-NLD-09232021
2
ASTOR DYNAMIC ALLOCATION FUND
PORTFOLIO REVIEW (Unaudited)
July 31, 2021
Average Annual Total Return through July 31, 2021*, as compared to its benchmarks:
| One Year | Three Year | Five Year | Ten Year | Inception (1) | Inception (2) | Inception (3) | |
| Astor Dynamic Allocation Fund - Class A Shares | 18.20% | 5.45% | 7.25% | N/A | N/A | N/A | 6.25% |
| Astor Dynamic Allocation Fund - Class A Shares With Load | 12.60% | 3.75% | 6.21% | N/A | N/A | N/A | 5.72% |
| Astor Dynamic Allocation Fund - Class C Shares | 17.25% | 4.65% | 6.44% | 4.48% | N/A | 4.42% | N/A |
| Astor Dynamic Allocation Fund - Class I Shares | 18.49% | 5.72% | 7.53% | 5.54% | 5.45% | N/A | N/A |
| S&P 500 Total Return Index ** | 36.45% | 18.16% | 17.35% | 15.35% | 14.80% | 14.79% | 16.24% |
| Bloomberg Capital U.S. Aggregate Bond Index *** | -0.70% | 5.73% | 3.13% | 3.35% | 3.77% | 3.72% | 3.23% |
| * | The performance data quoted is historical. Past performance is no guarantee of future results. Current performance may be higher or lower than the performance data quoted. The principal value and investment return of an investment will fluctuate so that your shares, when redeemed, may be worth more or less than their original cost. The returns shown do not reflect the deduction of taxes that a shareholder would pay on Fund distributions or on the redemptions of Fund shares. The Fund’s total annual operating expenses, including underlying funds, are 1.74%, 2.49%, and 1.49% for Class A, Class C, and Class I respectively, per the most recent prospectus. After fee waivers and/or reimbursements, the Fund’s net operating expense, including underlying funds, is 1.61%, 2.36%, and 1.36% for Class A, Class C, and Class I shares, respectively. Pursuant to a written contract (the “Waiver Agreement”), the advisor has agreed, at least until November 30, 2021, to waive a portion of its advisory fee and has agreed to reimburse the Fund for other expenses to the extent necessary so that the total expenses incurred by the Fund (excluding any front-end or contingent deferred loads; brokerage fees and commissions; acquired fund fees and expenses; borrowing costs (such as interest and dividend expense on securities sold short); taxes; and extraordinary expenses, such as litigation expenses (which may include indemnification of Fund officers and Trustees, contractual indemnification of Fund service providers, other than the advisor)) do not exceed 1.40%, 2.15%, and 1.15% for Class A, Class C, and Class I shares, respectively. Class A shares are subject to a maximum sales charge of 4.75% of the purchase price. Performance figures for periods greater than one year are annualized. For performance information current to the most recent month-end, please call 1-877-738-0333. |
| ** | The S&P 500 Total Return Index is an unmanaged composite of 500 large capitalization companies. This Index is widely used by professional investors as a performance benchmark for large-cap stocks. You cannot invest directly in an index and unmanaged index returns do not reflect any fees, expenses or sales charges. |
| *** | The Bloomberg Capital U.S. Aggregate Bond Index is a market capitalization-weighted index, meaning the securities in the Index are weighted according to the market size of each bond type. Most U.S. traded investment grade bonds are represented. Municipal bonds and Treasury Inflation-Protected Securities are excluded, due to tax treatment issues. The Index includes Treasury securities, Government agency bonds, mortgage-backed bonds, corporate bonds, and a small amount of foreign bonds traded in the U.S. You cannot invest directly in an index and unmanaged index returns do not reflect any fees, expenses or sales charges. |
| (1) | Class I inception date is October 19, 2009. |
| (2) | Class C inception date is March 12, 2010. |
| (3) | Class A inception date is November 30, 2011. |
Comparison of the Change in Value of a $10,000 Investment
| The Fund’s holdings by asset class, as of July 31, 2021 are as follows: | ||||
| Asset Classes | % of Net Assets | |||
| Exchange Traded Funds - Equity | 68.5 | % | ||
| Exchange Traded Funds - Debt | 24.9 | % | ||
| Exchange Traded Funds - Commodity | 5.2 | % | ||
| Short-Term Investments | 1.6 | % | ||
| Liabilities in Excess of Other Assets | (0.2 | )% | ||
| Total | 100.0 | % | ||
Please refer to the Schedule of Investments in this annual report for a detailed listing of the Fund’s holdings.
3
ASTOR SECTOR ALLOCATION FUND
PORTFOLIO REVIEW (Unaudited)
July 31, 2021
Average Annual Total Return through July 31, 2021*, as compared to its benchmark:
| One Year | Three Year | Five Year | Since Inception (1) | Since Inception (2) | |
| Astor Sector Allocation Fund - Class A Shares | 29.87% | 9.26% | 10.42% | 9.71% | N/A |
| Astor Sector Allocation Fund - Class A Shares With Load | 23.72% | 7.51% | 9.35% | 9.16% | N/A |
| Astor Sector Allocation Fund - Class C Shares | 28.89% | 8.44% | 9.59% | 8.89% | N/A |
| Astor Sector Allocation Fund - Class I Shares | 30.18% | 9.55% | 10.70% | N/A | 7.87% |
| S&P 500 Total Return Index ** | 36.45% | 18.16% | 17.35% | 16.24% | 14.55% |
| * | The performance data quoted is historical. Past performance is no guarantee of future results. Current performance may be higher or lower than the performance data quoted. The principal value and investment return of an investment will fluctuate so that your shares, when redeemed, may be worth more or less than their original cost. The returns shown do not reflect the deduction of taxes that a shareholder would pay on Fund distributions or on the redemptions of Fund shares. The Fund’s total annual operating expenses, including underlying funds, are 2.24%, 2.99%, and 1.99% for Class A, Class C, and Class I respectively, per the most recent prospectus. After fee waivers and/or reimbursements, the Fund’s net operating expenses, including underlying funds, are 1.70%, 2.45%, and 1.45% for Class A, Class C and Class I shares, respectively. Pursuant to a written contract (the “Waiver Agreement”), the advisor has agreed, at least until November 30, 2021, to waive a portion of its advisory fee and has agreed to reimburse the Fund for other expenses to the extent necessary so that the total expenses incurred by the Fund (excluding any front-end or contingent deferred loads; brokerage fees and commissions; acquired fund fees and expenses; borrowing costs (such as interest and dividend expense on securities sold short); taxes; and extraordinary expenses, such as litigation expenses (which may include indemnification of Fund officers and Trustees, contractual indemnification of Fund service providers, other than the advisor)) do not exceed 1.40%, 2.15% and 1.15%, for Class A, Class C, Class I shares, respectively. Class A shares are subject to a maximum sales charge of 4.75% of the purchase price. For performance information current to the most recent month-end, please call 1-877-738-0333. |
| ** | The S&P 500 Total Return Index is an unmanaged composite of 500 large capitalization companies. This Index is widely used by professional investors as a performance benchmark for large-cap stocks. You cannot invest directly in an index and unmanaged index returns do not reflect any fees, expenses or sales charges. |
| (1) | Class A and C inception date is November 30, 2011. |
| (2) | Class I inception date is January 6, 2014. |
Comparison of the Change in Value of a $10,000 Investment

Comparison of the Change in Value of a $10,000 Investment
4
ASTOR SECTOR ALLOCATION FUND
PORTFOLIO REVIEW (Unaudited) (Continued)
July 31, 2021
| The Fund’s holdings by asset class, as of July 31, 2021 are as follows: | ||||
| Asset Classes | % of Net Assets | |||
| Exchange Traded Funds - Equity | 98.4 | % | ||
| Short-Term Investments | 1.7 | % | ||
| Liabilities in Excess of Other Assets | (0.1 | )% | ||
| Total | 100.0 | % | ||
Please refer to the Schedule of Investments in this annual report for a detailed listing of the Fund’s holdings.
5
ASTOR MACRO ALTERNATIVE FUND
PORTFOLIO REVIEW (Unaudited)
July 31, 2021
Average Annual Total Return through July 31, 2021*, as compared to its benchmark:
| One Year | Three Year | Five Year | Since Inception (1) | Since Inception (2) | |
| Astor Macro Alternative Fund - Class A Shares | N/A | N/A | N/A | N/A | 0.32% |
| Astor Macro Alternative Fund - Class I Shares | 7.94% | 9.79% | 7.95% | 7.54% | N/A |
| S&P 500 Total Return Index ** | 36.45% | 18.16% | 17.35% | 14.88% | 12.65% |
| * | The performance data quoted is historical. Past performance is no guarantee of future results. Current performance may be higher or lower than the performance data quoted. The principal value and investment return of an investment will fluctuate so that your shares, when redeemed, may be worth more or less than their original cost. The returns shown do not reflect the deduction of taxes that a shareholder would pay on Fund distributions or on the redemptions of Fund shares. The Fund’s total annual operating expense, including underlying funds, are 4.02% and 3.77% for Class A and Class I, respectively, per the most recent prospectus. After fee waivers and/or reimbursements, the Fund’s net operating expense, including underlying funds, is 2.18% and 1.93% for Class A and Class I shares, respectively. Pursuant to a written contract (the “Waiver Agreement”), the advisor has agreed, at least until November 30, 2021, to waive a portion of its advisory fee and has agreed to reimburse the Funds for other expenses to the extent necessary so that the total expenses incurred by the Fund (excluding any front-end or contingent deferred loads; brokerage fees and commissions; acquired fund fees and expenses; borrowing costs (such as interest and dividend expense on securities sold short); taxes; and extraordinary expenses, such as litigation expenses (which may include indemnification of Fund officers and Trustees, contractual indemnification of Fund service providers, other than the advisor)) do not exceed 2.00% and 1.75% for Class A and Class I shares, respectively. Performance figures for periods greater than one year are annualized. For performance information current to the most recent month-end, please call 1-877-738-0333. |
| ** | The S&P 500 Total Return Index is an unmanaged composite of 500 large capitalization companies. This Index is widely used by professional investors as a performance benchmark for large-cap stocks. You cannot invest directly in an index and unmanaged index returns do not reflect any fees, expenses or sales charges. |
| (1) | Class I inception date is June 22, 2015. |
| (2) | Class A inception date is February 24, 2021. |
Comparison of the Change in Value of a $10,000 Investment
| The Fund’s holdings by asset class, as of July 31, 2021 are as follows: | ||||
| Asset Classes | % of Net Assets | |||
| Exchange Traded Funds - Debt | 53.5 | % | ||
| Exchange Traded Funds - Equity | 35.9 | % | ||
| Exchange Traded Funds - Alternative | 2.9 | % | ||
| Short-Term Investment | 2.6 | % | ||
| Other Assets in Excess of Liabilities | 5.1 | % | ||
| Total | 100.0 | % | ||
Please refer to the Schedule of Investments in this annual report for a detailed listing of the Fund’s holdings.
6
| Astor Dynamic Allocation Fund |
| SCHEDULE OF INVESTMENTS |
| July 31, 2021 |
| Shares | Fair Value | |||||||
| EXCHANGE TRADED FUNDS - 98.6% | ||||||||
| COMMODITY FUND - 5.2% | ||||||||
| 399,690 | Invesco Optimum Yield Diversified Commodity Strategy No K-1 ETF | $ | 8,141,685 | |||||
| DEBT FUNDS - 24.9% | ||||||||
| 154,679 | First Trust Low Duration Opportunities ETF | 7,860,787 | ||||||
| 167,051 | First Trust Senior Loan ETF | 7,986,708 | ||||||
| 547,674 | Quadratic Interest Rate Volatility and Inflation ETF | 15,460,837 | ||||||
| 96,023 | Vanguard Short-Term Bond ETF | 7,911,335 | ||||||
| 39,219,667 | ||||||||
| EQUITY FUNDS - 68.5% | ||||||||
| 70,768 | Invesco S&P 500 Equal Weight Technology ETF | 21,113,633 | ||||||
| 102,851 | iShares Core MSCI EAFE ETF | 7,770,393 | ||||||
| 51,963 | iShares Core MSCI Emerging Markets ETF | 3,284,581 | ||||||
| 186,734 | iShares MSCI USA Equal Weighted ETF | 15,990,033 | ||||||
| 133,065 | iShares MSCI USA Min Vol Factor ETF | 10,142,214 | ||||||
| 113,413 | SPDR Portfolio Emerging Markets ETF | 4,859,747 | ||||||
| 355,954 | SPDR Portfolio S&P 1500 Composite Stock Market ETF | 19,253,552 | ||||||
| 351,243 | SPDR Portfolio S&P 500 ETF | 18,110,089 | ||||||
| 196,087 | Wisdomtree Emerging Markets EX-State-Owned Enterprises Fund | 7,653,276 | ||||||
| 108,177,518 | ||||||||
| TOTAL EXCHANGE TRADED FUNDS (Cost $138,824,029) | 155,538,870 | |||||||
| SHORT-TERM INVESTMENTS - 1.6% | ||||||||
| MONEY MARKET FUND - 1.6% | ||||||||
| 2,594,859 | BlackRock Liquidity Funds T-Fund Portfolio, Institutional Class, 0.01% + | 2,594,859 | ||||||
| TOTAL SHORT-TERM INVESTMENT (Cost $2,594,859) | 2,594,859 | |||||||
| TOTAL INVESTMENTS - 100.2% (Cost $141,418,888) | $ | 158,133,729 | ||||||
| LIABILITIES IN EXCESS OF OTHER ASSETS - (0.2)% | (267,620 | ) | ||||||
| TOTAL NET ASSETS - 100.0% | $ | 157,866,109 | ||||||
ETF - Exchange Traded Fund
EAFE - Europe, Australasia and the Far East
MSCI - Morgan Stanley Capital International
SPDR - Standard and Poor’s Depositary Receipts
| + | Money market fund; interest rate reflects seven-day effective yield on July 31, 2021. |
See accompanying notes to financial statements.
7
| Astor Sector Allocation Fund |
| SCHEDULE OF INVESTMENTS |
| July 31, 2021 |
| Shares | Fair Value | |||||||
| EXCHANGE TRADED FUNDS - 98.4% | ||||||||
| EQUITY FUNDS - 98.4% | ||||||||
| 26,594 | Consumer Discretionary Select Sector SPDR Fund | $ | 4,798,355 | |||||
| 50,668 | Consumer Staples Select Sector SPDR Fund | 3,623,269 | ||||||
| 25,339 | First Trust Technology Discretionary AlphaDEX Fund | 1,554,041 | ||||||
| 23,217 | First Trust Technology AlphaDEX Fund | 2,913,269 | ||||||
| 48,002 | Health Care Select Sector SPDR Fund | 6,343,464 | ||||||
| 44,257 | Industrial Select Sector SPDR Fund | 4,574,404 | ||||||
| 12,651 | Invesco S&P 500 Equal Weight Technology ETF | 3,774,426 | ||||||
| 17,705 | O’Shares Global Internet Giants ETF | 966,693 | ||||||
| 38,906 | Real Estate Select Sector SPDR Fund | 1,804,460 | ||||||
| TOTAL EXCHANGE TRADED FUNDS (Cost $25,827,798) | 30,352,381 | |||||||
| SHORT-TERM INVESTMENTS - 1.7% | ||||||||
| MONEY MARKET FUND - 1.7% | ||||||||
| 518,513 | BlackRock Liquidity Funds T-Fund Portfolio, Institutional Class, 0.01% + | 518,513 | ||||||
| TOTAL SHORT-TERM INVESTMENTS (Cost $518,513) | 518,513 | |||||||
| TOTAL INVESTMENTS - 100.1% (Cost $26,346,311) | $ | 30,870,894 | ||||||
| LIABILITIES IN EXCESS OF OTHER ASSETS - (0.1)% | (33,064 | ) | ||||||
| TOTAL NET ASSETS - 100.0% | $ | 30,837,830 | ||||||
ETF - Exchange Traded Fund
SPDR - Standard and Poor’s Depositary Receipts
| + | Money market fund; interest rate reflects seven-day effective yield on July 31, 2021. |
See accompanying notes to financial statements.
8
| Astor Macro Alternative Fund |
| CONSOLIDATED SCHEDULE OF INVESTMENTS |
| July 31, 2021 |
| Shares | Fair Value | |||||||
| EXCHANGE TRADED FUNDS - 92.3% | ||||||||
| ALTERNATIVE FUND - 2.9% | ||||||||
| 36,135 | IQ Merger Arbitrage ETF | $ | 1,201,128 | |||||
| DEBT FUNDS - 53.5% | ||||||||
| 7,588 | iShares 3-7 Year Treasury Bond ETF | 999,643 | ||||||
| 56,563 | iShares Core U.S. Aggregate Bond ETF | 6,587,327 | ||||||
| 99,715 | iShares Short Treasury Bond ETF | 11,017,510 | ||||||
| 35,562 | SPDR Bloomberg Barclays High Yield Bond ETF | 3,903,641 | ||||||
| 22,508,121 | ||||||||
| EQUITY FUNDS - 35.9% | ||||||||
| 8,674 | Alerian MLP ETF | 294,135 | ||||||
| 12,907 | Invesco QQQ Trust Series 1 | 4,705,505 | ||||||
| 89,226 | Invesco S&P 500 Pure Value ETF | 6,728,533 | ||||||
| 2,085 | iShares MSCI Brazil ETF | 77,979 | ||||||
| 2,634 | iShares MSCI China ETF | 187,725 | ||||||
| 6,445 | iShares MSCI India ETF | 288,027 | ||||||
| 8,194 | iShares MSCI Malaysia ETF | 202,310 | ||||||
| 5,971 | iShares MSCI Mexico ETF | 292,698 | ||||||
| 7,395 | iShares MSCI Philippines ETF | 206,838 | ||||||
| 13,142 | iShares MSCI Poland ETF | 286,496 | ||||||
| 6,477 | iShares MSCI Russia ETF | 285,053 | ||||||
| 1,679 | iShares MSCI South Africa ETF | 81,280 | ||||||
| 4,425 | iShares MSCI Taiwan ETF | 281,386 | ||||||
| 2,736 | iShares MSCI Thailand ETF | 200,029 | ||||||
| 9,604 | iShares MSCI Turkey ETF | 212,825 | ||||||
| 6,532 | iShares Select Dividend ETF | 755,360 | ||||||
| 15,086,179 | ||||||||
| TOTAL EXCHANGE TRADED FUNDS (Cost $38,545,845) | 38,795,428 | |||||||
| SHORT-TERM INVESTMENTS - 2.6% | ||||||||
| 1,094,780 | BlackRock Liquidity Funds T-Fund Portfolio, Institutional Class 0.01% + | 1,094,780 | ||||||
| TOTAL SHORT-TERM INVESTMENT (Cost $1,094,780) | ||||||||
| TOTAL INVESTMENTS - 94.9% (Cost $39,640,625) | $ | 39,890,208 | ||||||
| OTHER ASSETS IN EXCESS OF LIABILITIES - 5.1% | 2,155,887 | |||||||
| TOTAL NET ASSETS - 100.0% | $ | 42,046,095 | ||||||
ETF - Exchange Traded Fund
MSCI - Morgan Stanley Capital International
SPDR - Standard and Poor’s Depositary Receipts
| + | Money market fund; interest rate reflects seven-day effective yield on July 31, 2021. |
See accompanying notes to financial statements.
9
| Astor Macro Alternative Fund |
| CONSOLIDATED SCHEDULE OF INVESTMENTS (Continued) |
| July 31, 2021 |
FUTURES CONTRACTS ^
| Underlying Face Amount at | ||||||||||||||
| Long Contracts | Description | Counterparty | Value ** | Unrealized Gain (Loss) | ||||||||||
| 12 | 10 Year Euro BUND Future September 2021 | StoneX | $ | 2,512,522 | $ | 31,749 | ||||||||
| 19 | 10 Year US Treasury Note September 2021 | StoneX | 2,554,607 | 2,669 | ||||||||||
| 11 | Gasoline RBOB Futures August 2021 | StoneX | 1,078,631 | 32,752 | ||||||||||
| 21 | Henry Hub Natural Gas Futures November 2021 | StoneX | 857,850 | 74,210 | ||||||||||
| 38 | Japanese Yen Future September 2021 | StoneX | 4,328,913 | 19,950 | ||||||||||
| 31 | Lean Hogs Future October 2021 | StoneX | 1,091,510 | (27,830 | ) | |||||||||
| 44 | Live Cattle Future October 2021 | StoneX | 2,238,720 | (27,760 | ) | |||||||||
| 42 | Long Gilt Future September 2021 | StoneX | 7,579,052 | 107,830 | ||||||||||
| 12 | NY Harbor ULSD Futures August 2021 | StoneX | 1,106,582 | 28,997 | ||||||||||
| 12 | Soybean Future December 2021 | StoneX | 424,680 | (24,650 | ) | |||||||||
| Net Unrealized Gain from Open Long Futures Contracts | $ | 217,917 | ||||||||||||
| Underlying Face Amount at | ||||||||||||||
| Short Contracts | Description | Counterparty | Value ** | Unrealized Gain (Loss) | ||||||||||
| 50 | British Pound Future September 2021 | StoneX | $ | 4,341,563 | $ | (42,581 | ) | |||||||
| 53 | Cocoa Future September 2021 | StoneX | 1,253,980 | 17,600 | ||||||||||
| 10 | Coffee Future March 2021 | StoneX | 673,313 | 85,856 | ||||||||||
| 49 | Corn Future December 2021 | StoneX | 1,335,863 | 6,786 | ||||||||||
| 32 | Cotton No.2 Future December 2021 | StoneX | 1,430,240 | (30,410 | ) | |||||||||
| 12 | Crude Future September 2021 | StoneX | 878,760 | (24,090 | ) | |||||||||
| 11 | Soybean Oil Future December 2021 | StoneX | 416,064 | (18,011 | ) | |||||||||
| 32 | Wheat Future September 2021 | StoneX | 1,126,000 | (86,075 | ) | |||||||||
| 32 | World Sugar Future September 2021 | StoneX | 641,894 | (31,281 | ) | |||||||||
| Net Unrealized Loss from Open Short Futures Contracts | $ | (122,206 | ) | |||||||||||
| ^ | Each futures contract is a holding of AMA Fund Limited CFC (“AMA”) which commenced operations on June 22, 2015 and is a wholly owned subsidiary of the Astor Macro Alternative Fund. |
| ** | The amounts shown are the underlying reference notional amounts to stock exchange indices and equities upon which the fair value of the futures contracts held by AMA are based. Notional values do not represent the current fair value of, and are not necessarily indicative of, the future cash flows of AMA’s futures contracts. Further, the underlying price changes in relation to the variables specified by the notional values affects the fair value of these derivative financial instruments. The notional values as set forth within this schedule do not purport to represent economic value at risk to AMA. |
See accompanying notes to financial statements.
10
| The Astor Funds |
| STATEMENTS OF ASSETS AND LIABILITIES |
| July 31, 2021 |
| Astor Macro | ||||||||||||
| Astor Dynamic | Astor Sector | Alternative Fund | ||||||||||
| Allocation Fund | Allocation Fund | (Consolidated) | ||||||||||
| ASSETS | ||||||||||||
| Investment securities : | ||||||||||||
| At cost | $ | 141,418,888 | $ | 26,346,311 | $ | 39,640,625 | ||||||
| At value | $ | 158,133,729 | $ | 30,870,894 | $ | 39,890,208 | ||||||
| Cash | 25,788 | — | — | |||||||||
| Deposits of foreign currency at broker, at value (Cost $0, $0 and $1,622, respectively) | — | — | 1,622 | |||||||||
| Deposits for futures contracts | — | — | 2,048,448 | |||||||||
| Net unrealized appreciation on futures contracts | — | — | 95,711 | |||||||||
| Dividends and interest receivable | 11 | 2 | 5 | |||||||||
| Receivable for Fund shares sold | 111,117 | — | 55,885 | |||||||||
| Prepaid expenses and other assets | 30,751 | 30,827 | 26,134 | |||||||||
| TOTAL ASSETS | 158,301,396 | 30,901,723 | 42,118,013 | |||||||||
| LIABILITIES | ||||||||||||
| Distribution (12b-1) fees payable | 29,694 | 10,724 | 106 | |||||||||
| Investment advisory fees payable | 123,685 | 13,285 | 22,420 | |||||||||
| Payable to related parties | 36,478 | 14,511 | 10,335 | |||||||||
| Payable for Fund shares redeemed | 205,445 | 1,082 | 11,375 | |||||||||
| Accrued expenses and other liabilities | 39,985 | 24,291 | 27,682 | |||||||||
| TOTAL LIABILITIES | 435,287 | 63,893 | 71,918 | |||||||||
| NET ASSETS | $ | 157,866,109 | $ | 30,837,830 | $ | 42,046,095 | ||||||
| Net Assets Consist Of: | ||||||||||||
| Paid in capital ($0 par value, unlimited shares authorized) | $ | 125,635,670 | $ | 21,826,687 | $ | 39,333,800 | ||||||
| Accumulated earnings | 32,230,439 | 9,011,143 | 2,712,295 | |||||||||
| NET ASSETS | $ | 157,866,109 | $ | 30,837,830 | $ | 42,046,095 | ||||||
See accompanying notes to financial statements.
11
| The Astor Funds |
| STATEMENTS OF ASSETS AND LIABILITIES (Continued) |
| July 31, 2021 |
| Astor Macro | ||||||||||||
| Astor Dynamic | Astor Sector | Alternative Fund | ||||||||||
| Allocation Fund | Allocation Fund | (Consolidated) | ||||||||||
| Net Asset Value Per Share: | ||||||||||||
| Class A Shares: | ||||||||||||
| Net Assets | $ | 11,834,464 | $ | 7,790,437 | $ | 135,981 | ||||||
| Shares of beneficial interest outstanding ($0 par value, unlimited shares authorized) | 782,257 | 427,294 | 10,996 | |||||||||
| Net asset value (Net Assets ÷ Shares Outstanding), and redemption price per share | $ | 15.13 | $ | 18.23 | $ | 12.37 | ||||||
| Maximum offering price per share (4.75% sales charge) | $ | 15.88 | $ | 19.14 | $ | 12.99 | ||||||
| Class C Shares: | ||||||||||||
| Net Assets | $ | 31,287,865 | $ | 12,666,886 | $ | — | ||||||
| Shares of beneficial interest outstanding ($0 par value, unlimited shares authorized) | 2,182,712 | 752,927 | — | |||||||||
| Net asset value (Net Assets ÷ Shares Outstanding), offering price and redemption price per share | $ | 14.33 | $ | 16.82 | $ | — | ||||||
| Class I Shares: | ||||||||||||
| Net Assets | $ | 114,743,780 | $ | 10,380,507 | $ | 41,910,114 | ||||||
| Shares of beneficial interest outstanding ($0 par value, unlimited shares authorized) | 7,560,215 | 559,811 | 3,385,557 | |||||||||
| Net asset value (Net Assets ÷ Shares Outstanding), offering price and redemption price per share | $ | 15.18 | $ | 18.54 | $ | 12.38 | ||||||
See accompanying notes to financial statements.
12
| The Astor Funds |
| STATEMENTS OF OPERATIONS |
| For the Year Ended July 31, 2021 |
| Astor Macro | ||||||||||||
| Astor Dynamic | Astor Sector | Alternative Fund | ||||||||||
| Allocation Fund | Allocation Fund | (Consolidated) | ||||||||||
| INVESTMENT INCOME | ||||||||||||
| Dividends | $ | 2,621,363 | $ | 434,501 | $ | 358,474 | ||||||
| Interest | (5,361 | ) | 102 | — | ||||||||
| Securities lending income - net | 182,149 | 35,306 | — | |||||||||
| TOTAL INVESTMENT INCOME | 2,798,151 | 469,909 | 358,474 | |||||||||
| EXPENSES | ||||||||||||
| Investment advisory fees | 1,664,124 | 293,937 | 426,525 | |||||||||
| Distribution (12b-1) fees, Class A shares | 31,607 | 20,048 | 106 | |||||||||
| Distribution (12b-1) fees, Class C shares | 321,864 | 127,692 | — | |||||||||
| Administrative services fees | 166,067 | 43,749 | 50,243 | |||||||||
| Third party administrative servicing fees | 106,719 | 12,766 | 15,427 | |||||||||
| Transfer agent fees | 111,128 | 33,956 | 21,217 | |||||||||
| Registration fees | 80,150 | 65,505 | 27,425 | |||||||||
| Accounting services fees | 55,446 | 32,647 | 21,068 | |||||||||
| Printing expenses | 46,897 | 10,510 | 7,760 | |||||||||
| Compliance officer fees | 26,526 | 6,943 | 7,078 | |||||||||
| Custodian fees | 21,842 | 5,542 | 8,611 | |||||||||
| Legal fees | 15,986 | 15,073 | 33,591 | |||||||||
| Trustees fees and expenses | 15,575 | 14,986 | 14,968 | |||||||||
| Audit fees | 15,956 | 16,000 | 21,500 | |||||||||
| Miscellaneous expense | 6,092 | 4,398 | 3,843 | |||||||||
| Insurance expense | 5,475 | 1,105 | 979 | |||||||||
| TOTAL EXPENSES | 2,691,454 | 704,857 | 660,341 | |||||||||
| Less: Fees waived and/or expenses reimbursed by the advisor | (325,638 | ) | (199,986 | ) | (136,984 | ) | ||||||
| NET EXPENSES | 2,365,816 | 504,871 | 523,357 | |||||||||
| NET INVESTMENT INCOME (LOSS) | 432,335 | (34,962 | ) | (164,883 | ) | |||||||
| REALIZED AND UNREALIZED GAIN (LOSS) FROM INVESTMENTS | ||||||||||||
| Net realized gain from security transactions | 22,035,041 | 5,570,694 | 2,666,367 | |||||||||
| Net realized gain from futures transactions | — | — | 194,737 | |||||||||
| Net realized gain from foreign currency transactions | — | — | 1,710 | |||||||||
| Net change in unrealized appreciation (depreciation) on investments | 6,250,049 | 2,480,830 | (308,552 | ) | ||||||||
| Net change in unrealized appreciation on futures contracts | — | — | 2,888 | |||||||||
| Net change in unrealized depreciation on foreign currency transactions | — | — | (8,756 | ) | ||||||||
| NET REALIZED AND UNREALIZED GAIN FROM INVESTMENTS | 28,285,090 | 8,051,524 | 2,548,394 | |||||||||
| NET INCREASE IN NET ASSETS RESULTING FROM OPERATIONS | $ | 28,717,425 | $ | 8,016,562 | $ | 2,383,511 | ||||||
See accompanying notes to financial statements.
13
| The Astor Funds |
| STATEMENTS OF CHANGES IN NET ASSETS |
| Astor Dynamic Allocation Fund | ||||||||
| For the | For the | |||||||
| Year Ended | Year Ended | |||||||
| July 31, 2021 | July 31, 2020 | |||||||
| FROM OPERATIONS | ||||||||
| Net investment income | $ | 432,335 | $ | 1,638,712 | ||||
| Net realized gain (loss) from security transactions | 22,035,041 | (2,469,525 | ) | |||||
| Net change in unrealized appreciation (depreciation) on investments | 6,250,049 | (4,809,547 | ) | |||||
| Net increase (decrease) in net assets resulting from operations | 28,717,425 | (5,640,360 | ) | |||||
| DISTRIBUTIONS TO SHAREHOLDERS | ||||||||
| Total distributions paid | ||||||||
| Class A | (61,514 | ) | (346,330 | ) | ||||
| Class C | (101,264 | ) | (668,492 | ) | ||||
| Class I | (862,944 | ) | (4,518,221 | ) | ||||
| Return of capital | ||||||||
| Class A | — | (28,778 | ) | |||||
| Class C | — | (62,296 | ) | |||||
| Class I | — | (341,873 | ) | |||||
| Total distributions to shareholders | (1,025,722 | ) | (5,965,990 | ) | ||||
| FROM SHARES OF BENEFICIAL INTEREST | ||||||||
| Proceeds from shares sold | ||||||||
| Class A | 508,837 | 2,749,000 | ||||||
| Class C | 1,468,270 | 10,893,962 | ||||||
| Class I | 17,438,216 | 100,678,299 | ||||||
| Distributions reinvested | ||||||||
| Class A | 51,652 | 324,475 | ||||||
| Class C | 91,321 | 658,880 | ||||||
| Class I | 682,091 | 4,032,867 | ||||||
| Cost of shares redeemed | ||||||||
| Class A | (4,871,281 | ) | (5,513,273 | ) | ||||
| Class C | (8,590,300 | ) | (7,417,973 | ) | ||||
| Class I | (104,900,735 | ) | (92,158,780 | ) | ||||
| Net increase (decrease) in net assets from shares of beneficial interest | (98,121,929 | ) | 14,247,457 | |||||
| TOTAL INCREASE (DECREASE) IN NET ASSETS | (70,430,226 | ) | 2,641,107 | |||||
| NET ASSETS | ||||||||
| Beginning of Year | 228,296,335 | 225,655,228 | ||||||
| End of Year | $ | 157,866,109 | $ | 228,296,335 | ||||
See accompanying notes to financial statements.
14
| The Astor Funds |
| STATEMENTS OF CHANGES IN NET ASSETS (Continued) |
| Astor Dynamic Allocation Fund | ||||||||
| For the | For the | |||||||
| Year Ended | Year Ended | |||||||
| July 31, 2021 | July 31, 2020 | |||||||
| SHARE ACTIVITY | ||||||||
| Class A: | ||||||||
| Shares Sold | 36,799 | 203,949 | ||||||
| Shares Reinvested | 3,734 | 23,862 | ||||||
| Shares Redeemed | (353,979 | ) | (418,747 | ) | ||||
| Net decrease in shares of beneficial interest outstanding | (313,446 | ) | (190,936 | ) | ||||
| Class C: | ||||||||
| Shares Sold | 110,638 | 863,568 | ||||||
| Shares Reinvested | 6,998 | 50,416 | ||||||
| Shares Redeemed | (649,892 | ) | (601,245 | ) | ||||
| Net increase (decrease) in shares of beneficial interest outstanding | (532,256 | ) | 312,739 | |||||
| Class I: | ||||||||
| Shares Sold | 1,268,513 | 7,760,788 | ||||||
| Shares Reinvested | 48,879 | 296,654 | ||||||
| Shares Redeemed | (7,784,934 | ) | (7,199,974 | ) | ||||
| Net increase (decrease) in shares of beneficial interest outstanding | (6,467,542 | ) | 857,468 | |||||
See accompanying notes to financial statements.
15
| The Astor Funds |
| STATEMENTS OF CHANGES IN NET ASSETS (Continued) |
| Astor Sector Allocation Fund | ||||||||
| For the | For the | |||||||
| Year Ended | Year Ended | |||||||
| July 31, 2021 | July 31, 2020 | |||||||
| FROM OPERATIONS | ||||||||
| Net investment income (loss) | $ | (34,962 | ) | $ | 102,522 | |||
| Net realized gain (loss) from security transactions | 5,570,694 | (476,487 | ) | |||||
| Net change in unrealized appreciation (depreciation) on investments | 2,480,830 | (94,367 | ) | |||||
| Net increase (decrease) in net assets resulting from operations | 8,016,562 | (468,332 | ) | |||||
| DISTRIBUTIONS TO SHAREHOLDERS | ||||||||
| Total distributions paid | ||||||||
| Class A | (24,848 | ) | (974,349 | ) | ||||
| Class C | (20,234 | ) | (1,826,640 | ) | ||||
| Class I | (41,157 | ) | (1,704,721 | ) | ||||
| From distributions to shareholders | (86,239 | ) | (4,505,710 | ) | ||||
| FROM SHARES OF BENEFICIAL INTEREST | ||||||||
| Proceeds from shares sold | ||||||||
| Class A | 134,375 | 228,387 | ||||||
| Class C | 64,906 | 96,388 | ||||||
| Class I | 278,905 | 2,336,051 | ||||||
| Distributions reinvested | ||||||||
| Class A | 23,550 | 936,139 | ||||||
| Class C | 18,030 | 1,730,236 | ||||||
| Class I | 38,456 | 1,657,093 | ||||||
| Cost of shares redeemed | ||||||||
| Class A | (2,582,884 | ) | (2,901,503 | ) | ||||
| Class C | (4,151,715 | ) | (6,462,645 | ) | ||||
| Class I | (3,289,566 | ) | (10,947,535 | ) | ||||
| Net decrease in net assets from shares of beneficial interest | (9,465,943 | ) | (13,327,389 | ) | ||||
| TOTAL DECREASE IN NET ASSETS | (1,535,620 | ) | (18,301,431 | ) | ||||
| NET ASSETS | ||||||||
| Beginning of Year | 32,373,450 | 50,674,881 | ||||||
| End of Year | $ | 30,837,830 | $ | 32,373,450 | ||||
See accompanying notes to financial statements.
16
| The Astor Funds |
| STATEMENTS OF CHANGES IN NET ASSETS (Continued) |
| Astor Sector Allocation Fund | ||||||||
| For the | For the | |||||||
| Year Ended | Year Ended | |||||||
| July 31, 2021 | July 31, 2020 | |||||||
| SHARE ACTIVITY | ||||||||
| Class A: | ||||||||
| Shares Sold | 8,726 | 15,727 | ||||||
| Shares Reinvested | 1,534 | 63,899 | ||||||
| Shares Redeemed | (161,736 | ) | (202,997 | ) | ||||
| Net decrease in shares of beneficial interest outstanding | (151,476 | ) | (123,371 | ) | ||||
| Class C: | ||||||||
| Shares Sold | 4,098 | 7,597 | ||||||
| Shares Reinvested | 1,243 | 126,665 | ||||||
| Shares Redeemed | (286,657 | ) | (480,448 | ) | ||||
| Net decrease in shares of beneficial interest outstanding | (281,316 | ) | (346,186 | ) | ||||
| Class I: | ||||||||
| Shares Sold | 17,095 | 151,312 | ||||||
| Shares Reinvested | 2,507 | 111,433 | ||||||
| Shares Redeemed | (209,040 | ) | (751,659 | ) | ||||
| Net decrease in shares of beneficial interest outstanding | (189,438 | ) | (488,914 | ) | ||||
See accompanying notes to financial statements.
17
| The Astor Funds |
| CONSOLIDATED STATEMENTS OF CHANGES IN NET ASSETS |
| Astor Macro Alternative Fund | ||||||||
| For the | For the | |||||||
| Year Ended | Year Ended | |||||||
| July 31, 2021 | July 31, 2020 | |||||||
| FROM OPERATIONS | ||||||||
| Net investment loss | $ | (164,883 | ) | $ | (39,550 | ) | ||
| Net realized gain from security transactions, futures transactions and foreign currency transactions | 2,862,814 | 633,948 | ||||||
| Net change in unrealized appreciation (depreciation) investments, futures contracts and foreign currency transactions | (314,420 | ) | 233,539 | |||||
| Net increase in net assets resulting from operations | 2,383,511 | 827,937 | ||||||
| DISTRIBUTIONS TO SHAREHOLDERS | ||||||||
| Total distributions paid | ||||||||
| Class I | (528,074 | ) | (704,041 | ) | ||||
| From distributions to shareholders | (528,074 | ) | (704,041 | ) | ||||
| FROM SHARES OF BENEFICIAL INTEREST | ||||||||
| Proceeds from shares sold | ||||||||
| Class A* | 132,836 | — | ||||||
| Class I | 33,682,558 | 7,914,083 | ||||||
| Distributions reinvested | ||||||||
| Class I | 478,975 | 486,246 | ||||||
| Cost of shares redeemed | ||||||||
| Class I | (7,649,731 | ) | (1,683,720 | ) | ||||
| Net increase in net assets from shares of beneficial interest | 26,644,638 | 6,716,609 | ||||||
| TOTAL INCREASE IN NET ASSETS | 28,500,075 | 6,840,505 | ||||||
| NET ASSETS | ||||||||
| Beginning of Year | 13,546,020 | 6,705,515 | ||||||
| End of Year | $ | 42,046,095 | $ | 13,546,020 | ||||
| SHARE ACTIVITY | ||||||||
| Class A:* | ||||||||
| Shares Sold | 10,996 | — | ||||||
| Net increase in shares of beneficial interest outstanding | 10,996 | — | ||||||
| Class I: | ||||||||
| Shares Sold | 2,813,995 | 698,038 | ||||||
| Shares Reinvested | 39,815 | 44,610 | ||||||
| Shares Redeemed | (626,974 | ) | (147,720 | ) | ||||
| Net increase in shares of beneficial interest outstanding | 2,226,836 | 594,928 | ||||||
| * | Class A commenced operations on February 24, 2021. |
See accompanying notes to financial statements.
18
| The Astor Funds |
| FINANCIAL HIGHLIGHTS |
Per Share Data and Ratios for a Share of Beneficial Interest Outstanding Throughout Each Year Presented
| Astor Dynamic Allocation Fund Class A | ||||||||||||||||||||
| Year Ended | Year Ended | Year Ended | Year Ended | Year Ended | ||||||||||||||||
| July 31, | July 31, | July 31, | July 31, | July 31, | ||||||||||||||||
| 2021 | 2020 | 2019 | 2018 | 2017 | ||||||||||||||||
| Net asset value, beginning of year | $ | 12.86 | $ | 13.44 | $ | 13.83 | $ | 13.02 | $ | 12.20 | ||||||||||
| Activity from investment operations: | ||||||||||||||||||||
| Net investment income (1) | 0.03 | 0.08 | 0.10 | 0.07 | 0.09 | |||||||||||||||
| Net realized and unrealized gain (loss) on investments | 2.30 | (0.33 | ) | (0.00 | ) (6) | 1.47 | 0.88 | |||||||||||||
| Total from investment operations | 2.33 | (0.25 | ) | 0.10 | 1.54 | 0.97 | ||||||||||||||
| Less distributions from: | ||||||||||||||||||||
| Net investment income | (0.04 | ) | (0.09 | ) | (0.12 | ) | (0.11 | ) | (0.12 | ) | ||||||||||
| Net realized gains | (0.02 | ) | (0.22 | ) | (0.37 | ) | (0.62 | ) | (0.03 | ) | ||||||||||
| Return of capital | — | (0.02 | ) | — | — | — | ||||||||||||||
| Total distributions | (0.06 | ) | (0.33 | ) | (0.49 | ) | (0.73 | ) | (0.15 | ) | ||||||||||
| Net asset value, end of year | $ | 15.13 | $ | 12.86 | $ | 13.44 | $ | 13.83 | $ | 13.02 | ||||||||||
| Total return (2) | 18.20 | % | (2.02 | )% | 1.25 | % | 12.07 | % | 7.99 | % | ||||||||||
| Net assets, at end of year (000s) | $ | 11,834 | $ | 14,089 | $ | 17,290 | $ | 16,333 | $ | 11,372 | ||||||||||
| Ratio of gross expenses to average net assets (3)(4) | 1.59 | % | 1.53 | % | 1.50 | % | 1.59 | % | 1.68 | % | ||||||||||
| Ratio of net expenses to average net assets (4) | 1.40 | % | 1.40 | % | 1.40 | % | 1.40 | % | 1.44 | % | ||||||||||
| Ratio of net investment income to average net assets (5) | 0.21 | % | 0.63 | % | 0.76 | % | 0.49 | % | 0.74 | % | ||||||||||
| Portfolio Turnover Rate | 111 | % | 116 | % | 79 | % | 52 | % | 78 | % | ||||||||||
| (1) | Per share amounts calculated using the average shares method, which more appropriately presents the per share data for the period. |
| (2) | Total returns shown exclude the effect of applicable sales charges. |
| (3) | Represents the ratio of expenses to average net assets absent fee waivers and/or expense reimbursements by the advisor and affiliates. |
| (4) | Does not include the expenses of other investment companies in which the Fund invests. |
| (5) | Recognition of net investment income by the Fund is affected by the timing of the declaration of dividends by the underlying investment companies in which the Fund invests. |
| (6) | Amount represents less than $0.01 per share. |
See accompanying notes to financial statements.
19
| The Astor Funds |
| FINANCIAL HIGHLIGHTS |
Per Share Data and Ratios for a Share of Beneficial Interest Outstanding Throughout Each Year Presented
| Astor Dynamic Allocation Fund Class C | ||||||||||||||||||||
| Year Ended | Year Ended | Year Ended | Year Ended | Year Ended | ||||||||||||||||
| July 31, | July 31, | July 31, | July 31, | July 31, | ||||||||||||||||
| 2021 | 2020 | 2019 | 2018 | 2017 | ||||||||||||||||
| Net asset value, beginning of year | $ | 12.26 | $ | 12.87 | $ | 13.30 | $ | 12.60 | $ | 11.83 | ||||||||||
| Activity from investment operations: | ||||||||||||||||||||
| Net investment loss (1) | (0.08 | ) | (0.02 | ) | (0.00 | ) (6) | (0.04 | ) | (0.00 | ) (6) | ||||||||||
| Net realized and unrealized gain (loss) on investments | 2.19 | (0.32 | ) | (0.00 | ) (6) | 1.42 | 0.85 | |||||||||||||
| Total from investment operations | 2.11 | (0.34 | ) | (0.00 | ) (6) | 1.38 | 0.85 | |||||||||||||
| Less distributions from: | ||||||||||||||||||||
| Net Investment income | (0.02 | ) | (0.03 | ) | (0.06 | ) | (0.06 | ) | (0.05 | ) | ||||||||||
| Net realized gains | (0.02 | ) | (0.22 | ) | (0.37 | ) | (0.62 | ) | (0.03 | ) | ||||||||||
| Return of capital | — | (0.02 | ) | — | — | — | ||||||||||||||
| Total distributions | (0.04 | ) | (0.27 | ) | (0.43 | ) | (0.68 | ) | (0.08 | ) | ||||||||||
| Net asset value, end of year | $ | 14.33 | $ | 12.26 | $ | 12.87 | $ | 13.30 | $ | 12.60 | ||||||||||
| Total return (2) | 17.25 | % | (2.74 | )% | 0.51 | % | 11.19 | % | 7.21 | % | ||||||||||
| Net assets, at end of year (000s) | $ | 31,288 | $ | 33,278 | $ | 30,916 | $ | 26,293 | $ | 20,587 | ||||||||||
| Ratio of gross expenses to average net assets (3)(4) | 2.34 | % | 2.28 | % | 2.25 | % | 2.34 | % | 2.43 | % | ||||||||||
| Ratio of net expenses to average net assets (4) | 2.15 | % | 2.15 | % | 2.15 | % | 2.15 | % | 2.19 | % | ||||||||||
| Ratio of net investment income (loss) to average net assets (5) | (0.55 | )% | (0.14 | )% | 0.02 | % | (0.28 | )% | (0.03 | )% | ||||||||||
| Portfolio Turnover Rate | 111 | % | 116 | % | 79 | % | 52 | % | 78 | % | ||||||||||
| (1) | Per share amounts calculated using the average shares method, which more appropriately presents the per share data for the period. |
| (2) | Total returns shown exclude the effect of applicable sales charges and redemption fees. |
| (3) | Represents the ratio of expenses to average net assets absent fee waivers and/or expense reimbursements by the advisor and affiliates. |
| (4) | Does not include the expenses of other investment companies in which the Fund invests. |
| (5) | Recognition of net investment income (loss) by the Fund is affected by the timing of the declaration of dividends by the underlying investment companies in which the Fund invests. |
| (6) | Amount represents less than $0.01 per share. |
See accompanying notes to financial statements.
20
| The Astor Funds |
| FINANCIAL HIGHLIGHTS |
Per Share Data and Ratios for a Share of Beneficial Interest Outstanding Throughout Each Year Presented
| Astor Dynamic Allocation Fund Class I | ||||||||||||||||||||
| Year Ended | Year Ended | Year Ended | Year Ended | Year Ended | ||||||||||||||||
| July 31, | July 31, | July 31, | July 31, | July 31, | ||||||||||||||||
| 2021 | 2020 | 2019 | 2018 | 2017 | ||||||||||||||||
| Net asset value, beginning of year | $ | 12.90 | $ | 13.47 | $ | 13.86 | $ | 13.04 | $ | 12.21 | ||||||||||
| Activity from investment operations: | ||||||||||||||||||||
| Net investment income (1) | 0.06 | 0.11 | 0.14 | 0.10 | 0.12 | |||||||||||||||
| Net realized and unrealized gain (loss) on investments | 2.31 | (0.33 | ) | (0.01 | ) | 1.47 | 0.88 | |||||||||||||
| Total from investment operations | 2.37 | (0.22 | ) | 0.13 | 1.57 | 1.00 | ||||||||||||||
| Less distributions from: | ||||||||||||||||||||
| Net investment income | (0.07 | ) | (0.10 | ) | (0.15 | ) | (0.13 | ) | (0.14 | ) | ||||||||||
| Net realized gains | (0.02 | ) | (0.22 | ) | (0.37 | ) | (0.62 | ) | (0.03 | ) | ||||||||||
| Return of capital | — | (0.03 | ) | — | — | — | ||||||||||||||
| Total distributions | (0.09 | ) | (0.35 | ) | (0.52 | ) | (0.75 | ) | (0.17 | ) | ||||||||||
| Net asset value, end of year | $ | 15.18 | $ | 12.90 | $ | 13.47 | $ | 13.86 | $ | 13.04 | ||||||||||
| Total return (2) | 18.49 | % | (1.74 | )% | 1.47 | % | 12.31 | % | 8.32 | % | ||||||||||
| Net assets, at end of year (000s) | $ | 114,744 | $ | 180,929 | $ | 177,450 | $ | 157,874 | $ | 101,006 | ||||||||||
| Ratio of gross expenses to average net assets (3)(4) | 1.34 | % | 1.28 | % | 1.25 | % | 1.34 | % | 1.43 | % | ||||||||||
| Ratio of net expenses to average net assets (4) | 1.15 | % | 1.15 | % | 1.15 | % | 1.15 | % | 1.19 | % | ||||||||||
| Ratio of net investment income to average net assets (5) | 0.45 | % | 0.86 | % | 1.03 | % | 0.70 | % | 0.97 | % | ||||||||||
| Portfolio Turnover Rate | 111 | % | 116 | % | 79 | % | 52 | % | 78 | % | ||||||||||
| (1) | Per share amounts calculated using the average shares method, which more appropriately presents the per share data for the period. |
| (2) | Total returns shown exclude the effect of applicable sales charges and redemption fees. |
| (3) | Represents the ratio of expenses to average net assets absent fee waivers and/or expense reimbursements by the advisor and affiliates. |
| (4) | Does not include the expenses of other investment companies in which the Fund invests. |
| (5) | Recognition of net investment income by the Fund is affected by the timing of the declaration of dividends by the underlying investment companies in which the Fund invests. |
See accompanying notes to financial statements.
21
| The Astor Funds |
| FINANCIAL HIGHLIGHTS |
Per Share Data and Ratios for a Share of Beneficial Interest Outstanding Throughout Each Year Presented
| Astor Sector Allocation Fund Class A | ||||||||||||||||||||
| Year Ended | Year Ended | Year Ended | Year Ended | Year Ended | ||||||||||||||||
| July 31, | July 31, | July 31, | July 31, | July 31, | ||||||||||||||||
| 2021 | 2020 | 2019 | 2018 | 2017 | ||||||||||||||||
| Net asset value, beginning of year | $ | 14.08 | $ | 15.57 | $ | 18.31 | $ | 16.28 | $ | 14.64 | ||||||||||
| Activity from investment operations: | ||||||||||||||||||||
| Net investment income (1) | 0.02 | 0.06 | 0.07 | 0.03 | 0.01 | |||||||||||||||
| Net realized and unrealized gain (loss) on investments | 4.18 | (0.04 | ) | (0.48 | ) | 2.11 | 1.63 | |||||||||||||
| Total from investment operations | 4.20 | 0.02 | (0.41 | ) | 2.14 | 1.64 | ||||||||||||||
| Less distributions from: | ||||||||||||||||||||
| Net investment income | (0.05 | ) | (0.02 | ) | (0.04 | ) | — | — | ||||||||||||
| Net realized gains | — | (1.49 | ) | (2.29 | ) | (0.11 | ) | — | ||||||||||||
| Total distributions | (0.05 | ) | (1.51 | ) | (2.33 | ) | (0.11 | ) | — | |||||||||||
| Net asset value, end of year | $ | 18.23 | $ | 14.08 | $ | 15.57 | $ | 18.31 | $ | 16.28 | ||||||||||
| Total return (2) | 29.87 | % | (0.23 | )% | 0.66 | % | 13.19 | % | 11.20 | % | ||||||||||
| Net assets, at end of year (000s) | $ | 7,790 | $ | 8,148 | $ | 10,934 | $ | 15,077 | $ | 17,588 | ||||||||||
| Ratio of gross expenses to average net assets (3)(4) | 2.05 | % | 1.94 | % | 1.66 | % | 1.69 | % | 1.68 | % | ||||||||||
| Ratio of net expenses to average net assets (4) | 1.40 | % | 1.40 | % | 1.40 | % | 1.40 | % | 1.44 | % | ||||||||||
| Ratio of net investment income to average net assets (5) | 0.12 | % | 0.43 | % | 0.44 | % | 0.15 | % | 0.07 | % | ||||||||||
| Portfolio Turnover Rate | 166 | % | 119 | % | 138 | % | 66 | % | 82 | % | ||||||||||
| (1) | Per share amounts calculated using the average shares method, which more appropriately presents the per share data for the period. |
| (2) | Total returns shown exclude the effect of applicable sales charges. |
| (3) | Represents the ratio of expenses to average net assets absent fee waivers and/or expense reimbursements by the advisor and affiliates. |
| (4) | Does not include the expenses of other investment companies in which the Fund invests. |
| (5) | Recognition of net investment income by the Fund is affected by the timing of the declaration of dividends by the underlying investment companies in which the Fund invests. |
See accompanying notes to financial statements.
22
| The Astor Funds |
| FINANCIAL HIGHLIGHTS |
Per Share Data and Ratios for a Share of Beneficial Interest Outstanding Throughout Each Year Presented
| Astor Sector Allocation Fund Class C | ||||||||||||||||||||
| Year Ended | Year Ended | Year Ended | Year Ended | Year Ended | ||||||||||||||||
| July 31, | July 31, | July 31, | July 31, | July 31, | ||||||||||||||||
| 2021 | 2020 | 2019 | 2018 | 2017 | ||||||||||||||||
| Net asset value, beginning of year | $ | 13.07 | $ | 14.64 | $ | 17.46 | $ | 15.64 | $ | 14.18 | ||||||||||
| Activity from investment operations: | ||||||||||||||||||||
| Net investment loss (1) | (0.09 | ) | (0.04 | ) | (0.05 | ) | (0.10 | ) | (0.10 | ) | ||||||||||
| Net realized and unrealized gain (loss) on investments | 3.86 | (0.04 | ) | (0.48 | ) | 2.03 | 1.56 | |||||||||||||
| Total from investment operations | 3.77 | (0.08 | ) | (0.53 | ) | 1.93 | 1.46 | |||||||||||||
| Less distributions from: | ||||||||||||||||||||
| Net investment income | (0.02 | ) | — | (0.00 | ) (6) | — | — | |||||||||||||
| Net realized gains | — | (1.49 | ) | (2.29 | ) | (0.11 | ) | — | ||||||||||||
| Total distributions | (0.02 | ) | (1.49 | ) | (2.29 | ) | (0.11 | ) | — | |||||||||||
| Net asset value, end of year | $ | 16.82 | $ | 13.07 | $ | 14.64 | $ | 17.46 | $ | 15.64 | ||||||||||
| Total return (2) | 28.89 | % | (0.97 | )% | (0.09 | )% | 12.38 | % | 10.30 | % | ||||||||||
| Net assets, at end of year (000s) | $ | 12,667 | $ | 13,515 | $ | 20,213 | $ | 28,201 | $ | 31,799 | ||||||||||
| Ratio of gross expenses to average net assets (3)(4) | 2.80 | % | 2.69 | % | 2.41 | % | 2.44 | % | 2.43 | % | ||||||||||
| Ratio of net expenses to average net assets (4) | 2.15 | % | 2.15 | % | 2.15 | % | 2.15 | % | 2.19 | % | ||||||||||
| Ratio of net investment loss to average net assets (5) | (0.64 | )% | (0.30 | )% | (0.32 | )% | (0.61 | )% | (0.68 | )% | ||||||||||
| Portfolio Turnover Rate | 166 | % | 119 | % | 138 | % | 66 | % | 82 | % | ||||||||||
| (1) | Per share amounts calculated using the average shares method, which more appropriately presents the per share data for the period. |
| (2) | Total returns shown exclude the effect of applicable sales charges. |
| (3) | Represents the ratio of expenses to average net assets absent fee waivers and/or expense reimbursements by the advisor and affiliates. |
| (4) | Does not include the expenses of other investment companies in which the Fund invests. |
| (5) | Recognition of net investment loss by the Fund is affected by the timing of the declaration of dividends by the underlying investment companies in which the Fund invests. |
| (6) | Amount represents less than $0.01 per share. |
See accompanying notes to financial statements.
23
| The Astor Funds |
| FINANCIAL HIGHLIGHTS |
Per Share Data and Ratios for a Share of Beneficial Interest Outstanding Throughout Each Year Presented
| Astor Sector Allocation Fund Class I | ||||||||||||||||||||
| Year Ended | Year Ended | Year Ended | Year Ended | Year Ended | ||||||||||||||||
| July 31, | July 31, | July 31, | July 31, | July 31, | ||||||||||||||||
| 2021 | 2020 | 2019 | 2018 | 2017 | ||||||||||||||||
| Net asset value, beginning of year | $ | 14.30 | $ | 15.77 | $ | 18.48 | $ | 16.40 | $ | 14.72 | ||||||||||
| Activity from investment operations: | ||||||||||||||||||||
| Net investment income (1) | 0.05 | 0.11 | 0.11 | 0.07 | 0.05 | |||||||||||||||
| Net realized and unrealized gain (loss) on investments | 4.25 | (0.05 | ) | (0.47 | ) | 2.13 | 1.63 | |||||||||||||
| Total from investment operations | 4.30 | 0.06 | (0.36 | ) | 2.20 | 1.68 | ||||||||||||||
| Less distributions from: | ||||||||||||||||||||
| Net investment income | (0.06 | ) | (0.04 | ) | (0.06 | ) | (0.01 | ) | — | |||||||||||
| Net realized gains | — | (1.49 | ) | (2.29 | ) | (0.11 | ) | — | ||||||||||||
| Total distributions | (0.06 | ) | (1.53 | ) | (2.35 | ) | (0.12 | ) | — | |||||||||||
| Net asset value, end of year | $ | 18.54 | $ | 14.30 | $ | 15.77 | $ | 18.48 | $ | 16.40 | ||||||||||
| Total return (2) | 30.18 | % | 0.03 | % | 0.97 | % | 13.47 | % | 11.41 | % | ||||||||||
| Net assets, at end of year (000s) | $ | 10,381 | $ | 10,711 | $ | 19,528 | $ | 32,230 | $ | 30,526 | ||||||||||
| Ratio of gross expenses to average net assets (3)(4) | 1.80 | % | 1.69 | % | 1.41 | % | 1.44 | % | 1.43 | % | ||||||||||
| Ratio of net expenses to average net assets (4) | 1.15 | % | 1.15 | % | 1.15 | % | 1.15 | % | 1.19 | % | ||||||||||
| Ratio of net investment income to average net assets (5) | 0.36 | % | 0.74 | % | 0.68 | % | 0.40 | % | 0.31 | % | ||||||||||
| Portfolio Turnover Rate | 166 | % | 119 | % | 138 | % | 66 | % | 82 | % | ||||||||||
| (1) | Per share amounts calculated using the average shares method, which more appropriately presents the per share data for the period. |
| (2) | Total returns shown exclude the effect of applicable sales charges. |
| (3) | Represents the ratio of expenses to average net assets absent fee waivers and/or expense reimbursements by the advisor and affiliates. |
| (4) | Does not include the expenses of other investment companies in which the Fund invests. |
| (5) | Recognition of net investment income by the Fund is affected by the timing of the declaration of dividends by the underlying investment companies in which the Fund invests. |
See accompanying notes to financial statements.
24
| The Astor Funds |
| CONSOLIDATED FINANCIAL HIGHLIGHTS |
Per Share Data and Ratios for a Share of Beneficial Interest Outstanding Throughout the Period Presented
| Astor Macro Alternative Fund Class A | ||||
| Period Ended | ||||
| July 31, | ||||
| 2021 (1) | ||||
| Net asset value, beginning of period | $ | 12.33 | ||
| Activity from investment operations: | ||||
| Net investment income (loss) (2) | (0.03 | ) | ||
| Net realized and unrealized gain (loss) on investments | 0.07 | |||
| Total from investment operations | 0.04 | |||
| Net asset value, end of period | $ | 12.37 | ||
| Total return (3) | 0.32 | % (7) | ||
| Net assets, at end of period (000s) | $ | 136 | ||
| Ratio of gross expenses to average net assets (4)(5) | 2.46 | % (8) | ||
| Ratio of net expenses to average net assets (5) | 2.00 | % (8) | ||
| Ratio of net investment income (loss) to average net assets (6) | (0.80 | )% (8) | ||
| Portfolio Turnover Rate | 270 | % (7) | ||
| (1) | The inception date of the Astor Macros Alternative Fund Class A shares was February 24, 2021. |
| (2) | Per share amounts calculated using the average shares method, which more appropriately presents the per share data for the period. |
| (3) | Total returns shown exclude the effect of applicable sales charges. |
| (4) | Represents the ratio of expenses to average net assets absent fee waivers and/or expense reimbursements by the advisor and affiliates. |
| (5) | Does not include the expenses of other investment companies in which the Fund invests. |
| (6) | Recognition of net investment income (loss) by the Fund is affected by the timing of the declaration of dividends by the underlying investment companies in which the Fund invests. |
| (7) | Not annualized. |
| (8) | Annualized. |
See accompanying notes to financial statements.
25
| The Astor Funds |
| CONSOLIDATED FINANCIAL HIGHLIGHTS |
Per Share Data and Ratios for a Share of Beneficial Interest Outstanding Throughout Each Year Presented
| Astor Macro Alternative Fund Class I | ||||||||||||||||||||
| Year Ended | Year Ended | Year Ended | Year Ended | Year Ended | ||||||||||||||||
| July 31, | July 31, | July 31, | July 31, | July 31, | ||||||||||||||||
| 2021 | 2020 | 2019 | 2018 | 2017 | ||||||||||||||||
| Net asset value, beginning of year | $ | 11.69 | $ | 11.89 | $ | 11.07 | $ | 10.34 | $ | 10.59 | ||||||||||
| Activity from investment operations: | ||||||||||||||||||||
| Net investment income (loss) (1) | (0.07 | ) | (0.06 | ) | (0.05 | ) | (0.04 | ) | 0.04 | |||||||||||
| Net realized and unrealized gain (loss) on investments | 0.99 | 1.14 | 1.25 | 1.10 | (0.01 | ) | ||||||||||||||
| Total from investment operations | 0.92 | 1.08 | 1.20 | 1.06 | 0.03 | |||||||||||||||
| Less distributions from: | ||||||||||||||||||||
| Net investment income | (0.11 | ) | (0.64 | ) | (0.11 | ) | (0.04 | ) | (0.18 | ) | ||||||||||
| Net realized gains | (0.12 | ) | (0.64 | ) | (0.27 | ) | (0.29 | ) | (0.10 | ) | ||||||||||
| Total distributions | (0.23 | ) | (1.28 | ) | (0.38 | ) | (0.33 | ) | (0.28 | ) | ||||||||||
| Net asset value, end of year | $ | 12.38 | $ | 11.69 | $ | 11.89 | $ | 11.07 | $ | 10.34 | ||||||||||
| Total return (2) | 7.94 | % | 9.93 | % | 11.54 | % | 10.38 | % | 0.35 | % | ||||||||||
| Net assets, at end of year (000s) | $ | 41,910 | $ | 13,546 | $ | 6,706 | $ | 7,206 | $ | 2,013 | ||||||||||
| Ratio of gross expenses to average net assets (3)(4) | 2.21 | % | 3.59 | % | 3.53 | % | 5.67 | % | 9.17 | % | ||||||||||
| Ratio of net expenses to average net assets (4) | 1.75 | % | 1.75 | % | 1.75 | % | 1.75 | % | 1.78 | % | ||||||||||
| Ratio of net investment income (loss) to average net assets (5) | (0.55 | )% | (0.52 | )% | (0.24 | )% | (0.40 | )% | 0.42 | % | ||||||||||
| Portfolio Turnover Rate | 270 | % | 302 | % | 190 | % | 194 | % | 114 | % | ||||||||||
| (1) | Per share amounts calculated using the average shares method, which more appropriately presents the per share data for the period. |
| (2) | Total returns shown exclude the effect of applicable sales charges. |
| (3) | Represents the ratio of expenses to average net assets absent fee waivers and/or expense reimbursements by the advisor and affiliates. |
| (4) | Does not include the expenses of other investment companies in which the Fund invests. |
| (5) | Recognition of net investment income (loss) by the Fund is affected by the timing of the declaration of dividends by the underlying investment companies in which the Fund invests. |
See accompanying notes to financial statements.
26
| The Astor Funds |
| NOTES TO FINANCIAL STATEMENTS AND CONSOLIDATED FINANCIAL STATEMENTS |
| July 31, 2021 |
| 1. | ORGANIZATION |
The Astor Dynamic Allocation Fund, the Astor Sector Allocation Fund, and Astor Macro Alternative Fund (each a “Fund” or collectively the “Funds”) are each a diversified series of shares of beneficial interest of Northern Lights Fund Trust (the “Trust”), a statutory trust organized under the laws of the State of Delaware on January 19, 2005, and registered under the Investment Company Act of 1940, as amended (the “1940 Act”), as an open-end management investment company. The Astor Dynamic Allocation Fund seeks total return through a combination of capital appreciation and income. The Astor Sector Allocation Fund seeks capital appreciation. The Astor Macro Alternative Fund seeks to provide positive returns over a market cycle regardless of market conditions or general market direction. The Astor Dynamic Allocation Fund commenced operations on October 19, 2009. The Astor Sector Allocation Fund commenced operations on November 30, 2011. The Astor Macro Alternative Fund commenced operations on June 22, 2015.
The Astor Dynamic Allocation Fund currently offers Class A, Class C, and Class I shares. Class C and Class I shares are offered at net asset value. Class A shares are offered at net asset value plus a maximum sales charge of 4.75%. The Astor Sector Allocation Fund currently offers Class A, Class C, and Class I shares. Class C and Class I shares are offered at net asset value and Class A shares are offered at net asset value plus a maximum sales charge of 4.75%. The Astor Macro Alternative Fund currently offers Class A and Class I shares. Class I shares are offered at net asset value and Class A shares are offered at net asset value plus a maximum sales charge of 4.75%. Each class represents an interest in the same assets of the respective Fund and classes of a Fund are identical except for differences in their sales charge structures and ongoing service and distribution charges. All classes of shares of a Fund have equal voting privileges except that each class has exclusive voting rights with respect to its service and/or distribution plans. Each Fund’s income, expenses (other than class specific distribution fees), and realized and unrealized gains and losses are allocated proportionately each day based upon the relative net assets of each class.
The consolidated financial statements of the Astor Macro Alternative Fund include the Astor Macro Alternative Fund and its wholly owned subsidiary AMA Fund Limited (“AMA”). AMA commenced operations on June 22, 2015 and is incorporated in the Cayman Islands as an exempted investment company with limited liability.
| 2. | SIGNIFICANT ACCOUNTING POLICIES |
The following is a summary of significant accounting policies followed by the Funds in preparation of their financial statements. The policies are in conformity with U.S. generally accepted accounting principles (“GAAP”). The preparation of the financial statements requires management to make estimates and assumptions that affect the reported amounts of assets and liabilities and disclosure of contingent assets and liabilities at the date of the financial statements and the reported amounts of income and expenses for the year then ended. Actual results could differ from those estimates. Each Fund is an investment company and accordingly follows the investment company accounting and reporting guidance of the Financial Accounting Standards Board (“FASB”) Accounting Standards Codification Topic 946 “Financial Services Investment Companies” including Accounting Standards Update (“ASU”) 2013-08.
27
| The Astor Funds |
| NOTES TO FINANCIAL STATEMENTS AND CONSOLIDATED FINANCIAL STATEMENTS (Continued) |
| July 31, 2021 |
Securities Valuation – Securities listed on an exchange are valued at the last reported sale price at the close of the regular trading session of the exchange on the business day the value is being determined or, in the case of securities listed on NASDAQ, at the NASDAQ Official Closing Price. In the absence of a sale, such securities shall be valued at the mean between the current bid and ask prices on the day of valuation. Debt securities (other than short-term obligations) are valued each day by an independent pricing service approved by the Trust’s Board of Trustees (the “Board”) using methods which include current market quotations from a major market maker in the securities and based on methods which include the consideration of yields or prices of securities of comparable quality, coupon, maturity and type. The independent pricing service does not distinguish between smaller-sized bond positions known as “odd lots” and larger institutional-sized bond positions known as “round lots”. A Fund may fair value a particular bond if the advisor does not believe that the round lot value provided by the independent pricing service reflects fair value of the Fund’s holding. Short-term debt obligations with remaining maturities in excess of sixty days are valued at current market prices by an independent pricing service approved by the Board. Short-term debt obligations having sixty days or less remaining until maturity, at time of purchase, may be valued at amortized cost.
The Funds may hold securities, such as private investments, interests in commodity pools, other non-traded securities or temporarily illiquid securities, for which market quotations are not readily available or are determined to be unreliable. These securities will be valued using the “fair value” procedures approved by the Board. The Board has delegated execution of these procedures to a fair value committee composed of one or more representatives from each of the (i) Trust, (ii) administrator, and (iii) advisor. The committee may also enlist third party consultants such as a valuation specialist at a public accounting firm, valuation consultant or financial officer of a security issuer on an as-needed basis to assist in determining a security-specific fair value. The Board has also engaged a third-party valuation firm to attend valuation meetings held by the Trust, review minutes of such meetings and report to the Board on a quarterly basis. The Board reviews and ratifies the execution of this process and the resultant fair value prices at least quarterly to assure the process produces reliable results.
Fair Valuation Process – As noted above, the fair value committee is composed of one or more representatives from each of the (i) Trust, (ii) administrator, and (iii) advisor. The applicable investments are valued collectively via inputs from each of these groups. For example, fair value determinations are required for the following securities: (i) securities for which market quotations are insufficient or not readily available on a particular business day (including securities for which there is a short and temporary lapse in the provision of a price by the regular pricing source); (ii) securities for which, in the judgment of the advisor or sub-advisor, the prices or values available do not represent the fair value of the instrument. Factors which may cause the advisor or sub-advisor to make such a judgment include, but are not limited to, the following: only a bid price or an asked price is available; the spread between bid and asked prices is substantial; the frequency of sales; the thinness of the market; the size of reported trades; and actions of the securities markets, such as the suspension or limitation of trading; (iii) securities determined to be illiquid; (iv) securities with respect to which an event that will affect the value thereof has occurred since the closing prices were established on the principal exchange on which they are traded, but prior to a Fund’s calculation of its NAV. Specifically, interests in commodity pools or managed futures pools are valued on a daily basis by reference to the closing market prices of each futures contract or other asset held by a pool, as adjusted for pool expenses. Restricted or illiquid securities, such as private investments or non-traded securities are valued via inputs from the advisor based upon the current bid for the security from two or more independent dealers or other parties reasonably familiar with the facts and circumstances of the security (who should take into consideration all relevant factors as may be appropriate under the circumstances). If the advisor is unable to obtain a current bid from such independent dealers or other independent parties, the fair value committee shall determine the fair value of such security using the following factors: (i) the type of security; (ii) the cost at date of purchase; (iii) the size and nature of a Fund’s holdings; (iv) the discount from market value of unrestricted securities of the same class at the time of purchase and subsequent thereto; (v) information as to any transactions or offers with respect to the security; (vi) the nature and duration of restrictions on disposition of the security and the existence of any registration rights; (vii) how the yield of the security compares to similar
28
| The Astor Funds |
| NOTES TO FINANCIAL STATEMENTS AND CONSOLIDATED FINANCIAL STATEMENTS (Continued) |
| July 31, 2021 |
securities of companies of similar or equal creditworthiness; (viii) the level of recent trades of similar or comparable securities; (ix) the liquidity characteristics of the security; (x) current market conditions; and (xi) the market value of any securities into which the security is convertible or exchangeable.
Valuation of Fund of Funds – The Funds may invest in portfolios of open-end or closed-end investment companies (the “Underlying Funds”). The Underlying Funds value securities in their portfolios for which market quotations are readily available at their market values (generally the last reported sale price) and all other securities and assets at their fair value to the methods established by the board of directors of the Underlying Funds.
Futures Contracts – The Astor Macro Alternative Fund may purchase or sell futures contracts to gain exposure to, or hedge against, changes in the value of equities, interest rates, foreign currencies, or commodities. Initial margin deposits required upon entering into futures contracts are satisfied by the segregation of specific securities or cash as collateral for the account of the broker (the Fund’s agent in acquiring the futures position). During the period the futures contracts are open, changes in the value of the contracts are recognized as unrealized gains or losses by “marking to market” on a daily basis to reflect the market value of the contracts at the end of each day’s trading. Variation margin payments are received or made depending upon whether unrealized gains or losses are incurred. When the contracts are closed, the Fund recognizes a realized gain or loss equal to the difference between the proceeds from, or cost of, the closing transaction and the Fund’s basis in the contract. If the Fund was unable to liquidate a futures contract and/or enter into an offsetting closing transaction, the Fund would continue to be subject to market risk with respect to the value of the contracts and continue to be required to maintain the margin deposits on the futures contracts. The Fund segregates liquid securities having a value at least equal to the amount of the current obligation under any open futures contract. Risks may exceed amounts recognized in the consolidated statement of assets and liabilities. With futures, there is minimal counterparty credit risk to the Fund since futures are exchange traded and the exchange’s clearinghouse, as counterparty to all exchange traded futures, guarantees the futures against default.
Valuation of Underlying Funds – Open-end investment companies are valued at their respective net asset values as reported by such investment companies. The shares of many closed-end investment companies, after their initial public offering, frequently trade at a price per share, which is different than the net asset value per share. The difference represents a market premium or market discount of such shares. There can be no assurances that the market discount or market premium on shares of any closed-end investment company purchased by the Funds will not change. Each Fund utilizes various methods to measure the fair value of all of its investments on a recurring basis.
GAAP establishes a hierarchy that prioritizes inputs to valuation methods. The three levels of inputs are:
Level 1 – Unadjusted quoted prices in active markets for identical assets and liabilities that the Funds have the ability to access.
Level 2 – Observable inputs other than quoted prices included in Level 1 that are observable for the asset or liability, either directly or indirectly. These inputs may include quoted prices for the identical instrument in an inactive market, prices for similar instruments, interest rates, prepayment speeds, credit risk, yield curves, default rates, and similar data.
Level 3 – Unobservable inputs for the asset or liability, to the extent relevant observable inputs are not available, representing the Funds’ own assumptions about the assumptions a market participant would use in valuing the asset or liability, and would be based on the best information available.
The availability of observable inputs can vary from security to security and is affected by a wide variety of factors, including, for example, the type of security, whether the security is new and not yet established in the marketplace, the liquidity of markets, and other characteristics particular to the security. To the extent that valuation is based on models or inputs that are less observable or unobservable in the market, the determination of fair value requires
29
| The Astor Funds |
| NOTES TO FINANCIAL STATEMENTS AND CONSOLIDATED FINANCIAL STATEMENTS (Continued) |
| July 31, 2021 |
more judgment. Accordingly, the degree of judgment exercised in determining fair value is greatest for instruments categorized in Level 3.
The inputs used to measure fair value may fall into different levels of the fair value hierarchy. In such cases, for disclosure purposes, the level in the fair value hierarchy within which the fair value measurement falls in its entirety, is determined based on the lowest level input that is significant to the fair value measurement in its entirety.
The inputs or methodology used for valuing securities are not necessarily an indication of the risk associated with investing in those securities. The following tables summarize the inputs used as of July 31, 2021, for the Funds’ assets and liabilities measured at fair value:
Astor Dynamic Allocation Fund
| Assets * | Level 1 | Level 2 | Level 3 | Total | ||||||||||||
| Exchange Traded Funds | $ | 155,538,870 | $ | — | $ | — | $ | 155,538,870 | ||||||||
| Money Market Fund | 2,594,859 | — | — | 2,594,859 | ||||||||||||
| Total | $ | 158,133,729 | $ | — | $ | — | $ | 158,133,729 | ||||||||
Astor Sector Allocation Fund
| Assets * | Level 1 | Level 2 | Level 3 | Total | ||||||||||||
| Exchange Traded Funds | $ | 30,352,381 | $ | — | $ | — | $ | 30,352,381 | ||||||||
| Money Market Fund | 518,513 | — | — | 518,513 | ||||||||||||
| Total | $ | 30,870,894 | $ | — | $ | — | $ | 30,870,894 | ||||||||
Astor Macro Alternative Fund
| Assets ** | Level 1 | Level 2 | Level 3 | Total | ||||||||||||
| Exchange Traded Funds | $ | 38,795,428 | $ | — | $ | — | $ | 38,795,428 | ||||||||
| Open futures contracts *** | 95,711 | — | — | 95,711 | ||||||||||||
| Short-Term Investment | 1,094,780 | — | — | 1,094,780 | ||||||||||||
| Total | $ | 39,985,919 | $ | — | $ | — | $ | 39,985,919 | ||||||||
The Funds did not hold any Level 2 or 3 securities during the period.
| * | Refer to the Schedule of Investments for classification by asset class. |
| ** | Refer to the Consolidated Schedule of Investments for classification by asset class. |
| *** | Includes cumulative net unrealized appreciation on futures contracts open at July 31, 2021. |
Consolidation of Subsidiaries – The consolidated financial statements of the Astor Macro Alternative Fund include AMA, a wholly-owned and controlled foreign corporation (“CFC”).
The Astor Macro Alternative Fund may invest up to 25% of its total assets in a CFC, which acts as an investment vehicle in order to effect certain investments consistent with the Astor Macro Alternative Fund’s investment objectives and policies. The Astor Macro Alternative Fund consolidates the results of subsidiaries in which the Astor Macro Alternative Fund holds a controlling economic interest. Controlling economic interest is generally deemed to exist with investment interests comprising greater than 50% of the net asset value of the subsidiary. However, the Astor Macro Alternative Fund may also consider qualitative aspects of control in determining if a controlling economic interest exists. These qualitative control considerations include the nature and organizational structure of the investment, as well as the Astor Macro Alternative Fund’s ability to control the circumstances leading to majority ownership. All significant inter-company accounts and transactions have been eliminated in consolidation.
30
| The Astor Funds |
| NOTES TO FINANCIAL STATEMENTS AND CONSOLIDATED FINANCIAL STATEMENTS (Continued) |
| July 31, 2021 |
A summary of the net assets of AMA is as follows:
| % of Astor Macro Alternative | ||||||
| Inception Date of | AMA Net Assets at | Fund’s Net Assets at | ||||
| AMA: | July 31, 2021 | July 31, 2021 | ||||
| 6/22/2015 | $ | 2,145,782 | 5.10% | |||
| The results from operations of AMA were as follows: | ||||
| Net investment loss | $ | (4,651 | ) | |
| Net realized gain | 196,447 | |||
| Net decrease in unrealized depreciation | (5,868 | ) | ||
| Net increase in net assets resulting from operations | $ | 185,928 | ||
For tax purposes, AMA is an exempted Cayman Islands investment company. AMA has received an undertaking from the government of the Cayman Islands exempting it from all local income, profits, and capital gains taxes. No such taxes are levied in the Cayman Islands at the present time. For U.S. income tax purposes, AMA is a CFC which generates and is allocated no income which is considered effectively connected with U.S. trade or business and as such is not subject to U.S. income tax. However, as a wholly-owned CFC, AMA’s net income and capital gain, to the extent of its earnings and profits, will be included each year in the Astor Macro Alternative Fund’s investment company taxable income.
In accordance with its investment objectives and through its exposure to the aforementioned managed futures program, the Astor Macro Alternative Fund may have increased or decreased exposure to one or more of the following risk factors defined below:
Commodity Risk – Commodity risk relates to the change in value of commodities or commodity indexes as they relate to increases or decreases in the commodities market. Commodities are physical assets that have tangible properties. Examples of these types of assets are crude oil, heating oil, metals, livestock, and agricultural products.
Credit Risk – Credit risk relates to the ability of the issuer to meet interest and principal payments, or both, as they come due. In general, lower-grade, higher-yield bonds are subject to credit risk to a greater extent than lower-yield, higher-quality bonds.
Currency Risk – Foreign exchange rate risk relates to the change in the U.S. dollar value of a security held that is denominated in a foreign currency. The U.S. dollar value of a foreign currency denominated security will decrease as the dollar appreciates against the currency, while the U.S. dollar value will increase as the dollar depreciates against the currency.
Fixed-Income Risk – When the Fund invests in fixed-income ETFs that invest in fixed-income securities, the value of your investment in the Fund will fluctuate with changes in interest rates. Typically, a rise in interest rates causes a decline in the value of the fixed-income securities owned by the Fund. In general, the market price of debt securities with longer maturities will increase or decrease more in response to changes in interest rates than shorter-term securities. Other risk factors impacting fixed-income securities include credit risk, maturity risk, market risk, extension or prepayment risk, illiquid security risks and investment-grade securities risk. These risks could affect the value of a particular investment by the Fund possibly causing the Fund’s share price and total return to be reduced and fluctuate more than other types of investments.
31
| The Astor Funds |
| NOTES TO FINANCIAL STATEMENTS AND CONSOLIDATED FINANCIAL STATEMENTS (Continued) |
| July 31, 2021 |
ETF Risk – Exchange-Traded Funds (“ETFs”) are subject to investment advisory fees and other expenses, which will be indirectly paid by the Fund. As a result, your cost of investing in the Fund will be higher than the cost of investing directly in ETFs and may be higher than other mutual funds that invest directly in stocks and bonds. ETFs are listed on national stock exchanges and are traded like stocks listed on an exchange. ETF shares may trade at a discount or a premium in market price if there is a limited market in such shares. ETFs are also subject to brokerage and other trading costs, which could result in greater expenses to the Fund. ETFs may employ leverage, which magnifies the changes in the value of the ETFs. Finally, because the value of ETF shares depends on the demand in the market, the advisor may not be able to liquidate the Fund’s holdings at the most optimal time, adversely affecting performance. If the Fund invests a significant portion of its assets in ETFs offered by one ETF sponsor, the Fund could be exposed to additional risks and losses if the sponsor’s ETFs fall out of favor in the marketplace and trading volumes cause the ETF’s market prices to decline.
You will indirectly bear fees and expenses charged by the ETFs in addition to the Fund’s direct fees and expenses. Additional risks of investing in ETFs are described below:
(a) Strategy Risk. Each ETF is subject to specific risks, depending on the nature of the ETF. These risks could include liquidity risk and sector risk, as well as risks associated with fixed-income securities.
(b) Net Asset Value and Market Price Risk. The market value of the ETF shares may differ from their net asset value. This difference in price may be due to the fact that the supply and demand in the market for ETF shares at any point in time is not always identical to the supply and demand in the market for the underlying basket of securities. Accordingly, there may be times when an ETF share trades at a premium or discount to its net asset value.
(c) Tracking Risk. Investment in the Fund should be made with the understanding that the ETFs in which the Fund invests will not be able to replicate exactly the performance of the indices they track because the total return generated by the securities will be reduced by transaction costs incurred in adjusting the actual balance of the securities. In addition, the ETFs in which the Fund invests will incur expenses not incurred by their applicable indices. Certain securities comprising the indices tracked by the ETFs may, from time to time, temporarily be unavailable, which may further impede the ability to track the applicable indices.
(d) Market Risk. The net asset value of the Fund will fluctuate based on changes in the value of the individual securities in which the Fund invests. The increasing interconnectivity between global economies and financial markets increases the likelihood that events or conditions in one region or financial market may adversely impact issuers in a different country, region or financial market. Securities in the Fund’s portfolio may underperform due to inflation (or expectations for inflation), interest rates, global demand for particular products or resources, natural disasters, pandemics, epidemics, terrorism, regulatory events and governmental or quasi-governmental actions. The occurrence of global events similar to those in recent years may result in market volatility and may have long term effects on both the U.S. and global financial markets. The current novel coronavirus (COVID-19) global pandemic and the aggressive responses taken by many governments, including closing borders, restricting international and domestic travel, and the imposition of prolonged quarantines or similar restrictions, as well as the forced or voluntary closure of, or operational changes to, many retail and other businesses, has had negative impacts, and in many cases severe negative impacts, on markets worldwide. It is not known how long such impacts, or any future impacts of other significant events described above, will or would last, but there could be a prolonged period of global economic slowdown, which may impact your Fund investment.
Security Transactions and Related Income – Security transactions are accounted for on the trade date. Interest income is recognized on an accrual basis. Discounts are accreted and premiums are amortized on securities purchased over the lives of the respective securities using the effective interest method. Dividend income is recorded on the ex-dividend date. Realized gains or losses from sales of securities are determined by comparing the identified cost of the security lot sold with the net sales proceeds.
32
| The Astor Funds |
| NOTES TO FINANCIAL STATEMENTS AND CONSOLIDATED FINANCIAL STATEMENTS (Continued) |
| July 31, 2021 |
Dividends and Distributions to Shareholders – Dividends from net investment income, if any, are declared and paid quarterly for the Astor Dynamic Allocation Fund, the Astor Sector Allocation Fund, and the Astor Macro Alternative Fund. Distributable net realized capital gains, if any, are declared and distributed annually. Dividends from net investment income and distributions from net realized gains are determined in accordance with federal income tax regulations, which may differ from GAAP. These “book/tax” differences are considered either temporary (i.e., deferred losses, capital loss carry forwards) or permanent in nature. To the extent these differences are permanent in nature, such amounts are reclassified within the composition of net assets based on their federal tax-basis treatment; temporary differences do not require reclassification. Dividends and distributions to shareholders are recorded on the ex-dividend date.
Expenses – Expenses of the Trust that are directly identifiable to a specific Fund are charged to that Fund. Expenses, which are not readily identifiable to a specific Fund, are allocated in such a manner as deemed equitable, taking into consideration the nature and type of expense and the relative sizes of the Funds in the Trust.
Federal Income Taxes – Each Fund complies with the requirements of the Internal Revenue Code applicable to regulated investment companies and intends to distribute all of its taxable income to its shareholders. Therefore, no provision for federal income tax is required. The Funds recognize the tax benefits of uncertain tax positions only where the position is “more likely than not” to be sustained assuming examination by tax authorities. Management has analyzed the Funds’ tax positions and has concluded that no liability for unrecognized tax benefits should be recorded related to uncertain tax positions taken on returns filed for open tax years July 31, 2018 – July 31, 2020, or expected to be taken in the Funds’ July 31, 2021 tax returns. The Funds identified their major tax jurisdictions as U.S. federal, Ohio and foreign jurisdictions where the Funds make significant investments; however, the Funds are not aware of any tax positions for which it is reasonably possible that the total amounts of unrecognized tax benefits will change materially in the next twelve months.
The Funds recognize interest and penalties, if any, related to unrecognized tax benefits as income tax expense in the Statements of Operations. During the year, the Funds did not incur any interest or penalties.
Exchange Traded Funds – The Funds may invest in ETFs. ETFs are a type of fund bought and sold on a securities exchange. An ETF trades like common stock and represents a fixed portfolio of securities. The risks of owning an ETF generally reflect the risks of owning the underlying securities they are designed to track, although the lack of liquidity on an ETF could result in it being more volatile. Additionally, ETFs have fees and expenses that reduce their value.
Impact of Derivatives on the Consolidated Statement of Assets and Liabilities and Consolidated Statement of Operations
The following is a summary of the location of derivative investments on the Astor Macro Alternative Fund’s Consolidated Statement of Assets and Liabilities as of July 31, 2021.
| Contract Type/Primary Risk Exposure | Balance Sheet Location | Unrealized Appreciation (Depreciation) | ||||
| Commodity Risk | Net unrealized appreciation on futures contracts | $ | (23,906 | ) | ||
| Foreign Exchange Rate Risk | Net unrealized depreciation on futures contracts | (22,631 | ) | |||
| Interest Risk | Net unrealized appreciation on futures contracts | 142,248 | ||||
| Total | $ | 95,711 | ||||
33
| The Astor Funds |
| NOTES TO FINANCIAL STATEMENTS AND CONSOLIDATED FINANCIAL STATEMENTS (Continued) |
| July 31, 2021 |
The following is a summary of the location of derivative investments on the Astor Macro Alternative Fund’s Consolidated Statement of Operations for the year ended July 31, 2021:
| Realized and Unrealized Gain | ||||||||
| Location of Gain (Loss) on | (Loss) on Derivatives recognized | |||||||
| Derivative Investment Type | Primary Risk Exposure | Derivatives recognized in income | in income | |||||
| Futures Contracts | Commodity Risk | Net realized loss from futures transactions | $ | (380,467 | ) | |||
| Equity Risk | Net realized loss from futures transactions | (191,882 | ) | |||||
| Foreign Exchange Rate Risk | Net realized gain from futures transactions | 254,711 | ||||||
| Interest Risk | Net realized gain from futures transactions | 512,375 | ||||||
| Total | $ | 194,737 | ||||||
| Futures Contracts | Commodity Risk | Net change in unrealized depreciation on futures contracts | $ | (1,469 | ) | |||
| Foreign Exchange Rate Risk | Net change in unrealized depreciation on futures contracts | (122,881 | ) | |||||
| Interest Risk | Net change in unrealized appreciation on futures contracts | 127,238 | ||||||
| Total | $ | 2,888 | ||||||
The amounts of realized and changes in unrealized gains and losses on derivative instruments during the period as disclosed in the Consolidated Statement of Operations serve as indicators of the volume of derivative activity for the Astor Macro Alternative Fund.
Offsetting of Financial Assets and Derivative Assets
The Astor Macro Alternative Fund’s policy is to recognize a net asset or liability equal to the unrealized gain (loss) on futures contracts. The following table shows additional information regarding the offsetting of assets and liabilities at July 31, 2021 for the Astor Macro Alternative Fund.
34
| The Astor Funds |
| NOTES TO FINANCIAL STATEMENTS AND CONSOLIDATED FINANCIAL STATEMENTS (Continued) |
| July 31, 2021 |
Astor Macro Alternative Fund
| Gross Amounts Not Offset in the | ||||||||||||||||||||||||
| Consolidated Statement of Assets & | ||||||||||||||||||||||||
| Assets: | Liabilities | |||||||||||||||||||||||
| Gross Amounts Offset | Net Amounts of Assets | |||||||||||||||||||||||
| Gross Amounts | in the Consolidated | Presented in the | ||||||||||||||||||||||
| of Recognized | Statement of Assets & | Consolidated Statement | Financial | Cash Collateral | ||||||||||||||||||||
| Description | Assets | Liabilities | of Assets & Liabilities | Instruments | Pledged | Net Amount | ||||||||||||||||||
| Futures Contracts | $ | 408,399 | $ | (312,688 | ) | $ | 95,711 | $ | — | $ | — | $ | 95,711 | |||||||||||
| Total | $ | 408,399 | $ | (312,688 | ) | $ | 95,711 | $ | — | $ | — | $ | 95,711 | |||||||||||
| Liabilities: | Net Amounts of | |||||||||||||||||||||||
| Gross Amounts Offset | Liabilities Presented in | |||||||||||||||||||||||
| Gross Amounts | in the Consolidated | the Consolidated | ||||||||||||||||||||||
| of Recognized | Statement of Assets & | Statement of Assets & | Financial | Cash Collateral | ||||||||||||||||||||
| Description | Liabilities | Liabilities | Liabilities | Instruments | Received | Net Amount | ||||||||||||||||||
| Futures Contracts | $ | (312,688 | ) | $ | 312,688 | $ | — | $ | — | $ | — | $ | — | |||||||||||
| Total | $ | (312,688 | ) | $ | 312,688 | $ | — | $ | — | $ | — | $ | — | |||||||||||
Indemnification – The Trust indemnifies its officers and trustees for certain liabilities that may arise from the performance of their duties to the Trust. Additionally, in the normal course of business, the Funds enter into contracts that contain a variety of representations and warranties and which provide general indemnities. The Funds’ maximum exposure under these arrangements is unknown, as this would involve future claims that may be made against the Funds that have not yet occurred. However, based on experience, the Funds expect the risk of loss due to these warranties and indemnities to be remote.
Security Loans – The Astor Dynamic Allocation Fund and the Astor Sector Allocation Fund have entered into a securities lending arrangement with BNP Paribas (the “Borrower”). Under the terms of the agreement, the Funds are authorized to loan securities to the Borrower. In exchange, the Funds receive cash collateral in the amount of at least 102% of the value of the securities loaned. Although risk is mitigated by the collateral, the Funds could experience a delay in recovering their securities and possible loss of income or value if the Borrower fails to return them.
Gain or loss in the fair value of securities loaned that may occur during the term of the loan will be for the account of each Fund. Each Fund has the right under the securities lending agreement to recover the securities from the Borrower on demand. If the fair value of the collateral falls below 102% plus accrued interest of the loaned securities, the lender’s agent shall request additional collateral from the Borrower to bring the collateralization back to 102%. Under the terms of the securities lending agreement, each Fund is indemnified for such losses by the security lending agreement. Should the Borrower fail financially, the Funds have the right to repurchase the securities using the collateral in the open market.
There was no security lending for the Astor Dynamic Allocation Fund and the Astor Sector Allocation for the period ended July 31, 2021.
| 3. | INVESTMENT TRANSACTIONS |
For the year ended July 31, 2021, cost of purchases and proceeds from sales of portfolio securities, other than short-term investments and U.S. government securities, amounted to $191,572,405 and $290,390,114, respectively, for Astor Dynamic Allocation Fund, $50,348,824 and $59,157,520, respectively, for Astor Sector Allocation Fund, and $96,433,611 and $71,755,702, respectively, for the Astor Macro Alternative Fund.
35
| The Astor Funds |
| NOTES TO FINANCIAL STATEMENTS AND CONSOLIDATED FINANCIAL STATEMENTS (Continued) |
| July 31, 2021 |
| 4. | INVESTMENT ADVISORY AGREEMENT AND TRANSACTIONS WITH RELATED PARTIES |
Astor Investment Management, LLC (the “Advisor”) is the Funds’ investment advisor. Pursuant to an investment advisory agreement with the Trust, on behalf of the Funds (the “Advisory Agreement”), the Advisor, under the supervision of the Board, oversees the daily operations of the Funds and supervises the performance of administrative and professional services provided by others. As compensation for its services and the related expenses borne by the Advisor, the Advisor receives a management fee, computed and accrued daily and paid monthly, at an annual rate of 0.95% for the Astor Dynamic Allocation Fund and Astor Sector Allocation Fund’s average daily net assets and 1.45% of the Astor Macro Alternative Fund’s average daily net assets. The Advisor earned $1,664,124, $293,937 and $426,525 in management fees for the year ended July 31, 2021 from the Astor Dynamic Allocation Fund, Astor Sector Allocation Fund and Astor Macro Alternative Fund, respectively.
Pursuant to a written contract (the “Waiver Agreement”), the Advisor has agreed, at least until November 30, 2021, to waive a portion of its advisory fee and has agreed to reimburse the Funds for other expenses to the extent necessary so that the total expenses incurred by the Funds (excluding any front-end or contingent deferred loads; brokerage fees and commissions; acquired fund fees and expenses; borrowing costs (such as interest and dividend expense on securities sold short); taxes; and extraordinary expenses, such as litigation expenses (which may include indemnification of Fund officers and Trustees, contractual indemnification of Fund service providers, other than the Advisor) do not exceed 1.40%, 2.15% and 1.15% per annum of the Astor Dynamic Allocation Fund’s average daily net assets for Class A, Class C, and Class I shares, respectively, 1.40%, 2.15%, and 1.15% per annum of the Astor Sector Allocation Fund’s average daily net assets for Class A, Class C, and Class I shares, respectively, and 2.00% and 1.75% per annum of the Astor Macro Alternative Fund’s average daily net assets for Class A and Class I shares, respectively.
If the Advisor waives any fee or reimburses any expense pursuant to the Waiver Agreement, and any Fund’s operating expenses are subsequently lower than their respective expense limitation, the Advisor shall be entitled to reimbursement by the Fund(s). These fee waivers and expense reimbursements are subject to possible recoupment from the Fund(s) in future years (within the three years from the date when the amount is waived or reimbursed) if such recoupment can be achieved within the lesser of the foregoing expense limits or the then-current expense limits. The Board may terminate this expense reimbursement arrangement at any time.
During the year ended July 31, 2021, the Advisor waived fees reimbursed expenses of $325,638, $199,986, and $136,984 for the Astor Dynamic Allocation Fund, Astor Sector Allocation Fund, and the Astor Macro Alternative Fund, respectively, pursuant to the Waiver Agreement. As of July 31, 2021, the Advisor has waived/reimbursed expenses that may be recovered no later than July 31 of the year indicated below:
| Fund | 2022 | 2023 | 2024 | Total | ||||||||||||
| Astor Dynamic Allocation Fund | $ | 231,807 | $ | 300,499 | $ | 325,638 | $ | 857,944 | ||||||||
| Astor Sector Allocation Fund | 160,642 | 223,426 | 199,986 | 584,054 | ||||||||||||
| Astor Macro Alternative Fund | 128,651 | 137,175 | 136,984 | 402,810 | ||||||||||||
The Trust has adopted, on behalf of the Funds, the Trust’s Master Distribution and Shareholder Servicing Plans (the “Plans”) pursuant to Rule 12b-1 under the 1940 Act with respect to Class A and Class C shares of each Fund. The Plans provide that a monthly service and/or distribution fee is calculated by the Funds at an annual rate of 0.25% of the average daily net assets attributable to such Class A shares and 1.00% of the average daily net assets attributable to Class C shares and is paid to Northern Lights Distributors, LLC (the “Distributor” or “NLD”), to provide compensation for ongoing distribution-related activities or services and/or maintenance of the Funds’ shareholder accounts, not otherwise required to be provided by the Advisor. The Plans are compensation plans, which means that compensation is provided regardless of 12b-1 expenses incurred. The Astor Dynamic Allocation
36
| The Astor Funds |
| NOTES TO FINANCIAL STATEMENTS AND CONSOLIDATED FINANCIAL STATEMENTS (Continued) |
| July 31, 2021 |
Fund, Astor Sector Allocation Fund and Astor Macro Alternative Fund incurred $353,471, $147,740 and $106 in 12b-1 fees for the year ended July 31, 2021, respectively.
The Distributor acts as each Fund’s principal underwriter in a continuous public offering of the Funds’ Class A, Class C, and Class I shares. For the year ended July 31, 2021, $9,895, $4,077 and $6,148 were paid to the underwriter for the Astor Dynamic Allocation Fund, Astor Sector Allocation Fund and Astor Macro Alternative Fund, respectively. Of these amounts, $1,587, $622 and $894 were retained by the Astor Dynamic Allocation Fund and Astor Sector Allocation Fund and Astor Macro Alternative Fund, respectively. The Advisor incurs and pays for these fees for the benefit of the Funds.
In addition, certain affiliates of the Distributor provide services to the Funds as follows:
Gemini Fund Services, LLC (“GFS”), an affiliate of the Distributor, provides administration, fund accounting, and transfer agent services to the Trust. Pursuant to separate servicing agreements with GFS, the Funds pay GFS customary fees for providing administration, fund accounting and transfer agency services to the Funds. Certain officers of the Trust are also officers of GFS, and are not paid any fees directly by the Funds for serving in such capacities.
Northern Lights Compliance Services, LLC (“NLCS”), an affiliate of GFS and the Distributor, provides a Chief Compliance Officer to the Trust, as well as related compliance services, pursuant to a consulting agreement between NLCS and the Trust. Under the terms of such agreement, NLCS receives fees from the Funds.
Blu Giant, LLC (“Blu Giant”), an affiliate of GFS and the Distributor, provides EDGAR conversion and filing services as well as print management services for the Funds on an ad-hoc basis. For the provision of these services, Blu Giant receives fees from the Funds.
5. DISTRIBUTIONS TO SHAREHOLDERS AND TAX COMPONENTS OF CAPITAL
The below table represents aggregate cost for federal tax purposes, for the Funds as of July 31, 2021 and differs from market value by net unrealized appreciation/depreciation which consisted of:
| Gross Unrealized | Gross Unrealized | Total Unrealized | ||||||||||||||
| Fund | Aggregate Cost | Appreciation | Depreciation | Appreciation | ||||||||||||
| Astor Dynamic Allocation Fund | $ | 141,418,888 | $ | 17,421,636 | $ | (706,795 | ) | $ | 16,714,841 | |||||||
| Astor Sector Allocation Fund | 26,346,311 | 4,674,182 | (149,599 | ) | 4,524,583 | |||||||||||
| Astor Macro Alternative Fund | 39,654,867 | 1,396,391 | (1,065,339 | ) | 331,052 | |||||||||||
37
| The Astor Funds |
| NOTES TO FINANCIAL STATEMENTS AND CONSOLIDATED FINANCIAL STATEMENTS |
| (Continued) |
| July 31, 2021 |
The tax character of distributions paid during the fiscal years ended July 31, 2021 and July 31, 2020 was as follows:
| For fiscal year ended | Ordinary | Long-Term | Return of | Total | ||||||||||||
| July 31, 2021 | Income | Capital Gain | Capital | Distribution | ||||||||||||
| Astor Dynamic Allocation Fund | $ | 756,925 | $ | 304,534 | $ | — | $ | 1,061,459 | ||||||||
| Astor Sector Allocation Fund | 86,239 | — | — | 86,239 | ||||||||||||
| Astor Macro Alternative Fund | 331,071 | 207,046 | — | 538,117 | ||||||||||||
| For fiscal year ended | Ordinary | Long-Term | Return of | Total | ||||||||||||
| July 31, 2020 | Income | Capital Gain | Capital | Distribution | ||||||||||||
| Astor Dynamic Allocation Fund | $ | 1,637,455 | $ | 3,895,588 | $ | 432,947 | $ | 5,965,990 | ||||||||
| Astor Sector Allocation Fund | 52,118 | 4,453,592 | — | $ | 4,505,710 | |||||||||||
| Astor Macro Alternative Fund | 521,945 | 183,340 | — | $ | 705,285 | |||||||||||
The difference between ordinary distributions paid from book and ordinary distributions paid from tax relates to allowable foreign tax credits of $35,737 and $10,043 for fiscal year ended July 31, 2021 for the Astor Dynamic Allocation Fund and Astor Macro Alternative Fund, respectively, and $1,244 for the fiscal year ended July 31, 2020 for the Astor Macro Alternative Fund, which have been passed through to the Funds’ underlying shareholders and are deemed dividends for tax purposes.
As of July 31, 2021, the components of accumulated earnings on a tax basis were as follows:
| Undistributed | Undistributed | Post October Loss | Capital Loss | Other | Unrealized | Total | ||||||||||||||||||||||
| Ordinary | Long-Term | and | Carry | Book/Tax | Appreciation/ | Accumulated | ||||||||||||||||||||||
| Income | Capital Gains | Late Year Loss | Forwards | Differences | (Depreciation) | Earnings/(Deficits) | ||||||||||||||||||||||
| Astor Dynamic Allocation Fund | $ | 15,515,598 | $ | — | $ | — | $ | — | $ | — | $ | 16,714,841 | $ | 32,230,439 | ||||||||||||||
| Astor Sector Allocation Fund | 4,052,053 | 524,961 | (90,454 | ) | — | — | 4,524,583 | 9,011,143 | ||||||||||||||||||||
| Astor Macro Alternative Fund | 2,437,820 | — | (58,199 | ) | — | — | 332,674 | 2,712,295 | ||||||||||||||||||||
The differences between book basis and tax basis undistributed net investment income, accumulated net realized gains, and unrealized appreciation from security transactions are primarily attributable to adjustments for C-Corporation return of capital distributions, and the tax deferral of losses on wash sales.
The unrealized appreciation for Astor Macro Alternative Fund in the table above includes unrealized foreign currency gains of $1,622.
Late year losses incurred after December 31 within the fiscal year are deemed to arise on the first business day of the following fiscal year for tax purposes. The following Funds incurred and elected to defer such late year losses as follows:
| Late Year | ||||
| Portfolio | Losses | |||
| Astor Dynamic Allocation Fund | $ | — | ||
| Astor Sector Allocation Fund | 90,454 | |||
| Astor Macro Alternative Fund | 58,199 | |||
38
| The Astor Funds |
| NOTES TO FINANCIAL STATEMENTS AND CONSOLIDATED FINANCIAL STATEMENTS |
| (Continued) |
| July 31, 2021 |
On July 31, 2021, the Funds had capital loss carry forwards for federal income tax purposes available to offset future capital gains, utilized capital loss carryforwards and had capital loss carryforwards subject to expiration as follows:
| Non-Expiring | ||||||||||||||||
| CLCF | ||||||||||||||||
| Portfolio | Short-Term | Long-Term | Total | Utilized | ||||||||||||
| Astor Dynamic Allocation Fund | $ | — | $ | — | $ | — | $ | — | ||||||||
| Astor Sector Allocation Fund | — | — | — | 113,467 | ||||||||||||
| Astor Macro Alternative Fund | — | — | — | — | ||||||||||||
During the fiscal year ended July 31, 2021, the Funds utilized tax equalization which is the use of earnings and profits distributions to shareholders on redemption of shares as part of the dividends paid deduction for income tax purposes. Permanent book and tax differences, primarily attributable to the tax adjustments for prior year tax returns and the use of tax equalization credits resulted in reclassifications for the Funds for the fiscal year ended July 31, 2021 as follows:
| Paid | ||||||||
| In | Accumulated | |||||||
| Portfolio | Capital | Earnings (Losses) | ||||||
| Astor Dynamic Allocation Fund | $ | 2,444,862 | $ | (2,444,862 | ) | |||
| Astor Sector Allocation Fund | 568,549 | (568,549 | ) | |||||
| Astor Macro Alternative Fund | 178,200 | (178,200 | ) | |||||
| 6. | BENEFICIAL OWNERSHIP |
The beneficial ownership, either directly or indirectly, of more than 25% of the voting securities of a Fund creates a presumption of control of the Fund, under Section 2(a)(9) of the 1940 Act. As of July 31, 2021, Wells Fargo Clearing Services held 27.06% of the voting securities of the Astor Dynamic Allocation Fund and may be deemed to control the Fun. As of July 31, 2021, National Financial Services LLC held 26.41% and Pershing LLC held 26.83% of the voting securities of the Astor Macro Alternative Fund, respectively, and may be deemed to control the Fund.
| 7. | UNDERLYING INVESTMENT IN OTHER INVESTMENT COMPANIES |
The Astor Macro Alternative Fund currently seeks to achieve its investment objectives by investing a portion of its assets in the iShares Short Treasury Bond ETF (the “Security”). The Astor Macro Alternative Fund may redeem its investments from this Security at any time if the Advisor determines that it is in the best interest of the Fund and its shareholders to do so.
The performance of the Astor Macro Alternative Fund will be directly affected by the performance of the Security. The annual report of the Security, along with the report of the independent registered public accounting firm, is included in the Security’s most recent annual report filed on Form N-CSR available at www.sec.gov. As of July 31, 2021, the percentage of the Astor Macro Alternative Fund’s net assets invested in the Invesco QQQ Trust Series 1 was 26.20%.
| 8. | MARKET AND GEOPOLITICAL RISK |
The increasing interconnectivity between global economies and financial markets increases the likelihood that events or conditions in one region or financial market may adversely impact issuers in a different country, region or financial market. Securities in the Fund may underperform due to inflation (or expectations for inflation),
39
| The Astor Funds |
| NOTES TO FINANCIAL STATEMENTS AND CONSOLIDATED FINANCIAL STATEMENTS |
| (Continued) |
| July 31, 2021 |
interest rates, global demand for particular products or resources, natural disasters, pandemics, epidemics, terrorism, regulatory events and governmental or quasi-governmental actions. The occurrence of global events similar to those in recent years, such as terrorist attacks around the world, natural disasters, social and political discord or debt crises and downgrades, among others, may result in market volatility and may have long term effects on both the U.S. and global financial markets. It is difficult to predict when similar events affecting the U.S. or global financial markets may occur, the effects that such events may have and the duration of those effects. Any such event(s) could have a significant adverse impact on the value and risk profile of the Fund. The current novel coronavirus (COVID-19) global pandemic and the aggressive responses taken by many governments, including closing borders, restricting international and domestic travel, and the imposition of prolonged quarantines or similar restrictions, as well as the forced or voluntary closure of, or operational changes to, many retail and other businesses, has had negative impacts, and in many cases severe negative impacts, on markets worldwide. It is not known how long such impacts, or any future impacts of other significant events described above, will or would last, but there could be a prolonged period of global economic slowdown, which may impact your investment. Therefore, the Fund could lose money over short periods due to short-term market movements and over longer periods during more prolonged market downturns. During a general market downturn, multiple asset classes may be negatively affected. Changes in market conditions and interest rates can have the same impact on all types of securities and instruments. In times of severe market disruptions, you could lose your entire investment.
Please refer to the Fund’s prospectus and statement of additional information for a full listing of risks associated with the Fund’s investment strategies.
| 9. | SUBSEQUENT EVENTS |
Subsequent events after the date of the Statements of Assets and Liabilities have been evaluated through the date the financial statements were issued. Management has determined that no events or transactions occurred requiring adjustment or disclosure in the financial statements.
40

REPORT OF INDEPENDENT REGISTERED PUBLIC ACCOUNTING FIRM
To the Shareholders of Astor Funds and
Board of Trustees of Northern Lights Fund Trust
Opinion on the Financial Statements
We have audited the accompanying statements of assets and liabilities, including the schedules of investments, of Astor Dynamic Allocation Fund and Astor Sector Allocation Fund, and the accompanying consolidated statement of assets and liabilities, including the consolidated schedule of investments, of Astor Macro Alternative Fund (the “Funds”), each a series of Northern Lights Fund Trust, as of July 31, 2021, the related statements of operations for the year then ended, the statements of changes in net assets for each of the two years in the period then ended, the related notes, and the financial highlights for each of the five years in the period then ended for Astor Dynamic Allocation Fund and Astor Sector Allocation Fund, and the related consolidated statement of operations for the year then ended, the consolidated statements of changes in net assets for each of the two years in the period then ended, including the related notes, and the consolidated financial highlights for each of the five years in the period then ended for Astor Macro Alternative Fund (collectively referred to as the “financial statements”). In our opinion, the financial statements present fairly, in all material respects, the financial position of each of the Funds as of July 31, 2021, the results of their operations for the year then ended, the changes in net assets for each of the two years in the period then ended, and the financial highlights for each of the five years in the period then ended, in conformity with accounting principles generally accepted in the United States of America.
Basis for Opinion
These financial statements are the responsibility of the Funds’ management. Our responsibility is to express an opinion on the Funds’ financial statements based on our audits. We are a public accounting firm registered with the Public Company Accounting Oversight Board (United States) (“PCAOB”) and are required to be independent with respect to the Funds in accordance with the U.S. federal securities laws and the applicable rules and regulations of the Securities and Exchange Commission and the PCAOB.
We conducted our audits in accordance with the standards of the PCAOB. Those standards require that we plan and perform the audit to obtain reasonable assurance about whether the financial statements are free of material misstatement whether due to error or fraud.
Our audits included performing procedures to assess the risks of material misstatement of the financial statements, whether due to error or fraud, and performing procedures that respond to those risks. Such procedures included examining, on a test basis, evidence regarding the amounts and disclosures in the financial statements. Our procedures included confirmation of securities owned as of July 31, 2021, by correspondence with the custodian and brokers. Our audits also included evaluating the accounting principles used and significant estimates made by management, as well as evaluating the overall presentation of the financial statements. We believe that our audits provide a reasonable basis for our opinion.
COHEN & COMPANY, LTD.
800.229.1099 | 866.818.4538 fax | cohencpa.com
Registered with the Public Company Accounting Oversight Board
41
We have served as the Funds’ auditor since 2009.

COHEN & COMPANY, LTD.
Cleveland, Ohio
September 29, 2021
42
| The Astor Funds |
| SUPPLEMENTAL INFORMATION (Unaudited) |
| July 31, 2021 |
Astor Investment Management, LLC Adviser- Astor Dynamic Allocation Fund, Astor Macro Alternative Fund, and Astor Sector Allocation Fund) *
In connection with the regular meeting held on March 23-25, 2021 of the Board of Trustees (the “Trustees” or the “Board”) of the Northern Lights Fund Trust (the “Trust”), including a majority of the Trustees who are not “interested persons,” as that term is defined in the Investment Company Act of 1940, as amended, discussed the re-approval of an investment advisory agreement (the “Advisory Agreement”) between Astor Investment Management, LLC (“Adviser”) and the Trust, with respect to the Astor Dynamic Allocation Fund (“Astor Dynamic”), Astor Macro Alternative Fund (“Astor Macro”) and Astor Sector Allocation Fund (“Astor Sector”) collectively referred to as (the “Funds”). In considering the re-approval of the Advisory Agreement, the Board received materials specifically relating to the Advisory Agreement.
The Trustees were assisted by independent legal counsel throughout the Advisory Agreement review process. The Trustees relied upon the advice of independent legal counsel and their own business judgment in determining the material factors to be considered in evaluating the Advisory Agreement and the weight to be given to each such factor. The conclusions reached by the Trustees were based on a comprehensive evaluation of all of the information provided and were not the result of any one factor. Moreover, each Trustee may have afforded different weight to the various factors in reaching his conclusions with respect to the Advisory Agreement.
Nature, Extent, and Quality of Services. The Board observed that Astor was founded in 2001 with approximately $2.18 billion in total assets under management. The Board acknowledged that the Adviser created models and proprietary indicators to determine investment allocations. It noted that Astor mitigated risk by modeling inputs to account for changing positions, and managed other risk such as interest rate changes, durations, product liquidity, and individual product risk. The Board discussed the Adviser’s broker-dealer selection, noting that it utilized best execution practices to evaluate execution and service quality and operational proficiency. The Board concluded that Astor continued to provide effective and quality services to each Astor Fund and its respective shareholders.
Performance.
Astor Dynamic. With respect to Astor Dynamic, the Board considered the Fund’s objective of total return though capital appreciation and income, with a multi-asset tactical strategy that adjusts portfolio risk based on microeconomic variables and target beta. The Board noted that the Fund earned a three-star Morningstar category rating. It observed that the Fund underperformed its Morningstar category, Broadridge recommended peer group, and benchmark over the one-year period, but outperformed its peer group median over the three-year and five-year periods. Additionally, the Board observed that the Fund modestly outperformed its peer group and Morningstar category median over the three and five-year periods. After further discussion, the Board concluded that Astor Dynamic’s performance was satisfactory.
Astor Macro. With respect to Astor Macro, the Board observed that the Fund utilized multiple quantitative strategies implemented over a broad variety of asset classes and countries to achieve its investment objective of positive returns with lower risk than global equity markets. The Board
43
| The Astor Funds |
| SUPPLEMENTAL INFORMATION (Unaudited) (Continued) |
| July 31, 2021 |
noted that the Fund outperformed its Morningstar category and Broadridge recommended peer group for the one-year, three-year, five-year, and since inception periods, but trailed the S&P 500 across all periods. After further discussion, the Board concluded that the Fund’s performance was satisfactory.
Astor Sector. The Board noted the Fund’s objective of capital appreciation with less volatility than the equity market. It observed that the Fund saw an 8.8% return over the one-year period, earning a three-star Morningstar rating. The Board remarked that the Fund outperformed its Morningstar category and Broadridge recommended peer group medians across all periods. The Board concluded that the Fund’s performance was satisfactory.
Fees and Expenses.
Astor Dynamic. The Board evaluated the Fund’s advisory fee, noting that its advisory fee of 0.95% was below its Broadridge recommended peer group average and median, but higher than its Morningstar category average and median. It noted that the Fund’s net expense ratio of 1.15% was lower than the Fund’s peer group average and median, and in line with its Morningstar category median. The Board concluded that the advisory fee for Astor Dynamic was not unreasonable.
Astor Macro. The Board observed that the Fund’s advisory fee and net expense ratios were above its Morningstar category average and median and its Broadridge recommended peer group average and median. The Board noted that, while the advisory fee was on the high end, it was within the range of its peers and the category. After discussion of the information provided, and considering the quality of services provided, the Board concluded that the Fund’s advisory fee was not unreasonable.
Astor Sector. The Board observed that the advisory fee for Astor Sector was below its Broadridge recommended peer group average and median and higher than its Morningstar category average, but within the range of the category. It acknowledged that the Fund’s net expense ratio was lower than the peer group average and median. The Board concluded that the Fund’s advisory fee was not unreasonable.
Economies of Scale. The Board considered whether economies of scale had been reached with respect to the management of each Fund. They noted that the Adviser had indicated its willingness to discuss the matter of breakpoints with the Board as each Fund increased its assets. The Board agreed that in light of the expense limitation agreements, which effectively provide shareholders with some benefits of scale despite lower asset levels, and the Adviser’s willingness to consider breakpoints as each Fund reached readily attainable asset levels, the absence of breakpoints was acceptable.
Profitability. The Board reviewed the profitability analysis provided by the Adviser for each of the Astor Funds. It noted that the Adviser reported varying levels of profits for Astor Macro, Astor Dynamic, and Astor Sector, and that the Adviser reported its first profitable year with respect to Astor Macro since its inception. The Board considered other factors cited by the Adviser to support the level of profits, including, without limitation, business risks and opportunity costs. Based on
44
| The Astor Funds |
| SUPPLEMENTAL INFORMATION (Unaudited) (Continued) |
| July 31, 2021 |
the information presented, the Board concluded that the Adviser’s profitability with respect to each Fund was not excessive.
Conclusion. Having requested and received such information from the Adviser as the Board believed to be reasonably necessary to evaluate the terms of the Advisory Agreement, and as assisted by the advice of independent counsel, the Board concluded that renewal of the Advisory Agreement was in the best interests of the shareholders of each of the Astor Funds.
| * | Due to the timing of the contract renewal schedule, these deliberations may or may not relate to the current performance results of the Funds. |
45
| The Astor Funds |
| SUPPLEMENTAL INFORMATION (Unaudited) |
| July 31, 2021 |
LIQUIDITY RISK MANAGEMENT PROGRAM
The Funds have adopted and implemented a written liquidity risk management program as required by Rule 22e-4 (the “Liquidity Rule”) under the Investment Company Act. The program is reasonably designed to assess and manage the Funds’ liquidity risk, taking into consideration, among other factors, the Funds’ investment strategies and the liquidity of its portfolio investments during normal and reasonably foreseeable stressed conditions; its short and long-term cash flow projections; and its cash holdings and access to other funding sources.
During the year ended July 31, 2021, the Board and the Trust’s Liquidity Risk Management Program Committee (the “Committee”) reviewed the Funds’ investments and they determined that the Funds held adequate levels of cash and highly liquid investments to meet shareholder redemption activities in accordance with applicable requirements. Accordingly, the Board and Committee concluded that (i) the Funds’ liquidity risk management program is reasonably designed to prevent violations of the Liquidity Rule and (ii) the Funds’ liquidity risk management program has been effectively implemented.
46
| The Astor Funds |
| Expense Examples (Unaudited) |
| July 31, 2021 |
Example
As a shareholder of a Fund you will incur two types of costs: (1) transaction costs, including sales loads and redemption fees; and (2) ongoing expenses, such as advisory fees, distribution and service fees (12b-1), and other fund expenses. The following examples are intended to help you understand the ongoing cost (in dollars) of investing in a Fund and to compare these costs with the ongoing costs of investing in other mutual funds. Please note, the expenses shown in the tables are meant to highlight ongoing costs only and do not reflect any transactional costs, such as sales charges (loads), or contingent deferred sales charges on redemptions which may be assessed by mutual funds. This Example is based on an investment of $1,000 invested at the beginning of the period and held for the entire period as indicated below.
Actual Expenses
The columns under the heading entitled “Actual” help you estimate the actual expenses you paid over the period. The “Ending Account Value” shown is derived from each Fund’s actual return, and the “Expenses Paid During Period” shows the dollar amount that would have been paid by an investor who started with $1,000 in the Fund. To estimate the expenses you paid on your account during this period, simply divide your account value by $1,000 (for example, an $8,600 account value divided by $1,000 = 8.6), then multiply the result by the number in the column under the heading entitled “Actual Expenses Paid During Period.”
Hypothetical Examples for Comparison Purposes
The columns under the heading entitled “Hypothetical” provide information about hypothetical account value and hypothetical expenses based on each Fund’s actual expense ratio and an assumed rate of return of 5% per year before expenses, which is not the Fund’s actual return. The hypothetical account values and expenses may not be used to estimate the actual ending account balance or expenses you paid for the period. You may use this information to compare the ongoing costs of investing in each Fund and other funds. To do so, compare this 5% hypothetical example with the 5% hypothetical examples that appear in the shareholder reports of other funds.
Please note that the expenses shown in the table are meant to highlight your ongoing costs only and do not reflect any transactional costs which may be applicable to your account. Therefore, the last column of the table (Hypothetical Expenses Paid During Period) is useful in comparing ongoing costs only, and will not help you determine the relative total costs of owning different funds. In addition, if these transactional costs were included, your costs would have been higher.
| Hypothetical | ||||||||||||||
| Actual | (5% return before expenses) | |||||||||||||
| Fund’s | Beginning | Ending | Expenses | Ending | Expenses | |||||||||
| Annualized | Account Value | Account Value | Paid During | Account Value | Paid During | |||||||||
| Expense Ratio | 2/1/21 | 7/31/21 | Period(a) | 7/31/21 | Period | |||||||||
| Astor Dynamic Allocation Fund – Class A | 1.40% | $1,000.00 | $1,095.30 | $ 7.27 | $1,017.85 | $ 7.00 | ||||||||
| Astor Dynamic Allocation Fund – Class C | 2.15% | $1,000.00 | $1,090.60 | $ 11.15 | $1,014.13 | $ 10.74 | ||||||||
| Astor Dynamic Allocation Fund – Class I | 1.15% | $1,000.00 | $1,097.10 | $ 5.98 | $1,019.09 | $ 5.76 | ||||||||
| Astor Sector Allocation Fund – Class A | 1.40% | $1,000.00 | $1,168.60 | $ 7.53 | $1,017.85 | $ 7.00 | ||||||||
| Astor Sector Allocation Fund – Class C | 2.15% | $1,000.00 | $1,164.00 | $ 11.54 | $1,014.13 | $ 10.74 | ||||||||
| Astor Sector Allocation Fund – Class I | 1.15% | $1,000.00 | $1,170.50 | $ 6.19 | $1,019.09 | $ 5.76 | ||||||||
| Astor Macro Alternative Fund – Class A | 1.15% | $1,000.00 | $1,003.50 | $ 8.69(b) | $1,014.07 | $ 8.74(b) | ||||||||
| Astor Macro Alternative Fund – Class I | 1.75% | $1,000.00 | $1,039.50 | $ 8.85 | $1,016.11 | $ 8.75 | ||||||||
| (a) | Actual Expenses Paid During Period are equal to each Fund’s annualized expense ratio, multiplied by the average account value over the period, multiplied by 181 days and divided by 365. |
| (b) | Actual Expenses Paid During Period are equal to each Fund’s annualized expense ratio, multiplied by the average account value over the period, multiplied by 158 days and divided by 365. |
47
| The Astor Funds |
| SUPPLEMENTAL INFORMATION (Unaudited) |
| July 31, 2021 |
The Trustees and the executive officers of the Trust are listed below with their present positions with the Trust and principal occupations over at least the last five years. The business address of each Trustee and Officer is 225 Pictoria Drive, Suite 450, Cincinnati, OH 45246. All correspondence to the Trustees and Officers should be directed to c/o Gemini Fund Services, LLC, P.O. Box 541150, Omaha, Nebraska 68154.
Independent Trustees
| Name, Address and Year of Birth | Position/Term of Office* | Principal Occupation During the Past Five Years | Number of Portfolios in Fund Complex** Overseen by Trustee | Other Directorships held by Trustee During the Past Five Years |
| Mark Garbin Born in 1951 | Trustee Since 2013 | Managing Principal, Coherent Capital Management LLC (since 2007). | 3 | Northern Lights Fund Trust (for series not affiliated with the Funds since 2013); Two Roads Shared Trust (since 2012); Forethought Variable Insurance Trust (since 2013); Northern Lights Variable Trust (since 2013); OHA Mortgage Strategies Fund (offshore), Ltd. (2014 -2017); and Altegris KKR Commitments Master Fund (since 2014); Carlyle Tactical Private Credit Fund (since March 2018) and Independent Director OHA CLO Enhanced Equity II Genpar LLP (since June 2021). |
| Mark D. Gersten Born in 1950 | Trustee Since 2013 | Independent Consultant (since 2012). | 3 | Northern Lights Fund Trust (for series not affiliated with the Funds since 2013); Northern Lights Variable Trust (since 2013); Two Roads Shared Trust (since 2012); Altegris KKR Commitments Master Fund (since 2014); previously, Ramius Archview Credit and Distressed Fund (2015-2017); and Schroder Global Series Trust (2012 to 2017). |
| Anthony J. Hertl Born in 1950 | Trustee Since 2005; Chairman of the Board since 2013 | Retired, previously held several positions in a major Wall Street firm including Capital Markets Controller, Director of Global Taxation, and CFO of the Specialty Finance Group. | 3 | Northern Lights Fund Trust (for series not affiliated with the Funds since 2005); Northern Lights Variable Trust (since 2006); Alternative Strategies Fund (since 2010); Satuit Capital Management Trust (2007-2019). |
| Gary W. Lanzen Born in 1954 | Trustee Since 2005 | Retired (since 2012). Formerly, Founder, President, and Chief Investment Officer, Orizon Investment Counsel, Inc. (2000-2012). | 3 | Northern Lights Fund Trust (for series not affiliated with the Funds since 2005) Northern Lights Variable Trust (since 2006); AdvisorOne Funds (since 2003); Alternative Strategies Fund (since 2010); and previously, CLA Strategic Allocation Fund (2014-2015). |
| John V. Palancia Born in 1954 | Trustee Since 2011 | Retired (since 2011). Formerly, Director of Futures Operations, Merrill Lynch, Pierce, Fenner & Smith Inc. (1975-2011). | 3 | Northern Lights Fund Trust (for series not affiliated with the Funds since 2011); Northern Lights Fund Trust III (since February 2012); Alternative Strategies Fund (since 2012) and Northern Lights Variable Trust (since 2011). |
| Mark H. Taylor Born in 1964 | Trustee Since 2007; Chairman of the Audit Committee since 2013 | Director, Lynn Pippenger School of Accountancy Muma College of Business, University of South Florida, Tampa FL (since 2019); Chair, Department of Accountancy and Andrew D. Braden Professor of Accounting and Auditing, Weatherhead School of Management, Case Western Reserve University (2009-2019); Vice President-Finance, American Accounting Association (2017-2020); President, Auditing Section of the American Accounting Association (2012-15). AICPA Auditing Standards Board Member (2009-2012). | 3 | Northern Lights Fund Trust (for series not affiliated with the Funds since 2007); Alternative Strategies Fund (since 2010); Northern Lights Fund Trust III (since 2012); and Northern Lights Variable Trust (since 2007). |
7/31/21 – NLFT_v1
48
| The Astor Funds |
| SUPPLEMENTAL INFORMATION (Unaudited) (Continued) |
| July 31, 2021 |
Officers
| Name, Address and Year of Birth | Position/Term of Office* | Principal Occupation During the Past Five Years | Number of Portfolios in Fund Complex** Overseen by Trustee | Other Directorships held by Trustee During the Past Five Years |
| Kevin E. Wolf Born in 1969 | President Since June 2017 | Vice President, The Ultimus Group, LLC and Executive Vice President, Gemini Fund Services, LLC (since 2019); President, Gemini Fund Services, LLC (2012-2019) Treasurer of the Trust (2006-June 2017); Director of Fund Administration, Gemini Fund Services, LLC (2006 -2012); and Vice-President, Blu Giant, LLC, (2004 -2013). | N/A | N/A |
| Richard Malinowski Born in 1983 | Vice President Since March 2018 | Senior Vice President (since 2017); Vice President and Counsel (2016-2017) and Assistant Vice President, Gemini Fund Services, LLC (2012-2016). | N/A | N/A |
| James Colantino Born in 1969 | Treasurer Since June 2017 | Assistant Treasurer of the Trust (2006-June 2017); Senior Vice President -Fund Administration, Gemini Fund Services, LLC (since 2012). | N/A | N/A |
| Stephanie Shearer Born in 1979 | Secretary Since February 2017 | Assistant Secretary of the Trust (2012-February 2017); Manager of Legal Administration, Gemini Fund Services, LLC (since 2018); Senior Paralegal, Gemini Fund Services, LLC (from 2013 - 2018); Paralegal, Gemini Fund Services, LLC (2010-2013). | N/A | N/A |
| Michael J. Nanosky Born in 1966 | Chief Compliance Officer Since January 2021 | Chief Compliance Officer, of the Trust (since January 2021); Vice President-Senior Compliance Officer, Ultimus Fund Solutions (since 2020); Vice President, Chief Compliance Officer for Williamsburg Investment Trust (2020-current); Senior Vice President- ChiefCompliance Officer, PNC Funds (2014-2019). | N/A | N/A |
| * | The term of office for each Trustee and officer listed above will continue indefinitely until the individual resigns or is removed. |
| ** | As of July 31, 2021, the Trust was comprised of 68 active portfolios managed by unaffiliated investment advisers. The term “Fund Complex” applies only to the Funds in the Trust advised by the Fund’s Adviser. The Funds do not hold themselves out as related to any other series within the Trust that is not advised by the Fund’s Adviser. |
The Funds’ SAI includes additional information about the Trustees and is available free of charge, upon request, by calling toll-free at 1-877-738-0333.
7/31/21 – NLFT_v1
49
PRIVACY NOTICE
Northern Lights Fund Trust
Rev. February 2014
| FACTS | WHAT DOES NORTHERN LIGHTS FUND TRUST DO WITH YOUR PERSONAL INFORMATION? |
| Why? | Financial companies choose how they share your personal information. Federal law gives consumers the right to limit some, but not all sharing. Federal law also requires us to tell you how we collect, share, and protect your personal information. Please read this notice carefully to understand what we do. |
| What? | The types of personal information we collect and share depends on the product or service that you have with us. This information can include:
● Social Security number and wire transfer instructions
● account transactions and transaction history
● investment experience and purchase history
When you are no longer our customer, we continue to share your information as described in this notice. |
| How? | All financial companies need to share customers’ personal information to run their everyday business. In the section below, we list the reasons financial companies can share their customers’ personal information; the reasons Northern Lights Fund Trust chooses to share; and whether you can limit this sharing. |
| Reasons we can share your personal information: | Does Northern Lights Fund Trust share information? | Can you limit this sharing? |
| For our everyday business purposes - such as to process your transactions, maintain your account(s), respond to court orders and legal investigations, or report to credit bureaus. | YES | NO |
| For our marketing purposes - to offer our products and services to you. | NO | We don’t share |
| For joint marketing with other financial companies. | NO | We don’t share |
| For our affiliates’ everyday business purposes - information about your transactions and records. | NO | We don’t share |
| For our affiliates’ everyday business purposes - information about your credit worthiness. | NO | We don’t share |
| For nonaffiliates to market to you | NO | We don’t share |
| QUESTIONS? | Call 1-402-493-4603 |
50
PRIVACY NOTICE
Northern Lights Fund Trust
| Page 2 |
| What we do: | |
How does Northern Lights Fund Trust protect my personal information? | To protect your personal information from unauthorized access and use, we use security measures that comply with federal law. These measures include computer safeguards and secured files and buildings.
Our service providers are held accountable for adhering to strict policies and procedures to prevent any misuse of your nonpublic personal information. |
How does Northern Lights Fund Trust collect my personal information? | We collect your personal information, for example, when you ● open an account or deposit money
● direct us to buy securities or direct us to sell your securities
● seek advice about your investments
We also collect your personal information from others, such as credit bureaus, affiliates, or other companies. |
Why can’t I limit all sharing? | Federal law gives you the right to limit only: ● sharing for affiliates’ everyday business purposes – information about your creditworthiness.
● affiliates from using your information to market to you.
● sharing for nonaffiliates to market to you.
State laws and individual companies may give you additional rights to limit sharing. |
| Definitions | |
| Affiliates | Companies related by common ownership or control. They can be financial and nonfinancial companies.
● Northern Lights Fund Trust does not share with our affiliates. |
| Nonaffiliates | Companies not related by common ownership or control. They can be financial and nonfinancial companies.
● Northern Lights Fund Trust does not share with nonaffiliates so they can market to you. |
| Joint marketing | A formal agreement between nonaffiliated financial companies that together market financial products or services to you.
● Northern Lights Fund Trust doesn’t jointly market. |
51
PROXY VOTING POLICY
Information regarding how the Funds voted proxies relating to portfolio securities for the most recent twelve month period ended June 30 as well as a description of the policies and procedures that the Funds use to determine how to vote proxies is available without charge, upon request, by calling 1-877-738-0333 or by referring to the Securities and Exchange Commission’s (“SEC”) website at http://www.sec.gov.
PORTFOLIO HOLDINGS
Each Fund files its complete schedule of portfolio holdings with the SEC for the first and third quarters of each fiscal year as an exhibit to its reports on Form N-PORT, within sixty days after the end of the period. Form N-PORT reports are available at the SEC’s website at www.sec.gov. The information on Form N-PORT is available without charge, upon request, by calling 1-844-798-3833.
| ADVISOR |
| Astor Investment Management, LLC |
| 111 South Wacker Dr. Suite 3950 |
| Chicago, Illinois 60606 |
| ADMINISTRATOR |
| Gemini Fund Services, LLC |
| 4221 North 203rd Street, Suite 100 |
| Elkhorn, NE 68022 |
| AST-AR21 |
| (b) | Not Applicable |
Item 2. Code of Ethics.
(a) The registrant has, as of the end of the period covered by this report, adopted a code of ethics that applies to the registrant's principal executive officer, principal financial officer, principal accounting officer or controller, or persons performing similar functions, regardless of whether these individuals are employed by the registrant or a third party.
(b) During the period covered by this report, there were no amendments to any provision of the code of ethics.
(c) During the period covered by this report, there were no waivers or implicit waivers of a provision of the code of ethics.
Item 3. Audit Committee Financial Expert.
(a)(1) The registrant’s Board of Trustees has determined that Mark Taylor is an audit committee financial expert, as defined in Item 3 of Form N-CSR. Mr. Taylor is independent for purposes of this Item.
(a)(2) Not applicable.
(a)(3) In this regard, no member of the audit committee was identified as having all of the required technical attributes identified in instruction 2 (b) to item 3 of Form N-CSR to qualify as an “audit committee financial expert,” whether through the type of specialized education or experience required by that instruction. At this time, the board believes the experience provided by each member of the audit committee collectively offers the fund adequate oversight by its audit committee given the fund’s level of financial complexity. The board will from time to time reexamine such belief.
Item 4. Principal Accountant Fees and Services.
| (a) | Audit Fees |
2021 - $ 45,500
2020 - $ 40,500
| (b) | Audit-Related Fees |
2021 - None
2020 - None
| (c) | Tax Fees |
2021 – $ 8,000
2020 – $ 7,500
Preparation of Federal & State income tax returns, assistance with calculation of required income, capital gain and excise distributions and preparation of Federal excise tax returns.
| (d) | All Other Fees |
2021 - None
2020 - None
| (e) | (1) Audit Committee’s Pre-Approval Policies |
The registrant’s Audit Committee is required to pre-approve all audit services and, when appropriate, any non-audit services (including audit-related, tax and all other services) to the registrant. The registrant’s Audit Committee also is required to pre-approve, when appropriate, any non-audit services (including audit-related, tax and all other services) to its adviser, or any entity controlling, controlled by or under common control with the adviser that provides ongoing services to the registrant, to the extent that the services may be determined to have an impact on the operations or financial reporting of the registrant. Services are reviewed on an engagement by engagement basis by the Audit Committee.
| (2) | Percentages of Services Approved by the Audit Committee |
2021 2020
Audit-Related Fees: 0.00% 0.00%
Tax Fees: 0.00% 0.00%
All Other Fees: 0.00% 0.00%
| (f) | During the audit of registrant's financial statements for the most recent fiscal year, less than 50 percent of the hours expended on the principal accountant's engagement were attributed to work performed by persons other than the principal accountant's full-time, permanent employees. |
| (g) | The aggregate non-audit fees billed by the registrant's accountant for services rendered to the registrant, and rendered to the registrant's investment adviser (not including any sub-adviser whose role is primarily portfolio management and is subcontracted with or overseen by another investment adviser), and any entity controlling, controlled by, or under common control with the adviser that provides ongoing services to the registrant: |
2021 - $ 8,000
2020 - $ 7,500
(h) The registrant's audit committee has considered whether the provision of non-audit services to the registrant's investment adviser (not including any sub-adviser whose role is primarily portfolio management and is subcontracted with or overseen by another investment adviser), and any entity controlling, controlled by, or under common control with the investment adviser that provides ongoing services to the registrant, that were not pre-approved pursuant to paragraph (c)(7)(ii) of Rule 2-01 of Regulation S-X, is compatible with maintaining the principal accountant's independence.
Item 5. Audit Committee of Listed Companies. Not applicable to open-end investment companies.
Item 6. Schedule of Investments. See Item 1.
Item 7. Disclosure of Proxy Voting Policies and Procedures for Closed-End Funds. Not applicable to open-end investment companies.
Item 8. Portfolio Managers of Closed-End Management Investment Companies. Not applicable to open-end investment companies.
Item 9. Purchases of Equity Securities by Closed-End Funds. Not applicable to open-end investment companies.
Item 10. Submission of Matters to a Vote of Security Holders. None
Item 11. Controls and Procedures.
(a) Based on an evaluation of the Registrant’s disclosure controls and procedures as of a date within 90 days of filing date of this Form N-CSR, the principal executive officer and principal financial officer of the Registrant have concluded that the disclosure controls and procedures of the Registrant are reasonably designed to ensure that the information required in filings on Form N-CSR is recorded, processed, summarized, and reported by the filing date, including that information required to be disclosed is accumulated and communicated to the Registrant’s management, including the Registrant’s principal executive officer and principal financial officer, as appropriate to allow timely decisions regarding required disclosure.
(b) There were no significant changes in the Registrant’s internal control over financial reporting that occurred during the Registrant’s last fiscal half-year that have materially affected, or are reasonably likely to materially affect, the Registrant’s internal control over financial reporting.
Item 12. Disclosure of Securities Lending Activities for Closed-End Management Investment Companies. Not applicable to open-end investment companies.
Item 13. Exhibits.
(a)(1) Code of Ethics herewith.
(a)(3) Not applicable for open-end investment companies.
SIGNATURES
Pursuant to the requirements of the Securities Exchange Act of 1934 and the Investment Company Act of 1940, the registrant has duly caused this report to be signed on its behalf by the undersigned, thereunto duly authorized.
(Registrant) Northern Lights Fund Trust
By (Signature and Title)
/s/ Kevin E. Wolf
Kevin E. Wolf, Principal Executive Officer/President
Date 10/5/2021
Pursuant to the requirements of the Securities Exchange Act of 1934 and the Investment Company Act of 1940, this report has been signed below by the following persons on behalf of the registrant and in the capacities and on the dates indicated.
By (Signature and Title)
/s/ Kevin E. Wolf
Kevin E. Wolf, Principal Executive Officer/President
Date 10/5/2021
By (Signature and Title)
/s/ Jim Colantino
Jim Colantino, Principal Financial Officer/Treasurer
Date 10/5/2021