Investor Presentation December 2016 Exhibit 99.1 |
Forward Looking Statement Certain statements in this presentation are "forward-looking statements" within the meaning of the Private Securities Litigation Reform Act of 1995 and may include, but are not limited to, statements about sales levels, acquisitions, restructuring, profitability and anticipated synergies, expenses and cash outflows. All forward-looking statements involve risks and uncertainties. All statements contained herein that are not clearly historical in nature are forward-looking, and words such as "believe," "anticipate," "expect," "estimate," "may," "will," "should," "continue," "plans,“ “potential,” "intends," "likely," or other similar words or phrases are generally intended to identify forward-looking statements. Any forward-looking statement contained herein, in press releases, written statements or documents filed with the Securities and Exchange Commission, or in Koppers communications with and discussions with investors and analysts in the normal course of business through meetings, phone calls and conference calls, regarding expectations with respect to sales, earnings, cash flows, operating efficiencies, restructurings, the benefits of acquisitions and divestitures or other matters as well as financings and debt reduction, are subject to known and unknown risks, uncertainties and contingencies. Many of these risks, uncertainties and contingencies are beyond our control, and may cause actual results, performance or achievements to differ materially from anticipated results, performance or achievements. Factors that might affect such forward-looking statements, include, among other things, the impact of changes in commodity prices, such as oil and copper, on product margins; general economic and business conditions; potential difficulties in protecting our intellectual property; the ratings on our debt and our ability to repay or refinance outstanding indebtedness; our ability to operate within the limitations of our debt covenants; potential impairment of our goodwill and/or long-lived assets; demand for Koppers goods and services; competitive conditions; interest rate and foreign currency rate fluctuations; availability of key raw materials and unfavorable resolution of claims against us, as well as those discussed more fully elsewhere in this presentation and in documents filed with the Securities and Exchange Commission by Koppers, particularly our latest annual report on Form 10-K and subsequent filings. Any forward-looking statements in this presentation speak only as of the date of this presentation, and we undertake no obligation to update any forward-looking statement to reflect events or circumstances after that date or to reflect the occurrence of unanticipated events. Note: There are non-GAAP amounts in this presentation for which reconciliations to GAAP are provided in the company’s quarterly financial news releases, which are posted to the website at www.koppers.com along with this presentation. To access the reconciliations, go to the company’s homepage, select “Investor Relations” and then “News Releases”. The company also provided a reconciliation for the twelve months ended September 30, 2016 on page 28 of this presentation. 1 |
2 Leroy M. Ball President and Chief Executive Officer Michael J. Zugay Chief Financial Officer Management Representatives |
Strategic Overview |
4 • Global leader in oil and water-borne preservatives serving many market applications for treated wood • Successfully transitioning from a business built on producing carbon pitch to serve global aluminum industry into an enterprise centered on the preservation and enhancement of wood • Knowledge of wood preservation is a core competency Largest integrated producer of wood treatment preservatives for North American railroad crosstie industry Performance Chemicals wood treatment preservatives serve various industrial, agricultural and residential markets • Strategy continues to build momentum; continue to evaluate opportunities to optimize product portfolio and capital structure Systematic approach of reducing dependence on highly cyclical industries tied to oil and aluminum Continuing to de-emphasize CMC as a standalone business • Wood treatment technologies are at the heart of our value creation model Investment Thesis |
5 We are in the “5 th inning” of our transformation Strategic Initiative Description Expected Completion De-emphasize CMC Business • Will have ceased distillation or sold 7 of 11 facilities by YE 2016 • CMC revenues decreased from two-thirds to less than ~30% of consolidated sales • Expect to improve CMC profitability to 9-15% adj EBITDA through economic cycle by year-end 2018 Q4 2017 Aggressively Targeted Debt Reduction Goal: Leverage @ 2-4X • $128M operating cash flow in 2015; all-time high as public company • Reduced debt by $116M in 2015; making progress toward debt reduction target of $85M in 2016 • Total debt was $850 million at 12/31/14, $735 million at 12/31/15 and $691 million at 9/30/16 Q4 2016 Secure long-term business of key customer base • Extended contracts with the BNSF, CSX and NS into 2021 • Signed long-term rail joint agreements with 2 key railroad customers – NS (2019) & UP (2021) • Extended supply agreements with 2 largest PC customers into 2017 & 2018, respectively • Signed 2 long-term contracts that are expected to increase phthalic sales volume 20% YOY Ongoing Reduce China risk profile • Restructured loan agreements in China; renegotiated soft pitch agreement with Nippon Steel and received $30M (July 2015) • Exiting 2 of 3 existing joint ventures in China Q1 2017 Divest non-core businesses • Sold North American utility business (January 2015) • Sold KSA concrete tie joint venture (July 2015) • Sold Houston wood-treating business (October 2016) Ongoing Initiatives Are Well Underway; Significantly Improving Profitability |
Integrated global provider of treated wood products, wood treatment chemicals, and carbon compounds Three core complementary business segments Unique product/service portfolio and niche end market focus YTD 9/30/16 Net Sales Products & Services Carbon Materials and Chemicals (CMC) Performance Chemicals (PC) Railroad and Utility Products and Services (RUPS) $337 Million $304 Million $462 Million Carbon Pitch Creosote Carbon Black Feedstock Naphthalene Phthalic Anhydride Wood Preservation Chemicals Coatings Water Repellants Pigmented Stains Fire Retardants Railroad Crossties Railroad Bridge Services Rail Joint Bars Utility Poles Leading Global Supplier: Infrastructure & Construction Markets 6 YTD 9/30/16 LTM 9/30/16 12/31/15 Net Sales $1,103M $1,467M $1,627M EBITDA* $137M $166M $150M EBITDA %* 12.4% 11.3% 9.2% +280 bps YOY +270 bps YOY +170 bps YOY YTD 9/30/16 EBITDA %* 3.7% 21.6% 13.0% Key Market Drivers 1-3% #1 2-4% #1 1-3% #1 or #2 Repair & Remodel Existing Home Sales Global Industrial Growth * On an adjusted basis Market Growth Market Position Replacement Cycle |
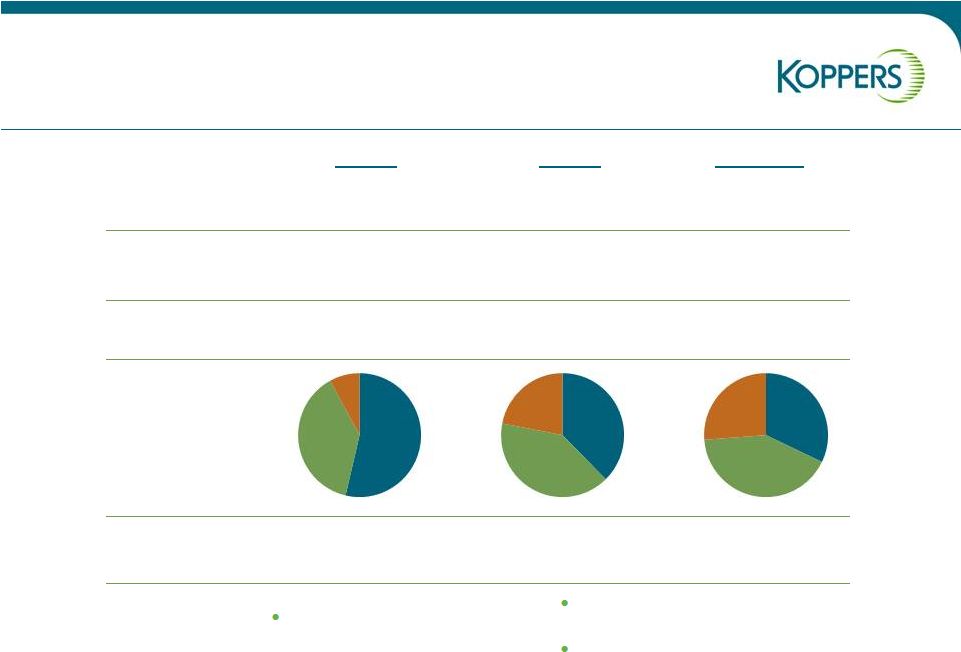
Transforming Our Business Profile; Maximizing Our Profitability 7 12/31/14 12/31/15 LTM 9/30/16 Net Sales $1,555M $1,627M $1,467M EBITDA* Margin* $116M 7.5% $150M 9.2% $166M 11.3% Net Leverage 6.9x 4.7x 4.1x Business Segment Revenues Wood-related Products & Services 46% 62% 68% Strategy Diversified commodity chemicals * On an adjusted basis Transformation to integrated wood preservation business Delivering restructuring benefits and margin expansion CMC 54% RUPS 38% PC 8% CMC 38% RUPS 40% PC 22% CMC 32% RUPS 42% PC 26% |
Zero Harm Focus Driving Shareholder Value 8 Achieved certification in American Chemistry Council’s Responsible Care ® initiative across 18 global facilities and corporate headquarters Received awards from BNSF Railway, Canadian National Railway and Union Pacific Railroad for excellence in chemical transportation safety performance 12 operating locations achieved a zero total recordable rate in 2015 Auckland Christchurch Darlington Denver Geelong Houston Hubbell KCCC Longford Millington Mt. Gambier Scunthorpe ZERO IS POSSIBLE! Safety Statistics YTD 9/30/16 2015 2014 2013 2012 Days Away (DA) 0.94 1.21 0.76 0.90 0.72 Days Away / Restricted Transfer (DART) 2.06 1.90 2.03 1.69 1.66 Total Recordable Rate (TRR) 3.12 3.45 3.91 3.71 3.99 |
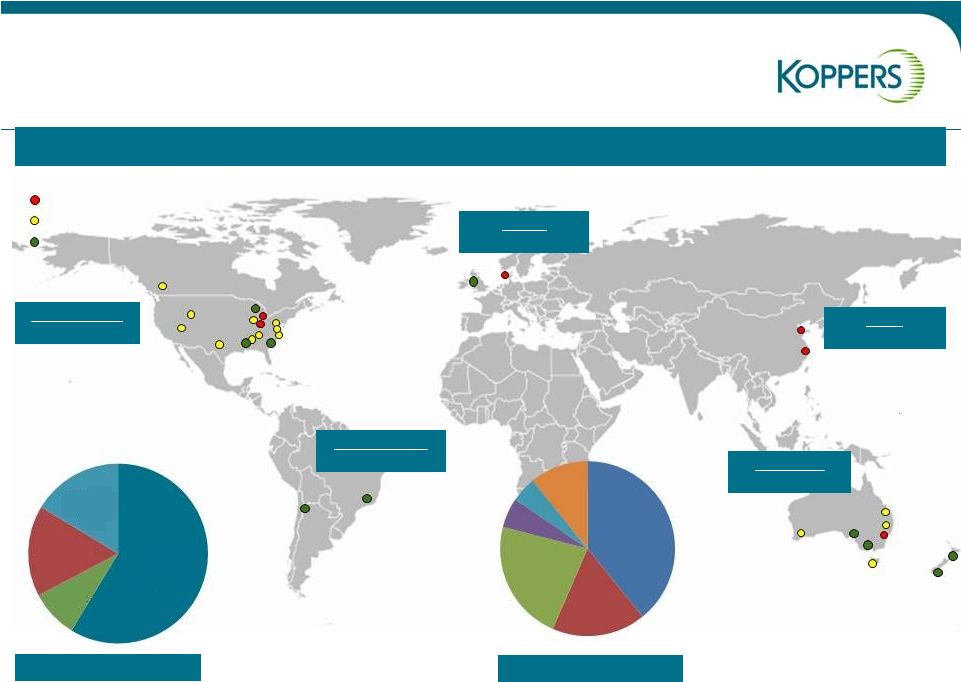
Facilities well-positioned to capture worldwide demand growth Europe 2 facilities North America 15 facilities China 2 facilities Australasia 9 facilities 2015 Sales by Region Carbon Materials and Chemicals Railroad and Utility Products and Services Performance Chemicals South America 2 facilities (a) Global Presence; Serving Customer Demand (a) Toll producing facilities 2015 Sales by End Market Railroad 39% Construction , 23% Utilities 5% Rubber 5% Other 11% Aluminum/Steel, 17% North America 61% Europe 9% Australasia 17% Emerging Markets 13% |
10 By 12/31/16, will have shut down coal tar distillation capacity or sold 7 of 11 facilities over 3-year period; already ceased distillation at 6 locations: • Uithoorn, Netherlands stopped producing coal tar products in April 2014 • Follansbee, WV ceased distillation in December 2015 • Port Clarence & Scunthorpe, U.K. facilities, ceased production in February 2016; properties and assets sold to Industrial Chemicals Group Limited in July 2016 • KCCC in China ceased coal tar distillation in March 2016 • Clairton, PA facility ceased coal tar distillation in July 2016 Plan to exit 1 additional facility in near-term: • Agreement has been reached to sell our 30% interest in TKK JV in China; closing to occur by year-end 2016 By 1/1/2017, global capacity for coal tar distillation will be reduced by ~50%; remaining 4 CMC facilities have key competitive advantages: • Stickney, IL • Nyborg, DK • Mayfield, AU • Jiangsu Province, China CMC Consolidation Strategy |
6.8% 10.7% 11.2% 7.9% 9.6% 13.7% 13.7% Q1 Q2 Q3 Q4 Q1 Q2 Q3 Quarterly EBITDA Margin* Delivering Improved Profitability 11 2015 2016 Q1-Q3 Avg: 9.6% Q1-Q3 Avg: 12.4% * On an adjusted basis |
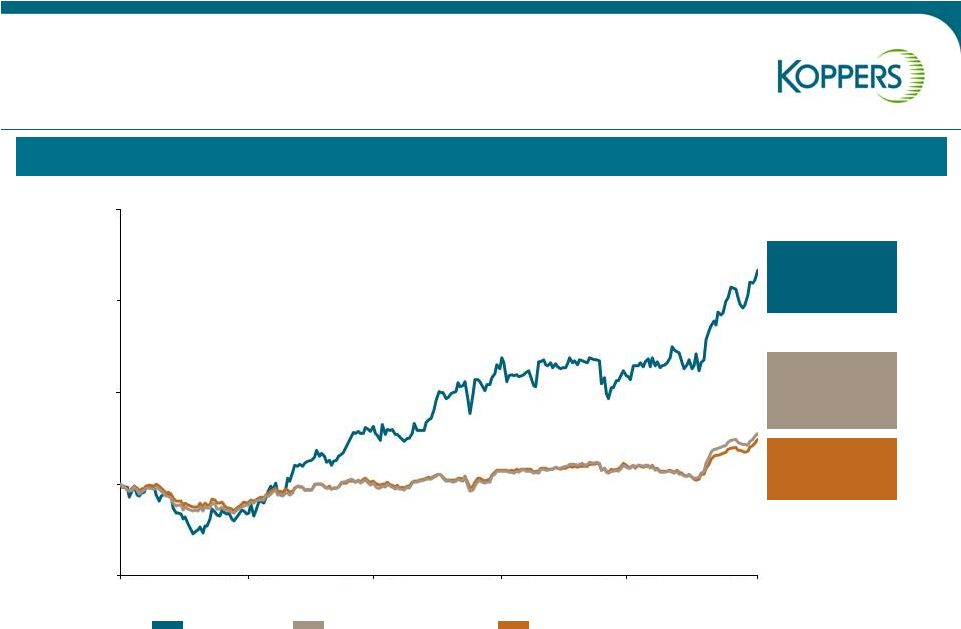
Koppers: 117.2% Total Shareholder Return – LTM (1) 12 (1) Total Shareholder Return includes stock appreciation and common dividends received from December 8, 2015 to December 8, 2016. Strategic Transformation Driving Shareholder Value Enhancement S&P SmallCap 600: 24.7% S&P SmallCap 600 Industrials: 28.0% Koppers S&P SmallCap 600 S&P SmallCap 600 Industrials Dec-15 Feb-16 May-16 Jul-16 Sep-16 Dec-16 50% 100% 150% 200% 250% |
Debt & Liquidity |
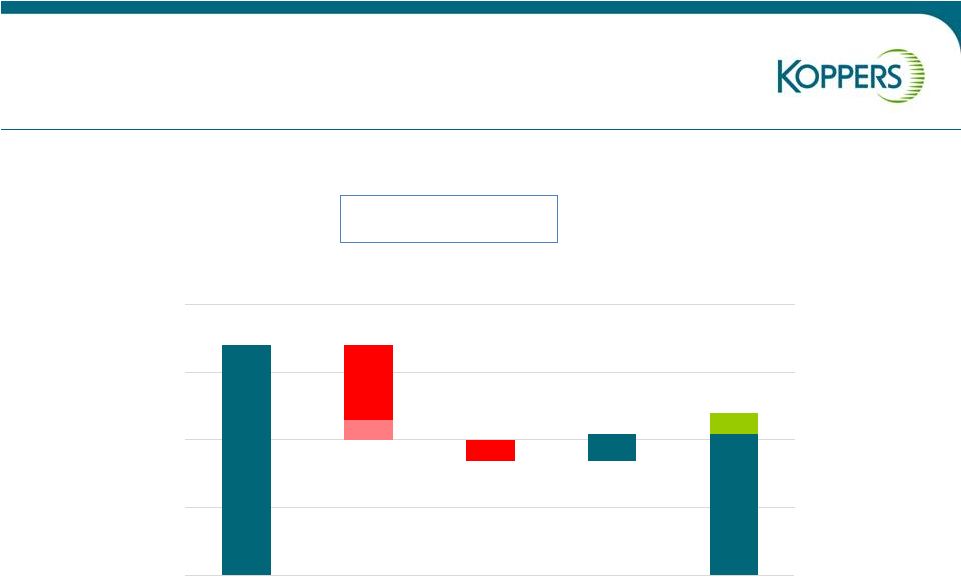
2016 Debt Repayment: $85M Target 14 ($ in millions) $735 $650 N/A * $168 $23 $47 $46 $13 $500 $550 $600 $650 $700 $750 Total debt 1/1/2016 TKK loan repayment Adjusted EBITDA Working capital and other Capex Cash interest Cash taxes Total debt 12/31/2016 2016 Estimated Debt Repayment * Deferred until 2017 • Reduce debt to achieve goal of 2-4X leverage ratio • Provide greater flexibility • Allocate capital to maximize shareholder returns |
U.S. Credit Facility Amendment 15 Credit amendment (April 2016) provides financial flexibility to fully implement restructuring actions • Reduce revolving credit facility to $300M from $500M; lower revolver interest expense • Increase leverage covenant ratio for each remaining measurement period of agreement • Exclude capital expenditures related to N.A. & European CMC restructuring from fixed charge ratio; can advance construction of naphthalene production at Stickney (IL) facility • Reset $75M basket to zero for cash or non-cash, non-recurring charges related to sale or discontinuation of businesses • Additional pricing tier that increases interest rate slightly compared to prior agreement until we reach < 3.5 times leverage |
Appendix |
Financial Highlights |
18 Performance Chemicals (PC) • Continued to strengthen market-leading position and benefited from near-peak consumer demand • Strong operating profitability; favorable trends in repair & remodeling markets and existing home sales • Retailers & dealers stocking and selling treated wood with higher preservative retention levels Railroad and Utility Products and Services (RUPS) • Reduction in crosstie purchases due to lower spending by Class I rail customers; lower pass-through pricing related to lower hardwood pricing; greater competition in non-Class I business • Delivered solid margin performance despite softening market conditions as previously forecasted; favorable sales mix related to crosstie treatment and bridge services Carbon Materials and Chemicals (CMC) • Strategy to significantly reduce coal tar distillation capacity reaping benefits in terms of increased profitability and shrinking environmental footprint • Profitability increased from prior year due to cost savings related to consolidation strategy and lower average raw material costs • Decoupling wood-preservation business from significant volatility that affected CMC historically Q3 2016: Continue Focusing on Higher-value Wood Preservatives Market |
19 Q3 Sales: Reflect Strategic Shift to De-emphasize CMC; Softening Railroad Market ($ in millions) $434 $371 $14 ($32) ($45) $350 $370 $390 $410 $430 $450 Q3 2015 PC RUPS CMC Q3 2016 Sales Bridge Q3 2016 |
Q3 EBITDA* of $51M; PC Delivered Strong Profitability 20 ($ in millions) $48 $51 $8 ($5) $1 ($1) $25 $35 $45 $55 $65 Q3 2015 PC RUPS CMC CORP Q3 2016 EBITDA* Bridge Q3 2016 * On an adjusted basis |
2016 Guidance |
2016 Sales Forecast of ~$1.4B 22 ($ in millions) $1,627 ~ $1,4B $50-$60 ($80-$90) ($180-$200) $1,200 $1,300 $1,400 $1,500 $1,600 $1,700 2015 ACTUAL PC RUPS CMC 2016 FORECAST Consolidated Sales Bridge 2016 Forecast |
2016 EBITDA* Forecast: PC Net Improvement of $19M 23 ($ in millions) $61 $80 $19 $50 $60 $70 $80 2015 ACTUAL Organic Growth/ Cost Savings 2016 FORECAST PC EBITDA* Bridge 2016 Forecast * On an adjusted basis |
2016 EBITDA* Forecast: RUPS Expect Lower Treating Volumes; Commercial Softening 24 ($ in millions) $84 ($3) $4 $71-$74 ($11-$14) $50 $60 $70 $80 $90 2015 ACTUAL Treating Volumes Rail Joints & Utility Poles Cost Savings 2016 FORECAST RUPS EBITDA* Bridge 2016 Forecast * On an adjusted basis |
25 ($ in millions) 2016 EBITDA* Forecast: CMC Increase of $10-$11M $9 $5 $15-$16 ($10) $19-$20 $0 $10 $20 $30 2015 ACTUAL China/Australia Restructuring Savings Volume/Price/RM Savings 2016 FORECAST CMC EBITDA* Bridge 2016 Forecast * On an adjusted basis |
2016 EBITDA Forecast: Consolidated EBITDA* of $168M-$172M 26 ($ in millions) EBITDA Margin* ~12% * On an adjusted basis $150 $168-$172 ~ $180 $19 ($10-$13) $10-$11 $2 $120 $130 $140 $150 $160 $170 2015 ACTUAL PC RUPS CMC CORP 2016 FORECAST 2017 FORECAST Consolidated EBITDA Bridge 2016-17 Forecast |
Non-GAAP Measures and Guidance Koppers believes that EBITDA, adjusted EBITDA and adjusted EBITDA margin provide information useful to investors in understanding the underlying operational performance of the company, its business and performance trends and facilitates comparisons between periods and with other corporations in similar industries. The exclusion of certain items permits evaluation and a comparison of results for ongoing business operations, and it is on this basis that Koppers management internally assesses the company's performance. In addition, the Board of Directors and executive management team use adjusted EBITDA and adjusted earnings per share as performance measures under the company’s annual incentive plans. Although Koppers believes that these non-GAAP financial measures enhance investors’ understanding of its business and performance, these non-GAAP financial measures should not be considered an alternative to GAAP basis financial measures and should be read in conjunction with the relevant GAAP financial measure. Other companies in a similar industry may define or calculate these measures differently than the company, limiting their usefulness as comparative measures. Because of these limitations, these non-GAAP financial measures should not be considered in isolation or as substitutes for performance measures calculated in accordance with GAAP. For the company’s 2016 guidance, adjusted EBITDA excludes restructuring, impairment, non- cash LIFO charges, and non-cash mark-to-market commodity hedging. The forecasted amounts for these items are not determinable, but may be significant. For that reason, the company is unable to provide GAAP earnings estimates at this time. Final results could also be affected by various other factors that management is unaware of at this time. 27 |
Adjusted EBITDA Reconciliation – LTM 9/30/16 28 ($ in millions) LTM 9/30/2016 Net Sales $1,467 Net Income (loss) (67) Interest expense including refinancing 51 Depreciation and amortization 56 Income tax provision (4) Discontinued Operations (1) EBITDA $35 Adjustments to EBITDA: Treating plant closure 6 Net gain on sale of business 3 European restructuring 27 North American restructuring 34 Storage tank and railcar cleaning costs 0 Osmose acquisition costs 0 China restructuring 3 Non-cash LIFO expense (6) Mark-to-market commodity hedging 1 Reimbursement Environmental Costs (3) Escrow Recovery (1) Goodwill Impairment 67 Adjusted EBITDA (1) $166 Adjusted EBITDA Margin (2) 11.3% (1) The table above describe the adjustments to EBITDA for the twelve months ending September 30, 2016. (2) Adjusted EBITDA as a percentage of GAAP sales. |
Koppers Holdings Inc. 436 Seventh Avenue Pittsburgh, PA 15219-1800 Koppers, with corporate headquarters in Pittsburgh, Pennsylvania, is an integrated global provider of treated wood products, wood treatment chemicals and carbon compounds. Our products and services are used in a variety of niche applications in a diverse range of end-markets, including the railroad, specialty chemical, utility, residential lumber, agriculture, aluminum, steel, rubber, and construction industries. Stock Exchange Listing NYSE: KOP Contact Information Ms. Quynh McGuire Director, Investor Relations and Corporate Communications 412 227 2049 McGuireQT@koppers.com KOPPERS World Headquarters Pittsburgh, Pennsylvania, USA Koppers is a a member of the American Chemistry Council. |