UNITED STATES
SECURITIES AND EXCHANGE COMMISSION
WASHINGTON, D.C. 20549
CERTIFIED SHAREHOLDER REPORT OF REGISTERED MANAGEMENT
INVESTMENT COMPANIES
Investment Company Act file number 811-21707
PRESIDIO FUNDS
(Exact name of registrant as specified in charter)
3717 Buchanan Street, Suite 200
San Francisco, CA 94123
(Address of principal executive offices) (Zip code)
Kevin C. O’Boyle
Presidio Fund
3717 Buchanan Street, Suite 200
San Francisco, CA 94123
(Name and address of agent for service) |
Registrant’s telephone number, including area code: (415) 441-3034
Date of fiscal year end: April 30
Date of reporting period: April 30, 2009
Form N-CSR is to be used by management investment companies to file reports with the Commission not later than 10 days after the transmission to stockholders of any report that is required to be transmitted to stockholders under Rule 30e-1 under the Investment Company Act of 1940 (17 CFR 270.30e -1). The Commission may use the information provided on Form N-CSR in its regulatory, disclosure review, inspection and policymaking roles.
A registrant is required to disclose the information specified by Form N-CSR, and the Commission will make this information public. A registrant is not required to respond to the collection of information contained in Form N-CSR unless the Form displays a currently valid Office of Management and Budget ("OMB") control number. Please direct comments concerning the accuracy of the information collection burden estimate and any suggestions for reducing the burden to Secretary, Securities and Exchange Commission, 450 Fifth Street, NW, Washington, DC 20549-0609. The OMB has reviewed this collection of information under the clearance requirements of 44 U.S.C. § 3507.
Item 1. Reports to Stockholders.
Presidio Fund
Annual Report
April 30, 2009
Presidio Funds
1-800-595-3166
www.presidiofunds.com
May 3, 2009
Dear Shareholder: |
This annual shareholder report covers the twelve-month period ended April 30, 2009, but this letter focuses primarily on the second half of the fiscal year. Please refer to the semi-annual shareholder report for additional commentary on the first half of the fiscal year.
| Performance Summary: | | | | | | | | |
| | | | | | | 3-year | | Average | | Cumulative |
| | | 6-month | | 1-year | | Average | | Annual Return | | Return |
| | | Return | | Return | | Annual Return | | Since Inception* | | Since Inception* |
| Presidio Fund | | 0.14% | | <24.79%> | | <6.37%> | | 1.63% | | 6.67% |
| Wilshire 5000 Index | | <7.49%> | | <34.69%> | | <10.72%> | | <4.28%> | | <16.05%> |
| *inception May 3, 2005 | | | | | | | | | | |
Presidio Fund's net asset value on April 30, 2009 was $10.13. The Fund paid out a long-term capital gains distribution of $0.0229 per share on December 29, 2008. Total net assets amounted to $45,594,996. At period end, 81.61% of the Fund's net assets were invested in equities, 3.86% in convertible debt, and 14.53% in net cash.* The median market capitalization of the Fund's equity investments was $4.764 billion. Large-cap stocks comprised 35.5% of the portfolio, mid-cap stocks 20.3%, and small-cap stocks 25.8% .
The six-month return box score does not begin to tell the story of the extraordinary market volatility, which resembled a wild roller coaster ride. The broad market indices plummeted approximately 25% during the first three weeks of November 2008, surged about 25% into the first week of 2009, plunged another 27% or so to a new low during the following two months, and then rallied approximately 30% to finish the period.
During the six-month period ended April 30, 2009, Presidio Fund generated a modestly positive return overall. Investments in commodities-related equities and exchange-traded funds (about 20% of the portfolio) performed well. Gold and related stocks rebounded strongly, and most other investments in this sector generated a positive return. The Fund's consumer goods and services investments (also approximately 20% of the portfolio) generated only small losses overall. Our healthcare investments (approximately 15% of the portfolio), in aggregate, generated small losses, but individual investment performance was uneven. I will have more to say about healthcare later in this letter.
The worst-performing portfolio investments for the second half of the fiscal year related primarily to the capital investment and insurance sectors. The financial system meltdown resulted in significant reductions in capital spending generally, as well as substantial capital losses in the insurance sector. It is unlikely that capital spending in most sectors will rebound soon, so we reduced or completely sold our positions in EMS Technologies, Faro Technologies, Flow International, Learning Tree International, and Zebra Technologies.
For the full fiscal year ended April 30, 2009, Presidio Fund's net asset value declined 24.79% compared to a 34.69% decline in the Wilshire 5000 Index. The market declined significantly in the first half of the fiscal year as the global financial system fell apart. The Fund's smaller decline compared to the Wilshire 5000 for the twelve-month period resulted from the positive relative performance in the second half of the fiscal period, as described above, and from its net cash and precious metals holdings over the entire fiscal period.
Think Macro and Focus More on Capital Preservation
For most of my career, I have achieved success by focusing on individual stock selection without too much regard for macroeconomic issues. When the macro-economy is stable, it requires a modicum of attention in making most investment decisions. But when the macro-economy is in crisis, as it is today, it almost becomes the over-riding consideration before investigating the merits of individual companies. Therefore, this commentary will focus on macroeconomic issues that are influencing the Fund's investment activities.
Capital preservation means preserving the purchasing power of investments denominated in the local currency (e.g. - dollars) even if the value of the local currency declines. This has now become a very important issue on which to focus, because the financial crisis has prompted government and central bank responses in many parts of the world that will have material long-term consequences.
In the U.S., the Federal Reserve has more than doubled its balance sheet during the past year, primarily through the creation of the alphabet-soup list of programs that we have read about in the news. The Fed's balance sheet expansion has now reached the point where it is actually creating new money to buy both U.S. treasury bonds and mortgage-related assets. In my opinion, the Fed is likely to continue expanding its balance sheet indefinitely in an effort to stave off bankruptcies of large lenders and insurance companies, and to facilitate borrower debt servicing. The effect of the Federal Reserve's continued balance sheet expansion will be an increase in the supply of dollars, which should ultimately lead to a significant reduction in the purchasing power of the dollar.
It should be noted that other central banks around the world (including the European, Japan, Switzerland, and the United Kingdom central banks) are now also creating new money to purchase debt issued by their respective governments. So, this scenario of declining paper-based currencies may become a somewhat global phenomenon.
History demonstrates that owning "hard" assets that are not very economically sensitive provides a solid defense against persistent currency declines, not to mention bank failures. It is for this reason that Presidio Fund owns positions in precious metals ETFs/closed end funds and mining stocks, agriculture-related investments, and to a much lesser extent - energy-related stocks. I am also focused on identifying strong business franchises that can thrive in an environment where prices are being distorted by government interventions. Note that publicly-traded real estate vehicles may not preserve capital this time around, because many are over-leveraged and will face refinancing issues going forward.
Finally, please note that the reduction in interest rates which has resulted from the Federal Reserve's programs has also prompted Presidio Fund to establish some small positions in convertible debt securities. The Fund has focused on convertible debt securities that are trading at least 15% below par, mature or can be put back to the issuer in less than four years, and appear to have miniscule default risk. These investments should provide a safe alternative to extremely low treasury-bill yields and provide returns of at least 6.5% compounded annually, on average, over the period of investment.
The New, New Deal - Government Intervention
Since the financial crisis commenced in the summer of 2007, both major political parties have reacted to each new problem with proposals to increase government intervention in the economy -despite public disapproval. At first, the interventions were centered on the financial services sector, in the name of mitigating "systemic risk".
Last autumn, the interventions moved into the automotive sector. Then, early this year, the stimulus legislation brought intervention to a number of new sectors, including: incentives for information technology spending for electronic medical records in the healthcare sector, incentives to build out broadband networks in rural areas in the telecommunications sector, incentives to convert power transmission grids to "smart" grids in the utility sector, and increased incentives to develop non-fossil fuel-based energy sources in the utility sector.
Proposals are now being developed to reform the healthcare system almost from top-to-bottom, to change the tax system for U.S.-based corporations, and to implement a "Cap and Trade" system in an effort to reduce carbon gas emissions.
Each of these government interventions has had, or potentially will have, a substantial impact on the business economics and competitive dynamics of the affected industries. This greatly complicates investment analysis, and could lead to an increased number of investment mistakes until the full ramifications of government interventions become apparent.
Presidio Fund currently has approximately 15% of the portfolio invested in the healthcare sector, which is likely to experience dramatic changes in the near future. While I believe that each of our
2009 Annual Report 2
healthcare investments has compelling merits, only two of the investments, Allscripts-Misys and Abaxis, clearly stand to benefit over time from healthcare reform.
Allscripts-Misys is a supplier of electronic medical record and financial management software for physicians and hospitals. At the time of our initial purchase last summer, the Allscripts stock was out of favor due to product transition issues that had negatively impacted sales and earnings, and uncertainties associated with the pending merger with Misys. Since it became clear that Obama would become President, this stock has more than doubled.
The impact of healthcare reform on the Fund's other healthcare investments are currently unclear, but would likely be neutral to negative. However, the valuations of these investments seem to already reflect a negative outcome. For example, we recently initiated an investment in Pfizer. This pharmaceutical company has been out of favor due primarily to the looming patent expiration of its best-selling drug Lipitor, and numerous research and development failures over the past few years. New management has re-evaluated strategy, reorganized the company to become more productive, and entered into an agreement to acquire Wyeth. The Wyeth acquisition is projected to enable Pfizer to sustain the current sales level, while improving profits. Yet, the stock currently trades at just 8 times projected 2009 earnings and less than 6.5 times projected earnings once the Lipitor patent has expired and the Wyeth acquisition has been fully integrated. Moreover, Pfizer currently has a dividen d yield of 4.25%, and may be in position to raise the dividend once the Wyeth acquisition is consummated.
Conclusion
At this juncture, macroeconomic factors are looming much larger in the investment landscape than previously. Presidio Fund has adjusted its investment approach to take these factors into greater consideration. Government intervention into the economy is now occurring at a pace, and on a scale, that was previously unthinkable. As the full investment implications of these interventions become clear, existing investment theses may prove to be incorrect and new investment ideas may surface. In such instances, the Fund will aim to make appropriate portfolio adjustments.
In closing, I would like to thank shareholders for your continued support and trust.
Sincerely,

*Net cash represents cash equivalents and other assets less liabilities.
Performance data quoted represents past performance. Past performance does not guarantee future results. The investment return and principal value of an investment will fluctuate so that an investor's shares, when redeemed, may be worth more or less than their original cost. Current performance may be lower or higher than the performance data quoted. You may obtain performance data current to the most recent month-end by calling 1-800-595-3166. Investors should consider the investment objective, risks, and charges and expenses of the Fund carefully before investing. The Fund's prospectus contains this and other information about the Fund and is available upon request by calling 1-800-595-3166 or by visiting www.presidiofunds.com. Please obtain and carefully read the prospectus before investing.
2009 Annual Report 3
Presidio Fund
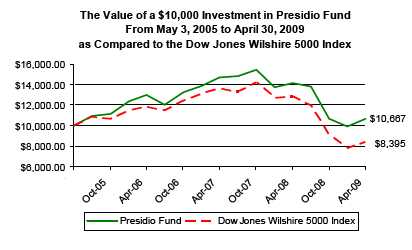
PERFORMANCE INFORMATION
April 30, 2009 NAV $10.13
Average annual rate of return (%) for periods ended April 30, 2009.
| | | | | Since |
| | | 1 Year(A) | | Inception(A) |
| Presidio Fund | | <24.79%> | | 1.63% |
| Wilshire 5000 Index(B) | | <34.69%> | | <4.28%> |
(A)1 Year and Since Inception returns include change in share prices and in each case includes reinvestment of any dividends and capital gain distributions. The inception date of the Presidio Fund was May 3, 2005.
(B)The Wilshire 5000 Index measures the performance of all U.S. headquartered equity securities with readily available price data. Over 5,000 capitalization weighted security returns are used to adjust the index. The composition of the Wilshire 5000 Index is different from the Fund.
PAST PERFORMANCE DOES NOT GUARANTEE FUTURE RESULTS. INVESTMENT RETURN AND PRINCIPAL VALUE WILL FLUCTUATE SO THAT SHARES, WHEN REDEEMED, MAY BE WORTH MORE OR LESS THAN THEIR ORIGINAL COST. RETURNS DO NOT REFLECT THE DEDUCTION OF TAXES THAT A SHAREHOLDER WOULD PAY ON FUND DISTRIBUTIONS OR THE REDEMPTION OF FUND SHARES. CURRENT PERFORMANCE MAY BE LOWER OR HIGHER THAN THE PERFORMANCE DATA QUOTED. TO OBTAIN PERFORMANCE DATA CURRENT TO THE MOST RECENT MONTH END, PLEASE CALL 1-800-595-3166.
2009 Annual Report 4
Presidio Fund
By Industry Sectors Based on Percent of Net Assets
(Unaudited)
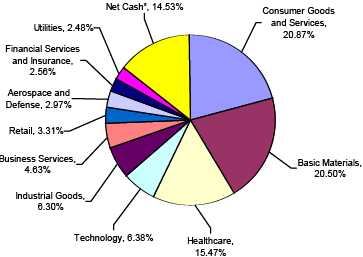
*Net Cash represents cash equivalents and other assets less liabilities.
______________________________________________________________________________________________________
Proxy Voting Guidelines
(Unaudited) |
KCO Investments, Inc., the Fund’s Adviser, is responsible for exercising the voting rights associated with the securities held by the Fund. A description of the policies and procedures used by the Adviser in fulfilling this responsibility is available without charge on the Fund’s website at www.presidiofunds.com or is also available without charge, upon request, by calling our toll free number (1-800-595-3166). It is also included in the Fund’s Statement of Additional Information, which is available on the Securities and Exchange Commission’s web-site at http://www.sec.gov.
Information regarding how the Fund voted proxies, Form N-PX, relating to portfolio securities during the most recent 12-month period ended June 30 is available without charge, upon request, by calling our toll free number (1-800-595-3166). This information is also available on the Securities and Exchange Commission’s website at http://www.sec.gov.
2009 Annual Report 5
Availability of Quarterly Schedule of Investments
(Unaudited)
The Fund files its complete schedule of portfolio holdings with the Securities and Exchange Commission ("SEC") for the first and third quarters of each fiscal year on Form N-Q. The Fund’s Forms N-Q are available on the SEC's Web site at http://www.sec.gov. The Fund’s Forms N-Q also may be reviewed and copied at the SEC's Public Reference Room in Washington, DC. Information on the operation of the Public Reference Room may be obtained by calling 1-800-SEC-0330.
Expense Example
(Unaudited) |
Shareholders of this Fund incur ongoing costs consisting of management fees and services fees. The following example is intended to help you understand your ongoing costs of investing in the Fund and to compare these costs with similar costs of investing in other mutual funds. The example is based on an investment of $1,000 invested in the Fund on November 1, 2008 and held through April 30, 2009.
The first line of the table below provides information about actual account values and actual expenses. In order to estimate the expenses a shareholder paid during the period covered by this report, shareholders can divide their account value by $1,000 (for example, an $8,600 account value divided by $1,000 = 8.6) and then multiply the result by the number in the first line under the heading entitled "Expenses Paid During the Period."
The second line of the table below provides information about hypothetical account values and hypothetical expenses based on the Fund's actual expense ratio and an assumed rate of return of 5% per year before expenses, which is not the Fund’s actual return. The hypothetical account values and expenses may not be used to estimate the actual ending account balance or expenses paid by a shareholder for the period. Shareholders may use this information to compare the ongoing costs of investing in this Fund and other funds. To do so, compare this 5% hypothetical example with the 5% hypothetical examples that appear in other funds' shareholder reports.
| | | | | | | Expenses Paid |
| | | Beginning | | Ending | | During the Period* |
| | | Account Value | | Account Value | | November 1, 2008 |
| | | November 1, 2008 | | April 30, 2009 | | to April 30, 2009 |
| |
| Actual | | $1,000.00 | | $1,001.38 | | $7.44 |
| |
| Hypothetical | | $1,000.00 | | $1,017.36 | | $7.50 |
| (5% annual return | | | | | | |
| before expenses) | | | | | | |
* Expenses are equal to the Fund’s annualized expense ratio of 1.50%, multiplied
by the average account value over the period, multiplied by 181/365 (to reflect the
one-half year period). |
2009 Annual Report 6
| Presidio Fund |
| |
| | | | | Schedule of Investments |
| | | | | | | April 30, 2009 |
| |
| Shares/Principal Amount | | Market Value | | % of Net Assets |
| |
| COMMON STOCKS | | | | |
| |
| Aerospace/Defense | | | | |
| 40,100 | | Argon ST, Inc. * | | $ 817,639 | | 1.79% |
| Business Services | | | | |
| 14,400 | | FTI Consulting, Inc. * | | 790,272 | | |
| 73,900 | | Healthcare Services Group Inc. | | 1,321,332 | | |
| | | | | 2,111,604 | | 4.63% |
| Capital Goods | | | | | | |
| 23,979 | | FARO Technologies, Inc. * | | 363,522 | | |
| 21,500 | | Zebra Technologies Corp. * | | 456,875 | | |
| | | | | 820,397 | | 1.80% |
| Commodities - Agriculture | | | | |
| 5,900 | | Potash Corp. of Saskatchewan, Inc. (Canada) | | 510,291 | | |
| 21,200 | | Syngenta AG ** | | 904,180 | | |
| | | | | 1,414,471 | | 3.10% |
| Commodities - Energy | | | | |
| 21,200 | | Occidental Petroleum Corporation | | 1,193,348 | | 2.62% |
| Commodities - Precious Metals & Related | | | | |
| 4,000 | | Agnico-Eagle Mines Ltd. (Canada) | | 176,440 | | |
| 18,000 | | Central GoldTrust * (Canada) | | 768,600 | | |
| 24,700 | | Goldcorp Inc. (Canada) | | 679,744 | | |
| 30,500 | | Newmont Mining Corp. | | 1,227,320 | | |
| 70,900 | | Yamana Gold, Inc. (Canada) | | 560,819 | | |
| | | | | 3,412,923 | | 7.49% |
| Consumer Products - Apparel & Related | | | | |
| 54,500 | | Carters, Inc. * | | 1,165,210 | | |
| 13,900 | | VF Corp. | | 823,853 | | |
| | | | | 1,989,063 | | 4.36% |
| Consumer Products - Consumables | | | | |
| 14,500 | | The Coca-Cola Company | | 624,225 | | |
| 29,300 | | Philip Morris International, Inc. | | 1,060,660 | | |
| | | | | 1,684,885 | | 3.70% |
| Consumer Products - Electronics | | | | |
| 25,000 | | Electronic Arts Inc. * | | 508,750 | | |
| 48,300 | | Nokia Corp. ** | | 682,962 | | |
| | | | | 1,191,712 | | 2.61% |
| Consumer Products - Other | | | | |
| 31,300 | | Helen of Troy Limited * | | 499,235 | | |
| 68,200 | | Hillenbrand, Inc. | | 1,239,876 | | |
| 48,500 | | Mattel Inc. | | 725,560 | | |
| | | | | 2,464,671 | | 5.41% |
| Financial Services - Banks | | | | |
| 8,400 | | City Holding Co. | | 247,716 | | |
| 1,200 | | Westamerica Bancorp. | | 64,356 | | |
| | | | | 312,072 | | 0.68% |
| Financial Services - Insurance & Insurance Brokers | | | | |
| 6 | | Berkshire Hathaway Inc. Class A * | | 564,000 | | |
| 14,000 | | Marsh & McLennan Companies, Inc. | | 295,260 | | |
| | | | | 859,260 | | 1.88% |
| Healthcare - Capital Equipment | | | | |
| 94,900 | | Allscripts-Misys Healthcare Solutions, Inc. | | 1,178,658 | | 2.59% |
| Healthcare - Products and Services | | | | |
| 36,600 | | Abaxis, Inc. * | | 553,392 | | |
| 18,300 | | Abbott Laboratories | | 765,855 | | |
| 9,700 | | Alcon Inc. (Switzerland) | | 892,497 | | |
| 103,000 | | Boston Scientific Corp. * | | 866,230 | | |
| 44,500 | | CONMED Corp. * | | 592,740 | | |
| 77,000 | | Pfizer Inc. | | 1,028,720 | | |
| 37,500 | | Pharmaceutical Product Development Inc. | | 735,375 | | |
| | | | | 5,434,809 | | 11.92% |
*Non-Income Producing Securities.
** ADR - American Depository Receipt.
The accompanying notes are an integral part of these financial statements.
2009 Annual Report 7
| Presidio Fund |
| |
| | | | | Schedule of Investments |
| | | | | | | April 30, 2009 |
| |
| Shares/Principal Amount | | Market Value | | % of Net Assets |
| |
| COMMON STOCKS | | | | |
| Industrial Products & Services | | | | |
| 56,500 | | Electronics for Imaging, Inc. * | | $ 554,830 | | |
| 36,000 | | Gentex Corp. | | 481,320 | | |
| 125,500 | | Jabil Circuit, Inc. | | 1,016,550 | | |
| | | | | 2,052,700 | | 4.50% |
| Media | | | | | | |
| 84,400 | | News Corp. CL A | | 697,144 | | 1.53% |
| Retail | | | | | | |
| 34,500 | | Advance Auto Parts, Inc. | | 1,509,375 | | 3.31% |
| Technology | | | | | | |
| 48,600 | | Broadcom Corp. * | | 1,127,034 | | |
| 24,900 | | Maxim Integrated Products Inc. | | 337,395 | | |
| | | | | 1,464,429 | | 3.21% |
| Technology - Telecommunications Equipment | | | | |
| 56,500 | | Arris Group Inc. * | | 602,855 | | |
| 77,500 | | TTI Team Telecom International Ltd. (Israel) * | | 56,188 | | |
| | | | | 659,043 | | 1.45% |
| Telecommunications Services | | | | |
| 40,200 | | AT&T, Inc. | | 1,029,924 | | |
| 15,000 | | Verizon Communications Inc. | | 455,100 | | |
| | | | | 1,485,024 | | 3.26% |
| Utilities | | | | | | |
| 54,200 | | Northwestern Corp. | | 1,133,864 | | 2.48% |
| Total for Common Stocks (Cost $36,873,841) | | 33,887,091 | | 74.32% |
| EXCHANGE TRADED FUNDS | | | | |
| 10,700 | | Market Vectors Gold Miners ETF * | | 352,137 | | |
| 55,000 | | PowerShares DB Agriculture * | | 1,390,950 | | |
| 18,100 | | SPDR Gold Shares * | | 1,579,587 | | |
| Total for Exchange Traded Funds (Cost $3,544,931) | | 3,322,674 | | 7.29% |
| CONVERTIBLE BONDS | | | | |
| 330,000 | | Cadence Design Systems, Inc., 1.375%, 12/15/2011 | | 267,712 | | |
| 675,000 | | Ceradyne, Inc., 2.875%, 12/15/2035 | | 537,469 | | |
| 500,000 | | Sepracor Inc., 0.000%, 12/15/2010 | | 436,250 | | |
| 550,000 | | SPSS Inc., 2.500%, 03/15/2012 | | 517,688 | | |
| Total for Convertible Bonds (Cost $1,697,074) | | 1,759,119 | | 3.86% |
| Cash Equivalents | | | | |
| 6,471,011 | | Fidelity Treasury Only Class I 1.80% *** | | 6,471,011 | | 14.19% |
| | | (Cost - $6,471,011) | | | | |
| | | Total Investments | | 45,439,895 | | 99.66% |
| | | (Cost - $48,586,857) | | | | |
| | | Other Assets in Excess of Liabilities | | 155,101 | | 0.34% |
| | | Net Assets | | $ 45,594,996 | | 100.00% |
*Non-Income Producing Securities.
*** Variable rate security; the money market rate shown represents the rate at April 30, 2009.
The accompanying notes are an integral part of these financial statements.
2009 Annual Report 8
| Presidio Fund |
| |
| Statement of Assets and Liabilities | | |
| April 30, 2009 | | | | |
| |
| Assets: | | | | |
| Investment Securities at Market Value | | $ 45,439,895 |
| (Identified Cost - $48,586,857) | | |
| Cash | | | | 6,905 |
| Receivables: | | | | |
| Securities Sold | | | | 356,157 |
| Fund Shares Sold | | 11,200 |
| Dividends and Interest | | 96,482 |
| Total Assets | | | | 45,910,639 |
| Liabilities | | | | |
| Payables: | | | | |
| Administrative Fees | | | | 18,200 |
| Management Fees | | | | 36,400 |
| Securities Purchased | | 245,099 |
| Fund Shares Redeemed | | 15,944 |
| Total Liabilities | | 315,643 |
| Net Assets | | | | $ 45,594,996 |
| Net Assets Consist of: | | | | |
| Paid In Capital | | | | $ 56,576,597 |
| Accumulated Undistributed Net Investment Income | | 15,367 |
| Realized Loss on Investments - Net | | (7,850,005) |
| Unrealized Appreciation in Value | | |
| of Investments Based on Identified Cost - Net | | (3,146,963) |
| Net Assets, for 4,501,758 Shares Outstanding | | $ 45,594,996 |
| (Unlimited number of shares authorized without par value) | | |
| Net Asset Value and Redemption Price (Note 2) | | |
| Per Share ($45,594,996/4,501,758 shares) | | $ 10.13 |
| Minimum Redemption Price Per Share ($10.13 * 0.98) (Note 2) | | $ 9.93 |
| |
| Statement of Operations | | |
| For the year ended April 30, 2009 | | |
| |
| Investment Income: | | | | |
| Dividends (Net of foreign withholding tax of $3,868) (a) | | $ 678,287 |
| Interest | | | | 148,710 |
| Total Investment Income | | 826,997 |
| Expenses: | | | | |
| Administrative Fees | | (Note 3) | | 270,543 |
| Management Fees | | (Note 3) | | 541,087 |
| Total Expenses | | | | 811,630 |
| |
| Net Investment Income | | 15,367 |
| |
| Realized and Unrealized Gain (Loss) from Investments: | | |
| Net Realized Loss from Investments | | (7,737,110) |
| Net Change In Unrealized Depreciation from Investments | | (9,028,948) |
| Net Realized and Unrealized Loss from Investments | | (16,766,058) |
| |
| Net Decrease in Net Assets Resulting from Operations | | $ (16,750,691) |
(a) Dividend income is net of $224,651 of return of capital distribution received from a portfolio company.
The accompanying notes are an integral part of these financial statements.
2009 Annual Report 9
| Presidio Fund |
| |
| Statements of Changes in Net Assets | | | | |
| | | For the year | | For the year |
| | | ended | | ended |
| | | April 30, 2009 | | April 30, 2008 |
| Increase (Decrease) in Net Assets From Operations: | | | | |
| Net Investment Income (Loss) | | $ 15,367 | | $ (411,502) |
| Net Realized Gain (Loss) from Investments | | (7,737,110) | | 2,242,903 |
| Unrealized Depreciation on Investments | | (9,028,948) | | (4,535,544) |
| Net Decrease in Assets Resulting from Operations | | (16,750,691) | | (2,704,143) |
| |
| Distributions to Shareholders from realized gains | | (108,052) | | (3,449,342) |
| |
| Capital Share Transactions: | | | | |
| Proceeds From Sale of Shares | | 10,074,972 | | 19,700,285 |
| Proceeds From Redemption Fees (Note 2) | | 23,857 | | 6,308 |
| Shares Issued on Reinvestment of Dividends | | 102,843 | | 3,335,771 |
| Cost of Shares Redeemed | | (16,010,364) | | (12,322,736) |
| Net Increase (Decrease) from Shareholder Activity | | (5,808,692) | | 10,719,628 |
| Total Increase (Decrease) | | (22,667,435) | | 4,566,143 |
| Net Assets at Beginning of Period | | 68,262,431 | | 63,696,288 |
| Net Assets at End of Period (includes undistributed net | | $ 45,594,996 | | $ 68,262,431 |
| investment gain of $15,367 and $0, respectively) | | | | |
| |
| Share Transactions: | | | | |
| Issued | | 946,930 | | 1,360,326 |
| Reinvested | | 10,624 | | 236,244 |
| Redeemed | | (1,512,155) | | (868,388) |
| Net increase (decrease) in shares | | (554,601) | | 728,182 |
| Shares outstanding beginning of period | | 5,056,359 | | 4,328,177 |
| Shares outstanding end of period | | 4,501,758 | | 5,056,359 |
| Financial Highlights | | | | | | | | | | |
| Selected data for a share of capital stock | | For the year | | For the year | | For the year | | For the period | | |
| outstanding throughout the period: | | ended | | ended | | ended | | ended | | |
| | | April 30, 2009 | | April 30, 2008 | | April 30, 2007 | | April 30, 2006* | | |
| Net Asset Value - | | | | | | | | | | |
| Beginning of Period | | $ 13.50 | | $ 14.72 | | $ 13.00 | | $ 10.00 | | |
| Net Investment Loss **** | | 0.00 | | (0.08) | | (0.06) | | (0.07) | | |
| Net Gains or Losses on Securities | | | | | | | | | | |
| (realized and unrealized) | | (3.35) | | (0.43) | | 1.78 | | 3.07 | | |
| Total from Investment Operations | | (3.35) | | (0.51) | | 1.72 | | 3.00 | | |
| Less Distributions from realized gains | | (0.02) | | (0.71) | | 0.00 | | 0.00 | | |
| Net Asset Value - | | | | | | | | | | |
| End of Period | | $ 10.13 | | $ 13.50 | | $ 14.72 | | $ 13.00 | | |
| Total Return ***** | | (24.79)% | | (3.65)% | | 13.23% | | 30.00% | *** | |
| Ratios/Supplemental Data | | | | | | | | | | |
| Net Assets - End of Period (Thousands) | | $ 45,595 | | $ 68,262 | | $ 63,696 | | $ 36,227 | | |
| Ratio of Expenses to Average Net Assets | | 1.50% | | 1.50% | | 1.50% | | 1.50% | ** | |
| Ratio of Net Income to Average Net Assets | | 0.03% | | -0.59% | | -0.47% | | -0.59% | ** | |
| Portfolio Turnover Rate | | 102.89% | | 84.14% | | 57.55% | | 29.50% | | |
* May 3, 2005 (Commencement of investment operations) through April 30, 2006
** Annualized *** Not annualized.
**** Per share amounts were calculated using the average shares method.
***** Total return in the above table represents the rate that the investor would have earned or lost on an investment in the Fund assuming reinvestment of distributions to shareholders.
The accompanying notes are an integral part of these financial statements.
2009 Annual Report 10
NOTES TO FINANCIAL STATEMENTS
PRESIDIO FUND
APRIL 30, 2009
1.) ORGANIZATION
Presidio Fund (the "Fund") is a non-diversified series of the Presidio Funds (the "Trust"), which is registered under the Investment Company Act of 1940, as amended, as an open-end management investment company. The Trust was organized in Ohio as a business trust on January 22, 2004, and may offer shares of beneficial interest in a number of separate series, each series representing a distinct fund with its own investment objectives and policies. At present, the Fund is the only series authorized by the Trust. The Fund commenced operations on May 3, 2005. The Fund’s investment adviser is KCO Investments, Inc. (the “Adviser”). The Fund's investment objective is long-term growth of capital.
2.) SIGNIFICANT ACCOUNTING POLICIES
SECURITY VALUATION: Securities that are traded on any exchange or on the NASDAQ over-the-counter market generally are valued at the last quoted sale price. Lacking a last sale price, a security is generally valued at its last bid price except when, in the Adviser's opinion, the last bid price does not accurately reflect the current value of the security. When market quotations are not readily available, when the Adviser determines the last bid price does not accurately reflect the current value or when restricted or illiquid securities are being valued, such securities are valued as determined in good faith by the Adviser, in conformity with guidelines adopted by and subject to review of the Board of Trustees.
Fixed income securities generally are valued by using market quotations, but may be valued on the basis of prices furnished by a pricing service when the Adviser believes such prices accurately reflect the fair market value of such securities. A pricing service utilizes electronic data processing techniques based on yield spreads relating to securities with similar characteristics to determine prices for normal institutional-size trading units of debt securities without regard to sale or bid prices. If the Adviser decides that a price provided by the pricing service does not accurately reflect the fair market value of the securities, when prices are not readily available from a pricing service or when restricted or illiquid securities are being valued, securities are valued at fair value as determined in good faith by the Adviser, in conformity with guidelines adopted by and subject to review of the Board of Trustees. Short term investments in fixed income securities with ma turities of less than 60 days when acquired, or which subsequently are within 60 days of maturity, are valued by using the amortized cost method of valuation, which the Board of Trustees has determined will represent fair value.
In accordance with the Trust’s good faith pricing guidelines, the Adviser is required to consider all appropriate factors relevant to the value of securities for which it has determined other pricing sources are not available or reliable as described above. No single standard for determining fair value controls, since fair value depends upon the circumstances of each individual case. As a general principle, the current fair value of securities being valued by the Adviser would appear to be the amount which the owner might reasonably expect to receive for them upon their current sale. Methods which are in accord with this principle may, for example, be based on (i) a multiple of earnings; (ii) a discount from market of a similar freely traded security (including a derivative security or a basket of securities traded on other markets, exchanges or among dealers); or (iii) yield to maturity with respect to debt issues, or a combination of these and other methods.
FAS 157: The Fund adopted Financial Accounting Standards Board Statement of Financial Accounting Standards No. 157, Fair Value Measurements ("FAS 157"), effective May 1, 2008. In accordance with FAS 157, fair value is defined as the price that the Fund would receive to sell an asset or pay to transfer a liability in an orderly transaction between market participants at the measurement date. FAS 157 also establishes a framework for measuring fair value, and a three-level hierarchy for fair value measurements based upon the transparency of inputs to the valuation of an asset or liability. The three-tier hierarchy of inputs is summarized below.
Level 1 - quoted prices in active markets for identical investments
Level 2 - other significant observable inputs (including quoted prices for similar investments, interest rates, prepayment speeds, credit risk, etc.)
Level 3 - significant unobservable inputs (including the Fund's own assumptions in determining the fair value of investments)
The inputs or methodology used for valuing securities are not necessarily an indication of the risk associated with investing in those securities.
2009 Annual Report 11
Notes to the Financial Statements - continued
The following table summarizes the valuation of the Fund's investments by the above fair value hierarchy levels as of April 30, 2009:
| | | Investments |
| Valuation Inputs | | in Securities |
| Level 1- Quoted Prices | | $45,439,895 |
| Level 2- Significant Other Observable Inputs | | 0 |
| Level 3- Significant Unobservable Inputs | | 0 |
| Total | | $45,439,895 |
SHARE VALUATION: The net asset value (the “NAV”) is generally calculated as of the close of trading on the New York Stock Exchange (normally 4:00 p.m. Eastern time) every day the Exchange is open. The NAV is calculated by taking the total value of the Fund’s assets, subtracting its liabilities, and then dividing by the total number of shares outstanding, rounded to the nearest cent. The offering price and redemption price per share is equal to the net asset value per share, except that shares of each fund are subject to a redemption fee of 2% if redeemed within 180 days of purchase. To discourage large and frequent short-term trades by investors, and to compensate the Fund for costs that may be incurred by such trades, the Fund imposed the redemption fee. During the fiscal year ended April 30, 2009 proceeds from redemption fees were $23,857.
FOREIGN CURRENCY: Investment securities and other assets and liabilities denominated in foreign currencies are translated into U.S. dollar amounts at the date of valuation. Purchases and sales of investment securities and income and expense items denominated in foreign currencies are translated into U.S. dollar amounts on the respective dates of such transactions.
The Fund does not isolate that portion of the results of operations resulting from changes in foreign exchange rates on investments from the fluctuations arising from changes in market prices of securities held. Such fluctuations are included with the net realized and unrealized gain or loss from investments.
Net realized foreign exchange gains or losses arise from sales of foreign currencies, currency gains or losses realized between the trade and settlement dates on securities transactions, and the difference between the amounts of dividends, interest, and foreign withholding taxes recorded on the Fund's books and the U.S. dollar equivalent of the amounts actually received or paid. Net unrealized foreign exchange gains and losses arise from changes in the fair values of assets and liabilities, other than investments in securities at fiscal period end, resulting from changes in exchange rates.
SHORT SALES: The Fund may sell a security it does not own in anticipation of a decline in the fair value of that security. When the Fund sells a security short, it must borrow the security sold short and deliver it to the broker-dealer through which it made the short sale. A gain, limited to the price at which the Fund sold the security short, or a loss, unlimited in size, will be recognized upon the termination of a short sale.
OPTION WRITING: When the Fund writes an option, an amount equal to the premium received by the Fund is recorded as a liability and is subsequently adjusted to the current fair value of the option written. Premiums received from writing options that expire unexercised are treated by the Fund on the expiration date as realized gains from investments. The difference between the premium and the amount paid on effecting a closing purchase transaction, including brokerage commissions, is also treated as a realized gain, or, if the premium is less than the amount paid for the closing transaction, as a realized loss. If a call option is exercised, the premium is added to the proceeds from the sale of the underlying security or currency in determining whether the Fund has realized a gain or loss. If a put option is exercised, the premium reduces the cost basis of the securities purchased by the Fund. The Fund as a writer of an option bears the market risk of an unfavorable change in the price of the security underlying the written option.
SECURITY LOANS: The Fund may make long and short term loans of its portfolio securities to parties such as broker-dealers, banks or institutional investors. The Fund would receive compensation in the form of fees, or it would retain a portion of interest on the investment of any cash received as collateral. The Fund continues to receive interest or dividends on the securities loaned. The loans are secured by collateral at least equal, at all times, to the fair value of the securities loaned plus accrued interest. Gain or loss in the fair value of the securities loaned that may occur during the term of the loan will be for the account of the Fund. The Fund has the right under the lending agreement to recover the securities from the borrower on demand.
2009 Annual Report 12
Notes to the Financial Statements - continued
SECURITY TRANSACTION TIMING: Security transactions are recorded on a trade date basis. Dividend income is recognized on the ex-dividend date. Interest income is recognized on an accrual basis. Discounts and premiums on securities purchased are amortized over the life of the respective securities. Withholding taxes on foreign dividends have been provided for in accordance with the Fund’s understanding of the applicable country’s tax rules and rates.
FEDERAL INCOME TAXES: The Fund’s policy is to comply with the requirements of Subchapter M of the Internal Revenue Code that are applicable to regulated investment companies and to distribute all of its taxable income to its shareholders. Therefore, no federal income tax provision is required. It is the Fund's policy to distribute annually, prior to the end of the calendar year, dividends sufficient to satisfy excise tax requirements of the Internal Revenue Service. This Internal Revenue Service requirement may cause an excess of distributions over the book year-end accumulated income. In addition, it is the Fund's policy to distribute annually, after the end of the fiscal year, any remaining net investment income and net realized capital gains.
FASB 48: The Fund adopted Financial Accounting Standards Board (FASB) Interpretation No. 48 - Accounting for Uncertainty in Income Taxes on May 1, 2007. FASB Interpretation No. 48 requires the tax effects of certain tax positions to be recognized. These tax positions must meet a "more likely than not" standard that, based on their technical merits, they have a more than fifty percent likelihood of being sustained upon examination. At adoption, the financial statements must be adjusted to reflect only those tax positions that are more likely than not of being sustained. Management of the Fund does not believe that any adjustments were necessary to the financial statements at adoption.
DISTRIBUTIONS TO SHAREHOLDERS: Distributions to shareholders, which are determined in accordance with income tax regulations, are recorded on the ex-dividend date.
USE OF ESTIMATES: The preparation of financial statements in conformity with accounting principles generally accepted in the United States of America requires management to make estimates and assumptions that affect the reported amounts of assets and liabilities and disclosure of contingent assets and liabilities at the date of the financial statements and the reported amounts of increases and decreases in net assets from operations during the reporting period. Actual results could differ from those estimates.
NEW ACCOUNTING PRONOUNCEMENT: In March 2008, FASB issued the Statement of Financial Accounting Standards No.161, "Disclosures about Derivative Instruments and Hedging Activities" ("SFAS 161"). SFAS 161 is effective for fiscal years and interim periods beginning after November 15, 2008. SFAS 161 requires enhanced disclosures about the Fund’s derivative and hedging activities, including how such activities are accounted for and their effect on the Fund’s financial position, performance and cash flows. Management is currently evaluating the impact the adoption of SFAS 161 will have on the Fund’s financial statements and related disclosures.
3.) MANAGEMENT AND SERVICES AGREEMENTS
The Fund has a management agreement with the Adviser (the "Management Agreement") to furnish investment advisory services to the Fund, consistent with the Fund’s objectives and policies. The Fund will pay the Adviser a monthly management fee based on the Fund's average daily net assets at the annual rate of 1.00% . The Fund also has a services agreement with the Adviser (the "Services Agreement"), under which the Fund pays the Adviser a monthly fee based on the Fund's average daily net assets at the annual rate of .50% on assets up to $75 million and .40% on assets in excess of $75 million. Under the Services Agreement, the Adviser provides administrative and supervisory services as well as the services of a Chief Compliance Officer; and assumes all Fund operating expenses other than the management fee, brokerage fees and commissions, taxes, borrowing costs (such as (a) interest and (b) dividend expenses on securities sold short) and extraordinary or non-recurring expen ses. Kevin O'Boyle is the sole shareholder of the Adviser and also serves as a trustee/officer of the Fund.
For the fiscal year ended April 30, 2009, the Adviser earned management fees totaling $541,087, of which $36,400 was still due to the Adviser at April 30, 2009. For the same period the Adviser earned administrative fees of $270,543, of which $18,200 was still due to the Adviser at April 30, 2009.
4.) INVESTMENT TRANSACTIONS
For the fiscal year ended April 30, 2009, purchases and sales of investment securities other than U.S. Government obligations and short-term investments aggregated $46,621,408 and $50,626,858, respectively. Purchases and sales of U.S. Government obligations aggregated $14,440,144 and $19,500,000, respectively.
2009 Annual Report 13
Notes to the Financial Statements - continued
5.) TAX MATTERS
As of April 30, 2009, the tax basis components of distributable earnings, unrealized appreciation (depreciation) and cost of investment securities were as follows:
| Undistributed ordinary income | | $ 15,367 |
| Capital loss carryforward expiring 4/30/2017+ | | ($1,279,286) |
| Post-October capital loss deferrals between realized 11/1/08 and 4/30/2009* | | ($6,555,835) |
| Gross unrealized appreciation on investment securities | | $2,455,731 |
| Gross unrealized depreciation on investment securities | | ($5,683,226) |
| Net unrealized depreciation on investment securities | | ($3,227,495) |
| Cost of investment securities, including ST investments# | | $48,631,816 |
*These deferrals are considered incurred in the subsequent year.
+ The capital loss carryforward will be used to offset any capital gains realized by the Fund in future years through the expiration date. The Fund will not make distributions from capital gains while a capital loss carryforward remains.
# The difference between the tax cost and book cost basis of investments is due to wash sales disallowed for tax purposes.
6.) RELATED PARTY TRANSACTIONS
Kevin C. O’Boyle is the owner and control person of the Adviser and also serves as a trustee/officer of the Fund. This individual receives benefits from the Adviser resulting from management and administrative fees paid to the Adviser by the Fund.
The Trustees who are not interested persons of the Fund received, in aggregate, $12,000 in Trustee fees from the Adviser through the fiscal year ended April 30, 2009.
2009 Annual Report 14
ADDITIONAL INFORMATION
(UNAUDITED) |
APPROVAL OF INVESTMENT ADVISORY AGREEMENT
On April 17, 2009 the Board of Trustees considered the renewal of the Management Agreement. In reviewing the Management Agreement, the Board of Trustees received materials from the Adviser addressing the following factors: (i) the investment performance of the Fund and the Adviser; (ii) the nature, extent and quality of the services provided by the Adviser to the Fund; (iii) the cost of the services to be provided and the profits to be realized by the Adviser and its affiliates from the relationship with the Fund; (iv) the extent to which economies of scale will be realized as the Fund grows; and (v) whether the fee levels reflect these economies of scale to the benefit of shareholders.
To evaluate the performance of the Fund, the Trustees were provided information regarding the Fund's performance compared to a group of funds of similar size, style and objective (the "Peer Group"), as well as a larger group of funds categorized by Morningstar as small blend funds. The Trustees also received performance information for the Wilshire 5000 Index through the calendar year period ended December 31, 2008. The Trustees noted that the Fund outperformed the Wilshire 5000 Index and the Peer Group since inception and over the 12-month period ended December 31, 2008.
The Trustees also analyzed the Adviser's resources, capabilities, and experience with respect to providing quality advisory services to the Fund. The Trustees reviewed the Adviser's Form ADV, Code of Ethics certifications, and financial condition. The Board also reviewed the Adviser's investment management experience and background, and discussed the firm's ability to meet its obligations under the Management Agreement. The Trustees concluded that the nature and extent of the services provided by the Adviser were consistent with their expectations, and that the quality of services, particularly those provided by the portfolio manager, was excellent.
The Trustees noted that the Fund's expense ratio of 1.50% was higher than its Peer Group's average expense ratio of 1.46%, but within the Peer Group's range. While the Fund's management fee of 1.00% of assets was above the category average of 0.86%, the Fund had no front-end load, deferred load, nor 12b-1 expense. The Peer Group's average front-end load, deferred load, and 12b-1 expenses were 1.20%, 0.49%, and 0.28% respectively. The Trustees also reviewed a profit and loss statement prepared by the Adviser that detailed the Adviser's revenue and expenses associated with Fund operations. The Trustees concluded that the advisory fee was reasonable.
In reviewing the Services Agreement, the Trustees noted that the Adviser has implemented breakpoints, and agreed to reduce the breakpoints in fees payable under the Services Agreement. Service fee breakpoints will benefit shareholders as the Fund's assets grow.
Following the Trustees' evaluation of the Adviser with respect to the factors outlined above, the Board concluded that renewal of the Management and Services Agreements would be in the best interests of the Fund, and unanimously voted to renew the Agreements.
2009 Annual Report 15
REPORT OF INDEPENDENT REGISTERED PUBLIC ACCOUNTING FIRM
To the Shareholders and Board of Trustees
of Presidio Fund,
a Series of the Presidio Funds |
We have audited the accompanying statement of assets and liabilities of the Presidio Fund, a Series of the Presidio Funds (the "Fund"), including the schedule of investments, as of April 30, 2009 and the related statement of operations for the year then ended, the statements of changes in net assets for the two years in the period then ended and the financial highlights for the three years in the period then ended and for the period May 3, 2005 (commencement of investment operations) through April 30, 2006. These financial statements and financial highlights are the responsibility of the Fund's management. Our responsibility is to express an opinion on these financial statements based on our audits.
We conducted our audits in accordance with the standards of the Public Company Accounting Oversight Board (United States). Those standards require that we plan and perform the audit to obtain reasonable assurance about whether the financial statements and financial highlights are free of material misstatement. An audit includes examining, on a test basis, evidence supporting the amounts and disclosures in the financial statements. Our procedures included confirmation of securities and cash owned as of April 30, 2009, by correspondence with the custodian and brokers. An audit also includes assessing the accounting principles used and significant estimates made by management, as well as evaluating the overall financial statement presentation. We believe that our audits provide a reasonable basis for our opinion.
In our opinion, the financial statements and financial highlights referred to above present fairly, in all material respects, the financial position of the Presidio Fund, a Series of the Presidio Funds as of April 30, 2009, the results of its operations and changes in its net assets and the financial highlights for the periods indicated therein in conformity with accounting principles generally accepted in the United States of America.

Abington, Pennsylvania
June15, 2009
2009 Annual Report 16
TRUSTEES AND OFFICERS - Unaudited
The Board of Trustees supervises the business activities of the Trust. The names of the Trustees and executive officers of the Trust are shown below. Each Trustee serves until the Trustee dies, resigns, retires or is removed. Officers hold office for one year and until their respective successors are chosen and qualified. The Statement of Additional Information includes additional information about the Fund’s Trustees and officers and is available, without charge upon request, by calling 1-800-595-3166. The Trustees and executive officers of the Trust and their principal business activities during the past five years are:
Interested Trustees and Officers
| | | | | | | | | | | Other |
| Name, | | Position | | Length of | | Principal | | Number of | | Directorships |
| Address(1), | | with the | | Time Served | | Occupation(s) | | Portfolios | | Held By |
| and Age | | Trust | | | | During | | Overseen By | | Trustee or |
| | | | | | | Past 5 Years | | Trustee | | Officer |
| |
| Kevin C. O'Boyle(2), 44 | | President, | | Since 2005 | | President of KCO Investments, | | 1 | | None |
| | | Secretary, | | | | Inc., a registered investment | | | | |
| | | Treasurer, | | | | adviser (2005 - current), private | | | | |
| | | Chief | | | | investor (2004 - 2005). | | | | |
| | | Financial | | | | | | | | |
| | | Officer, Chief | | | | | | | | |
| | | Compliance | | | | | | | | |
| | | Officer, and | | | | | | | | |
| | | Trustee | | | | | | | | |
| |
| Rodney Y. Chen, 46 | | Vice | | Since 2005 | | Real estate development, (1996 - | | N/A | | N/A |
| | | President | | | | current). | | | | |
Independent Trustees
| | | | | | | Principal | | Number of | | Other |
| Name, | | Position | | Length of | | Occupation(s) | | Portfolios Directorships |
| Address(1), | | with the | | Time Served | | During | | Overseen By | | Held By |
| and Age | | Trust | | | | Past 5 Years | | Trustee | | Trustee or |
| | | | | | | | | | | Officer |
| |
| Eric Gonzales, 42 | | Independent | | Since 2005 | | Chief Executive Officer, Ujogo | | 1 | | None |
| | | Trustee | | | | (2006 - current), General Partner, | | | | |
| | | | | | | DCM - Doll Capital Management, | | | | |
| | | | | | | (2004 - 2005). | | | | |
| |
| John McGrath, 44 | | Independent | | Since 2005 | | Vice President and CFO, Network | | 1 | | Endwave |
| | | Trustee | | | | Equipment Technologies, (2001 - | | | | Corporation, |
| | | | | | | current). | | | | Actel |
| | | | | | | | | | | Corporation |
| |
| Eric H. Sussman, 42 | | Independent | | Since 2005 | | President, Amber Capital, Inc., | | 1 | | Causeway |
| | | Trustee, | | | | real estate investments, (1994 - | | | | Capital |
| | | Chairman of | | | | current), Lecturer, UCLA, (1995 - | | | | Management |
| | | the Board | | | | current). | | | | Trust |
(1)The address of each trustee and officer is c/o Presidio Fund, 3717 Buchanan Street, Suite 200, San Francisco, CA 94123.
(2)Kevin C. O'Boyle is considered an "interested person" as defined in Section 2(a)(19) of the Investment Company Act of 1940 by virtue of his affiliation with the Adviser.
2009 Annual Report 17
Board of Trustees
Eric Gonzales
John McGrath
Kevin O’Boyle
Eric Sussman
Investment Adviser
KCO Investments, Inc.
Counsel
Thompson Hine LLP
Custodian
U.S. Bank, NA
Dividend Paying Agent,
Shareholders' Servicing Agent,
Transfer Agent
Mutual Shareholder Services, LLC
Fund Administrator
Premier Fund Solutions, Inc.
Independent Registered
Public Accounting Firm
Sanville & Company |
This report is provided for the general information of the shareholders of the Presidio Fund. This report is not intended for distribution to prospective investors in the Fund, unless preceded or accompanied by an effective prospectus.
Presidio Funds
1-800-595-3166
www.presidiofunds.com
Item 2. Code of Ethics.
The registrant has adopted a code of ethics that applies to the registrant’s principal executive officer and the principal financial officer. The registrant has not made any amendments to its code of ethics during the covered period. The registrant has not granted any waivers from any provisions of the code of ethics during the covered period. A copy of the registrant’s Code of Ethics is filed herewith.
Item 3. Audit Committee Financial Expert.
The registrant’s Board of Trustees has determined that Eric Gonzales, John McGrath and Eric Sussman are audit committee financial experts. Mr. Gonzales, Mr. McGrath and Mr. Sussman are independent for purposes of this Item 3.
Item 4. Principal Accountant Fees and Services.
(a-d) The following table details the aggregate fees billed for each of the last two fiscal years for audit fees, audit-related fees, tax fees and other fees by the principal accountant to the registrant. The principal accountant has provided no services to the adviser or any entity controlled by, or under common control with the adviser that provides ongoing services to the registrant.
| | | FYE 4/30/09 | | FYE 4/30/08 |
| Audit Fees | | $11,000 | | $10,000 |
| Audit-Related Fees | | $0 | | $0 |
| Tax Fees | | $1,100 | | $1,100 |
| All Other Fees | | $0 | | $500 |
Nature of Tax Fees: preparation of Excise Tax Statement and 1120 RIC.
Nature of All Other Fees: Review of Semi-Annual Report and meeting attendance.
(e) (1) The audit committee approves all audit and non-audit related services and, therefore, has not adopted pre-approval policies and procedures described in paragraph (c)(7) of Rule 2-01 of Regulation S-X.
(e) (2) None of the services described in paragraph (b) through (d) of this Item were approved by the audit committee pursuant to paragraph (c)(7)(i)(C) of Rule 2-01 of Regulation S-X.
(f) All of the principal accountant’s hours spent on auditing the registrant’s financial statements were attributed to work performed by full-time permanent employees of the principal accountant.
(g) The following table indicates the aggregate non-audit fees billed by the registrant’s principal accountant for services to the registrant , the registrant’s investment adviser (not sub-adviser), and any entity controlling, controlled by, or under common control with the adviser that provides ongoing services to the registrant, for the last two years.
| Non-Audit Fees | | FYE 4/30/09 | | FYE 4/30/08 |
| Registrant | | $1,100 | | $1,600 |
| Registrant’s Investment Adviser | | $0 | | $0 |
(h) The principal accountant provided no services to the investment adviser or any entity controlling, controlled by, or under common control with the adviser that provides ongoing services to the registrant.
Item 5. Audit Committee of Listed Companies. Not applicable.
Item 6. Schedule of Investments. Schedule filed with Item 1.
Item 7. Disclosure of Proxy Voting Policies and Procedures for Closed-End Management Investment Companies. Not applicable.
Item 8. Portfolio Managers of Closed End Management Investment Companies. Not applicable.
Item 9. Purchases of Equity Securities by Closed-End Management Investment Companies and Affiliated Purchasers. Not applicable.
Item 10. Submission of Matters to a Vote of Security Holders.
The registrant has not adopted procedures by which shareholders may recommend nominees to the registrant’s board of trustees.
Item 11. Controls and Procedures.
(a) The registrant’s president and chief financial officer concluded that the disclosure controls and procedures (as defined in Rule 30a-3(c) under the Investment Company Act of 1940 (the “Act”)) were effective as of a date within 90 days of the filing date of this report, based on the evaluation of these controls and procedures required by Rule 30a-3(b) under the Act.
(b) There were no changes in the registrant’s internal control over financial reporting (as defined in Rule 30a-3(d) under the Act) that occurred during the registrant’s second fiscal quarter of the period covered by this report that have materially affected, or are reasonably likely to materially affect, the registrant’s internal control over financial reporting.
Item 12. Exhibits.
(a)(1) Code of Ethics. Filed herewith.
(a)(2) Certifications pursuant to Section 302 of the Sarbanes-Oxley Act of 2002. Filed herewith.
(b) Certification pursuant to Section 906 Certification of the Sarbanes-Oxley Act of 2002. Filed
Pursuant to the requirements of the Securities Exchange Act of 1934 and the Investment Company Act of 1940, the registrant has duly caused this report to be signed on its behalf by the undersigned, thereunto duly authorized.
| | By: /s/ Kevin C. O’Boyle
Kevin C. O’Boyle
President |
Pursuant to the requirements of the Securities Exchange Act of 1934 and the Investment Company Act of 1940, this report has been signed below by the following persons on behalf of the registrant and in the capacities and on the dates indicated.
| | By: /s/ Kevin C. O’Boyle
Kevin C. O’Boyle
President |
| | By: /s/ Kevin C. O’Boyle
Kevin C. O’Boyle
Chief Financial Officer |