UNITED STATES
SECURITIES AND EXCHANGE COMMISSION
WASHINGTON, D.C. 20549 |
CERTIFIED SHAREHOLDER REPORT OF REGISTERED MANAGEMENT
INVESTMENT COMPANIES |
Investment Company Act file number 811-21707
| (Exact name of registrant as specified in charter) |
| |
| 3717 Buchanan Street, Suite 200 | |
| San Francisco, CA | 94123 |
| (Address of principal executive offices) | (Zip code) |
Kevin C. O’Boyle
Presidio Fund
3717 Buchanan Street, Suite 200
San Francisco, CA 94123
(Name and address of agent for service) |
Registrant’s telephone number, including area code: (415) 441-3034
Date of fiscal year end: April 30
Date of reporting period: October 31, 2009
Form N-CSR is to be used by management investment companies to file reports with the Commission not later than 10 days after the transmission to stockholders of any report that is required to be transmitted to stockholders under Rule 30e-1 under the Investment Company Act of 1940 (17 CFR 270.30e -1). The Commission may use the information provided on Form N-CSR in its regulatory, disclosure review, inspection and policymaking roles.
A registrant is required to disclose the information specified by Form N-CSR, and the Commission will make this information public. A registrant is not required to respond to the collection of information contained in Form N-CSR unless the Form displays a currently valid Office of Management and Budget ("OMB") control number. Please direct comments concerning the accuracy of the information collection burden estimate and any suggestions for reducing the burden to Secretary, Securities and Exchange Commission, 450 Fifth Street, NW, Washington, DC 20549-0609. The OMB has reviewed this collection of information under the clearance requirements of 44 U.S.C. § 3507.
Item 1. Reports to Stockholders.
Presidio Fund
Semi-Annual Report
October 31, 2009
Presidio Funds
1-800-595-3166
www.presidiofunds.com |
Dear Shareholder:
This semi-annual shareholder report covers the six-month period ended October 31, 2009. Please note that the Fund will pay a small dividend distribution but no capital gains distribution in calendar year 2009. Visit www.presidiofunds.com for additional details.
Performance Summary
| | | | | | | | | | | |
| | | | | | | 3-year | | Compounded | | Cumulative | |
| | 6-month | | 1-year | | | Compounded | | Annual Return | | Return | |
| | Return | | Return | | | Annual Return | | Since Inception* | | Since Inception* | |
| Presidio Fund | 16.09% | | 16.25% | | | <2.23%> | | 4.86% | | 23.83% | |
| Wilshire 5000 | 19.68% | | 10.71% | | | <6.74%> | | 0.11% | | 0.48% | |
| *Inception May 3, 2005 | | | | | | | | | | |
Presidio Fund's net asset value on October 31, 2009 was $11.76. Total net assets amounted to $53,529,001. At period end, 89.10% of the Fund's net assets were invested in equities, 1.74% in convertible debt, and 9.16% in net cash.** The median market capitalization of the Fund's equity investments was $6.372 billion. Large-cap stocks (>$10 billion market capitalization) comprised 36.6% of the portfolio, mid-cap stocks 27.7% (market cap between $2-10 billion), and small-cap stocks 24.7% (market capitalization < $2 billion).
U.S. stock markets rallied for almost the entire six-month period ended October 31, 2009; faltering only during the last three weeks of the reporting period. Stocks were buoyed by the Federal Reserve's "quantitative easing" policies to support financial institutions and general belief that the U.S. economy has reached a bottom for this business cycle.
Presidio Fund's strongest returns for the period were generated by its healthcare and convertible bond investments. Healthcare sector stock valuations improved from abnormally low levels even as healthcare reform continues to loom. The convertible bond investment returns were helped not only by quantitative easing, but by the acquisition by larger companies of two holdings: SPSS and Sepracor. On the commodities front, the Fund's investments in Occidental Petroleum and gold mining stocks did well, while investments in the agricultural sector lagged. Investments in companies whose businesses are economically sensitive (e.g. Jabil and News Corporation) or whose sales are geared to international markets (e.g. - Avon, Philip Morris International, and Coca Cola) also generated strong returns.
Overall, Presidio Fund's performance lagged the benchmark index for the reporting period, but compared favorably to the benchmark index for all periods that extended longer than six months. The Fund's portfolio is weighted towards high-quality companies with strong balance sheets and cash flows, typically participating in less economically-sensitive sectors. During the six months ended October 31, 2009, the stocks of the least financially sound companies performed best, helped by the return of liquidity to financial institutions; while stocks in economically-sensitive sectors also generated very strong returns.
2009 Semi-Annual Report 1
One Year Later
The recent Dubai debt obligation deferral request is a reminder that the relative financial stability witnessed for the past several months is dependent upon continued government intervention into the global financial system and economy. World markets and economies do not yet appear able to stand on their own two feet, as bank losses have not been fully recognized and markets still have not been allowed to clear. Government interventions into markets do not come without cost, which should now be obvious to everyone. In my opinion, the current magnitude of intervention is unlikely to be sustainable for an indefinite period of time. Therefore, one should expect significant market volatility in the future.
Presidio Fund continues to emphasize investments in strong business franchises that are not particularly sensitive to the economic environment, as well as companies with significant secular growth opportunities. The Fund also maintained its strategy to emphasize "hard" assets. However, the unusual buying opportunity in convertible bonds has passed, so I do not anticipate new bond purchases any time soon. The Fund's cash level continues to be reduced as buying opportunities present themselves, as the returns from holding cash are now negligible.
Portfolio Update
At period end, basic materials investments comprised almost 23% of the Fund's net asset value, with gold and gold mining investments comprising 11%, agriculture and related investments almost 9%, and oil and gas exploration 3%. During the period ended October 31, 2009, the Fund reduced its investment in PowerShares DB Agriculture ETF and purchased two new agriculture-related investments: Compass Minerals and Monsanto. Presidio Fund also sold its gold-related ETF investments, replacing them with Central GoldTrust, a Canadian-based closed end fund that invests in gold bullion; and an increased investment in Goldcorp, a gold mining company also based in Canada.
Compass Minerals is the largest and most efficient producer of rock salt in the U.S. and UK, and the largest producer of natural sulfate of potash (SOP) in the U.S. Rock salt is used in highway de-icing products and consumer and industrial applications. Highway de-icing product demand varies with the weather, but industry demand is otherwise quite stable. Due to the essential nature of its products and supply constraints, Compass Minerals' salt business maintains strong pricing power. SOP is a yield-improving specialty fertilizer applied to chloride-sensitive crops such as fruits, vegetables, nuts, turf, and nursery products. The company is expanding its SOP salt pond operations, which will enable it to limit raw materials purchases, thereby reducing costs significantly. This should result in increased market share and profit margins over time. Due to its unique salt resources, Compass Minerals appears to be very well-positioned to grow its earnings over time even if economi c weakness persists.
Monsanto is the leading producer of biotech seeds and breeding technologies used by farmers to improve crop yields and a crop protection herbicide known as glyphosate. Global grain demand is increasing over time due to population growth and improved diets in developing economies, along with increased bio fuels demand in the U.S. and EU. Since arable land per capita continues to decline, crop yields must rise to meet increased demand. The company's earnings will decline in FY'10 (August) due to excess channel inventory of glyphosate and increased competition in that business. This has prevented the stock from rebounding along
2009 Semi-Annual Report 2
with the market in 2009. However, the seed business remains poised for strong growth, which could enable Monsanto to generate solid double-digit earnings growth for many years to come. The company's product development pipeline also appears to not be fully reflected in the stock valuation, making Monsanto an attractive investment at this time.
Other notable portfolio investments included the addition of Avon Products; Cleco; Clorox; three everyday-item retailers (Family Dollar Stores, Kroger, and Safeway); Microsoft; W.R. Berkley; and significant increases in our Abaxis, Abbott Labs, and Maxim Integrated Products investments. The Fund also made small investments in Accenture, Copart, Flir Systems, Iris International, and O'Reilly Automotive.
During the period, Presidio Fund sold its positions in Arris, Boston Scientific, Electronics for Imaging, Nokia, Pharmaceutical Product Development, Sepracor (convertible bond), SPSS (convertible bond), and Verizon; and its remaining positions in Faro Technologies, Gentex, and TTI Team Telecom.
Conclusion
In closing, I would like to note that effective August 28, 2009, the break point at which the administrative services fee decreases from 50 basis points to 40 basis points was reduced from $75 million in net assets to $50 million. We continue to focus on maintaining or improving the operational efficiency of the Fund so that the expense ratio can be reduced further if assets grow.
Thank you for your continued support and trust.
Sincerely,

President
**Net cash represents cash equivalents and other assets less liabilities.
Performance data quoted represents past performance. Past performance does not guarantee future results. The investment return and principal value of an investment will fluctuate so that an investor's shares, when redeemed, may be worth more or less than their original cost. Current performance may be lower or higher than the performance data quoted. You may obtain performance data current to the most recent month-end by calling 1-800-595-3166. Investors should consider the investment objective, risks, and charges and expenses of the Fund carefully before investing. The Fund's prospectus contains this and other information about the Fund and is available upon request by calling 1-800-595-3166 or by visiting www.presidiofunds.com. Please obtain and carefully read the prospectus before investing.
2009 Semi-Annual Report 3
By Industry Sectors Based on Percent of Net Assets
(Unaudited) |
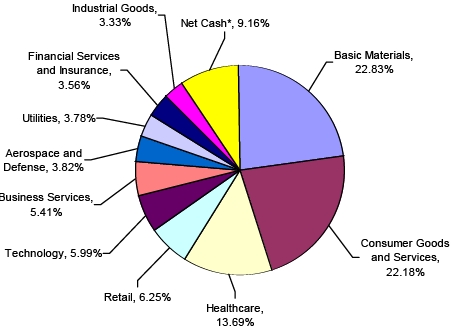
*Net Cash represents cash equivalents and other assets less liabilities.
| | PERFORMANCE INFORMATION
October 31, 2009 NAV $11.76
Average annual rate of return (%) for periods ended October 31, 2009. |
| | | | |
| | | | Since | |
| | 1 Year | (A) | Inception | (A) |
| Presidio Fund | 16.25 | % | 4.86 | % |
| Wilshire 5000 Index(B) | 10.71 | % | 0.11 | % |
(A)1 Year and Since Inception returns include change in share prices and in each case includes reinvestment of any dividends and capital gain distributions. The inception date of the Presidio Fund was May 3, 2005.
(B)The Wilshire 5000 Index measures the performance of all U.S. headquartered equity securities with readily available price data. Over 5,000 capitalization weighted security returns are used to adjust the index. The composition of the Wilshire 5000 Index is different from the Fund.
PAST PERFORMANCE DOES NOT GUARANTEE FUTURE RESULTS. INVESTMENT RETURN AND PRINCIPAL VALUE WILL FLUCTUATE SO THAT SHARES, WHEN REDEEMED, MAY BE WORTH MORE OR LESS THAN THEIR ORIGINAL COST. RETURNS DO NOT REFLECT THE DEDUCTION OF TAXES THAT A SHAREHOLDER WOULD PAY ON FUND DISTRIBUTIONS OR THE REDEMPTION OF FUND SHARES. CURRENT PERFORMANCE MAY BE LOW ER OR HIGHER THAN THE PERFORMANCE DATA QUOTED. TO OBTAIN PERFORMANCE DATA CURRENT TO THE MOST RECENT MONTH END, PLEASE CALL 1-800-595-3166.
2009 Semi-Annual Report 4
Availability of Quarterly Schedule of Investments
(Unaudited)
The Fund files its complete schedule of portfolio holdings with the Securities and Exchange Commission ("SEC") for the first and third quarters of each fiscal year on Form N-Q. The Fund’s Forms N-Q are available on the SEC's Web site at http://www.sec.gov. The Fund’s Forms N-Q also may be reviewed and copied at the SEC's Public Reference Room in Washington, DC. Information on the operation of the Public Reference Room may be obtained by calling 1-800-SEC-0330.
Proxy Voting Guidelines
(Unaudited) |
KCO Investments, Inc., the Fund’s Adviser, is responsible for exercising the voting rights associated with the securities held by the Fund. A description of the policies and procedures used by the Adviser in fulfilling this responsibility is available without charge on the Fund’s website at www.pre-sidiofunds.com or is also available without charge, upon request, by calling our toll free number (1-800-595-3166). It is also included in the Fund’s Statement of Additional Information, which is available on the Securities and Exchange Commission’s website at http://www.sec.gov.
Information regarding how the Fund voted proxies, Form N-PX, relating to portfolio securities during the most recent 12-month period ended June 30 is available without charge, upon request, by calling our toll free number (1-800-595-3166). This information is also available on the Securities and Exchange Commission’s website at http://www.sec.gov.
Expense Example
(Unaudited) |
Shareholders of this Fund incur ongoing costs consisting of management fees and services fees. The following example is intended to help you understand your ongoing costs of investing in the Fund and to compare these costs with similar costs of investing in other mutual funds. The example is based on an investment of $1,000 invested in the Fund on May 1, 2009 and held through October 31, 2009.
The first line of the table below provides information about actual account values and actual expenses. In order to estimate the expenses a shareholder paid during the period covered by this report, shareholders can divide their account value by $1,000 (for example, an $8,600 account value divided by $1,000 = 8.6) and then multiply the result by the number in the first line under the heading entitled "Expenses Paid During the Period."
The second line of the table below provides information about hypothetical account values and hypothetical expenses based on the Fund's actual expense ratio and an assumed rate of return of 5% per year before expenses, which is not the Fund’s actual return. The hypothetical account values and expenses may not be used to estimate the actual ending account balance or expenses paid by a shareholder for the period. Shareholders may use this information to compare the ongoing costs of investing in this Fund and other funds. To do so, compare this 5% hypothetical example with the 5% hypothetical examples that appear in other funds' shareholder reports.
| | | | | | |
| | | | | | | Expenses Paid |
| | | Beginning | | Ending | | During the Period* |
| | | Account Value | | Account Value | | May 1, 2009 to |
| | | May 1, 2009 | | October 31, 2009 | | October 31, 2009 |
| |
| Actual | | $1,000.00 | | $1,160.91 | | $8.17 |
| |
| Hypothetical | | $1,000.00 | | $1,017.64 | | $7.63 |
| (5% annual return | | | | | | |
| before expenses) | | | | | | |
| * | Expenses are equal to the Fund’s annualized expense ratio of 1.50%, multiplied by the average account value over the period, multiplied by 184/365 (to reflect the one-half year period). |
| |
2009 Semi-Annual Report 5
| | | | | |
| Presidio Fund | | | | |
| |
| | | | Schedule of Investments | |
| | | | October 31, 2009 (Unaudited) | |
| |
| Shares/Principal Amount | | Market Value | % of Net Assets | |
| |
| COMMON STOCKS | | | | |
| |
| Aerospace/Defense | | | | |
| 59,600 | Argon ST, Inc. * | | $1,108,560 | | |
| 11,100 | FLIR Systems, Inc. * | | 308,691 | | |
| | | | 1,417,251 | 2.65 | % |
| Business Services | | | | |
| 7,500 | Accenture plc ** | | 278,100 | | |
| 12,700 | Copart Inc. * | | 408,559 | | |
| 18,400 | FTI Consulting, Inc. * | | 750,904 | | |
| 73,900 | Healthcare Services Group Inc. | | 1,459,525 | | |
| | | | 2,897,088 | 5.41 | % |
| Capital Goods | | | | | |
| 21,500 | Zebra Technologies Corp. * | | 537,500 | 1.00 | % |
| Commodities - Agriculture | | | | |
| 24,200 | Compass Minerals International Inc. | | 1,508,144 | | |
| 14,500 | Monsanto Co. | | 974,110 | | |
| 5,600 | Potash Corp. of Saskatchewan, Inc. (Canada) | | 519,568 | | |
| 25,200 | Syngenta AG ** | | 1,192,716 | | |
| | | | 4,194,538 | 7.84 | % |
| Commodities - Energy | | | | |
| 21,200 | Occidental Petroleum Corporation | | 1,608,656 | 3.01 | % |
| Commodities - Precious Metals & Related | | | | |
| 4,000 | Agnico-Eagle Mines Ltd. (Canada) | | 214,120 | | |
| 32,200 | Goldcorp Inc. (Canada) | | 1,183,994 | | |
| 30,500 | Newmont Mining Corp. | | 1,325,530 | | |
| 50,400 | Yamana Gold, Inc. (Canada) | | 536,760 | | |
| | | | 3,260,404 | 6.09 | % |
| Consumer Products - Apparel & Related | | | | |
| 54,500 | Carters, Inc. * | | 1,286,200 | | |
| 15,900 | VF Corp. | | 1,129,536 | | |
| | | | 2,415,736 | 4.51 | % |
| Consumer Products - Consumables | | | | |
| 27,700 | Avon Products Inc. | | 887,785 | | |
| 12,100 | Clorox Corporation | | 716,683 | | |
| 14,500 | The Coca-Cola Company | | 772,995 | | |
| 29,300 | Philip Morris International, Inc. | | 1,387,648 | | |
| | | | 3,765,111 | 7.03 | % |
| Consumer Products - Electronics | | | | |
| 30,000 | Electronic Arts Inc. * | | 547,200 | 1.02 | % |
| Consumer Products - Other | | | | |
| 31,300 | Helen of Troy Limited * | | 714,892 | | |
| 68,200 | Hillenbrand, Inc. | | 1,362,636 | | |
| 67,500 | Mattel Inc. | | 1,277,775 | | |
| | | | 3,355,303 | 6.27 | % |
| Financial Services - Banks | | | | |
| 8,400 | City Holding Co. | | 256,788 | | |
| 1,200 | Westamerica Bancorp. | | 57,360 | | |
| | | | 314,148 | 0.59 | % |
| Financial Services - Insurance & Insurance Brokers | | | | |
| 6 | Berkshire Hathaway Inc. Class A * | | 594,000 | | |
| 14,000 | Marsh & McLennan Companies, Inc. | | 328,440 | | |
| 27,000 | W.R. Berkley Corporation | | 667,440 | | |
| | | | 1,589,880 | 2.97 | % |
*Non-Income Producing Securities.
** ADR - American Depository Receipt.
The accompanying notes are an integral part of these
financial statements. |
2009 Semi-Annual Report 6
| | | | | | |
| Presidio Fund | | | | | |
| |
| | | | Schedule of Investments | |
| | | | October 31, 2009 (Unaudited) | |
| |
| Shares/Principal Amount | | Market Value | | % of Net Assets | |
| |
| COMMON STOCKS | | | | | |
| |
| Healthcare - Capital Equipment | | | | | |
| 65,600 | Allscripts-Misys Healthcare Solutions, Inc. | | $1,279,200 | | | |
| 35,000 | IRIS International Inc. * | | 354,900 | | | |
| | | | 1,634,100 | | 3.05 | % |
| Healthcare - Products and Services | | | | | |
| 47,400 | Abaxis, Inc. * | | 1,081,668 | | | |
| 30,200 | Abbott Laboratories | | 1,527,214 | | | |
| 9,700 | Alcon Inc. (Switzerland) | | 1,385,063 | | | |
| 18,400 | CONMED Corp. * | | 389,896 | | | |
| 77,000 | Pfizer Inc. | | 1,311,310 | | | |
| | | | 5,695,151 | | 10.64 | % |
| Industrial Products & Services | | | | | |
| 93,200 | Jabil Circuit, Inc. | | 1,247,016 | | 2.33 | % |
| Media | | | | | | |
| 66,000 | News Corp. CL A | | 760,320 | | 1.42 | % |
| Retail | | | | | | |
| 34,500 | Advance Auto Parts, Inc. | | 1,285,470 | | | |
| 24,000 | Family Dollar Stores Inc. | | 679,200 | | | |
| 26,200 | Kroger Co. | | 606,006 | | | |
| 4,000 | O'Reilly Automotive Inc. * | | 149,120 | | | |
| 28,000 | Safeway Inc. | | 625,240 | | | |
| | | | 3,345,036 | | 6.25 | % |
| Technology - Semiconductors | | | | | |
| 26,200 | Broadcom Corp. * | | 697,182 | | | |
| 58,900 | Maxim Integrated Products Inc. | | 981,863 | | | |
| | | | 1,679,045 | | 3.14 | % |
| Technology - Software | | | | | |
| 44,100 | Microsoft Corporation | | 1,222,893 | | 2.28 | % |
| Telecommunications Services | | | | | |
| 40,200 | AT&T, Inc. | | 1,031,934 | | 1.93 | % |
| Utilities | | | | | | |
| 28,900 | Cleco Corp. | | 715,275 | | | |
| 54,200 | Northwestern Corp. | | 1,308,930 | | | |
| | | | 2,024,205 | | 3.78 | % |
| Total for Common Stocks (Cost $40,487,367) | | 44,542,515 | | 83.21 | % |
| CLOSED END FUNDS | | | | | |
| 64,600 | Central GoldTrust * (Canada) | | 2,628,574 | | | |
| Total for Closed End Funds (Cost $2,346,561) | | 2,628,574 | | 4.91 | % |
| EXCHANGE TRADED FUNDS | | | | | |
| 20,500 | PowerShares DB Agriculture * | | 524,185 | | | |
| Total for Exchange Traded Funds (Cost $533,652) | | 524,185 | | 0.98 | % |
| CONVERTIBLE BONDS | | | | | |
| 330,000 | Cadence Design Systems, Inc., 1.375%, 12/15/2011 | | 303,600 | | | |
| 675,000 | Ceradyne, Inc., 2.875%, 12/15/2035 | | 627,750 | | | |
| Total for Convertible Bonds (Cost $805,205) | | 931,350 | | 1.74 | % |
| Cash Equivalents | | | | | |
| 5,623,908 | Fidelity Treasury Only Class I 0.09% *** | | 5,623,908 | | 10.51 | % |
| | (Cost - $5,623,908) | | | | | |
| | Total Investments | | 54,250,532 | | 101.35 | % |
| | (Cost - $49,796,693) | | | | | |
| | Liabilities in Excess of Other Assets | | (721,531 | ) | -1.35 | % |
| | Net Assets | | $53,529,001 | | 100.00 | % |
*Non-Income Producing Securities.
*** Variable rate security; the money market rate shown
represents the rate at October 31, 2009.
The accompanying notes are an integral part of these
financial statements. |
2009 Semi-Annual Report 7
| | | | |
| Presidio Fund |
| |
| Statement of Assets and Liabilities (Unaudited) | | | |
| October 31, 2009 | | | | |
| |
| Assets: | | | | |
| Investment Securities at Market Value | | $54,250,532 | |
| (Identified Cost - $49,796,693) | | | |
| Cash | | | 1,000 | |
| Receivables: | | | | |
| Fund Shares Sold | | 10,373 | |
| Dividends and Interest | | 70,994 | |
| Total Assets | | | 54,332,899 | |
| Liabilities | | | | |
| Payables: | | | | |
| Administrative Fees | | | 23,369 | |
| Management Fees | | | 47,804 | |
| Securities Purchased | | 658,294 | |
| Fund Shares Redeemed | | 74,431 | |
| Total Liabilities | | 803,898 | |
| Net Assets | | | $53,529,001 | |
| Net Assets Consist of: | | | | |
| Paid In Capital | | | $56,893,208 | |
| Accumulated Undistributed Net Investment Income | | 95,575 | |
| Realized Loss on Investments - Net | | (7,913,621 | ) |
| Unrealized Appreciation in Value | | | |
| of Investments Based on Identified Cost - Net | | 4,453,839 | |
| Net Assets, for 4,552,877 Shares Outstanding | | $53,529,001 | |
| (Unlimited number of shares authorized without par value) | | | |
| Net Asset Value and Redemption Price (Note 2) | | | |
| Per Share ($53,529,001/4,552,877 shares) | | $11.76 | |
| Minimum Redemption Price Per Share ($11.76 * 0.98) (Note 2) | | $11.52 | |
| |
| Statement of Operations (Unaudited) | | | |
| For the six months ended October 31, 2009 | | | |
| |
| Investment Income: | | | | |
| Dividends (Net of foreign withholding tax and agent fees of $15,997) | | $407,727 | |
| Interest | | | 67,146 | |
| Total Investment Income | | 474,873 | |
| Expenses: | | | | |
| Administrative Fees | (Note 4) | | 130,891 | |
| Management Fees | (Note 4) | | 263,774 | |
| Total Expenses | | | 394,665 | |
| |
| Net Investment Income | | 80,208 | |
| |
| Realized and Unrealized Gain (Loss) from Investments: | | | |
| Net Realized Loss from Investments | | (63,616 | ) |
| Net Change In Unrealized Appreciation from Investments | | 7,600,802 | |
| Net Realized and Unrealized Gain from Investments | | 7,537,186 | |
| |
| Net Increase in Net Assets Resulting from Operations | | $7,617,394 | |
The accompanying notes are an integral part of these financial statements.
| 2009 Semi-Annual Report 8 |
| | | | | | |
| Presidio Fund | | | | | | |
| |
| Statements of Changes in Net Assets | | (Unaudited) | | | | |
| | | Six Months | | | For the year | |
| | | ended | | | ended | |
| | | October 31, 2009 | | | April 30, 2009 | |
| Increase (Decrease) in Net Assets From Operations: | | | | | | |
| Net Investment Income | | $80,208 | | | $15,367 | |
| Net Realized Loss from Investments | | (63,616 | ) | | (7,737,110 | ) |
| Unrealized Appreciation (Depreciation) on Investments | | 7,600,802 | | | (9,028,948 | ) |
| Net Increase (Decrease) in Assets Resulting from Operations | | 7,617,394 | | | (16,750,691 | ) |
| |
| Distributions to Shareholders from realized gains | | - | | | (108,052 | ) |
| |
| Capital Share Transactions: | | | | | | |
| Proceeds From Sale of Shares | | 4,507,904 | | | 10,074,972 | |
| Proceeds From Redemption Fees (Note 2) | | 5,741 | | | 23,857 | |
| Shares Issued on Reinvestment of Dividends | | - | | | 102,843 | |
| Cost of Shares Redeemed | | (4,197,034 | ) | | (16,010,364 | ) |
| Net Increase (Decrease) from Shareholder Activity | | 316,611 | | | (5,808,692 | ) |
| Total Increase (Decrease) | | 7,934,005 | | | (22,667,435 | ) |
| Net Assets at Beginning of Period | | 45,594,996 | | | 68,262,431 | |
| Net Assets at End of Period (includes undistributed net | | $53,529,001 | | | $45,594,996 | |
| investment income of $95,575 and $15,367, respectively) | | | | | | |
| |
| Share Transactions: | | | | | | |
| Issued | | 410,569 | | | 946,930 | |
| Reinvested | | - | | | 10,624 | |
| Redeemed | | (359,450 | ) | | (1,512,155 | ) |
| Net increase (decrease) in shares | | 51,119 | | | (554,601 | ) |
| Shares outstanding beginning of period | | 4,501,758 | | | 5,056,359 | |
| Shares outstanding end of period | | 4,552,877 | | | 4,501,758 | |
| | | | | | | | | | | | | | | |
| Financial Highlights | | (Unaudited) | | | | | | | | | | | | | |
| Selected data for a share of capital stock | | Six Months | | | For the year | | | For the year | | | For the year | | | For the period | |
| outstanding throughout the period: | | ended | | | ended | | | ended | | | ended | | | ended | |
| | | October 31, 2009 | | | April 30, 2009 | | | April 30, 2008 | | | April 30, 2007 | | | April 30, 2006* | |
| Net Asset Value - | | | | | | | | | | | | | | | |
| Beginning of Period | | $10.13 | | | $13.50 | | | $14.72 | | | $13.00 | | | $10.00 | |
| Net Investment Income (Loss) **** | | 0.02 | | | 0.00 | | | (0.08 | ) | | (0.06 | ) | | (0.07 | ) |
| Net Gains or Losses on Securities | | | | | | | | | | | | | | | |
| (realized and unrealized) | | 1.61 | | | (3.35 | ) | | (0.43 | ) | | 1.78 | | | 3.07 | |
| Total from Investment Operations | | 1.63 | | | (3.35 | ) | | (0.51 | ) | | 1.72 | | | 3.00 | |
| Less Distributions from realized gains | | 0.00 | | | (0.02 | ) | | (0.71 | ) | | 0.00 | | | 0.00 | |
| Net Asset Value - | | | | | | | | | | | | | | | |
| End of Period | | $11.76 | | | $10.13 | | | $13.50 | | | $14.72 | | | $13.00 | |
| Total Return ***** | | 16.09 | % *** | | (24.79 | )% | | (3.65 | )% | | 13.23 | % | | 30.00 | % *** |
| Ratios/Supplemental Data | | | | | | | | | | | | | | | |
| Net Assets - End of Period (Thousands) | | $53,529 | | | $45,595 | | | $68,262 | | | $63,696 | | | $36,227 | |
| Ratio of Expenses to Average Net Assets | | 1.50 | % ** | | 1.50 | % | | 1.50 | % | | 1.50 | % | | 1.50 | % ** |
| Ratio of Net Income (Loss) to Average Net Assets | | 0.30 | % ** | | 0.03 | % | | -0.59 | % | | -0.47 | % | | -0.59 | % ** |
| Portfolio Turnover Rate | | 28.87 | % *** | | 102.89 | % | | 84.14 | % | | 57.55 | % | | 29.50 | % |
* May 3, 2005 (Commencement of investment operations) through April 30, 2006.
** Annualized
*** Not annualized.
**** Per share amounts were calculated using the average shares method.
***** Total return in the above table represents the rate that the investor would
have earned or lost on an investment in the Fund assuming reinvestment of
distributions to shareholders. |
The accompanying notes are an integral part of these financial statements.
2009 Semi-Annual Report 9
NOTES TO FINANCIAL STATEMENTS
PRESIDIO FUND
OCTOBER 31, 2009
(UNAUDITED) |
1.) ORGANIZATION
Presidio Fund (the "Fund") is a non-diversified series of the Presidio Funds (the "Trust"), which is registered under the Investment Company Act of 1940, as amended, as an open-end management investment company. The Trust was organized in Ohio as a business trust on January 22, 2004, and may offer shares of beneficial interest in a number of separate series, each series representing a distinct fund with its own investment objectives and policies. At present, the Fund is the only series authorized by the Trust. The Fund commenced operations on May 3, 2005. The Fund’s investment adviser is KCO Investments, Inc. (the “Adviser”). The Fund's investment objective is long-term growth of capital.
2.) SIGNIFICANT ACCOUNTING POLICIES
All investments in securities are recorded at their estimated fair value, as described in note 3.
As specified in Financial Accounting Standards Board (FASB) Statement No. 168, the FASB Accounting Standards Codification and the Hierarchy of Generally Accepted Accounting Principles, effective September 15, 2009 the Financial Accounting Standards Board (FASH) Accounting Standards Codification (FASC) became the authoritative source of generally accepted accounting principles (GAAP) recognized by the FASB. As of this effective date, all accounting and reporting standards under GAAP are superseded.
SHARE VALUATION: The net asset value (the “NAV”) is generally calculated as of the close of trading on the New York Stock Exchange (normally 4:00 p.m. Eastern time) every day the Exchange is open. The NAV is calculated by taking the total value of the Fund’s assets, subtracting its liabilities, and then dividing by the total number of shares outstanding, rounded to the nearest cent. The offering price and redemption price per share is equal to the net asset value per share, except that shares of each fund are subject to a redemption fee of 2% if redeemed within 180 days of purchase. To discourage large and frequent short-term trades by investors, and to compensate the Fund for costs that may be incurred by such trades, the Fund imposed the redemption fee. During the six months ended October 31, 2009 proceeds from redemption fees were $5,741.
FOREIGN CURRENCY: Investment securities and other assets and liabilities denominated in foreign currencies are translated into U.S. dollar amounts at the date of valuation. Purchases and sales of investment securities and income and expense items denominated in foreign currencies are translated into U.S. dollar amounts on the respective dates of such transactions.
The Fund does not isolate that portion of the results of operations resulting from changes in foreign exchange rates on investments from the fluctuations arising from changes in market prices of securities held. Such fluctuations are included with the net realized and unrealized gain or loss from investments.
Net realized foreign exchange gains or losses arise from sales of foreign currencies, currency gains or losses realized between the trade and settlement dates on securities transactions, and the difference between the amounts of dividends, interest, and foreign withholding taxes recorded on the Fund's books and the U.S. dollar equivalent of the amounts actually received or paid. Net unrealized foreign exchange gains and losses arise from changes in the fair values of assets and liabilities, other than investments in securities at fiscal period end, resulting from changes in exchange rates.
FEDERAL INCOME TAXES: The Fund’s policy is to comply with the requirements of Subchapter M of the Internal Revenue Code that are applicable to regulated investment companies and to distribute all of its taxable income to its shareholders. Therefore, no federal income tax provision is required. It is the Fund's policy to distribute annually, prior to the end of the calendar year, dividends sufficient to satisfy excise tax requirements of the Internal Revenue Service. This Internal Revenue Service requirement may cause an excess of distributions over the book year-end accumulated income. In addition, it is the Fund's policy to distribute annually, after the end of the fiscal year, any remaining net investment income and net realized capital gains.
The Fund recognizes the tax benefits of certain tax positions only where the position is “more likely than not” to be sustained assuming examination by tax authorities. Management has analyzed the Fund’s tax positions, and has concluded that no liability for unrecognized tax benefits should be recorded related to uncertain tax positions taken on returns filed for open tax years (2006-2008), or expected to be taken on the Fund’s 2009 tax return. The Fund identifies its major tax jurisdictions as U.S. Federal and State tax authorities; however the Fund is not aware of any tax positions for which it is reasonably possible that the total amounts of unrecognized tax benefits will change materially in the next twelve months.
2009 Semi-Annual Report 10
Notes to the Financial Statements (Unaudited) - continued
DISTRIBUTIONS TO SHAREHOLDERS: Distributions to shareholders, which are determined in accordance with income tax regulations, are recorded on the ex-dividend date.
USE OF ESTIMATES: The preparation of financial statements in conformity with accounting principles generally accepted in the United States of America requires management to make estimates and assumptions that affect the reported amounts of assets and liabilities and disclosure of contingent assets and liabilities at the date of the financial statements and the reported amounts of increases and decreases in net assets from operations during the reporting period. Actual results could differ from those estimates.
SUBSEQUENT EVENTS: Management has evaluated subsequent events through December 30, 2009, the date the financial statements were issued 3.) SECURITIES VALUATIONS
As described in note 2, the Fund utilizes various methods to measure the fair value of most of its investments on a recurring basis. As required by the fair value topic of the FASB Accounting Standards Codification, fair value is defined as the price that the Fund would receive to sell an asset or pay to transfer a liability in an orderly transaction between market participants at the measurement date. The topic also establishes a framework for measuring fair value, and a three-level hierarchy for fair value measurements based upon the transparency of inputs to the valuation of an asset or liability. The three-tier hierarchy of inputs is summarized below:
Level 1 - Unadjusted quoted prices in active markets for identical assets or liabilities that the Fund has the ability to access.
Level 2 - Observable inputs other than quoted prices included in level 1 that are observable for the asset or liability, either directly or indirectly. These inputs may include quoted prices for the identical instrument on an inactive market, prices for similar instruments, interest rates, prepayment speeds, credit risk, yield curves, default rates and similar data.
Level 3 - Unobservable inputs for the asset or liability, to the extent relevant observable inputs are not available, representing the Fund’s own assumptions about the assumptions a market participant would use in valuating the asset or liability, and would be based on the best information available.
The availability of observable inputs can vary from security to security and is affected by a wide variety of factors, including, for example, the type of security, whether the security is new and not yet established in the marketplace, the liquidity of markets, and other characteristics particular to the security. To the extent that valuation is based on models or inputs that are less observable or unobservable in the market, the determination of fair value requires more judgment. Accordingly, the degree of judgment exercised in determining fair value is greatest for instruments categorized in level 3.
The inputs used to measure fair value may fall into different levels of the fair value hierarchy. In such cases, for disclosure purposes, the level in the fair value hierarchy within which the fair value measurement falls in its entirety, is determined based on the lowest level input that is significant to the fair value measurement in its entirety.
FAIR VALUE MEASUREMENTS
A description of the valuation techniques applied to the Fund’s major categories of assets and liabilities measured at fair value on a recurring basis follows.
Equity securities (common stock including ADRs, exchange traded funds and convertible bonds). Equity securities that are traded on any exchange or on the NASDAQ over-the-counter market are valued at the last quoted sale price. Lacking a last sale price, a security is valued at its last bid price except when, in the Adviser's opinion, the last bid price does not accurately reflect the current value of the security. All other securities for which over-the-counter market quotations are not readily available are valued at their last bid price. Generally, if the security is traded in an active market and is valued at the last sale price, the security is categorized as a level 1 security. When the security position is not considered to be part of an active market or when the security is valued at the bid price, the position is generally categorized as a level 2. When market quotations are not readily available, when the Adviser determines the last bid price does not accurately reflect the current value or when restricted securities are being valued, such securities are valued as determined in good faith by the Adviser, in conformity with guidelines adopted by and subject to review of the Board of Trustees and are generally categorized in level 2 of the fair value hierarchy.
Money markets. Money market securities are valued at a net asset value of $1.00 and are classified in level 1 of the fair value hierarchy.
Fixed income securities. Fixed income securities generally are valued by using market quotations, but may be valued on the basis of prices furnished by a pricing service when the Adviser believes such prices accurately reflect the fair market value of such securities. A pricing service
2009 Semi-Annual Report 11
Notes to the Financial Statements (Unaudited) - continued
utilizes electronic data processing techniques based on yield spreads relating to securities with similar characteristics to determine prices for normal institutional-size trading units of debt securities without regard to sale or bid prices. If the Adviser decides that a price provided by the pricing service does not accurately reflect the fair market value of the securities, when prices are not readily available from a pricing service or when restricted or illiquid securities are being valued, securities are valued at fair value as determined in good faith by the Adviser, in conformity with guidelines adopted by and subject to review of the Board of Trustees. Short term investments in fixed income securities with maturities of less than 60 days when acquired, or which subsequently are within 60 days of maturity, are valued by using the amortized cost method of valuation, which the Board of Trustees has determined will represent fair value.
In accordance with the Trust's good faith pricing guidelines, the Adviser is required to consider all appropriate factors relevant to the value of securities for which it has determined other pricing sources are not available or reliable as described above. There is no single standard for determining fair value controls, since fair value depends upon the circumstances of each individual case. As a general principle, the current fair value of an issue of securities being valued by the Adviser would appear to be the amount which the owner might reasonably expect to receive for them upon their current sale. Methods which are in accordance with this principle may, for example, be based on (i) a multiple of earnings; (ii) a discount from market of a similar freely traded security (including a derivative security or a basket of securities traded on other markets, exchanges or among dealers); or (iii) yield to maturity with respect to debt issues, or a combination of these and othe r methods.
The following table summarizes the inputs used to value the Fund’s assets measured at fair value as of October 31, 2009:
| | | | | | | | |
| Valuation Inputs of Assets | | Level 1 | | Level 2 | | Level 3 | | Total |
| Common Stocks | | $44,542,515 | | $0 | | $0 | | $44,542,515 |
| Closed End Funds | | 2,628,574 | | 0 | | 0 | | 2,628,574 |
| Exchange Traded Funds | | 524,185 | | 0 | | 0 | | 524,185 |
| Convertible Bonds | | 931,350 | | 0 | | 0 | | 931,350 |
| Money Market Fund | | 5,623,908 | | 0 | | 0 | | 5,623,908 |
| Total | | $54,250,532 | | $0 | | $0 | | $54,250,532 |
Refer to the Fund’s Schedule of Investments for a listing of securities by industry. The Fund did not hold any Level 3 assets during the six months ended October 31, 2009.
The Fund adopted FASB Accounting Standards Codification guidance regarding "Disclosures about Derivative Instruments and Hedging Activities" effective May 1, 2009. This guidance requires enhanced disclosures about the Fund’s derivative and hedging activities, including how such activities are accounted for and their effect on the Fund’s financial position, performance and cash flows. The Fund did not invest in derivative instruments during the six months ended October 31, 2009.
4.) MANAGEMENT AND SERVICES AGREEMENTS
The Fund has a management agreement with the Adviser (the "Management Agreement") to furnish investment advisory services to the Fund, consistent with the Fund’s objectives and policies. The Fund will pay the Adviser a monthly management fee based on the Fund's average daily net assets at the annual rate of 1.00% . The Fund also has a services agreement with the Adviser (the "Services Agreement"), under which the Fund pays the Adviser a monthly fee based on the Fund's average daily net assets at the annual rate of .50% on assets up to $50 million and .40% on assets in excess of $50 million. Under the Services Agreement, the Adviser provides administrative and supervisory services as well as the services of a Chief Compliance Officer; and assumes all Fund operating expenses other than the management fee, brokerage fees and commissions, taxes, borrowing costs (such as (a) interest and (b) dividend expenses on securities sold short) and extraordinary or non-recurring expen ses. Kevin O'Boyle is the sole shareholder of the Adviser and also serves as a trustee/officer of the Fund.
For the six months ended October 31, 2009, the Adviser earned management fees totaling $263,774, of which $47,804 was still due to the Adviser at October 31, 2009. For the same period the Adviser earned administrative fees of $130,891, of which $23,369 was still due to the Adviser at October 31, 2009.
5.) INVESTMENT TRANSACTIONS
For the six months ended October 31, 2009, purchases and sales of investment securities other than U.S. Government obligations and short-term investments aggregated $15,378,554 and $13,318,773, respectively. Purchases and sales of U.S. Government obligations aggregated $0 and $0, respectively.
2009 Semi-Annual Report 12
Notes to the Financial Statements (Unaudited) - continued
At October 31, 2009, the composition of unrealized appreciation (the excess of value over tax cost) and depreciation (the excess of tax cost over value) was as follows:
| | | | | | |
| | Appreciation | | (Depreciation) | | | Net Appreciation (Depreciation) |
| | $6,376,323 | | ($1,922,484) | | | $4,453,839 |
6.) TAX MATTERS
The Fund did not pay a dividend distribution for the fiscal six month period ended October 31, 2009.
7.) RELATED PARTY TRANSACTIONS
Kevin C. O’Boyle is the owner and control person of the Adviser and also serves as a trustee/officer of the Fund. This individual receives benefits from the Adviser resulting from management and administrative fees paid to the Adviser by the Fund.
The Trustees who are not interested persons of the Fund received, in aggregate, $6,000 in Trustee fees from the Adviser through the six months ended October 31, 2009.
2009 Semi-Annual Report 13
Board of Trustees
Eric Gonzales
John McGrath
Kevin O’Boyle
Eric Sussman
Investment Adviser
KCO Investments, Inc.
Counsel
Thompson Hine LLP
Custodian
U.S. Bank, NA
Dividend Paying Agent,
Shareholders' Servicing Agent,
Transfer Agent
Mutual Shareholder Services, LLC
Fund Administrator
Premier Fund Solutions, Inc.
Independent Registered
Public Accounting Firm
Sanville & Company |
This report is provided for the general information of the shareholders of the Presidio Fund. This report is not intended for distribution to prospective investors in the Fund, unless preceded or accompanied by an effective prospectus.
Presidio Funds
1-800-595-3166
www.presidiofunds.com |
Item 2. Code of Ethics. Not applicable.
Item 3. Audit Committee Financial Expert. Not applicable.
Item 4. Principal Accountant Fees and Services. Not applicable.
Item 5. Audit Committee of Listed Companies. Not applicable.
Item 6. Schedule of Investments. Not applicable. Schedule filed with Item 1.
Item 7. Disclosure of Proxy Voting Policies and Procedures for Closed-End Funds. Not applicable.
Item 8. Portfolio Managers of Closed End Funds. Not applicable.
Item 9. Purchases of Equity Securities by Closed-End Management Investment Companies and Affiliated Purchasers. Not applicable.
Item 10. Submission of Matters to a Vote of Security Holders.
The registrant has not adopted procedures by which shareholders may recommend nominees to the registrant’s board of trustees.
Item 11. Controls and Procedures.
(a) The Registrant’s president and chief financial officer concluded that the disclosure controls and procedures (as defined in Rule 30a-3(c) under the Investment Company Act of 1940 (the “Act”)) were effective as of a date within 90 days of the filing date of this report, based on the evaluation of these controls and procedures required by Rule 30a-3(b) under the Act.
(b) There were no changes in the registrant’s internal control over financial reporting (as defined in Rule 30a-3(d) under the Act) that occurred during the registrant’s second fiscal quarter of the period covered by this report that have materially affected, or are reasonably likely to materially affect, the registrant’s internal control over financial reporting.
Item 12. Exhibits.
| (a) | (1)Code of Ethics. Not applicable. |
| |
| (a) | (2)Certifications pursuant to Section 302 of the Sarbanes-Oxley Act of 2002. Filed herewith. |
| |
| (b) | Certification pursuant to Section 906 of the Sarbanes-Oxley Act of 2002. Filed herewith. |
| |
Pursuant to the requirements of the Securities Exchange Act of 1934 and the Investment Company Act of 1940, the registrant has duly caused this report to be signed on its behalf by the undersigned, thereunto duly authorized.
Presidio Funds
By: /s/ Kevin C. O'Boyle
Kevin C. O’Boyle
President
Date: 01/07/10
Pursuant to the requirements of the Securities Exchange Act of 1934 and the Investment Company Act of 1940, this report has been signed below by the following persons on behalf of the registrant and in the capacities and on the dates indicated.
By: /s/ Kevin C. O'Boyle
Kevin C. O’Boyle
President
Date: 01/07/10
By: /s/ Kevin C. O'Boyle
Kevin C. O’Boyle
Chief Financial Officer
Date: 01/07/10