Searchable text section of graphics shown above
Creating Shareholder Value
[LOGO]
Credit Suisse First Boston
18th Annual Chemicals Conference
September 28, 2005
Safe Harbor Language
Statements in this presentation relating to matters that are not historical facts are forward-looking statements. These forward-looking statements are just predictions or expectations and are subject to risks and uncertainties. Actual results could differ materially, based on factors including but not limited to future global economic conditions, further increases in raw material and/or energy costs, access to capital markets, industry production capacity and operating rates, the supply/demand balance for the products produced by the Company and its joint ventures, competitive products and pricing pressures, technological developments, changes in governmental regulations and other risk factors. Rockwood does not undertake any obligation to publicly update any forward-looking statement to reflect events or circumstances after the date on which any such statement is made or to reflect the occurrence of unanticipated events.
[LOGO]
1
Seifi Ghasemi
Chairman & CEO
• Chairman & CEO of Rockwood since 2001
• 1997 to 2001 with GKN, plc, $6.0 billion global, U.K. listed manufacturing company. Was a member of the board of directors of the parent company. Also Chairman & CEO of GKN Sinter Metals, Inc. and Hoeganes Corporation.
• 1979 to 1997 with the BOC Group, plc, $7 billion global industrial gas company. Was a member of the board of directors of the parent company and also President, BOC Gases Americas, Chairman & CEO of BOC Process Plants and Chairman of Cryostar.
• Graduated from Stanford University.
2
Robert J. Zatta
Senior Vice President & CFO
• CFO of Rockwood since 2001
• 1990 to 2001 with the Campbell Soup Company, a NYSE – listed manufacturer of prepared foods with sales of $7.5 billion. Held a variety of senior financial management positions in the U.S. and Europe; appointed Corporate Officer in 1997; from October 1993 to 2001 was Global VP Corporate Development and Strategic Planning.
• 1979 to 1990 with General Foods Corporation (acquired by Philip Morris late in 1985). Held a variety of financial management positions including Controller, General Foods Canada, from 1985 to 1988.
• MBA - Finance
3
Rockwood Today
• LTM 6/30/05 Pro Forma Net Sales: $3.1 billion
• LTM 6/30/05 Pro Forma Adjusted EBITDA: $565 million
• Pro Forma Adjusted EBITDA margin: 18.5%
• Manufacturing Operations in 25 Countries
• 100 Manufacturing Facilities
• Approximately 10,200 Employees
• Over 60,000 Customers
4
Rockwood History
2000 | • | Rockwood formed through acquisitions of several businesses from Laporte, PLC by KKR. Company had sales of about $750 million |
| | |
2001 | • | Seifi Ghasemi and Bob Zatta join Rockwood. The following strategy was put in place: |
| | • | Change culture |
| | • | Develop operating metrics |
| | • | Improve Productivity |
| | • | Push organic growth |
| | • | Grow the company to more than $3.0 billion in sales through acquisitions |
| | • | IPO in 3 to 5 years |
5
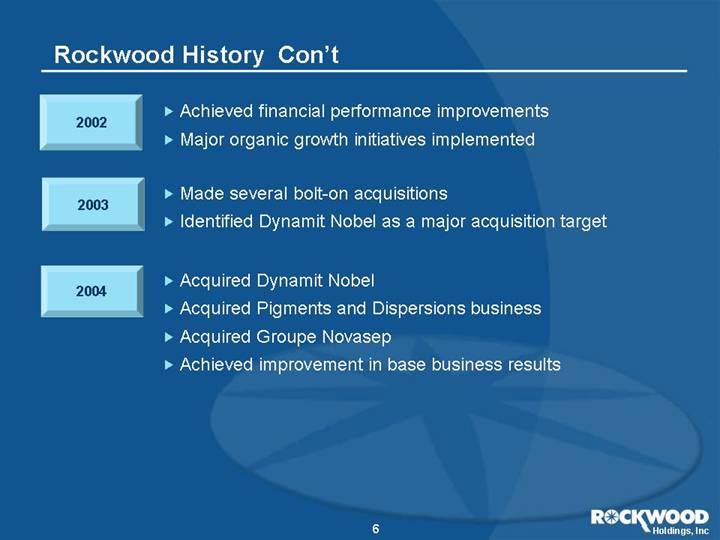
2002 | • | Achieved financial performance improvements |
| • | Major organic growth initiatives implemented |
| | |
2003 | • | Made several bolt-on acquisitions |
| • | Identified Dynamit Nobel as a major acquisition target |
| | |
2004 | • | Acquired Dynamit Nobel |
| • | Acquired Pigments and Dispersions business |
| • | Acquired Groupe Novasep |
| • | Achieved improvement in base business results |
6
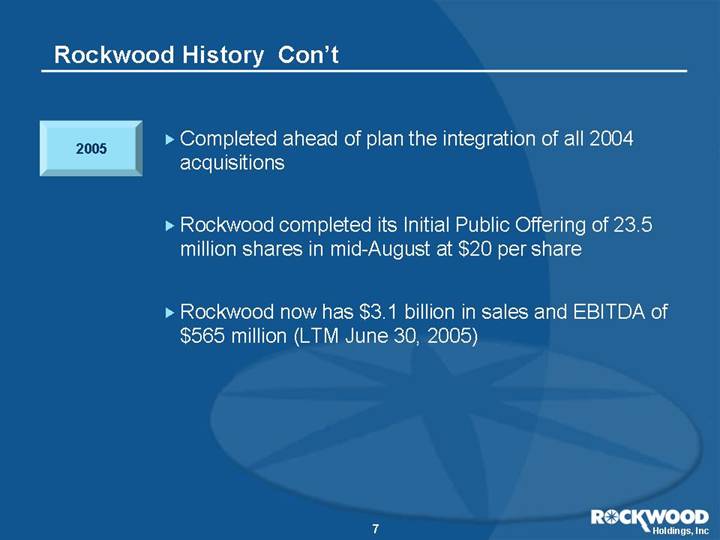
2005 | • | Completed ahead of plan the integration of all 2004 acquisitions |
| | |
| • | Rockwood completed its Initial Public Offering of 23.5 million shares in mid-August at $20 per share |
| | |
| • | Rockwood now has $3.1 billion in sales and EBITDA of $565 million (LTM June 30, 2005) |
7
Investment Highlights
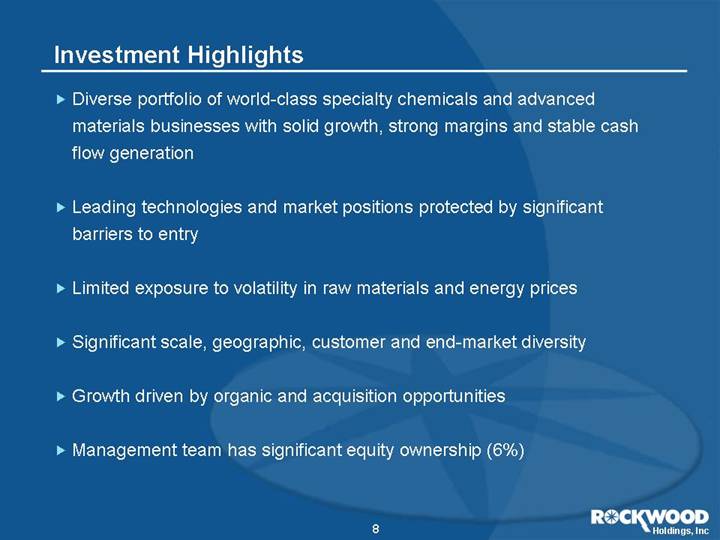
• Diverse portfolio of world-class specialty chemicals and advanced materials businesses with solid growth, strong margins and stable cash flow generation
• Leading technologies and market positions protected by significant barriers to entry
• Limited exposure to volatility in raw materials and energy prices
• Significant scale, geographic, customer and end-market diversity
• Growth driven by organic and acquisition opportunities
• Management team has significant equity ownership (6%)
8
Rockwood Businesses - Segments
LTM 6/30/05 PF Financials
[LOGO]
Revenue: | | $3.1 billion | |
Adjusted EBITDA: | | $565 million | |
Margin: | | 18.5 | % |
Specialty
Chemicals | | Performance
Additives | | Titanium
Dioxide
Pigments | | Advanced
Ceramics | | Groupe
Novasep | | Specialty
Compounds | | Electronics |
Note: Consolidated Adjusted EBITDA of $565 million includes corporate costs (incl. Legacy business) of $40 million.
9
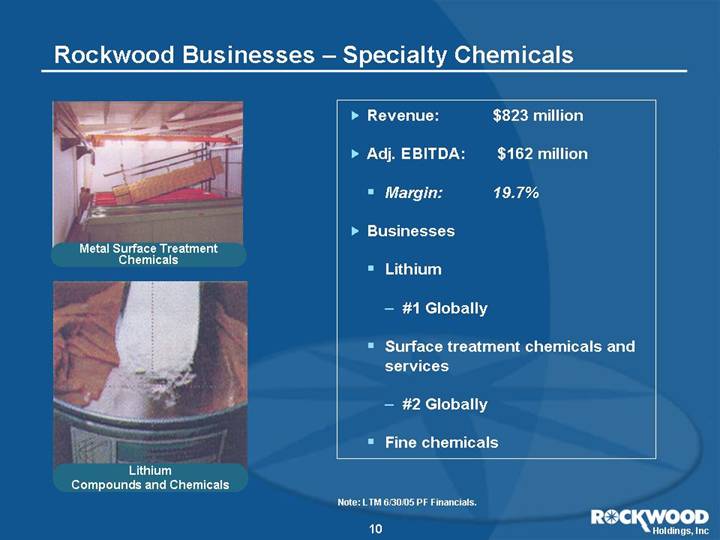
Rockwood Businesses – Specialty Chemicals
[GRAPHIC] | • | Revenue: | $823 million |
• | Adj. EBITDA: | $162 million |
| • | Margin: | 19.7% |
• | Businesses | |
| | | • | Lithium | |
[GRAPHIC] | | | • | #1 Globally |
| • | Surface treatment chemicals and services |
| | • | #2 Globally |
| • | Fine chemicals |
| | | | | | |
Note: LTM 6/30/05 PF Financials.
10
Rockwood Businesses – Performance Additives
[GRAPHIC]
[GRAPHIC] | • | Revenue: | $679 million |
• | Adj. EBITDA: | $153 million |
| • | Margin: | 22.5% |
• | Businesses | |
| | | • | Iron oxide pigments |
[GRAPHIC]
[GRAPHIC] | | | • | Top 3 Globally |
| • | Timber treatment chemicals |
| | • | Top 3 Globally |
| • | Clay-based additives |
| | • | Water treatment chemicals |
| | | | | | |
Note: LTM 6/30/05 PF Financials.
11
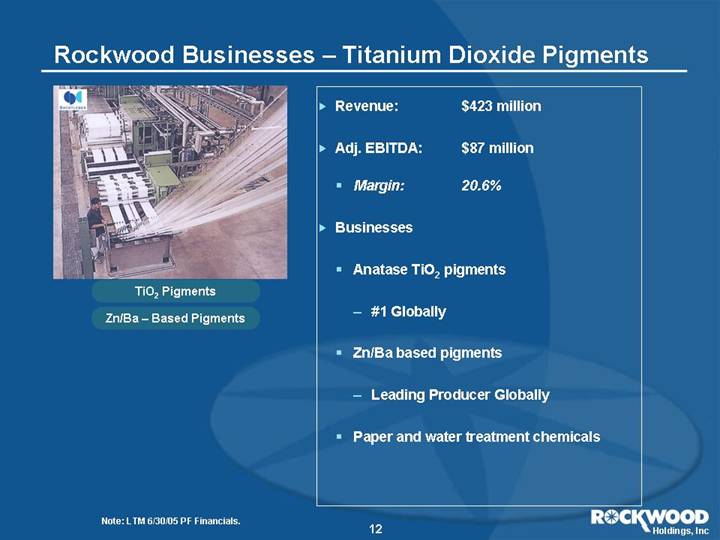
Rockwood Businesses – Titanium Dioxide Pigments
[GRAPHIC] | • | Revenue: | $423 million |
• | Adj. EBITDA: | $87 million |
| • | Margin: | 20.6% |
• | Businesses |
| • | Anatase TiO2 pigments |
| | • | #1 Globally |
| • | Zn/Ba based pigments |
| | • | Leading Producer Globally |
| • | Paper and water treatment chemicals |
| | | | | |
Note: LTM 6/30/05 PF Financials.
12
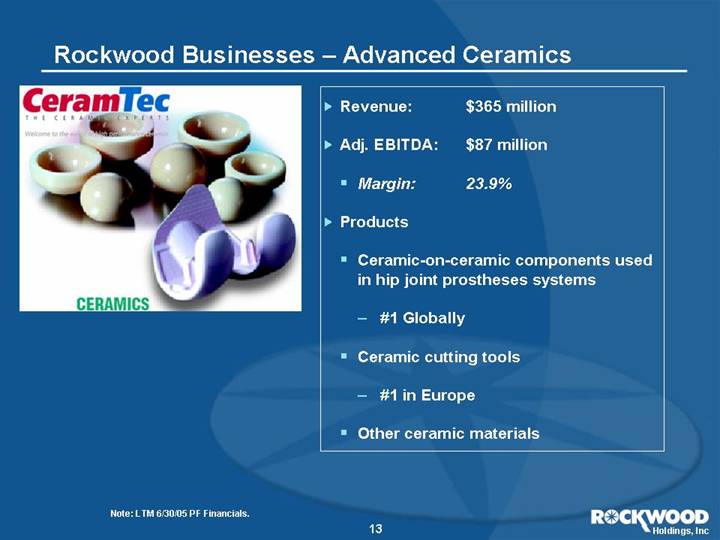
Rockwood Businesses – Advanced Ceramics
[GRAPHIC] | • | Revenue: | $365 million |
• | Adj. EBITDA: | $87 million |
| • | Margin: | 23.9% |
• | Products |
| • | Ceramic-on-ceramic components used in hip joint prostheses systems |
| | • | #1 Globally |
| • | Ceramic cutting tools |
| | • | #1 in Europe |
| • | Other ceramic materials |
| | | | | |
Note: LTM 6/30/05 PF Financials.
13
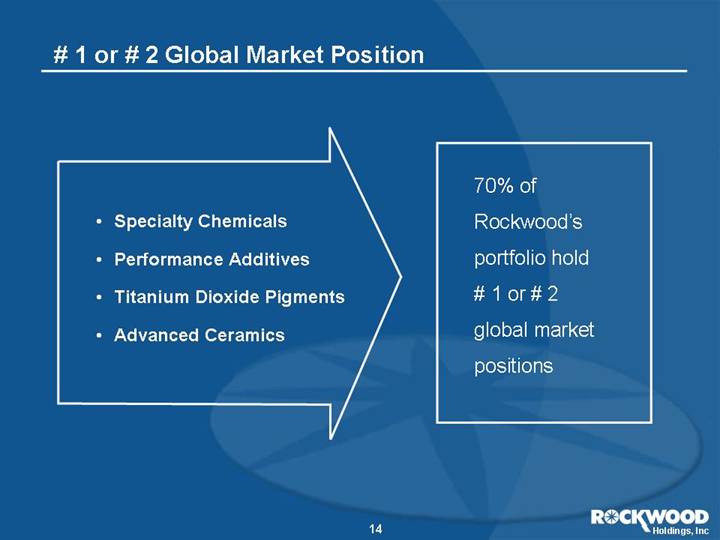
# 1 or # 2 Global Market Position
• | | Specialty Chemicals | 70% of Rockwood’s portfolio hold # 1 or # 2 global market positions |
| | |
• | | Performance Additives |
| | |
• | | Titanium Dioxide Pigments |
| | |
• | | Advanced Ceramics |
14
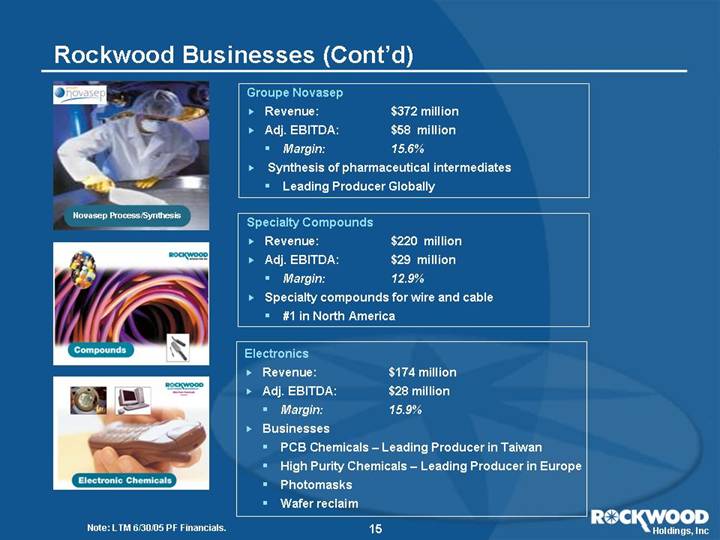
[GRAPHIC]
Groupe Novasep
• | Revenue: | | $372 million |
• | Adj. EBITDA: | | $58 million |
| • | Margin: | | 15.6% |
• | Synthesis of pharmaceutical intermediates | | |
| • | Leading Producer Globally | | |
[GRAPHIC]
Specialty Compounds
• | Revenue: | | $220 million |
• | Adj. EBITDA: | | $29 million |
| • | Margin: | | 12.9% |
• | Specialty compounds for wire and cable | | |
| • | #1 in North America | | |
[GRAPHIC]
Electronics
• | Revenue: | | $174 million |
• | Adj. EBITDA: | | $28 million |
| • | Margin: | | 15.9% |
• | Businesses | | |
| • | PCB Chemicals – Leading Producer in Taiwan |
| • | High Purity Chemicals – Leading Producer in Europe |
| • | Photomasks |
| • | Wafer reclaim |
| | | | |
Note: LTM 6/30/05 PF Financials.
15
Diversified End-Markets
[CHART]
2004PF Net Sales $2.9 billion
16
Significant Barriers to Entry
• Proprietary Technologies
• Unique Process Know-how
• Customer Switching Costs
• Strong Brands / Customer Relationships
17
Limited Exposure to Raw Materials & Energy Prices
Raw Material Position
• Top 10 raw materials represent only 7.9% of 2004 pro forma sales
RAW MATERIAL | | BUSINESS | | % OF 2004 PF NET SALES | |
TiO2 Slag | | Titanium Dioxide Pigments | | 1.9 | % |
PVC resin | | Specialty Compounds | | 1.0 | |
Purchased iron oxide | | Iron Oxide Pigments | | 0.9 | |
Quat | | Timber Treatment Chemicals | | 0.9 | |
Monoethanolamine | | Timber Treatment Chemicals | | 0.9 | |
Copper metal | | Timber Treatment Chemicals | | 0.7 | |
Quat | | Clay Based Additives | | 0.4 | |
General plasticizer | | Specialty Compounds | | 0.4 | |
Raw Material A(1) | | Groupe Novasep | | 0.4 | |
Sn powder | | Fine Chemicals | | 0.4 | |
Total | | | | 7.9 | % |
(1) Proprietary raw material.
Energy Exposure
• Energy purchases account for only ~3% of 2004 pro forma sales
• Very limited exposure to oil price fluctuations due to inorganic focus
18
Attractive Market And Customer Profile
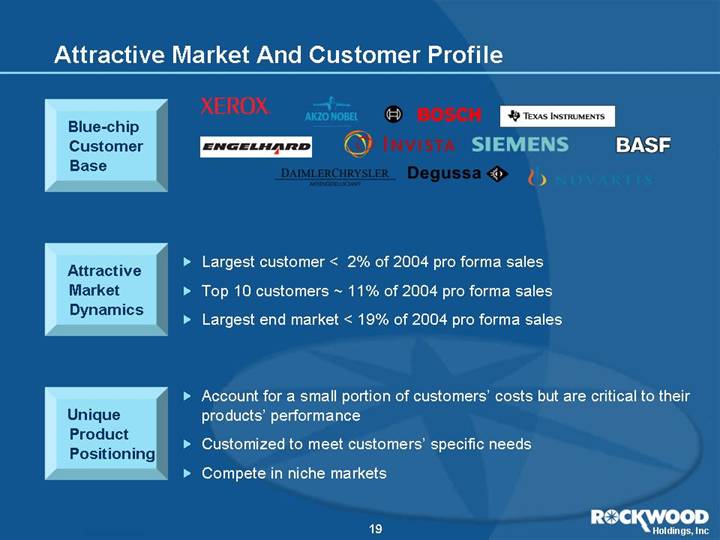
Blue-chip Customer Base
[GRAPHIC]
Attractive Market Dynamics
• Largest customer < 2% of 2004 pro forma sales
• Top 10 customers ~ 11% of 2004 pro forma sales
• Largest end market < 19% of 2004 pro forma sales
Unique Product Positioning
• Account for a small portion of customers’ costs but are critical to their products’ performance
• Customized to meet customers’ specific needs
• Compete in niche markets
19
Significant Exposure to High Growth Segments
[CHART]
Source: SRI Consulting
20
Compelling Growth Platforms
EXAMPLES
Specialty Chemicals
• Lithium in energy storage, life sciences and elastomers
• Synthetic metal sulfides
• Specialty surface treatment products (e.g. organic coatings)
Performance Additives
• Color in construction
• New materials (nanoclays) and new applications (synthetic layered silicate)
• Patented environmentally advanced products (ACQ)
Titanium Dioxide Pigments
• Synthetic fiber production
• Nano-technologies and new applications for Zn/Ba products
Advanced Ceramics
• Substitution of traditional materials by high-performance ceramics
• Only FDA approved manufacturer and supplier of ceramic components for hip joint prostheses, which are gaining share in the market
Groupe Novasep
• New APIs for hazardous azide chemistry, purification technologies, chiral separation and transition metal catalysis
Specialty Compounds
• High-end wire and cable market utilizing our Smokeguard branded products
• Joint development agreement with DuPont
Electronics
• Semiconductor sector driven by global recovery, especially China
21
Corporate Strategy
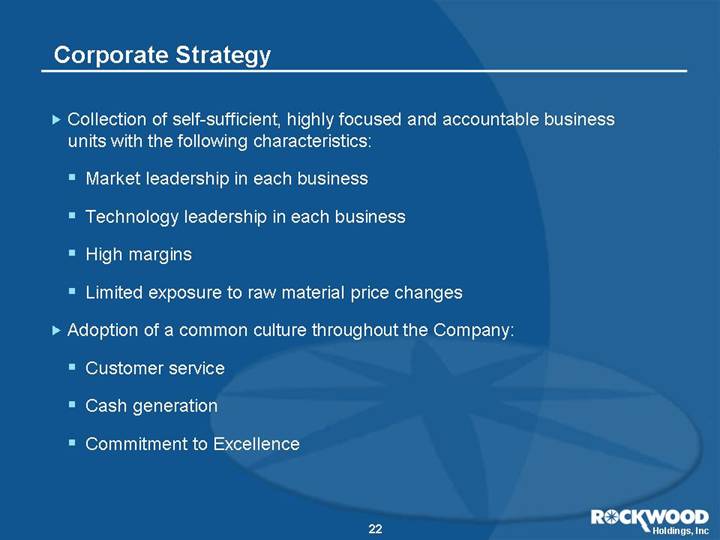
• Collection of self-sufficient, highly focused and accountable business units with the following characteristics:
• Market leadership in each business
• Technology leadership in each business
• High margins
• Limited exposure to raw material price changes
• Adoption of a common culture throughout the Company:
• Customer service
• Cash generation
• Commitment to Excellence
22
Our Management Approach
• Small corporate center
• Minimum layers of management
• Total elimination of bureaucracy
• Implementation of culture change
• Development of world class and detailed operating metrics
• Short-term incentive plan based on Adjusted EBITDA and working capital of each unit
• Long-term equity incentive plan for key employees
• On-site communication and motivation of all employees
23
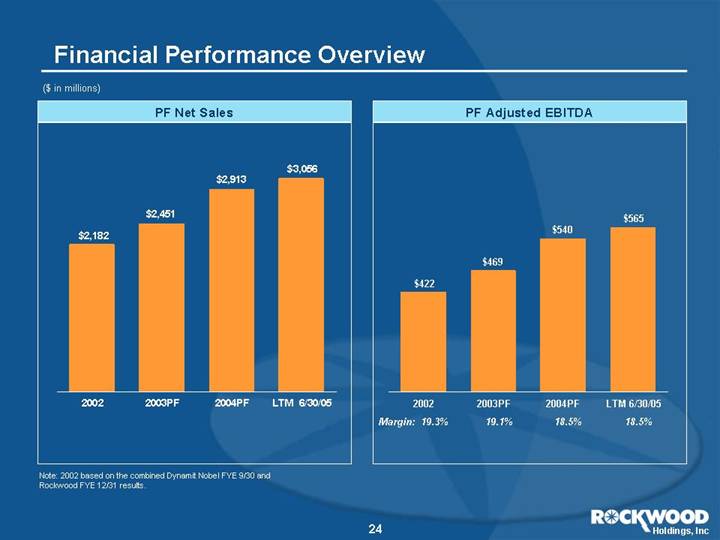
Financial Performance Overview
($ in millions)
PF Net Sales
[CHART]
PF Adjusted EBITDA
[CHART]
Note: 2002 based on the combined Dynamit Nobel FYE 9/30 and Rockwood FYE 12/31 results.
24
Debt
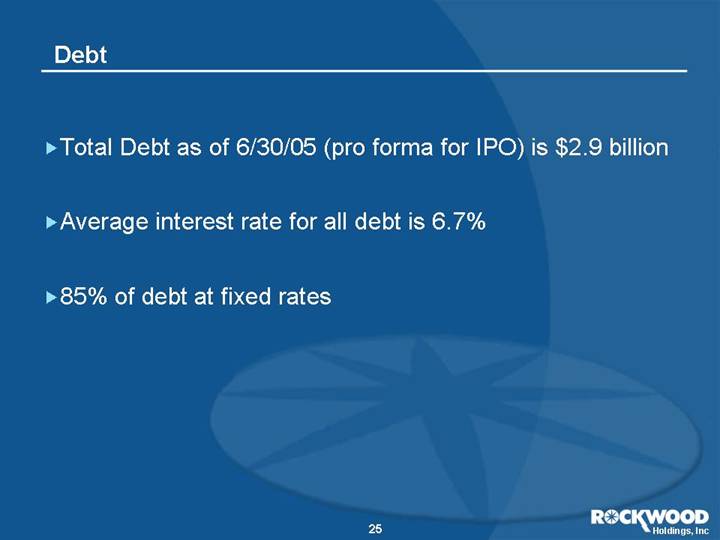
• Total Debt as of 6/30/05 (pro forma for IPO) is $2.9 billion
• Average interest rate for all debt is 6.7%
• 85% of debt at fixed rates
25
Rockwood’s Cash Flow Model
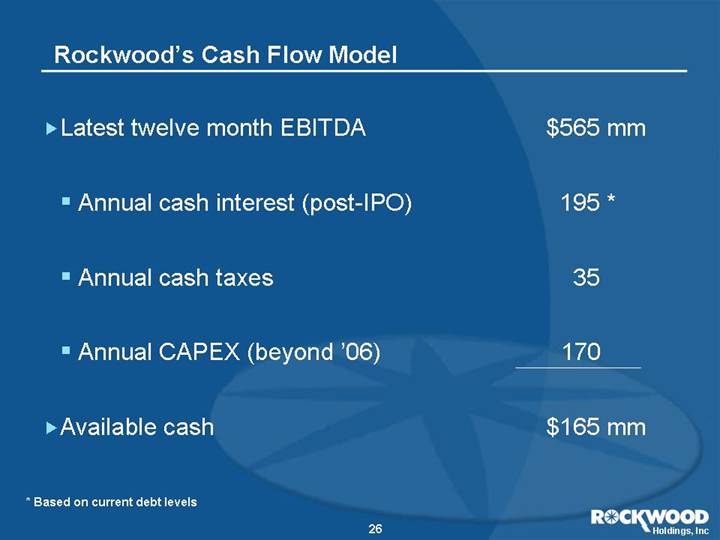
• Latest twelve month EBITDA | | $ | 565 | mm |
| | | |
• Annual cash interest (post-IPO) | | 195 | * |
| | | |
• Annual cash taxes | | 35 | |
| | | |
• Annual CAPEX (beyond ‘06) | | 170 | |
| | | |
• Available cash | | $ | 165 | mm |
* Based on current debt levels
26
Financial Performance Overview
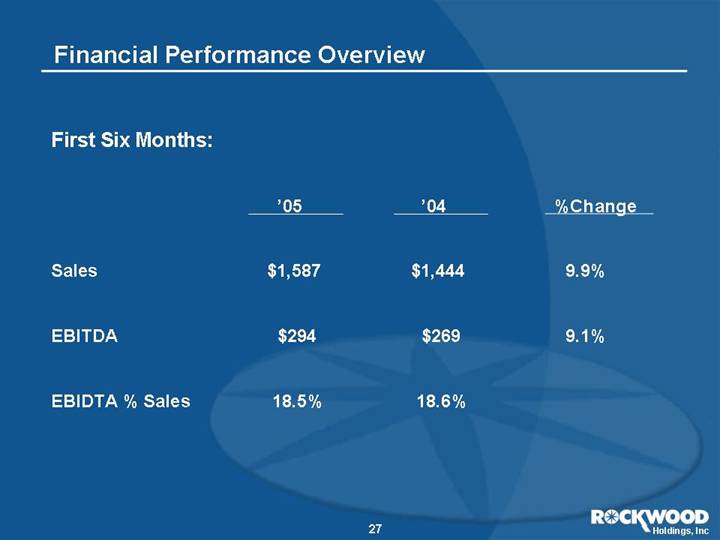
First Six Months:
| | ’05 | | ’04 | | %Change | |
| | | | | | | |
Sales | | $ | 1,587 | | $ | 1,444 | | 9.9 | % |
| | | | | | | |
EBITDA | | $ | 294 | | $ | 269 | | 9.1 | % |
| | | | | | | |
EBIDTA % Sales | | 18.5 | % | 18.6 | % | | |
27
Investment Highlights
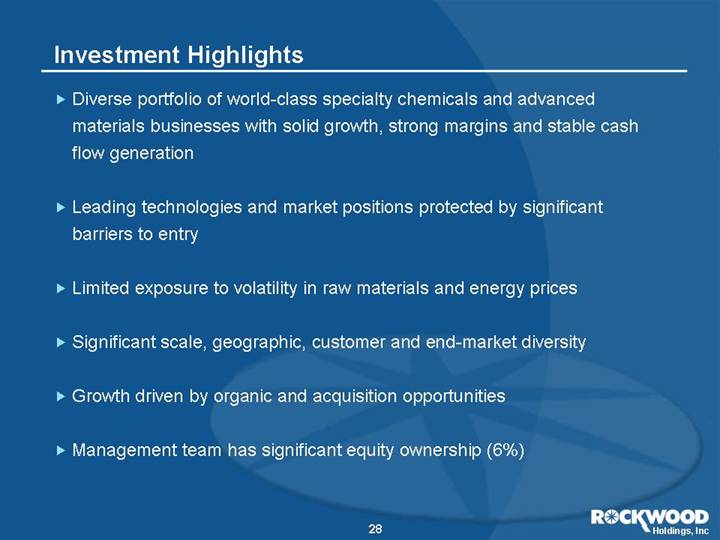
• Diverse portfolio of world-class specialty chemicals and advanced materials businesses with solid growth, strong margins and stable cash flow generation
• Leading technologies and market positions protected by significant barriers to entry
• Limited exposure to volatility in raw materials and energy prices
• Significant scale, geographic, customer and end-market diversity
• Growth driven by organic and acquisition opportunities
• Management team has significant equity ownership (6%)
28
Reconciliation of Pro Forma Net Income to Pro Forma Adjusted EBITDA: LTM June 30, 2005
Net income (loss) | | $ | 83.9 | | $ | 13.1 | | $ | (6.2 | ) | $ | 21.8 | | $ | 1.8 | | $ | (16.1 | ) | $ | (16.7 | ) | $ | (184.3 | ) | $ | (102.7 | ) |
Income tax provision (benefit) | | (0.5 | ) | 8.2 | | (5.9 | ) | 25.4 | | 15.8 | | 21.8 | | 22.0 | | 1.8 | | 88.6 | |
Interest, net | | 28.7 | | (0.3 | ) | 5.8 | | 43.2 | | 30.0 | | 32.7 | | 12.7 | | 91.1 | | 243.9 | |
Depreciation and amortization | | 33.8 | | 6.7 | | 18.7 | | 43.0 | | 32.9 | | 27.5 | | 30.0 | | 2.3 | | 194.9 | |
Systems/organization establishment expenses | | 0.2 | | — | | 0.2 | | 0.1 | | — | | — | | — | | 5.2 | | 5.7 | |
Inventory write-up reversal | | 1.0 | | — | | — | | 25.4 | | 6.6 | | 20.8 | | 10.4 | | — | | 64.2 | |
Costs incurred related to debt modifications | | — | | — | | — | | — | | — | | — | | — | | 2.0 | | 2.0 | |
Cancelled acquisition and disposition costs | | 0.2 | | — | | 0.2 | | — | | — | | — | | — | | 0.6 | | 1.0 | |
Impairment charges | | — | | — | | 11.0 | | — | | — | | — | | — | | — | | 11.0 | |
Write-off of deferred debt issuance costs | | 0.4 | | 0.2 | | 0.1 | | — | | — | | — | | — | | 24.4 | | 25.1 | |
Foreign exchange loss (gain) | | 0.7 | | — | | 1.9 | | 1.7 | | — | | 0.1 | | 1.2 | | 4.9 | | 10.5 | |
Loss from disposed businesses | | — | | — | | — | | — | | — | | — | | 0.8 | | — | | 0.8 | |
Restructuring and related charges | | 3.7 | | 0.3 | | 2.0 | | 1.4 | | — | | (0.1 | ) | (0.3 | ) | — | | 7.0 | |
CCA litigation defense costs | | 1.3 | | — | | — | | — | | — | | — | | — | | 0.2 | | 1.5 | |
Foreign exchange loss on foreign currency derivatives | | — | | — | | — | | — | | — | | — | | — | | 10.9 | | 10.9 | |
Minority Interest | | — | | — | | — | | — | | — | | — | | (1.7 | ) | — | | (1.7 | ) |
Other | | (0.3 | ) | 0.3 | | (0.1 | ) | 0.5 | | 0.2 | | 0.5 | | (0.5 | ) | 1.2 | | 1.8 | |
| | | | | | | | | | | | | | | | | | | |
Total Adjusted EBITDA | | $ | 153.1 | | $ | 28.5 | | $ | 27.7 | | $ | 162.5 | | $ | 87.3 | | $ | 87.2 | | $ | 57.9 | | $ | (39.7 | ) | $ | 564.5 | |
31
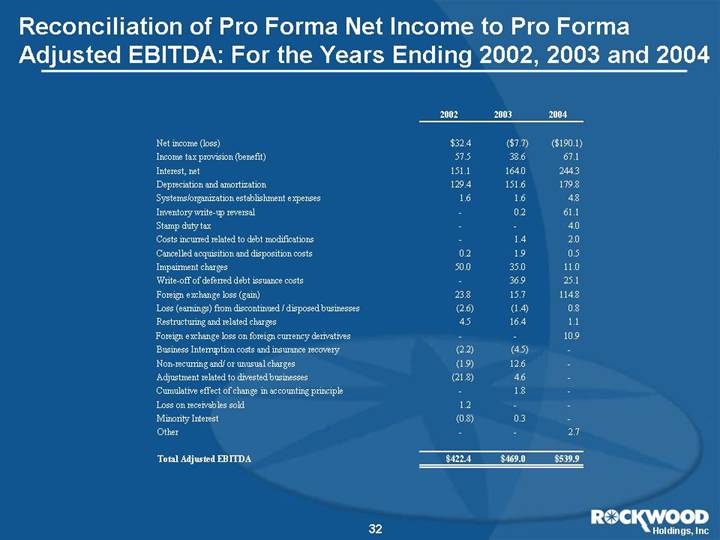
Reconciliation of Pro Forma Net Income to Pro Forma Adjusted EBITDA: For the Years Ending 2002, 2003 and 2004
| | 2002 | | 2003 | | 2004 | |
| | | | | | | |
Net income (loss) | | $ | 32.4 | | $ | (7.7 | ) | $ | (190.1 | ) |
Income tax provision (benefit) | | 57.5 | | 38.6 | | 67.1 | |
Interest, net | | 151.1 | | 164.0 | | 244.3 | |
Depreciation and amortization | | 129.4 | | 151.6 | | 179.8 | |
Systems/organization establishment expenses | | 1.6 | | 1.6 | | 4.8 | |
Inventory write-up reversal | | — | | 0.2 | | 61.1 | |
Stamp duty tax | | — | | — | | 4.0 | |
Costs incurred related to debt modifications | | — | | 1.4 | | 2.0 | |
Cancelled acquisition and disposition costs | | 0.2 | | 1.9 | | 0.5 | |
Impairment charges | | 50.0 | | 35.0 | | 11.0 | |
Write-off of deferred debt issuance costs | | — | | 36.9 | | 25.1 | |
Foreign exchange loss (gain) | | 23.8 | | 15.7 | | 114.8 | |
Loss (earnings) from discontinued / disposed businesses | | (2.6 | ) | (1.4 | ) | 0.8 | |
Restructuring and related charges | | 4.5 | | 16.4 | | 1.1 | |
Foreign exchange loss on foreign currency derivatives | | — | | — | | 10.9 | |
Business Interruption costs and insurance recovery | | (2.2 | ) | (4.5 | ) | — | |
Non-recurring and/ or unusual charges | | (1.9 | ) | 12.6 | | — | |
Adjustment related to divested businesses | | (21.8 | ) | 4.6 | | — | |
Cumulative effect of change in accounting principle | | — | | 1.8 | | — | |
Loss on receivables sold | | 1.2 | | — | | — | |
Minority Interest | | (0.8 | ) | 0.3 | | — | |
Other | | — | | — | | 2.7 | |
| | | | | | | |
Total Adjusted EBITDA | | $ | 422.4 | | $ | 469.0 | | $ | 539.9 | |
32

