Searchable text section of graphics shown above
| Fourth Quarter Results |
| |
[LOGO] |
| |
| March 20th, 2006 |
Forward Looking Statements
• This conference call may contain certain “forward-looking statements” within the meaning of the Private Securities Litigation Reform Act of 1995 concerning the business, operations and financial condition of Rockwood Holdings, Inc. and its subsidiaries (“Rockwood”). Although Rockwood believes the expectations reflected in such forward-looking statements are based upon reasonable assumptions, there can be no assurance that its expectations will be realized. “Forward-looking statements” consist of all non-historical information, including the statements referring to the prospects and future performance of Rockwood or the four businesses of Dynamit Nobel that Rockwood has acquired. Actual results could differ materially from those projected in Rockwood’s forward-looking statements due to numerous known and unknown risks and uncertainties, including, among other things, the “Risk Factors” described in its Registration Statement on Form S-1 on file with the Securities and Exchange Commission. Rockwood does not undertake any obligation to publicly update any forward-looking statement to reflect events or circumstances after the date on which any such statement is made or to reflect the occurrence of unanticipated events.
2
Where to Find Materials/Archives
• A replay of the conference call will be available through March 27, 2006 at (800) 475-6701 in the U.S., access code: 799694, and internationally at (320) 365-3844, access code: 799694. The webcast and the materials will also be archived on our website at www.rocksp.com or www.rockwoodspecialties.com and are accessible by clicking on “Company News.”
3
Agenda
• Yr 2005 Highlights
• Actual Results
• Pro-Forma Results
• Financial Summary
Appendices
4
Foreign Exchange Rates
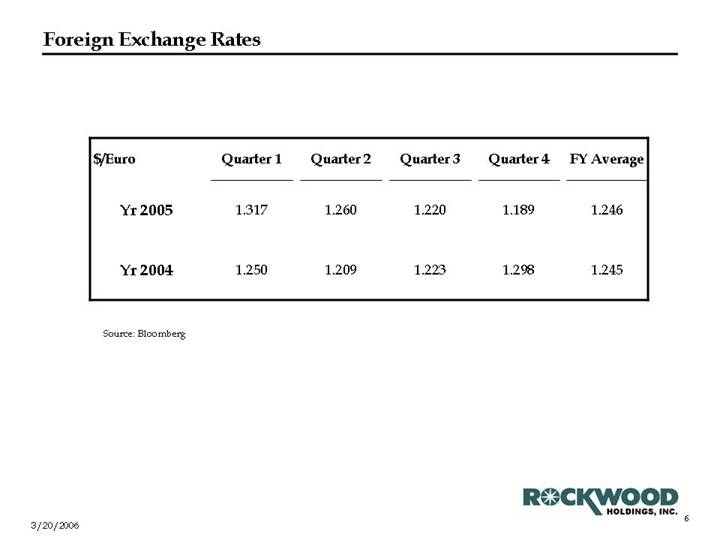
$/Euro | | Quarter 1 | | Quarter 2 | | Quarter 3 | | Quarter 4 | | FY Average | |
| | | | | | | | | | | |
Yr 2005 | | 1.317 | | 1.260 | | 1.220 | | 1.189 | | 1.246 | |
| | | | | | | | | | | |
Yr 2004 | | 1.250 | | 1.209 | | 1.223 | | 1.298 | | 1.245 | |
Source: Bloomberg
6
FY 2005 Summary
($M) | | FY 2005 | | FY 2004 | |
| | | | | |
Sales(a) | | $ | 3,121.2 | | $ | 2,913.0 | |
| | | | | |
Adjusted EBITDA(a) | | 570.9 | | 539.9 | |
| | | | | |
Reported Net Income | | 95.8 | | (216.1 | ) |
| | | | | |
Reported EPS - Diluted (b) | | 1.52 | | (6.66 | ) |
| | | | | |
Pro Forma EPS - Diluted (c) | | 1.28 | | NA | |
| | | | | |
Net Debt | | 2,741.6 | | 3,269.3 | |
| | | | | | | |
(a) FY 2004 Pro-forma as if the Dynamit Nobel, Omega and Groupe Novasep acquisitions had been completed at the beginning of the year.
(b) FY 2005 based on share count of 60,002 after adjusting for $4.3M of convertible preferred stock dividend; FY 2004 based on share count of 33,054.
(c) Based on Pro Forma share count of 74,648, before adjusting for non-recurring items.
7
Highlights
• Continued Focus on:
• Customer Service
• Productivity
• Organic Growth
• Resulted in financial performance in line with expectations.
• All Yr 2004 acquisitions are now fully and successfully integrated ahead of plan.
8
Financial Results
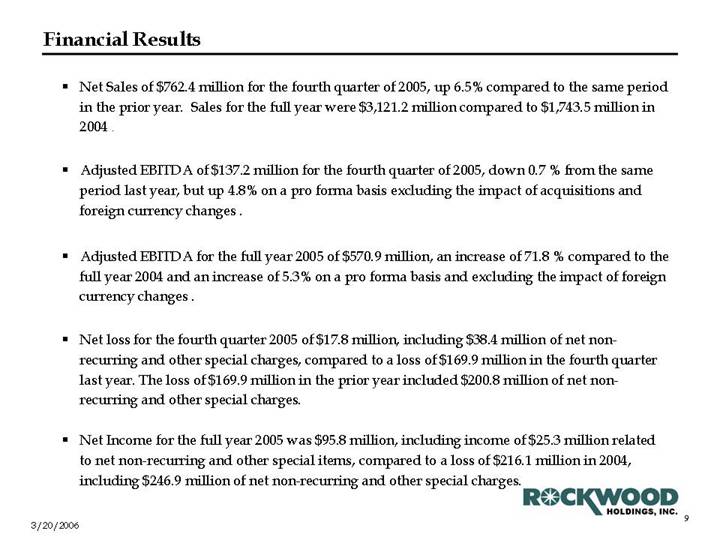
• Net Sales of $762.4 million for the fourth quarter of 2005, up 6.5% compared to the same period in the prior year. Sales for the full year were $3,121.2 million compared to $1,743.5 million in 2004.
• Adjusted EBITDA of $137.2 million for the fourth quarter of 2005, down 0.7 % from the same period last year, but up 4.8% on a pro forma basis excluding the impact of acquisitions and foreign currency changes.
• Adjusted EBITDA for the full year 2005 of $570.9 million, an increase of 71.8 % compared to the full year 2004 and an increase of 5.3% on a pro forma basis and excluding the impact of foreign currency changes.
• Net loss for the fourth quarter 2005 of $17.8 million, including $38.4 million of net non-recurring and other special charges, compared to a loss of $169.9 million in the fourth quarter last year. The loss of $169.9 million in the prior year included $200.8 million of net non-recurring and other special charges.
• Net Income for the full year 2005 was $95.8 million, including income of $25.3 million related to net non-recurring and other special items, compared to a loss of $216.1 million in 2004, including $246.9 million of net non-recurring and other special charges.
9
Yr 2005 Critical Accomplishments
• Completed Rockwood Holdings IPO.
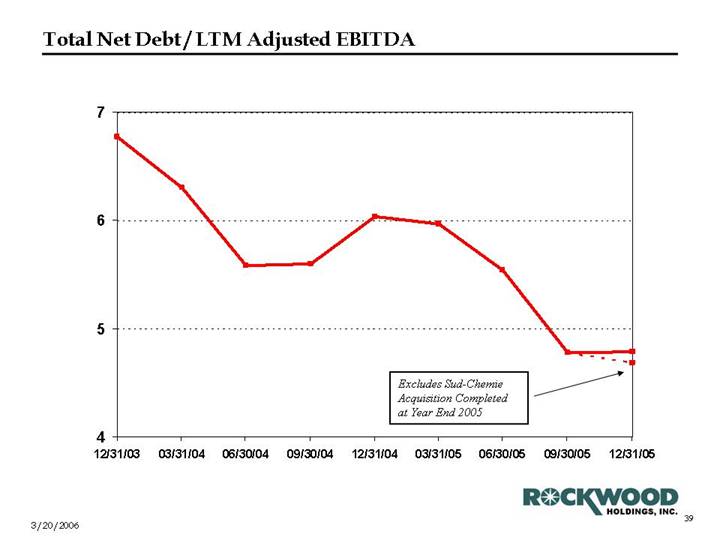
• Reduced Leverage from 6.0x Adjusted EBITDA at 12/31/2004 to 4.7x Adjusted EBITDA at 12/31/2005*.
• Implemented Rohner (in Groupe Novasep segment) downsizing plan and Wafer Reclaim (in Electronics segment) Restructuring.
• Closed the acquisition of Sud Chemie’s Rheological Additives and Carbonless Clay businesses.
• Opened new ceramic medical component manufacturing facility and commenced testing of hip joint production process.
• Continued to build excellence in Corporate Governance program including:
• Appointment of three new independent directors.
* Excluding the payment for Sud Chemie acquisition.
10
Rockwood Fourth Quarter and FY Results
(Actual)
11
Consolidated Results: Actual
| | Net Sales | | Adj. EBITDA (a) | |
@ Actual Rates | | | | | | | | FX Adj | | | | | | | | FX Adj | |
($ in Millions) | | Yr 2005 | | Yr 2004 | | % Change | | % Change (b) | | Yr 2005 | | Yr 2004 | | % Change | | % Change (b) | |
| | | | | | | | | | | | | | | | | |
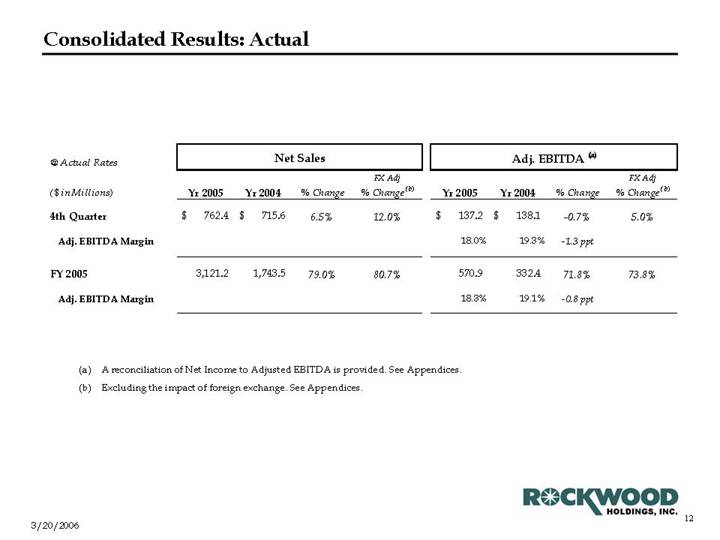
4th Quarter | | $ | 762.4 | | $ | 715.6 | | 6.5 | % | 12.0 | % | $ | 137.2 | | $ | 138.1 | | -0.7 | % | 5.0 | % |
| | | | | | | | | | | | | | | | | |
Adj. EBITDA Margin | | | | | | | | | | 18.0 | % | 19.3 | % | -1.3 | ppt | | |
| | | | | | | | | | | | | | | | | |
FY 2005 | | 3,121.2 | | 1,743.5 | | 79.0 | % | 80.7 | % | 570.9 | | 332.4 | | 71.8 | % | 73.8 | % |
| | | | | | | | | | | | | | | | | |
Adj. EBITDA Margin | | | | | | | | | | 18.3 | % | 19.1 | % | -0.8 | ppt | | |
| | | | | | | | | | | | | | | | | | | | | |
(a) A reconciliation of Net Income to Adjusted EBITDA is provided. See Appendices.
(b) Excluding the impact of foreign exchange. See Appendices.
12
Fourth Quarter Results By Segment: Actual
| | Net Sales | | Adj. EBITDA (a) | |
@ Actual Rates | | | | | | | | FX Adj | | | | | | | | FX Adj | |
($M) | | Q4 2005 | | Q4 2004 | | % Change | | % Change (b) | | Q4 2005 | | Q4 2004 | | % Change | | % Change (b) | |
| | | | | | | | | | | | | | | | | |
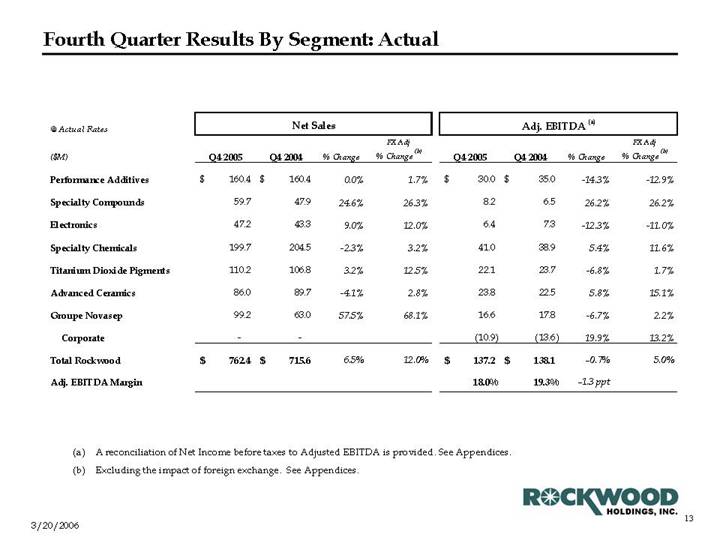
Performance Additives | | $ | 160.4 | | $ | 160.4 | | 0.0 | % | 1.7 | % | $ | 30.0 | | $ | 35.0 | | -14.3 | % | -12.9 | % |
| | | | | | | | | | | | | | | | | |
Specialty Compounds | | 59.7 | | 47.9 | | 24.6 | % | 26.3 | % | 8.2 | | 6.5 | | 26.2 | % | 26.2 | % |
| | | | | | | | | | | | | | | | | |
Electronics | | 47.2 | | 43.3 | | 9.0 | % | 12.0 | % | 6.4 | | 7.3 | | -12.3 | % | -11.0 | % |
| | | | | | | | | | | | | | | | | |
Specialty Chemicals | | 199.7 | | 204.5 | | -2.3 | % | 3.2 | % | 41.0 | | 38.9 | | 5.4 | % | 11.6 | % |
| | | | | | | | | | | | | | | | | |
Titanium Dioxide Pigments | | 110.2 | | 106.8 | | 3.2 | % | 12.5 | % | 22.1 | | 23.7 | | -6.8 | % | 1.7 | % |
| | | | | | | | | | | | | | | | | |
Advanced Ceramics | | 86.0 | | 89.7 | | -4.1 | % | 2.8 | % | 23.8 | | 22.5 | | 5.8 | % | 15.1 | % |
| | | | | | | | | | | | | | | | | |
Groupe Novasep | | 99.2 | | 63.0 | | 57.5 | % | 68.1 | % | 16.6 | | 17.8 | | -6.7 | % | 2.2 | % |
| | | | | | | | | | | | | | | | | |
Corporate | | — | | — | | | | | | (10.9 | ) | (13.6 | ) | 19.9 | % | 13.2 | % |
| | | | | | | | | | | | | | | | | |
Total Rockwood | | $ | 762.4 | | $ | 715.6 | | 6.5 | % | 12.0 | % | $ | 137.2 | | $ | 138.1 | | -0.7 | % | 5.0 | % |
| | | | | | | | | | | | | | | | | | | | | |
Adj. EBITDA Margin | | | | | | | | | | 18.0 | % | 19.3 | % | -1.3 | ppt | | |
(a) A reconciliation of Net Income before taxes to Adjusted EBITDA is provided. See Appendices.
(b) Excluding the impact of foreign exchange. See Appendices.
13
FY Results By Segment: Actual
| | Net Sales | | Adj. EBITDA (a) | |
@ Actual Rates | | | | | | | | FX Adj | | | | | | | | FX Adj | |
($M) | | FY 2005 | | FY 2004 | | % Change | | % Change (b) | | FY 2005 | | FY 2004 | | % Change | | % Change (b) | |
| | | | | | | | | | | | | | | | | |
Performance Additives | | $ | 680.7 | | $ | 630.9 | | 7.9 | % | 7.8 | % | $ | 148.3 | | $ | 149.2 | | -0.6 | % | -1.3 | % |
| | | | | | | | | | | | | | | | | |
Specialty Compounds | | 237.5 | | 200.4 | | 18.5 | % | 18.2 | % | 29.5 | | 28.8 | | 2.4 | % | 1.7 | % |
| | | | | | | | | | | | | | | | | |
Electronics | | 181.8 | | 168.1 | | 8.1 | % | 7.1 | % | 26.9 | | 28.9 | | -6.9 | % | -6.9 | % |
| | | | | | | | | | | | | | | | | |
Specialty Chemicals | | 842.0 | | 321.1 | | 162.2 | % | 165.2 | % | 174.2 | | 60.0 | | 190.3 | % | 193.8 | % |
| | | | | | | | | | | | | | | | | |
Titanium Dioxide Pigments | | 430.5 | | 175.7 | | 145.0 | % | 150.5 | % | 86.6 | | 37.8 | | 129.1 | % | 134.1 | % |
| | | | | | | | | | | | | | | | | |
Advanced Ceramics | | 369.6 | | 146.3 | | 152.6 | % | 156.7 | % | 93.8 | | 35.8 | | 162.0 | % | 167.9 | % |
| | | | | | | | | | | | | | | | | |
Groupe Novasep | | 379.1 | | 101.0 | | 275.3 | % | 281.9 | % | 51.9 | | 23.0 | | 125.7 | % | 133.0 | % |
| | | | | | | | | | | | | | | | | |
Corporate | | — | | — | | | | | | (40.3 | ) | (31.1 | ) | -29.6 | % | -29.3 | % |
| | | | | | | | | | | | | | | | | |
Total Rockwood | | $ | 3,121.2 | | $ | 1,743.5 | | 79.0 | % | 80.7 | % | $ | 570.9 | | $ | 332.4 | | 71.8 | % | 73.8 | % |
| | | | | | | | | | | | | | | | | |
Adj. EBITDA Margin | | | | | | | | | | 18.3 | % | 19.1 | % | -0.8 | ppt | | |
(a) A reconciliation of net income before taxes to Adjusted EBITDA is provided. See Appendices.
(b) Excluding the impact of foreign exchange. See Appendices.
14
Rockwood FY 2005 Results
(Pro-forma)
15
FY Consolidated Results: Pro-Forma
| | Net Sales | | Adj. EBITDA (b) | |
@ Actual Rates | | | | | | | | FX Adj | | | | | | | | FX Adj | |
($ in Millions) | | Yr 2005 | | Yr 2004 (a) | | % Change | | % Change (c) | | Yr 2005 | | Yr 2004 (a) | | % Change | | % Change (c) | |
| | | | | | | | | | | | | | | | | |
4th Quarter | | $ | 762.4 | | $ | 755.1 | | 1.0 | % | 6.5 | % | $ | 137.2 | | $ | 137.2 | | 0.0 | % | 4.8 | % |
Adj. EBITDA Margin | | | | | | | | | | 18.0 | % | 18.2 | % | -0.2 | ppt | | |
| | | | | | | | | | | | | | | | | |
FY 2005 | | 3,121.2 | | 2,913.0 | | 7.1 | % | 6.8 | % | 570.9 | | 539.9 | | 5.7 | % | 5.3 | % |
| | | | | | | | | | | | | | | | | |
Adj. EBITDA Margin | | | | | | | | | | 18.3 | % | 18.5 | % | -0.2 | ppt | | |
| | | | | | | | | | | | | | | | | | | | | |
(a) Pro-forma as if the Dynamit Nobel, Omega and Groupe Novasep acquisitions had been completed at the beginning of each period presented.
(b) A reconciliation of Net Income to Adjusted EBITDA is provided. See Appendices.
(c) Excluding the impact of foreign exchange. See Appendices.
16
Fourth Quarter Results By Segment: Pro Forma
| | Net Sales | | Adj. EBITDA (b) | |
@ Actual Rates | | | | | | | | FX Adj | | | | | | | | FX Adj | |
($M) | | Q4 2005 | | Q4 2004 (a) | | % Change | | % Change (c) | | Q4 2005 | | Q4 2004 (a) | | % Change | | % Change (c) | |
| | | | | | | | | | | | | | | | | |
Performance Additives | | $ | 160.4 | | $ | 160.4 | | 0.0 | % | 1.7 | % | $ | 30.0 | | $ | 34.8 | | -13.8 | % | -12.4 | % |
| | | | | | | | | | | | | | | | | |
Specialty Compounds | | 59.7 | | 47.9 | | 24.6 | % | 26.3 | % | 8.2 | | 6.5 | | 26.2 | % | 26.2 | % |
| | | | | | | | | | | | | | | | | |
Electronics | | 47.2 | | 43.3 | | 9.0 | % | 12.0 | % | 6.4 | | 7.3 | | -12.3 | % | -11.0 | % |
| | | | | | | | | | | | | | | | | |
Specialty Chemicals | | 199.7 | | 204.5 | | -2.3 | % | 3.2 | % | 41.0 | | 37.0 | | 10.8 | % | 17.3 | % |
| | | | | | | | | | | | | | | | | |
Titanium Dioxide Pigments | | 110.2 | | 106.9 | | 3.1 | % | 12.3 | % | 22.1 | | 23.3 | | -5.2 | % | 3.4 | % |
| | | | | | | | | | | | | | | | | |
Advanced Ceramics | | 86.0 | | 89.7 | | -4.1 | % | 2.8 | % | 23.8 | | 21.3 | | 11.7 | % | 21.1 | % |
| | | | | | | | | | | | | | | | | |
Groupe Novasep | | 99.2 | | 102.4 | | -3.1 | % | 6.2 | % | 16.6 | | 19.9 | | -16.6 | % | -13.6 | % |
| | | | | | | | | | | | | | | | | |
Corporate | | — | | — | | | | | | (10.9 | ) | (12.9 | ) | 15.5 | % | 7.8 | % |
| | | | | | | | | | | | | | | | | |
Total Rockwood | | $ | 762.4 | | $ | 755.1 | | 1.0 | % | 6.5 | % | $ | 137.2 | | $ | 137.2 | | 0.0 | % | 4.8 | % |
| | | | | | | | | | | | | | | | | |
Adj. EBITDA Margin | | | | | | | | | | 18.0 | % | 18.2 | % | -0.2 | ppt | | |
(a) Pro-forma as if Groupe Novasep acquisition had been completed at the beginning of period presented.
(b) A reconciliation of net income before taxes to Adjusted EBITDA is provided. See Appendices.
(c) Excluding the impact of foreign exchange. See Appendices.
17
FY Results By Segment: Pro Forma
| | Net Sales | | Adj. EBITDA (b) | |
@ Actual Rates | | | | | | | | FX Adj | | | | | | | | FX Adj | |
($M) | | FY 2005 | | FY 2004 (a) | | % Change | | % Change (c) | | FY 2005 | | FY 2004 (a) | | % Change | | % Change (c) | |
| | | | | | | | | | | | | | | | | |
Performance Additives | | $ | 680.7 | | $ | 674.8 | | 0.9 | % | 0.7 | % | $ | 148.3 | | $ | 154.9 | | -4.3 | % | -5.0 | % |
| | | | | | | | | | | | | | | | | |
Specialty Compounds | | 237.5 | | 200.4 | | 18.5 | % | 18.2 | % | 29.5 | | 28.8 | | 2.4 | % | 1.7 | % |
| | | | | | | | | | | | | | | | | |
Electronics | | 181.8 | | 168.1 | | 8.1 | % | 7.1 | % | 26.9 | | 28.9 | | -6.9 | % | -6.9 | % |
| | | | | | | | | | | | | | | | | |
Specialty Chemicals | | 842.0 | | 759.6 | | 10.8 | % | 10.0 | % | 174.2 | | 141.4 | | 23.2 | % | 22.2 | % |
| | | | | | | | | | | | | | | | | |
Titanium Dioxide Pigments | | 430.5 | | 422.0 | | 2.0 | % | 2.2 | % | 86.6 | | 84.6 | | 2.4 | % | 2.5 | % |
| | | | | | | | | | | | | | | | | |
Advanced Ceramics | | 369.6 | | 349.5 | | 5.8 | % | 5.4 | % | 93.8 | | 80.3 | | 16.8 | % | 16.9 | % |
| | | | | | | | | | | | | | | | | |
Groupe Novasep | | 379.1 | | 338.6 | | 12.0 | % | 12.3 | % | 51.9 | | 61.1 | | -15.1 | % | -15.4 | % |
| | | | | | | | | | | | | | | | | |
Corporate | | — | | — | | | | | | (40.3 | ) | (40.1 | ) | -0.5 | % | -0.2 | % |
| | | | | | | | | | | | | | | | | |
Total Rockwood | | $ | 3,121.2 | | $ | 2,913.0 | | 7.1 | % | 6.8 | % | $ | 570.9 | | $ | 539.9 | | 5.7 | % | 5.3 | % |
| | | | | | | | | | | | | | | | | |
Adj. EBITDA Margin | | | | | | | | | | 18.3 | % | 18.5 | % | -0.2 | ppt | | |
(a) Pro-forma as if the Dynamit Nobel, Omega and Groupe Novasep acquisitions had been completed at the beginning of the year.
(b) A reconciliation of net income before taxes to Adjusted EBITDA is provided. See Appendices.
(c) Excluding the impact of foreign exchange. See Appendices.
18
Sales Growth: Pro-forma
($M) | | Net Sales | | % Change | |
| | | | | |
FY 2005 | | $ | 3,121.2 | | | |
| | | | | |
FY 2004 (a) | | 2,913.0 | | | |
| | | | | |
Change | | $ | 208.2 | | 7.1 | % |
| | | | | |
Due to (Approx.): | | | | | |
| | | | | |
Pricing | | | | 2.0 | % |
| | | | | |
Currency | | | | 0.3 | % |
| | | | | |
Volume/Mix | | | | 4.8 | % |
(a) Pro-forma as if the Dynamit Nobel, Omega and Groupe Novasep acquisitions had been completed at the beginning of each period presented.
19
Yr 2005 Raw Materials and Energy Summary
• Rockwood has not been materially impacted by increases in Raw Material and Energy costs in Yr 2005
• Raw Materials % of Sales is 33.9% (vs. 33.4% for Yr 2004)
• Energy Cost % of Sales is 3.3% (vs. 3.0% for Yr 2004)
Raw Materials -
• Due to our inorganic focus, hydrocarbon related raw materials account for only 6% of total sales, about $180M for FY 2005.
• Much of the hydrocarbon related materials cost increase, as in the case of Specialty Compounds (PVC, Plasticizer, AOM), have been recovered through higher prices.
• Other inorganic raw material cost increases have also been recovered through higher prices.
• Color Pigments has had less success in passing cost increases; however, cost decrease in Slag and Tin in TiO2 Pigments and Fine Chemicals have helped offset this negative impact.
Energy -
• Energy accounts for only 3.3% of total Sales.
• About 70% of the energy consumption is in Europe, where the natural gas price has been relatively stable despite some increases in Q4.
20
Performance Additives: Pro-forma
| | Net Sales | | Adj. EBITDA (b) | |
@ Actual Rates | | | | | | | | FX Adj | | | | | | | | FX Adj | |
($ in Millions) | | 2005 | | 2004 (a) | | % Change | | % Change (c) | | 2005 | | 2004 (a) | | % Change | | % Change (c) | |
4th Quarter | | $ | 160.4 | | $ | 160.4 | | 0.0 | % | 1.7 | % | $ | 30.0 | | $ | 34.8 | | -13.8 | % | -12.4 | % |
Adj. EBITDA Margin | | | | | | | | | | 18.7 | % | 21.7 | % | -3 | ppt | | |
| | | | | | | | | | | | | | | | | |
FY 2005 | | 680.7 | | 674.8 | | 0.9 | % | 0.7 | % | 148.3 | | 154.9 | | -4.3 | % | -5.0 | % |
| | | | | | | | | | | | | | | | | |
Adj. EBITDA Margin | | | | | | | | | | 21.8 | % | 23.0 | % | -1.2 | ppt | | |
| | | | | | | | | | | | | | | | | | | | | |
• Strong Q4 volume in our Pool and Spa chemicals’ business was offset by soft volume and higher raw materials costs in Timber (particularly copper) and Color Pigments.
• For the FY 2005, although strong performance from Pool & Spa helped offset the lowered volume in Clay Additives, segment overall results were negatively impacted by lower Timber, Color Pigments volume and higher raw materials costs.
(a) Pro-forma as if the Omega acquisition had been completed at the beginning of each period presented.
(b) A reconciliation of net income before taxes to Adjusted EBITDA is provided. See Appendices.
(c) Excluding the impact of foreign exchange. See Appendices.
21
Specialty Compounds
| | Net Sales | | Adj. EBITDA (a) | |
@ Actual Rates | | | | | | | | FX Adj | | | | | | | | FX Adj | |
($ in Millions) | | 2005 | | 2004 | | % Change | | % Change (b) | | 2005 | | 2004 (a) | | % Change | | % Change (b) | |
| | | | | | | | | | | | | | | | | |
4th Quarter | | $ | 59.7 | | $ | 47.9 | | 24.6 | % | 26.3% | | $ | 8.2 | | $ | 6.5 | | 26.2 | % | 26.2 | % |
Adj. EBITDA Margin | | | | | | | | | | 13.7 | % | 13.6 | % | 0.2 | ppt | | |
| | | | | | | | | | | | | | | | | |
FY 2005 | | 237.5 | | 200.4 | | 18.5 | % | 18.2 | % | 29.5 | | 28.8 | | 2.4 | % | 1.7 | % |
| | | | | | | | | | | | | | | | | |
Adj. EBITDA Margin | | | | | | | | | | 12.4 | % | 14.4 | % | -2 | ppt | | |
| | | | | | | | | | | | | | | | | | | | | |
• Higher raw material prices offset by higher selling prices
• Full Year results favorably impacted by strong wire and cable sales volume
(a) A reconciliation of Net income before taxes to Adjusted EBITDA is provided. See Appendices.
(b) Excluding the impact of foreign exchange. See Appendices.
22
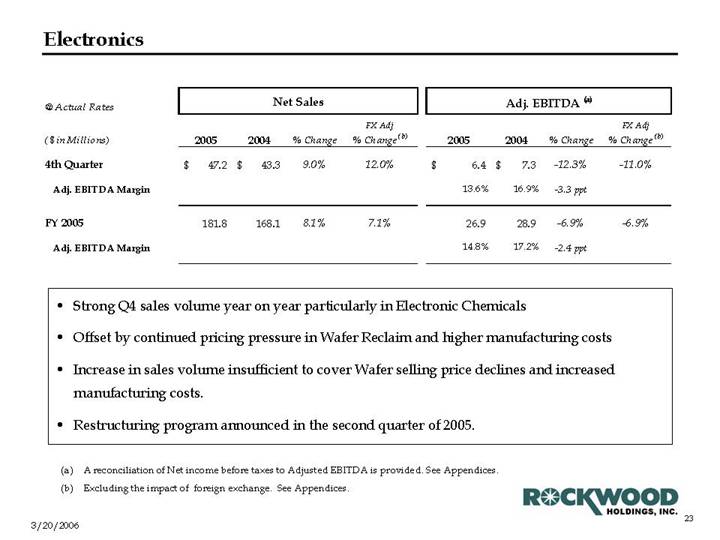
Electronics
| | Net Sales | | Adj. EBITDA (a) | |
@ Actual Rates | | | | | | | | FX Adj | | | | | | | | FX Adj | |
($ in Millions) | | 2005 | | 2004 | | % Change | | % Change (b) | | 2005 | | 2004 | | % Change | | % Change (b) | |
| | | | | | | | | | | | | | | | | |
4th Quarter | | $ | 47.2 | | $ | 43.3 | | 9.0 | % | 12.0 | % | $ | 6.4 | | $ | 7.3 | | -12.3 | % | -11.0 | % |
| | | | | | | | | | | | | | | | | | | | | |
Adj. EBITDA Margin | | | | | | | | | | 13.6 | % | 16.9 | % | -3.3 | ppt | | |
| | | | | | | | | | | | | | | | | |
FY 2005 | | 181.8 | | 168.1 | | 8.1 | % | 7.1 | % | 26.9 | | 28.9 | | -6.9 | % | -6.9 | % |
| | | | | | | | | | | | | | | | | |
Adj. EBITDA Margin | | | | | | | | | | 14.8 | % | 17.2 | % | -2.4 | ppt | | |
• Strong Q4 sales volume year on year particularly in Electronic Chemicals
• Offset by continued pricing pressure in Wafer Reclaim and higher manufacturing costs
• Increase in sales volume insufficient to cover Wafer selling price declines and increased manufacturing costs.
• Restructuring program announced in the second quarter of 2005.
(a) A reconciliation of Net income before taxes to Adjusted EBITDA is provided. See Appendices.
(b) Excluding the impact of foreign exchange. See Appendices.
23
Specialty Chemicals: Pro-forma
| | Net Sales | | Adj. EBITDA (a) | |
@ Actual Rates | | | | | | | | FX Adj | | | | | | | | FX Adj | |
($ in Millions) | | 2004 (a) | | 2005 | | % Change | | % Change (c) | | 2004 (a) | | 2005 | | % Change | | % Change (c) | |
| | | | | | | | | | | | | | | | | |
4th Quarter | | $ | 199.7 | | $ | 204.5 | | -2.3 | % | 3.2 | % | $ | 41.0 | | $ | 37.0 | | 10.8 | % | 17.3 | % |
| | | | | | | | | | | | | | | | | |
Adj. EBITDA Margin | | | | | | | | | | 20.5 | % | 18.1 | % | 2.4 | ppt | | |
| | | | | | | | | | | | | | | | | |
FY 2005 | | 842.0 | | 759.6 | | 10.8 | % | 10.0 | % | 174.2 | | 141.4 | | 23.2 | % | 22.2 | % |
| | | | | | | | | | | | | | | | | |
Adj. EBITDA Margin | | | | | | | | | | 20.7 | % | 18.6 | % | 2.1 | ppt | | |
| | | | | | | | | | | | | | | | | | | | | |
• Solid volume increases in both Surface Treatment (Aerospace and Automotive) and Fine Chemical (Lithium) businesses
• Higher selling prices offset by higher raw material costs occurred particularly in the Fine Chemicals (Metal Sulfides) business
• Currency changes negatively impacted Q4 results (sales -5.5%, Adj. EBITDA -6.5%)
(a) Pro-forma as if the Dynamit Nobel acquisition had been completed at the beginning of each period presented.
(b) A reconciliation of Net Income to Adjusted EBITDA is provided. See Appendices.
(c) Excluding the impact of foreign exchange. See Appendices.
24
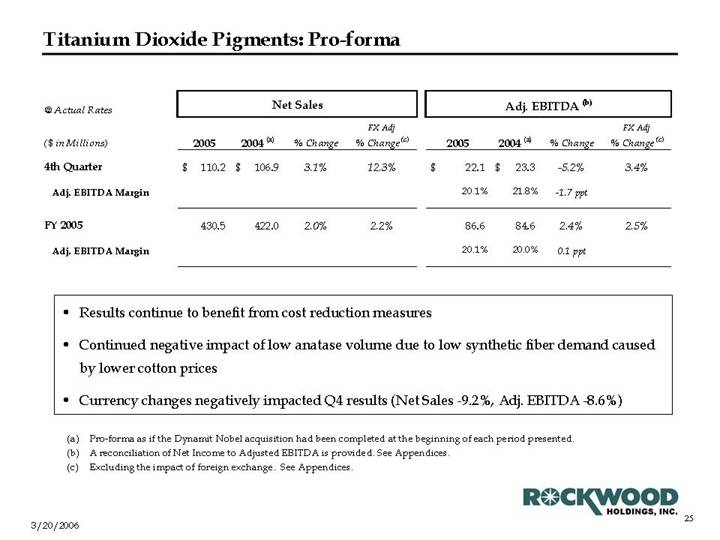
Titanium Dioxide Pigments: Pro-forma
| | Net Sales | | Adj. EBITDA (b) | |
@ Actual Rates | | | | | | | | FX Adj | | | | | | | | FX Adj | |
($ in Millions) | | 2005 | | 2004 (a) | | % Change | | % Change (c) | | 2005 | | 2004 (a) | | % Change | | % Change (c) | |
| | | | | | | | | | | | | | | | | |
4th Quarter | | $ | 110.2 | | $ | 106.9 | | 3.1 | % | 12.3 | % | $ | 22.1 | | $ | 23.3 | | -5.2 | % | 3.4 | % |
| | | | | | | | | | | | | | | | | |
Adj. EBITDA Margin | | | | | | | | | | 20.1 | % | 21.8 | % | -1.7 | ppt | | |
| | | | | | | | | | | | | | | | | |
FY 2005 | | 430.5 | | 422.0 | | 2.0 | % | 2.2 | % | 86.6 | | 84.6 | | 2.4 | % | 2.5 | % |
| | | | | | | | | | | | | | | | | |
Adj. EBITDA Margin | | | | | | | | | | 20.1 | % | 20.0 | % | 0.1 | ppt | | |
| | | | | | | | | | | | | | | | | | | | | |
• Results continue to benefit from cost reduction measures
• Continued negative impact of low anatase volume due to low synthetic fiber demand caused by lower cotton prices
• Currency changes negatively impacted Q4 results (Net Sales -9.2%, Adj. EBITDA -8.6%)
(a) Pro-forma as if the Dynamit Nobel acquisition had been completed at the beginning of each period presented.
(b) A reconciliation of Net Income to Adjusted EBITDA is provided. See Appendices.
(c) Excluding the impact of foreign exchange. See Appendices.
25
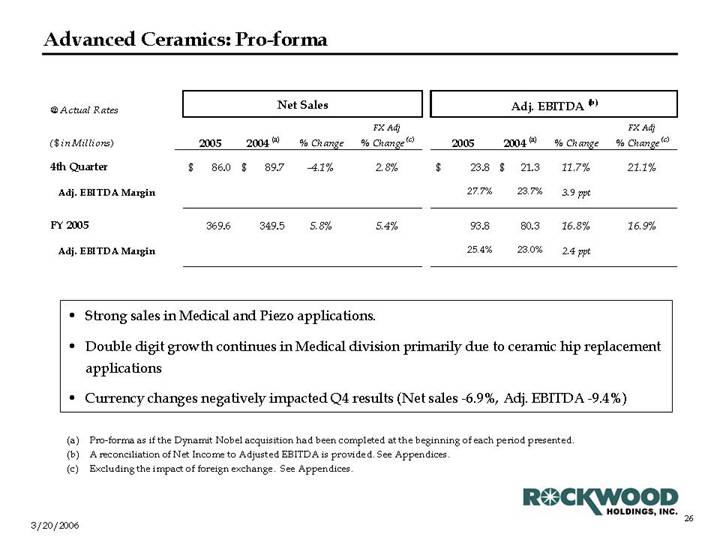
Advanced Ceramics: Pro-forma
| | Net Sales | | Adj. EBITDA (b) | |
@ Actual Rates | | | | | | | | FX Adj | | | | | | | | FX Adj | |
($ in Millions) | | 2005 | | 2004(a) | | % Change | | % Change (c) | | 2005 | | 2004(a) | | % Change | | % Change (c) | |
| | | | | | | | | | | | | | | | | |
4th Quarter | | $ | 86.0 | | $ | 89.7 | | -4.1 | % | 2.8 | % | $ | 23.8 | | $ | 21.3 | | 11.7 | % | 21.1 | % |
| | | | | | | | | | | | | | | | | |
Adj. EBITDA Margin | | | | | | | | | | 27.7 | % | 23.7 | % | 3.9 | ppt | | |
| | | | | | | | | | | | | | | | | |
FY 2005 | | 369.6 | | 349.5 | | 5.8 | % | 5.4 | % | 93.8 | | 80.3 | | 16.8 | % | 16.9 | % |
| | | | | | | | | | | | | | | | | |
Adj. EBITDA Margin | | | | | | | | | | 25.4 | % | 23.0 | % | 2.4 | ppt | | |
| | | | | | | | | | | | | | | | | | | | | |
• Strong sales in Medical and Piezo applications.
• Double digit growth continues in Medical division primarily due to ceramic hip replacement applications
• Currency changes negatively impacted Q4 results (Net sales -6.9%, Adj. EBITDA -9.4%)
(a) Pro-forma as if the Dynamit Nobel acquisition had been completed at the beginning of each period presented.
(b) A reconciliation of Net Income to Adjusted EBITDA is provided. See Appendices.
(c) Excluding the impact of foreign exchange. See Appendices.
26
Groupe Novasep: Pro-forma
| | Net Sales | | Adj. EBITDA (b) | |
@ Actual Rates | | | | | | | | FX Adj | | | | | | | | FX Adj | |
($ in Millions) | | 2005 | | 2004 (a) | | % Change | | % Change (c) | | 2005 | | 2004 (a) | | % Change | | % Change (c) | |
| | | | | | | | | | | | | | | | | |
4th Quarter | | $ | 99.2 | | $ | 102.4 | | -3.1 | % | 6.2 | % | $ | 16.6 | | $ | 19.9 | | -16.6 | % | -13.6 | % |
| | | | | | | | | | | | | | | | | |
Adj. EBITDA Margin | | | | | | | | | | 16.7 | % | 19.4 | % | -2.7 | ppt | | |
| | | | | | | | | | | | | | | | | |
FY 2005 | | 379.1 | | 338.6 | | 12.0 | % | 12.3 | % | 51.9 | | 61.1 | | -15.1 | % | -15.4 | % |
| | | | | | | | | | | | | | | | | |
Adj. EBITDA Margin | | | | | | | | | | 13.7 | % | 18.0 | % | -4.4 | ppt | | |
| | | | | | | | | | | | | | | | | | | | | |
• Continued capacity utilization issues at Rohner.
• Sales increase due to late 2004 Novasep acquisitions.
• Sales continue to be generated in lower margin yielding applications.
• Rohner divested in March 2006.
(a) Pro-forma as if the Dynamit Nobel acquisition had been completed at the beginning of each period presented.
(b) A reconciliation of Net Income to Adjusted EBITDA is provided. See Appendices.
(c) Excluding the impact of foreign exchange. See Appendices.
27
FY Results By Segment: Pro Forma
| | Net Sales | | Adj. EBITDA (b) | |
@ Actual Rates | | | | | | | | FX Adj | | | | | | | | FX Adj | |
($M) | | FY 2005 | | FY 2004 (a) | | % Change | | % Change (c) | | FY 2005 | | FY 2004 (a) | | % Change | | % Change (c) | |
| | | | | | | | | | | | | | | | | |
Performance Additives | | $ | 680.7 | | $ | 674.8 | | 0.9 | % | 0.7 | % | $ | 148.3 | | $ | 154.9 | | -4.3 | % | -5.0 | % |
| | | | | | | | | | | | | | | | | |
Specialty Compounds | | 237.5 | | 200.4 | | 18.5 | % | 18.2 | % | 29.5 | | 28.8 | | 2.4 | % | 1.7 | % |
| | | | | | | | | | | | | | | | | |
Electronics | | 181.8 | | 168.1 | | 8.1 | % | 7.1 | % | 26.9 | | 28.9 | | -6.9 | % | -6.9 | % |
| | | | | | | | | | | | | | | | | |
Specialty Chemicals | | 842.0 | | 759.6 | | 10.8 | % | 10.0 | % | 174.2 | | 141.4 | | 23.2 | % | 22.2 | % |
| | | | | | | | | | | | | | | | | |
Titanium Dioxide Pigments | | 430.5 | | 422.0 | | 2.0 | % | 2.2 | % | 86.6 | | 84.6 | | 2.4 | % | 2.5 | % |
| | | | | | | | | | | | | | | | | |
Advanced Ceramics | | 369.6 | | 349.5 | | 5.8 | % | 5.4 | % | 93.8 | | 80.3 | | 16.8 | % | 16.9 | % |
| | | | | | | | | | | | | | | | | |
Groupe Novasep | | 379.1 | | 338.6 | | 12.0 | % | 12.3 | % | 51.9 | | 61.1 | | -15.1 | % | -15.4 | % |
| | | | | | | | | | | | | | | | | |
Corporate | | — | | — | | | | | | (40.3 | ) | (40.1 | ) | -0.5 | % | -0.2 | % |
| | | | | | | | | | | | | | | | | |
Total Rockwood | | $ | 3,121.2 | | $ | 2,913.0 | | 7.1 | % | 6.8 | % | $ | 570.9 | | $ | 539.9 | | 5.7 | % | 5.3 | % |
| | | | | | | | | | | | | | | | | |
Adj. EBITDA Margin | | | | | | | | | | 18.3 | % | 18.5 | % | -0.2 | ppt | | |
(a) Pro-forma as if the Dynamit Nobel, Omega and Groupe Novasep acquisitions had been completed at the beginning of the year.
(b) A reconciliation of net income before taxes to Adjusted EBITDA is provided. See Appendices.
(c) Excluding the impact of foreign exchange. See Appendices.
28
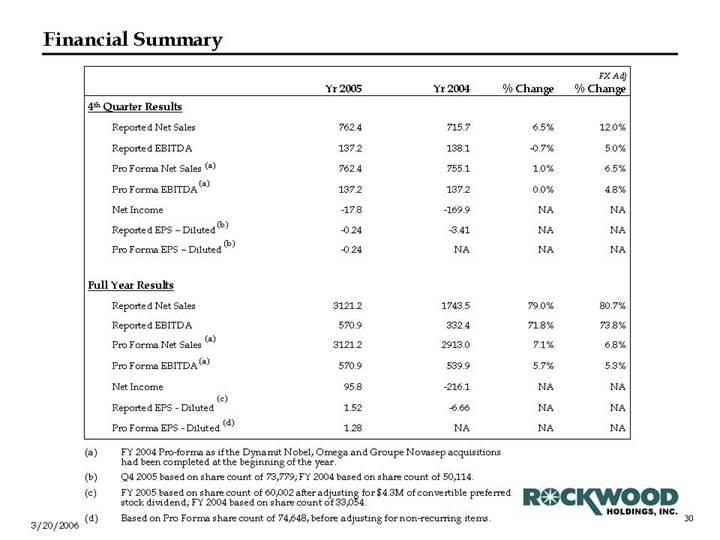
Financial Summary
| | | | | | | | FX Adj | |
| | Yr 2005 | | Yr 2004 | | % Change | | % Change | |
4th Quarter Results | | | | | | | | | |
Reported Net Sales | | 762.4 | | 715.7 | | 6.5 | % | 12.0 | % |
Reported EBITDA | | 137.2 | | 138.1 | | -0.7 | % | 5.0 | % |
Pro Forma Net Sales (a) | | 762.4 | | 755.1 | | 1.0 | % | 6.5 | % |
Pro Forma EBITDA (a) | | 137.2 | | 137.2 | | 0.0 | % | 4.8 | % |
Net Income | | -17.8 | | -169.9 | | NA | | NA | |
Reported EPS – Diluted (b) | | -0.24 | | -3.41 | | NA | | NA | |
Pro Forma EPS – Diluted (b) | | -0.24 | | NA | | NA | | NA | |
| | | | | | | | | |
Full Year Results | | | | | | | | | |
Reported Net Sales | | 3121.2 | | 1743.5 | | 79.0 | % | 80.7 | % |
Reported EBITDA | | 570.9 | | 332.4 | | 71.8 | % | 73.8 | % |
Pro Forma Net Sales (a) | | 3121.2 | | 2913.0 | | 7.1 | % | 6.8 | % |
Pro Forma EBITDA (a) | | 570.9 | | 539.9 | | 5.7 | % | 5.3 | % |
Net Income | | 95.8 | | -216.1 | | NA | | NA | |
Reported EPS - Diluted (c) | | 1.52 | | -6.66 | | NA | | NA | |
Pro Forma EPS - Diluted (d) | | 1.28 | | NA | | NA | | NA | |
(a) FY 2004 Pro-forma as if the Dynamit Nobel, Omega and Groupe Novasep acquisitions had been completed at the beginning of the year.
(b) Q4 2005 based on share count of 73,779; FY 2004 based on share count of 50,114.
(c) FY 2005 based on share count of 60,002 after adjusting for $4.3M of convertible preferred stock dividend; FY 2004 based on share count of 33,054.
(d) Based on Pro Forma share count of 74,648, before adjusting for non-recurring items.
30
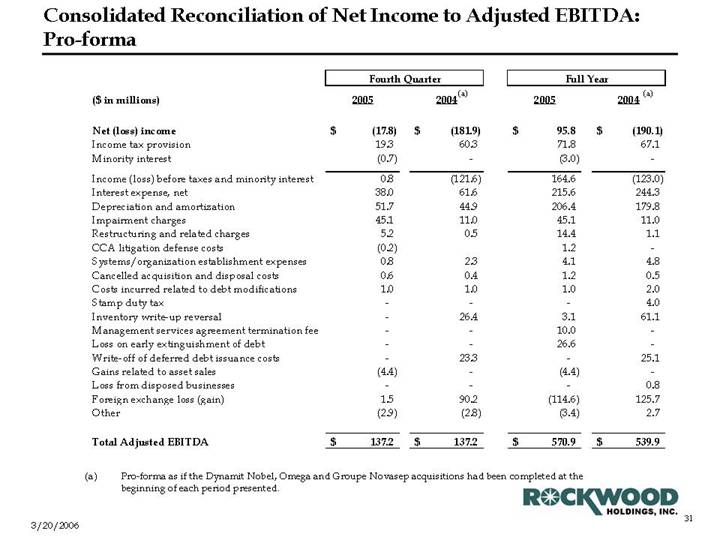
Consolidated Reconciliation of Net Income to Adjusted EBITDA: Pro-forma
| | Fourth Quarter | | Full Year | |
($ in millions) | | 2005 | | 2004 (a) | | 2005 | | 2004 (a) | |
| | | | | | | | | |
Net (loss) income | | $ | (17.8 | ) | $ | (181.9 | ) | $ | 95.8 | | $ | (190.1 | ) |
Income tax provision | | 19.3 | | 60.3 | | 71.8 | | 67.1 | |
Minority interest | | (0.7 | ) | — | | (3.0 | ) | — | |
| | | | | | | | | |
Income (loss) before taxes and minority interest | | 0.8 | | (121.6 | ) | 164.6 | | (123.0 | ) |
Interest expense, net | | 38.0 | | 61.6 | | 215.6 | | 244.3 | |
Depreciation and amortization | | 51.7 | | 44.9 | | 206.4 | | 179.8 | |
Impairment charges | | 45.1 | | 11.0 | | 45.1 | | 11.0 | |
Restructuring and related charges | | 5.2 | | 0.5 | | 14.4 | | 1.1 | |
CCA litigation defense costs | | (0.2 | ) | | | 1.2 | | — | |
Systems/organization establishment expenses | | 0.8 | | 2.3 | | 4.1 | | 4.8 | |
Cancelled acquisition and disposal costs | | 0.6 | | 0.4 | | 1.2 | | 0.5 | |
Costs incurred related to debt modifications | | 1.0 | | 1.0 | | 1.0 | | 2.0 | |
Stamp duty tax | | — | | — | | — | | 4.0 | |
Inventory write-up reversal | | — | | 26.4 | | 3.1 | | 61.1 | |
Management services agreement termination fee | | — | | — | | 10.0 | | — | |
Loss on early extinguishment of debt | | — | | — | | 26.6 | | — | |
Write-off of deferred debt issuance costs | | — | | 23.3 | | — | | 25.1 | |
Gains related to asset sales | | (4.4 | ) | — | | (4.4 | ) | — | |
Loss from disposed businesses | | — | | — | | — | | 0.8 | |
Foreign exchange loss (gain) | | 1.5 | | 90.2 | | (114.6 | ) | 125.7 | |
Other | | (2.9 | ) | (2.8 | ) | (3.4 | ) | 2.7 | |
| | | | | | | | | |
Total Adjusted EBITDA | | $ | 137.2 | | $ | 137.2 | | $ | 570.9 | | $ | 539.9 | |
(a) Pro-forma as if the Dynamit Nobel, Omega and Groupe Novasep acquisitions had been completed at the beginning of each period presented.
31
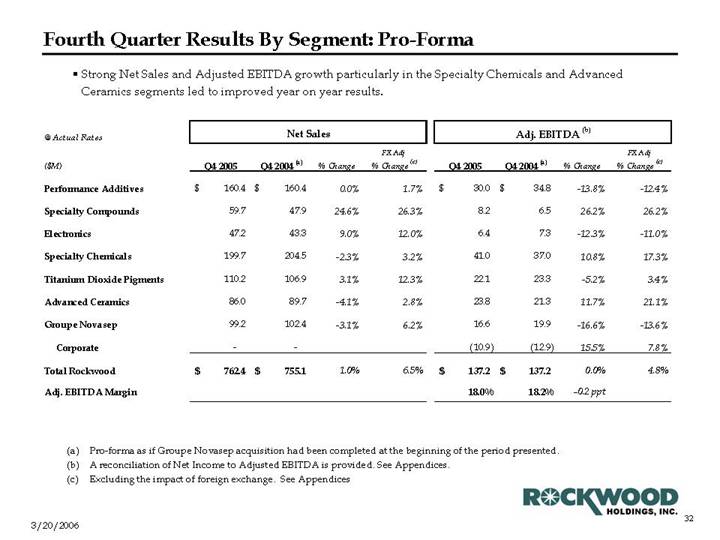
Fourth Quarter Results By Segment: Pro-Forma
• Strong Net Sales and Adjusted EBITDA growth particularly in the Specialty Chemicals and Advanced Ceramics segments led to improved year on year results.
| | Net Sales | | Adj. EBITDA (b) | |
@ Actual Rates | | | | | | | | FX Adj | | | | | | | | FX Adj | |
($M) | | Q4 2005 | | Q4 2004 (a) | | % Change | | % Change (c) | | Q4 2005 | | Q4 2004 (a) | | % Change | | % Change(c) | |
| | | | | | | | | | | | | | | | | |
Performance Additives | | $ | 160.4 | | $ | 160.4 | | 0.0 | % | 1.7 | % | $ | 30.0 | | $ | 34.8 | | -13.8 | % | -12.4 | % |
Specialty Compounds | | 59.7 | | 47.9 | | 24.6 | % | 26.3 | % | 8.2 | | 6.5 | | 26.2 | % | 26.2 | % |
Electronics | | 47.2 | | 43.3 | | 9.0 | % | 12.0 | % | 6.4 | | 7.3 | | -12.3 | % | -11.0 | % |
Specialty Chemicals | | 199.7 | | 204.5 | | -2.3 | % | 3.2 | % | 41.0 | | 37.0 | | 10.8 | % | 17.3 | % |
Titanium Dioxide Pigments | | 110.2 | | 106.9 | | 3.1 | % | 12.3 | % | 22.1 | | 23.3 | | -5.2 | % | 3.4 | % |
Advanced Ceramics | | 86.0 | | 89.7 | | -4.1 | % | 2.8 | % | 23.8 | | 21.3 | | 11.7 | % | 21.1 | % |
Groupe Novasep | | 99.2 | | 102.4 | | -3.1 | % | 6.2 | % | 16.6 | | 19.9 | | -16.6 | % | -13.6 | % |
Corporate | | — | | — | | | | | | (10.9 | ) | (12.9 | ) | 15.5 | % | 7.8 | % |
Total Rockwood | | $ | 762.4 | | $ | 755.1 | | 1.0 | % | 6.5 | % | $ | 137.2 | | $ | 137.2 | | 0.0 | % | 4.8 | % |
Adj. EBITDA Margin | | | | | | | | | | 18.0 | % | 18.2 | % | -0.2 | ppt | | |
(a) Pro-forma as if Groupe Novasep acquisition had been completed at the beginning of the period presented.
(b) A reconciliation of Net Income to Adjusted EBITDA is provided. See Appendices.
(c) Excluding the impact of foreign exchange. See Appendices
32
FY Results By Segment: Pro-forma
• Strong Net Sales and Adjusted EBITDA growth particularly in the Specialty Chemicals and Advanced Ceramics segments led to improved year on year results.
| | Net Sales | | Adj. EBITDA (b) | |
@ Actual Rates | | | | | | | | FX Adj | | | | | | | | FX Adj | |
($M) | | FY 2005 | | FY 2004 (a) | | % Change | | % Change (c) | | FY 2005 | | FY 2004 (a) | | % Change | | % Change (c) | |
| | | | | | | | | | | | | | | | | |
Performance Additives | | $ | 680.7 | | $ | 674.8 | | 0.9 | % | 0.7 | % | $ | 148.3 | | $ | 154.9 | | -4.3 | % | -5.0 | % |
Specialty Compounds | | 237.5 | | 200.4 | | 18.5 | % | 18.2 | % | 29.5 | | 28.8 | | 2.4 | % | 1.7 | % |
Electronics | | 181.8 | | 168.1 | | 8.1 | % | 7.1 | % | 26.9 | | 28.9 | | -6.9 | % | -6.9 | % |
Specialty Chemicals | | 842.0 | | 759.6 | | 10.8 | % | 10.0 | % | 174.2 | | 141.4 | | 23.2 | % | 22.2 | % |
Titanium Dioxide Pigments | | 430.5 | | 422.0 | | 2.0 | % | 2.2 | % | 86.6 | | 84.6 | | 2.4 | % | 2.5 | % |
Advanced Ceramics | | 369.6 | | 349.5 | | 5.8 | % | 5.4 | % | 93.8 | | 80.3 | | 16.8 | % | 16.9 | % |
Groupe Novasep | | 379.1 | | 338.6 | | 12.0 | % | 12.3 | % | 51.9 | | 61.1 | | -15.1 | % | -15.4 | % |
Corporate | | — | | — | | | | | | (40.3 | ) | (40.1 | ) | -0.5 | % | -0.2 | % |
Total Rockwood | | $ | 3,121.2 | | $ | 2,913.0 | | 7.1 | % | 6.8 | % | $ | 570.9 | | $ | 539.9 | | 5.7 | % | 5.3 | % |
Adj. EBITDA Margin | | | | | | | | | | 18.3 | % | 18.5 | % | -0.2 | ppt | | |
| | | | | | | | | | | | | | | | | | | | | | | | |
(a) Pro-forma as if the Dynamit Nobel, Omega and Groupe Novasep acquisitions had been completed at the beginning of each period presented.
(b) A reconciliation of Net Income to Adjusted EBITDA is provided. See Appendices.
(c) Excluding the impact of foreign exchange. See Appendices
33
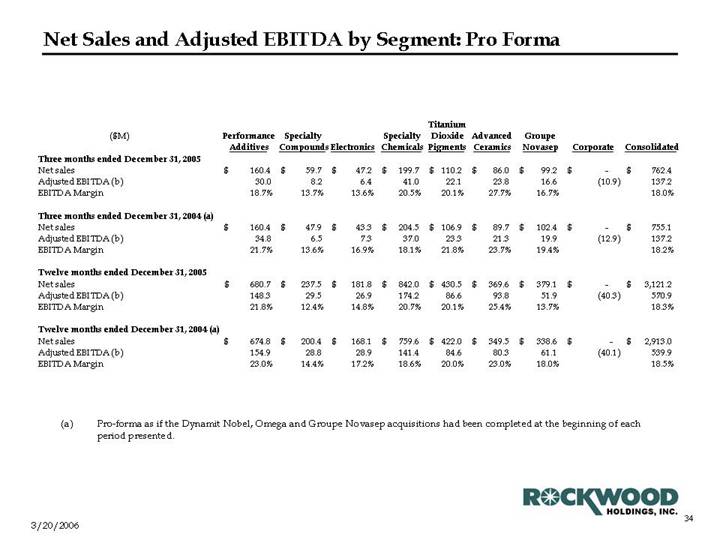
Net Sales and Adjusted EBITDA by Segment: Pro Forma
| | | | | | | | | | Titanium | | | | | | | | | |
| | Performance | | Specialty | | | | Specialty | | Dioxide | | Advanced | | Groupe | | | | | |
($M) | | Additives | | Compounds | | Electronics | | Chemicals | | Pigments | | Ceramics | | Novasep | | Corporate | | Consolidated | |
Three months ended December 31, 2005 | | | | | | | | | | | | | | | | | | | |
Net sales | | $ | 160.4 | | $ | 59.7 | | $ | 47.2 | | $ | 199.7 | | $ | 110.2 | | $ | 86.0 | | $ | 99.2 | | $ | — | | $ | 762.4 | |
Adjusted EBITDA (b) | | 30.0 | | 8.2 | | 6.4 | | 41.0 | | 22.1 | | 23.8 | | 16.6 | | (10.9 | ) | 137.2 | |
EBITDA Margin | | 18.7 | % | 13.7 | % | 13.6 | % | 20.5 | % | 20.1 | % | 27.7 | % | 16.7 | % | | | 18.0 | % |
| | | | | | | | | | | | | | | | | | | |
Three months ended December 31, 2004 (a) | | | | | | | | | | | | | | | | | | | |
Net sales | | $ | 160.4 | | $ | 47.9 | | $ | 43.3 | | $ | 204.5 | | $ | 106.9 | | $ | 89.7 | | $ | 102.4 | | $ | — | | $ | 755.1 | |
Adjusted EBITDA (b) | | 34.8 | | 6.5 | | 7.3 | | 37.0 | | 23.3 | | 21.3 | | 19.9 | | (12.9 | ) | 137.2 | |
EBITDA Margin | | 21.7 | % | 13.6 | % | 16.9 | % | 18.1 | % | 21.8 | % | 23.7 | % | 19.4 | % | | | 18.2 | % |
| | | | | | | | | | | | | | | | | | | |
Twelve months ended December 31, 2005 | | | | | | | | | | | | | | | | | | | |
Net sales | | $ | 680.7 | | $ | 237.5 | | $ | 181.8 | | $ | 842.0 | | $ | 430.5 | | $ | 369.6 | | $ | 379.1 | | $ | — | | $ | 3,121.2 | |
Adjusted EBITDA (b) | | 148.3 | | 29.5 | | 26.9 | | 174.2 | | 86.6 | | 93.8 | | 51.9 | | (40.3 | ) | 570.9 | |
EBITDA Margin | | 21.8 | % | 12.4 | % | 14.8 | % | 20.7 | % | 20.1 | % | 25.4 | % | 13.7 | % | | | 18.3 | % |
| | | | | | | | | | | | | | | | | | | |
Twelve months ended December 31, 2004 (a) | | | | | | | | | | | | | | | | | | | |
Net sales | | $ | 674.8 | | $ | 200.4 | | $ | 168.1 | | $ | 759.6 | | $ | 422.0 | | $ | 349.5 | | $ | 338.6 | | $ | — | | $ | 2,913.0 | |
Adjusted EBITDA (b) | | 154.9 | | 28.8 | | 28.9 | | 141.4 | | 84.6 | | 80.3 | | 61.1 | | (40.1 | ) | 539.9 | |
EBITDA Margin | | 23.0 | % | 14.4 | % | 17.2 | % | 18.6 | % | 20.0 | % | 23.0 | % | 18.0 | % | | | 18.5 | % |
(a) Pro-forma as if the Dynamit Nobel, Omega and Groupe Novasep acquisitions had been completed at the beginning of each period presented.
34
Earnings Per Share
| | Q4 2005 | | FY 2005 | |
($M) | | Net Income | | EPS (7) | | Net Income | | EPS (8) | |
Reported Net Income | | (17.8 | ) | (0.24 | ) | 95.8 | | 1.28 | |
Non-Recurring Items | | | | | | | | | |
IPO Related Charges(1) | | 0.0 | | 0.00 | | 23.8 | | 0.32 | |
Restructuring(2) | | 3.3 | | 0.04 | | 9.0 | | 0.12 | |
Rohner Related Charges(3) | | 43.7 | | 0.59 | | 43.7 | | 0.58 | |
Inventory Step-up Reversal (Novasep) | | 0.0 | | 0.00 | | 2.1 | | 0.03 | |
FX Gain on Euro Debt(4) | | 0.9 | | 0.01 | | (69.3 | ) | (0.93 | ) |
Interest Expense - MTM of Swaps | | (6.0 | ) | (0.08 | ) | (13.8 | ) | (0.18 | ) |
PF Interest Reduction due to IPO | | 0.0 | | 0.00 | | 20.5 | | 0.27 | |
Valuation Allowance(5) | | 2.2 | | 0.03 | | (18.1 | ) | (0.24 | ) |
Other Charges(6) | | (5.6 | ) | (0.08 | ) | (2.6 | ) | (0.04 | ) |
(1) Includes management agreement termination, debt redemption premium and deferred financing cost write-off.
(2) Mainly Wafer Reclaim in Electronics Segment and Baulking in Performance Additives Segment.
(3) Includes Rohner impairment charge and minority interests of impairment and loan guarantee.
(4) Results from the impact of the euro/$ change on our euro-denominated debt.
(5) FY amount is net reversal of valuation allowance previously set up on US deferred tax assets.
(6) Includes system & organization establishment cost, acquisition & divestiture cost, CCA litigation cost, financing cost, gain on disposal of assets and CeramTec interest income.
(7) Based on 73,779 diluted shares based on the Treasury Stock Method.
(8) Based on 74,648 pro forma diluted shares based on the Treasury Stock Method.
35
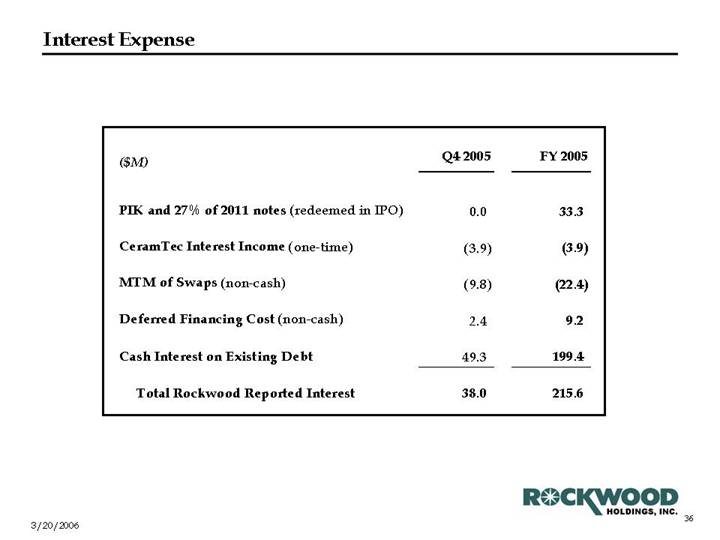
Interest Expense
($M) | | Q4 2005 | | FY 2005 | |
| | | | | |
PIK and 27% of 2011 notes (redeemed in IPO) | | 0.0 | | 33.3 | |
CeramTec Interest Income (one-time) | | (3.9 | ) | (3.9 | ) |
MTM of Swaps (non-cash) | | (9.8 | ) | (22.4 | ) |
Deferred Financing Cost (non-cash) | | 2.4 | | 9.2 | |
Cash Interest on Existing Debt | | 49.3 | | 199.4 | |
Total Rockwood Reported Interest | | 38.0 | | 215.6 | |
36
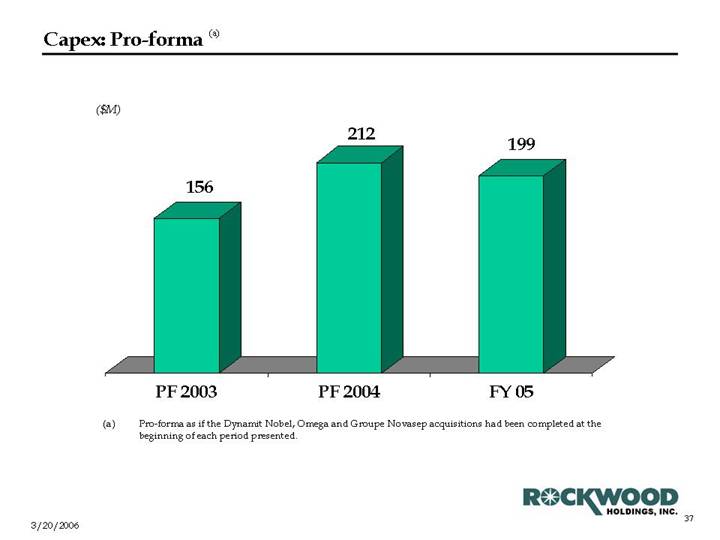
Capex: Pro-forma (a)
($M)
[CHART]
(a) Pro-forma as if the Dynamit Nobel, Omega and Groupe Novasep acquisitions had been completed at the beginning of each period presented.
37
Net Debt
| | LTM | | | | LTM | | | |
($M) | | 12/31/2004 | | Leverage | | 12/31/2005 | | Leverage | |
B/S FX | | 1.36 | | | | 1.18 | | | |
Adjusted EBITDA (a) | | $ | 539.9 | | | | $ | 570.9 | | | |
| | | | | | | | | |
Cash | | 111.3 | | 0.21 | x | 102.2 | | 0.18 | x |
Revolver | | — | | | | 30.0 | | 0.05 | x |
Term Loans | | 1,803.4 | | 3.34 | x | 1,709.0 | | 2.99 | x |
Assumed Debt | | 236.0 | | 0.44 | x | 189.0 | | 0.33 | x |
Net Sr. Debt | | $ | 1,928.1 | | 3.57 | x | $ | 1,825.8 | | 3.20 | x |
| | | | | | | | | |
PIK Notes/S. Disc. Notes | | 256.5 | | 0.48 | x | — | | 0.00 | x |
Sr. Sub.Notes 2011 | | 375.0 | | 0.69 | x | 273.4 | | 0.48 | x |
Sr. Sub.Notes 2014 | | 709.7 | | 1.31 | x | 642.4 | | 1.13 | x |
Net Debt | | $ | 3,269.3 | | 6.06 | x | $ | 2,741.6 | | 4.80 | x(b) |
(a) A reconciliation of pro-forma net income to pro-forma Adjusted EBITDA is provided. See Appendices.
(b) Excluding the impact of Sud Chemie acquisition, the leverage ratio is 4.68x. Covenant ratio per credit agreement at Rockwood Specialties Group, Inc. is 4.87x.
38
Total Net Debt / LTM Adjusted EBITDA
[CHART]
39
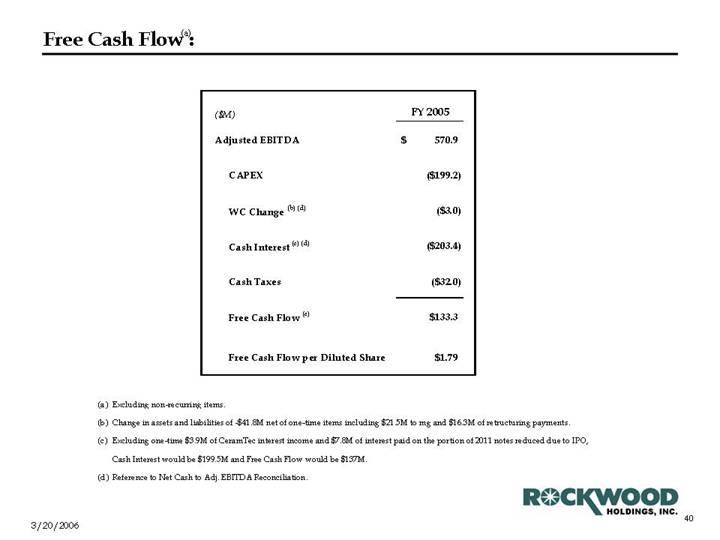
Free Cash Flow (a):
($M) | | FY 2005 | |
Adjusted EBITDA | | $ | 570.9 | |
CAPEX | | $ | (199.2 | ) |
WC Change (b) (d) | | $ | (3.0 | ) |
Cash Interest (c) (d) | | $ | (203.4 | ) |
Cash Taxes | | $ | (32.0 | ) |
Free Cash Flow (c) | | $ | 133.3 | |
Free Cash Flow per Diluted Share | | $ | 1.79 | |
(a) Excluding non-recurring items.
(b) Change in assets and liabilities of -$41.8M net of one-time items including $21.5M to mg and $16.3M of retructuring payments.
(c) Excluding one-time $3.9M of CeramTec interest income and $7.8M of interest paid on the portion of 2011 notes reduced due to IPO, Cash Interest would be $199.5M and Free Cash Flow would be $137M.
(d) Reference to Net Cash to Adj. EBITDA Reconciliation.
40
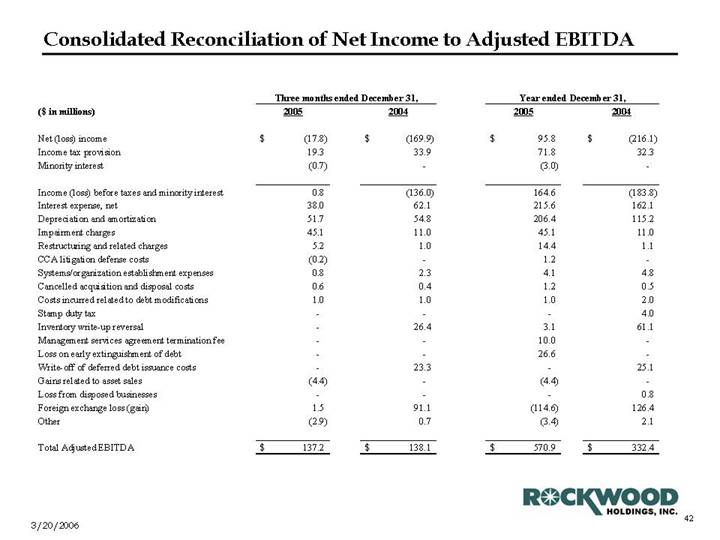
Consolidated Reconciliation of Net Income to Adjusted EBITDA
| | Three months ended December 31, | | Year ended December 31, | |
($ in millions) | | 2005 | | 2004 | | 2005 | | 2004 | |
| | | | | | | | | |
Net (loss) income | | $ | (17.8 | ) | $ | (169.9 | ) | $ | 95.8 | | $ | (216.1 | ) |
Income tax provision | | 19.3 | | 33.9 | | 71.8 | | 32.3 | |
Minority interest | | (0.7 | ) | — | | (3.0 | ) | — | |
| | | | | | | | | |
Income (loss) before taxes and minority interest | | 0.8 | | (136.0 | ) | 164.6 | | (183.8 | ) |
Interest expense, net | | 38.0 | | 62.1 | | 215.6 | | 162.1 | |
Depreciation and amortization | | 51.7 | | 54.8 | | 206.4 | | 115.2 | |
Impairment charges | | 45.1 | | 11.0 | | 45.1 | | 11.0 | |
Restructuring and related charges | | 5.2 | | 1.0 | | 14.4 | | 1.1 | |
CCA litigation defense costs | | (0.2 | ) | — | | 1.2 | | — | |
Systems/organization establishment expenses | | 0.8 | | 2.3 | | 4.1 | | 4.8 | |
Cancelled acquisition and disposal costs | | 0.6 | | 0.4 | | 1.2 | | 0.5 | |
Costs incurred related to debt modifications | | 1.0 | | 1.0 | | 1.0 | | 2.0 | |
Stamp duty tax | | — | | — | | — | | 4.0 | |
Inventory write-up reversal | | — | | 26.4 | | 3.1 | | 61.1 | |
Management services agreement termination fee | | — | | — | | 10.0 | | — | |
Loss on early extinguishment of debt | | — | | — | | 26.6 | | — | |
Write-off of deferred debt issuance costs | | — | | 23.3 | | — | | 25.1 | |
Gains related to asset sales | | (4.4 | ) | — | | (4.4 | ) | — | |
Loss from disposed businesses | | — | | — | | — | | 0.8 | |
Foreign exchange loss (gain) | | 1.5 | | 91.1 | | (114.6 | ) | 126.4 | |
Other | | (2.9 | ) | 0.7 | | (3.4 | ) | 2.1 | |
| | | | | | | | | |
Total Adjusted EBITDA | | $ | 137.2 | | $ | 138.1 | | $ | 570.9 | | $ | 332.4 | |
42
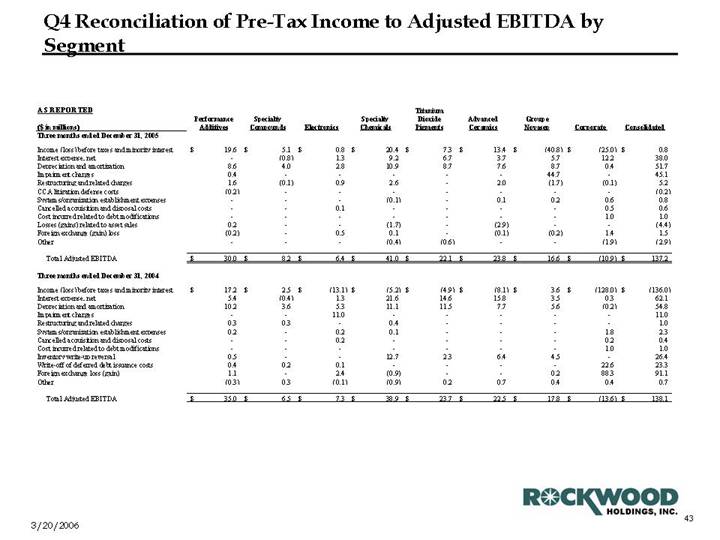
Q4 Reconciliation of Pre-Tax Income to Adjusted EBITDA by Segment
AS REPORTED
| | | | | | | | | | Titanium | | | | | | | | | |
| | Performance | | Specialty | | | | Specialty | | Dioxide | | Advanced | | Groupe | | | | | |
($ in millions) | | Additives | | Compounds | | Electronics | | Chemicals | | Pigments | | Ceramics | | Novasep | | Corporate | | Consolidated | |
Three months ended December 31, 2005 | | | | | | | | | | | | | | | | | | | |
| | | | | | | | | | | | | | | | | | | |
Income (loss) before taxes and minority interest | | $ | 19.6 | | $ | 5.1 | | $ | 0.8 | | $ | 20.4 | | $ | 7.3 | | $ | 13.4 | | $ | (40.8 | ) | $ | (25.0 | ) | $ | 0.8 | |
Interest expense, net | | — | | (0.8 | ) | 1.3 | | 9.2 | | 6.7 | | 3.7 | | 5.7 | | 12.2 | | 38.0 | |
Depreciation and amortization | | 8.6 | | 4.0 | | 2.8 | | 10.9 | | 8.7 | | 7.6 | | 8.7 | | 0.4 | | 51.7 | |
Impairment charges | | 0.4 | | — | | — | | — | | — | | — | | 44.7 | | — | | 45.1 | |
Restructuring and related charges | | 1.6 | | (0.1 | ) | 0.9 | | 2.6 | | — | | 2.0 | | (1.7 | ) | (0.1 | ) | 5.2 | |
CCA litigation defense costs | | (0.2 | ) | — | | — | | — | | — | | — | | — | | — | | (0.2 | ) |
Systems/organization establishment expenses | | — | | — | | — | | (0.1 | ) | — | | 0.1 | | 0.2 | | 0.6 | | 0.8 | |
Cancelled acquisition and disposal costs | | — | | — | | 0.1 | | — | | — | | — | | — | | 0.5 | | 0.6 | |
Cost incurred related to debt modifications | | — | | — | | — | | — | | — | | — | | — | | 1.0 | | 1.0 | |
Losses (gains) related to asset sales | | 0.2 | | — | | — | | (1.7 | ) | — | | (2.9 | ) | — | | — | | (4.4 | ) |
Foreign exchange (gain) loss | | (0.2 | ) | — | | 0.5 | | 0.1 | | — | | (0.1 | ) | (0.2 | ) | 1.4 | | 1.5 | |
Other | | — | | — | | — | | (0.4 | ) | (0.6 | ) | — | | — | | (1.9 | ) | (2.9 | ) |
| | | | | | | | | | | | | | | | | | | |
Total Adjusted EBITDA | | $ | 30.0 | | $ | 8.2 | | $ | 6.4 | | $ | 41.0 | | $ | 22.1 | | $ | 23.8 | | $ | 16.6 | | $ | (10.9 | ) | $ | 137.2 | |
| | | | | | | | | | | | | | | | | | | |
Three months ended December 31, 2004 | | | | | | | | | | | | | | | | | | | |
| | | | | | | | | | | | | | | | | | | |
Income (loss) before taxes and minority interest | | $ | 17.2 | | $ | 2.5 | | $ | (13.1 | ) | $ | (5.2 | ) | $ | (4.9 | ) | $ | (8.1 | ) | $ | 3.6 | | $ | (128.0 | ) | $ | (136.0 | ) |
Interest expense, net | | 5.4 | | (0.4 | ) | 1.3 | | 21.6 | | 14.6 | | 15.8 | | 3.5 | | 0.3 | | 62.1 | |
Depreciation and amortization | | 10.2 | | 3.6 | | 5.3 | | 11.1 | | 11.5 | | 7.7 | | 5.6 | | (0.2 | ) | 54.8 | |
Impairment charges | | — | | — | | 11.0 | | — | | — | | — | | — | | — | | 11.0 | |
Restructuring and related charges | | 0.3 | | 0.3 | | — | | 0.4 | | — | | — | | — | | — | | 1.0 | |
Systems/organization establishment expenses | | 0.2 | | — | | 0.2 | | 0.1 | | — | | — | | — | | 1.8 | | 2.3 | |
Cancelled acquisition and disposal costs | | — | | — | | 0.2 | | — | | — | | — | | — | | 0.2 | | 0.4 | |
Cost incurred related to debt modifications | | — | | — | | — | | — | | — | | — | | — | | 1.0 | | 1.0 | |
Inventory write-up reversal | | 0.5 | | — | | — | | 12.7 | | 2.3 | | 6.4 | | 4.5 | | — | | 26.4 | |
Write-off of deferred debt issuance costs | | 0.4 | | 0.2 | | 0.1 | | — | | — | | — | | — | | 22.6 | | 23.3 | |
Foreign exchange loss (gain) | | 1.1 | | — | | 2.4 | | (0.9 | ) | — | | — | | 0.2 | | 88.3 | | 91.1 | |
Other | | (0.3 | ) | 0.3 | | (0.1 | ) | (0.9 | ) | 0.2 | | 0.7 | | 0.4 | | 0.4 | | 0.7 | |
| | | | | | | | | | | | | | | | | | | |
Total Adjusted EBITDA | | $ | 35.0 | | $ | 6.5 | | $ | 7.3 | | $ | 38.9 | | $ | 23.7 | | $ | 22.5 | | $ | 17.8 | | $ | (13.6 | ) | $ | 138.1 | |
43
FY Reconciliation of Net Income before taxes to Adjusted EBITDA by Segment
| | Performance | | Specialty | | | | Specialty | | Dioxide | | Advanced | | Groupe | | | | | |
($ in millions) | | Additives | | Compounds | | Electronics | | Chemicals | | Pigments | | Ceramics | | Novasep | | Corporate | | Consolidated | |
Year ended December 31, 2005 | | | | | | | | | | | | | | | | | | | |
| | | | | | | | | | | | | | | | | | | |
Income (loss) before taxes and minority interest | | $ | 85.9 | | $ | 22.3 | | $ | 5.2 | | $ | 89.4 | | $ | 20.2 | | $ | 34.1 | | $ | (47.8 | ) | $ | (44.7 | ) | $ | 164.6 | |
Interest expense, net | | 20.6 | | (1.6 | ) | 5.3 | | 36.2 | | 30.8 | | 30.1 | | 17.5 | | 76.7 | | 215.6 | |
Depreciation and amortization | | 33.2 | | 8.3 | | 15.3 | | 44.7 | | 36.2 | | 29.8 | | 35.8 | | 3.1 | | 206.4 | |
Impairment charges | | 0.4 | | — | | — | | — | | — | | — | | 44.7 | | — | | 45.1 | |
Restructuring and related charges | | 6.3 | | (0.1 | ) | 3.0 | | 4.2 | | — | | 2.6 | | (1.5 | ) | (0.1 | ) | 14.4 | |
CCA litigation defense costs | | 1.1 | | — | | — | | — | | — | | — | | — | | 0.1 | | 1.2 | |
Systems/organization establishment expenses | | 0.3 | | — | | — | | (0.1 | ) | — | | 0.1 | | 0.2 | | 3.6 | | 4.1 | |
Cancelled acquisition and disposal costs | | 0.2 | | — | | 0.1 | | — | | — | | — | | — | | 0.9 | | 1.2 | |
Cost incurred related to debt modifications | | — | | — | | — | | — | | — | | — | | — | | 1.0 | | 1.0 | |
Inventory write-up reversal | | — | | — | | — | | — | | — | | — | | 3.1 | | — | | 3.1 | |
Management services agreement termination fee | | — | | — | | — | | — | | — | | — | | — | | 10.0 | | 10.0 | |
Loss on early extinguishment of debt | | 1.1 | | 0.6 | | 0.3 | | — | | — | | — | | — | | 24.6 | | 26.6 | |
Losses (gains) related to asset sales | | 0.2 | | — | | — | | (1.7 | ) | — | | (2.9 | ) | — | | — | | (4.4 | ) |
Foreign exchange (gain) loss | | (1.0 | ) | — | | (2.3 | ) | 1.9 | | — | | — | | (0.1 | ) | (113.1 | ) | (114.6 | ) |
Other | | — | | — | | — | | (0.4 | ) | (0.6 | ) | — | | — | | (2.4 | ) | (3.4 | ) |
| | | | | | | | | | | | | | | | | | | |
Total Adjusted EBITDA | | $ | 148.3 | | $ | 29.5 | | $ | 26.9 | | $ | 174.2 | | $ | 86.6 | | $ | 93.8 | | $ | 51.9 | | $ | (40.3 | ) | $ | 570.9 | |
| | | | | | | | | | | | | | | | | | | |
Year ended December 31, 2004 | | | | | | | | | | | | | | | | | | | |
| | | | | | | | | | | | | | | | | | | |
Income (loss) before taxes and minority interest | | $ | 88.3 | | $ | 21.0 | | $ | (10.1 | ) | $ | (7.1 | ) | $ | 0.3 | | $ | (13.8 | ) | $ | (1.0 | ) | $ | (261.4 | ) | $ | (183.8 | ) |
Interest expense, net | | 26.8 | | (0.7 | ) | 5.4 | | 24.3 | | 15.7 | | 16.6 | | 5.5 | | 68.5 | | 162.1 | |
Depreciation and amortization | | 32.0 | | 7.7 | | 20.8 | | 17.4 | | 15.0 | | 11.5 | | 9.8 | | 1.0 | | 115.2 | |
Impairment charges | | — | | — | | 11.0 | | — | | — | | — | | — | | — | | 11.0 | |
Restructuring and related charges | | 0.5 | | 0.3 | | — | | 0.3 | | — | | — | | — | | — | | 1.1 | |
Systems/organization establishment expenses | | 0.2 | | — | | 0.2 | | 0.1 | | — | | — | | — | | 4.3 | | 4.8 | |
Cancelled acquisition and disposal costs | | — | | — | | 0.2 | | — | | — | | — | | — | | 0.3 | | 0.5 | |
Stamp duty tax | | — | | — | | — | | — | | — | | — | | — | | 4.0 | | 4.0 | |
Loss from disposed businesses | | — | | — | | — | | — | | — | | — | | 0.8 | | — | | 0.8 | |
Cost incurred related to debt modifications | | — | | — | | — | | — | | — | | — | | — | | 2.0 | | 2.0 | |
Inventory write-up reversal | | 1.0 | | — | | — | | 25.4 | | 6.6 | | 20.8 | | 7.3 | | — | | 61.1 | |
Refinancing expenses | | 0.4 | | 0.2 | | 0.1 | | — | | — | | — | | — | | 26.4 | | 27.1 | |
Foreign exchange loss (gain) | | 0.3 | | — | | 1.4 | | (0.9 | ) | — | | — | | 0.2 | | 123.4 | | 124.4 | |
Other | | (0.3 | ) | 0.3 | | (0.1 | ) | 0.5 | | 0.2 | | 0.7 | | 0.4 | | 0.4 | | 2.1 | |
| | | | | | | | | | | | | | | | | | | |
Total Adjusted EBITDA | | $ | 149.2 | | $ | 28.8 | | $ | 28.9 | | $ | 60.0 | | $ | 37.8 | | $ | 35.8 | | $ | 23.0 | | $ | (31.1 | ) | $ | 332.4 | |
44
Consolidated Reconciliation of Net Income to Adjusted EBITDA: Pro-forma
| | Three months ended | | Year ended December | |
($ in millions) | | December 31, 2004 (a) | | 31, 2004 (a) | |
| | | | | |
Net loss | | $ | (181.9 | ) | $ | (190.1 | ) |
Income tax (benefit) provision | | 60.3 | | 67.1 | |
| | | | | |
Loss before taxes and minority interest | | (121.6 | ) | (123.0 | ) |
Interest expense, net | | 61.6 | | 244.3 | |
Depreciation and amortization | | 44.9 | | 179.8 | |
Impairment charges | | 11.0 | | 11.0 | |
Restructuring and related charges | | 0.5 | | 1.1 | |
Systems/organization establishment expenses | | 2.3 | | 4.8 | |
Cancelled acquisition and disposal costs | | 0.4 | | 0.5 | |
Stamp duty tax | | — | | 4.0 | |
Inventory write-up reversal | | 26.4 | | 61.1 | |
Refinancing expenses | | 24.3 | | 27.1 | |
Loss from disposed businesses | | — | | 0.8 | |
Foreign exchange loss | | 90.2 | | 125.7 | |
Other | | (2.8 | ) | 2.7 | |
| | | | | |
Total Adjusted EBITDA | | $ | 137.2 | | $ | 539.9 | |
(a) Pro-forma as if the Dynamit Nobel, Omega and Groupe Novasep acquisitions had been completed at the beginning of each period presented.
45
Reconciliation of Net Income before Taxes to Adjusted EBITDA :
Pro-forma (a)
PRO-FORMA
| | | | | | | | | | Titanium | | | | | | | | | |
| | Performance | | Specialty | | | | Specialty | | Dioxide | | Advanced | | Groupe | | | | | |
($ in millions) | | Additives | | Compounds | | Electronics | | Chemicals | | Pigments | | Ceramics | | Novasep | | Corporate | | Consolidated | |
Three months ended December 31, 2004 | | | | | | | | | | | | | | | | | | | |
| | | | | | | | | | | | | | | | | | | |
Income (loss) before taxes and minority interest | | $ | 16.6 | | $ | 3.9 | | $ | (13.3 | ) | $ | 11.3 | | $ | 6.8 | | $ | (1.2 | ) | $ | 6.6 | | $ | (152.3 | ) | $ | (121.6 | ) |
Interest expense, net | | 7.5 | | (0.1 | ) | 1.6 | | 10.1 | | 6.5 | | 6.9 | | 2.2 | | 26.9 | | 61.6 | |
Depreciation and amortization | | 8.5 | | 1.9 | | 5.2 | | 9.5 | | 7.1 | | 6.4 | | 6.0 | | 0.3 | | 44.9 | |
Impairment charges | | — | | — | | 11.0 | | — | | — | | — | | — | | — | | 11.0 | |
Restructuring and related charges | | 0.3 | | 0.3 | | — | | 0.3 | | — | | (0.1 | ) | (0.3 | ) | — | | 0.5 | |
Systems /organization establishment expenses | | 0.2 | | — | | 0.2 | | 0.1 | | — | | — | | — | | 1.8 | | 2.3 | |
Cancelled acquisition and disposal costs | | — | | — | | 0.2 | | — | | — | | — | | — | | 0.2 | | 0.4 | |
Cost incurred related to debt modifications | | — | | — | | — | | — | | — | | — | | — | | 1.0 | | 1.0 | |
Inventory write-up reversal | | 0.5 | | — | | — | | 12.7 | | 2.3 | | 6.4 | | 4.5 | | — | | 26.4 | |
Write-off of deferred debt issuance costs | | 0.4 | | 0.2 | | 0.1 | | — | | — | | — | | — | | 22.6 | | 23.3 | |
Foreign exchange loss (gain) | | 1.1 | | — | | 2.4 | | (0.9 | ) | — | | — | | 0.9 | | 86.7 | | 90.2 | |
Other | | (0.3 | ) | 0.3 | | (0.1 | ) | (6.1 | ) | 0.6 | | 2.9 | | (0.8 | ) | 0.7 | | (2.8 | ) |
| | | | | | | | | | | | | | | | | | | |
Total Adjusted EBITDA | | $ | 34.8 | | $ | 6.5 | | $ | 7.3 | | $ | 37.0 | | $ | 23.3 | | $ | 21.3 | | $ | 19.1 | | $ | (12.1 | ) | $ | 137.2 | |
PRO-FORMA
| | | | | | | | | | Titanium | | | | | | | | | |
| | Performance | | Specialty | | | | Specialty | | Dioxide | | Advanced | | Groupe | | | | | |
($ in millions) | | Additives | | Compounds | | Electronics | | Chemicals | | Pigments | | Ceramics | | Novasep | | Corporate | | Consolidated | |
Year ended December 31, 2004 | | | | | | | | | | | | | | | | | | | |
| | | | | | | | | | | | | | | | | | | |
Income (loss) before taxes and minority interest | | $ | 88.6 | | $ | 20.8 | | $ | (11.3 | ) | $ | 34.0 | | $ | 21.1 | | $ | 3.3 | | $ | 18.4 | | $ | (297.9 | ) | $ | (123.0 | ) |
Interest expense, net | | 30.0 | | (0.5 | ) | 6.6 | | 43.9 | | 28.3 | | 30.0 | | 9.9 | | 96.1 | | 244.3 | |
Depreciation and amortization | | 34.2 | | 7.7 | | 20.8 | | 38.1 | | 28.4 | | 25.5 | | 24.1 | | 1.0 | | 179.8 | |
Impairment charges | | — | | — | | 11.0 | | — | | — | | — | | — | | — | | 11.0 | |
Restructuring and related charges | | 0.5 | | 0.3 | | — | | 0.3 | | — | | — | | — | | — | | 1.1 | |
Systems /organization establishment expenses | | 0.2 | | — | | 0.2 | | 0.1 | | — | | — | | — | | 4.3 | | 4.8 | |
Cancelled acquisition and disposal costs | | — | | — | | 0.2 | | — | | — | | — | | — | | 0.3 | | 0.5 | |
Stamp duty tax | | — | | — | | — | | — | | — | | — | | — | | 4.0 | | 4.0 | |
Cost incurred related to debt modifications | | — | | — | | — | | — | | — | | — | | — | | 2.0 | | 2.0 | |
Inventory write-up reversal | | 1.0 | | — | | — | | 25.4 | | 6.6 | | 20.8 | | 7.3 | | — | | 61.1 | |
Write-off of deferred debt issuance costs | | 0.4 | | 0.2 | | 0.1 | | — | | — | | — | | — | | 24.4 | | 25.1 | |
Loss from disposed businesses | | — | | — | | — | | — | | — | | — | | 0.8 | | — | | 0.8 | |
Foreign exchange loss (gain) | | 0.3 | | — | | 1.4 | | (0.9 | ) | — | | — | | 0.9 | | 124.0 | | 125.7 | |
Other | | (0.3 | ) | 0.3 | | (0.1 | ) | 0.5 | | 0.2 | | 0.7 | | (0.3 | ) | 1.7 | | 2.7 | |
| | | | | | | | | | | | | | | | | | | |
Total Adjusted EBITDA | | $ | 154.9 | | $ | 28.8 | | $ | 28.9 | | $ | 141.4 | | $ | 84.6 | | $ | 80.3 | | $ | 61.1 | | $ | (40.1 | ) | $ | 539.9 | |
(a) Pro-forma as if the Dynamit Nobel, Omega and Groupe Novasep acquisitions had been completed at the beginning of each period presented.
46
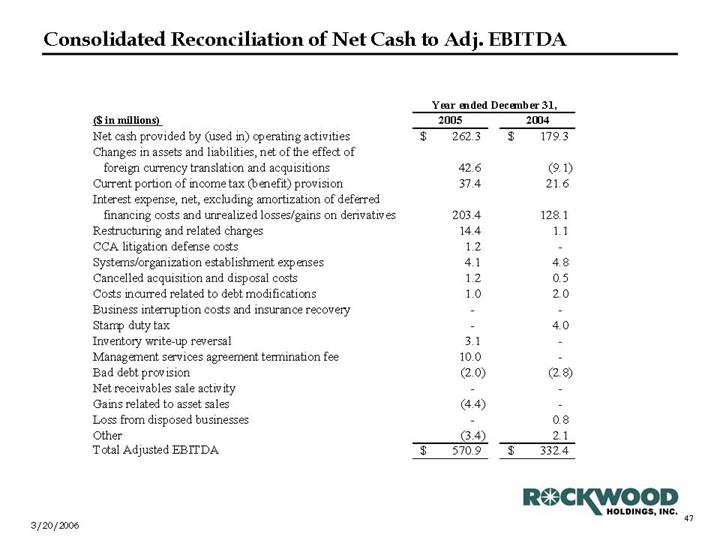
Consolidated Reconciliation of Net Cash to Adj. EBITDA
| | Year ended December 31, | |
($ in millions) | | 2005 | | 2004 | |
Net cash provided by (used in) operating activities | | $ | 262.3 | | $ | 179.3 | |
Changes in assets and liabilities, net of the effect of foreign currency translation and acquisitions | | 42.6 | | (9.1 | ) |
Current portion of income tax (benefit) provision | | 37.4 | | 21.6 | |
Interest expense, net, excluding amortization of deferred financing costs and unrealized losses/gains on derivatives | | 203.4 | | 128.1 | |
Restructuring and related charges | | 14.4 | | 1.1 | |
CCA litigation defense costs | | 1.2 | | — | |
Systems/organization establishment expenses | | 4.1 | | 4.8 | |
Cancelled acquisition and disposal costs | | 1.2 | | 0.5 | |
Costs incurred related to debt modifications | | 1.0 | | 2.0 | |
Business interruption costs and insurance recovery | | — | | — | |
Stamp duty tax | | — | | 4.0 | |
Inventory write-up reversal | | 3.1 | | — | |
Management services agreement termination fee | | 10.0 | | — | |
Bad debt provision | | (2.0 | ) | (2.8 | ) |
Net receivables sale activity | | — | | — | |
Gains related to asset sales | | (4.4 | ) | — | |
Loss from disposed businesses | | — | | 0.8 | |
Other | | (3.4 | ) | 2.1 | |
Total Adjusted EBITDA | | $ | 570.9 | | $ | 332.4 | |
47
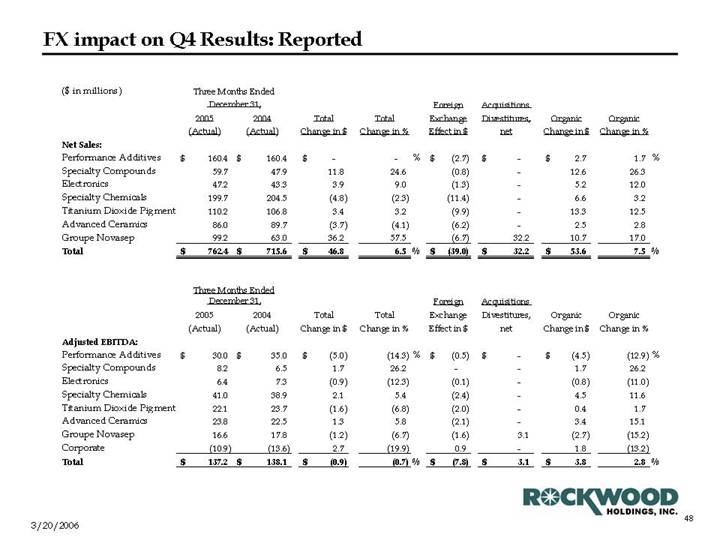
FX impact on Q4 Results: Reported
| | Three Months Ended | | | | | | | | | | | | | |
| | December 31, | | | | | | Foreign | | Acquisitions | | | | | |
| | 2005 | | 2004 | | Total | | Total | | Exchange | | Divestitures, | | Organic | | Organic | |
($ in millions) | | (Actual) | | (Actual) | | Change in $ | | Change in % | | Effect in $ | | net | | Change in $ | | Change in % | |
Net Sales: | | | | | | | | | | | | | | | | | |
Performance Additives | | $ | 160.4 | | $ | 160.4 | | $ | — | | — | % | $ | (2.7 | ) | $ | — | | $ | 2.7 | | 1.7 | % |
Specialty Compounds | | 59.7 | | 47.9 | | 11.8 | | 24.6 | | (0.8 | ) | — | | 12.6 | | 26.3 | |
Electronics | | 47.2 | | 43.3 | | 3.9 | | 9.0 | | (1.3 | ) | — | | 5.2 | | 12.0 | |
Specialty Chemicals | | 199.7 | | 204.5 | | (4.8 | ) | (2.3 | ) | (11.4 | ) | — | | 6.6 | | 3.2 | |
Titanium Dioxide Pigment | | 110.2 | | 106.8 | | 3.4 | | 3.2 | | (9.9 | ) | — | | 13.3 | | 12.5 | |
Advanced Ceramics | | 86.0 | | 89.7 | | (3.7 | ) | (4.1 | ) | (6.2 | ) | — | | 2.5 | | 2.8 | |
Groupe Novasep | | 99.2 | | 63.0 | | 36.2 | | 57.5 | | (6.7 | ) | 32.2 | | 10.7 | | 17.0 | |
Total | | $ | 762.4 | | $ | 715.6 | | $ | 46.8 | | 6.5 | % | $ | (39.0 | ) | $ | 32.2 | | $ | 53.6 | | 7.5 | % |
| | Three Months Ended | | | | | | | | | | | | | |
| | December 31, | | | | | | Foreign | | Acquisitions | | | | | |
| | 2005 | | 2004 | | Total | | Total | | Exchange | | Divestitures, | | Organic | | Organic | |
| | (Actual) | | (Actual) | | Change in $ | | Change in% | | Effect in $ | | net | | Change in $ | | Change in% | |
Adjusted EBITDA: | | | | | | | | | | | | | | | | | |
Performance Additives | | $ | 30.0 | | $ | 35.0 | | $ | (5.0 | ) | (14.3 | )% | $ | (0.5 | ) | $ | — | | $ | (4.5 | ) | (12.9 | )% |
Specialty Compounds | | 8.2 | | 6.5 | | 1.7 | | 26.2 | | — | | — | | 1.7 | | 26.2 | |
Electronics | | 6.4 | | 7.3 | | (0.9 | ) | (12.3 | ) | (0.1 | ) | — | | (0.8 | ) | (11.0 | ) |
Specialty Chemicals | | 41.0 | | 38.9 | | 2.1 | | 5.4 | | (2.4 | ) | — | | 4.5 | | 11.6 | |
Titanium Dioxide Pigment | | 22.1 | | 23.7 | | (1.6 | ) | (6.8 | ) | (2.0 | ) | — | | 0.4 | | 1.7 | |
Advanced Ceramics | | 23.8 | | 22.5 | | 1.3 | | 5.8 | | (2.1 | ) | — | | 3.4 | | 15.1 | |
Groupe Novasep | | 16.6 | | 17.8 | | (1.2 | ) | (6.7 | ) | (1.6 | ) | 3.1 | | (2.7 | ) | (15.2 | ) |
Corporate | | (10.9 | ) | (13.6 | ) | 2.7 | | (19.9 | ) | 0.9 | | — | | 1.8 | | (13.2 | ) |
Total | | $ | 137.2 | | $ | 138.1 | | $ | (0.9 | ) | (0.7 | )% | $ | (7.8 | ) | $ | 3.1 | | $ | 3.8 | | 2.8 | % |
48
FX impact on FY Results: Reported
| | Year Ended December 31, | | | | | | Foreign | | Acquisitions | | | | | |
| | 2005 | | 2004 | | Total | | Total | | Exchange | | Divestitures, | | Organic | | Organic | |
($ in millions) | | (Actual) | | (Actual) | | Change in $ | | Change in % | | Effect in $ | | net | | Change in $ | | Change in % | |
Net Sales: | | | | | | | | | | | | | | | | | |
Performance Additives | | $ | 680.7 | | $ | 630.9 | | $ | 49.8 | | 7.9 | % | $ | 0.3 | | $ | 42.4 | | $ | 7.1 | | 1.1 | % |
Specialty Compounds | | 237.5 | | 200.4 | | 37.1 | | 18.5 | | 0.7 | | — | | 36.4 | | 18.2 | |
Electronics | | 181.8 | | 168.1 | | 13.7 | | 8.1 | | 1.7 | | — | | 12.0 | | 7.1 | |
Specialty Chemicals | | 842.0 | | 321.1 | | 520.9 | | 162.2 | | (9.6 | ) | 505.7 | | 24.8 | | 7.7 | |
Titanium Dioxide Pigments | | 430.5 | | 175.7 | | 254.8 | | 145.0 | | (9.6 | ) | 249.0 | | 15.4 | | 8.8 | |
Advanced Ceramics | | 369.6 | | 146.3 | | 223.3 | | 152.6 | | (6.0 | ) | 219.2 | | 10.1 | | 6.9 | |
Groupe Novasep | | 379.1 | | 101.0 | | 278.1 | | 275.3 | | (6.6 | ) | 276.9 | | 7.8 | | 7.7 | |
Total | | $ | 3,121.2 | | $ | 1,743.5 | | $ | 1,377.7 | | 79.0 | % | $ | (29.1 | ) | $ | 1,293.2 | | $ | 113.6 | | 6.5 | % |
| | Year Ended December 31, | | | | | | Foreign | | Acquisitions | | | | | |
| | 2005 | | 2004 | | Total | | Total | | Exchange | | Divestitures, | | Organic | | Organic | |
| | (Actual) | | (Actual) | | Change in $ | | Change in % | | Effect in $ | | net | | Change in $ | | Change in % | |
Adjusted EBITDA: | | | | | | | | | | | | | | | | | |
Performance Additives | | $ | 148.3 | | $ | 149.2 | | $ | (0.9 | ) | (0.6 | )% | $ | 1.0 | | $ | 5.8 | | $ | (7.7 | ) | (5.2 | )% |
Specialty Compounds | | 29.5 | | 28.8 | | 0.7 | | 2.4 | | 0.2 | | — | | 0.5 | | 1.7 | |
Electronics | | 26.9 | | 28.9 | | (2.0 | ) | (6.9 | ) | — | | — | | (2.0 | ) | (6.9 | ) |
Specialty Chemicals | | 174.2 | | 60.0 | | 114.2 | | 190.3 | | (2.1 | ) | 105.2 | | 11.1 | | 18.5 | |
Titanium Dioxide Pigments | | 86.6 | | 37.8 | | 48.8 | | 129.1 | | (1.9 | ) | 50.3 | | 0.4 | | 1.1 | |
Advanced Ceramics | | 93.8 | | 35.8 | | 58.0 | | 162.0 | | (2.1 | ) | 53.3 | | 6.8 | | 19.0 | |
Groupe Novasep | | 51.9 | | 23.0 | | 28.9 | | 125.7 | | (1.7 | ) | 36.5 | | (5.9 | ) | (25.7 | ) |
Corporate | | (40.3 | ) | (31.1 | ) | (9.2 | ) | 29.6 | | (0.1 | ) | — | | (9.1 | ) | 29.3 | |
Total | | $ | 570.9 | | $ | 332.4 | | $ | 238.5 | | 71.8 | % | $ | (6.7 | ) | $ | 251.1 | | $ | (5.9 | ) | (1.8 | )% |
| | | | | | | | | | | | | | | | | | | | | | | | |
49
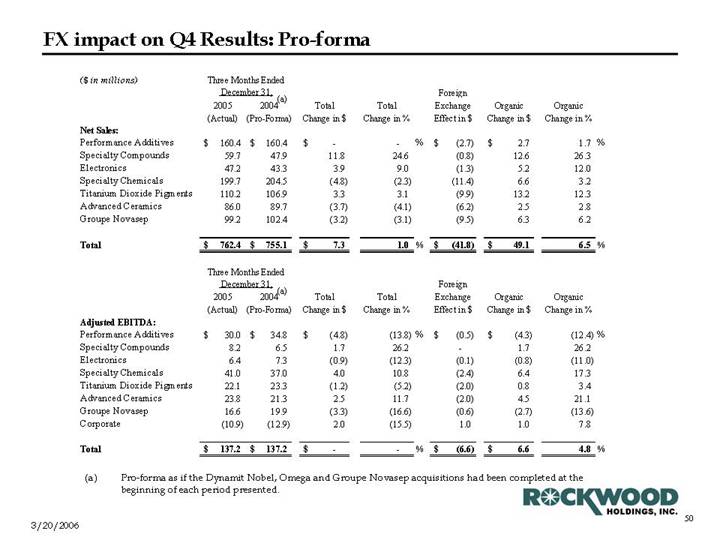
FX impact on Q4 Results: Pro-forma
| | Three Months Ended | | | | | | | | | | | |
| | December 31, | | | | | | Foreign | | | | | |
| | 2005 | | 2004(a) | | Total | | Total | | Exchange | | Organic | | Organic | |
($ in millions) | | (Actual) | | (Pro-Forma) | | Change in $ | | Change in % | | Effect in $ | | Change in $ | | Change in % | |
Net Sales: | | | | | | | | | | | | | | | |
Performance Additives | | $ | 160.4 | | $ | 160.4 | | $ | — | | — | % | $ | (2.7 | ) | $ | 2.7 | | 1.7 | % |
Specialty Compounds | | 59.7 | | 47.9 | | 11.8 | | 24.6 | | (0.8 | ) | 12.6 | | 26.3 | |
Electronics | | 47.2 | | 43.3 | | 3.9 | | 9.0 | | (1.3 | ) | 5.2 | | 12.0 | |
Specialty Chemicals | | 199.7 | | 204.5 | | (4.8 | ) | (2.3 | ) | (11.4 | ) | 6.6 | | 3.2 | |
Titanium Dioxide Pigments | | 110.2 | | 106.9 | | 3.3 | | 3.1 | | (9.9 | ) | 13.2 | | 12.3 | |
Advanced Ceramics | | 86.0 | | 89.7 | | (3.7 | ) | (4.1 | ) | (6.2 | ) | 2.5 | | 2.8 | |
Groupe Novasep | | 99.2 | | 102.4 | | (3.2 | ) | (3.1 | ) | (9.5 | ) | 6.3 | | 6.2 | |
| | | | | | | | | | | | | | | |
Total | | $ | 762.4 | | $ | 755.1 | | $ | 7.3 | | 1.0 | % | $ | (41.8 | ) | $ | 49.1 | | 6.5 | % |
| | Three Months Ended | | | | | | | | | | | |
| | December 31, | | | | | | Foreign | | | | | |
| | 2005 | | 2004(a) | | Total | | Total | | Exchange | | Organic | | Organic | |
| | (Actual) | | (Pro-Forma) | | Change in $ | | Change in % | | Effect in $ | | Change in $ | | Change in % | |
Adjusted EBITDA: | | | | | | | | | | | | | | | |
Performance Additives | | $ | 30.0 | | $ | 34.8 | | $ | (4.8 | ) | (13.8 | )% | $ | (0.5 | ) | $ | (4.3 | ) | (12.4 | )% |
Specialty Compounds | | 8.2 | | 6.5 | | 1.7 | | 26.2 | | — | | 1.7 | | 26.2 | |
Electronics | | 6.4 | | 7.3 | | (0.9 | ) | (12.3 | ) | (0.1 | ) | (0.8 | ) | (11.0 | ) |
Specialty Chemicals | | 41.0 | | 37.0 | | 4.0 | | 10.8 | | (2.4 | ) | 6.4 | | 17.3 | |
Titanium Dioxide Pigments | | 22.1 | | 23.3 | | (1.2 | ) | (5.2 | ) | (2.0 | ) | 0.8 | | 3.4 | |
Advanced Ceramics | | 23.8 | | 21.3 | | 2.5 | | 11.7 | | (2.0 | ) | 4.5 | | 21.1 | |
Groupe Novasep | | 16.6 | | 19.9 | | (3.3 | ) | (16.6 | ) | (0.6 | ) | (2.7 | ) | (13.6 | ) |
Corporate | | (10.9 | ) | (12.9 | ) | 2.0 | | (15.5 | ) | 1.0 | | 1.0 | | 7.8 | |
| | | | | | | | | | | | | | | |
Total | | $ | 137.2 | | $ | 137.2 | | $ | — | | — | % | $ | (6.6 | ) | $ | 6.6 | | 4.8 | % |
(a) Pro-forma as if the Dynamit Nobel, Omega and Groupe Novasep acquisitions had been completed at the beginning of each period presented.
50
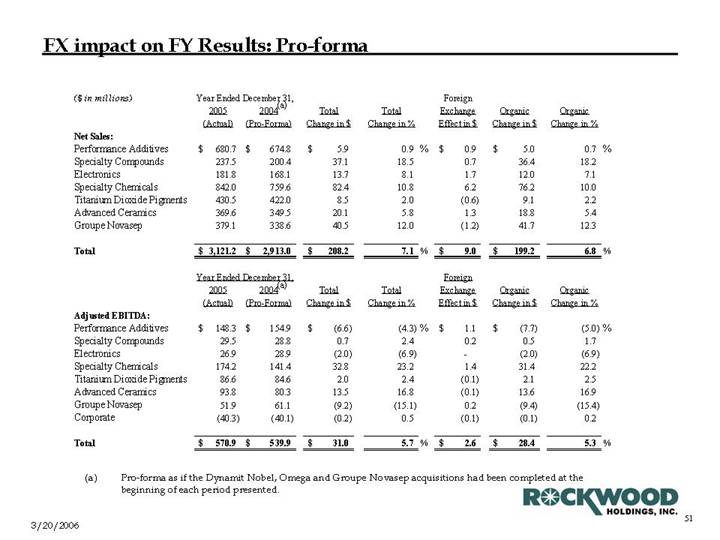
FX impact on FY Results: Pro-forma
| | Year Ended December 31, | | | | | | Foreign | | | | | |
| | 2005 | | 2004(a) | | Total | | Total | | Exchange | | Organic | | Organic | |
($ in millions) | | (Actual) | | (Pro-Forma) | | Change in $ | | Change in % | | Effect in $ | | Change in $ | | Change in % | |
Net Sales: | | | | | | | | | | | | | | | |
Performance Additives | | $ | 680.7 | | $ | 674.8 | | $ | 5.9 | | 0.9 | % | $ | 0.9 | | $ | 5.0 | | 0.7 | % |
Specialty Compounds | | 237.5 | | 200.4 | | 37.1 | | 18.5 | | 0.7 | | 36.4 | | 18.2 | |
Electronics | | 181.8 | | 168.1 | | 13.7 | | 8.1 | | 1.7 | | 12.0 | | 7.1 | |
Specialty Chemicals | | 842.0 | | 759.6 | | 82.4 | | 10.8 | | 6.2 | | 76.2 | | 10.0 | |
Titanium Dioxide Pigments | | 430.5 | | 422.0 | | 8.5 | | 2.0 | | (0.6 | ) | 9.1 | | 2.2 | |
Advanced Ceramics | | 369.6 | | 349.5 | | 20.1 | | 5.8 | | 1.3 | | 18.8 | | 5.4 | |
Groupe Novasep | | 379.1 | | 338.6 | | 40.5 | | 12.0 | | (1.2 | ) | 41.7 | | 12.3 | |
| | | | | | | | | | | | | | | |
Total | | $ | 3,121.2 | | $ | 2,913.0 | | $ | 208.2 | | 7.1 | % | $ | 9.0 | | $ | 199.2 | | 6.8 | % |
| | Year Ended December 31, | | | | | | Foreign | | | | | |
| | 2005 | | 2004(a) | | Total | | Total | | Exchange | | Organic | | Organic | |
| | (Actual) | | (Pro-Forma) | | Change in $ | | Change in % | | Effect in $ | | Change in $ | | Change in % | |
Adjusted EBITDA: | | | | | | | | | | | | | | | |
Performance Additives | | $ | 148.3 | | $ | 154.9 | | $ | (6.6 | ) | (4.3 | )% | $ | 1.1 | | $ | (7.7 | ) | (5.0 | )% |
Specialty Compounds | | 29.5 | | 28.8 | | 0.7 | | 2.4 | | 0.2 | | 0.5 | | 1.7 | |
Electronics | | 26.9 | | 28.9 | | (2.0 | ) | (6.9 | ) | — | | (2.0 | ) | (6.9 | ) |
Specialty Chemicals | | 174.2 | | 141.4 | | 32.8 | | 23.2 | | 1.4 | | 31.4 | | 22.2 | |
Titanium Dioxide Pigments | | 86.6 | | 84.6 | | 2.0 | | 2.4 | | (0.1 | ) | 2.1 | | 2.5 | |
Advanced Ceramics | | 93.8 | | 80.3 | | 13.5 | | 16.8 | | (0.1 | ) | 13.6 | | 16.9 | |
Groupe Novasep | | 51.9 | | 61.1 | | (9.2 | ) | (15.1 | ) | 0.2 | | (9.4 | ) | (15.4 | ) |
Corporate | | (40.3 | ) | (40.1 | ) | (0.2 | ) | 0.5 | | (0.1 | ) | (0.1 | ) | 0.2 | |
| | | | | | | | | | | | | | | |
Total | | $ | 570.9 | | $ | 539.9 | | $ | 31.0 | | 5.7 | % | $ | 2.6 | | $ | 28.4 | | 5.3 | % |
(a) Pro-forma as if the Dynamit Nobel, Omega and Groupe Novasep acquisitions had been completed at the beginning of each period presented.
51