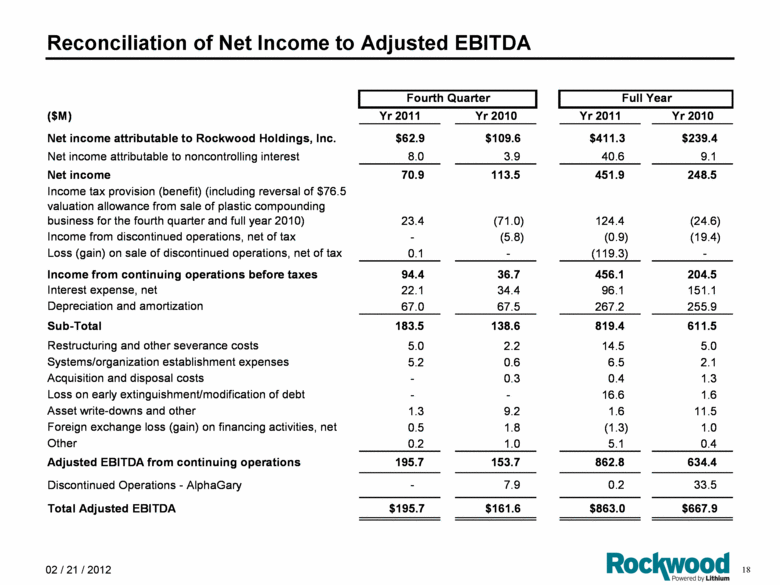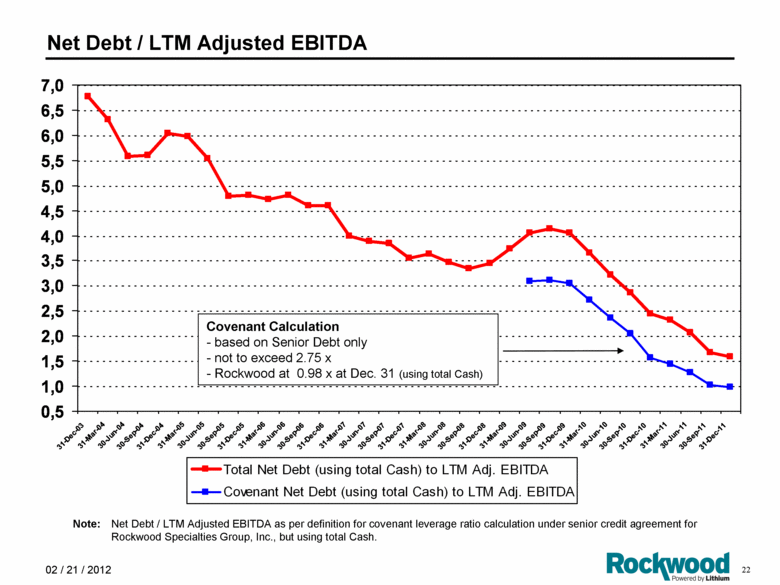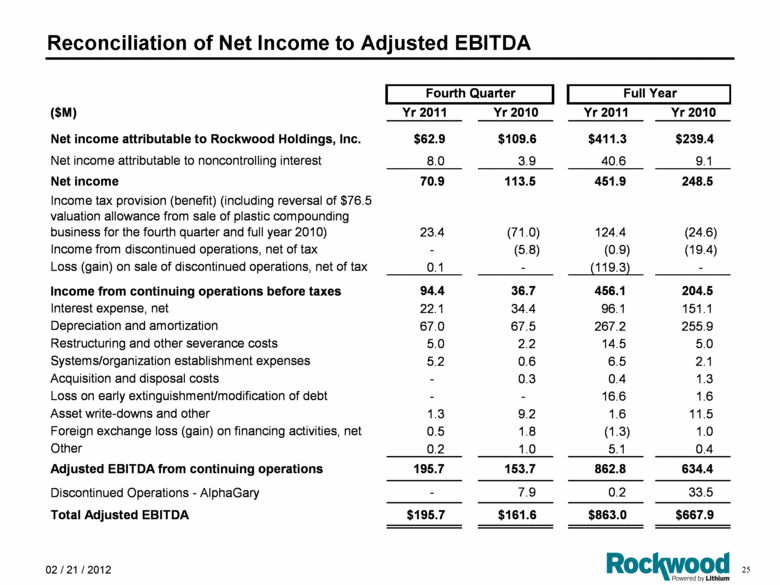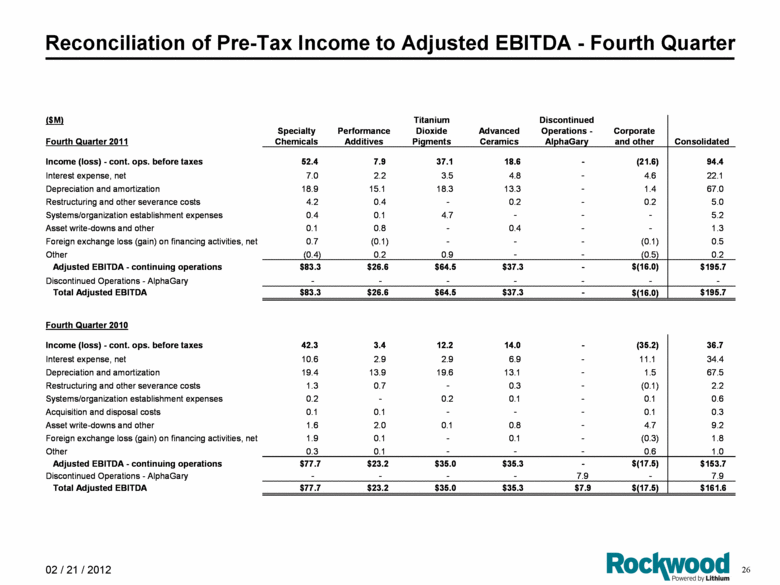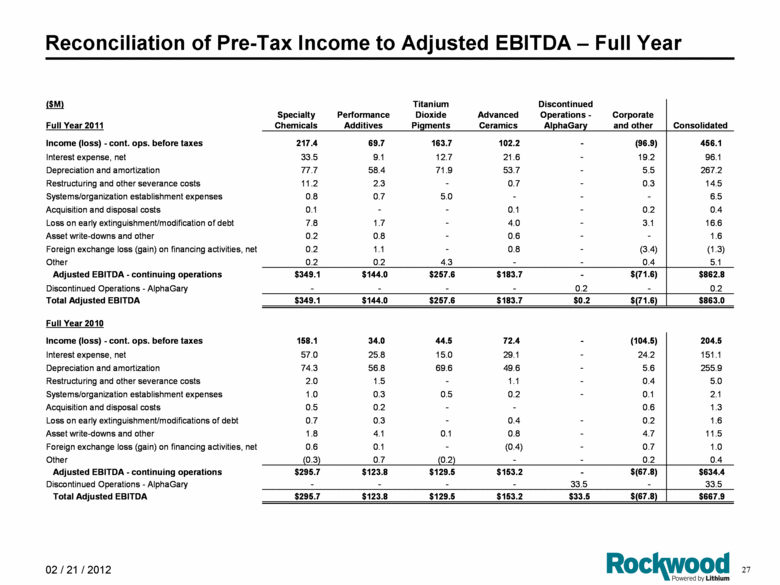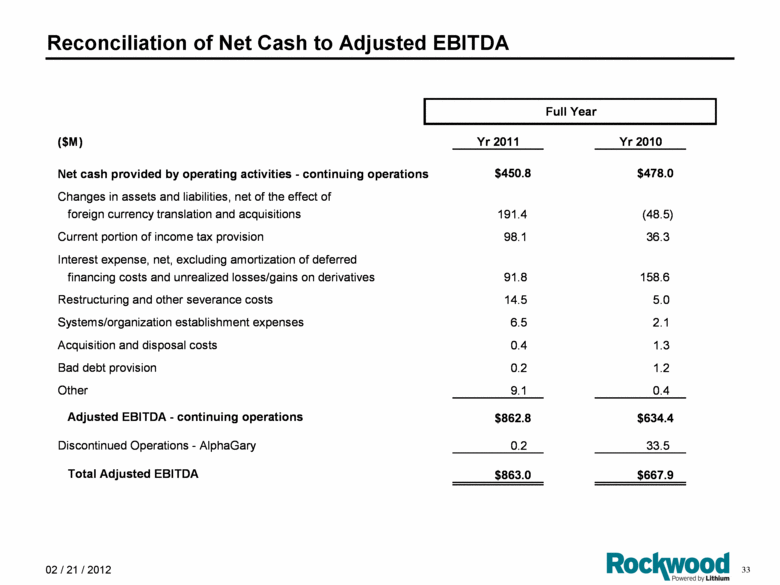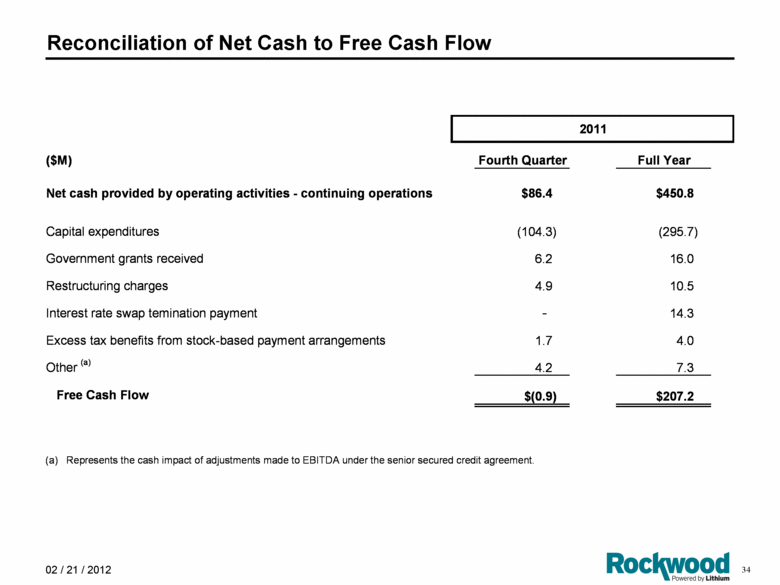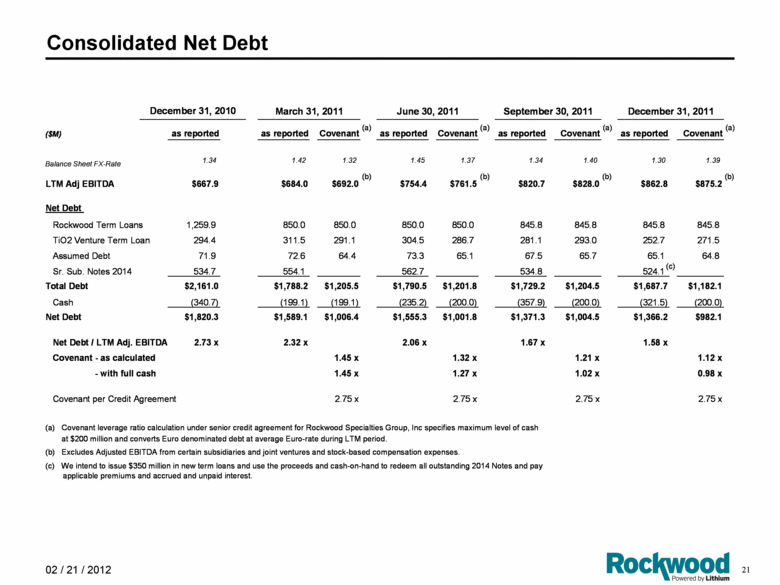
| Consolidated Net Debt March 31, 2011 June 30, 2011 September 30, 2011 December 31, 2011 ($M) as reported as reported Covenant as reported Covenant as reported Covenant as reported Covenant Balance Sheet FX-Rate 1.34 1.42 1.32 1.45 1.37 1.34 1.40 1.30 1.39 LTM Adj EBITDA $667.9 $684.0 $692.0 $754.4 $761.5 $820.7 $828.0 $862.8 $875.2 Net Debt Rockwood Term Loans 1,259.9 850.0 850.0 850.0 850.0 845.8 845.8 845.8 845.8 TiO2 Venture Term Loan 294.4 311.5 291.1 304.5 286.7 281.1 293.0 252.7 271.5 Assumed Debt 71.9 72.6 64.4 73.3 65.1 67.5 65.7 65.1 64.8 Sr. Sub. Notes 2014 534.7 554.1 562.7 534.8 524.1 Total Debt $2,161.0 $1,788.2 $1,205.5 $1,790.5 $1,201.8 $1,729.2 $1,204.5 $1,687.7 $1,182.1 Cash (340.7) (199.1) (199.1) (235.2) (200.0) (357.9) (200.0) (321.5) (200.0) Net Debt $1,820.3 $1,589.1 $1,006.4 $1,555.3 $1,001.8 $1,371.3 $1,004.5 $1,366.2 $982.1 Net Debt / LTM Adj. EBITDA 2.73 x 2.32 x 2.06 x 1.67 x 1.58 x Covenant - as calculated 1.45 x 1.32 x 1.21 x 1.12 x - with full cash 1.45 x 1.27 x 1.02 x 0.98 x Covenant per Credit Agreement 2.75 x 2.75 x 2.75 x 2.75 x December 31, 2010 (b) Excludes Adjusted EBITDA from certain subsidiaries and joint ventures and stock-based compensation expenses. (a) Covenant leverage ratio calculation under senior credit agreement for Rockwood Specialties Group, Inc specifies maximum level of cash at $200 million and converts Euro denominated debt at average Euro-rate during LTM period. (c) We intend to issue $350 million in new term loans and use the proceeds and cash-on-hand to redeem all outstanding 2014 Notes and pay applicable premiums and accrued and unpaid interest. (b) (a) (b) (a) (b) (a) (b) (a) (c) |
