Lisa J. Cohen
Davis Selected Advisers, L.P.
ITEM 1. REPORT TO STOCKHOLDERS
Cautionary Statement
Davis Advisors is committed to communicating with our investment partners as candidly as possible because we believe our investors benefit from understanding our investment philosophy and approach. Our views and opinions regarding the investment prospects of our portfolio holdings include “forward looking statements” which may or may not be accurate over the long term. While we believe we have a reasonable basis for our appraisals and we have confidence in our opinions, actual results may differ materially from those we anticipate. These opinions are current as of the date of this report but are subject to change. The information provided in this report should not be considered a recommendation to buy, sell, or hold any particular security.
You can identify forward looking statements by words like “believe,” “expect,” “anticipate,” or similar expressions when discussing prospects for particular portfolio holdings and/or of the Fund. We cannot assure future results and achievements. You should not place undue reliance on forward looking statements, which speak only as of the date of this report. We disclaim any obligation to update or alter any forward looking statements, whether as a result of new information, future events, or otherwise. This material must be preceded or accompanied by a prospectus. Please read the prospectus carefully for a discussion of investment objectives, risks, fees, and expenses. Current performance may be lower or higher than the performance quoted herein. You may obtain a current copy of the Fund’s Prospectus or more current performance information by calling Investor Services at 1-800-432-2504 or on Clipper Fund’s website (www.clipperfund.com).
CLIPPER FUNDSM | Table of Contents |
| 2 |
| | |
| 13 |
| | |
| 15 |
| | |
| 16 |
| | |
| 17 |
| | |
| 19 |
| | |
| 20 |
| | |
| 21 |
| | |
| 22 |
| | |
| 28 |
| | |
| 29 |
| | |
| 32 |
| | |
| 33 |
| | |
| 34 |
This Semi-Annual Report is authorized for use by existing shareholders. Prospective shareholders must receive a current Clipper Fund (the “Fund”) prospectus, which contains more information about investment strategies, risks, fees, and expenses. Please read the prospectus carefully before investing or sending money.
Shares of the Fund are not deposits or obligations of any bank, are not guaranteed by any bank, are not insured by the FDIC or any other agency, and involve investment risks, including possible loss of the principal amount invested.
Portfolio Proxy Voting Policies and Procedures
The Fund has adopted Portfolio Proxy Voting Policies and Procedures under which the Fund votes proxies relating to securities held by the Fund. A description of the Fund’s Portfolio Proxy Voting Policies and Procedures is available (i) without charge, upon request, by calling the Fund toll-free at 1-800-432-2504, (ii) on the Fund’s website at www.clipperfund.com, and (iii) on the SEC’s website at www.sec.gov.
In addition, the Fund is required to file Form N-PX, with its complete proxy voting record for the 12 months ended June 30th, no later than August 31st of each year. The Fund’s Form N-PX filing is available (i) without charge, upon request, by calling the Fund toll-free at 1-800-432-2504, (ii) on the Fund’s website at www.clipperfund.com, and (iii) on the SEC’s website at www.sec.gov.
Quarterly Schedule of Investments
The Fund files its complete schedule of investments with the SEC on Form N-CSR (as of the end of the second and fourth quarters) and on Form N-PORT Part F (as of the end of the first and third quarters). The Fund’s Forms N-CSR (Annual and Semi-Annual Reports) and N-PORT Part F are available without charge, upon request, by calling 1-800-432-2504, on the Fund’s website at www.clipperfund.com, and on the SEC’s website at www.sec.gov. A list of the Fund’s quarter-end holdings is also available at www.clipperfund.com on or about the 15th day following each quarter end and remains available on the website until the list is updated for the subsequent quarter.
Executive Summary
| ◾ | Looking over the last 10 years beginning June 30, 2012, Clipper Fund built shareholder wealth at 10.10% per year, turning a $10,000 investment into more than $26,000. |
| ◾ | Clipper Fund is well positioned to navigate the current period of uncertainty, which includes a bear market, recessionary fears and higher inflation. |
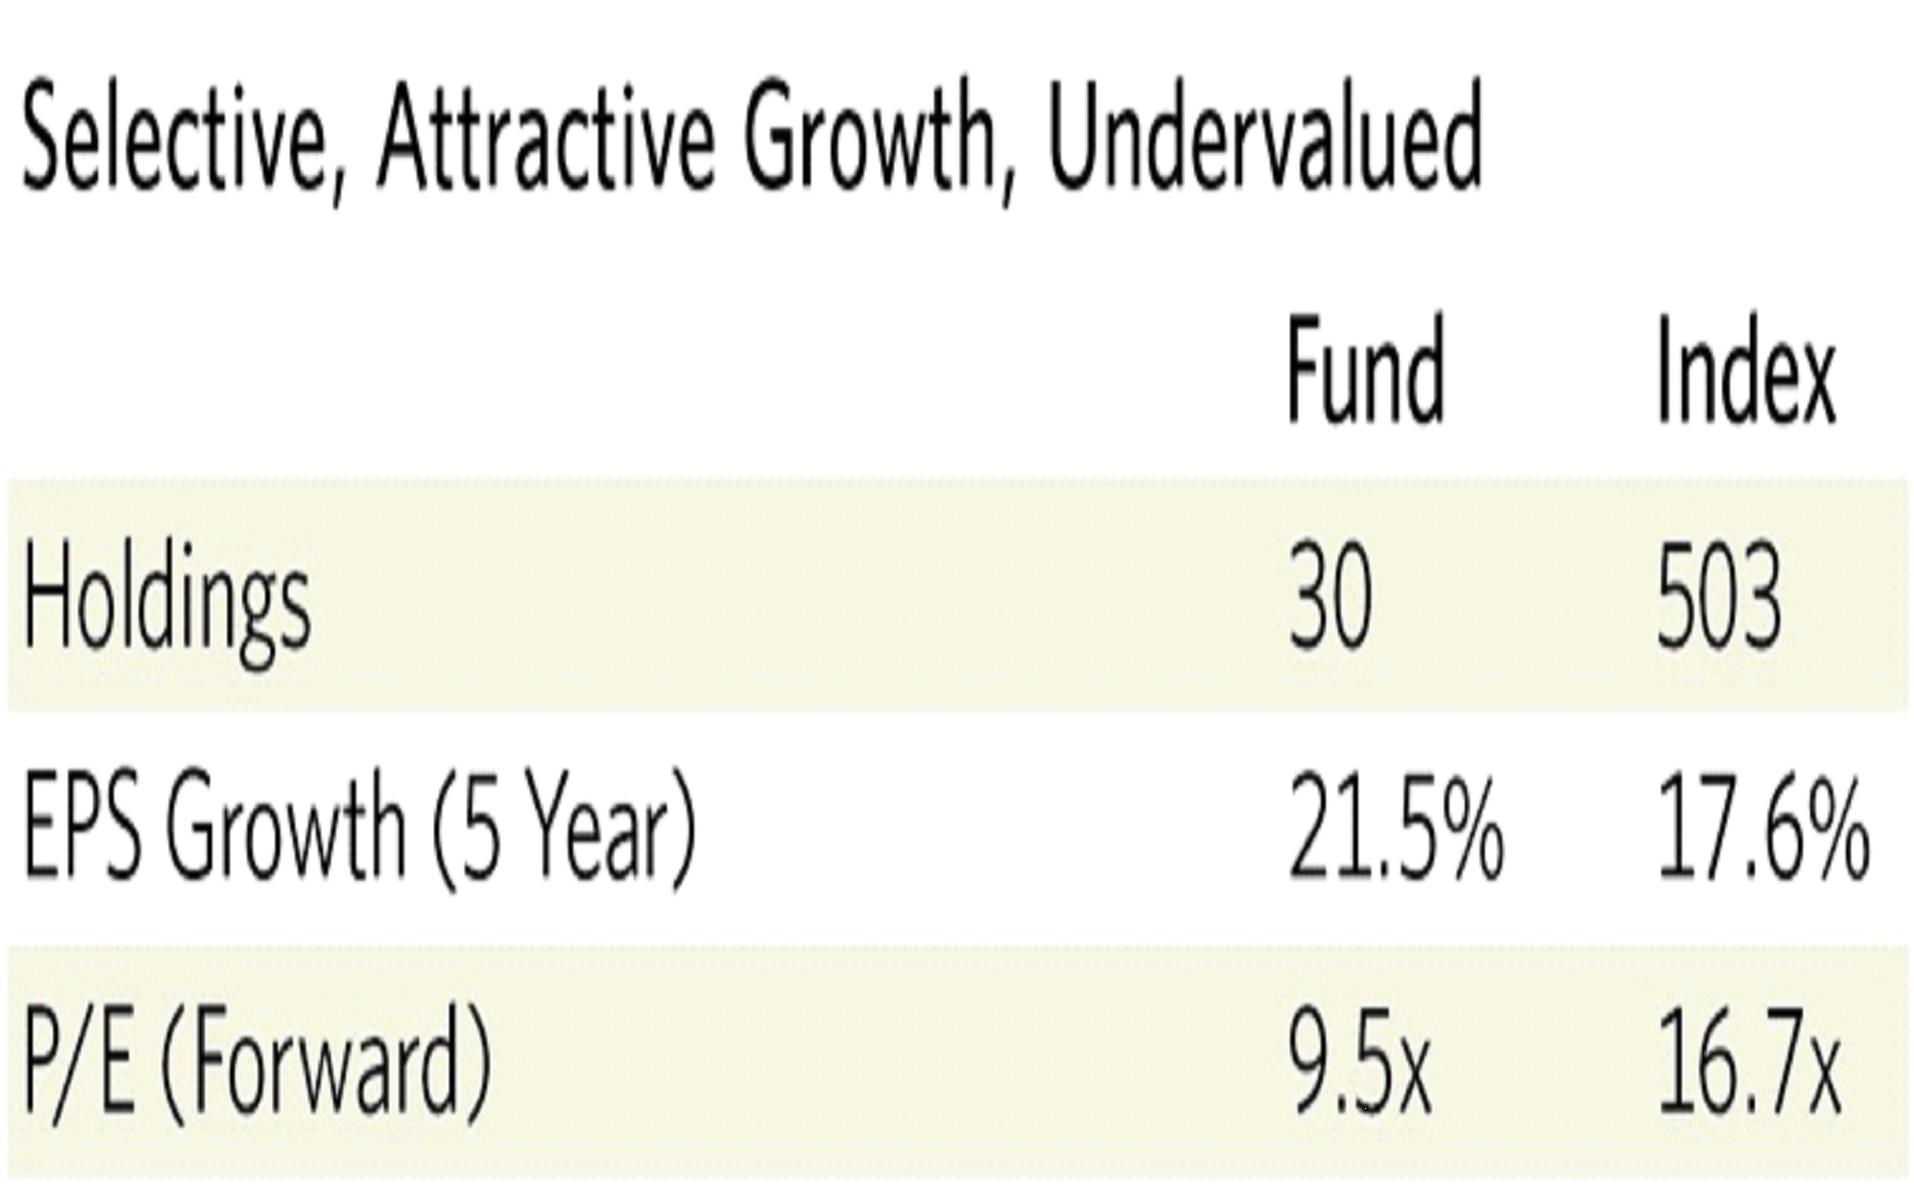
| ◾ | Our carefully selected companies have grown earnings per share at almost 22% per year over the last five years, a remarkable 4% per year faster than the S&P 500 Index. Yet they are currently valued at less than 10x earnings, a 43% discount to the S&P 500 Index. Higher growth at lower valuations is a rare combination and one that positions us well for the years and decades ahead. |
| ◾ | The majority of our portfolio is invested in companies with strong, liquid balance sheets and little or no short-term funding needs. |
| ◾ | We see significant opportunity in growth companies trading at value prices and value companies with durable growth prospects. |
| ◾ | We believe the banking sector represents a significant opportunity given high capital levels, proven resilience, high dividends and record low relative valuations. |
| ◾ | Because of their power, stability and scope, we remain confident in the great tech platforms, particularly Alphabet, Meta and Alibaba, as well as Amazon. |
| ◾ | With more than $2 billion of our own money invested alongside clients, our interests are aligned, and our conviction is more than just words.1 |
The average annual total returns for Clipper Fund for periods ending June 30, 2022 are: 1 year, −21.72%; 5 years, 5.19%; and 10 years, 10.10%. The performance presented represents past performance and is not a guarantee of future results. The performance presented represents past performance and is not a guarantee of future results. Total return assumes reinvestment of dividends and capital gain distributions. Investment return and principal value will vary so that, when redeemed, an investor’s shares may be worth more or less than their original cost. For most recent month-end performance, visit clipperfund.com or call 800-432-2504. Current performance may be lower or higher than the performance quoted. The total annual operating expense ratio as of the most recent prospectus was 0.71%. The total annual operating expense ratio may vary in future years.
This report includes candid statements and observations regarding investment strategies, individual securities, and economic and market conditions; however, there is no guarantee that these statements, opinions or forecasts will prove to be correct. All fund performance discussed within this piece are as of 06/30/22 unless otherwise noted. This is not a recommendation to buy, sell or hold any specific security. Past performance is not a guarantee of future results. The Attractive Growth and Undervalued reference in this piece relates to underlying characteristics of the portfolio holdings. There is no guarantee that the Fund performance will be positive as equity markets are volatile and an investor may lose money.
1 As of 06/30/22 Davis Advisors, the Davis family and Foundation, our employees, and Fund trustees have more than $2 billion invested alongside clients in similarly managed accounts and strategies.
Not a part of Semi-Annual Report to Fund shareholders
CLIPPER FUNDSM | Shareholder Letter – (Continued) |

Overview
As we write this review, there is war in Ukraine, a bear market in U.S. stocks, soaring global inflation and implications of a recession.
So why is this a good time for long-term investors?
As anyone who watches the news can see, the struggles that individuals, families and our country face are not to be taken lightly. As citizens, we do not wish for times of fear and suffering. As investors, however, we know that remaining unemotional through turbulent times is a requirement for success.
To understand why, we recognize two simple truths. First, fear lowers prices. Second, lower prices increase future returns. The first is learned from experience and the second from arithmetic. Imagine you had a neighbor who owned a local car wash business that reliably produces $100,000 per year of income. Buying this business for $1 million would give you a 10% future return. If, instead, your neighbor was panicking and offered you the business for $500,000, your return would double to 20%. The same business purchased at a lower price will mathematically produce a higher return. We do not welcome times of fear; rather, we welcome the lower prices that such times produce, a concept succinctly captured in Shelby Cullom Davis’ famous observations: “You make most of your money in a bear market, you just don’t realize it at the time.”
In the pages that follow, we will look backwards at results. More importantly, we will look ahead at how we believe the actions we are taking in today’s bear market will affirm this wisdom. Specifically, we will provide a longer-term context for current events, share with you how we have prepared the portfolio for market and economic downturns, outline our thoughts concerning systemically higher inflation, and most importantly, describe the investment opportunities created for long-term investors who can remain rational when fearful sellers race for the exits.
Results
Clipper Fund was launched by our predecessor in 1984. Since then, our country has endured periods of growth and contraction, crises and complacency, bubbles and busts. These include the crash of 1987, the S&L crisis, the (first) Russian bond default, the Asian Contagion, the invasion of Kuwait, the dot-com bubble, September 11th, wars in Iraq and Afghanistan, the financial crisis, the Great Recession, the Euro Crisis, COVID, the Russian invasion of Ukraine and more. If, at Clipper Fund’s inception, an investor had been able to predict the litany of crises and calamities that lay ahead, they may well have decided to remain on the sidelines rather than invest at such an uncertain time.
They would have been wrong.
As the graph below shows, $10,000 invested at Clipper Fund’s inception would now be worth more than $520,000, more than 15 times the amount the investor would have received sitting on the sidelines earning the risk-free rate.
2 Source: Davis Advisors and Bloomberg. Chart represents performance from 02/29/84 to 06/30/22. Past performance is not a guarantee of future results.
Not a part of Semi-Annual Report to Fund shareholders
CLIPPER FUNDSM | Shareholder Letter – (Continued) |
Looking at results over different time periods, we can see that for all periods over one year, the longer a shareholder in Clipper Fund has remained invested with us, the more wealth has been built.
Our long-term record of building generational wealth includes periods like today when our investment approach was out of sync and relative results lagged the market. For example, looking over the last 10 years beginning June 30, 2012, Clipper Fund built shareholder wealth at 10.10% per year, turning a $10,000 investment into more than $26,000. Importantly, this result includes the negative returns of the current bear market. If you stopped the clock almost six years into this 10-year stretch on February 1, 2018, we would have generated a cumulative 139%, a result that slightly beat the S&P 500 Index’s return (by 0.48% per year, to be precise).
However, as described in our 2021 annual update, the latter part of this decade was characterized by an enormous dispersion in which speculative growth companies surged into bubble territory, driving the S&P 500 Index up more than 45% from February 2018 to present and leaving value investors like us with a cumulative return of only 9.82% trailing way behind. Putting these periods together has resulted in a decade in which absolute returns have been on track, but relative returns have lagged substantially, almost entirely due to the enormous dispersion of the last four years.
While this relative performance gap has persisted through the start of the current bear market despite the collapse of some of the risky high flyers we predicted in our last report, we believe we have set the stage to meaningfully make up this ground. This conviction is driven by the characteristics of the carefully selected companies that make up Clipper Fund.
In addition to the resiliency, durability and ability to prosper in times of inflation (all of which will be discussed in this letter), these high-quality companies have grown earnings per share at almost 22% per year over the last five years, a remarkable 4% per year faster than the S&P 500 Index. As shown in the table below, however, despite this outstanding record of growth, these high-quality companies are currently valued at less than 10x earnings, a 43% discount to the S&P 500 Index. Higher growth at lower valuations is a rare combination and one that positions us well for the years and decades ahead.
Not a part of Semi-Annual Report to Fund shareholders
CLIPPER FUNDSM | Shareholder Letter – (Continued) |
The Futility of Forecasts
Clipper Fund’s long record of building generational wealth through so many different economic and political environments does not result from our ability to make economic, monetary or political forecasts, but rather our ability to identify durable, growing and undervalued companies, prepare for uncertainty and adapt to changing times, a discipline that can be distilled to three words: Don’t predict. Prepare.
While this may sound obvious, given that none of the crises highlighted in the graph on page 3 were predicted by the experts, one need only turn on the news to see the same experts who failed to predict what has already happened boldly predicting what is going to happen next. As John Kenneth Galbraith famously said, “The function of economic [and, we would add, political and market] forecasting is to make astrology look respectable.” As can be seen in the graph below, for example, the forecasts of Wall Street’s top strategists (shown in blue) are essentially uncorrelated to what actually happened. (We could easily show similar charts for political, interest rate and economic forecasts.)
Reacting to such forecasts is a recipe for disaster. Instead of trying to make short-term predictions, we prepare for uncertainty by identifying a select portfolio of high-quality, durable companies that can withstand corrections, recessions and inflation and build generational wealth for shareholders over the long term.
3 Source: Wall Street Journal Publications. From 1999 through 2005, numbers reflect Dow Jones Industrial Average forecasts. In 2006, the S&P 500 Index was used exclusively. Past performance is not a guarantee of future results.
Not a part of Semi-Annual Report to Fund shareholders
CLIPPER FUNDSM | Shareholder Letter – (Continued) |
Investing Through Market Corrections
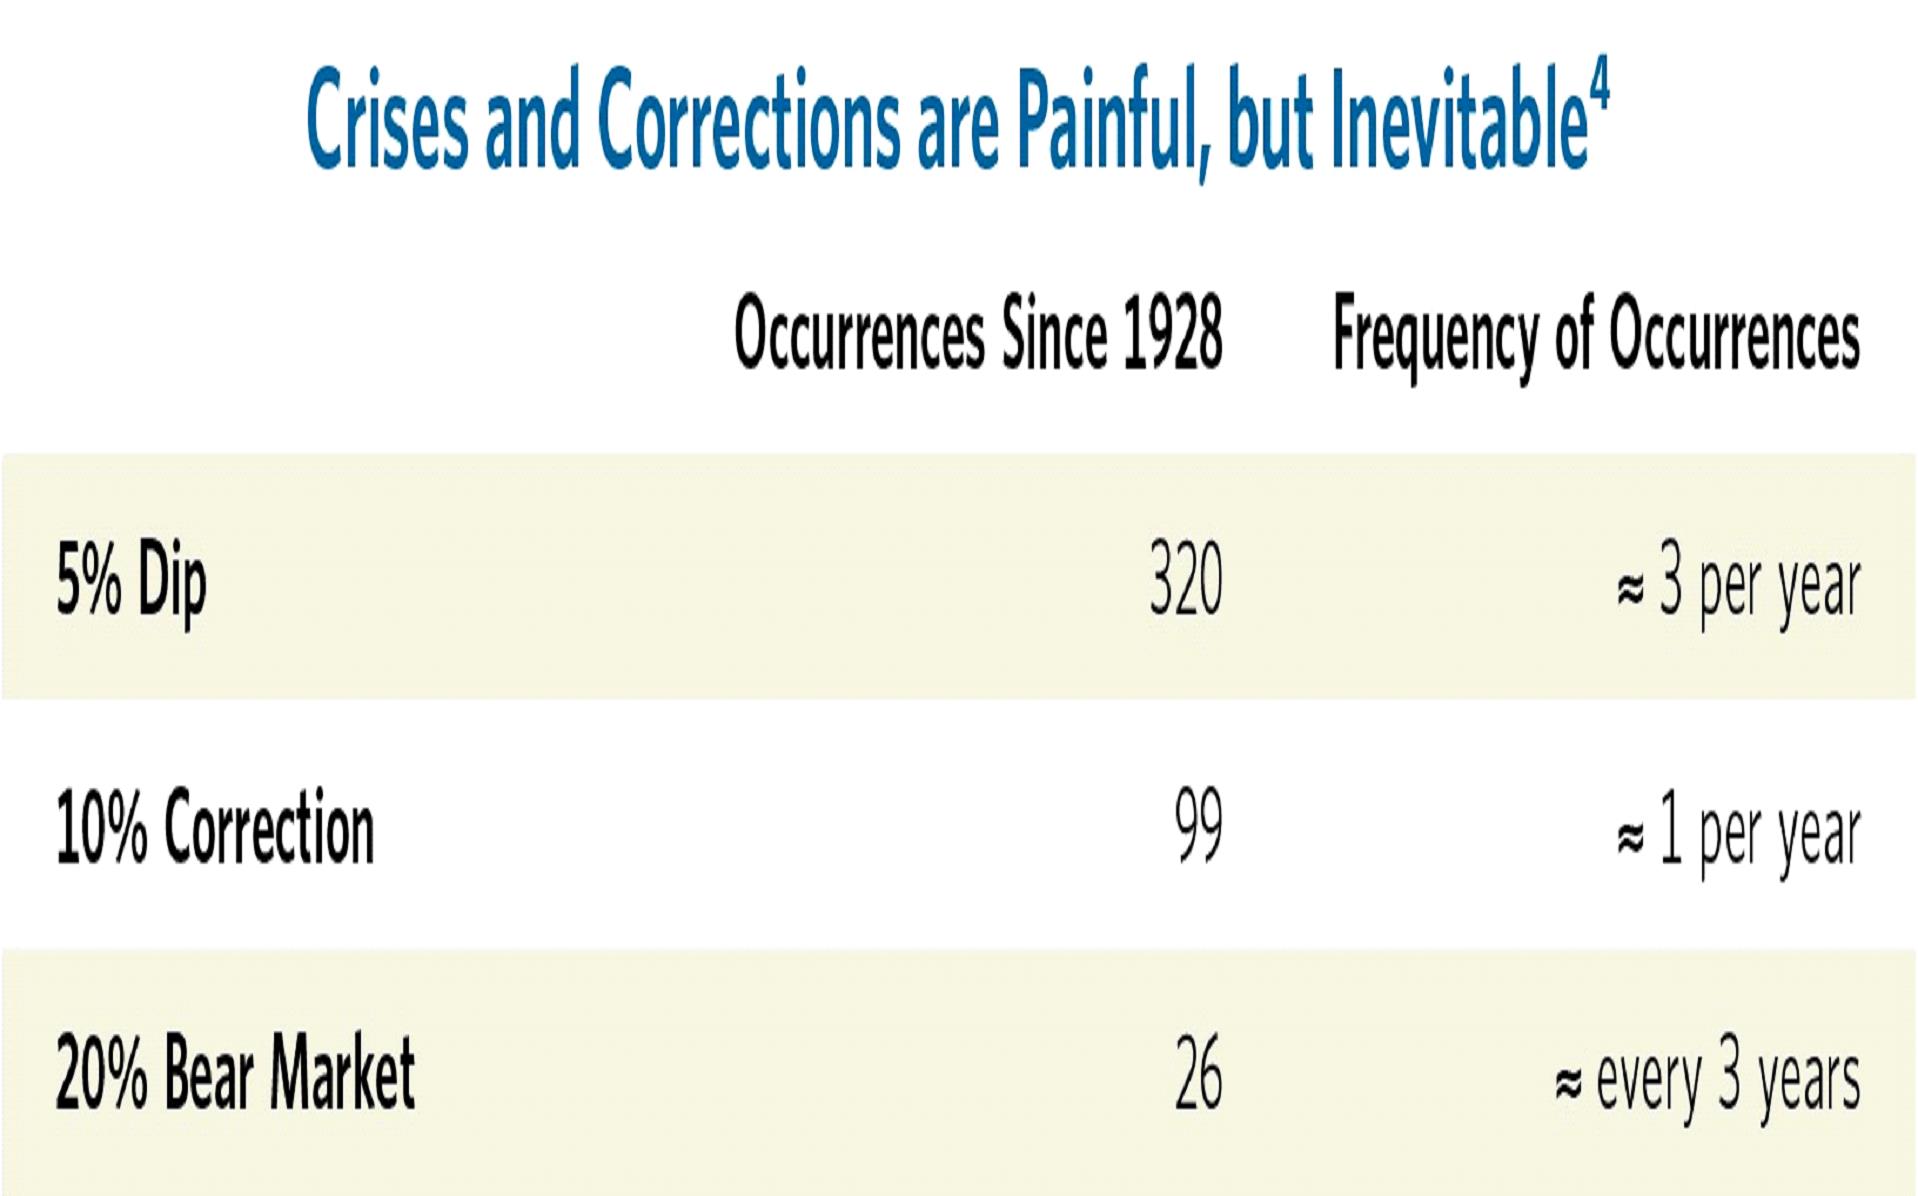
Market corrections like the one we are experiencing are an unpleasant but inevitable part of the investment landscape. As shown in the table below, over the last 100 years of market history, a 10% correction occurs roughly once per year and a 20% bear market roughly every three years.
Although knowing when a correction or market shock will occur is unpredictable, knowing that one will occur is certain. Because we will certainly be investing through such episodic times of market dislocation, we avoid companies that require short-term access to capital markets. As became clear during the junk bond crisis of the late ‘80s, the dot-com bust of the early 2000s, the financial crisis and, most recently, in today’s downturn, capital markets can be fickle. When the market window is closed, even decent businesses can be forced into a distressed sale and even bankruptcy if they require funding.
In contrast, we prepare for market corrections by focusing on two types of companies. First, we invest the lion’s share of the portfolio in companies with strong, liquid balance sheets and little or no short-term funding needs. These companies could be described as resistant or even indifferent to dislocations in capital markets. Examples of such holdings include companies like Applied Materials and many of our internet platform companies that have net cash positions. Second, we invest in a select handful of companies that we would describe as “anti-fragile”, a phrase coined by Nassim Taleb to refer to companies that actually gain from market disorder. In saying this, we are not predicting that the stock prices of such companies will go up in a bear market, but rather that their business models and strategies are designed to create value when markets are in turmoil. Examples in our portfolio include Berkshire Hathaway and Markel, both of which have a contrarian record of putting money to work when others are panicking.
To this list, we might also give partial credit to companies with trading operations that benefit from market volatility, such as JP Morgan, and companies with the capacity and history of repurchasing their own shares as they fall, a rare characteristic that we particularly value. Because repurchasing shares at lower prices increases return on capital, a number of our tech and financial holdings (discussion to follow), as well as the handful of Asian technology platform companies (like Alibaba, JD.com and DiDi Global) that we own, may also share this valuable anti-fragile characteristic.
________________________________________
4 Source: Ned Davis Research, Inc. As of 02/23/22. Further distribution prohibited without prior permission. All Rights Reserved.
Not a part of Semi-Annual Report to Fund shareholders
CLIPPER FUNDSM | Shareholder Letter – (Continued) |
Investing Through Recessions
Though less frequent than market declines, economic recessions are similarly inevitable. However, they present significantly more risk and opportunity for investors.
This larger risk is created by the fact that while market corrections only impact businesses that require access to capital, economic downturns affect virtually all businesses. As the economy contracts, falling revenue can have a magnified impact on a company’s bottom line, leading to significant losses and even distress. This is especially true for companies with high fixed costs and leveraged balance sheets. Such highly cyclical companies are especially fragile as they may ultimately be forced to raise capital at distressed prices (see previous page). Although companies with fixed costs and balance sheets leverage can be rocket ships in good times, we avoid them for the simple reason that recessions are inevitable. As a result, for our portfolio companies, we demand the strength and durability to get through such downturns without jeopardizing long-term earnings power or issuing more shares. That does not mean that the short-term earnings of our companies won’t decline, many will, but rather that their long-term earnings power, competitive position and capital structure will weather the storm.
Importantly, when investors are fearful of an impending recession, they tend to be aggressive sellers of all businesses whose earnings are economically sensitive, without discriminating between those that are durable and those that are fragile. While this lack of discrimination is a contributor to our lagging short-term results, it will be an accelerant to returns as the market’s perception changes and the durability of our companies becomes apparent. Because these companies may benefit from both recovering earnings and multiple expansion, we view their current underperformance like a coiled spring, primed for a future snap back.
Although this opportunity applies to several of our industrial holdings, it is the dominant theme for our investment in select banks like Wells Fargo, Capital One and U.S. Bancorp. The great financial crisis created a once-in-a-generation transformation of the U.S. banking system at all levels. At the regulatory level, banks are now required to hold more capital than any time in their history, making them far more resilient. Beyond increased capital, banks have also been subject to much stricter regulation, including an annual stress test that assures they can weather an economic catastrophe far worse than either COVID or the financial crisis.
At the company level, the financial crisis reinforced the importance of conservatism in lending. While there is unquestionably credit risk in the system, our research indicates that the risk is predominantly outside of the banking system, in areas like high-yield and private credit, rather than on our banks’ balance sheets. Finally, at the investor level, the demise of companies like Fannie Mae, Freddie Mac, Countrywide, WAMU, Lehman and Bear Stearns (none of which we owned) still lingers in investors’ minds, making them mistakenly think that banks are fragile when we believe they are in fact better capitalized and less risky than they have ever been. The poor performance of bank shares in the last several months reminds us of the early days of the pandemic when bank shares dramatically underperformed, only to snap back to new highs as investors realized that the sector was well prepared for a recession. Today, banks are trading at or near their lowest relative valuation in history. As the recession unfolds and banks demonstrate their resilience while continuing to pay handsome dividends, we expect our bank holdings to become a powerful driver of future returns.
Not a part of Semi-Annual Report to Fund shareholders
CLIPPER FUNDSM | Shareholder Letter – (Continued) |
In contrast to our approach, panicked investors are selling bank holdings and flocking to a small handful of companies and industries that have historically been recession resistant. We consider such a strategy highly risky for two reasons. First, it overvalues short-term earnings prospects over long-term cash generation. Earnings of $2 million this year, zero next year and $2 million the year after are more valuable than earnings of $1 million this year, $1.1 million next and $1.2 million the year after. Second, many companies that have historically been recession resistant may face other challenges that make their futures bleaker than their past. In industries like consumer staples, the erosion of once-dominant consumer brands, when paired with increasingly leveraged balance sheets, may make companies that were once safe havens far riskier in the future.
Putting these two thoughts together, investors who fear a recession will often pay silly prices for smooth earnings from companies with competitively disadvantaged futures, while significantly undervaluing durable and growing businesses, such as our bank holdings, simply because they happen to exhibit more short-term earnings volatility.
As we invest through a time of recession, the enormous valuation discount presented in the chart below should begin to close, creating a double play of rising earnings on rising valuations. In the meantime, high dividends and steady share repurchases make select banks one of the best investment opportunities facing patient investors in today’s market.
5 Source: Credit Suisse. As of 06/30/22.
Not a part of Semi-Annual Report to Fund shareholders
CLIPPER FUNDSM | Shareholder Letter – (Continued) |
Investing Through Inflation
No investor who has been in the profession for less than 40 years has ever seen a period of rising inflation. In this context, we view our long history as an enormous advantage. While many of today’s investors consider bonds low-risk investments, legendary investor Shelby Cullom Davis referred to them as “certificates of confiscation.”
To understand why we continue to hold this view, we must first recognize that the decision to invest rather than save is really a decision to put off buying something today with the expectation that you will be able to buy more in the future (otherwise, why defer the purchase?). As a result, what matters over time is that an investment increases the holder’s purchasing power. Over a long period of time, the erosion of purchasing power can be staggering. For example, over the last 50 years, purchasing power has fallen more than 88%. Even in periods of low inflation, investors are often surprised at the pernicious and relentless impact of price increases. As shown in the graph below, even in the low inflationary period we have enjoyed since 2000, purchasing power has fallen more than 40%.
After decades of low inflation, we now face a period of systemically higher inflation. While there is debate about how long this period may last, we are confident that recent increases in wages, the most important contributor to inflation, will not reverse and that other contributors such as supply chain and commodities will take time to come back under control.
In times of inflation, investors must decide what to avoid as well as what to own. Speaking to the former, many investment classes previously viewed as safe, most notably cash and bonds, are almost certain to decline in value, perhaps substantially, especially when viewed in terms of purchasing power rather than notional price. Real estate investments are a mixed bag in inflationary times, depending on capital structure, lease terms and operating costs, not to mention the impact of work-from-home trends on office values and online shopping on shopping mall owners. Finally, companies with meaningful cost inputs (labor, energy and materials) and/or high required capital spending will see significant margin and return erosion if they are unable to pass along those higher costs to customers. (Given dollar appreciation, this is a particular worry for companies with lower-cost foreign competitors.)
6 Source: https://fred.stlouisfed.org/series/CUUR0000SA0R#0
Not a part of Semi-Annual Report to Fund shareholders
CLIPPER FUNDSM | Shareholder Letter – (Continued) |
Turning from risk to opportunity, businesses whose revenue and prices go up with inflation faster than their costs can be very resilient. In the 1970s, for example, advertising firms significantly outperformed. Today’s equivalent of the Madison Avenue ad giants of that era are the great tech platforms, particularly Alphabet, Meta and Alibaba. Similarly, while Amazon will see some pressure from higher labor costs, its scale gives it a huge leg up on traditional retail competitors, while its high margin and inflation-protected advertising and cloud services businesses should continue to grow significantly. Finally, we should mention that the earnings of several of our financial holdings, including Bank of New York Mellon, American Express and our bank holdings, will all benefit from higher interest rates.
Conclusion
The last 12 months have represented a complete change in market fundamentals and sentiment as we moved from a time of record-low interest rates, speculative bubbles and market highs to a period of inflation, recession and a bear market. However, the seeds for this change were planted in the excesses of the last five years. As we highlighted in our past reports, signs of speculative excess were apparent in so many different aspects of market and economy, from artificially low interest rates to Special Purpose Acquisition Companies (SPACs) to the fact that 73 companies in the S&P 500 Index traded at more than 10 times sales!
During that stretch, especially the last five years, our focus on durability, resiliency and valuation left us out of the hottest areas of the market, and though we grew the value of the assets entrusted to our stewardship, we significantly lagged the indices. As fear and pessimism have set in, investors have been selling indiscriminately, with the result that the prices of our companies have declined roughly in line with the market index, and we continue to have ground to make up.
So why are we convinced that now is an excellent time to invest in Clipper Fund? Because, as Warren Buffett famously said, in the short term, the market is a voting machine, and in the long term, it is a weighing machine. Our focus on durability, resilience and valuation has been unpopular and unimportant for most of the last decade, but especially the last five years. While others chased momentum, we prepared our portfolio to weather a bear market, a recession and the return of inflation. While the market has not yet rewarded us for this discipline, the strength, performance and competitive position of the select businesses we own gives us confidence that this is just a matter of time. If a picture is worth a thousand words, the table below says it all. The combination of resiliency and above-average growth along with a valuation at a 43% discount to the averages is a value investor’s dream.
In short, as the flood waters rise, we have built an ark. In the years ahead, we expect our discipline and patience will be rewarded. With more than $2 billion of our own money invested alongside clients, our interests are aligned, and our conviction is more than just words. This alignment is an uncommon advantage, given that 85% of all funds are overseen by managers who have less than $1 million invested alongside their clients. We are well prepared for today’s fear and turmoil and grateful for the trust you have placed in us.
Not a part of Semi-Annual Report to Fund shareholders
CLIPPER FUNDSM | Shareholder Letter – (Continued) |
This report is authorized for use by existing shareholders. A current Clipper Fund prospectus must accompany or precede this material if it is distributed to prospective shareholders. You should carefully consider the Fund’s investment objective, risks, fees, and expenses before investing. Read the prospectus carefully before you invest or send money.
This report includes candid statements and observations regarding investment strategies, individual securities, and economic and market conditions; however, there is no guarantee that these statements, opinions or forecasts will prove to be correct. These comments may also include the expression of opinions that are speculative in nature and should not be relied on as statements of fact.
Davis Advisors is committed to communicating with our investment partners as candidly as possible because we believe our investors benefit from understanding our investment philosophy and approach. Our views and opinions include “forward-looking statements” which may or may not be accurate over the long term. Forward-looking statements can be identified by words like “believe,” “expect,” “anticipate,” or similar expressions. You should not place undue reliance on forward-looking statements, which are current as of the date of this report. We disclaim any obligation to update or alter any forward-looking statements, whether as a result of new information, future events, or otherwise. While we believe we have a reasonable basis for our appraisals and we have confidence in our opinions, actual results may differ materially from those we anticipate.
Objective and Risks. The investment objective of Clipper Fund is long-term capital growth and capital preservation. There can be no assurance that the Fund will achieve its objective. Some important risks of an investment in the Fund are: stock market risk: stock markets have periods of rising prices and periods of falling prices, including sharp declines; common stock risk: an adverse event may have a negative impact on a company and could result in a decline in the price of its common stock; financial services risk: investing a significant portion of assets in the financial services sector may cause the Fund to be more sensitive to problems affecting financial companies; focused portfolio risk: investing in a limited number of companies causes changes in the value of a single security to have a more significant effect on the value of the Fund’s total portfolio; foreign country risk: foreign companies may be subject to greater risk as foreign economies may not be as strong or diversified; As of 06/30/22, the Fund had approximately 15.0% of net assets invested in foreign companies; headline risk: the Fund may invest in a company when the company becomes the center of controversy. The company’s stock may never recover or may become worthless; large-capitalization companies risk: companies with $10 billion or more in market capitalization generally experience slower rates of growth in earnings per share than do mid- and small-capitalization companies; manager risk: poor security selection may cause the Fund to underperform relevant benchmarks; depositary receipts risk: depositary receipts involve higher expenses and may trade at a discount (or premium) to the underlying security; fees and expenses risk: the Fund may not earn enough through income and capital appreciation to offset the operating expenses of the Fund; foreign currency risk: the change in value of a foreign currency against the U.S. dollar will result in a change in the U.S. dollar value of securities denominated in that foreign currency; and mid- and small-capitalization companies risk: companies with less than $10 billion in market capitalization typically have more limited product lines, markets and financial resources than larger companies, and may trade less frequently and in more limited volume. See the prospectus for a complete description of the principal risks.
The information provided in this material should not be considered a recommendation to buy, sell or hold any particular security. As of 06/30/22, the top ten holdings of Clipper Fund were: Alphabet*, 10.27%; Berkshire Hathaway, 10.22%; Wells Fargo, 8.00%; Capital One, 6.75%; Markel, 6.41%; Cigna, 5.42%; Bank of New York Mellon, 5.29%; U.S. Bancorp, 4.96%; Intel, 4.25%; and Meta Platforms, 3.72%.
*Alphabet Inc. holding includes Class A and Class C.
Clipper Fund has adopted a Portfolio Holdings Disclosure policy that governs the release of non-public portfolio holding information. This policy is described in the prospectus. Holding percentages are subject to change. Visit clipperfund.com or call 800-432-2504 for the most current public portfolio holdings information.
Clipper Fund was managed from inception, 02/29/84, until 12/31/05 by another Adviser. Davis Selected Advisers, L.P. took over management of the Fund on 01/01/06.
Forward Price/Earnings (Forward P/E) Ratio is a stock’s current price divided by the company’s forecasted earnings for the following 12 months. The values for the portfolio and index are the weighted average of the P/E ratios of the stocks in the portfolio or index.
Not a part of Semi-Annual Report to Fund shareholders
CLIPPER FUNDSM | Shareholder Letter – (Continued) |
Five-Year EPS Growth Rate is the average annualized earning per share growth for a company over the past five years. The values for the portfolio and index are the weighted average of the five-year EPS Growth Rates of the stocks in the portfolio or index.
A Special Purpose Acquisition Company (SPAC) is a company without commercial operations and is formed strictly to raise capital through an initial public offering for the purpose of acquiring or merging with an existing company.
We gather our index data from a combination of reputable sources, including, but not limited to, Lipper, Wilshire, and index websites.
The S&P 500 Index is an unmanaged index of 500 selected common stocks, most of which are listed on the New York Stock Exchange. The index is adjusted for dividends, weighted towards stocks with large market capitalizations and represents approximately two-thirds of the total market value of all domestic common stocks. Investments cannot be made directly in an index.
After 10/31/22, this material must be accompanied by a supplement containing performance data for the most recent quarter end.
06/22 Davis Distributors, LLC, 2949 East Elvira Road, Suite 101, Tucson, AZ 85756, 800‑432-2504, clipperfund.com
Not a part of Semi-Annual Report to Fund shareholders
CLIPPER FUNDSM | Management’s Discussion of Fund Performance |
Performance Overview
Clipper Fund performed in line with the Standard & Poor’s 500® Index (“S&P 500®” or the “Index”) for the six-month period ended June 30, 2022 (the “period”). The Fund delivered a total return of -20.03%, versus a -19.96% return for the S&P 500®. The sectors1 within the S&P 500® that reported the weakest performance were Consumer Discretionary (down 33%), Communication Services (down 30%), and Information Technology (down 27%). Energy (up 32%) was the only sector in the S&P 500® that reported positive performance during the period. The other sectors within the Index that were stronger comparatively were Utilities (down 1%) and Consumer Staples (down 6%).
Detractors from Performance
The Fund’s Communication Services holdings were an important detractor2 from performance both on an absolute basis and relative to the Index. The Fund’s holdings underperformed the Index sector (down 33%, versus down 30%) and the Fund was overweight in this weaker performing sector (average weighting of 15%, versus 9%). Meta Platforms3 (down 52%) and Alphabet (down 25%) were the two largest Fund detractors during the period, respectively.
The Fund continued to hold a large position in Financials. These holdings were the top detractor from absolute performance. Capital One Financial (down 28%), Bank of New York Mellon (down 27%), Wells Fargo (down 18%), and Berkshire Hathaway (down 9%), all holdings that were significant contributors in 2021, were among the key detractors from performance during the period. Berkshire Hathaway, Wells Fargo, and Capital One Financial all remained as top five holdings at the end of the period, representing 10.22%, 8.00%, and 6.75% of net assets, respectively. U.S. Bancorp (down 17%) was also among the weaker performers from this sector.
The Fund’s Information Technology holdings were also a key detractor from absolute performance. The Fund’s holdings underperformed the Index sector (down 34%, versus down 27%). The Fund’s lone two holdings, Applied Materials (down 42%) and Intel (down 26%), were among the largest detractors.
The Fund had no exposure in Energy, Utilities, or Consumer Staples, the three highest performing sectors of the S&P 500®, respectively. As a result, relative performance suffered.
An additional individual detractor from performance was Amazon (down 36%).
Contributors to Performance
Although the aforementioned Financials sector was the Fund’s largest detractor from absolute performance, the Fund benefited significantly from its overweight position (average weight of 55%, compared to the Index sector’s 12%) while also outperforming the Index sector (down 16%, versus down 18%). Markel (up 5%) and AIA Group (up 9%) were among the largest contributors to performance. American Express (down 14%) started the period off strong but finished on a negative note, thus being down for the entire period. Fortunately, the Fund sold a majority of its shares before the performance declined. As a result, American Express was also a contributor for the period.
The Fund’s relative performance also benefited from both outperforming (down 24%, versus down 33%) and being underweight (average weighting of 9%, versus 12%) in the weakest performing sector of the Index, Consumer Discretionary. While JD.com (down 6%) decreased during the period, the Fund benefited from some timely purchases in March and subsequent performance of those shares.
Cigna (up 16%), a Health Care holding, was the overall top contributor to performance and a top ten holding at the end of the period, representing 5.42% of net assets. The Fund’s sole holding in the Materials sector, Teck Resources (up 8%), outperformed the Index sector (down 18%).
The Fund also benefited from its lower average weighting in the weaker performing Information Technology sector (8%, versus 27% for the Index). Additionally, the Fund had an average weighting of 13% of net assets in foreign securities. The Fund’s foreign holdings outperformed the U.S. holdings (down 7%, versus down 22%).
Clipper Fund’s investment objective is to seek long-term capital growth and capital preservation. There can be no assurance that the Fund will achieve its objective. Clipper Fund’s principal risks are: stock market risk, common stock risk, financial services risk, focused portfolio risk, foreign country risk, headline risk, large-capitalization companies risk, manager risk, depositary receipts risk, fees and expenses risk, foreign currency risk, and mid- and small-capitalization companies risk. See the prospectus for a full description of each risk.
Clipper Fund focuses its investments in fewer companies, and it may be subject to greater risks than a more diversified fund that is not allowed to focus its investments in a few companies. The Fund’s investment performance, both positive and negative, is expected to reflect the economic performance of its more focused portfolio.
Past performance does not guarantee future results, Fund prices fluctuate, and the value of an investment may be worth more or less than the purchase price. Data provided in this performance overview is for the six-month period ended June 30, 2022, unless otherwise noted. Return figures for underlying Fund positions reflect the return of the security from the beginning of the period or the date of first purchase if subsequent thereto through the end of the period or the date the position is completely liquidated. The actual contribution to the Fund will vary based on a number of factors (e.g., trading activity, weighting). Portfolio holding information is as of the end of the six-month period, June 30, 2022, unless otherwise noted.
1 | The companies included in the Standard & Poor’s 500® Index are divided into eleven sectors. One or more industry groups make up a sector. For purposes of measuring concentration, the Fund generally classifies companies at the industry group or industry level. See the SAI for additional information regarding the Fund’s concentration policy. |
| | |
2 | A company’s or sector’s contribution to or detraction from the Fund’s performance is a product both of its appreciation or depreciation and its weighting within the Fund. For example, a 5% holding that rises 20% has twice as much impact as a 1% holding that rises 50%. |
| | |
3 | This Management Discussion of Fund Performance discusses a number of individual companies. The information provided in this report does not provide information reasonably sufficient upon which to base an investment decision and should not be considered a recommendation to purchase, sell, or hold any particular security. The Schedule of Investments lists the Fund’s holdings of each company discussed. |
CLIPPER FUNDSM | Management’s Discussion of Fund Performance – (Continued) |
Comparison of a $10,000 investment in Clipper Fund versus the Standard & Poor’s 500® Index
over 10 years for an investment made on June 30, 2012
Average Annual Total Return for periods ended June 30, 2022
Fund & Benchmark Index | 1-Year | 5-Year | 10-Year | Since Fund’s Inception (02/29/84) | Gross Expense Ratio | Net Expense Ratio |
| Clipper Fund | (21.72)% | 5.19% | 10.10% | 10.85% | 0.71% | 0.71% |
Standard & Poor’s 500® Index | (10.62)% | 11.30% | 12.95% | 11.21% | | |
The Standard & Poor’s 500® Index is an unmanaged index of 500 selected common stocks, most of which are listed on the New York Stock Exchange. The Index is adjusted for dividends, weighted towards stocks with large market capitalizations, and represents approximately two-thirds of the total market value of all domestic common stocks. Investments cannot be made directly in the Index.
The performance data quoted in this report represents past performance, assumes that all distributions were reinvested, and is not a guarantee of future results. The investment return and principal value will fluctuate so that shares may be worth more or less than their original cost when redeemed. Current performance may be higher or lower than performance data quoted. Returns shown do not reflect the deduction of taxes that a shareholder would pay on fund distributions or the redemption of fund shares. The operating expense ratio may vary in future years. For most recent month-end performance information, please call Clipper Fund Investor Services at 1-800-432-2504 or visit the Fund’s website at www.clipperfund.com.
Davis Selected Advisers, L.P. began serving as investment adviser to Clipper Fund on January 1, 2006. A different investment adviser managed the Fund through December 31, 2005.
CLIPPER FUNDSM | |
| | June 30, 2022 (Unaudited) |
| Portfolio Composition | | Industry Weightings |
| (% of Fund’s 06/30/22 Net Assets) | | (% of 06/30/22 Stock Holdings) |
| | | | | | | |
| | | | | Fund | | S&P 500® |
| Common Stock (U.S.) | 83.76% | | Diversified Financials | 23.11% | | 4.95% |
Common Stock (Foreign) | 14.99% | | Banks | 20.02% | | 3.69% |
Other Assets & Liabilities | 1.25% | | Media & Entertainment | 14.22% | | 7.45% |
| | 100.00% | | Health Care | 11.03% | | 15.14% |
| | | | Insurance | 10.74% | | 2.20% |
| | | | Retailing | 9.04% | | 5.72% |
| | | | Information Technology | 7.24% | | 26.84% |
| | | | Capital Goods | 1.96% | | 5.25% |
| | | | Materials | 1.85% | | 2.60% |
| | | | Transportation | 0.79% | | 1.79% |
| | | | Energy | – | | 4.35% |
| | | | Food, Beverage & Tobacco | – | | 3.72% |
| | | | Utilities | – | | 3.10% |
| | | | Real Estate | – | | 2.92% |
| | | | Other | – | | 10.28% |
| | | | | 100.00% | | 100.00% |
| Top 10 Long-Term Holdings |
| (% of Fund’s 06/30/22 Net Assets) |
| | | |
Alphabet Inc.* | Media & Entertainment | 10.27% |
Berkshire Hathaway Inc., Class A | Diversified Financial Services | 10.22% |
Wells Fargo & Co. | Banks | 8.00% |
Capital One Financial Corp. | Consumer Finance | 6.75% |
Markel Corp. | Property & Casualty Insurance | 6.41% |
Cigna Corp. | Health Care Equipment & Services | 5.42% |
Bank of New York Mellon Corp. | Capital Markets | 5.29% |
U.S. Bancorp | Banks | 4.96% |
Intel Corp. | Semiconductors & Semiconductor Equipment | 4.25% |
Meta Platforms, Inc., Class A | Media & Entertainment | 3.72% |
*Alphabet Inc. holding includes Class A and Class C.
CLIPPER FUNDSM | Expense Example ( Unaudited) |
As a shareholder of the Fund, you incur ongoing costs only, including advisory and administrative fees and other Fund expenses. The Expense Example is intended to help you understand your ongoing costs (in dollars) of investing in the Fund and to compare these costs with the ongoing costs of investing in other mutual funds. The Expense Example is based on an investment of $1,000 invested at the beginning of the period and held for the entire period indicated which is for the six-month period ended June 30, 2022.
Actual Expenses
The information represented in the row entitled “Actual” provides information about actual account values and actual expenses. You may use the information in this row, together with the amount you invested, to estimate the expenses that you paid over the period. Simply divide your account value by $1,000 (for example, an $8,600 account value divided by $1,000 = 8.6), then multiply the result by the number under the heading “Expenses Paid During Period” to estimate the expenses you paid on your account during this period. An annual maintenance fee of $10, charged on retirement plan accounts per Social Security Number, is not included in the Expense Example. If this fee was included, the estimate of expenses you paid during the period would be higher, and your ending account value would be lower, by this amount.
Hypothetical Example for Comparison Purposes
The information represented in the row entitled “Hypothetical” provides information about hypothetical account values and hypothetical expenses based on the Fund’s actual expense ratio and an assumed rate of return of 5% per year before expenses, which is not the Fund’s actual return. The hypothetical account values and expenses may not be used to estimate the actual ending account balance or expenses you paid for the period. You may use this information to compare the ongoing costs of investing in the Fund and other funds. To do so, compare this 5% hypothetical example with the 5% hypothetical examples that appear in the shareholder reports of the other funds. An annual maintenance fee of $10, charged on retirement plan accounts per Social Security Number, is not included in the Expense Example. If this fee was included, the estimate of expenses you paid during the period would be higher, and your ending account value would be lower, by this amount.
Please note that the expenses shown in the table are meant to highlight your ongoing costs only. Therefore, the information in the row entitled “Hypothetical” is useful in comparing ongoing costs only, and will not help you determine the relative total costs of owning different funds.
| | Beginning | | Ending | | Expenses Paid |
| | Account Value | | Account Value | | During Period* |
| | (01/01/22) | | (06/30/22) | | (01/01/22-06/30/22) |
Actual | $1,000.00 | | $799.68 | | $3.17 |
| Hypothetical | $1,000.00 | | $1,021.27 | | $3.56 |
Hypothetical assumes 5% annual return before expenses.
* Expenses are equal to the Fund’s annualized operating expense ratio (0.71%)**, multiplied by the average account value over the period, multiplied by 181/365 (to reflect the one-half year period).
** The expense ratio reflects the impact, if any, of certain reimbursements from the Adviser.
CLIPPER FUNDSM | |
| | June 30, 2022 (Unaudited) |
| | Shares/Units | | Value
(Note 1) |
| COMMON STOCK – (98.75%) |
| | COMMUNICATION SERVICES – (14.04%) |
| | | Media & Entertainment – (14.04%) |
| | | | | | | | | | |
| | | | | | | | |
| | | | | | | | |
| | Meta Platforms, Inc., Class A * | | | | | | |
| | | | Total Communication Services | | | |
| | CONSUMER DISCRETIONARY – (8.93%) |
| | Retailing – (8.93%) |
| | Alibaba Group Holding Ltd., ADR (China)* | | | | | | |
| | | | | | | | |
| | JD.com, Inc., Class A, ADR (China) | | | | | | |
| | Naspers Ltd. - N (South Africa) | | | | | | |
| | Prosus N.V., Class N (Netherlands) | | | | | | |
| | Total Consumer Discretionary | | | |
| | FINANCIALS – (53.20%) |
| | Banks – (19.77%) |
| | | | | | | | |
| | DBS Group Holdings Ltd. (Singapore) | | | | | | |
| | | | | | | | |
| | | | | | | | |
| | | | | | | | |
| | | | 181,972,098 |
| | Diversified Financials – (22.82%) |
| | Capital Markets – (5.29%) |
| | Bank of New York Mellon Corp. | | | | | | |
| | Consumer Finance – (7.31%) |
| | | | | | | | |
| | Capital One Financial Corp. | | | | | | |
| | | 67,305,721 |
| | Diversified Financial Services – (10.22%) |
| | Berkshire Hathaway Inc., Class A * | | | | | | |
| | | | 210,058,268 |
| | Insurance – (10.61%) |
| | Life & Health Insurance – (4.20%) |
| | AIA Group Ltd. (Hong Kong) | | | | | | |
| | Ping An Insurance (Group) Co. of China, Ltd. - H (China) | | | | | | |
| | | 38,616,105 |
| | Property & Casualty Insurance – (6.41%) |
| | | | | | | | |
| | | | 97,649,088 |
| | | | | |
| | HEALTH CARE – (10.90%) |
| | Health Care Equipment & Services – (7.29%) |
| | | | | | | | |
| | | | | | | | |
| | | 67,037,280 |
CLIPPER FUNDSM | Schedule of Investments – (Continued) |
| | June 30, 2022 (Unaudited) |
| | Shares | | Value
(Note 1) |
| COMMON STOCK – (CONTINUED) |
| | HEALTH CARE – (CONTINUED) |
| | | Pharmaceuticals, Biotechnology & Life Sciences – (3.61%) |
| | | | | | | | | | |
| | | | | | | | | | |
| | INDUSTRIALS – (2.71%) |
| | Capital Goods – (1.93%) |
| | | | | | | | |
| | | | | | | | |
| | | | 17,784,296 |
| | Transportation – (0.78%) |
| | DiDi Global Inc., Class A, ADS (China)* | | | | | | |
| | | | | |
| | INFORMATION TECHNOLOGY – (7.15%) |
| | Semiconductors & Semiconductor Equipment – (7.15%) |
| | | | | | | | |
| | | | | | | | |
| | Total Information Technology | | | |
| | MATERIALS – (1.82%) |
| | Teck Resources Ltd., Class B (Canada) | | | | | | |
| | | | | |
| | TOTAL COMMON STOCK – (Identified cost $660,727,456)
| | | |
| | Total Investments – (98.75%) – (Identified cost $660,727,456) | | | 908,947,925 |
| | Other Assets Less Liabilities – (1.25%) | | | 11,525,258 |
| | Net Assets – (100.00%) | | $ | 920,473,183 |
| |
| | ADR: American Depositary Receipt |
| |
| | ADS: American Depositary Share |
| |
| | * | Non-income producing security. |
| |
| | (a) | Restricted Security – See Note 6 of the Notes to Financial Statements. |
| |
| | (b) | The value of this security was determined using significant unobservable inputs. See Note 1 of the Notes to Financial Statements. |
| |
| See Notes to Financial Statements |
CLIPPER FUNDSM | Statement of Assets and Liabilities |
| | At June 30, 2022 (Unaudited) |
| ASSETS: | | | | | |
Investments in securities, at value* (see accompanying Schedule of Investments) | | $ | 908,947,925 |
| Receivables: | | | |
| | | Capital stock sold | | | 69,094 |
| | Dividends and interest | | | 509,495 |
| | Investment securities sold | | | 11,959,583 |
Prepaid expenses | | | 5,227 |
| | Total assets | | | 921,491,324 |
LIABILITIES: | | | |
Cash overdraft | | | 129,102 |
| Payables: | | | |
| | Capital stock redeemed | | | 143,772 |
Accrued custodian fees | | | 109,500 |
Accrued investment advisory fees | | | 453,527 |
Accrued transfer agent fees | | | 124,767 |
Other accrued expenses | | | 57,473 |
| | | Total liabilities | | | 1,018,141 |
NET ASSETS | | $ | 920,473,183 |
SHARES OUTSTANDING | | | 8,767,674 |
NET ASSET VALUE, offering, and redemption price per share (Net assets ÷ Shares outstanding) | | $ | 104.98 |
NET ASSETS CONSIST OF: | | | |
Paid-in capital | | $ | 661,501,599 |
Distributable earnings | | | 258,971,584 |
| | Net Assets | | $ | 920,473,183 |
*Including: | | | |
| | Cost of investments | | $ | 660,727,456 |
| See Notes to Financial Statements |
CLIPPER FUNDSM | |
| | For the six months ended June 30, 2022 (Unaudited) |
| INVESTMENT INCOME: | | | | | | |
| Income: | | | |
Dividends* | | $ | 8,727,046 |
Interest | | | 18,649 |
| | | Total income | | | | 8,745,695 |
Expenses: | | | |
Investment advisory fees (Note 3) | | $ | 2,977,297 | | | |
Custodian fees | | | 119,656 | | | |
Transfer agent fees | | | 503,872 | | | |
Audit fees | | | 28,200 | | | |
Legal fees | | | 12,627 | | | |
Reports to shareholders | | | 19,998 | | | |
Trustees' fees and expenses | | | 125,477 | | | |
Registration and filing fees | | | 19,999 | | | |
Miscellaneous | | | 33,192 | | | |
| | Total expenses | | | | 3,840,318 |
| Net investment income | | | 4,905,377 |
REALIZED AND UNREALIZED GAIN (LOSS) ON INVESTMENTS AND FOREIGN CURRENCY TRANSACTIONS: | | | | | | |
| Net realized gain from: | | | |
| | | Investment transactions | | | 15,285,711 |
| | Foreign currency transactions | | | 2,430 |
| Net realized gain | | | 15,288,141 |
Net decrease in unrealized appreciation | | | (254,642,883) |
| | Net realized and unrealized loss on investments and foreign currency transactions | | | | (239,354,742) |
| Net decrease in net assets resulting from operations | | $ | (234,449,365) |
*Net of foreign taxes withheld of | | $ | 128,401 |
| See Notes to Financial Statements |
CLIPPER FUNDSM | Statements of Changes in Net Assets |
| | | | | |
| | | Six months ended June 30, 2022 (Unaudited) | | Year ended December 31, 2021 |
OPERATIONS: | | | | | | |
Net investment income | | $ | 4,905,377 | | $ | 4,009,337 |
Net realized gain from investments and foreign currency transactions | | | 15,288,141 | | | 174,254,834 |
Net increase (decrease) in unrealized appreciation on investments and foreign currency transactions | | | (254,642,883) | | | 13,380,351 |
| | | Net increase (decrease) in net assets resulting from operations | | | (234,449,365) | | | 191,644,522 |
DIVIDENDS AND DISTRIBUTIONS TO SHAREHOLDERS: | | | (35,298,295) | | | (151,299,101) |
CAPITAL SHARE TRANSACTIONS: | | | | | | |
Net increase in net assets resulting from capital share transactions (Note 4) | | | 1,099,105 | | | 55,361,323 |
| |
Total increase (decrease) in net assets | | | (268,648,555) | | | 95,706,744 |
NET ASSETS: | | | | | | |
Beginning of period | | | 1,189,121,738 | | | 1,093,414,994 |
| End of period | | $ | 920,473,183 | | $ | 1,189,121,738 |
| See Notes to Financial Statements |
CLIPPER FUNDSM | Notes to Financial Statements |
| | June 30, 2022 (Unaudited) |
NOTE 1 - SUMMARY OF SIGNIFICANT ACCOUNTING POLICIES
Clipper Funds Trust, a Delaware statutory trust (“Trust”), on behalf of Clipper Fund (“Fund”), a series of the Trust, is registered under the Investment Company Act of 1940, as amended, as a non-diversified, open-end management investment company. The Fund follows the reporting guidance of the Financial Accounting Standards Board (“FASB”) Accounting Standards Codification Topic 946, Financial Services – Investment Companies. The Fund’s investment objective is long-term capital growth and capital preservation. Davis Selected Advisers, L.P. (“Davis Advisors” or “Adviser”), the Fund’s investment adviser, seeks to invest the Fund’s assets primarily in common stocks of large companies (generally, companies with market capitalizations of $10 billion or more at the time of initial purchase) that are trading at prices below the Adviser’s estimate of their intrinsic values. The COVID-19 pandemic has caused market disruptions on a global scale and the long-term impact is uncertain. The aforementioned disruptions may adversely affect the value and liquidity of the Fund’s investments and thus Fund performance. The following is a summary of significant accounting policies followed by the Fund in the preparation of its financial statements.
Security Valuation - The Fund calculates the net asset value of its shares as of the close of the New York Stock Exchange (“Exchange”), normally 4:00 P.M. Eastern time, on each day the Exchange is open for business. Securities listed on the Exchange (and other national exchanges including NASDAQ) are valued at the last reported sales price on the day of valuation. Listed securities for which no sale was reported on that date are valued at the last quoted bid price. Securities traded on foreign exchanges are valued based upon the last sales price on the principal exchange on which the security is traded prior to the time when the Fund’s assets are valued. Securities (including restricted securities) for which market quotations are not readily available or securities whose values have been materially affected by what the Adviser identifies as a significant event occurring before the Fund’s assets are valued but after the close of their respective exchanges will be fair valued using a fair valuation methodology applicable to the security type or the significant event as previously approved by the Fund’s Pricing Committee and Board of Trustees. The Pricing Committee considers all facts it deems relevant that are reasonably available, through either public information or information available to the Adviser’s portfolio management team, when determining the fair value of a security. To assess the appropriateness of security valuations, the Adviser may consider (i) comparing prior day prices and/or prices of comparable securities; (ii) comparing sale prices to the prior or current day prices and challenge those prices exceeding certain tolerance levels with the third-party pricing service or broker source; (iii) new rounds of financing; (iv) the performance of the market or the issuer’s industry; (v) the liquidity of the security; (vi) the size of the holding in a fund; and/or (vii) any other appropriate information. The determination of a security’s fair value price often involves the consideration of a number of subjective factors and is therefore subject to the unavoidable risk that the value assigned to a security may be higher or lower than the security’s value would be if a reliable market quotation for the security was readily available. Fair value determinations are subject to review, approval, and ratification by the Fund’s Board of Trustees at its next regularly scheduled meeting covering the calendar quarter in which the fair valuation was determined. Fair valuation methods used by the Fund may include, but are not limited to, valuing securities initially at cost (excluding commissions) and subsequently adjusting the value due to: additional transactions by the issuer, changes in company specific fundamentals, and changes in the value of similar securities. Values may be further adjusted for any discounts related to security-specific resale restrictions.
Short-term investments purchased within 60 days to maturity are valued at amortized cost, which approximates market value.
The Fund’s valuation procedures are reviewed and subject to approval by the Board of Trustees. There have been no significant changes to the fair valuation procedures during the period.
Fair Value Measurements - Fair value is defined as the price that the Fund would receive upon selling an investment in an orderly transaction to an independent buyer in the principal market for the investment. Various inputs are used to determine the fair value of the Fund’s investments. These inputs are summarized in the three broad levels listed below.
Level 1 –
| quoted prices in active markets for identical securities |
Level 2 –
| other significant observable inputs (including quoted prices for similar investments, interest rates, prepayment speeds, credit risk, etc.) |
Level 3 –
| significant unobservable inputs (including the Fund’s own assumptions in determining the fair value of investments) |
The inputs or methodologies used for valuing securities are not necessarily an indication of the risks associated with investing in those securities nor can it be assured that the Fund can obtain the fair value assigned to a security if it were to sell the security.
CLIPPER FUNDSM | Notes to Financial Statements – (Continued) |
| | June 30, 2022 (Unaudited) |
NOTE 1 - SUMMARY OF SIGNIFICANT ACCOUNTING POLICIES – (CONTINUED)
Fair Value Measurements - (Continued)
The following is a summary of the inputs used as of June 30, 2022 in valuing the Fund’s investments carried at value:
| | Investments in Securities at Value |
| | Valuation Inputs |
| | | | Level 2: | | Level 3: | | |
| | | | Other Significant | | Significant | | |
| | Level 1: | | Observable | | Unobservable | | |
| | Quoted Prices | | Inputs | | Inputs | | Total |
Common Stock: | | | | | | | | | | | |
| Communication Services | $ | 128,822,140 | | $ | – | | $ | 398,963 | | $ | 129,221,103 |
| Consumer Discretionary | | 82,214,061 | | | – | | | – | | | 82,214,061 |
| Financials | | 489,679,454 | | | – | | | – | | | 489,679,454 |
| Health Care | | 100,285,602 | | | – | | | – | | | 100,285,602 |
| Industrials | | 24,923,803 | | | – | | | – | | | 24,923,803 |
| Information Technology | | 65,832,718 | | | – | | | – | | | 65,832,718 |
| Materials | | 16,791,184 | | | – | | | – | | | 16,791,184 |
| Total Investments | $ | 908,548,962 | | $ | – | | $ | 398,963 | | $ | 908,947,925 |
The following table reconciles the valuation of assets in which significant unobservable inputs (Level 3) were used in determining fair value during the six months ended June 30, 2022. The net change in unrealized appreciation (depreciation) during the period on Level 3 securities still held at June 30, 2022 was $(14,908). The cost of purchases or proceeds from sales may include securities received or delivered through corporate actions or exchanges. Realized and unrealized gains (losses) are included in the related amounts on investments in the Statement of Operations.
| | | Beginning Balance at January 1, 2022 | | Cost of Purchases | | Proceeds from Sales | | Net Change in Unrealized Appreciation (Depreciation) | | Net Realized Gain (Loss) | | Transfers into Level 3 | | Transfers out of Level 3 | | | Ending Balance at June 30, 2022 |
| Investments in Securities: | | | | | | | | | | | | | | | | | | | | | | | | |
| Common Stock | | $ | 413,871 | | $ | – | | $ | – | | $ | (14,908) | | $ | – | | $ | – | | $ | – | | $ | 398,963 |
| Total Level 3 | | $ | 413,871 | | $ | – | | $ | – | | $ | (14,908) | | $ | – | | $ | – | | $ | – | | $ | 398,963 |
The following table is a summary of those assets in which significant unobservable inputs (Level 3) were used by the Adviser in determining fair value. Note that these amounts exclude any valuations provided by a pricing service or broker.
| | | Fair Value at | | Valuation | | Unobservable | | | | Impact to Valuation from |
| | | June 30, 2022 | | Technique | | Input | | Amount | | an Increase in Input |
| Investments in Securities: | | | | | | | | | | | |
| Common Stock | | $ | 398,963 | | Discounted Cash Flow | | Annualized Yield | | 3.704% | | Decrease |
| | | | | | | | | | | | |
| Total Level 3 | | $ | 398,963 | | | | | | | | |
The significant unobservable input listed in the above table is used in the fair value measurement of common stock, and if changed, would affect the fair value of the Fund’s investments. The “Impact to Valuation from an Increase in Input” represents the change in fair value measurement resulting from an increase in the corresponding input. A decrease in the input would have the opposite effect.
CLIPPER FUNDSM | Notes to Financial Statements – (Continued) |
| | June 30, 2022 (Unaudited) |
NOTE 1 - SUMMARY OF SIGNIFICANT ACCOUNTING POLICIES – (CONTINUED)
Master Repurchase Agreements - The Fund, along with other affiliated funds, may transfer uninvested cash balances into one or more master repurchase agreement accounts. These balances are invested in one or more repurchase agreements, secured by U.S. Government securities. A custodian bank holds securities pledged as collateral for repurchase agreements until the agreements mature. Each agreement requires that the market value of the collateral be sufficient to cover payments of interest and principal; however, in the event of default by the other party to the agreement, retention of the collateral may be subject to legal proceedings.
Currency Translation - The market values of all assets and liabilities denominated in foreign currencies are recorded in the financial statements after translation to United States Dollar (“USD”) on the date of valuation using exchange rates determined as of the close of trading on the Exchange. The cost basis of such assets and liabilities is determined based upon historical exchange rates. Income and expenses are translated at average exchange rates in effect as accrued or incurred.
Foreign Currency - The Fund may enter into forward purchases or sales of foreign currencies to hedge certain foreign currency denominated assets and liabilities against declines in market value relative to USD. Forward currency contracts are marked-to-market daily and the change in market value is recorded by the Fund as an unrealized gain or loss. When the forward currency contract is closed, the Fund records a realized gain or loss equal to the difference between the value of the forward currency contract at the time it was opened and value at the time it was closed. Investments in forward currency contracts may expose the Fund to risks resulting from unanticipated movements in foreign currency exchange rates or failure of the counter-party to the agreement to perform in accordance with the terms of the contract. There were no forward contracts entered into by the Fund.
Reported net realized foreign exchange gains or losses arise from the sales of foreign currencies, currency gains or losses realized between the trade and settlement dates on security transactions, the difference between the amounts of dividends, interest, and foreign withholding taxes recorded on the Fund’s books, and the USD equivalent of the amounts actually received or paid. Net unrealized foreign exchange gains or losses arise from changes in the value of assets and liabilities, other than investments in securities at fiscal period end, resulting from changes in the exchange rate. The Fund includes foreign currency gains and losses realized on the sales of investments together with market gains and losses on such investments in the Statement of Operations.
Federal Income Taxes - It is the Fund’s policy to comply with the requirements of the Internal Revenue Code applicable to regulated investment companies, and to distribute substantially all of its taxable income, including any net realized gains on investments not offset by loss carryovers, to shareholders. Therefore, no provision for federal income or excise tax is required. The Adviser analyzed the Fund’s tax positions taken on federal and state income tax returns for all open tax years and concluded that as of June 30, 2022, no provision for income tax is required in the Fund’s financial statements related to these tax positions. The Fund’s federal and state (Arizona) income and federal excise tax returns for tax years for which the applicable statutes of limitations have not expired are subject to examination by the Internal Revenue Service and state Department of Revenue. The earliest tax year that remains subject to examination by these jurisdictions is 2018.
At June 30, 2022, the aggregate cost of investments and unrealized appreciation (depreciation) for federal income tax purposes were as follows:
Cost | | $ | 665,917,596 |
Unrealized appreciation | | | 310,995,436 |
Unrealized depreciation | | | (67,965,107) |
| Net unrealized appreciation | | $ | 243,030,329 |
Securities Transactions and Related Investment Income - Securities transactions are accounted for on the trade date (date the order to buy or sell is executed) with realized gain or loss on the sale of securities being determined based upon identified cost. Dividend income is recorded on the ex-dividend date. Interest income, which includes accretion of discount and amortization of premium, is accrued as earned.
CLIPPER FUNDSM | Notes to Financial Statements – (Continued) |
| | June 30, 2022 (Unaudited) |
NOTE 1 - SUMMARY OF SIGNIFICANT ACCOUNTING POLICIES – (CONTINUED)
Dividends and Distributions to Shareholders - Dividends and distributions to shareholders are recorded on the ex-dividend date. Net investment income (loss), net realized gains (losses), and net unrealized appreciation (depreciation) on investments [collectively “Distributable earnings (losses)”] may differ for financial statement and tax purposes primarily due to permanent and temporary differences which may include wash sales, foreign currency transactions, Trustee deferred compensation, corporate actions, equalization, passive foreign investment company shares, and partnership income. The character of dividends and distributions made during the fiscal year from net investment income and net realized securities gains may differ from their ultimate characterization for federal income tax purposes. Also, due to the timing of dividends and distributions, the fiscal year in which amounts are distributed may differ from the fiscal year in which income or realized gain was recorded by the Fund. The Fund adjusts certain components of capital to reflect permanent differences between financial statement amounts and net income and realized gains/losses determined in accordance with income tax rules.
Indemnification - Under the Fund’s organizational documents, its officers and trustees are indemnified against certain liabilities arising out of the performance of their duties to the Fund. In addition, some of the Fund’s contracts with its service providers contain general indemnification clauses. The Fund’s maximum exposure under these arrangements is unknown since the amount of any future claims that may be made against the Fund cannot be determined and the Fund has no historical basis for predicting the likelihood of any such claims.
Use of Estimates in Financial Statements - In preparing financial statements in conformity with accounting principles generally accepted in the United States of America, management makes estimates and assumptions that affect the reported amounts of assets and liabilities and disclosure of contingent assets and liabilities at the date of the financial statements, as well as the reported amounts of income and expenses during the reporting period. Actual results may differ from these estimates.
Trustees Fees and Expenses - The Fund set up a Rabbi Trust to provide for the deferred compensation plan for Independent Trustees that enables them to elect to defer receipt of all or a portion of annual fees they are entitled to receive. The value of an eligible Trustees’ account is based upon years of service and fees paid to each Trustee during the years of service. The amount paid to the Trustee by the Trust under the plan will be determined based upon the performance of the Funds in which the amounts are invested.
CLIPPER FUNDSM | Notes to Financial Statements – (Continued) |
| | June 30, 2022 (Unaudited) |
NOTE 2 - PURCHASES AND SALES OF SECURITIES
The cost of purchases and proceeds from sales of investment securities (excluding short-term investments) during the six months ended June 30, 2022 were $35,048,592 and $55,966,036, respectively.
NOTE 3 - FEES AND OTHER TRANSACTIONS WITH SERVICE PROVIDERS (INCLUDING AFFILIATES)
Davis Selected Advisers-NY, Inc. (“DSA-NY”), a wholly-owned subsidiary of the Adviser, acts as sub-adviser to the Fund. DSA-NY performs research and portfolio management services for the Fund under a Sub-Advisory Agreement with the Adviser. The Fund pays no fees directly to DSA-NY.
All officers of the Fund (including Interested Trustees) hold positions as executive officers with the Adviser or its affiliates.
Investment Advisory Fees - Advisory fees are paid monthly to the Adviser. The annual rate is 0.55% of the average net assets for the first $3 billion, 0.54% on the next $1 billion, 0.53% on the next $1 billion, 0.52% on the next $1 billion, 0.51% on the next $1 billion, 0.50% on the next $3 billion, and 0.485% of the average net assets greater than $10 billion. Advisory fees paid during the six months ended June 30, 2022 approximated 0.55% of average net assets.
Transfer Agent and Accounting Fees - DST Asset Manager Solutions, Inc. is the Fund’s primary transfer agent. The Adviser is also paid for certain transfer agent services. The fee paid to the Adviser for these services during the six months ended June 30, 2022 amounted to $32,696. State Street Bank and Trust Company (“State Street Bank”) is the Fund’s primary accounting provider. Fees for such services are included in the custodian fees as State Street Bank also serves as the Fund’s custodian.
NOTE 4 - CAPITAL STOCK
At June 30, 2022, there were unlimited shares of capital stock (no par value) authorized. Transactions in capital stock were as follows:
| | Six months ended June 30, 2022 (Unaudited) |
| | | Sold | | | Reinvestment of Distributions | | | Redeemed | | | Net Increase |
| | | | | | | | | | | | |
| Shares | | 62,350 | | | 317,714 | | | (331,356) | | | 48,708 |
| Value | $ | 8,060,600 | | $ | 34,001,751 | | $ | (40,963,246) | | $ | 1,099,105 |
| | | | | | | | | | | | |
| |
| | Year ended December 31, 2021 |
| | | Sold | | | Reinvestment of Distributions | | | Redeemed | | | Net Increase |
| | | | | | | | | | | | |
| Shares | | 183,380 | | | 1,040,631 | | | (808,023) | | | 415,988 |
| Value | $ | 27,148,017 | | $ | 146,252,476 | | $ | (118,039,170) | | $ | 55,361,323 |
| | | | | | | | | | | | |
NOTE 5 - SECURITIES LOANED
The Fund has entered into a securities lending arrangement with State Street Bank. Under the terms of the agreement, the Fund receives fee income from lending transactions; in exchange for such fees, State Street Bank is authorized to loan securities on behalf of the Fund, against receipt of collateral at least equal to the value of the securities loaned. As of June 30, 2022, the Fund did not have any securities on loan. The Fund bears the risk of any deficiency in the amount of the collateral available for return to a borrower due to a loss in an approved investment.
CLIPPER FUNDSM | Notes to Financial Statements – (Continued) |
| | June 30, 2022 (Unaudited) |
NOTE 6 - RESTRICTED SECURITIES
Restricted securities are not registered under the Securities Act of 1933 and may have contractual restrictions on resale. They are fair valued under methods approved by the Board of Trustees. The aggregate value of restricted securities amounted to $398,963 or 0.04% of the Fund’s net assets as of June 30, 2022. Information regarding restricted securities is as follows:
| Security | | Initial Acquisition Date | | Units | | Cost per Unit | | Valuation per Unit as of June 30, 2022 |
ASAC II L.P. | | 10/10/13 | | 407,313 | | $ | 1.00 | | $ | 0.9795 |
| The following financial information represents selected data for each share of capital stock outstanding throughout each period: |
| | Six months ended
June 30, 2022 | | Year ended December 31, |
| | (Unaudited) | | 2021 | | 2020 | | 2019 | | 2018 | | 2017 |
Net Asset Value, Beginning of Period | | $ | 136.38 | | $ | 131.69 | | $ | 122.75 | | $ | 96.09 | | $ | 120.46 | | $ | 108.72 |
Income (Loss) from Investment Operations: | | | | | | | | | | | | | | | | | | | |
Net Investment Incomea | | 0.57 | | 0.49 | | 0.52 | | 0.67 | | 0.92 | | 0.75 |
| Net Realized and Unrealized Gains (Losses) | | (27.81) | | 23.01 | | 11.65 | | 27.79 | | (15.56) | | 18.16 |
| | | Total from Investment Operations | | (27.24) | | 23.50 | | 12.17 | | 28.46 | | (14.64) | | 18.91 |
Dividends and Distributions: | | | | | | | | | | | | | | | | | | | |
| Dividends from Net Investment Income | | (0.63) | | (0.49) | | (0.98) | | (1.10) | | (0.88) | | (0.80) |
| Distributions from Realized Gains | | (3.53) | | (18.32) | | (2.25) | | (0.70) | | (8.85) | | (6.37) |
| | Total Dividends and Distributions |
| (4.16) |
| (18.81) | | (3.23) | | (1.80) | | (9.73) | | (7.17) |
| Net Asset Value, End of Period | | $ | 104.98 | | $ | 136.38 | | $ | 131.69 | | $ | 122.75 | | $ | 96.09 | | $ | 120.46 |
Total Returnb | | (20.03)% | | 17.78% | | 9.96% | | 29.63% | | (12.92) % | | 17.69% |
Ratios/Supplemental Data: | | | | | | | | | | | | | | | | | | | |
| Net Assets, End of Period (in millions) | | $ | 920 | | $ | 1,189 | | $ | 1,093 | | $ | 1,123 | | $ | 940 | | $ | 1,185 |
Ratio of Expenses to Average Net Assets: | | | | | | | | | | | | | | | | | | | |
| | Gross | | 0.71%c | | 0.71% | | 0.71% | | 0.71% | | 0.71% | | 0.71% |
| | Netd | | 0.71%c | | 0.71% | | 0.71% | | 0.71% | | 0.71% | | 0.71% |
Ratio of Net Investment Income to Average Net Assets | | 0.91%c | | 0.33% | | 0.45% | | 0.59% | | 0.77% | | 0.66% |
| Portfolio Turnover Ratee | | 3% | | 25% | | 10% | | 7% | | 24% | | 17% |
a | Per share calculations were based on average shares outstanding for the period. |
| |
b | Assumes hypothetical initial investment on the business day before the first day of the fiscal period, with all dividends and distributions reinvested in additional shares on the reinvestment date, and redemption at the net asset value calculated on the last business day of the fiscal period. Total returns are not annualized for periods of less than one year. |
| |
c | Annualized. |
| |
d | The Net Ratio of Expenses to Average Net Assets reflects the impact, if any, of certain reimbursements. |
| |
e | The lesser of purchases or sales of portfolio securities for a period, divided by the monthly average of the market value of portfolio securities owned during the period. Securities with a maturity or expiration date at the time of acquisition of one year or less are excluded from the calculation. |
| |
| See Notes to Financial Statements |
CLIPPER FUNDSM | Trustee Approval of Advisory Agreement ( Unaudited) |
Process of Annual Review
The Board of Trustees of Clipper Funds Trust oversees the management of the Clipper Fund and, as required by law, determines annually whether to approve the continuance of the Clipper Fund’s advisory agreement with Davis Selected Advisers, L.P. and sub-advisory agreement with Davis Selected Advisers-NY, Inc. (jointly “Davis Advisors” and “Advisory Agreement”).
With the assistance of counsel to the Independent Trustees, the Independent Trustees undertook a comprehensive review process in anticipation of their annual contract review meeting, held in April 2022. As part of this process, Davis Advisors provided the Independent Trustees with material (including recent investment performance data) that was responsive to questions submitted to Davis Advisors by the Independent Trustees. At this meeting, the Independent Trustees reviewed and evaluated all information which they deemed reasonably necessary under the circumstances and were provided guidance by their independent counsel. Clipper Fund, Inc. was reorganized into Clipper Funds Trust in December 2014. For this reason, the review included historical information for Clipper Fund, Inc.
In reaching their decision, the Independent Trustees also took into account information furnished to them throughout the year and otherwise provided to them during their quarterly meetings or through other prior communications. The Independent Trustees concluded that they had been supplied with sufficient information and data to analyze the Advisory Agreement and that their questions had been sufficiently answered by Davis Advisors. Upon completion of this review, the Independent Trustees found that the terms of the Advisory Agreement are fair and reasonable and that continuation of the Advisory Agreement is in the best interests of Clipper Fund and its shareholders.
Reasons the Independent Trustees Approved Continuation of the Advisory Agreement
The Independent Trustees’ determinations were based upon a comprehensive consideration of all information provided to them, and they did not identify any single item or piece of information as the controlling factor. Each Independent Trustee did not necessarily attribute the same weight to each factor. The following considerations and conclusions were important, but not exclusive, to the Independent Trustees’ recommendation to renew the Advisory Agreement.
The Independent Trustees considered the investment performance of the Fund on an absolute basis, as well as relative to its benchmark and other comparable funds. The Independent Trustees not only considered the investment performance of the Fund, but also the full range and quality of services provided by Davis Advisors to the Fund and its shareholders, including whether the Fund:
| 1. | achieves satisfactory investment results over the long-term, after all costs; |
| 2. | efficiently and effectively handles shareholder transactions, inquiries, requests and records, provides quality accounting, legal and compliance services, and oversees third-party service providers; and |
| 3. | fosters healthy investor behavior. |
Davis Advisors is reimbursed a portion of its costs in providing some but not all of these services.
A shareholder’s ultimate return is the product of a fund’s results as well as the shareholder’s behavior, specifically in selecting when to invest or redeem. The Independent Trustees concluded that, through its actions and communications, Davis Advisors has attempted to have a meaningful positive impact on investor behavior.
In aggregate, Davis Advisors, employees of Davis Advisors, and the Davis family have made significant investments in the Fund. The Independent Trustees considered that these investments tend to align Davis Advisors’, Davis Advisors’ employees, and the Davis family’s interests with other shareholders, as they face the same risks, pay the same fees, and are motivated to achieve satisfactory long-term returns. In addition, the Independent Trustees concluded that significant investments by Davis Advisors and the Davis family have contributed to the economies of scale that have lowered fees and expenses for Clipper Fund’s shareholders over time.
The Independent Trustees noted the importance of reviewing quantitative measures, but recognized that qualitative factors are also important in assessing whether Clipper Fund’s shareholders are likely to be well served by the renewal of the Advisory Agreement. They noted both the value and shortcomings of purely quantitative measures, including the data provided by independent service providers, and concluded that, while such measures and data may be informative, the judgment of the Independent Trustees must take many factors into consideration in representing the shareholders of the Clipper Fund, including those listed below. In connection with reviewing comparative performance information, the Independent Trustees generally give greater weight to longer-term measurements.
CLIPPER FUNDSM | Trustee Approval of Advisory Agreement (Unaudited) – (Continued) |
Reasons the Independent Trustees Approved Continuation of the Advisory Agreement – (Continued)
The Independent Trustees noted that Davis Advisors employs a disciplined, company-specific, research-driven, businesslike, long-term investment philosophy. The Independent Trustees considered the quality of Davis Advisors’ investment process as well as the experience, capability and integrity of its senior management and other personnel.
The Independent Trustees recognized Davis Advisors’ (a) efforts to minimize transaction costs by generally having a long- term time horizon and low portfolio turnover; (b) focus on tax efficiency; (c) record of generally producing satisfactory results over longer-term periods; (d) efforts towards fostering healthy investor behavior by, among other things, providing informative and substantial educational material; and (e) efforts to promote shareholder interests by actively speaking out on corporate governance issues.
The Independent Trustees assessed (a) comparative fee and expense information for other funds, as selected and analyzed by a nationally recognized independent service provider; (b) information regarding fees charged by Davis Advisors to other advisory clients, which includes other funds it advises, other funds which it sub-advises, and private accounts, as well as the differences in the services provided to such other clients; and (c) the fee schedule of the Fund, including an assessment of competitive fee schedules.
The Independent Trustees reviewed the management fee schedule for the Fund, profitability of the Fund to Davis Advisors, the extent to which economies of scale might be realized if the Fund’s net assets increase, and whether the fee schedule reflected those potential economies of scale at this time. The Independent Trustees considered the nature, quality, and extent of the services being provided to the Fund and the costs incurred by Davis Advisors in providing such services. The Independent Trustees considered various potential benefits that Davis Advisors may receive in connection with the services it provides under the Advisory Agreement with the Fund, including a review of portfolio brokerage practices. The Independent Trustees noted that Davis Advisors does not use client commissions to pay for publications that are available to the general public or for research reports that are created by parties other than the broker-dealers providing trade execution, clearing and/or settlement services to the Fund.
The Independent Trustees compared the fees paid to Davis Advisors by the Clipper Fund with those paid by Davis Advisors’ advised and sub-advised clients, private account clients, and managed money/wrap clients. To the extent sub-advised, private account, or managed money/wrap fees were lower than fees paid by the Fund, the Independent Trustees noted that the range of services provided to the Fund is more extensive, with greater risks associated with operating SEC registered, publicly traded mutual funds. Serving as the primary adviser for mutual funds is more work because of the complex overlay of regulatory, tax, and accounting issues, which are unique to mutual funds. In addition, the operational work required to service shareholders is more extensive because of the significantly greater number of shareholders, and managing trading is more complex because of the more frequent fund flows. With respect to risk, not only has regulation become more complex and burdensome, but the scrutiny of regulators and shareholders has become more intense. The Independent Trustees concluded that reasonable justifications existed for any differences between the fee rates for Clipper Fund and Davis Advisors’ other lines of business.
Clipper Fund
Davis Advisors began the day-to-day management of the Clipper Fund on January 1, 2006. The Independent Trustees noted that Clipper Fund underperformed its benchmark, the Standard & Poor’s 500® Index (“S&P 500®”), over the one-, three-, five-, ten-year, and since-inception time periods, all periods ended March 31, 2022.
Broadridge, an independent service provider, presented a report to the Independent Trustees that compared the Fund to all Lipper retail and institutional large-cap value funds (the “Performance Universe Average”), as well as the relevant Lipper Index. The report indicated that the Fund outperformed the Performance Universe Average and performed in line with the Lipper Index over the three- and ten-year time periods, and underperformed both over the one-, two-, four-, and five-year time periods, all periods ended December 31, 2021.
CLIPPER FUNDSM | Trustee Approval of Advisory Agreement (Unaudited) – (Continued) |
Clipper Fund – (Continued)
The Independent Trustees also reviewed the Fund’s performance versus both the S&P 500® and the Lipper Large-Cap Value category when measured over rolling five- and ten-year time frames. Since Davis Advisors took over management, the Fund outperformed the S&P 500® in 3 out of 12 rolling five-year time periods and outperformed the Lipper Large-Cap Value category in 7 out of 12 rolling five-year time periods, all periods ended December 31 for each year from 2010 through 2021. The Fund outperformed the S&P 500® in 0 out of 7 rolling ten-year time periods and outperformed the Lipper Large-Cap Value category in 4 out of 7 rolling ten-year time periods, all periods ended December 31 for each year from 2015 through 2021.
The Independent Trustees considered Clipper Fund’s management fee and total expense ratio. They observed that both were slightly above the average and median of its expense peer group, however well below the median of its expense universe, as determined by Broadridge. They noted that the Fund has an advisory fee schedule that begins at 0.55% and declines from there in a series of breakpoints. In addition, the Independent Trustees noted that the breakpoint discounts in the Fund’s advisory fee schedule would provide for the sharing by Davis Advisors with Fund shareholders of any economies of scale that may exist in the management of the Fund. They also considered that, based on its asset level, the Fund does not qualify for a breakpoint in its advisory fee. In addition, the Independent Trustees noted that the Fund’s advisory fee schedule is identical to two other open-end mutual funds that Davis Advisors serves as investment adviser and that have a higher asset level than the Fund.
Approval of Advisory Agreement
The Independent Trustees concluded that Davis Advisors had provided Clipper Fund and its shareholders a reasonable level of both investment and non-investment services. The Independent Trustees further concluded that shareholders have received a significant benefit from Davis Advisors’ shareholder-oriented approach, as well as the execution of its investment discipline.
The Independent Trustees determined that the advisory fee for the Clipper Fund is reasonable in light of the nature, quality, and extent of the services being provided to the Fund, the costs incurred by Davis Advisors in providing such service, and in comparison to the range of the average advisory fees of its peer group, as determined by an independent service provider. The Independent Trustees found that the terms of the Advisory Agreement were fair and reasonable and that continuation of the Advisory Agreement is in the best interest of the Clipper Fund and its shareholders. The Independent Trustees and the full Board of Trustees therefore voted to continue the Advisory Agreement.
CLIPPER FUNDSM | Liquidity Risk Management Program |
Following is a description of the operation and effectiveness of the Liquidity Risk Management Program (“LRMP”) that was adopted by the Board of Trustees (the “Board”) in accordance with Rule 22e-4 under the Investment Company Act of 1940 (the “Liquidity Rule”). The Liquidity Rule is meant to promote effective liquidity risk management practices in order to reduce the likelihood that a fund would be unable to meet its redemption obligations.
The Board has appointed Davis Selected Advisers, L.P. (the “Adviser”) to serve as the Administrator of the LRMP, subject to the supervision of the Board. The Adviser has engaged a third party to perform certain functions, including the production of liquidity classification model information.
The Adviser monitors the adequacy and effectiveness of the implementation of the LRMP on an ongoing basis. This monitoring includes a review of the Fund’s liquidity risk based on a variety of factors including the Fund’s (1) investment strategy, (2) portfolio liquidity and cash flow projections during normal and reasonably foreseeable stressed conditions, (3) shareholder redemptions, and (4) borrowing arrangements and other funding sources. The Liquidity Rule places a 15% limit on a fund’s illiquid investments and requires a fund that does not primarily hold assets that are highly liquid investments to determine and maintain a minimum percentage of the fund’s net assets in highly liquid investments (highly liquid investment minimum or HLIM). The LRMP includes provisions and safeguards that are reasonably designed to comply with the 15% limit on illiquid investments and the Fund is currently classified as a Fund that primarily holds highly liquid investments. The LRMP includes the classification, no less than monthly, of the Fund’s investments into one of four liquidity classifications as provided for in the Liquidity Rule.
At a recent meeting of the Fund’s Board of Trustees, the Adviser provided a written report to the Board pertaining to the operation, adequacy, and effectiveness of implementation of the LRMP from April 1, 2021 through March 31, 2022. The report concluded that the LRMP is operating effectively and is reasonably designed to assess and manage the Fund’s liquidity risk. There can be no guarantee that the LRMP will achieve its objectives in the future. Additional information regarding risks of investing in the Fund, including liquidity risks presented by the Fund’s investment portfolio, is found in the Fund’s Prospectus and Statement of Additional Information.
CLIPPER FUNDSM | Privacy Notice and Householding |
Privacy Notice
While you generally will be dealing with a broker-dealer or other financial adviser, we may collect information about you from your account application and other forms that you may deliver to us. We use this information to process your requests and transactions; for example, to provide you with additional information about the Fund, to open an account for you, or to process a transaction. In order to service your account and execute your transactions, we may provide your personal information to firms that assist us in servicing your account, such as our transfer agent. We may also provide your name and address to one of our agents for the purpose of mailing to you your account statement and other information about our products and services. We may also gather information through the use of “cookies” when you visit our website. These files help us to recognize repeat visitors and allow easy access to and use of the website. We require these outside firms and agents to protect the confidentiality of your information and to use the information only for the purpose for which the disclosure is made. We do not provide customer names and addresses to outside firms, organizations, or individuals except in furtherance of our business relationship with you or as otherwise allowed by law.
We restrict access to nonpublic personal information about you to those employees who need to know that information to provide products or services to you. We maintain physical, electronic, and procedural safeguards that comply with federal standards to guard your personal information.
Householding
The Fund may, on occasion, mail notices, reports, prospectuses, or proxy material to shareholders. To avoid sending duplicate copies of materials to households, the Fund will mail only one copy of these items to shareholders having the same last name and address on the Fund’s records. The consolidation of these mailings, called householding, benefits the Fund through reduced mailing expense. If you have a direct account with the Fund and you do not want the mailing of these documents to be combined with those to other members of your household, please contact Clipper Fund by phone at 1-800-432-2504. Your instructions will become effective within 30 days of your notice to the Fund.
For the purpose of their service as trustees to the Fund, the business address for each of the Trustees is 2949 E. Elvira Road, Suite 101, Tucson, AZ 85756. Each Trustee serves until retirement, resignation, death, or removal. After turning 75, each Trustee will be annually reviewed by the Independent Trustees, and a majority of the Independent Trustees (with such Trustee abstaining) may request such Trustee’s resignation as of the last business day of the year. Subject to further exceptions and exemptions that may be granted by the Independent Trustees, Trustees must retire from the Board and cease being a Trustee at the close of business on the last day of the calendar year in which the Trustee attains age 80.
Name, Date of Birth, Positions Held with Fund, Length of Service | Principal Occupation(s) During Past Five Years | Number of Portfolios Overseen | Other Directorships |
Independent Trustees
| | | | |
Francisco L. Borges (11/17/51) Trustee since 2014 | Partner and Co-Head, Ares Management Corp. (global alternative investment manager) since 2021; Chairman and Managing Partner, Landmark Partners, LLC (private equity firm) until 2021. | 3 | Chairman and Trustee, John S. and James L. Knight Foundation; Chairman/Director, Assured Guaranty Ltd. (financial guaranty insurance business); Trustee, Millbrook School; Director, Selected Funds (consisting of two portfolios); Director, Hartford HealthCare (healthcare network). |
| | | | |
Lawrence E. Harris (09/16/56) Trustee/Director since 2006 | Fred V. Keenan Chair in Finance of the Marshall School of Business, University of Southern California, Los Angeles, CA. | 3 | Director, Interactive Brokers Group, Inc.; Director, Selected Funds (consisting of two portfolios). |
| | | | |
Steven N. Kearsley (09/29/41) Trustee/Director since 2006 | Private Investor, Real Estate Development. | 3 | Director, Selected Funds (consisting of two portfolios). |
| | | | |
Katherine L. MacWilliams (01/19/56) Trustee since 2014 | Retired; Chief Financial Officer, Caridian BCT, Inc. (medical device company) 2008-2012. | 3 | Director, Selected Funds (consisting of two portfolios). |
| | | | |
James J. McMonagle (10/01/44) Trustee since 2014 Chairman since 2015 | Of Counsel to Vorys, Sater, Seymour and Pease LLP (law firm) since 2002. | 3 | Director/Chairman, Selected Funds (consisting of two portfolios). |
| | | | |
Richard O’Brien (09/12/45) Trustee since 2014 | Retired; Corporate Economist, HP Inc. | 3 | Director, Selected Funds (consisting of two portfolios). |
Interested Trustees*
| | | | |
Andrew A. Davis (06/25/63) Trustee since 2014 | President or Vice President of each Selected Fund, Clipper Fund, and Davis Fund; President, Davis Selected Advisers, L.P., and also serves as an executive officer of certain companies affiliated with the Adviser. | 16 | Director, Selected Funds (consisting of two portfolios); Director, Davis Funds (consisting of 13 portfolios). |
| | | | |
Christopher C. Davis (07/13/65) Trustee since 2014 | President or Vice President of each Selected Fund, Davis Fund, Clipper Fund, and Davis ETF; Chairman, Davis Selected Advisers, L.P., and also serves as an executive officer of certain companies affiliated with the Adviser, including sole member of the Adviser’s general partner, Davis Investments, LLC. | 16 | Director, Selected Funds (consisting of two portfolios); Director, Davis Funds (consisting of 13 portfolios); Lead Independent Director, Graham Holdings Company (educational and media company); Director, The Coca-Cola Company (beverage company); Director, Berkshire Hathaway Inc. (financial services). |
* Andrew A. Davis and Christopher C. Davis own partnership units (directly, indirectly, or both) of the Adviser and are considered to be “interested persons” of the Funds as defined in the Investment Company Act of 1940. Andrew A. Davis and Christopher C. Davis are brothers.
Officers
Lisa J. Cohen (born 04/25/89, Clipper Fund officer since 2021). Vice President and Secretary of Clipper Funds Trust (consisting of one portfolio), Davis Funds (consisting of 13 portfolios), Selected Funds (consisting of two portfolios), and Davis Fundamental ETF Trust (consisting of four portfolios); Vice President, Senior Attorney, and Secretary, Davis Selected Advisers, L.P., and also serves as an executive officer of certain companies affiliated with the Adviser.
Andrew A. Davis (born 06/25/63, Clipper Fund officer since 2015). See description in the section on Interested Trustees.
Christopher C. Davis (born 07/13/65, Clipper Fund officer since 2005). See description in the section on Interested Trustees.
Kenneth C. Eich (born 08/14/53, Clipper Fund officer since 2005). Executive Vice President and Principal Executive Officer of Clipper Funds Trust (consisting of one portfolio), Davis Funds (consisting of 13 portfolios), and Selected Funds (consisting of two portfolios); Trustee/Chairman, Executive Vice President, and Principal Executive Officer of Davis Fundamental ETF Trust (consisting of four portfolios); Chief Operating Officer, Davis Selected Advisers, L.P., and also serves as an executive officer of certain companies affiliated with the Adviser.
Douglas A. Haines (born 03/04/71, Clipper Fund officer since 2005). Vice President, Treasurer, Chief Financial Officer, Principal Financial Officer, and Principal Accounting Officer of Clipper Funds Trust (consisting of one portfolio), Davis Funds (consisting of 13 portfolios), Selected Funds (consisting of two portfolios), and Davis Fundamental ETF Trust (consisting of four portfolios); Vice President and Director of Fund Accounting, Davis Selected Advisers, L.P.
Randi J. Roessler (born 06/26/81, Clipper Fund officer since 2018). Vice President and Chief Compliance Officer of Clipper Funds Trust (consisting of one portfolio), Davis Funds (consisting of 13 portfolios), Selected Funds (consisting of two portfolios), and Davis Fundamental ETF Trust (consisting of four portfolios); Vice President and Chief Compliance Officer, Davis Selected Advisers, L.P., and also serves as an executive officer of certain companies affiliated with the Adviser.
| Investment Adviser |
Davis Selected Advisers, L.P. (Doing business as “Davis Advisors”) |
2949 East Elvira Road, Suite 101 |
Tucson, Arizona 85756 |
(800) 432-2504 |
| |
| Distributor |
Davis Distributors, LLC |
2949 East Elvira Road, Suite 101 |
Tucson, Arizona 85756 |
| |
| Transfer Agent |
DST Asset Manager Solutions, Inc. |
P.O. Box 219167 |
Kansas City, Missouri 64121-9167 |
| |
Overnight Address: |
430 West 7th Street, Suite 219167 |
Kansas City, Missouri 64105-1407 |
| |
| Custodian |
State Street Bank and Trust Co. |
One Lincoln Street |
Boston, Massachusetts 02111 |
| |
| Legal Counsel |
Greenberg Traurig, LLP |
77 West Wacker Drive, Suite 3100 |
Chicago, Illinois 60601 |
| |
| Independent Registered Public Accounting Firm |
KPMG LLP |
1225 17th Street, Suite 800 |
Denver, Colorado 80202 |
For more information about Clipper Fund including management fee, charges, and expenses, see the current prospectus, which must precede or accompany this report. The Fund’s Statement of Additional Information contains additional information about the Fund’s Trustees and is available without charge, upon request, by contacting the Fund at 1-800-432-2504 and on the Fund’s website at www.clipperfund.com. Quarterly Fact Sheets are available on the Fund’s website at www.clipperfund.com.