Construction-in-progress (“CIP”) relates to the facility being built in Wanning City of Hainan Province.
In April 2013, Kandi Electric Vehicles (Wanning) Co., Ltd. (“Kandi Wanning”) was formed in Wanning City of Hainan Province. The Company signed an agreement with Wanning city government and planned to invest a total of RMB 1 billion, or $156,892,278, to develop a factory in Wanning with an annual production of 100,000 EVs. In 2013, the Company contracted with an unrelated third party equipment supplier, Nanjing Shangtong Auto Technologies Co., Ltd. (“Nanjing Shangtong”), to purchase equipment. The equipment was purchased and delivered according to the construction schedule and development of Kandi Wanning. As of September 30, 2015, a total amount of advances to suppliers of RMB 353,000,000, or $55,382,974, made by Kandi Wanning to Nanjing Shangtong for equipment purchases was transferred to Construction in Process (“CIP”). None of CIP was transferred to property, plant and equipment at September 30, 2015.
Because the government of Hainan Province is enforcing a new plan to centralize the manufacturing in designated industry park, the Wanning facility was required to move from Wanning City to the national high tech development zone in Haikou City. After relocation, Kandi Wanning is expected to obtain more support from the government of Hainan Province and Haikou City. Currently the relocation is in process. Although causing certain delay to our production, Kandi Wanning will eventually benefit from the relocation because Haikou City is the capital of Hainan Province. In addition, all related expenses caused by the relocation is expected to be compensated by local government.
No depreciation is provided for CIP until such time as the facility is completed and placed into operation.
Information with respect to the Company’s CIP as of September 30, 2015 is as follow:
As of September 30, 2015 and December 31, 2014, the Company had CIP amounting to $56,525,652 and $58,510,051, respectively.
No interest expense has been capitalized for CIP at the end of September 30, 2015 and December 31, 2014, respectively.
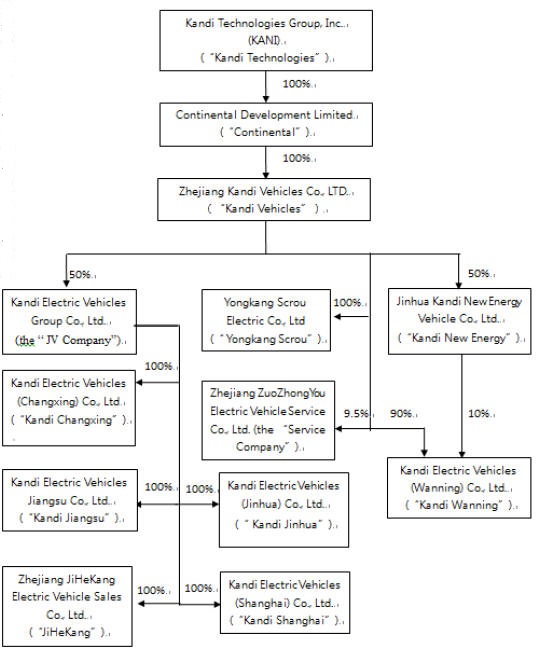
In August 2015, according to the agreement, the JV Company transferred 50% of the total 19% equity share of the Service Company to Shanghai Guorun and Kandi Vehicles respectively, thus Kandi Vehicles has directly own 9.5% of the Service Company. The total equity of the Service Company is $15,689,228, and the long term investment to the Service Company from Kandi Vehicles was 1,490,477 as at the end of September 30, 2015.
The interest expenses for the nine months ended September 30, 2015 and 2014 were $1,712,872 and $1,728,432, respectively. The interest expenses for the three months ended September 30, 2015 and 2014 were $528,285 and $558,806, respectively.
As of September 30, 2015, the aggregate amount of short-term loans that was guaranteed by various third parties was $12,237,597.
It is a common business practice among companies in the region of the PRC in which the Company is located to exchange guarantees for bank debts with no additional consideration given. It is considered a “favor for favor” business practice and is commonly required by Chinese lending banks, as in these cases.
By issuing bank notes payables rather than paying cash to suppliers, the Company can defer the payments until the date the bank notes payable are due. Simultaneously, the Company may need to deposit restricted cash in banks to back up the bank notes payable. The restricted cash deposited in banks will generate interest income.
A bank acceptance note is a promised future payment or time draft, which is accepted and guaranteed by a bank and drawn on a deposit at the bank. The banker's acceptance note specifies the amount of money, the date, and the person to which the payment is due.
After acceptance, the draft becomes an unconditional liability of the bank. But the holder of the draft can sell (exchange) it for cash at a discount to a buyer who is willing to wait until the maturity date for the funds in the deposit.
All of the bank acceptance notes do not bear interest, but are subject to bank charges of 0.05% of the principal as a commission on each transaction. Bank charges for notes payable were $6,585 and $6,498 for the nine months ended September 30, 2015 and 2014, respectively. Bank charges for notes payable were $1,616 and $0 for the three months ended September 30, 2015 and 2014, respectively.
No restricted cash was held as collateral for the notes payable as of September 30, 2015 and December 31, 2014.
NOTE 19 – BOND PAYABLE
On December 27, 2013, the Company issued a bond in the amount of RMB 80,000,000, or $13,000,731, to China Ever-bright Securities Co. Ltd. and CITIC Securities Company Limited. The term of this bond was 3 years, and the material terms of this bond were similar to the terms of the bond issued in 2012 and repaid in August 2013, except that the interest rate was reduced to 11.5%. Bond interest was payable on December 27 in each of 2014, 2015 and 2016. In October 2014, the Company repaid, without a prepayment penalty, all principal and interest to China Ever-bright Securities Co. Ltd. and CITIC Securities Company Limited. For the year ended December 31, 2014, $1,262,691 of interest expense was paid. There was no bond payable as of September 30, 2015 and December 31, 2014 respectively.
37
NOTE 20 – TAXES
(a) Corporation Income Tax
In accordance with the relevant tax laws and regulations of the PRC, applicable corporate income tax (“CIT”) rate is 25%. However, Kandi Vehicle is qualified as a high technology company in China and is entitled to pay income tax at a reduced rate of 15%. The applicable CIT rate of each of Kandi Vehicle's three subsidiaries, Kandi New Energy, Yongkang Scrou and Kandi Wanning, the JV Company and its subsidiaries and the Service Company is 25%.
The Company is qualified as a high technology company in China and is entitled to pay a reduced CIT rate of 15%. After combining with the research and development tax credit of 25% on certain qualified research and development expenses, the final effective reduced income tax rate is 37.16%. The combined tax benefits were 44.25%. The actual effective income tax rate was reduced from 25% to 13.94% at September 30, 2015.
According to the PRC CIT reporting system, the CIT sales cut-off base is concurrent with the value-added tax (“VAT”), which should be reported to the State Administration of Taxation (“SAT”) on a quarterly basis. Since the VAT and CIT are accounted for on a VAT tax basis that recorded all sales on a “State provided official invoices” reporting system, the Company is reporting the CIT according to the SAT prescribed tax reporting rules. Under the VAT tax reporting system, sales cut-off is not done on an accrual basis but rather on a VAT taxable reporting basis. Therefore, when the Company adopted U.S. GAAP using an accrual basis, the sales cut-off CIT timing (due to the VAT reporting system) created a temporary sales cut-off timing difference. This difference is reflected in the deferred tax assets or liabilities calculations on the income tax estimate reported in the Company’s annual report on Form 10-K.
Effective January 1, 2007, the Company adopted ASC 740,Income Taxes. The interpretation addresses the determination of whether tax benefits claimed or expected to be claimed on a tax return should be recorded in the financial statements.
Under ASC 740,Income Taxes, the Company may recognize the tax benefit from an uncertain tax position only if it is more likely than not that the tax position will be sustained on examination by the taxing authorities, based on the technical merits of the position. The tax benefits recognized in the financial statements from such a position should be measured based on the largest benefit that has a greater than fifty percent likelihood of being realized upon ultimate settlement. ASC 740 also provides guidance on de-recognition, classification, interest and penalties on income taxes, accounting in interim periods and requires increased disclosures.
38
As of September 30, 2015, the Company did not have a liability for unrecognized tax benefits. The Company files income tax returns with the U.S. Internal Revenue Services (“IRS”) and state tax authorities where the Company has operations. The Company is subject to U.S. federal or state income tax examinations by the IRS and relevant state tax authorities for years after 2006. During the periods open to examination, the Company has net operating loss carry forwards (“NOLs”) for U.S. federal and state tax purposes that have attributes from closed periods. Since these NOLs may be utilized in future periods, they remain subject to examination. The Company also files certain tax returns in China. As of September 30, 2015, the Company was not aware of any pending income tax examinations by U.S. or China tax authorities. The Company's policy is to record interest and penalties on uncertain tax provisions as income tax expense. As of September 30, 2015, the Company has no accrued interest or penalties related to uncertain tax positions. The Company has not recorded a provision for U.S. federal income tax for the three months or nine months ended September 30, 2015 due to the accumulated net operating loss carry forward from prior years in the United States.
Income tax expense for the nine months ended September 30, 2015 and 2014 is summarized as follows:
| | | For Nine Months Ended | |
| | | September 30, | |
| | | (Unaudited) | |
| | | 2015 | | | 2014 | |
| Current: | | | | | | |
| Provision for CIT | $ | 3,175,287 | | $ | 1,269,408 | |
| Provision for Federal Income Tax | | - | | | - | |
| Deferred: | | | | | | |
| Provision for CIT | | - | | | - | |
| Income tax expense | $ | 3,175,287 | | $ | 1,269,408 | |
39
The Company’s income tax expense differs from the “expected” tax expense for the nine months ended September 30, 2015 and 2014 (computed by applying the U.S. Federal Income Tax rate of 34% and PRC CIT rate of 25%, respectively, to income before income taxes) as follows:
| | | For Nine Months Ended | |
| | | September 30, | |
| | | (Unaudited) | |
| | | 2015 | | | 2014 | |
| | | | | | | |
| Computed “expected” expense | $ | (322,716 | ) | $ | 1,594,293 | |
| Favorable tax rate | | (880,016 | ) | | (368,675 | ) |
| Permanent differences | | 280,798 | | | (877,509 | ) |
| Valuation allowance | | 4,097,221 | | | 921,299 | |
| Income tax expense | $ | 3,175,287 | | $ | 1,269,408 | |
The tax effects of temporary differences that give rise to the Company’s net deferred tax assets and liabilities as of September 30, 2015 and December 31, 2014 are summarized as follows:
| | September 30‚
2015 | | | December 31‚
2014 | |
| | | (Unaudited) | | | | |
| Current portion: | | | | | | |
| Deferred tax assets (liabilities): | | | | | | |
| Expense | $ | 163,944 | | $ | (80,016 | ) |
| Subtotal | | 163,944 | | | (80,016 | ) |
| Deferred tax assets (liabilities): | | | | | | |
Sales cut-off difference derived from Value
Added Tax reporting system to calculate PRC
Corporation Income Tax in accordance with the
PRC State Administration of Taxation | | (329,933 | ) | | (26,226 | ) |
| Other | | (90,059 | ) | | (124,622 | ) |
| Subtotal | | (419,992 | ) | | (150,848 | ) |
| | | | | | | |
| Total deferred tax assets (liabilities) – current portion | | (256,049 | ) | | (230,864 | ) |
| | | | | | | |
| Non-current portion: | | | | | | |
| Deferred tax assets (liabilities): | | | | | | |
| Depreciation | | (402,934 | ) | | (551,697 | ) |
| Loss carried forward | | 4,097,221 | | | 3,025,997 | |
| Valuation allowance | | (4,097,221 | ) | | (3,025,997 | ) |
| Subtotal | | (402,934 | ) | | (551,697 | ) |
| | | | | | | |
| Deferred tax liabilities: | | | | | | |
| Accumulated other comprehensive gain | | - | | | (1,715,028 | ) |
| Subtotal | | - | | | (1,715,028 | ) |
| | | | | | | |
| Total deferred tax assets – non-current portion | | (402,934 | ) | | (2,266,725 | ) |
| | | | | | | |
| Net deferred tax assets (liabilities) | $ | (658,982 | ) | $ | (2,497,589 | ) |
40
(b) Tax Benefit (Holiday) Effect
For the nine months ended September 30, 2015 and 2014, the PRC CIT rate was 25%. Certain subsidiaries of the Company were entitled to tax benefit (holidays) for the nine months ended September 30, 2015 and 2014.
The combined effects of the income tax expense exemptions and reductions available to the Company for the three and nine months ended September 30, 2015 and 2014 were as follows:
41
| | | For Nine Months Ended | |
| | | September 30, | |
| | | (Unaudited) | |
| | 2015 | | | 2014 | |
| Tax benefit (holiday) credit | $ | 880,016 | | $ | 368,675 | |
| Basic net income per share effect | $ | 0.019 | | $ | 0.009 | |
NOTE 21 - STOCK OPTIONS AND WARRANTS
(a) Stock Options
On February 11, 2009, the Compensation Committee of the Board of Directors of the Company approved the grant of stock options to purchase 2,600,000 shares of common stock at an exercise price of $0.80 per share to ten of the Company’s employees and directors. The stock options vested ratably over three years and expire on the tenth anniversary of the grant date. The Company valued the stock options at $2,062,964 and amortized the stock compensation expense using the straight-line method over the service period from February 11, 2009 through February 11, 2012. The value of the options was estimated using the Black Scholes Model with an expected volatility of 164%, expected life of 10 years, risk-free interest rate of 2.76% and expected dividend yield of 0.00% . On June 30, 2011, one of the Company's directors resigned, and his 6,668 unexercised options were forfeited. As of December 31, 2013, options for 2,366,672 shares have been exercised and options for 6,668 shares have been forfeited. As of December 31, 2014, options for 2,593,332 shares had been exercised and options for 6,668 shares had been forfeited.
On October 6, 2009, the Company executed an agreement with Wang Rui and Li Qiwen, third-party consultants, whereby Mr. Wang and Mr. Li were to provide to the Company business development services in China in exchange for options to purchase 350,000 shares of the Company’s common stock at an exercise price of $1.50 per share. Per the agreement, options to purchase 250,000 shares vested and became exercisable on March 6, 2010, and options to purchase 100,000 shares vested and became exercisable on June 6, 2010. The options are issued under and subject to the terms of the Company’s 2008 Omnibus Long-Term Incentive Plan. As of December 31, 2014, options for 250,000 shares had been exercised and options for 100,000 shares had been forfeited due to the non-performance of services.
On May 29, 2015, the Compensation Committee of the Board of Directors of the Company approved the grant of stock options to purchase 4,900,000 shares of common stock at an exercise price of $9.72 per share to the Company’s senior staff. The stock options will vest ratably over three years and expire on the tenth anniversary of the grant date. The Company valued the stock options at $ 39,990,540 and will amortize the stock compensation expense using the straight-line method over the service period from May 29, 2015 through May 29, 2018. The value of the options was estimated using the Black Scholes Model with an expected volatility of 90%, expected life of 10 years, risk-free interest rate of 2.23% and expected dividend yield of 0.00% .
42
(b) Warrants
On June 26, 2013, the Company entered into a securities purchase agreement (the “2013 Securities Purchase Agreement”) with certain institutional investors (the “Third Round Investors”) that closed on July 1, 2013, pursuant to which the Company sold to the Third Round Investors, in a registered direct offering, an aggregate of 4,376,036 shares of the Company’s common stock at a negotiated purchase price of $6.03 per share. Under the 2013 Securities Purchase Agreement, the Third Round Investors also received Series A warrants for the purchase of up to 1,750,415 shares of the Company’s common stock at an exercise price of $7.24 per share and an option to make an additional investment in the form of Series B warrants and Series C warrants, Series B warrants to purchase a maximum aggregate of 728,936 shares of the Company’s common stock at an exercise price of $7.24 per share and Series C warrants to purchase a maximum aggregate of 291,574 shares of the Company’s common stock at an exercise price of $8.69 (the “Third Round Warrants”). In addition, the placement agent for this transaction also received warrants for the purchase of up to 262,562 shares of the Company’s common stock at an exercise price of $7.24 per share (the “Third Round Placement Agent Warrants”), which will expire on July 1, 2016, with a fair value of $0.53 per share. As of June 30, 2014, all the Third Round Warrants had been exercised on a cash basis.
On January 15, 2014, the Company sold to certain institutional investors warrants to purchase an aggregate of 1,429,393 shares of the Company’s common stock at an exercise price of $15 per share (the “January 2014 Warrants”)for a total purchase price of approximately $14,294. According to the warrant subscription agreement by and among the Company and the holders, the exercise price was reduced by a credit of $0.01, which reflected the price per warrant share paid in connection with the issuance of the January 2014 Warrants. Consequently, the effective exercise price per warrant share is $14.99. The January 2014 Warrants expired on January 30, 2015 and no investors exercised their warrants.
On March 19, 2014, the Company entered into a securities purchase agreement with certain purchasers (the “Fourth Round Investors”), pursuant to which the Company sold to the Fourth Round Investors, in a registered direct offering, an aggregate of 606,000 shares of common stock, at a negotiated purchase price of $18.24 per share, for aggregate gross proceeds to the Company of approximately $11,053,440, before deducting fees to the placement agent and other estimated offering expenses payable by the Company. As part of the transaction, the Fourth Round Investors also received warrants for the purchase of up to 90,900 shares of the Company’s common stock at an exercise price of $22.80 per share (the “Fourth Round Warrants”). In addition, the placement agent for this transaction also received warrants for the purchase of up to 36,360 shares of the Company’s common stock at an exercise price of $22.80 per share, which was adjusted to $9.72 on July 27, 2015. The Fourth Round Warrants have a term of eighteen months and are exercisable by the holders at any time after the date of issuance. On August 8, 2015, the Company extended the expiration date of these warrants from September 21, 2015 to January 20, 2016. As of September 30, 2015, the fair value of the Fourth Round Warrants was $0.44 per share.
43
On September 4, 2014, the Company entered in a securities purchase agreement with certain purchasers (the “Fifth Round Investors”), pursuant to which the Company sold to the Fifth Round Investors, in a registered direct offering, an aggregate of 4,127,908 shares of its common stock at a price of $17.20 per share, for aggregate gross proceeds to the Company of approximately $71 million, before deducting fees to the placement agent and other estimated offering expenses payable by the Company (the “Fifth Round Financing”). As part of the transaction, the Fifth Round Investors also received warrants for the purchase of up to 743,024 shares of the Company’s common stock at an exercise price of $21.50 per share (the “Fifth Round Warrants”), which was adjusted to $9.72 on July 27, 2015. The Fifth Round Warrants have a term of seventeen months and are exercisable by the holders at any time after the date of issuance. On August 8, 2015, the Company extended the expiration date of these warrants from February 4, 2016 to June 3, 2016. In addition, the placement agent for this transaction also received warrants for the purchase of up to 206,395 shares of the Company’s common stock at an exercise price of $20.64 per share. The placement agent’s warrants are exercisable for a term of seventeen months after the six months from the issuance. As of September 30, 2015, the fair value of the Fifth Round Warrants was $0.34 per share and the fair value of the Fifth Round Placement Agent Warrants was $0.46 per share.
In addition, any Fifth Round Investor that invested more than $30 million in the initial offering of shares and warrants in the Fifth Round Financing had an option to purchase its pro rata share of up to a $30 million of shares, or 1,744,186 shares of common stock, and its pro rata share of warrants to purchase an aggregate of up to 313,954 shares of the Company’s common stock at $17.20 for a period commencing on September 4, 2014 and ending on November 17, 2014. As of November 17, 2014, none of the Fifth Round Investors that invested more than $30 million in the initial offering of shares and warrants in the Fifth Round Financing exercised this option and such option expired.
44
NOTE 22 – STOCK AWARD
In connection with the appointment of Mr. Henry Yu as a member of the Board of Directors (the “Board”), and as compensation, the Board authorized the Company to provide Mr. Henry Yu with 5,000 shares of Company's restricted common stock every six months, beginning in July 2011.
As compensation for having Mr. Jerry Lewin to serve as a member of the Board, the Board authorized the Company to provide Mr. Jerry Lewin with 5,000 shares of Company's restricted common stock every six months, beginning in August 2011.
As compensation for having Ms. Kewa Luo to serve as the Company’s investor relation officer, the Board authorized the Company to provide Ms. Kewa Luo with 5,000 shares of Company's common stock every six months, beginning in September 2013.
As compensation for having Mr. Wei Chen serve as CEO assistant, the Board authorized the issuance by the Company to Mr. Chen 10,000 shares of Company’s common stock every year beginning in January 2012 ending December 31, 2013 and 2,500 shares of Company’s common stock every three months, beginning in January 2014 until May 30, 2014. As of June 1, 2014, Mr. Chen was no longer with the Company.
The fair value of stock awards based on service is determined based on the closing price of the common stock on the date the shares are granted. The compensation costs for awards of common stock are recognized over the requisite service period of six months.
On December 30, 2013, the Board approved a proposal (as submitted by the Compensation Committee) of an award for selected executives and other key employees comprising a total of 335,000 shares of common stock for each fiscal year, beginning with the 2013 fiscal year, under the Company’s 2008 Omnibus Long-Term Incentive Plan (the “Plan”), if the Company’s “Non-GAAP Net Income” for the current fiscal year increased by 10% comparing to that of the prior year. The specific number of shares of common stock to be issued in respect of such award could proportionally increase or decrease if the actual Non-GAAP Net Income increase is more or less than 10%. “Non-GAAP Net Income” means the Company’s net income for a particular year calculated in accordance with GAAP, excluding option-related expenses, stock award expenses, and the effects caused by the change of fair value of financial derivatives. For example, if Non-GAAP Net Income for the 2014 fiscal year increased by 10% compared to the Non-GAAP Net Income for the 2013 fiscal year, the selected executives and other key employees each would be granted his or her target amount of common stock of the Company. If Non-GAAP Net Income in 2014 is less than Non-GAAP Net Income in 2013, then no common stock would be granted. If Non-GAAP Net Income in 2014 increased compared to Non-GAAP Net Income in 2013 but the increase is less than 10%, then the target amount of the common stock grant would be proportionately decreased. If Non-GAAP Net Income in 2014 increased compared to Non- GAAP Net Income in 2013 but the increase is more than 10%, then the target amount of the common stock grant would be proportionately increased up to 200% of the target amount. Any such increase in the grant would be subject to the total number of shares available under the Plan, and the Company’s Board and shareholders will need to approve an increase in the number of shares reserved under the Plan if the number of shares originally reserved is used up. On May 20, 2015, the shareholders of the Company approved an increase of 9,000,000 shares under the Plan at its annual meeting. The fair value of each award granted under the Plan is determined based on the closing price of the Company’s stock on the date of grant of the award. To the extent that the performance goal is not met and so no shares become due, no compensation cost is recognized and any recognized compensation cost during the applicable year is reversed. The number of shares of common stock granted under the Plan with respect to fiscal 2014 would be 670,000 shares based on the Non-GAAP Net Income of the year of 2014. The compensation expense is recognized in General and Administrative Expenses. On April 17, 2015 and June 12, 2015, the Company granted 550,000 shares and 120,000 shares, respectively, to the senior management and key employee as year 2014 performance awards.
45
NOTE 23 – INTANGIBLE ASSETS
The following table provides the gross carrying value and accumulated amortization for each major class of intangible assets other than goodwill:
| | Remaining
useful
life | | | September 30,
2015 | | | December 31,
2014 | |
| Gross carrying amount: | | | | | | | | | |
| Trade name | | 6.25 years | | $ | 492,235 | | $ | 492,235 | |
| Customer relations | | 6.25 years | | | 304,086 | | | 304,086 | |
| | | | | | 796,321 | | | 796,321 | |
| Less : Accumulated amortization | | | | | | | | | |
| Trade name | | | | $ | (173,382 | ) | $ | (135,323 | ) |
| Customer relations | | | | | (107,109 | ) | | (83,597 | ) |
| | | | | | (280,491 | ) | | (218,920 | ) |
| Intangible assets, net | | | | $ | 515,830 | | $ | 577,401 | |
46
The aggregate amortization expense for those intangible assets that continue to be amortized is reflected in amortization of intangible assets in the consolidated statements of income and comprehensive income was both $20,524 for the three-months ended September 30, 2015 and 2014, respectively, and both $61,571 for the nine-month period ended September 30, 2015 and 2014, respectively.
Amortization expense for the next five years and thereafter is as follows:
| 2015 (three months) | $ | 20,524 | |
| 2016 | | 82,095 | |
| 2017 | | 82,095 | |
| 2018 | | 82,095 | |
| 2019 | | 82,095 | |
| Thereafter | | 166,926 | |
| Total | $ | 515,830 | |
NOTE 24 – SUMMARIZED INFORMATION OF EQUITY METHOD INVESTMENT IN THE JV COMPANY
The Company’s consolidated net income includes the Company’s proportionate share of the net income or loss of the Company’s equity method investees. When the Company records its proportionate share of net income, it increases equity income (loss) – net in the Company’s consolidated statements of income and the Company’s carrying value in that investment. Conversely, when the Company records its proportionate share of a net loss, it decreases equity income (loss) – net in the Company’s consolidated statements of income and the Company’s carrying value in that investment. All intra-entity profits and losses with the Company’s equity method investees have been eliminated.
47
Kandi Electric Vehicles Group Co., Ltd. (the “JV Company”)
In March 2013, pursuant to a joint venture agreement (the “JV Agreement”) entered into between Kandi Vehicles and Shanghai Maple Guorun Automobile Co., Ltd. (“Shanghai Guorun”), a 99%-owned subsidiary of Geely Automobile Holdings Ltd. (“Geely”), the parties established Zhejiang Kandi Electric Vehicles Co., Ltd. (the “JV Company”) to develop, manufacture and sell electric vehicles (“EVs”) and related auto parts. Each of Kandi Vehicles and Shanghai Guorun has a 50% ownership interest in the JV Company. In the fourth quarter of 2013, Kandi Vehicles entered into an ownership transfer agreement with the JV Company pursuant to which Kandi Vehicles transferred 100% of its ownership in Kandi Changxing to the JV Company. As a result, the Company indirectly has a 50% economic interest in Kandi Changxing through its 50% ownership interest in the JV Company after this transfer. In November 2013, Zhejiang Kandi Electric Vehicles Jinhua Co., Ltd. (“Kandi Jinhua”) was formed by the JV Company. The JV Company has 100% ownership interest in Kandi Jinhua, and the Company, indirectly through its 50% ownership interest in the JV Company, has a 50% economic interest in Kandi Jinhua. In November 2013, Zhejiang JiHeKang Electric Vehicle Sales Co., Ltd. (“JiHeKang”) was formed by the JV Company. The JV Company has 100% ownership interest in JiHeKang, and the Company, indirectly through its 50% ownership interest in the JV Company, has a 50% economic interest in JiHeKang. In December 2013, the JV Company entered into an ownership transfer agreement with Shanghai Guorun pursuant to which the JV Company acquired 100% ownership of Kandi Electric Vehicles (Shanghai) Co., Ltd. (“Kandi Shanghai”). As a result, Kandi Shanghai is a wholly-owned subsidiary of the JV Company, and the Company, indirectly through its 50% ownership interest in the JV Company, has a 50% economic interest in Kandi Shanghai. In January 2014, Zhejiang Kandi Electric Vehicles Jiangsu Co., Ltd. (“Kandi Jiangsu”) was formed by the JV Company. The JV Company has 100% ownership interest in Kandi Jiangsu, and the Company, indirectly through its 50% ownership interest in the JV Company, has a 50% economic interest in Kandi Jiangsu. In addition, In July 2013, Zhejiang ZuoZhongYou Electric Vehicle Service Co., Ltd. (the “Service Company”) was formed. The JV Company has a 19% ownership interest in the Service Company. In March 2014, the JV Company changed its name to Kandi Electric Vehicles Group Co., Ltd. In August 2015, the JV Company transferred its shares of the Service Company to Shanghai Guorun and Kandi Vehicles for 9.5% respectively. As the result, the JV Company no longer has any ownership of the Service Company since the transfer.
48
As of September 30, 2015, the JV Company consolidated the following entities on its financial statements: (1) 100% interest in Kandi Changxing; (2) 100% interest in Kandi Jinhua; (3) 100% interest in JiHeKang; (4) 100% interest in Kandi Shanghai; and (5) 100% interest in Kandi Jiangsu.
The Company accounted for its investments in the JV Company under the equity method of accounting as the Company has a 50% ownership interest in the JV Company. Therefore, the Company’s consolidated net income for the three months and nine months ended September 30, 2015, included equity income from the JV Company during such periods.
The combined results of operations and financial position of the JV Company are summarized below:
| | | Three months ended | |
| | | September 30, | |
| | | 2015 | | | 2014 | |
| Condensed income statement information: | | | | | | |
| Net sales | $ | 98,447,939 | | $ | 46,847,556 | |
| Gross income | | 13,325,271 | | | 7,025,415 | |
| % of net sales | | 13.5% | | | 15.0% | |
| Net income | | 1,611,658 | | | 4,398,828 | |
| % of net sales | | 1.6% | | | 9.4% | |
| Company’s equity in net income of JV | $ | 805,829 | | $ | 2,199,414 | |
| | | Nine months ended | |
| | | September 30, | |
| | | 2015 | | | 2014 | |
| Condensed income statement information: | | | | | | |
| Net sales | $ | 197,965,282 | | $ | 126,763,793 | |
| Gross income | | 31,958,679 | | | 13,944,898 | |
| % of net sales | | 16.1% | | | 11.0% | |
| Net income | | 4,000,781 | | | 6,782,272 | |
| % of net sales | | 2.0% | | | 5.4% | |
| Company’s equity in net income of JV | $ | 2,000,390 | | $ | 3,391,136 | |
49
| | | September 30, | | | December 31, | |
| | | 2015 | | | 2014 | |
| Condensed balance sheet information: | | | | | | |
| Current assets | $ | 308,146,994 | | $ | 262,543,256 | |
| Noncurrent assets | | 187,581,237 | | | 194,229,114 | |
| Total assets | $ | 495,728,231 | | $ | 456,772,370 | |
| Current liabilities | | 310,842,828 | | | 280,779,432 | |
| Noncurrent liabilities | | 19,787,767 | | | 9,006,787 | |
| Equity | | 165,097,636 | | | 166,986,151 | |
| Total liabilities and equity | $ | 495,728,231 | | $ | 456,772,370 | |
During the nine months ended September 30, 2015, 100% of the JV Company’s revenues were derived from the sales of EV products in the PRC with a total of 12,120 units sold, 3,647 units of which were direct sales through the distribution company, or JiHeKang, and the rest were sold to Micro Public Transportation Program (“MTP”,or the “EV-Share” Program). As the Company only has a 50% ownership interest in the JV Company and accounted for its investments in the JV Company under the equity method of accounting, the Company didn’t consolidate the JV Company’s financial results but included equity income from the JV Company during such periods.
50
Note: The following table illustrates the captions used in the Company’s Income Statements for its equity basis investments in the JV Company.
Changes in the Company’s equity method investment in JV Company for the nine months ended September 30, 2015 and 2014 were as follows:
| | | Nine months ended | |
| | | September 30, | |
| | | 2015 | | | 2014 | |
| Investment in JV Company, beginning of the period, | $ | 83,309,095 | | $ | 79,331,930 | |
| Share of profit | | 2,000,390 | | | 3,391,136 | |
| Intercompany transaction elimination | | (283,267 | ) | | (544,941 | ) |
| Year 2014 unrealized profit realized | | 183,005 | | | 911,023 | |
| Exchange difference | | (2,935,339 | ) | | (544,772 | ) |
| Investment in JV Company, end of the period | $ | 82,273,884 | | $ | 82,544,376 | |
Sales to the Company’s customers, the JV Company and its subsidiaries, for the three months ended September 30, 2015, were $31,888,768, and they were primarily the sales of battery packs, body parts, EV drive motors, EV controllers, air conditioning units and other auto parts, of which the majority of sales were to the JV Company amounted to $19,593,174, Kandi Changxing amounted to $7,245,341and Kandi Shanghai amounted to $ 5,061,218. These EV parts were used in manufacturing of pure EV products by the JV Company’s subsidiaries to sell entirely to the JV Company’s customer via Zhejiang Geely Automobile Company Limited (“Zhejiang Geely”). Zhejiang Geely holds the country’s vehicle production rights, equivalent to license, for sedans, which qualifies it to sell the EV products to the end customers. Zhejiang Geely is 90% owned by Zhejiang Geely Holding Group Company Limited and 10% owned by Zhejiang Maple Asset Management Co. Ltd. According to the JV Agreement, before the JV Company received vehicle production rights (license), the JV Company and its subsidiaries all may sell their products through the channel of Zhejiang Geely’s vehicle production rights (license) to the end customers or the Service Company, which purchased and used the cars in Hangzhou Micro Public Transportation project and group long-term lease project. With the total sales to the JV Company and its subsidiaries, approximately 85% for the nine months ended September 30, 2015 and approximately 79% for the three months ended September 30, 2015 of the total sales were related to the sales of battery packs because Kandi New Energy holds a production rights (license) to manufacture requisite battery packs used in manufacturing of Kandi brand’s EVs. Under the JV Agreement, the Company’s EV product manufacturing business has been completely transferred to the JV Company. The Company is mainly responsible for supplying the JV Company with EV parts and the JV Company is responsible for producing EV products and for selling finished goods through channels to its end customers.
51
As of September 30, 2015 and December 31, 2014, the amount due from the JV Company, net was $76,814,162 and $51,450,612, respectively, of which the majority was the balances with Kandi Jinhua, Kandi Changxing, Kandi Shanghai. The breakdown was as below:
| | | September 30, | | | December 31, | |
| | | 2015 | | | 2014 | |
| | | | | | | |
| Kandi Shanghai | $ | 20,274,877 | | $ | 6,978,618 | |
| Kandi Changxing | | 2,662,919 | | | 7,359,202 | |
| Kandi Jinhua | | 7,249,376 | | | 12,736,420 | |
| JV Company | | 46,626,990 | | | 24,376,372 | |
| Consolidated JV Company | $ | 76,814,162 | | $ | 51,450,612 | |
52
Within the receivables from the JV Company, the $23,533,842 was a one-year entrusted loan that Kandi Vehicle lent to the JV Company from December 16, 2014 to December 15, 2015 carrying an annual interest rate determined by using the People's Bank of China floating benchmark lending rate on the date of withdraw plus 5% of that rate. The rate will not be adjusted after the withdraw during the lending period, which was 5.88% . The loan was organized by Bank of Communications Hangzhou Zhongan Branch as the agent bank between Kandi Vehicle and the JV Company. Entrusted loans are commonly found in China, where direct borrowing and lending between commercial enterprises are restricted.
NOTE 25 – COMMITMENTS AND CONTINGENCIES
Guarantees and Pledged collateral for third party bank loans
As of September 30, 2015 and December 31, 2014, the Company provided guarantees for the following third parties:
(1) Guarantees for bank loans
| | September 30, | | | December31, | |
| Guarantee provided to | | 2015 | | | 2014 | |
| Zhejiang Kangli Metal Manufacturing Company. | $ | - | | $ | 4,875,274 | |
| Zhejiang Shuguang industrial Co., Ltd. | | 4,549,876 | | | 4,875,274 | |
| Nanlong Group Co., Ltd. | | 3,137,846 | | | 9,750,548 | |
| Total | $ | 7,687,722 | | $ | 19,501,096 | |
On September 29, 2015, the Company entered into a guarantee contract to serve as the guarantor for the bank loan borrowed from Ping An Bank in the amount of $4,549,876 by Zhejiang Shuguang Industrial Co., Ltd. (“ZSICL”) for the period from September 29, 2015 to September 28, 2016. ZSICL is not related to the Company. Under these guarantee contracts, the Company agrees to perform all obligations of ZSICL under the loan contracts if ZSICL fails to perform its obligations as set forth therein.
On March 15, 2013, the Company entered into a guarantee contract to serve as the guarantor for the bank loans borrowed from Shanghai Pudong Development Bank Jinhua Branch in the amount for the total amount $3,137,846 by Nanlong Group Co., Ltd. (“NGCL”) for the period from March 15, 2013 to March 15, 2016. NGCL is not related to the Company. Under this guarantee contract, the Company agrees to perform all obligations of NGCL under the loan contract if NGCL fails to perform its obligations as set forth therein.
53
(2) Pledged collateral for third parties’ bank loans
As of September 30, 2015 and December 31, 2014, none of the Company’s land use rights or plant and equipment were pledged as collateral securing bank loans to third parties.
NOTE 26 –SEGMENT REPORTING
The Company has only one single operating segment. The Company’s revenue and long-lived assets are primarily derived from and located in the PRC. The Company only has operations in the PRC.
The following table sets forth revenues by geographic area for the nine months ended September 30, 2015 and 2014, respectively:
| | | Nine Months Ended September 30, | |
| | | 2015 | | | 2014 | |
| | | Sales Revenue | | | Percentage | | | Sales Revenue | | | Percentage | |
| Overseas | $ | 3,380,570 | | | 2% | | $ | 6,005,588 | | | 5% | |
| China | | 138,892,521 | | | 98% | | | 111,332,763 | | | 95% | |
| Total | $ | 142,273,091 | | | 100% | | $ | 117,338,351 | | | 100% | |
54
The following table sets forth revenues by geographic area for the three months ended September 30, 2015 and 2014, respectively:
| | | Three Months Ended September 30, | |
| | | 2015 | | | 2014 | |
| | | Sales Revenue | | | Percentage | | | Sales Revenue | | | Percentage | |
| Overseas | $ | 1,436,398 | | | 3% | | $ | 2,650,592 | | | 6% | |
| China | | 49,092,147 | | | 97% | | | 41,556,400 | | | 94% | |
| Total | $ | 50,528,545 | | | 100% | | $ | 44,206,992 | | | 100% | |
55
| Item 2. | Management’s Discussion and Analysis of Financial Condition and Results of Operations. |
This report contains forward-looking statements within the meaning of the federal securities laws that relate to future events or our future financial performance. In some cases, you can identify forward-looking statements by terminology, such as “may,” “will,” “should,” “could,” “expect,” “plan,” “anticipate,” “believe,” “estimate,” “project,” “predict,” “intend,” “potential” or “continue” or the negative of such terms or other comparable terminology, although not all forward-looking statements contain such terms.
In addition, these forward-looking statements include, but are not limited to, statements regarding implementing our business strategy; development and marketing of our products; our estimates of future revenue and profitability; our expectations regarding future expenses, including research and development, sales and marketing, manufacturing and general and administrative expenses; difficulty or inability to raise additional financing, if needed, on terms acceptable to us; our estimates regarding our capital requirements and our needs for additional financing; attracting and retaining customers and employees; sources of revenue and anticipated revenue; and competition in our market.
Forward-looking statements are only predictions. Although we believe that the expectations reflected in these forward-looking statements are reasonable, we cannot guarantee future results, levels of activity, performance or achievements. All of our forward-looking information is subject to risks and uncertainties that could cause actual results to differ materially from the results expected. Although it is not possible to identify all factors, these risks and uncertainties include the risk factors and the timing of any of those risk factors described in our Annual Report on Form 10-K for the year ended December 31, 2014 and those set forth from time to time in our other filings with the Securities and Exchange Commission (“SEC”). These documents are available on the SEC’s Electronic Data Gathering and Analysis Retrieval System at http://www.sec.gov.
Critical Accounting Policies and Estimates
This section should be read together with the Summary of Significant Accounting Policies in the attached condensed consolidated financial statements included in this report.
56
Policy affecting options and warrants
Our stock option cost is recorded in accordance with ASC 718,Compensation — Stock Compensation, and ASC 505,Equity. The fair value of stock options is estimated using the Black-Scholes-Merton model. Our expected volatility assumption is based on the historical volatility of our common stock. The expected life assumption is primarily based on the expiration date of the option. The risk-free interest rate for the expected term of the option is based on the U.S. Treasury yield curve in effect at the time of grant. Stock option expense recognition is based on awards expected to vest. There were no estimated forfeitures. ASC standards require forfeitures to be estimated at the time of grant and revised in subsequent periods, if necessary, if actual forfeitures differ from those estimates.
Our warrant costs are recorded in liabilities and equities, respectively, in accordance with ASC 480,Distinguishing Liabilities From Equity, ASC 505,Equity, and ASC 815,Derivatives and Hedging. The fair value of a warrant, which is classified as a liability, is estimated using the Black-Scholes-Merton model and the lattice valuation model. Our expected volatility assumption is based on the historical volatility of our common stock. The expected life assumption is primarily based on the expiration date of the warrant. The risk-free interest rate for the expected term of the warrant is based on the U.S. Treasury yield curve in effect at the time of measurement. The warrants, which are freestanding derivatives classified as liabilities on the balance sheet, are measured at fair value on each reporting date, with decreases in fair value recognized in earnings and increases in fair values recognized in expenses.
The fair value of equity-based warrants, which are not considered derivatives under ASC 815, is estimated using the Black-Scholes-Merton model. Our expected volatility assumption is based on the historical volatility of our common stock. The expected life assumption is primarily based on the expiration date of the warrant. The risk-free interest rate for the expected term of the option is based on the U.S. Treasury yield curve in effect at the time of grant.
Estimates affecting accounts receivable and inventories
The preparation of our consolidated financial statements requires management to make estimates and assumptions that affect our reporting of assets and liabilities (and contingent assets and liabilities). These estimates are particularly significant where they affect the reported net realizable value of our accounts receivable and inventories.
Accounts receivable are recognized and carried at net realizable value. An allowance for doubtful accounts is recorded in the period when a loss is probable based on an assessment of specific factors, such as troubled collection, historical experience, accounts aging, ongoing business relations and other factors. Accounts are written off after exhaustive efforts at collection. If accounts receivable are to be provided for, or written off, they would be recognized in the consolidated statement of operations within operating expenses. As of September 30, 2015 and December 31, 2014, we recorded no allowance for doubtful accounts. This determination was made per our management’s judgment, which was based on their best knowledge.
57
Inventory is stated at the lower of cost, determined on a weighted average basis, or net realizable value. Net realizable value is the estimated selling price in the ordinary course of business less the estimated cost of completion and the estimated costs necessary to make the sale. Adjustments to reduce the cost of inventory to its net realizable value are made, if required, for estimated excess, obsolescence, or impaired balances. When inventories are sold, their carrying amount is charged to expense in the year in which the revenue is recognized.
Write-downs for declines in net realizable value or for losses of inventories are recognized as an expense in the year the impairment or loss occurs.
Although we believe that there is little likelihood that actual results will differ materially from current estimates, if customer demand for our products decreases significantly in the near future, or if the financial condition of our customers deteriorates in the near future, we could realize significant write downs for slow-moving inventories or uncollectible accounts receivable.
Revenue Recognition
Our revenue recognition policy plays a key role in our consolidated financial statements. Revenues represent the invoiced value of goods sold, recognized upon the shipment of goods to customers, and revenues are recognized when all of the following criteria are met:
Persuasive evidence of an arrangement exists; delivery has occurred or services have been rendered; the seller’s price to the buyer is fixed or determinable; and collectability is reasonably assured.
The revenue recognition policies for our products, including EVs, EV parts and Off-road vehicles, are the same: When the products are delivered, the associated risk of loss is deemed transferred, and at that time we recognize revenues.
58
Warranty Liability
Most of our non-EV products (the “Legacy Products”) are exported out of China to foreign countries that have legal and regulatory requirements with which we are not familiar. Development of warranty policies for our Legacy Products in each of these countries would be virtually impossible and prohibitively expensive. Therefore, we provide price incentives and free parts to our customers and in exchange, our customers establish appropriate warranty policies and assume warranty responsibilities. Consequently, warranty issues are taken into consideration during the price negotiation for our products. The free parts are delivered along with the products, and when products are sold, the related parts are recorded as cost of goods sold. Due to the reliable quality of our products, we have been able to maintain this warranty policy and we have not had any product liabilities attributed to the quality of our products.
For the EV products that we sold before year 2015 in China, there is a three-year or 50,000 kilometer manufacturer warranty. This warranty affects us through our participation and investment in the JV Company, which manufactures the EV products.
Results of Operations
Comparison of Three Months Ended September 30, 2015 and 2014
The following table sets forth the amounts and percentage relationship to revenue of certain items in our condensed consolidated statements of income (loss) and comprehensive income (loss) for the three months ended September 30, 2015 and 2014.
| | | Three Months Ended | |
| | Sep 30, 2015 | | | % of Revenue | | | Sep 30, 2014 | | | % of Revenue | | | Change in Amount | | | Change in % | |
| | | | | | | | | | | | | | | | | | | |
| REVENUES,NET | $ | 50,528,545 | | | | | $ | 44,206,992 | | | | | | 6,321,553 | | | 14.3% | |
| | | | | | | | | | | | | | | | | | | |
| COST OF GOODS SOLD | | 43,411,839 | | | 85.9% | | | 38,698,452 | | | 87.5% | | | 4,713,387 | | | 12.2% | |
| | | | | | | | | | | | | | | | | | | |
| GROSS PROFIT | | 7,116,70 6 | | | 14.1% | | | 5,508,540 | | | 12.5% | | | 1,608,166 | | | 29.2% | |
| | | | | | | | | | | | | | | | | | | |
| OPERATING EXPENSES: | | | | | | | | | | | | | | | | | | |
| | | | | | | | | | | | | | | | | | | |
| Research and development | | 785,450 | | | 1.6% | | | 391,097 | | | 0.9% | | | 394,353 | | | 100.8 % | |
| | | | | | | | | | | | | | | | | | | |
| Selling and marketing | | 122,873 | | | 0.2% | | | 432,365 | | | 1.0% | | | (309,492 | ) | | -71.6 % | |
| | | | | | | | | | | | | | | | | | | |
| General and administrative | | 8,649,541 | | | 17.1% | | | 2,076,749 | | | 4.7% | | | 6,572,792 | | | 316.5 % | |
| | | | | | | | | | | | | | | | | | | |
| Total OperatingExpenses | | 9,557,864 | | | 18.9% | | | 2,900,211 | | | 6.6% | | | 6,657,653 | | | 229.6 % | |
| | | | | | | | | | | | | | | | | | | |
| INCOME(LOSS) FROMOPERATIONS | | (2,441,158 | ) | | -4.8% | | | 2,608,329 | | | 5.9% | | | (5,049,487 | ) | | -193. 6% | |
| | | | | | | | | | | | | | | | | | | |
| OTHERINCOME(EXPENSE): | | | | | | | | | | | | | | | | | | |
| | | | | | | | | | | | | | | | | | | |
| Interest income | | 1,140,756 | | | 2.3% | | | 220,911 | | | 0.5% | | | 919,845 | | | 416.4 % | |
| | | | | | | | | | | | | | | | | | | |
| Interest (expense) | | (534,987 | ) | | -1.1% | | | (932,030 | ) | | -2.1% | | | 397,043 | | | -42.6 % | |
| | | | | | | | | | | | | | | | | | | |
| Change in fair value of financial instruments | | 3,049,242 | | | 6.0% | | | 10,187,277 | | | 23.0% | | | (7,138,035 | ) | | -70.1% | |
| | | | | | | | | | | | | | | | | | | |
| Government grants | | (724 | ) | | 0.0% | | | 63,584 | | | 0.1% | | | (64,308 | ) | | -101.1% | |
| | | | | | | | | | | | | | | | | | | |
| Share of (loss) in associated companies | | - | | | 0.0% | | | 38,702 | | | 0.1% | | | (38,702 | ) | | -100.0% | |
| | | | | | | | | | | | | | | | | | | |
| Share of profit after tax of JV | | 1,179,605 | | | 2.3% | | | 2,038,388 | | | 4.6% | | | (858,783 | ) | | -42.1% | |
| | | | | | | | | | | | | | | | | | | |
| Other income, net | | 988,224 | | | 2.0% | | | 21,814 | | | 0.0% | | | 966,410 | | | 4430.2% | |
| | | | | | | | | | | | | | | | | | | |
| Total otherincome(expense),net | | 5,822,116 | | | 11.5% | | | 11,638,646 | | | 26.3% | | | (5,816,530 | ) | | -50.0% | |
| | | | | | | | | | | | | | | | | | | |
| INCOME BEFORE INCOMETAXES | | 3,380,958 | | | 6.7% | | | 14,246,975 | | | 32.2% | | | (10,866 ,017 | ) | | -76.3% | |
| | | | | | | | | | | | | | | | | | | |
| INCOME TAX EXPENSE | | (1,037,763 | ) | | -2.1% | | | (713,273 | ) | | -1.6% | | | (324,490 | ) | | 45.5% | |
| | | | | | | | | | | | | | | | | | | |
| NET INCOME | | 2,343,195 | | | 4.6% | | | 13,533,702 | | | 30.6% | | | (11,190,507 | ) | | -82.7% | |
59
(a) Revenue
For the three months ended September 30, 2015, our revenue was $50,528,545 compared to $44,206,992 for the same period of 2014, an increase of $6,321,553 or 14.3% . The increase in revenue was mainly due to the increase in EV parts sales during this period. The majority of the EV parts sales was battery sales.
The following table summarizes our revenues as well as the number of units sold by product types for the three months ended September 30, 2015 and 2014:
| | | Three Month Ended September 30 | |
| | | 2015 | | | 2014 | |
| | | Unit | | | Sales | | | Unit | | | Sales | |
| EV parts | | 32,472 | | $ | 48,955,421 | | | 29,721 | | $ | 36,077,085 | |
| EV products | | 0 | | | 0 | | | 135 | | | 741,109 | |
| Off-road vehicles | | 2,364 | | | 1,573,124 | | | 9,187 | | | 7,388,798 | |
| Total | | 34,836 | | $ | 50,528,545 | | | 39,043 | | $ | 44,206,992 | |
60
EV Parts
Among our total revenues during the three months ended September 30, 2015, approximately $48,955,421 or 96.9% resulted from the sale of EV parts. We started the EV parts business in 2014, and our revenue of EV parts increased $12,878,336 or 35.7%, compared to the same period of 2014. Our EV parts sales primarily consisted of the sales of battery packs, body parts, EV drive motors, EV controllers, air conditioning units and other auto parts to the JV Company for manufacturing of EV products.
EV Products
Among our total revenues during the three months ended September 30, 2015, there was no EV products sales. The EV products revenue decreased $741,109, or 100% compared to the same period of 2014 because the manufacture of EV products was transferred to the JV Company based on the JV Agreement. Under the JV Agreement with our joint venture partner, Shanghai Maple Guorun Automobile Co., Ltd., since March 2013, our EV products manufacturing business has been gradually transferred to the JV Company, such transfer was completed at the end of 2014. We are now primarily responsible for supplying the JV Company with EV parts and the JV Company is primarily responsible for the production of EV products.
Off-Road Vehicles
Among our total revenues during the three months ended September 30, 2015, approximately $1,573,124 or 3.1%, resulted from the sale of off-road vehicles. The off-road vehicles revenue decreased $5,815,674, or 78.7% compared to the same period of 2014, mainly because the Company now focused on the EV parts production, which is in line with the long-term strategy of the Company.
(b) Cost of goods sold
Cost of goods sold was $43,411,839 during the three months ended September 30, 2015, representing an increase of $4,713,387, or 12.2%, compared to the same period of 2014. This increase was mainly due to the increase in corresponding sales. Please also refer to below (c) for the details cost by products.
61
(c) Gross profit
Gross profit for the third three months of 2015 increased $1,608,166 or 29.2% to $7,116,706, compared to $5,508,540 for the same period last year. Margin by product is as below:
| | | Three Months Ended September 30 | |
| | 2015 | | | 2014 | |
| | Sales | | | Cost | | | Gross Profit | | | Margin % | | | Sales | | | Cost | | | Gross Profit | | | Margin % | |
| EV parts | $ | 48,955,421 | | | 41,980,345 | | | 6,975,076 | | | 14.2% | | $ | 36,077,085 | | | 32,637,313 | | | 3,439,772 | | | 9.5% | |
| EV products | | - | | | - | | | - | | | | | | 741,109 | | | 509,187 | | | 231,92 2 | | | 31.3% | |
| Off-ro ad vehicles | | 1,573,1 24 | | | 1,431,494 | | | 141,63 0 | | | 9.0% | | | 7,388,7 98 | | | 5,551,952 | | | 1,836,846 | | | 24.9% | |
| Total | $ | 50,528,545 | | | 43,411,839 | | | 7,116,706 | | | 14.1% | | $ | 44,206,992 | | | 38,698,452 | | | 5,508,540 | | | 12.5% | |
The overall margin increased from 12.5% of the third three months of 2014 to 14.1% of the same period of 2015, which was due to the cost control and the scaled production for EV parts while offset by the impact of zero EV products sales and the decrease of off-road vehicles sales.
(d) Selling and distribution expenses
Selling and distribution expenses were $122,873 for the third three months of 2015, compared to $432,365 for the same period last year, a decrease of $309,492 or 71.6% .
This decrease was primarily due to the decrease of contractual maintenance and repair expense of $ 262,868 since we don’t have EV products sales starting year 2015.
(e) General and administrative expenses
General and administrative expenses were $8,649,541 for the third three months of 2015, compared to $2,076,749 for the same period of last year, an increase of $6,572,792 or 316.5% . For the three months ended September 30, 2015, general and administrative expenses included $7,028,089 in expenses for common stock awards and stock options to employees and consultants, compared to $2,024,550 for the same period in 2014. Excluding stock award costs, our net general and administrative expenses for the three months ended September 30, 2015 were $1,621,452, an increase of $1,569,253, from $52,199 for the same period of 2014. The increase was primarily due to an office expense adjustment of $886,845 in the third quarter of 2014, and also the legal expense of $460,174.
62
(f) Research and development
Research and development expenses were $785,450 for the third three months of 2015, an increase of $394,353 or 100.8% compared to $391,097 for the same period of last year. This increase was primarily due to the increase of $445,454 on the material spending for battery pack research and development in the third quarter of 2015.
(g) Government grants
Government grants were $-724(due to the change resulting from the RMB depreciation against the US dollars) for the third three months of 2015, a decrease of $64,308 compared to $63,584 for the same period of last year.
The government grants are project based. There was no government grants in the third quarter of 2015.
(h) Interest income
Interest income was $1,140,756 for the third three months ended September 30, 2015, an increase of $919,845 compared to $220,911for the same period of last year. This change was primarily attributable to an increase in interest income earned $350,835 on an entrusted loans made to the JV Company starting from December 16, 2014 and also the deposit interest income $426,749.
(i) Interest expense
Interest expense was $534,987 for the third three months of 2015, a decrease of $397,043 compared to $932,030 for the same period of last year. This change was due to the interest expense of a bond for $371,789 in the same period last year.
(j) Change in fair value of financial instruments
For the third three months of 2015, the gain related to changes in the fair value of derivative liability relating to the warrants issued to the investors and a placement agent was $3,049,242, a decrease of $7,138,035 compared to the same period of last year. The decrease was due to the change on the fair value valuation of warrants during the period.
63
(k) Share of (loss) of associated company
Investment gains were $0 for the third three months of 2015, a negative change of $38,702 compared to the same period of last year, primarily due to the loss of our investment in Jinhua Service as this entity was dissolved in the third quarter of 2014.
(l) Share of profit (loss) after tax of the JV Company
For the three months ended September 30, 2015, the JV Company’s net sales was $98,447,939, gross profit was $ 13,325,272i, and net profit was $1,611,658. We accounted for our investments in the JV Company under the equity method of accounting as we have a 50% ownership interest in the JV Company. As a result, we recorded 50% of the JV Company’s profit for $805,829 for the third quarter of 2015. After eliminating intra-entity profits and losses, our share of the after tax profit of the JV Company was $1,179,605 for the three months ended September 2015, a decrease of $858,783 compared to the same period of last year. The decrease of the JV Company’s profits were primarily due to: 1) the significant interest expense occurred for the increased bank loan for operating needs, 2) the increased operating expenses incurred compared to the same period last year, which were for the JV Company’s future business growth 3) the lower product margin due to the lower selling price to a strategic client in the third quarter of 2015.
During the third quarter of 2015, a total of 6,004 units of EV products were sold by the JV Company, an increase of 207.9% compared to 1,950 units sold in the same period of 2014.
(m) Other income, net
Net other income was $988,224 for the third three months of 2015, an increase of $966,410 or 4430.2% compared to the same period of last year, which was primarily due to a technology transfer income from the Company to the JV Company for $884,486 in the third quarter of 2015.
(n) Net income from continuing operation
Net income was $2,343,195 for the third three months of 2015, a decrease of $11,190,507 or 82.7% compared to $13,533,702 for the same period of last year. The decrease in net income was primarily attributable to the change of the fair value of financial derivatives, which was an income of $3,049,242 and $10,187,277 for the third three months ended September 30, 2015 and 2014, respectively; The other reason was the difference of stock compensation expense which was $7,028,089 and $2,024,550 for the third quarter ended September 30, 2015 and 2014 respectively, Our non-GAAP net income was $6,322,042 for the third three months of 2015 as compared to non-GAAP net income of $5,370,975 for the same period of 2014, an increase of $951,067. This increase in net income (non-GAAP) was primarily attributable to the growth in revenue and also the technology transfer income from the Company to the JV Company in the third quarter.
64
We make reference to certain non-GAAP financial measures, i.e., the adjusted net income. Management believes that such adjusted financial result is useful to investors in evaluating our operating performance because it presents a meaningful measure of corporate performance. See the non-GAAP reconciliation table below. Any non-GAAP measures should not be considered as a substitute for, and should only be read in conjunction with measures of financial performance prepared in accordance with GAAP.
| | Three Months Ended | |
| | | September 30, | |
| | 2015 | | | 2014 | |
| GAAP net income from continuing operations | $ | 2,343,195 | | $ | 13,533,702 | |
| Stock award expenses | | 7,028,089 | | | 2,024,550 | |
| Change of the fair value of financial derivatives | | 3,049,242 | | | 10,187,277 | |
| Non-GAAP net income from continuing operations | $ | 6,322,042 | | $ | 5,370,975 | |
Comparison of Nine Months Ended September 30, 2015 and 2014
The following table sets forth the amounts and percentage relationship to revenue of certain items in our condensed consolidated statements of income and comprehensive income for the nine months ended September 30, 2015 and 2014.
| | | Nine Months Ended | |
| | Sep 30, 2015 | | | % of Revenue | | | Sep 30, 2014 | | | % of Revenue | | | Change in Amount | | | Change in % | |
| | | | | | | | | | | | | | | | | | | |
| REVENUES, NET | $ | 142,273,091 | | | | | $ | 117,338,351 | | | | | | 24,934,740 | | | 21.3% | |
| | | | | | | | | | | | | | | | | | | |
| COST OF GOODS SOLD | | 122,294,189 | | | 86.0% | | | 99,748,314 | | | 85.0% | | | 22,545,875 | | | 22.6% | |
| | | | | | | | | | | | | | | | | | | |
| GROSSPROFIT | | 19,978, 902 | | | 14.0% | | | 17,590,037 | | | 15.0% | | | 2,388,865 | | | 13.6% | |
| | | | | | | | | | | | | | | | | | | |
| OPERATINGEXPENSES: | | | | | | | | | | | | | | | | | | |
| | | | | | | | | | | | | | | | | | | |
| Research and development | | 1,928,091 | | | 1.4% | | | 2,535,027 | | | 2.2% | | | (606,936 | ) | | -23.9 % | |
| | | | | | | | | | | | | | | | | | | |
| Selling and marketing | | 312,284 | | | 0.2% | | | 939,516 | | | 0.8% | | | (627,232 | ) | | -66.8 % | |
| | | | | | | | | | | | | | | | | | | |
| General and administrative | | 16,275, 202 | | | 11.4% | | | 11,720,693 | | | 10.0% | | | 4,554,509 | | | 38.9% | |
| | | | | | | | | | | | | | | | | | | |
| Total OperatingExpenses | | 18,515, 577 | | | 13.0% | | | 15,195,236 | | | 12.9% | | | 3,320,341 | | | 21.9% | |
| | | | | | | | | | | | | | | | | | | |
| INCOMEFROMOPERATIONS | | 1,463,325 | | | 1.0% | | | 2,394,801 | | | 2.0% | | | (931,476 | ) | | -38.9 % | |
| | | | | | | | | | | | | | | | | | | |
| OTHERINCOME(EXPENSE): | | | | | | | | | | | | | | | | | | |
| | | | | | | | | | | | | | | | | | | |
| Interest income | | 2,454,079 | | | 1.7% | | | 1,453,047 | | | 1.2% | | | 1,001,032 | | | 68.9% | |
| | | | | | | | | | | | | | | | | | | |
| Interest (expense) | | (1,730, 898 | ) | | -1.2% | | | (2,850,341 | ) | | -2.4% | | | 1,119,443 | | | -39.3 % | |
| | | | | | | | | | | | | | | | | | | |
| Change in fair value of financial instruments | | 11,802,586 | | | 8.3% | | | 6,814,675 | | | 5.8% | | | 4,987,911 | | | 73.2% | |
| | | | | | | | | | | | | | | | | | | |
| Government grants | | 92,139 | | | 0.1% | | | 217,284 | | | 0.2% | | | (125,145 | ) | | -57.6 % | |
| | | | | | | | | | | | | | | | | | | |
| Share of profit (loss) in associated companies | | - | | | 0.0% | | | (54,290 | ) | | 0.0% | | | 54,290 | | | -100.0% | |
| | | | | | | | | | | | | | | | | | | |
| Share of profit (loss) after tax of JV | | 1,900,128 | | | 1.3% | | | 3,757,218 | | | 3.2% | | | (1,857,090 | ) | | -49.4 % | |
| | | | | | | | | | | | | | | | | | | |
| Other income, net | | 1,094,278 | | | 0.8% | | | 141,641 | | | 0.1% | | | 952,637 | | | 672.6 % | |
| | | | | | | | | | | | | | | | | | | |
| Total other income, net | | 15,612,312 | | | 11.0% | | | 9,479,234 | | | 8.1% | | | 6,133,078 | | | 64.7% | |
| | | | | | | | | | | | | | | | | | | |
| INCOME BEFORE INCOME TAXES | | 17,075,637 | | | 12.0% | | | 11,874,035 | | | 10.1% | | | 5,201,602 | | | 43.8% | |
| | | | | | | | | | | | | | | | | | | |
| INCOME TAX EXPENSE | | (3,175,287 | ) | | -2.2% | | | (1,269,408 | ) | | -1.1% | | | (1,905,879 | ) | | 150.1 % | |
| | | | | | | | | | | | | | | | | | | |
| NET INCOME | | 13,900,350 | | | 9.8% | | | 10,604,627 | | | 9.0% | | | 3,295,723 | | | 31.1% | |
55
(a) Revenue
For the nine months ended September 30, 2015, our revenue was $142,273,091 compared to $117,338,351 for the same period of 2014, an increase of $24,934,740 or 21.3%. The increase in revenue was mainly due to the increase in EV parts sales during this period. The majority of the EV parts sales were battery sales.
The following table summarizes our revenues as well as the number of units sold by product types for the nine months ended September 30, 2015 and 2014:
66
| | | Nine Months Ended September 30 | |
| | | 2015 | | | 2014 | |
| | | Unit | | | Sales | | | Unit | | | Sales | |
| EV parts | | 78,603 | | $ | 138,584,847 | | | 79,189 | | $ | 78,528,845 | |
| EV products | | - | | | 0 | | | 1,666 | | | 22,358,409 | |
| Off-road vehicles | | 5,278 | | | 3,688,244 | | | 21,030 | | | 16,451,097 | |
| Total | | 83,881 | | $ | 142,273,091 | | | 101,885 | | $ | 117,338,351 | |
EV Parts
Among our total revenues during the nine months ended September 30, 2015, approximately $138,584,847, or 97.4%, resulted from the sale of EV parts. Our revenue of EV parts increased $60,056,002, or 76.5%, compared to the nine months ended September 30, 2014. Our EV parts sales primarily consisted of the sales of battery packs, body parts, EV drive motors, EV controllers, air conditioning units and other auto parts to the JV Company for manufacturing EV products.
EV Products
Among our total revenues during the nine months ended September 30, 2015, there was no revenue from EV products sales because the manufacture of EV products was transferred to the JV Company based on the JV Agreement. As a result, the EV products revenue decreased $22,358,409, or 100% compared to the same period of 2014. Under the JV Agreement, since March 2013, our EV products manufacturing business has been gradually transferred to the JV Company, and such transfer was completed at the end of 2014. We are now primarily responsible for supplying the JV Company with EV parts and the JV Company is primarily responsible for the production of EV products.
Off-Road Vehicles
Among our total revenues during the nine months ended September 30, 2015, approximately $3,688,244, or 2.6%, resulted from the sale of off-road vehicles. The off-road vehicles revenue decreased $12,762,853, or 77.6%, compared to the same period of 2014, mainly because the Company now focuses on the EV parts production, which is in line with the Company’s long-term strategy.
67
(b) Cost of goods sold
Cost of goods sold was $122,294,189 during the nine months ended September 30, 2015, representing an increase of $22,545,875, or 22.6%, compared to the same period of 2014. This increase was mainly due to the increase in corresponding growth in sales. Please also refer to (c) for cost details of each products.
(c) Gross profit
Gross profit for the nine months ended September 30, 2015 increased 13.6% to $19,978,902, compared to $17,590,037 for the same period last year. Margin by product was as below:
| | | Nine Months Ended September 30 | |
| | | 2015 | | | 2014 | |
| | Sales | | | Cost | | | Gross Profit | | | Margin % | | | Sales | | | Cost | | | Gross Profit | | | Margin % | |
| EV parts | $ | 138,584,847 | | | 119,132,000 | | | 19,452,847 | | | 14.0% | | $ | 78,528,845 | | | 71,156,715 | | | 7,372,130 | | | 9.4% | |
| EV produ cts | | 0 | | | 0 | | | 0 | | | | | | 22,358,409 | | | 15,994,877 | | | 6,363,532 | | | 28.5% | |
| Off-r oad vehicles | | 3,688,244 | | | 3,162,189 | | | 526,055 | | | 14.3% | | | 16,451,097 | | | 12,596,722 | | | 3,854,375 | | | 23.4% | |
| Total | $ | 142,273,091 | | | 122,294,189 | | | 19,978,902 | | | 14.0% | | $ | 117,338,351 | | | 99,748,314 | | | 17,590,037 | | | 15.0% | |
The overall margin decreased from 15.0% for the nine months ended September 30, 2014 to 14.0% for the same period of 2015.The principle reason for the decrease was that the Company did not sell any EV products directly to consumers in 2015, which was a high margin business in the last year. The margin of EV parts has significantly increased from 9.4% of the nine months of 2014 to 14.0% of the same period of 2015 due to the cost control and the scaled production for EV parts.
(d) Selling and distribution expenses
Selling and distribution expenses were $312,284 for the nine months ended September 30, 2015, compared to$939,516 for the same period last year, a decrease of $627,232 or 66.8% .
This decrease was primarily due to the decrease of contractual maintenance and repair expense of EV products for $564,445 because we did not have EV products sales starting from year 2015.
68
(e) General and administrative expenses
General and administrative expenses were $16,275,202 for the nine months ended September 30, 2015, compared to $11,720,693 for the same period of last year, an increase of $4,554,509 or 38.9%. For the nine months ended September 30, 2015, general and administrative expenses included $12,559,581 in expenses for common stock awards and stock options to employees and consultants, compared to $6,453,797 for the same period in 2014. Excluding stock award costs, our net general and administrative expenses for the nine months ended September 30, 2015 were $3,715,621, a decrease of $1,551,275, or 29.5%, from $5,266,896 for the same period of 2014. The decrease was primarily due to a placement agent fee of $1,963,408 occurred in the nine months ended September 30, 2014. We did not incur a similar fee in the same period of 2015.
(f) Research and development
Research and development expenses were $1,928,091 for the nine months ended September 30, 2015, a decrease of $606,936 or 23.9% compared to $2,535,027 for the same period of last year. This decrease was primarily due to: 1) the expenses on China Auto Research Centre for EV testing decreased $312,450 compared to the same period last year; and 2) the depreciation expenses decreased by $853,913 compared to the same period last year due to the related R&D equipment transferred from R&D department into the production department; 3) the material spending for battery pack research and development increased for $445,454 in the third quarter of 2015.
(g) Government grants
Government grants were $92,139 for the nine months ended September 30, 2015, a decrease of $125,145 or 57.6% compared to $217,284 for the same period of last year.
The government grants are project based. In April 2015, we received an RMB 400,000 (approximately $64,659) grant for the research of Kandi EV SMA7005 for Kandi Vehicle and an RMB 170,000 (approximately $27,480) grant for technologies incentive for Yongkang Scruo.
(h) Interest income
Interest income was $2,454,079 for the nine months ended September 30, 2015, an increase of $1,001,032 or 68.9% compared to $1,453,047 for the same period of last year. This change was primarily attributable to an increase in interest income earned on the entrusted loans made to the JV Company.
69
(i) Interest expense
Interest expense was $1,730,898 for the nine months ended September 30, 2015, a decrease of $1,119,443 or 39.3% compared to $2,850,341 for the same period of last year. This change was mainly due to the bond interest expense for $1,115,368 in the nine months ended September 30, 2014.
(j) Change in fair value of financial instruments
For the nine months ended September 30, 2015, the gain related to changes in the fair value of derivative liability relating to the warrants issued to the investors and a placement agent was $11,802,586, an increase of $4,987,911 compared to the same period of last year. The gain on the changes in the fair value of derivative, liability is due to the decrease of the fair value price of the derivative which was primarily attributable to two factors. First, it was caused by the decrease in the market price of the Company’s common stock underlying the warrants issued on September 4, 2014, which decreased from $17.13 on the issuance date to $5.25 on September 30, 2015. Second, it was due to the passage of remaining life of 1,429,393 shares of warrants, a significant portion of the Company’s outstanding warrants. These warrants was expired on January 30, 2015.
(k) Share of (loss) of associated company
Investment gains were $0 for the nine months ended September 30, 2015, a positive change of $54,290 compared to the same period of last year, primarily due to the liquidation of our investment in Jinhua Service as this entity was dissolved in the third quarter of 2014.
(l) Share of profit (loss) after tax of the JV Company
For the nine months ended September 30, 2015, the JV Company’s net sales were $197,965,282, gross profit was $ 31,958,679, and net profit was $4,000,781. We accounted for our investments in the JV Company under the equity method of accounting as we have a 50% ownership interest in the JV Company. As a result, we recorded 50% of the JV Company’s profit for $2,000,390 for the nine months ended September 30, 2015. After eliminating intra-entity profits and losses, our share of the after tax profit of the JV Company was $1,900,128 for the nine months ended September 30, 2015, a decrease of $1,857,090 or 49.4% compared to the same period of last year, the main reasons for the decrease of the JV Company’s profits primarily due to: 1) the significant interest expense occurred for the increased bank loan for operating needs, 2) the increased operating expenses incurred compared to the same period last year, which were for the JV Company’s future business growth, and 3) the lower product margin due to the lower selling price to a strategic client in the third quarter of 2015.
70
During the nine months ended September 30, 2015, a total of 12,120 units of EV products were sold by the JV Company, an increase of 66.5% compared to 7,279 units sold in the same period of 2014.
(m) Other income, net
Net other income was $1,094,278 for the nine months ended September 30, 2015, an increase of $952,637 or 672.6% compared to the same period of last year, which was primarily due to a technology transfer income from the Company to the JV Company for $884,486 in the third quarter of 2015.
(n) Net income from continuing operation
Net income was $13,900,350 for the nine months ended September 30, 2015, an increase of $3,295,723 compared to $10,604,627 for the same period of last year. The increase in net income was primarily attributable to the increased revenue and gross profits, and the gain from the change in the fair value of derivative securities, including (i) the effects of stock award expenses, which were $12,559,581 and $6,453,797 for the nine months ended September 30, 2015 and 2014, respectively, and (ii) the change of the fair value of financial derivatives, which was income of $11,802,586 and 6,814,675 for the nine months ended September 30, 2015 and 2014, respectively, our non-GAAP net income was $14,657,345 for the nine months ended September 30, 2015 as compared to non-GAAP net income of $10,243,749 for the same period of 2014, an increase of $4,413,596. This increase in net income (non-GAAP) was primarily attributable to the increase in revenue and gross profits and the operating expense savings during this nine-month period and also the technology transfer income.
We make reference to certain non-GAAP financial measures, i.e., the adjusted net income. Management believes that such adjusted financial result is useful to investors in evaluating our operating performance because it presents a meaningful measure of corporate performance. See the non-GAAP reconciliation table below. Any non-GAAP measures should not be considered as a substitute for, and should only be read in conjunction with measures of financial performance prepared in accordance with GAAP.
71
| | | Nine Months Ended | |
| | | September 30, | |
| | | 2015 | | | 2014 | |
| GAAP net income from continuing operations | $ | 13,900,350 | | $ | 10,604,627 | |
| Stock award expenses | | 12,559,581 | | | 6,453,797 | |
| Change of the fair value of financial derivatives | | 11,802,586 | | | 6,814,675 | |
| Non-GAAP net income from continuing operations | $ | 14,657,345 | | $ | 10,243,749 | |
LIQUIDITY AND CAPITAL RESOURCES
Cash Flow
For the nine months ended September 30, 2015, cash used in operating activities was $1,126,747, as compared to cash used in operating activities of $46,397,580 for the same period of last year.
Below is the cash flow statement for the operating activities:
72
| | | Nine Months Ended | |
| | September 30, 2015 | | | September 30, 2014 | |
| | | | | | | |
| CASH FLOWS FROM OPERATINGACTIVITIES: | | | | | | |
| Net income | $ | 13,900,350 | | $ | 10,604,627 | |
| Adjustments to reconcile net income to net cash provided by operating activities | | | | | | |
| Depreciation and amortization | | 4,388,902 | | | 4,157,606 | |
| Assets Impairments | | - | | | | |
| Deferred taxes | | (1,854,863 | ) | | 808,725 | |
| Change in fair value of financial instruments | | (11,802,586 | ) | | (6,814,675 | ) |
| Loss (income) in investment in associated companies | | - | | | 54,290 | |
| Share of profit after tax of JV Company | | (1,900,128 | ) | | (3,757,218 | ) |
| Decrease in reserve for fixed assets | | - | | | - | |
| Stock Compensation cost | | 12,486,881 | | | - | |
| | | | | | | |
| Changes in operating assets and liabilities,net of effects of acquisition: | | | | | | |
| (Increase) Decrease In: | | | | | | |
| Accounts receivable | | (19,286,512 | ) | | 17,190,113 | |
| Inventories | | (17,289,849 | ) | | (5,480,008 | ) |
| Other receivables | | (298,976 | ) | | 105,092 | |
| Due from employee | | (10,535 | ) | | 413,441 | |
| Prepayments and prepaid expenses | | 6,265,899 | | | (49,927,475 | ) |
| Amount due from JV Company | | (27,964,497 | ) | | (49,177,160 | ) |
| | | | | | | |
| Increase (Decrease) In: | | | | | | |
| Accounts payable | | 44,980,746 | | | 32,911,627 | |
| Other payables and accrued liabilities | | (1,302,135 | ) | | 2,441,464 | |
| Customer deposits | | (2,502,087 | ) | | 108,031 | |
| Income Tax payable | | 1,062,643 | | | (36,060 | ) |
| Due to related party | | - | | | - | |
| Net cash (used in ) provided by operatingactivities | $ | (1,126,747 | ) | $ | (46,397,580 | ) |
The major operating activities that provided cash for the nine months ended September 30, 2015 were net income of $13,900,350 and an increase in accounts payable of $44,980,746. The major operating activities that used cash for nine months ended September 30, 2015 were an increase in receivables from the JV Company of $27,964,497 and from other clients of $19,286,512, and an increase in inventories of $17,289,849.
73
Below is the cash flow statement for the investing activities:
| | | Nine Months Ended | |
| | September 30, 2015 | | | September 30, 2014 | |
| | | | | | | |
| CASH FLOWS FROM INVESTINGACTIVITIES: | | | | | | |
| (Purchases)/Disposal of plant and equipment, net | | (408,850 | ) | | (813,246 | ) |
| Purchases of land use rights and other intangible assets | | - | | | (1,667,986 | ) |
| Purchases of construction in progress | | (39,054 | ) | | (39,283 | ) |
| Deposit for acquisition | | - | | | - | |
| Disposal of associated company | | - | | | (96,268 | ) |
| Issuance of notes receivable | | (72,040,444 | ) | | (21,698,986 | ) |
| Repayment of notes receivable | | 61,697,894 | | | 29,344,951 | |
| Long Term Investment | | (1,535,651 | ) | | - | |
| Net cash provided by (used in) investingactivities | $ | (12,326,105 | ) | $ | 5,029,182 | |
Cash used by investing activities for the nine months ended September 30, 2015 was $12,326,105 primarily due to the result of the issuance of notes receivable of $72,040,444 and repayment of notes receivable of $61,697,894.
Below is the cash flow statement for the financing activities:
| | | Nine Months Ended | |
| | September 30, 2015 | | | September 30, 2014 | |
| | | | | | | |
| CASH FLOWS FROM FINANCING ACTIVITIES: | | | | | | |
| Restricted cash | | (3,232,950 | ) | | (13,006,018 | ) |
| Proceeds from short-term bank loans | | 30,583,709 | | | 28,616,816 | |
| Repayments of short-term bank loans | | (27,512,406 | ) | | (39,998,504 | ) |
| Proceeds from notes payable | | 9,860,498 | | | 13,007,644 | |
| Repayment of notes payable | | (12,299,436 | ) | | (16,584,746 | ) |
| Option exercise stock awards & other financing | | - | | | 6,429,622 | |
| Warrant exercise | | - | | | 22,447,914 | |
| Common stock issued for acquisition, net of cost of capital | | - | | | 78,155,627 | |
| Net cash (used in) provided by financingactivities | $ | (2,600,585 | ) | $ | 79,068,355 | |
74
Cash provided by financing activities for the nine months ended September 30, 2015 was $40,444,207, primarily due to the result of proceeds from short-term loans of $30,583,709, and the proceeds from notes payable of $9,860,498. Cash used in financing activities for the nine months ended September 30, 2015 was $43,044,792, primarily due to restricted cash increase of $3,232,950, repayments of short-term bank loans of $27,512,406 and repayment of notes payable of $12,299,436.
Working Capital
We had a working capital surplus of $54,318,555 at September 30, 2015, compared to $39,202,684 as of December 31, 2014.
We have historically financed our operations through short-term commercial bank loans from PRC banks. The term of these loans is typically for one year, and upon the payment of all outstanding principal and interest in a particular loan, the banks have typically rolled over the loan for an additional one-year term, with adjustments made to the interest rate to reflect prevailing market rates. We believe that this situation has not changed and that short-term bank loans will be available on normal trade terms if needed.
Capital Requirements and Capital Provided
Capital requirements and capital provided for the nine months ended September 30, 2015 were as follows:
| | Nine Months Ended | |
| | | September 30, 2015 | |
| | | (In Thousands) | |
| Capital requirements | | | |
| Purchase of plant and equipment | $ | 409 | |
| Purchase of construction in progress | | 39 | |
| Issuance of notes receivable | | 72,040 | |
| Long term investment | | 1,536 | |
| Repayments of short-term bank loans | | 27,512 | |
| Repayments of notes payable | | 12,299 | |
| Increase in restricted cash | | 3,233 | |
| Internal cash used in operations | | 1,127 | |
| Total capital requirements | $ | 118,195 | |
| | | | |
| Capital provided | | | |
| Repayments of notes receivable | | 61,698 | |
| Proceeds from short-term bank loan | | 30,584 | |
| Proceeds from notes payable | | 9,860 | |
| Decrease in cash | | 14,688 | |
| Total capital provided | $ | 116,830 | |
75
The change in exchange rate over the past nine months caused the difference between capital provided and capital required.
Recent Development Activities:
On July 6, 2015, we announced that the JV company signed a sales contract with Zhejiang Shi Kong Electric Vehicle Co. Ltd. (“Zhejiang Shi Kong”) for 4,000 units of Kandi Brand electric vehicles (EVs), including 1,500 units of Kandi K11 (Panda) and 2,500 units of Kandi K10 (Mini). The total value of the contract is over $89 million. Kandi expects vehicle delivery to be completed by the end of 2015. Zhejiang Shi Kong is dedicated to deepening the penetration of new energy vehicles (NEVs) through the Internet Plus concept. The 4,000 units of Kandi Brand EVs will be used in Zhejiang Shi Kong’s innovative programs to promote the adoption of NEVs in China. This sales contract marks Kandi’s entrance into this innovative field, and will further enhance our leadership position in China’s EV market.
On July 13, 2015, we announced that the JV Company planned to launch MPT program in Kunming City, The target is to deliver 2,000 Kandi Brand electric vehicles products by the end of 2015.This program is also strongly supported by local government. In the third quarter, we have delivered 1,100 EV products to Kunming to launch MPT program.
On July 20, 2015, we announced that the JV company and Luzhou Jiecheng Auto Co. Ltd. have signed a strategic cooperation agreement for the sale of 1,500 Kandi brand EVs in Luzhou to launch the MPT program. In support of the program, the Luzhou municipal government will match the national government’s per-vehicle subsidy. The delivery is expected by the end of 2015. We believe this cooperation will accelerate MPT’s market penetration and help us to maintain our leadership position in China’s booming EV industry.
On August 11, 2015, we announced that the JV Company received a prepayment of RMB 364.5 million (approximately US$59.6 million) representing a national subsidy for pure EV sales in 2015. We believe the prepaid national subsidy for pure EV sales in 2015 represents the government's strong support for the development of the pure EV industry. We are confident that we will continue to lead this market and achieve our full year sales target.
76
On September 8, 2015, we announced that the JV Company will use the new trademark "Global Hawk" for EV developed, manufactured and sold by the JV Company beginning September 1, 2015 according to the recent board resolution. As a well-recognized brand owned by Geely, the "Global Hawk" trademark has been provided to the JV Company at no cost to help address the fast-growing demand from China's EV market. We believe this brand will boost the expansion of the JV Company's EV products into the mid-to-high-tier markets.
On September 15, 2015, we announced our pure EV model SMA7001BEV04 ("K17" or "Kandi Cyclone") was listed on the fifth approved Directory of New Energy Vehicles published recently by China's Ministry of Industry and Information Technology ("MIIT") and State Administration of Taxation ("SAT"). As a result, the Kandi Cyclone is now qualified for a purchase tax exemption.
On September 21, 2015, we announced that EV models SMA7001BEV05 and SMA7000BEV06 developed by the JV Company have been approved by Ministry of Industry and Information Technology of the People's Republic of China ("MIIT") under the 2015 No. 134 public announcement issued on September 18th, 2015. We believe it marks the beginning of the JV Company's new growth stage.
On September 30, 2015, we endorsed China's latest policy on new energy vehicle (NEV) development that was released by China's Prime Minister Li Keqiang during a State Council meeting on Sept 29th. The new policy requires government organizations, institutions and public transportation departments to increase the number of NEVs in use. The Prime Minister also indicated that local governments should not set traffic controls and purchase quotas on NEVs. With these requirements announced by the government, China government pays high attention to the development of EV industry, and it will definitely boost the strong growth of EV in the future.
On November 2, 2015, the government of Zhejiang Province announced that the R&D institute of the JV Company will be entitled as the key enterprise R&D center in Zhejiang Province. Therefore, the R&D institute of JV Company will get strong financial support for new products development and senior talent recruiting from the government.
Item 3. Quantitative and Qualitative Disclosures About Market Risk
Exchange Rate Risk
Our operations are conducted mainly in the PRC. As such, our earnings are subject to movements in foreign currency exchange rates when transactions are denominated in Chinese Renminibi (“RMB”), which is our functional currency. Accordingly, our operating results are affected by changes in the exchange rate between the U.S. dollar and RMB currencies.
77
Economic and Political Risks
Our operations in the PRC are subject to special considerations and significant risks not typically associated with companies in North America and Western Europe. These include risks associated with, among others, the political, economic and legal environment in the PRC and foreign currency exchange. Our performance may be adversely affected by changes in the political and social conditions in the PRC, and by changes in governmental policies with respect to laws and regulations, anti-inflationary measures, currency conversion, remittances abroad, and rates and methods of taxation, among other things.
Item 4.Controls and Procedures.
Evaluation of Disclosure Controls and Procedures
We have evaluated, under the supervision of our Chief Executive Officer (“CEO”) and our Chief Financial Officer (“CFO”), the effectiveness of disclosure controls and procedures (as such term is defined in Rules 13a-15(e) and 15d-15(e) under the Securities Exchange Act of 1934 (the “Exchange Act”)) as of September 30, 2015. Based on this evaluation, our CEO and CFO concluded that as of the end of the period covered by this report, our disclosure controls and procedures were effective.
Disclosure controls and procedures are controls and other procedures that are designed to ensure that information required to be disclosed in our reports filed or submitted under the Exchange Act (a) is recorded, processed, summarized and reported within the time periods specified in the SEC’s rules and forms and (b) is accumulated and communicated to management, including our CEO and CFO, as appropriate, to allow timely decisions regarding required disclosure. Our management recognizes that any controls and procedures, no matter how well designed and operated, can provide only reasonable assurance of achieving their objectives and management necessarily applies its judgment in evaluating the cost-benefit relationship of possible controls and procedures. Our disclosure controls and procedures are designed to provide reasonable assurance of achieving their objectives as described above.
Changes in Internal Control over Financial Reporting
There was no change to our internal control over financial reporting (as defined in Rules 13a-15(f) and 15d-15(f) under the Exchange Act) that occurred during the period covered by this report that have materially affected, or are reasonably likely to materially affect, our internal control over financial reporting.
78
PART II - OTHER INFORMATION
Item 6. Exhibits
Exhibit Description
79
SIGNATURES
Pursuant to the requirements of the Securities Exchange Act of 1934, as amended, the registrant caused this report to be signed on its behalf by the undersigned, thereunto duly authorized.
| Date: November 9, 2015 | By: | /s/ Hu Xiaoming |
| | | Hu Xiaoming |
| | | President and Chief Executive Officer |
| | | (Principal Executive Officer) |
| Date: November 9, 2015 | By: | /s/ Wang Cheng (Henry) |
| | | Wang Cheng (Henry) |
| | | Chief Financial Officer |
| | | (Principal Financial Officer and |
| | Principal Accounting Officer) |
80