UNITED STATES
SECURITIES AND EXCHANGE COMMISSION
Washington, D.C. 20549
Form 10-K
| x | ANNUAL REPORT PURSUANT TO SECTION 13 OR 15(d) OF THE SECURITIES EXCHANGE ACT OF 1934 |
For the fiscal year ended December 29, 2007
or
| ¨ | TRANSITION REPORT PURSUANT TO SECTION 13 OR 15(d) OF THE SECURITIES EXCHANGE ACT OF 1934 |
For the transition period from to
Commission File Number 0-51333
Rackable Systems, Inc.
(Exact name of registrant as specified in its charter)
| | |
| Delaware | | 32-0047154 |
(State or other jurisdiction of incorporation or organization) | | (I.R.S. Employer Identification No.) |
46600 Landing Parkway
Fremont, California 94538
(Address of principal executive offices, including zip code)
(510) 933-8300
(Registrant’s telephone number, including area code)
Securities registered pursuant to Section 12(b) of the Act:
| | |
Title of each class | | Name of each exchange on which registered |
| Common Stock, $0.001 par value per share | | The NASDAQ Stock Market, Inc. |
Indicate by check mark whether the registrant is a well-known seasoned issuer, as defined in Rule 405 of the Securities Act. Yes ¨ No x
Indicate by check mark if the registrant is not required to file reports pursuant to Section 13 or Section 15(d) of the Act. Yes ¨ No x
Indicate by check mark whether the registrant (1) has filed all reports required to be filed by Section 13 or 15(d) of the Securities Exchange Act of 1934 during the preceding 12 months (or for such shorter period that the registrant was required to file such reports) and (2) has been subject to such filing requirements for the past 90 days. Yes x No ¨
Indicate by check mark if disclosure of delinquent filers pursuant to Item 405 of Regulation S-K is not contained herein, and will not be contained, to the best of registrant’s knowledge, in definitive proxy or information statements incorporated by reference in Part III of this Form 10-K or any amendment to this Form 10-K. x
Indicate by check mark whether the registrant is a large accelerated filer, an accelerated filer, a non-accelerated filer, or a smaller reporting company. See the definition of “large accelerated filer”, “accelerated filer” and “smaller reporting company” in Rule 12b-2 of the Exchange Act. (Check one):
| | | | | | |
Large accelerated filer ¨ | | Accelerated filer x | | Non-accelerated filer ¨ | | Smaller reporting company ¨ |
Indicate by check mark whether the registrant is a shell company (as defined in Rule 12b-2 of the Exchange Act). Yes ¨ No x
As of July 1, 2007, the aggregate market value of the voting stock held by non-affiliates of the registrant, computed by reference to the last sale price of such stock as of such date on the NASDAQ Global Select Market, was approximately $363,000,000. Excludes an aggregate of 3,416,248 shares of common stock held by officers and directors and by each person known by the registrant to own 5% or more of the outstanding common stock as of July 1, 2007. Exclusion of shares held by any of these persons should not be construed to indicate that such person possesses the power, direct or indirect, to direct or cause the direction of the management or policies of the registrant, or that such person is controlled by or under common control with the registrant.
As of March 6, 2008, there were 29,635,258 shares of the registrant’s common stock outstanding.
DOCUMENTS INCORPORATED BY REFERENCE.
Portions of the registrant’s definitive proxy statement for its 2008 Annual Meeting of Stockholders to be filed with the Commission within 120 days after the close of the registrant’s fiscal year are incorporated by reference into Part III of this report.
RACKABLE SYSTEMS, INC.
ANNUAL REPORT ON FORM 10-K
FOR THE FISCAL YEAR ENDED DECEMBER 29, 2007
TABLE OF CONTENTS
SPECIAL NOTE REGARDING FORWARD-LOOKING STATEMENTS AND TRADEMARKS
This Annual Report on Form 10-K contains forward-looking statements within the meaning of Section 27A of the Securities Act of 1933 and Section 21E of the Securities Exchange Act of 1934. All statements included or incorporated by reference in this Form 10-K other than statements of historical fact, are forward-looking statements. Investors can identify these and other forward-looking statements by the use of words such as “estimate,” “may,” “will,” “could,” “anticipate,” “expect,” “intend,” “believe,” “continue” or the negative of such terms, or other similar expressions. Forward-looking statements also include the assumptions underlying or relating to such statements.
Our actual results could differ materially from those projected in the forward-looking statements included herein as a result of a number of factors, risks and uncertainties, including, among others, the risk factors set forth in “Item 1A—Risk Factor and,” Item 7—“Management’s Discussion and Analysis of Financial Condition and Results of Operations” in this Form 10-K and elsewhere in this Form 10-K and the risks detailed from time to time in Rackable Systems, Inc.’s future U.S. Securities and Exchange Commission reports. The information included in this Form 10-K is as of the filing date with the Securities and Exchange Commission and future events or circumstances could differ materially from the forward-looking statements included herein. We assume no duty to update any of the forward-looking statements after the date of this report or to conform these statements to actual results except as required by law. Accordingly, we caution readers not to place undue reliance on such statements.
“Rackable Systems,” “Eco-Logical”, “OmniStor,” “RapidScale,” “Roamer”, “Concentro”, “ICE Cube” and the Rackable Systems logo are trademarks or registered trademarks of Rackable Systems, Inc. All other trademarks or service marks appearing in this report are trademarks or service marks of their respective owners.
PART I
Item 1.Business
Overview
We are a leading provider of servers, storage and data center solutions targeting large-scale data center deployments. Our products are designed to provide benefits in the areas of density, power efficiency, thermal management, ease of serviceability and remote management. We also offer a high degree of flexibility and control in component selection to match the specific environmental and application requirements of our customers. Our products are designed to reduce total cost of ownership through strategic sourcing of components and reduced deployment and operating expenses. In 2007, we began referring to these advantages as “Eco-Logical”, a term we trademarked to best describe our environmentally-friendly, efficient products (“eco”) that enable smart, practical solutions for our end users (“logical”). We base our products on the x86 platform—which means we leverage open standard components such as processors from Advanced Micro Devices (“AMD”) and Intel Corporation (“Intel”) and operating systems such as Linux and Windows in order to leverage the continuing price-performance improvements associated with high-volume computer components.
Our flagship half-depth servers are high-density, rack-mounted systems designed specifically for large-scale data center environments. This line of servers utilizes our patented half-depth, back-to-back chassis design to increase physical server density, reducing floor space requirements. When deployed in our cabinets, we are generally able to offer approximately twice the server or processor density of traditional rack-mount solutions. We provide a range of power and heat management techniques that enable our servers to operate effectively at these density levels. These servers also provide configurable components, front-facing cable connections for enhanced serviceability, and our proprietary Roamer remote management solution. We also offer a line of blade-like rack-mount servers, which can offer even higher density levels for various configurations as well as improve thermal and cable management. In addition, we selectively use reseller and original equipment manufacturer (“OEM”) relationships to provide additional server offerings that our customers may request from time to time.
1
We sell low-cost, high-capacity storage servers, which leverage many of our core server technologies, to help enterprises cost-effectively meet their increasing data storage requirements. If requested by our customers, we also provide storage products that combine our hardware with software layers provided by third parties under OEM software license arrangements. Our RapidScale clustered storage appliances provide scalable shared storage, enabling all stored data to reside under a single namespace and be simultaneously accessed by up to thousands of servers. The solution delivers high performance while improving capacity and performance scalability, ease of data management, and capacity utilization. To complement our RapidScale and storage server product lines, we selectively leverage reseller and OEM relationships to provide additional storage offerings that our customers may request from time to time, such as external fiber channel.
In March of 2007, we launched and sold our first modular data center, a self-contained, portable data center featuring extreme server and storage density with highly efficient cooling and easy serviceability. In September of 2007, we released the newest generation of the product, known as “ICE Cube”. Designed to augment or replace traditional brick-and-mortar data centers of any size and ideal for data centers facing power and space limitations, ICE Cube features system density levels of up to 1,400 of our half-depth, rack-mount servers in a 40’x8’ container, or up to 7.1 Petabytes of storage. Leveraging quad-core processors, a 1,400 server density enables up to 11,200 processing cores in this self-contained data center environment. Our introduction marked the first-ever known deployment of a modular data center, and we are seeing strong interest in this model given the growing challenges many large-scale data centers face today around power, cooling and space.
We market our systems primarily through our direct sales force predominantly to companies within the United States. We continue to pursue the creation of an international sales and operational presence, focusing initially on Europe and China. We focus our sales and marketing activities on companies that typically purchase hundreds of servers and tens to thousands of terabytes of storage per year. To date, we have sold our products to over 500 customers. We have concentrated our marketing efforts on Internet companies, as well as customers with high-performance computing requirements in vertical markets such as financial services, enterprise software, federal government, oil and gas exploration and biotechnology.
Corporate Information
Rackable Systems, Inc. was incorporated in the state of Delaware in December 2002 in connection with the acquisition of substantially all the assets and liabilities of Rackable Systems’ predecessor company referred to herein as Old Rackable. We have subsidiaries in Canada, Hong Kong and Ireland. In September 2006, we acquired Terrascale Technologies, Inc., a Canadian based company, the products of which are now sold under the RapidScale name. Our principal executive offices are located at 46600 Landing Parkway, Fremont, California and our telephone number is (510) 933-8300.
Additional information about Rackable Systems, Inc. is available on our website atwww.rackable.com. We make available free of charge, on or through our website, our Annual Report on Form 10-K, our Quarterly Reports on Form 10-Q, our Current Reports on Form 8-K, and any amendments to those reports filed or furnished pursuant to Section 13(a) or 15(d) of the Exchange Act, as soon as reasonably practicable after electronically filing such reports with, or furnishing such reports to, the Securities and Exchange Commission. Information contained on our website is not incorporated by reference in, or made part of this Annual Report on Form 10-K or our other filings with or reports furnished to the Securities and Exchange Commission.
The terms “Rackable,” “Rackable Systems,” “we,” “us” and “our” as used in this Form 10-K, refer to Rackable Systems, Inc. and its subsidiaries.
2
Innovation and Intellectual Property Creation
We design, market and support a comprehensive suite of servers, storage and data center solutions that are optimized for large-scale data centers. Our Eco-Logical rack-mount server and storage systems are based on industry-standard components and open-standard operating systems. We offer a broad selection of core system component technologies, which enables us to tailor systems to specific customer requirements. Our innovative designs enable our customers to maximize server density while optimizing thermal and power management within the data center. We design our solutions to be installed on a turnkey basis with remote management capabilities that minimize ongoing maintenance expenses. By embracing the benefits of modular, open-standards computing and storage solutions, we enable our customers to expand capacity and improve performance in the data center at a lower total cost of ownership.
Key benefits of our systems include:
Higher density levels. Our systems are designed to alleviate inefficient use of floor and rack space and thermal management issues, problems that are found in major data center installations today. Our primary line of rack-mount servers are approximately half as deep as traditional rack-mount systems, known as our “half-depth” servers and storage systems. By deploying these half-depth servers in our cabinets with our patented “back-to-back” mounting technology, we are able to offer twice the density of traditional rack-mount solutions. Our portable ICE Cube modular data center leverages our half-depth servers and storage to achieve unprecedented density levels of up to 1,400 systems in a 40’x8’ footprint, enabling data centers to save valuable floor space and reduce real estate costs. Our Scale Out Series also offers high density levels by making use of both “back-to-back” and “side-to-side” mounting technologies.
Improved cooling and thermal management. With increased density comes increasing needs for optimized thermal management. We use a range of thermal management technologies to vent server heat output from the cabinet as well as reduce heat inside the server. For example, our patented back-to-back mounting design enables a central air space, or plenum, which draws heat to the center of the cabinet and exhausts it from the top of the cabinet, enabling more efficient cooling and heat evacuation in the data center. We also reduce server-level heat by leveraging our high efficiency AC and DC power supplies, which improve efficiency and thereby reduce heat output. Our ICE Cube modular data center features a closed-loop liquid cooling technology, providing dramatic cooling cost savings over a traditional brick-and-mortar data center HVAC installation.
Improved power management. Our server and storage lines include a range of design innovations to reduce power consumption and enable flexible power management schemes. Because we build servers to order, we are sometimes able to eliminate components that draw power but may not be needed by the customer and to match the selection of a particular power supply to the load drawn by the system, which can improve power conversion efficiency. Our remote management technology offers the ability to stagger the start-up of systems, which reduces the aggregate power draw at system boot time and allows the customer to increase the number of systems attached to a power circuit without tripping the circuit breaker. All server components use DC power, and our DC power options allow cabinet- and data center-level bulk power conversion to enable higher overall power efficiency, as well as improved redundancy schemes, such as the ability to withstand complete loss of an AC circuit. Our DC power solutions are designed to be compatible with data centers that have either AC- or DC-based power distribution infrastructure. We also provide high efficiency AC power supply options to provide the flexibility that customers demand.
Remote monitoring and improved serviceability. Our Roamer lights-out remote management solution enables the administration of large-scale server farms from any network-connected off-site location. Roamer enables rapid identification and location of failed servers and results in a significant reduction in the need for onsite maintenance technicians. In addition, our products are designed for improved serviceability through a variety of means including front facing input-output (“I/O”) ports and integrated cable troughs. This series includes additional benefits such as completely internalized cable and power connections and “toolless” serviceability for simplified maintenance. These design innovations allow us to significantly reduce installation and maintenance time and to decrease the need for multiple technicians to service our systems.
3
Flexible platforms that address customer-specific requirements. Our servers and storage systems are based on highly flexible platforms that enable our customers to select the configuration, operating system, processor and other key components based on their requirements. Because our solutions are build-to-order at the component level, they meet our customers’ performance requirements without bundling unnecessary features or components that increase cost. Our systems utilize industry-standard components wherever possible and are compatible with lower-cost operating systems such as Linux and Windows, enabling our customers to achieve optimal performance in a cost-effective manner while minimizing vendor dependence associated with proprietary systems. Our ICE Cube modular data center can be deployed with any combination of Rackable Systems servers and storage, enabling tremendous flexibility and customization for the end user.
High capacity, cost-effective storage systems. Our storage servers utilize industry-standard components and lower-cost operating systems. We offer storage servers that allow our customers to run their own storage software or storage management applications. We also sell the RapidScale storage appliance that leverages our proprietary RapidScale clustered file system appliance software. If requested by our customers we also offer storage servers that include pre-installed storage software appliances that we source from third parties. Our storage platforms leverage many of the same design principles and component technologies as our compute server platforms. We also source storage hardware technologies from third parties under both OEM and resale arrangements.
Customers
We have sold our products to more than 500 customers, primarily to large Internet businesses, and companies in vertical markets such as financial services, enterprise software, federal government, oil and gas exploration and biotechnology. Because we generally sell to customers with large-scale data center deployments that, may procure hundreds or thousands of systems at a time, a single customer in any given quarter can account for a large portion of our sales. However, because our revenue has largely been generated in connection with these customers’ decisions to deploy large-scale server and storage farms, their capacity requirements can become fulfilled, whether temporarily or otherwise, and as a result they could purchase significantly fewer or no products from us in subsequent periods. For the fiscal year ended December 29, 2007, Microsoft, Amazon and Yahoo! accounted for approximately 36%, 16% and 12% of our revenues, respectively. For the fiscal year ended December 30, 2006, Microsoft and Yahoo! accounted for approximately 34% and 26% of our revenues, respectively. For the fiscal year ended December 31, 2005, Amazon.com, Yahoo! and Microsoft accounted for approximately 24%, 22% and 14% of our revenues, respectively. . No other customers accounted for more than 10% of our revenues in 2007, 2006 and 2005.
Products
We focus on three key product families: (1) servers, (2) storage and (3) modular data center infrastructure solutions. In 2007, we continued to make key advancements in our server designs, including the introduction of new Eco-Logical chassis form factors and configuration updates in conjunction with new technology launches from our partners and suppliers. We saw traction in our storage server sales, and continued to make critical refinements and upgrades to our RapidScale storage appliance offerings. We expanded our data center infrastructure solutions were expanded with the addition of new data center-level DC power distribution techniques as well as the launch and deployment of our modular data center technology.
Servers
Our high-density rack-mount servers offer a range of component choices and are typically built-to-order, providing a high degree of flexibility to our customers. We believe we offer a broader range of product configurations than larger global x86 server market competitors. We continually qualify new configurations as new motherboard, processor, dynamic random access memory, (“DRAM”), disk drive and other component technologies become available. Our servers are categorized into three main lines: half-depth rack-mount, standard-depth rack-mount and Scale Out blade systems.
4
Half-Depth Rack-Mount Servers. We introduced our half-depth server line in early 2000. This product line adheres to rack-mount standards but increases density levels and improves serviceability when deployed back-to-back in our proprietary, purpose-built cabinet. These 1U, 2U, 3U and 4U chassis designs are approximately half the depth of traditional rack-mount servers. A “U” is an industry unit of measure equal to approximately 1.75 inches and is used to measure the height of the server chassis. Our half-depth server line is comprised of the base chassis models C1001 (new in 2007), C2000, C2002, C2002-HPC, C2004, C3001 and C4002.
Because we adhere to rack-mount height and width standards, our customers can deploy these servers in most industry standard 19-inch cabinets or two-post “telco racks.” However, when deployed in our purpose-built, proprietary cabinet technology, our customers are able to achieve twice the density of traditional rack-mount solutions because we enable back-to-back mounting. Back-to-back mounting of our half-depth systems also enables improved thermal management and serviceability. We hold patents around the use of back-to-back mounting, the resulting air flow patterns and the front-facing I/O placement. We are able to deploy up to 88 servers in a seven foot tall cabinet. These density levels are reduced if a customer elects to include networking or other equipment in the cabinet.
In our cabinet technology, the back-to-back mounting technique creates an enclosed air plenum for heat exhaust, and we evacuate heat through the top of the cabinet, which often enables our customers to direct heat to air return systems in a more organized and efficient fashion. Our chassis and cabinet technology also offers additional benefits versus traditional rack-mount solutions such as elimination of guide rails, the use of front facing I/O and an integrated cable trough to improve cable management and system serviceability, and integrated power-mating brackets to internalize power connections and power cabling.
We currently offer our half-depth servers with single or dual processor motherboards supporting AMD and Intel 64-bit processors, such as the AMD Opteron and Intel Xeon. We also offer configurations featuring four processor motherboards supporting the 32/64-bit AMD Opteron 800 Series processors. We make server configurations also available with dual-core and quad-core processors from both AMD and Intel, enabling even higher density and processing cores per system. We also customize our systems to meet customer-specific requirements.
Standard-Depth Rack-Mount Servers. We currently offer two compute-specific, standard-depth servers of our own design, specifically our C1104 and C2104. The C1104 is a new chassis we introduced in 2007. We also selectively leverage reseller and OEM relationships to provide additional standard-depth chassis offerings, including our C3106, also introduced in 2007. Standard-depth servers are generally deployed in situations requiring redundant power supplies, installation into existing third-party racks with front-to-back cooling (also known as “hot aisle/cold aisle” deployments), and/or a broader range of add-in card or disk drive expansion options than what can be accommodated in our half-depth offerings. We can use both half-depth and standard-depth servers in a single cabinet by modifying our cabinet’s brackets and placing the standard-depth equipment at the bottom of the rack to avoid obstructing the air plenum created by the half-depth equipment.
Scale Out Series Blade. Our Scale Out Series server was introduced in August 2004 and utilizes a proprietary server form factor that is approximately half the width, half the depth and twice the height of a traditional 1U server. We mount the servers back-to-back and side-by-side in our proprietary, purpose-built cabinet. This product line does not adhere to the traditional rack-mount standard but still enables the use of open-standard components at the motherboard, processor, DRAM and disk drive level. The Scale Out series also offers advantages in thermal efficiency and serviceability, most notably as a result of the use of taller heat dissipation sinks inside the servers and a toolless mounting design. We have applied for patent protection for a number of innovations introduced by the Scale Out Series line. This design offers advantages for select data center environments.
5
Storage
Our storage servers leverage the key design advantages of our servers, including back-to-back mounting for higher density, improved thermal efficiency and flexible DC and AC power options. Our storage servers are available in a variety of 3U half-depth and standard-depth configurations, supporting from six to eighteen disk drives. The RapidScale clustered store line, first launched in late 2006, features our proprietary RapidScale file system software integrated with two storage chassis form factors. In 2007, we released the SE3016, the newest addition to our OmniStor line of storage arrays.
Half-Depth and Standard-Depth Storage Servers. Our half-depth storage servers include the S3006, S3009, S3012 and S6026. Standard-depth configurations include the S2108 and S3118. All our storage servers are largely based on serial ATA and serial ATA II drive technology, and we introduced our new serial attached SCSI (“SAS”) configurations in 2007. Many of our customers run their own software applications on our storage servers, but we may also qualify specific third-party software applications that we pre-install on our hardware.
RapidScale Storage Appliances. We introduce our RapidScale storage appliances were introduced in November 2006. The product is available as a 3U, half-depth DC power model, the SA2150, and as a 3U, standard-depth redundant AC model, the SA3100. The hardware configurations leverage our own chassis and cabinet technology. The software is our own proprietary clustered file system appliance software. In 2007, we released a new version of the file system software, further improving performance and scalability.
RapidScale software runs on each RapidScale appliance and provides the capability of scaling one or more file systems across one or more storage appliances and appears to servers as a virtual pool of storage, with data striped across all appliances in a storage cluster. The solution presents all stored data under a single, global namespace. All of the available network or disk bandwidth can be fully utilized. As such, RapidScale simplifies management and provides near-linear scaling in performance as capacity grows with additional storage appliances. This enables effective deployment of large-scale, storage configurations at the cabinet and row level for maximum scalability. Our RapidScale High Availability (“HA”) software provides an optional second level of data protection, allowing entire appliances to fail without affecting data availability. Our RapidScale Client software runs Linux servers accessing the RapidScale appliances and provides a means of accessing the shared file system that is more efficient than traditional protocols like the network file system (“NFS”) or common internet file system (“CIFS”).
OmniStor Storage Arrays.In 2007, we streamlined our OmniStor line of storage arrays, eliminating redundant hardware technologies we previously sourced from a third party under both an OEM and resale arrangements. We then introduced our OmniStor SE3016 which provides a SAS-attached external expansion solution, in a 3U half-depth rack-mount chassis, with 16 SAS or SATA-II hot swap disk drives. Host servers may daisy chain up to eight SE3016 systems per server controller card, which provides a rack-density up to 416TB.
Our Technology Solutions
We continue to maintain a core technology focus on mechanical chassis, cabinet and environmental design to enable higher density, improved thermal management and better serviceability. We also have technologies focused on power management and power distribution, as well as hardware- and firmware-based remote management. In 2007, we brought to market our first self-contained, modular data center, which was designed to augment or replace traditional brick-and-mortar data centers faced with power and space limitations.
Power Management and Distribution. We employ a range of techniques to minimize power consumption and enable more servers to be deployed per circuit or per power distribution unit (“PDU”). We offer a DC-powered option for both our servers and storage systems.
6
Our power management techniques include:
| | • | | DC power option. We offer the ability to deploy DC powered solutions in data centers that support either AC- or DC-based power. In an AC environment, we conduct aggregated AC-DC power conversion at the top of our cabinets using removable AC-DC rectifiers. These rectifiers convert input AC power to -48V DC power, which is then distributed to the servers through bus bars internalized in the cabinets. Each server has a -48V DC power supply which is more efficient than the AC power supplies, so less input power is lost as heat. This reduces heat dissipation in the server, which generally increases the life span of components in the server. In a DC environment, we can connect directly to DC current feeds. Conducting AC-DC rectification outside of the server significantly reduces the amount of heat inside the server. Bulk AC-DC conversion at the cabinet- or PDU-level can increase power conversion efficiency versus smaller individual power supplies typically housed in the server chassis. Finally, our DC technology allows us to deploy redundancy schemes such as the ability to withstand the loss of an entire AC circuit. |
| | • | | Stagger-start time delay. Our remote management solution enables the setting of a power on time delay so that systems attached to a single AC circuit can be set to start up in a staggered fashion as opposed to all at once. This reduces aggregate power draw at system boot time and can enable additional servers to be attached to a power circuit. |
| | • | | Matching of power supply to system power draw. Because our servers are built to order, we are able to specify a power supply that is well matched to the actual system power draw, which can improve power supply efficiency. |
| | • | | Elimination of unnecessary components. By building servers to order, we are able to exclude components that draw power but are not needed by a particular customer. |
Roamer Remote Management. Our Roamer remote management technology is designed to provide a range of out-of-band and in-band remote management features to our customers. Our out-of-band features work even if the system is not functional, due to the failure of either hardware or the operating system. Out-of-band features include reboot/power cycling, stagger-start up, temperature monitoring, flashing of an LED, scripting messages to an optional LCD and changing basic input/output system (“BIOS”) settings. In-band features are only accessible if both the hardware and the operating system that is running on the hardware are functional. In-band features include full serial console access to the operating system and the ability to write messages from within the operating system to the optional LCD. Roamer enables rapid identification and location of failed servers and results in a significant reduction in the need for onsite maintenance technicians. Because Roamer includes both in-band and out-of-band features, it can offer significant cost advantages versus alternative remote management solutions that may require both managed power strips and keyboard, video and mouse (“KVM”) and Ethernet based server remote management solutions. In addition to our serial- and Ethernet-based Roamer remote management options, we now offer a KVM version. We also enable Intelligent Platform Management Interface (“IPMI”), as supported by particular motherboard platforms, upon customer request.
We provide application programming interfaces to our remote management solution and offer a “shell mode” that enables our customers to create software scripts and integrate our remote management with their data center automation software platforms. For example, many of our customers utilize readily-available third-party software, such as grid, cluster and utility computing applications, in conjunction with our compute servers. Our remote management solution is based on serial or Ethernet access techniques and is compatible with any industry standard motherboard that supports a serial header and serial BIOS redirection. We are able to support serial console operating system access for Linux, Solaris, FreeBSD and current versions of Windows such as Windows Server 2003.
Server Virtualization.We now offer a line of fully certified, high performance rack-mount servers based on VMware’s full suite of server virtualization capabilities. Released in September of 2007, the new V Series line leverages our build-to-order half-depth and standard-depth rack-mount servers with the full virtualization
7
capabilities of VMware ESX. Virtualized systems can enable data centers to achieve higher server utilization and improved efficiency rates while managing systems more effectively in mission-critical environments. Our line of virtualized servers is comprised of four configurations from our Workgroup Edition and two configurations specific to our higher capacity Enterprise Edition. The Enterprise Edition features greater memory and storage capacity. All V Series systems have the same key benefits around density, thermal management, power efficiency and serviceability of our half-depth and standard-depth rack-mount servers.
Mobile, Modular Data Center Technology. In March 2007, we launched and sold our first modular data center, a self-contained, mobile data center, featuring extreme server and storage density with highly efficient cooling and easy serviceability. In September 2007, we released the newest generation of the product, known as the ICE Cube. The new release featured a 20% increase in density levels, the introduction of a 20’ container size and a broader range of configuration options.
Designed to augment or replace traditional brick-and-mortar data centers of any size and ideal for data centers facing power and space limitations, ICE Cube features system density levels of up to 1,400 of our half-depth, rack-mount servers in a 40’x8’ container, or up to 7.1 Petabytes of storage, including our V series virtualized servers, storage servers, RapidScale and OmniStor products. Leveraging quad-core processors, a container deployed with 1,400 of our 1U half-depth servers features 11,200 processing cores in this self-contained data center environment. ICE Cube features a closed-loop liquid cooling design, which can enable up to 80% reduction in cooling costs compared with a traditional brick-and-mortar data center environment. A wide 36” central aisle enables ample room to service and access our half-depth servers and storage systems. Self-contained UPS technology and the use of DC Power improve power efficiency, which can enable further cost savings for the end user.
ICE Cube is deployed in a non-descript, secure, weather tight shipping container. It can be transported via truck, rail or ship to any location where power and networking are provided. We believe this modular data center model is ideal for a range of deployment scenarios, such as disaster recovery, business continuity, military applications and basic data center expansion. This is innovative technology and we are encouraged by the level of interest we are seeing thus far from existing and prospective customers. We believe the need for alternative, less expensive data center solutions will drive adoption of modular data center technology in the future.
Service and Support
We offer a range of service and support packages, primarily associated with installation and deployment, hardware break-fix support and onsite hardware service. We offer several standard levels of warranty support that vary depending on specific services, response times, coverage hours and duration. In addition to our standard offerings, we also customize our warranty and support agreements to meet the specific needs of customers. In addition, we often contract with third parties to provide support services to our customers, particularly in regions where we have limited customer concentrations and it is more cost-effective for us to do so.
We offer a range of professional services such as onsite cabling assistance and installation of third-party software such as grid, clustering and utility computing applications. We intend to expand the range of professional services that we offer, and we may do so through growing our internal staff or partnering with or acquiring other companies. We also intend to implement new technology tools that allow customers to better serve themselves and to better access remote service personnel that can provide faster response and higher leverage to a large population of customers.
While we desire to expand our support and services revenues, we also employ a number of techniques that mitigate the cost associated with deployment and maintenance. Our compute and storage server products are designed to be shipped in a turnkey fashion, pre-racked and pre-cabled in our cabinets. We use specifically designed shipping crates to reduce the potential for shipping damage. While we also ship smaller installations in boxes, the majority of our shipments are delivered in this turnkey fashion. This enables us to minimize the time and effort associated with onsite deployment work.
8
On occasion, at the request of a customer that has informed us that one of our products is defective; we will ship a replacement product to that customer prior to the customer returning the defective product to us. This enables the customer to use the replacement product until the defective product is repaired and returned to the customer. Generally, we do not charge for this service, unless the customer fails to return the defective product to us, in which case we will charge the customer for the replacement product.
Sales and Marketing
We focus our sales and marketing activity on large companies that need to purchase hundreds or thousands of servers per year. We have historically targeted accounts primarily within the United States, and we intend to continue to expand our sales and operations model internationally, with a focus on building a broader sales base in Europe and China.
We currently sell our products through our direct sales team, which allows us to maintain close client contact and feedback throughout the entire sales process. Our sales process begins with leads generated through targeted marketing programs, which are then logged, qualified and assigned to an account executive. After an initial lead qualification, our sales executives and sales engineers collect information regarding the customer’s data center environment and application requirements. We then collaborate with the customer’s technical point of contact and our own internal technical resources to agree upon a particular system configuration for the customer. For larger customers, we allow evaluation of one or more hardware configurations to enable the customer to conduct their own benchmarking analyses. While we tailor solutions for most customers, there is substantial commonality in underlying components, so we are able to mitigate the impact on our manufacturing and sourcing operations.
In addition to augmenting our current sales team, our long-term plan for growing sales includes expanding distribution channels, such as value added resellers, systems integrators and independent software vendors. We plan to focus our sales efforts in Europe and China primarily through the value added reseller community. We are also exploring the potential of working with large-scale OEMs both domestically and internationally.
We focus our marketing efforts on increasing brand awareness, communicating product advantages and generating qualified leads for our sales force. We rely on a variety of marketing vehicles, including our website, trade shows, advertising, public relations, industry research and collaborative relationships with suppliers and technology vendors to gain wider market access.
See Note 9 of our “Notes to Consolidated Financial Statements” included under Part II, Item 8. “Financial Statements and Supplementary Data” for additional geographic and segment information, which is incorporated herein by reference, including long-lived assets by geographic area as well as revenue from external customers attributable to segments and geographic areas during the last three years.
Product Development
Our engineering staff is responsible for the design, development, quality, documentation and release of our products. Our product development efforts focus on addressing the needs of customers deploying large computing infrastructure. These needs include density, performance, power efficiency and thermal management. We have developed cooperative working relationships with many of the world’s most advanced technology companies, such as AMD and Intel, to leverage their research and development capabilities. Additionally, we work closely with our customers to develop product innovations and incorporate these into subsequent product design. This cooperative approach allows us to develop products that meet our customers’ needs in a cost-effective manner. We monitor new technology developments, new component availability and the impact of evolving standards through customer and supplier collaboration.
Our total research and development expense was $26.3 million, $13.6 million and $2.2 million for the years ended December 29, 2007, December 30, 2006 and December 31, 2005, respectively.
9
Manufacturing and Operations
Our operational strategy is to provide our customers with built-to-order, high-quality turnkey solutions. Our operations are based on a hybrid manufacturing model that maintains control of key processes, including procurement, product configuration validation, quality assurance and testing, while leveraging the labor resources of our contract manufacturers. As a result, we are able to maintain the flexibility to scale operations as needed while minimizing capital expenditures and fixed operating costs.
Personnel in our California facilities currently manage procurement, warehousing, operations planning, validation of product configuration, assembly and testing. We have established relationships with key technology vendors and distributors for the supply of our core components and sub-assemblies, including chassis metal fabrication, memory, processors, hard disk drives, printed circuit boards, fans and power supplies. We generally use multiple vendors on commodity products in order to obtain competitive pricing.
As part of our hybrid manufacturing model, we maintain in-house capabilities that we typically use to fulfill urgent orders, smaller orders and prototype system production. In order to reduce our reliance on a single vendor, we established relationships with three contract manufacturers, E-Cycle, Synnex and Realtime Technologies. During 2007 and 2006, Synnex and E-Cycle manufactured and assembled the majority of our products. During 2005, Synnex manufactured and assembled the majority of our products. We continue to evaluate additional contract manufacturers in order to expand capacity, address new geographic markets and to better serve our existing customers. None of our contract manufacturers is the sole manufacturer of any one of our products. We maintain staff at each of the manufacturing facilities to ensure that we have adequate control over the manufacturing process and quality control.
We perform final testing, cabling and packaging onsite at our contract manufacturers’ facilities, as well as in our facilities. We deliver our cabinet-level products in specially designed shipping crates, and generally ship them fully racked, cabled and tested. This simplifies the delivery and installation process, allowing field delivery staff to roll the cabinets out of the crate and quickly connect them to the datacenter power grid and network environment.
We generally only manufacture products after receipt of orders from our customers. However, customers may generally cancel or reschedule orders without penalty, and delivery schedules requested by customers in these orders frequently vary based upon each customer’s particular needs. For these reasons, orders may not constitute a firm backlog and may not be a meaningful indicator of future revenues.
Competition
The market for our products is highly competitive, rapidly evolving and subject to changing technology, customer needs and new product introductions. In the server market, we compete primarily with large vendors of x86 servers based in the United States, such as Dell Inc. (“Dell”), Hewlett-Packard Company (“H-P”), International Business Machines Corporation (“IBM”) and Sun Microsystems, Inc (“Sun”). In the storage market, we compete primarily with EMC Corporation (“EMC”), Network Appliance, Inc (“Net-App”), Hitachi Data Systems, Inc. (“HDS”) and Super Micro Computer, Inc (“Super Micro”). In all of our markets we compete principally on the basis of product features and performance, total cost of ownership, customer service, configurability and manageability and the ability to deliver clean and sustainable “green” technology. The ability of competitors to leverage multiple business lines, which we do not offer, allows them to target customers with benefits and deeper discounted pricing. Also, as we enter international markets, we anticipate facing additional competition from foreign vendors.
Intellectual Property
We rely on a combination of patent, trademark, copyright and trade secret laws and disclosure restrictions to protect our intellectual property rights. We also enter into confidentiality and proprietary rights agreements with
10
our employees, consultants and other third parties and control access to our proprietary information. We have twelve issued patents and a number of patent applications pending in the United States and a number of patent applications pending internationally. Our most important patent relates to back-to-back positioning, front facing I/O and multi-directional air flow cooling, and expires in January 2020. If a claim is asserted that we have infringed the intellectual property of a third party, we may be required to seek licenses to that technology. In addition, we have a number of non-exclusive licenses from third party hardware and software vendors that allow us to resell certain hardware products and incorporate their computer software products in our product offerings.
The steps we have taken to protect our intellectual property rights may not be adequate. Third parties may infringe or misappropriate our proprietary rights. In order to protect our intellectual property rights, we may need to take legal action against those we believe infringe our rights. In the past we have brought patent infringement suits against: Super Micro Computer, Inc. in one action; King Star Computer, Inc. in a second action; and Einux, Inc., Einux Systems, L.L.C., Einux Network Solutions, HPC Systems, Inc. and Micro-Technology Concepts, Inc. in third action. Although we were successful in these suits, there is no guarantee that we will be successful in protecting our intellectual property in the future. Competitors may also independently develop technologies that are substantially equivalent or superior to the technologies we employ in our products. If we fail to protect our proprietary rights adequately, our competitors could offer similar services, potentially significantly harming our competitive position and decreasing our revenues.
Employees
As of December 29, 2007, we had 374 full-time employees, consisting of 111 in manufacturing, 71 in research and development, 63 in service and support, 78 in sales and marketing and 51 in general and administrative functions within the organization. These totals include 37 temporary or contract employees. We consider our relationships with our employees to be good.
Executive Officers of the Registrant
Our executive officers, their ages and positions as of March 6, 2008, are as follows:
| | | | |
Name | | Age | | Position |
Mark J. Barrenechea | | 43 | | Chief Executive Officer, President and Director |
Anthony Carrozza | | 53 | | Senior Vice President of Sales |
Giovanni Coglitore | | 40 | | Co-founder and Chief Technology Officer |
Anthony P. Gaughan | | 43 | | Senior Vice President and Chief Products Officer |
Maurice Leibenstern | | 47 | | General Counsel, SVP and Corporate Secretary |
Madhu Ranganathan | | 43 | | Chief Financial Officer |
David M. Yoffie | | 48 | | Senior Vice President of Operations |
Mark Barrenechea joined Rackable Systems in November 2006 as a member of our board of directors, and in April 2007 became our President and Chief Executive Officer. Previously, Mr. Barrenechea served as Executive Vice President and CTO for CA, Inc. (“CA”), (formerly Computer Associates International, Inc.), a software company, from 2003 to 2006 and was a member of the executive management team. Prior to CA, Mr. Barrenechea served as Senior Vice President of Applications Development at Oracle Corporation, an enterprise software company, from 1997 to 2003, managing a multi-thousand person global team while serving as a member of the executive management team. From 1994 to 1997, Mr. Barrenechea served as Vice President of Development at Scopus, an applications company. Prior to Scopus Mr. Barrenechea was with Tesseract, an applications company, where he was responsible for reshaping the company’s line of human capital management software as Vice President of Development. Mr. Barrenechea holds a Bachelor of Science degree in computer science from Saint Michael’s College.
Anthony Carrozza joined Rackable in March 2008. In his role as Senior Vice President of Sales, Mr. Carrozza is responsible for Rackable Systems’ product sales for both direct and in-direct on a worldwide basis. Mr. Carrozza brings more than twenty years of worldwide sales experience in the technology sector. Prior to joining Rackable, Mr. Carrozza was with Neterion, Inc., a customer loyalty company from 2006 to 2008,
11
where he was vice president, sales. Mr. Carrozza formerly served with Quantum Corporation, a manufacturer of storage systems, from 1987 to 2006. When Mr. Carrozza left Quantum, he held the title of senior vice president, worldwide sales. Mr. Carrozza holds a Bachelor of Arts degree in political science from Iona College.
Giovanni Coglitore co-founded Rackable Systems in 1999 and has been our Chief Technology Officer since December 2002 and was a member of our board of directors from our formation until January 2006. From September 1999 to December 2002, Mr. Coglitore served as Chief Executive Officer. From April 1992 to September 1999, Mr. Coglitore served as co-founder and General Partner of International Computer Systems, a server and storage company. Mr. Coglitore holds a Bachelor of Arts in History from the University of California at Los Angeles.
Anthony Gaughan joined Rackable in July, 2007. In his role as Senior Vice President & Chief Products Officer, Mr. Gaughan is responsible for Rackable Systems’ overall product direction, including coordination of product vision and strategy, product design and development, quality, engineering and product management. Mr. Gaughan brings more than two decades of technology operations and leadership, and has held senior management and operations roles at major software companies such as CA, Inc., Oracle Corporation and J.D. Edwards/PeopleSoft. Prior to joining Rackable, Mr. Gaughan was with Satmetrix, a customer loyalty company from 2005 to 2007. Mr. Gaughan formerly served from 2004 to 2005 as Senior Vice President and General Manager for CA’s award-winning Unicenter product line and from 2003 to 2004 was Vice President of EnterpriseOne ERP at J.D. Edwards/PeopleSoft where he held P&L responsibility for the EnterpriseOne ERP product. Mr. Gaughan began his career at Oracle Corporation in 1994, developing products for a broad spectrum of market segments including CRM, media (digital assets), product lifecycle management and manufacturing. Mr. Gaughan holds Bachelor of Science degree in computer science from Heriot-Watt University in Edinburgh, Scotland.
Maurice Leibenstern joined Rackable Systems in September 2007. Mr. Leibenstern brings more than 20 years of high tech legal experience to Rackable Systems. Most recently, he was at CA, Inc. from 1998 to 2007, as the Chief Legal Counsel for Worldwide Sales, while serving as a Senior Vice President and member of the company’s Senior Leadership Team. Prior to CA, Mr. Leibenstern worked at IBM, a computer hardware and software company, from 1992 to 1997. He holds a Bachelor of Arts in History from Brooklyn College of the City University of New York and a J.D. from New York University School of Law.
Madhu Ranganathan joined Rackable Systems in December 2005 as our Vice President of Finance and became our Chief Financial Officer in April 2006. From August 2002 to November 2005, Ms. Ranganathan served as the Vice President and Corporate Controller at Redback Networks, a publicly traded company providing telecommunication networking equipment. From January 2000 to August 2002, Ms. Ranganathan served as Vice President of Finance at Jamcracker, Inc., an application services provider. From November 1996 to December 1999, Ms. Ranganathan served as Director of Finance for BackWeb Technologies, an Internet software company. Ms. Ranganathan holds a B.S. in Finance from the University of Madras, India and an Masters of Business Administration from the University of Massachusetts and is a Certified Public Accountant in California and a Chartered Accountant from India.
David Yoffie joined Rackable in August, 2007 as our Senior Vice President of Manufacturing Operations and Service. Mr. Yoffie brings extensive experience in manufacturing, customer service and operations to the Rackable Systems team. Prior to joining Rackable, between 2005 and 2007, Mr. Yoffie was vice president of customer operations at SS8 Networks, a telecommunications and law enforcement software and equipment company. From 2002 to 2005 Mr. Yoffie was a principal in Yoffie Advisory Services, a consulting company to the telecommunications industry. Mr. Yoffie was senior vice president of manufacturing at Kestrel Solutions, a fiber telecommunications equipment company, from 2000 to 2002. Mr. Yoffie was vice president of operations at GoDigital Networks, a telecommunications equipment company, from 1999 to 2000. He has held key management roles at a variety of rapid-growth organizations, including Aspect Communications, a customer contact center equipment and software company, and Pittiglio, Rabin, Todd and McGrath, a leading operational strategy, manufacturing and customer experience provider. Mr. Yoffie holds Masters of Science and Bachelors of Science degrees from Stanford University.
12
Item 1A.Risk Factors
Risks Related To Our Business and Industry
Our quarterly operating results have fluctuated significantly in the past and will continue to fluctuate in the future, which could cause our stock price to decline.
Our quarterly operating results have fluctuated significantly in the past, and we believe that they will continue to fluctuate in the future, due to a number of factors, many of which are beyond our control. For example, our revenues grew from $80.5 million for the quarter ended September 30, 2006 to $106.9 million for the quarter ended December 30, 2006, declined to revenues of $72.0 million for the quarter ended March 31, 2007, increased to $82.2 million for the quarter ended June 30, 2007, increased to $87.2 million for the quarter ended September 29, 2007 and increased to $ 111.7 million for the quarter ended December 29, 2007. Further, our gross margin and net income decreased dramatically in 2007 as a result of competition for the business derived from our principal customers and a $16.6 million charge for excess and obsolete inventory recorded in 2007. We expect our revenues, gross margin and earnings per share will fluctuate on a quarterly basis in future periods. If in future periods our operating results do not meet the expectations of investors or analysts who choose to follow our company, our stock price may fall. Factors that may affect our quarterly operating results include the following:
| | • | | fluctuations in the buying patterns and sizes of customer orders from one quarter to the next; |
| | • | | increased competition causing us to sell our products or services at decreasing margins; |
| | • | | location and timing requirements for the delivery of our products and services; |
| | • | | addition of new customers or loss of existing customers, especially involving our largest customers; |
| | • | | gross margin obtained on the sales of products and services, especially to our largest customers; |
| | • | | write-off of excess and obsolete inventory; |
| | • | | impairment and shortening of the useful life of components from our suppliers; |
| | • | | unexpected changes in the price for, and the availability of, components from our suppliers; |
| | • | | our ability to enhance our products with new and better designs and functionality; |
| | • | | costs associated with obtaining components to satisfy customer demand; |
| | • | | productivity and growth of our sales force; |
| | • | | actions taken by our competitors, such as new product announcements or introductions or changes in pricing; |
| | • | | revenues and gross margin disparity among our lines of server product and storage product lines; |
| | • | | market acceptance of our newer products, such as ICE Cube; |
| | • | | technology regulatory compliance, certification and intellectual property issues associated with our products; |
| | • | | the payment of unexpected legal fees and potential damages or settlements resulting from protecting or defending our intellectual property or other matters; |
| | • | | the payment of significant damages or settlements resulting from faulty or malfunctioning products or the provision of services unsatisfactory to our customers; |
| | • | | the departure and acquisition of key management and other personnel; and |
| | • | | general economic trends, including changes in information technology spending or geopolitical events such as war or incidents of terrorism. |
13
We are substantially dependent on a concentrated number of customers, specifically Internet companies that purchase in large quantities. If we are unable to maintain or replace our relationships with customers and diversify our customer base, our revenues may fluctuate and our growth may be limited.
Historically, a significant portion of our revenues has come from a limited number of customers. There can be no guarantee that we will be able to sustain our revenue levels from these customers because our revenues have largely been generated in connection with these customers’ decisions to deploy large-scale server and storage farms and their capacity requirements may become fulfilled. In 2007, our three largest customers accounted for 64% of our revenues. In 2006, our two largest customers accounted for 60% of our revenues Moreover, the proportion of our revenues derived from a limited number of customers may be even higher in any future quarter. If we cannot maintain or replace the customers that purchase large amounts of our products, or if they do not purchase products at the levels or at the times that we anticipate, our ability to maintain or grow our revenues will be adversely affected. In addition, customer concentration may expose us to credit risk, as a large portion of our accounts receivable may be from a small number of customers. For example, as of December 29, 2007, 80% of our accounts receivable were owed to us from three customers.
In 2007 and 2006, a substantial majority of our revenues were generated from companies that compete in the Internet market. A significant part of our growth has been due to the fact that these companies are doing well and, in many cases, expanding and, as a result, have been purchasing large quantities of products from us. If economic factors change for these Internet companies, as they have before, our ability to maintain or grow our revenues will be adversely affected.
We face intense competition from the leading enterprise computing companies in the world as well as from emerging companies. If we are unable to compete effectively, we might not be able to achieve sufficient market penetration, revenue growth or profitability.
The markets for compute server products and storage products are highly competitive. In addition to intensely competitive smaller companies we face challenges from some of the most established companies in the computer industry, such as Dell, H-P, IBM and Sun. in the computer server market. In the storage market, we compete primarily with EMC, H-P, HDS, Super Micro and Net-App. These larger competitors have at least the following advantages over us:
| | • | | substantially greater market presence and greater name recognition; |
| | • | | substantially greater financial, technical, research and development, sales and marketing, manufacturing, distribution and other resources; |
| | • | | longer operating histories; |
| | • | | a broader offering of products and services; |
| | • | | more established relationships with customers, suppliers and other technology companies; and |
| | • | | the ability to acquire technologies or consolidate with other companies in the industry to compete more effectively. |
Because these competitors have greater financial strength than we do and are able to offer a more diversified bundle of products and services, they may have the ability to severely undercut the pricing of our products or provide additional products or servicing at little or no cost, which would make us less competitive or force us to reduce our average selling prices, negatively impacting our margins. In the past year, we have had large transactions where one or more competitors undercut our prices causing us to reduce our price, which negatively impacted our gross margin on that transaction and our overall gross margin. In addition, we have on occasion lost sales opportunities due to a competitor undercutting the pricing of our products or maintaining superior brand recognition. These competitors may be able to develop products that are superior to the commercially available components that we incorporate into our products, or may be able to offer products that provide significant price
14
advantages over those we offer. For instance, a competitor could use its resources to develop proprietary motherboards with specifications and performance that are superior in comparison with the platforms that are currently available to the marketplace, which could give that competitor a distinct technological advantage. In addition, if our competitors’ products become more accepted than our products, our competitive position will be impaired.
As the enterprise computing industry evolves, we expect to encounter additional competitors, including companies in adjacent technology businesses such as storage and networking infrastructure and management, companies providing technology that is complementary to ours in functionality, such as datacenter management software, contract manufacturers, and other emerging companies that may announce server product offerings. Moreover, our current and potential competitors, including companies with whom we currently have strategic alliances, may establish cooperative relationships among themselves or with other third parties. If this occurs, new competitors or alliances may emerge that could negatively impact our competitive position.
Our products incorporate open standard, commoditized components and materials that we obtain in spot markets, and, as a result, our cost structure and our ability to respond in a timely manner to customer demand are sensitive to volatility of the market prices for these components and materials.
A significant portion of our cost of goods sold is directly related to the pricing of commoditized materials and components utilized in the manufacture of our products, such as memory, hard drives, central processing units (“CPUs”), or power supplies. As part of our procurement model, we generally do not enter into long-term supply contracts for these materials and components, but instead, purchase these materials and components in a competitive bid purchase order environment with suppliers or on the open market at spot prices. As a result, our cost structure is affected by the availability and price volatility in the marketplace for these components and materials, especially for DRAM, and new versions of hard drives and CPUs that are introduced by our suppliers. In the fourth quarter of 2006, we experienced volatility in DRAM prices that caused us to procure DRAM at prices higher than anticipated, which negatively impacted our overall gross margin for the quarter. In 2007, prices of DRAM have decreased. This volatility makes it difficult to predict expense levels and operating results and may cause them to fluctuate significantly. In addition, if we are successful in growing our business, we may not be able to continue to procure components solely on the spot market, which would require us to enter into contracts with component suppliers to obtain these components. This could increase our costs and decrease our gross margins. Also, if we try to take advantage of favorable pricing of a particular component by purchasing a large quantity, there is the risk that a shift in our customers’ preferred components may render any stockpiled components of little value to us. For example, we recorded a $16.6 million expense related to the write down for excess and obsolete inventory during fiscal year 2007, contributed in part by customer driven technology platform shift from AMD to Intel, affecting demand for memory, motherboards, CPUs and chassis that we had previously purchased.
In addition, because our procurement model involves our ability to maintain a low inventory and to acquire materials and components as needed, and because we do not enter into long-term supply contracts for these materials and components, our ability to effectively and efficiently respond to customer orders may be constrained by the then-current availability or the terms and pricing of these materials and components. Our industry has experienced component shortages and delivery delays in the past, and in the future we may experience shortages or delays of critical components as a result of strong demand in the industry or other factors. As one example, DRAM can represent a significant portion of our cost of revenues, and both the price and availability of various kinds of DRAM are subject to substantial volatility in the spot market. In the past, we have encountered situations where we were forced to pay higher prices than we anticipated for DRAM, which occurred in the fourth quarter of 2006, and we have encountered situations where DRAM was in tight supply and we were unable to deliver customer orders on their anticipated delivery dates. As another example, the industry in the past has experienced a shortage of selected Intel chips, which caused some of our motherboard suppliers to reduce or suspend shipments of motherboards using these chips. This impacted our ability to ship selected configurations to some of our customers, and in some cases accelerated a transition to other platforms. If
15
shortages or delays arise, the prices of these components may increase or the components may not be available at all. We may not be able to secure enough components at reasonable prices or of acceptable quality to build new products to meet customer demand, which could adversely affect our business and financial results. In addition, if any of our suppliers, such as Intel or AMD, were to increase the costs to Rackable for components we use, we would either pass these price increases on to our customers, which could cause us to lose business from these customers, or we would need to absorb these price increases, which would cause our margins to decrease, either of which could adversely affect our business and financial results.
We intend to expand our operations and increase our expenditures in an effort to grow our business. If we are not able to manage this growth and expansion, or if our business does not grow as we expect, our operating results may suffer.
We intend to continue to grow our business by entering new markets, developing new product and service offerings and pursuing new customers. In connection with this growth, we expect that our annual operating expenses may increase over the next several years to the extent we expand our sales and marketing, research and development, manufacturing and production infrastructure, and our customer service and support efforts. Our failure to timely or efficiently expand operational and financial systems and to implement or maintain effective internal controls and procedures could result in additional operating inefficiencies that could increase our costs and expenses more than we had planned and might cause us to lose the ability to take advantage of market opportunities, enhance existing products, develop new products, satisfy customer requirements, respond to competitive pressures or otherwise execute our business plan. Additionally, if we do increase our operating expenses in anticipation of the growth of our business and this growth does not meet our expectations, our financial results could be negatively impacted.
If we have acquired or acquire or invest in other companies, assets or technologies and we are not able to integrate them with our business, or we do not realize the anticipated financial and strategic goals for any of these existing or future transactions, our financial performance may be impaired.
If appropriate opportunities present themselves, as they have in the past, we may consider acquiring or making investments in companies, assets or technologies that we believe are strategic. We only have limited experience in doing so, and for any such company, asset or technology which we successfully acquire or invest in, we will be exposed to a number of risks, including:
| | • | | we may find that the acquired company, asset or technology does not further our business strategy, that we overpaid for the company, asset or technology or that the economic conditions underlying our acquisition decision have changed; |
| | • | | we may have difficulty integrating the assets, technologies, operations or personnel of an acquired company, or retaining the key personnel of the acquired company; |
| | • | | our ongoing business and management’s attention may be disrupted or diverted by transition or integration issues and the complexity of managing geographically or culturally diverse enterprises; |
| | • | | we may encounter difficulty entering and competing in new product or geographic markets or increased competition, including price competition or intellectual property litigation; and |
| | • | | we may experience significant problems or liabilities associated with product quality, technology and legal contingencies relating to the acquired business or technology, such as intellectual property or employment matters. |
If we were to proceed with one or more significant acquisitions or investments in which the consideration included cash, we could be required to use a substantial portion of our available cash. To the extent we issue shares of capital stock or other rights to purchase capital stock, including options and warrants, existing stockholders might be diluted and earnings per share might decrease. In addition, acquisitions and investments may result in the incurrence of debt, large one-time write-offs, such as of acquired in-process research and development costs, and restructuring charges.
16
We intend to further expand our sales into additional international markets, which may be more difficult than we expect, and if we are unable to do so successfully, our revenues and operating results may be adversely impacted.
One component of our growth strategy is to continue to expand into international markets. However, we have limited experience in selling our systems overseas, and we may encounter unexpected difficulties in doing so. To date, our sales to these geographies have been primarily originated from our U.S. based multi-national customers. If we are not able to successfully expand into international markets, our ability to grow our business will be adversely affected. Some of the factors that may impact our ability to initiate and maintain sales in foreign markets include:
| | • | | our ability to establish international manufacturing, support and service, which could be costly and time consuming; |
| | • | | our ability to establish channel relationships with resellers in international markets; |
| | • | | adoption of new laws or changes to existing international laws; |
| | • | | our ability to service international installations; |
| | • | | compliance with local laws, regulations and requirements for doing business in such jurisdictions; |
| | • | | tax liabilities and currency fluctuations; and |
| | • | | political and economic instability. |
Our business depends on decisions by potential customers to adopt our modular, open standard-based products and to replace their legacy server systems with our products, and they may be reluctant to do so, which would limit our growth.
Our business depends on companies moving away from large proprietary RISC/UNIX servers to standardized servers that utilize commercially available x86 processor architectures and can deploy a variety of operating systems, including Linux and Microsoft Windows. Excluding sales to Microsoft Corporation, we believe that a majority of the server systems that we sold in 2007, 2006 and 2005 ran on the Linux operating system and are subject to the GNU General Public License. While litigation involving the SCO Group’s claim against IBM that Linux is an unauthorized derivative work of the UNIX® operating system has been stayed due to SCO’s bankruptcy filing, if it ultimately results in a ruling that users of Linux must pay royalties to SCO or others, that could impede broader Linux adoption and could materially harm our ability to sell our products based on the Linux operating system. In addition, Microsoft has publicly claimed that Linux infringes 235 or more of Microsoft’s patents and has entered into transactions with Novell inc. and other Linux distributors under which the parties reportedly agree, among other things, not to sue each other’s customers for potential patent infringements related to Linux. It is possible that a party (including Microsoft) could prove a claim for proprietary rights in the Linux operating system or other programs developed and distributed under the GNU General Public License. In addition, the GNU General Public License is a subject of litigation, and it is possible that a court could hold these licenses to be unenforceable in that litigation. Any ruling by a court that the Linux operating system or significant portions of it may not be copied, modified or distributed subject only to the minimal restrictions contained in these licenses, that users or distributors of Linux must pay royalties to Microsoft or others or that these licenses are not enforceable could also impede broader Linux adoption and materially harm our ability to sell our products based on the Linux operating system. Further, because potential customers have often invested significant capital and other resources in existing systems, many of which run mission-critical applications, customers may be hesitant to make dramatic changes to their datacenter systems. The failure of our customers and potential customers to replace their legacy server systems and adopt open standard-based modular technologies could have a material adverse impact on our ability to maintain or generate additional revenues.
17
We rely primarily on our direct sales force to generate revenues, and may be unable to hire additional qualified sales personnel in a timely manner or retain our existing sales representatives.
To date, we have relied primarily on our direct sales force to sell our products in the United States. Because we are looking to expand our customer base and grow our sales to existing customers, we will need to continue to hire qualified sales personnel if we are to achieve our anticipated revenue growth. The competition for qualified sales personnel in our industry, and particularly in Silicon Valley, is very intense. If we are unable to hire, train, deploy and manage qualified sales personnel in a timely manner, our ability to grow our business will be impaired. For example, in the past it has taken us up to six months to hire a qualified sales executive and it may take a newly-hired sales executive up to nine months after hiring to become productive, resulting in aggregate lag time between the commencements of the search to productivity, in excess of one year. We have just hired a new senior vise president of sales and he is in the process of integrating himself into our company. In addition, if we are unable to retain our existing sales personnel, or if our sales personal are ineffective, our ability to maintain or grow our current level of revenues will be adversely affected. In addition, a large percentage of our revenue is generated from a small number of customers. If we are unable to retain the sales personnel who are responsible for those customer accounts, our business could be negatively impacted.
We are continuing to develop and execute upon a channel strategy to generate additional sales and revenues, and the failure to successfully expand channel sales might affect our ability to sustain revenue growth and may harm our business and operations.
An increasing portion of our sales strategy is to develop our sales efforts through the use of resellers and other third parties to sell our systems. We may not be successful in building or expanding relationships with these third parties. Further, even if we do develop and expand these relationships, they may conflict with our direct sales efforts in some territories. Ineffective marketing of our products by our resellers or disruptions in our distribution channels could lead to decreased sales or slower than expected growth in revenues and might harm our business and operations.
Our sales cycle requires us to expend a significant amount of resources, and could have an adverse effect on the amount, timing and predictability of future revenues.
The sales cycle of our products, beginning from our first customer contact to closing of the sale, often ranges from three to six months. We may expend significant resources during the sales cycle and ultimately fail to close the sale. The success of our product sales process is subject to factors, over which we have little or no control, including:
| | • | | the timing of our customers’ budget cycles and approval processes; |
| | • | | our customers’ existing use of, or willingness to adopt, open standard server products, or to replace their existing servers or expand their processing capacity with our products; |
| | • | | the announcement or introduction of competing products; and |
| | • | | established relationships between our competitors and our potential customers. |
We expend substantial time, effort and money educating our current and prospective customers as to the value of our products. Even if we are successful in persuading lower-level decision makers within our customers’ organizations of the benefits of our products, senior management might nonetheless elect not to buy our products after months of sales efforts by our employees or resellers. If we were unsuccessful in closing sales after expending significant resources, our revenues and operating expenses will be adversely affected.
If we are unable to protect our intellectual property adequately, we may not be able to compete effectively.
Our intellectual property is critical to our success and our ability to compete. If we fail to protect our intellectual property rights adequately, our competitors might gain access to our technology. Unauthorized
18
parties may attempt to copy or otherwise obtain and use our proprietary technology despite our efforts to protect our intellectual property. For example, in September 2005, we filed a patent infringement action against one defendant in response to which the defendant counterclaimed that two of our patents are invalid and not infringed. In addition, we previously initiated two patent infringement actions against six defendants, seeking to enforce our intellectual property rights. We obtained consent judgments and permanent injunctions against five of the defendants, and reached a confidential settlement with the sixth.
However, litigation is inherently uncertain, and there is no assurance that any litigation we initiate will have a successful outcome. Monitoring unauthorized use of our technology is difficult, and we cannot be certain that the steps we have taken will prevent unauthorized use of our technology, particularly in foreign countries where we have two patent applications pending but do not have any issued patents, and the laws may not protect our proprietary rights as fully as the laws of the United States. Any claims or litigation that we have initiated or that we may initiate in the future to protect our proprietary technology could be time consuming and expensive and divert the attention of our technical and management resources whether or not the claims or litigation are decided in our favor. We currently have a small number of patents issued in the United States and a number of utility patent applications pending. These patents may be limited in value in asserting our intellectual property rights against more established companies in the computer technology sector that have sizeable patent portfolios and greater capital resources. In addition, patents may not be issued from these patent applications, and even if patents are issued, they may not benefit us or give us adequate protection from competing products. For example, issued patents might be circumvented or challenged, and could be declared invalid or unenforceable. Moreover, if other companies develop unpatented proprietary technology similar to ours or competing technologies, our competitive position will be weakened.
If we are found to have violated the intellectual property rights of others, we could be required to indemnify our customers, resellers or suppliers, redesign our products, pay significant royalties and enter into license agreements with third parties.
Our industry is characterized by a large number of patents, copyrights, trade secrets and trademarks and by frequent litigation based on allegations of infringement or other violation of intellectual property rights. As we continue our business, expand our product lines and our product functionality, and expand into new jurisdictions around the world, third parties may assert that our technology or products violate their intellectual property rights. Any claim, regardless of its merits, could be expensive and time consuming to defend against. It would also divert the attention of our technical and management resources. Successful intellectual property claims against us could result in significant financial liability, impair our ability to compete effectively, or prevent us from operating our business or portions of our business. In addition, resolution of claims may require us to redesign our technology, to obtain licenses to use intellectual property belonging to third parties, which we may not be able to obtain on reasonable terms, to cease using the technology covered by those rights, and to indemnify our customers, resellers or suppliers. Any of these events could negatively affect our competitive position and materially harm our business, financial condition and results of operations.
If we lose the services of one or more members of our current executive management team or other key employees, or if we are unable to attract additional executives or key employees, we may not be able to execute on our business strategy.
Our future success depends in large part upon the continued service and enhancement of our executive management team and other key employees, including, for example, Mark Barrenechea, who joined our company as our chief executive officer, at the end of April 2007. Changes in management can be disruptive within a company, which could negatively affect our operations, our culture and our strategic direction. All of our employees are “at will”, and their employment can be terminated by us or them at any time. The failure of our management team to seamlessly manage employee transitions, or the loss of services of any of these executives or of one or more other members of our executive management or sales team or other key employees could seriously harm our business. Competition for qualified executives is intense, particularly in Silicon Valley, and if
19
we are unable to continue expanding our management team, or successfully integrate new additions to our management team in a manner that enables us to scale our business and operations effectively, our ability to operate effectively and efficiently could be limited or negatively impacted.
If we fail to maintain or expand our relationships with our suppliers, we may not have adequate access to new or key technology necessary for our products, and, as a result, our ability to deliver leading-edge products may be impaired.
In addition to the technologies we develop, our suppliers develop product innovations at our direction that are requested by our customers. In many cases, we retain the ownership of the intellectual property developed by these suppliers. In addition, we rely heavily on our component suppliers, such as Intel and AMD, to provide us with leading-edge components. If we are not able to maintain or expand our relationships with our suppliers or continue to leverage their research and development capabilities to develop new technologies desired by our customers, our ability to deliver leading-edge products may be impaired and we could be required to incur additional research and development expenses.
We depend on our server products for the majority of our revenues. If market acceptance of our compute server products does not continue, we may not be able to achieve or sustain growth.
Sales of our compute server products accounted for 91% of revenues in 2007 and 90% of revenues in 2006. If our compute server products fail to maintain market acceptance, or if we are unsuccessful in developing improved products or products to replace or supplement our current server product lines, we may not grow our business and revenues as we expect. Further, because our customers are engaged in large-scale data center implementations, if customers believe that new generations of our products will become available in the near future, this perception may cause customers to delay or cancel existing orders, which would affect our ability to generate revenues in accordance with forecasted levels.
We rely on contract manufacturers to manufacture our products, and our failure to successfully manage our relationships with these contract manufacturers could impair our ability to deliver our systems in a manner consistent with required volumes or delivery schedules, which could damage our relationships with our customers and decrease our revenues.
We rely on a very small number of contract manufacturers to assemble and test a majority of our products. None of these third-party contract manufacturers are obligated to perform services or supply products to us for any specific period, or in any specific quantities, except as may be provided in a particular purchase order. Moreover, none of our contract manufacturers has provided contractual assurances to us that adequate capacity will be available to us to meet future demand for our products. If our contract manufacturers are not able to maintain our high standards of quality, are not able to increase capacity as needed, or are forced to shut down a factory, our ability to deliver quality products to our customers on a timely basis may decline, which would damage our relationships with customers, decrease our revenues and negatively impact our growth.
Our customers require a high degree of reliability in our products and services, and if we cannot meet their expectations our relationships with our customers could be damaged and demand for our products and services will decline.
Because our customers rely on our products and services for their enterprise or mission critical applications, any failure to provide high quality products and reliable services, whether caused by our own failure or failures by our suppliers or contract manufacturers, could damage our reputation and reduce demand for our products and services. In addition, delays in our ability to fill product orders as a result of quality control issues, such as an increase in failure rates or the rate of product returns, may negatively impact our relationships with our customers and harm our revenues and growth.
20
Uncertainty in the credit market may negatively affect the value of auction rate securities owned by us and our ability to liquidate these securities.
Our short-term investments as of December 29, 2007, include various auction rate securities (“ARS”) with a market value of $64.6 million. ARS are variable-rate debt securities. While the underlying security has a long-term maturity, the interest rate is reset through Dutch auctions that are held at pre-determined intervals, usually every 28 days. In the past, liquidity for ARS was provided by this auction process that allowed investors to roll over their holdings or obtain immediate liquidity by selling the ARS at market. Recent uncertainty in the credit market has negatively affected these auctions and certain of these auctions have not had sufficient bidders to allow investors to complete a sale of ARS. All of the ARS that we held at December 29, 2007 had a successful reset in January 2008. In February 2008, auctions related to $9.1 million of ARS owned by us have failed. These are the only ARS investments in our portfolio as of March 1, 2008. In the future, failed auctions for our ARS may affect our ability to liquidate these ARS until a future auction is successful or until we decide and are able to sell the ARS in a secondary market. In addition, failed auctions may affect the fair value of our ARS and require the reclassification of these securities from short-term investments to long-term investments and may result in an impairment charge.
Maintaining and improving our financial controls and the requirements of being a public company may strain our resources and divert management’s attention.
We are subject to the reporting requirements of the Securities Exchange Act of 1934 or the Exchange Act, the Sarbanes-Oxley Act of 2002 and The NASDAQ Stock Market Rules. The requirements of these rules and regulations have increased our legal and financial compliance costs, make some activities more difficult, time-consuming or costly and may also place undue strain on our personnel, systems and resources.
The Sarbanes-Oxley Act requires, among other things, that we maintain effective disclosure controls and procedures and internal control over financial reporting. This can be difficult to do. As a result of this and similar activities, management’s attention may be diverted from other business concerns, which could have a material adverse effect on our business, financial condition and results of operations. In addition, if we are unable to continue to meet these requirements, we may not be able to remain listed on the NASDAQ Global Select Market
We have material weaknesses in our internal control over financial reporting, and these material weaknesses create a reasonable possibility of material misstatements in our financial statements.
As a publicly traded company we must maintain effective disclosure controls and procedures and internal control over financial reporting. This can be difficult to do. In connection with the preparation of our financial statements for the year ended December 29, 2007, we determined that we had two material weaknesses, and therefore determined that our internal control over financial reporting was not effective, and therefore created a reasonable possibility of material misstatements in our financial statements. These material weaknesses related to our accounting for inventory valuation and accounting for income taxes, as more fully explained in “Item 9A. Controls and Procedures” of this Annual Report on Form 10-K.
In order to improve and to maintain the effectiveness of our internal control over financial reporting and disclosure controls and procedures, significant resources and management oversight will be required. We have begun the process of remediating these material weaknesses, but this process will take time, and we will not be able to assert that we have remediated these material weaknesses until the procedures that we put in place have been working for a sufficient period of time for us to determine that they are effective. As a result of this and similar activities, management’s attention may be diverted from other business concerns, which could have a material adverse effect on our business, financial condition and results of operations. If we are unable to remediate these material weaknesses, or in the future report one or more additional material weaknesses, there is a reasonable possibility that a material misstatement of our annual or interim financial statements will not be prevented or detected on a timely basis. This could result in a restatement of our financial statements or impact our ability to accurately report financial information on a timely basis, which could adversely affect our stock price.
21
Risk Related to Owning Our Stock
Our stock price in the past has been volatile, and may continue to be volatile or may decline regardless of our operating performance, and investors may not be able to resell shares at or above the price at which they purchased the shares.
Our stock has been publicly traded for a relatively short period of time, having first begun trading in June 2005. During that time our stock price has fluctuated significantly, from a low of approximately $7.76 per share to a high of approximately $56 per share. At times the stock price has changed very quickly. For example, most recently, our stock has dropped from a high of more than $14 per share at the beginning of October 2007 to a low of less than $8 per share towards the end of January 2008. If investors purchase shares of our common stock, they may not be able to resell those shares at or above the price at which they purchase them. The market price of our common stock may fluctuate significantly in response to numerous factors, many of which are beyond our control including:
| | • | | price and volume fluctuations in the overall stock market; |
| | • | | the financial projections we may provide to the public, any changes in these projections or our failure to meet these projections; |
| | • | | actual or anticipated fluctuations in our operating results; |
| | • | | changes in operating performance and stock market valuations of other technology companies generally, or those that sell enterprise computing products in particular; |
| | • | | changes in financial estimates by any securities analysts who follow our company, our failure to meet these estimates or failure of those analysts to initiate or maintain coverage of our stock; |
| | • | | ratings downgrades by any securities analysts who follow our company; |
| | • | | the public’s response to our press releases or other public announcements, including our filings with the SEC; |
| | • | | announcements by us or our competitors of significant technical innovations, customer wins or losses, acquisitions, strategic partnerships, joint ventures or capital commitments; |
| | • | | introduction of technologies or product enhancements that reduce the need for our products; |
| | • | | market conditions or trends in our industry or the economy as a whole; |
| | • | | the loss of one or more key customers; |
| | • | | the loss of key personnel; |
| | • | | the development and sustainability of an active trading market for our common stock; |
| | • | | lawsuits threatened or filed against us; |
| | • | | future sales of our common stock by our officers, directors and significant stockholders; and |
| | • | | other events or factors, including those resulting from war, incidents of terrorism or responses to these events. |
In addition, the stock markets, and in particular the NASDAQ Stock Market, have experienced extreme price and volume fluctuations that have affected and continue to affect the market prices of equity securities of many technology companies. Stock prices of many technology companies have fluctuated in a manner unrelated or disproportionate to the operating performance of those companies. In the past, stockholders have instituted securities class action litigation following periods of market volatility. If we were involved in securities litigation, it could have substantial costs and divert resources and the attention of management from our business.
22
Due to these factors, sales of a substantial number of shares of our common stock in the public market could occur at any time. These sales, or the perception in the market that the holders of a large number of shares intend to sell shares, could reduce the market price of our common stock.
Some provisions in our certificate of incorporation and bylaws may deter third parties from acquiring us.
Our certificate of incorporation and bylaws contain provisions that may make the acquisition of our company more difficult without the approval of our board of directors, including the following:
| | • | | limitations on persons authorized to call a special meeting of stockholders; |
| | • | | our stockholders may take action only at a meeting of stockholders and not by written consent; |
| | • | | our certificate of incorporation authorizes undesignated preferred stock, the terms of which may be established and shares of which may be issued without stockholder approval; and |
| | • | | advance notice procedures required for stockholders to nominate candidates for election as directors or to bring matters before an annual meeting of stockholders. |
These anti-takeover defenses could discourage, delay or prevent a transaction involving a change in control of our company. These provisions could also discourage proxy contests and make it more difficult for stockholders to elect directors of their choosing and cause us to take other corporate actions they desire.
We do not expect to pay any cash dividends for the foreseeable future.
We do not anticipate that we will pay any cash dividends to holders of our common stock in the foreseeable future. Accordingly, investors must rely on sales of their common stock after price appreciation, which may never occur, as the only way to realize any future gains on their investment. Investors seeking cash dividends in the foreseeable future should not purchase our common stock.
Item 1B.Unresolved Staff Comments
Not applicable.
Item 2.Properties
Our properties consist of leased facilities used for manufacturing, warehouse, sales and marketing, research and development, services and support and administrative purposes.
| | | | | | |
Location | | Size (sq. ft.) | | Function | | Lease expires |
Fremont, CA | | 157,820 | | Corporate Headquarters, manufacturing | | December, 2013 |
Milpitas, CA | | 53,280 | | Manufacturing | | June, 2009 |
Montreal, Quebec | | 6,168 | | Software and Engineering Office | | March, 2008 |
Redmond, WA | | 2,950 | | Software and Engineering Office | | August, 2009 |
23
During fiscal year 2008, we expect to open additional facilities in Europe and Asia. We believe that our facilities will be adequate for our needs for at least the next twelve months, and we expect that additional facilities will be available on reasonable terms in other jurisdictions to the extent we determine to add new offices.
Item 3.Legal Proceedings
None
Item 4. Submission of Matters to a Vote of Security Holders
No matters were submitted to a vote of our security holders during the quarter ended December 29, 2007.
24
PART II
Item 5. Market for the Registrant’s Common Equity, Related Stockholder Matters and Issuer Purchase of Equity Securities
Market Information
Our common stock started trading on the NASDAQ National Market under the symbol “RACK” on June 10, 2005. Commencing in 2006, our common stock is traded on the NASDAQ Global Select Market. Prior to June 10, 2005, there was no public market for our common stock. The following table sets forth for the periods indicated the high and low sale prices of our common stock, as reported by the NASDAQ Markets.
| | | | | | |
Year Ending December 30, 2006 | | High | | Low |
First Quarter | | $ | 53.10 | | $ | 26.35 |
Second Quarter | | | 56.00 | | | 31.56 |
Third Quarter | | | 40.42 | | | 18.64 |
Fourth Quarter | | | 37.80 | | | 25.75 |
| | |
Year Ending December 29, 2007 | | High | | Low |
First Quarter | | $ | 32.48 | | $ | 15.96 |
Second Quarter | | | 17.24 | | | 11.25 |
Third Quarter | | | 14.49 | | | 11.25 |
Fourth Quarter | | | 14.66 | | | 9.48 |
Holders
On March 6, 2008, the last reported sale price of our common stock on the NASDAQ Global Select Market was $8.98. As of March 6, 2008, there were 29,635,258 shares of our common stock outstanding held by 29 holders of record.
Dividends
We have never declared or paid any dividends on our capital stock. We currently intend to retain any future earnings to fund the development and expansion of our business, and therefore we do not anticipate paying cash dividends on our common stock in the foreseeable future. Any future determination to pay dividends will be at the discretion of our board of directors.
25
Performance Graph (1)
The following graph shows the cumulative total stockholder return of an investment of $100 in cash on June 10, 2005, the date our common stock first started trading on the NASDAQ National Market through December 29, 2007, for (i) our common stock, (ii) the NASDAQ Composite Index and (iii) the RDG Technology Composite Index. Pursuant to applicable SEC rules, all values assume reinvestment of the full amount of all dividends, however no dividends have been declared on our common stock to date. The stockholder return shown on the graph below is not necessarily indicative of future performance, and we do not make or endorse any predictions as to future stockholder returns.
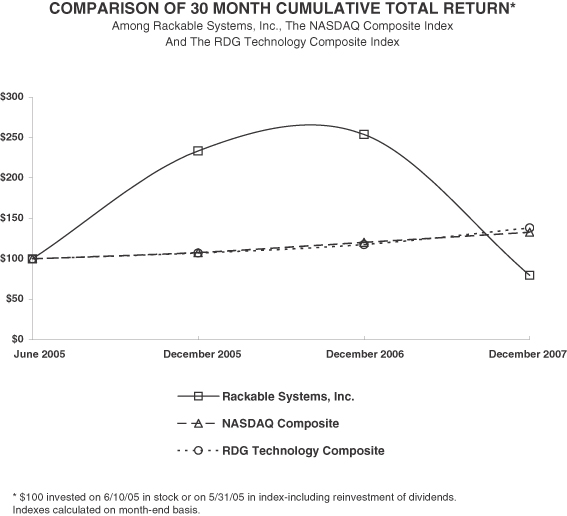
| (1) | This Section is not “soliciting material,” is not deemed “filed” with the SEC and is not to be incorporated by reference in any filing of Rackable Systems under the 1933 Act or the 1934 Act whether made before or after the date hereof and irrespective of any general incorporation language in any such filing. |
26
Item 6.Selected Financial Data
The following selected summary consolidated financial data should be read in conjunction with Part II, Item 8. “Financial Statements and Supplementary Data,” and with Part II, Item 7. “Management’s Discussion and Analysis of Financial Condition and Results of Operations” in this Annual Report on Form 10-K.
| | | | | | | | | | | | | | | | | | | | |
| | | Year ended | |
| | | January 3,
2004 (1) | | | January 1,
2005 (1) | | | December 31,
2005 (1) | | | December 30,
2006 (1) | | | December 29,
2007 (1) | |
| | | (in thousands, except for per share data) | |
Consolidated Statements of Operations Data: | | | | | | | | | | | | | | | | | | | | |
Revenue | | $ | 52,880 | | | $ | 109,743 | | | $ | 214,985 | | | $ | 360,376 | | | $ | 353,155 | |
Gross profit | | | 11,231 | | | | 20,989 | | | | 49,656 | | | | 76,976 | | | | 48,972 | |
Income (loss) from operations | | | 310 | | | | (1,616 | ) | | | 23,617 | | | | 11,547 | | | | (71,578 | ) |
Income (loss) before tax | | | (52,116 | ) | | | (52,396 | ) | | | 18,420 | | | | 19,844 | | | | (62,990 | ) |
Income tax provision | | | (548 | ) | | | (2,994 | ) | | | (9,908 | ) | | | (8,372 | ) | | | (6,567 | ) |
Net income (loss) | | | (52,664 | ) | | | (55,390 | ) | | | 8,512 | | | | 11,472 | | | | (69,557 | ) |
Net income (loss) attributable to common stockholders | | | (54,111 | ) | | | (55,390 | ) | | | 8,512 | | | | 11,472 | | | | (69,557 | ) |
Net income (loss) per share attributable to common stockholders: | | | | | | | | | | | | | | | | | | | | |
Basic | | $ | (16.64 | ) | | $ | (11.43 | ) | | $ | 0.86 | | | $ | 0.43 | | | $ | (2.42 | ) |
| | | | | | | | | | | | | | | | | | | | |
Diluted | | $ | (16.64 | ) | | $ | (11.43 | ) | | $ | 0.47 | | | $ | 0.40 | | | $ | (2.42 | ) |
| | | | | | | | | | | | | | | | | | | | |
Shares used in computing net income (loss) per share attributable to common stockholders: | | | | | | | | | | | | | | | | | | | | |
Basic | | | 3,251 | | | | 4,848 | | | | 9,947 | | | | 26,948 | | | | 28,786 | |
| | | | | | | | | | | | | | | | | | | | |
Diluted | | | 3,251 | | | | 4,848 | | | | 18,040 | | | | 28,618 | | | | 28,786 | |
| | | | | | | | | | | | | | | | | | | | |
| (1) | Includes non-cash share-based compensation as follows: |
| | | | | | | | | | | | | | | |
| | | Year ended |
| | | January 3,
2004 | | January 1,
2005 | | December 31,
2005 | | December 30,
2006 | | December 29,
2007 |
| | | (in thousands) |
Cost of revenue | | $ | 10 | | $ | 74 | | $ | 91 | | $ | 3,583 | | $ | 2,152 |
Research and development | | | — | | | 44 | | | 70 | | | 5,069 | | | 4,887 |
Sales and marketing | | | 34 | | | 155 | | | 261 | | | 6,245 | | | 5,465 |
General and administrative | | | 925 | | | 4,505 | | | 131 | | | 5,858 | | | 10,731 |
| | | | | | | | | | | | | | | |
Total | | $ | 969 | | $ | 4,778 | | $ | 553 | | $ | 20,755 | | $ | 23,235 |
| | | | | | | | | | | | | | | |
27
| | | | | | | | | | | | | | | | | |
| | | Year ended |
| | | January 3,
2004 | | | January 1,
2005 | | | December 31,
2005 | | December 30,
2006 | | December 29,
2007 |
| | | (unaudited) |
| | | (in thousands) |
Consolidated Balance Sheet Data: | | | | | | | | | | | | | | | | | |
Cash and cash equivalents | | $ | 2,320 | | | $ | 17,111 | | | $ | 29,099 | | $ | 30,446 | | $ | 49,897 |
Working capital | | | 11,302 | | | | 12,220 | | | | 112,326 | | | 268,180 | | | 251,200 |
Total assets | | | 29,526 | | | | 56,309 | | | | 176,042 | | | 406,770 | | | 352,458 |
Mandatorily redeemable preferred stock | | | 25,457 | | | | 23,651 | | | | — | | | — | | | — |
Embedded derivatives in preferred stock | | | 56,902 | | | | 103,639 | | | | — | | | — | | | — |
Total liabilities | | | 87,517 | | | | 161,064 | | | | 52,777 | | | 91,081 | | | 76,340 |
Total stockholders’ equity (deficit) | | | (57,991 | ) | | | (104,755 | ) | | | 123,265 | | | 315,689 | | | 276,118 |
Item 7.Management’s Discussion and Analysis of Financial Condition and Results of Operations
The following discussion should be read in conjunction with, and is qualified in its entirety by reference to, our consolidated financial statements and the related notes included elsewhere in this Annual Report on Form 10-K. The discussions in this section contain forward-looking statements that involve risks and uncertainties, and actual results could differ materially from those discussed below. See “Item 1A—Risk Factors” and “Special Note Regarding Forward-Looking Statements and Trademarks” at the beginning of this Annual Report on Form 10-K for a discussion of these risks and uncertainties.
Overview
General
We develop, market and sell server, storage systems and data center infrastructure purpose-built for large-scale data center deployments. Recently, enterprises have begun to deploy large-scale computing and storage farms by aggregating large numbers of relatively inexpensive, open-standard modular computing and storage systems. These systems typically run low-cost operating systems such as Linux and Windows and, we believe, enable enterprises to meet their computing and storage requirements at a lower total cost of ownership and provide enterprises with greater flexibility and scalability.
We have developed innovative technologies in the areas of chassis and cabinet design, power distribution techniques and hardware-based remote management technology. We offer compute servers using our half-depth design, enabling back-to-back mounting for higher server density and improved thermal management. In August 2004, we expanded our product line of compute servers with an additional offering in our product line, which we designed to further increase density levels, improve thermal management, and enhance cable management and system serviceability. We also offer a number of storage solutions. In the third quarter of 2006, we acquired Terrascale Technologies, Inc. and market its products as our RapidScale storage appliance. Our RapidScale products provide scalable shared storage solutions. RapidScale permits all stored data to reside under a single namespace and be simultaneously accessed by up to thousands of servers. The solution delivers high performance while improving capacity and performance scalability, ease of data management, and capacity utilization. RapidScale appliances leverage our own hardware in addition to our proprietary RapidScale file system appliance software. In September of 2007, we released the newest generation of our modular data center products, known as “ICE Cube”, designed to augment or replace traditional brick-and-mortar data centers of any size and ideal for data centers facing power and space limitations. We also sell low-cost, high-capacity storage servers, which leverage many of our core compute server technologies, to help enterprises cost-effectively meet their increasing data storage requirements. Our storage servers represented approximately 9% of our revenue for the year ended December 29, 2007. In addition, we selectively use reseller and OEM relationships to provide additional server and storage offerings that our customers may request from time to time. Service revenues were approximately 2% of total revenues in 2007, slightly over 1% of total revenues in 2006 and less than 1% in 2005.
28
We market our systems primarily through our direct sales force predominantly to enterprises within the United States. In 2007, 2006 and 2005, international sales were 6%, 9% and 3% of our sales, respectively. We are in the early stages of developing an international sales and operational presence, focusing initially on Europe and China. We focus our sales and marketing activities on enterprises that typically purchase hundreds of servers and tens or hundreds of terabytes of storage per year. To date, we have sold our products to over 500 customers. We have concentrated our marketing efforts on leading Internet companies, as well as customers with high-performance computing requirements in vertical markets such as semiconductor design, enterprise software, federal government, media, financial services, oil and gas exploration, biotechnology and pharmaceuticals.
In June 2005, we completed our initial public offering. Aggregate net proceeds from the offering, after deducting underwriting discounts and commissions and issuance costs, were approximately $67.4 million. We used $27.7 million of the offering proceeds to redeem all of our outstanding shares of preferred stock and to repay the promissory notes and accrued interest of approximately $3.0 million previously issued to our founders. In addition, we used $14.1 million of the offering proceeds to repay our bank line of credit. In December 2005, we completed a follow-on public offering, and aggregate net proceeds to us from that offering, after deducting underwriting discounts and commissions, and issuance costs, were approximately $46.2 million. In March 2006, we completed a second follow-on public offering. Aggregate net proceeds from that offering, after deducting underwriting discounts and commissions and issuance costs, were approximately $138.5 million.
In September 2006, we completed our acquisition of Terrascale for a total purchase price of $39.4 million.
In April 2007, we complete our acquisition of the rights of Distributed Parity Engine (“DPE”) from the former shareholders of Terrascale for a cash payment of $9.1 million.
In July 2007, we completed a tender offer to exchange 893,828 restricted stock unit awards for 2,238,883 employee stock options. (See Note 5 of the consolidated financial statements.) More than 87% of the eligible employees representing more than 92% of the eligible stock options participated. The incremental accounting charge for the restricted stock unit awards was approximately $145,000. The unrecognized compensation costs of the options cancelled was $17.1 million. The total value of the restricted stock unit awards on July 10, 2007 was $17.2 million and these costs will be amortized over the service period of the restricted stock unit awards. The vesting period of the restricted stock unit awards is longer than the remaining vesting period of the options tendered.
Fiscal Year
Beginning with the first quarter of calendar 2003, we have a 52-week fiscal year ending on the Saturday nearest to December 31, with 13 week quarters ending on the last Saturday of the period. Our fiscal years 2007, 2006 and 2005 ended on December 29, 2007, December 30, 2006 and December 31, 2005, respectively.
2007 Synopsis
Our revenues in FY 2007 declined from $360 million in FY 2006 to $353 million and our loss before income tax provision was $63 million in FY 2007 as compared to income before income tax provision of $20 million in FY 2006. Key contributors to our losses in FY 2007 were the following:
| | • | | Our gross profit in FY 2007 declined approximately $28 million as compared to FY 2006 due largely to a $17 million of excess and obsolete write-downs of inventory resulting from a significant technology shift in microprocessors, memory and power supplies and the resulting buying patterns of our customers; |
| | • | | During FY 2007, we recorded a charge of approximately $24 million for impairment of goodwill; |
| | • | | We added staff to our sales and marketing organization to support our existing customer base and penetrate new sales opportunities. We incurred higher general administrative expenses related to |
29
| | changes in senior management, increased facilities cost, resolution of state sales and franchise tax compliance issues and increased expenses for corporate insurance and professional fees. Selling, general and administrative expenses increased approximately $21 million during FY 2007 compared to FY 2006; |
| | • | | We increased our research and development expenditures to develop new products and respond to changes in technological factors impacting our current products resulting in higher expenses of approximately $13 million in FY 2007 compared to FY 2006; and |
| | • | | We completed the acquisition of Terrascale Technologies in September 2006. During FY 2007, the acquisition added approximately $8 million to our operating expenses on a year over year basis. |
Revenues
We derive our revenues from the sale of our products and services to end users as well as through resellers. Our revenue recognition policy is described in more detail under “Critical Accounting Policies, Significant Judgments and Estimates” below.
A relatively small number of our customers have historically accounted for a significant portion of our revenue, and we expect this trend to continue. Because our revenue has largely been generated in connection with these customers’ decisions to deploy large-scale server and storage farms, their capacity requirements can become fulfilled, whether temporarily or otherwise, and as a result they could purchase significantly fewer or no products from us in subsequent periods. In 2007, Microsoft, Amazon and Yahoo! accounted for 36%, 16% and 12% of our revenue, respectively. In 2006, Microsoft and Yahoo! accounted for 34% and 26% of our revenue. In 2005, Amazon.com, Yahoo! and Microsoft accounted for 24%, 22% and 14% of our revenue, respectively.
During 2007, the sale of compute server products represented approximately 91% of total product revenues and the sale of storage systems represented approximately 9% of total revenues. During 2006, the sale of compute server products and storage systems represented 90% and 10% of total revenues, respectively, and during 2005, the sale of compute server products and storage systems represented 91% and 9% of total revenues, respectively. We sell some server systems that have storage capacity. For purposes of this comparison, we define storage systems as products with the capacity to contain six or more hard disk data drives and our RapidScale products.
We derived 6%, 9% and 3% of our total revenue in 2007, 2006 and 2005, respectively, from products shipped to locations outside the United States, primarily to foreign offices of customers based or with operations in the United States. We continue to focus our direct sales efforts to bigger customers. In 2007, the mix for direct sales and indirect sales through resellers was 90% and 10% of total revenue, respectively. In 2006, the mix for direct sales and indirect sales was 93% and 7% of total revenue, respectively. In 2005 direct sales and indirect sales represented 91% and 9% of total revenue, respectively.
Product revenue. Our product revenue is derived from the sale of server and storage systems. The main factors which impact our revenue are unit volumes shipped and average selling prices. For the years ended December 29, 2007, December 30, 2006 and December 31, 2005, our unit volumes were approximately 103,000, 93,800 and 56,100 respectively. Our average selling prices for the same periods were approximately $3,400, $3,800 and $3,800, respectively. Overall, we expect average selling prices for similar products to decline over time as competitive pricing pressure increases, our products mature in the market and are replaced with new products with increased performance and superior features. The introduction of new product lines, depending upon configurations, could temporarily increase our average selling prices. In general, however, the average selling prices of server and storage systems have historically decreased over time.
Service revenue. In 2004, we began to develop our services organization and began offering service and maintenance contracts to all customers. Prior to 2004, we only offered service and maintenance contracts upon
30
customer request. We generate service revenue from the sale of standard maintenance contract service offerings as well as custom maintenance contracts that are tailored to individual customers’ needs. We recognize service revenue ratably over the service periods. Maintenance contracts are priced as a percentage of the list price of the underlying products to which the service relates. Maintenance contracts are typically one to three years in length, and we will actively pursue renewals of these contracts. Our customers may change to a different maintenance contract upon renewal. While we recently began to offer each customer maintenance contracts or an extended warranty for up to four years, some customers will choose not to purchase a maintenance contract or an extended warranty and instead rely solely upon our limited product warranty. These customers have the option to purchase a service plan in the following year. We generally use third-party service providers rather than establish our own on-site service capabilities in regions where we have limited customer concentrations and it is more cost-effective for us to do so. We also generate service revenue from implementation services. Prior to 2004, we did not make a concerted effort to sell service and maintenance contracts. During 2004, we generated substantially all of our revenue from sales of our products. Services revenues increased to $6.3 million in 2007, representing 2% of total revenue, compared to $3.9 million in 2006, representing 1% of total revenue and $1.3 million in 2005, or less than 1% of total revenue.
Cost of Revenue
Cost of product revenue. Cost of product revenue primarily consists of the costs to manufacture our finished products and the costs we pay to our suppliers for processors, memory and other components used in our systems and charges related to excess and obsolete (“E&O”) inventory. We realized the benefit of lower prices for purchases of memory and micro processor components throughout 2007. We do not believe that this trend of lower prices in 2008 will continue. We believe that the chip industry may be at the bottom of their pricing cycle and that prices for these components may increase in 2008. Our costs to manufacture products include both the cost of our in-house manufacturing organization as well as the cost of our third-party contract manufacturers. Typically, we utilize our in-house manufacturing capability for smaller builds, of usually 50 units or less, first article builds and to support our warranty and repair efforts. For our larger builds, we utilize third-party contract manufacturers. Our current contract manufacturers include Synnex, E-Cycle and Realtime Technologies. Cost of product revenue also includes provisions for warranty and excess or obsolete inventory write downs and compensation costs, including share-based compensation which historically was not significant prior to 2006. With the adoption of SFAS 123R in 2006, share-based compensation expense included in cost of revenue has increased significantly.
Cost of service revenue. Cost of service revenue consists of the cost of using spare parts in providing customer service, freight costs for shipping spare parts, personnel and related compensation costs, including share-based compensation which historically was not significant prior to 2006, and the costs we incur related to the provision of service by our third-party service providers.
Gross profit. Our gross profit is impacted by the magnitude of discounts provided to customers for purchasing our products, by changes in the cost of material paid to our suppliers, by changes in our product mix and by changes related to E&O expenses. The discounts we provide to customers are often driven by competitive pricing pressures, with greater discounts generally given to customers with higher volume purchases or to new strategic customers that we believe will place future large orders. We intend to lower our cost of product revenue by enhancing product design and working with our suppliers to reduce production and component costs. A large component of our cost of product revenue that impacts gross profit is DRAM pricing. Historically, pricing for DRAM has been volatile in response to market supply and demand. In general, DRAM is becoming a larger percentage of our bill of materials due to increased memory requirements. In periods of high memory prices and tight allocations where our ability to procure memory has been limited, our gross profit and ability to meet customer commitments have been negatively impacted.
31
Operating Expenses
Research and development expense. Research and development expense consists primarily of employee, contractor, and related personnel costs, expenses related to new component testing and evaluation, test equipment, design and implementation, new product design and testing and other product development activities. All research and development costs are expensed as incurred. In order to minimize research and development expense, we work closely with our customers to develop product innovations and incorporate these into subsequent product design. This cooperative approach allows us to develop products that meet our customers’ needs in a cost-effective manner. Our spending on research and development increased significantly in 2007 due to engineering activities to expand our product portfolio, to add new features to our existing products and also reflect full year operational costs associated with our Terrascale acquisition in September 2006, including expenses related to continual employment agreements. We are currently amortizing patents and other intangibles we acquired in connection with Terrascale acquisition. In addition, with the adoption of SFAS 123R in 2006, share-based compensation expense has increased significantly in 2007 and 2006 compared to 2005.
Acquired in-process research and development. In connection with our acquisition of Terrascale, we incurred $2.8 million charge for in-process research and development (“IPRD”) expenses in 2006. Development projects that had not reached technological feasibility, and had no future alternative uses were classified as IPRD. Our IPRD relates to developing a new version of the current software platform.
Sales and marketing expense. Sales and marketing expense consists primarily of salaries, bonus and commissions paid to our sales and marketing employees and salaries paid to our sales engineers who work with our sales and marketing employees to help determine the components and configuration requirements for new products. We also incur marketing expenses for marketing activities such as trade shows, direct mail and print advertising. Our sales and marketing expense increased significantly in 2007 as we hired additional sales personnel. With the adoption of SFAS 123R in 2006, share-based compensation expense has increased significantly in 2007 and 2006 as compared to 2005.
General and administrative expense. General and administrative expense consists primarily of salaries and overhead of our administrative staff and, to a lesser extent, amortization of patents we acquired in the Rackable Purchase. We expect our general and administrative expense to increase, as we will continue to incur additional legal, accounting, administrative and other costs and expenses as a public company that we did not incur as a private company. In particular, as a result of the compliance obligations with the Sarbanes-Oxley Act of 2002, as well as rules subsequently implemented by the SEC, the Public Company Accounting Oversight Board and The NASDAQ Stock Market. In 2006, we implemented a new ERP system to expand operational and financial systems and to maintain effective internal controls and procedures. We have incurred significant costs in implementing and maintaining the new ERP system. In 2005, we filed a patent lawsuit against one company. This lawsuit has resulted in significant legal expenses in 2007 and 2006. We also incurred higher costs as a result of the increase in the size of our board of directors, as well as the cost for directors’ and officers’ insurance. In addition, with the adoption of SFAS 123R in 2006, share-based compensation expense has increased significantly in 2007 and 2006 as compared to 2005.
Impairment of goodwill.Goodwill is not amortized but is reviewed annually, during the final month of our fiscal year (or more frequently if impairment indicators arise) for impairment. Impairment indicators include the significant decrease in market price of an asset, significant adverse changes in the extent or use or physical condition of an asset, significant adverse change in legal or regulatory factors affecting an asset, accumulation of costs significantly in excess of expected costs to acquire or construct an asset, operating or cash flow losses (or projections of losses) that demonstrates continuing losses associated with the use of an asset, or a current expectation that is more likely than not, that an asset will be sold or disposed of significantly before the end of its previously estimated useful life.
The process of evaluating the potential impairment of goodwill and other intangibles is highly subjective and requires significant judgment. We estimate expected future cash flows then compare the carrying value
32
including goodwill and other intangibles to the discounted future cash flows. If the total of future cash flows is less than the carrying amount of the assets, we recognize an impairment loss based on the excess of the carrying amount over the fair value of the assets. Estimates of the future cash flows associated with the assets are critical to these assessments. Changes in these estimates based on changed economic conditions or business strategies could result in material impairment charges in future periods.
In accordance with SFAS 142, goodwill is evaluated for impairment at the reporting unit level. We have concluded that we are a single reporting unit for evaluating impairment of our goodwill. The Chief Executive Officer, who is our chief operating decision maker, monitors the sales of various products, operations are managed and financial performance evaluated based upon the sales and production of multiple products employing common manufacturing and research and development resources, sales and administrative support, and facilities. We believe that any allocation of such shared expenses to various products would be impractical and arbitrary and it currently does not make such allocations internally.
Other Income and Expenses
Interest income. Interest income consists of interest earned on our money market accounts and short-term investments.
Interest expense. Interest expense consists of the interest expense associated with our bank borrowings and the accretion of dividends on our Series A preferred stock subsequent to the adoption of SFAS No. 150,Accounting for Certain Financial Instruments with Characteristics of Both Liabilities and Equityon July 1, 2003.Pursuant to adoption of SFAS No. 150, on July 1, 2003, we reclassified $21.4 million, the carrying amount of the Series A preferred stock at that date, including cumulative accretion to redemption value, from mezzanine debt to long-term liabilities. Also, under SFAS No. 150, we charged accretion to the redemption value to interest expense. The non-cash portion of interest expense associated with the accretion of the Series A preferred stock dividends under SFAS No. 150 was $1.1 million for the year ended December 31, 2005. Interest expense for the years ended December 29, 2007 and December 30, 2006 was immaterial.
Other income (expense)-net. Foreign exchange gain of approximately $0.4 million was recorded during the year ended December 29, 2007 resulting from sales dominated in Euros for our European operations. Foreign exchange gain of approximately $0.8 million was recorded during the year ended December 31, 2006 resulting from balances held in Euros for our European operations.
Provision for income taxes
The $6.6 million provision for income taxes recorded for the year ended December 29, 2007 includes the net tax expense resulting from the recording of a valuation allowance for our U.S. deferred tax assets in excess of recoverable income taxes as a result of our 2007 loss. The provision for income taxes for the year ended December 30, 2006 was recorded based on an effective tax rate of 42% which differed from the combined federal and state statutory income tax rate primarily due to certain stock compensation expenses for which deferred tax assets could not be recorded in accordance with SFAS 123R. The effective tax rate of 54% used to record the provision for income taxes for the year ended December 31, 2005 differed from the combined federal and statutory income tax rate mainly due to permanent tax differences associated with our accounting for embedded derivatives and accretion of preferred stock dividends recorded as interest expense for book purposes.
Critical Accounting Policies, Significant Judgments and Estimates
The preparation of financial statements in accordance with accounting principles generally accepted in the U.S. requires management to make estimates and assumptions that affect the amounts reported in our combined financial statements and accompanying notes. Management bases its estimates on historical experience and various other assumptions believed to be reasonable. Although these estimates are based on management’s best
33
knowledge of current events and actions that may impact us in the future, actual results may be different from the estimates. Our critical accounting policies are those that affect our financial statements materially and involve difficult, subjective or complex judgments by management. Those policies are revenue recognition, asset impairment charges, inventory valuation, warranty, share-based compensation, valuation of goodwill and intangible assets and accounting for income taxes.
Revenue Recognition
We account for our revenues under the provisions of Staff Accounting Bulletin (“SAB”) No. 104,Revenue Recognition in Financial Statements(“SAB 104”), FASB Technical Bulletin No. 90-1,Accounting for Separately Priced ExtendedWarrantyand Product Maintenance Contracts (“FTB 90-1”)and Statement of Position No. 97-2,Software Revenue Recognition(“SOP 97-2”).
Under the provisions of SAB 104, we recognize revenues from sales of products when persuasive evidence of an arrangement exists, shipment has occurred and title has transferred, the sales price is fixed and determinable, collection of the resulting receivable is reasonably assured, and all significant obligations have been met. Generally, this occurs at the time of shipment when risk of loss and title has passed to the customer.
Service revenue includes hardware maintenance and installation. Pursuant to SAB 104, we recognize revenue from the sale of our products prior to completion of these services, as our product sales are not dependent on these services to be functional. Under FTB 90-1, we recognize revenue from hardware maintenance contracts, which are sold and invoiced separately, ratably over the contract term, generally one to three years. Installation services are typically requested by our new customers who have limited history with our products. Installation and related services are usually performed within one day after product delivery.
As a result of our Terrascale acquisition in September 2006, we acquired clustered file system software. This software is typically integrated with industry standard hardware and sold as a hardware appliance, but can also be sold on a standalone basis. We provide unspecified software updates and enhancements to the software through service contracts. As a result, we account for revenue in accordance with SOP 97-2 for transactions involving the sale of software. Revenues earned on software arrangements involving multiple-elements are allocated to each element based on the Vendor Specific Objective Evidence (“VSOE”) of fair value. The VSOE of fair value of the undelivered elements (maintenance and support services) is generally determined based on the price charged for the undelivered element when sold separately or renewed. If VSOE cannot be obtained to determine fair value of the undelivered elements, revenue from the entire arrangement would be deferred and recognized as these elements are delivered.
Valuation of Intangible Assets and Goodwill
We periodically evaluate our intangible assets and goodwill in accordance with SFAS No. 142,Goodwill and Other Intangible Assets (“SFAS No. 142”), for indications of impairment whenever events or changes in circumstances indicate that the carrying value may not be recoverable. Intangible assets include goodwill, patents, customer list, customer backlog and tradename. Factors we consider important that could trigger an impairment review include significant under-performance relative to historical or projected future operating results, significant changes in the manner we use the acquired assets or the strategy for our overall business, or significant negative industry or economic trends. We have chosen the end of our fiscal month of December as the date of our annual impairment test. In accordance with SFAS No. 142, goodwill is evaluated for impairment at the reporting unit level. We consider the company to be a single reporting unit. While the CEO, who is our chief operating decision maker, monitors the sales of various products, operations are managed and financial performance evaluated based upon the sales and production of multiple products employing common manufacturing and research and development resources, sales and administrative support, and facilities. We believe that any allocation of such shared expenses to various products would be impractical and arbitrary and we currently do not make such allocations internally. In testing for a potential impairment of goodwill, the
34
provisions of SFAS No. 142 require the application of a fair value based test at the reporting unit level. We performed the annual goodwill impairment test as of December 29, 2007, December 30, 2006 and December 31, 2005. We determined that goodwill was impaired as of December 29, 2007. The goodwill impairment resulted in a charge of approximately $23.9 million. In accordance with SFAS No. 144,Accounting for the Impairment or Disposal of Long-lived Assets (“SFAS No. 144”) long-lived intangible assets with determinable economic life are tested for recoverability whenever events or circumstances indicate that their carrying amounts may not be recoverable.
Reserve for Sales Returns
Although customers are not granted rights to return products after the purchase has been made, in certain circumstances, we accepted returns and issued credits although we were not contractually obligated to do so. We estimate sales returns based on historical experience and record a provision for sales returns at the time product revenue is recognized. We review and update our estimates for sales returns on a quarterly basis to reflect our experience regarding the historical sales returns. Changes to the reserve occur based upon changes in revenue levels and historical rates of return. Our sales return reserve balance was $0.3 million, $0.1 million and $0.4 million, respectively, at December 29, 2007, December 30, 2006 and December 31, 2005. Our sales return provision was $1.3 million, $1.0 million and $0.8 million, respectively, for the years ended December 29, 2007, December 30, 2006 and December 31, 2005.
Allowance for Doubtful Accounts
We estimate the allowance for doubtful accounts based on management’s assessment of the collectibility of specific customer accounts and the aging of accounts receivables. We review and update our estimates for allowance for doubtful accounts on a quarterly basis. Changes to the reserve occur based upon changes in revenue levels, associated balances in accounts receivable and estimated changes in credit quality.
Our allowance for doubtful accounts totaled $434,000, $328,000 and $17,000, respectively, at December 29, 2007, December 30, 2006 and December 31, 2005, and our bad debt expense (benefit) totaled $298,000, $339,000 and ($28,000) for the years ended December 29, 2007, December 30, 2006 and December 31, 2005, respectively.
Inventory Valuation
We value our inventories at the lower of first-in, first-out, or cost of market. We assess the valuation of all inventories, including raw materials, work-in-process, finished goods and spare parts, on a periodic basis. We write down obsolete inventory or inventory in excess of our estimated usage to its estimated market value less cost to sell, if less than its cost. We record the inventory write-downs as an inventory valuation allowance established on the basis of obsolete inventory or specific identified inventory in excess of established usage. Inherent in our estimates of market value in determining inventory valuation are estimates related to future demand for our products and technological obsolescence of our products. If actual market conditions are less favorable than our projections, additional inventory write-downs may be required. If we write down the inventory value to its net realizable value and subsequently there is an increased demand for the inventory at a higher value, we do not realize the increased value of the inventory until we sell the inventory either as a component of a system or as separate inventory. During fiscal 2007 we had net charges of approximately $16.6 million to our excess and obsolete inventory that had a significant impact on our gross margin. These charges were in large part a result of technology shifts that are difficult to project and may occur in the future.
Warranty Liabilities
We net against the warranty expense any cost recoveries from warranties offered to us by our suppliers covering defective components. Warranty costs include labor to repair faulty systems and replacement parts for
35
defective items, as well as other costs incidental to warranty repairs. We sell our products without a right of return or price protection rights. Our standard warranty period for products is typically one year, although in July 2007 we began offering a three year warranty. We also offer extended service warranties. We calculate the liability for product warranties as a percentage of revenue. The percentage is based on historical actual product repair costs. We review and update our estimated warranty costs on a quarterly basis. Accordingly, in 2007, 2006 and 2005, we adjusted our warranty reserve accrual rate to reflect our recent experience regarding actual warranty charges as a percentage of revenue. Changes to the reserve occur as volume, product mix and actual warranty costs fluctuate. Our warranty reserve totaled $2.0 million, $0.9 million and $0.7 million at December 29, 2007, December 30, 2006 and December 31, 2005, respectively. Warranty expense totaled $3.1 million, $2.1 million and $1.2 million for the years ended December 29, 2007, December 30, 2006 and December 31, 2005, respectively.
Accounting for Income Taxes
The determination of our tax provision is subject to judgments and estimates. The carrying value of our net deferred tax assets, which is comprised primarily of future tax deductions, is subject to management judgment as to whether it is more likely than not our deferred tax assets will be realized. In determining whether the realization of these deferred tax assets may be impaired, we evaluate both positive and negative evidence as required in accordance with Financial Accounting Standards Board (“FASB”) Statement No. 109. As of December 29, 2007, management has concluded that it is more likely than not that our U.S. deferred tax assets in excess of recoverable income taxes and certain deferred tax liabilities will not be realized and we have therefore, recorded a valuation allowance for such excess U.S. deferred tax assets.
In the first quarter of 2007, we adopted FASB Interpretation No. 48, “Accounting for Uncertainty in Income Taxes–an interpretation of SFAS No. 109” (“FIN 48”), and related guidance. See Note 10 “Income Taxes” in this Form 10-K. As a result of the implementation of FIN 48, we recognize liabilities for uncertain tax positions based on the two-step process prescribed in the interpretation. The first step is to evaluate the tax position for recognition by determining if the weight of available evidence indicates that it is more likely than not that the position will be sustained on audit, including resolution of related appeals or litigation processes, if any. The second step requires us to estimate and measure the tax benefit as the largest amount that is more than 50% likely to be realized upon ultimate settlement with the taxing authorities. We reevaluate these uncertain tax positions on a quarterly basis. This evaluation is based on factors including, but not limited to, changes in facts or circumstances, changes in tax law, effectively settled issues under audit, new audit activity and lapses in the statutes of limitations on assessment. Such a change in recognition or measurement would result in the recognition of a tax benefit or an additional charge to the tax provision in the period that such event occurs.
Share-Based Compensation
Effective January 1, 2006, we began accounting for our employee stock purchase and stock incentive plans under the provisions of FASB Statement No. 123 (revised 2004), Share-Based Compensation, (“SFAS No. 123R”), using the modified-prospective-transition method. SFAS No. 123R requires the recognition of the fair value of share-based compensation in net income. For grants subsequent to the adoption of SFAS No. 123R, the fair values of our unvested stock units are calculated based on the fair value of our common stock at the dates of grant. The fair values of our stock options and employee stock purchase plan awards are estimated using the Black-Scholes option-pricing model. Share-based compensation expense for awards granted after January 1, 2006, was recorded in accordance with FASB Interpretation No. 28,Accounting for Stock Appreciation Rights and Other Variable Stock Option or Award Plans, (“FIN 28”) using the multiple-option approach, reduced for estimated forfeitures. Prior to January 1, 2006, we accounted for share-based employee compensation arrangements in accordance with Accounting Principles Board Opinion No. 25,Accounting for Stock Issued to Employees (“APB No. 25”) and related interpretations, as permitted by FASB Statement No. 123 (“SFAS No. 123”.) Under APB No. 25, compensation cost was recognized based on the difference, if any, between the then fair value of our common stock on the date of grant and the amount an employee must pay to acquire the stock.
36
Compensation cost was recorded in accordance with FIN 28, using the multiple-option approach. Under SFAS 123R, compensation expense for those options prior to the adoption of SFAS No. 123R continue to be expensed on the same basis as they were prior to its adoption, reduced for estimated forfeitures.
The adoption of SFAS No. 123R had a material impact on our earnings per share and on our consolidated financial statements for the years ended December 29, 2007 and December 30, 2006, and we expect that it will materially impact our financial statements in the foreseeable future.
Prior to January 1, 2006, we elected to follow the intrinsic value-based method prescribed by APB No. 25 and the related interpretations in accounting for employee stock options rather than adopting the alternative fair value accounting provided under SFAS No. 123. Therefore, we did not record any compensation expense for stock options we granted to our employees in which the exercise price equals the fair market value of the stock options on the date of grant and the exercise price, number of shares eligible for issuance under the options and vesting period are fixed. We comply with the disclosure provisions of SFAS No. 123 and SFAS No. 148, which require that we disclose our pro forma net income or loss and net income or loss per common share attributable to common stockholders as if we had expensed the fair value of the options. In calculating such fair values, we use assumptions of estimated option life, dividend policy, volatility and interest rates.
Results of Operations
The following table sets forth our financial results, as a percentage of revenue, for the years ended December 29, 2007, December 30, 2006 and December 31, 2005:
| | | | | | | | | |
| | | Year Ended | |
| | | December 29,
2007 | | | December 30,
2006 | | | December 31,
2005 | |
Revenue | | 100.0 | % | | 100.0 | % | | 100.0 | % |
Cost of revenue | | 86.1 | | | 78.6 | | | 76.9 | |
| | | | | | | | | |
Gross margin | | 13.9 | | | 21.4 | | | 23.1 | |
| | | | | | | | | |
Operating expenses: | | | | | | | | | |
Research and development | | 7.4 | | | 3.8 | | | 1.0 | |
Acquired in-process research and development | | — | | | 0.8 | | | — | |
Sales and marketing | | 9.7 | | | 7.5 | | | 7.2 | |
General and administrative | | 10.2 | | | 6.1 | | | 3.9 | |
Impairment of goodwill | | 6.8 | | | — | | | — | |
| | | | | | | | | |
Total operating expenses | | 34.1 | | | 18.2 | | | 12.1 | |
| | | | | | | | | |
Income (loss) from operations | | (20.2 | ) | | 3.2 | | | 11.0 | |
Other income (expense): | | | | | | | | | |
Change in fair value of embedded derivatives in preferred stock | | — | | | — | | | (2.0 | ) |
Interest income | | 2.3 | | | 2.1 | | | 0.3 | |
Interest expense | | (0.0 | ) | | — | | | (0.7 | ) |
Other income (expense), net | | 0.1 | | | 0.2 | | | — | |
| | | | | | | | | |
Total other income (expense), net | | 2.4 | | | 2.3 | | | (2.4 | ) |
| | | | | | | | | |
Income (loss) before tax | | (17.8 | ) | | 5.5 | | | 8.6 | |
Income tax provision | | (1.9 | ) | | (2.3 | ) | | (4.6 | ) |
| | | | | | | | | |
Net income (loss) | | (19.7 | )% | | 3.2 | % | | 4.0 | % |
| | | | | | | | | |
37
Comparison of the Years Ended December 29, 2007 and December 30, 2006
Revenue.
| | | | | | | | | | | | | |
| | | Year ended | | | | | | |
| | | December 29,
2007 | | December 30,
2006 | | Change | |
| | | | | $ | | | % | |
| | | (in thousands, except percentages) | |
Revenue | | $ | 353,155 | | $ | 360,376 | | $ | (7,221 | ) | | (2 | )% |
Revenue declined in 2007 due in large part, to more competitive pricing as well as reduced purchases from a primary customer. Units sold increased to 103,000 in 2007 from 93,800 in 2006 and but the ASP of units sold declined approximately 11% to $3,400 due primarily to a more competitive pricing environment in our compute server business. Approximately 87% of our revenues in 2007 were attributed to sales to customers that had also purchased our products in 2006. Sales of our storage servers—which include our RapidScale products—decreased 13% or $4.6 million to $30.2 million compared to $34.8 million in the prior year. Service revenues were 2% of total revenues in 2007 and slightly over 1% of total revenues in 2006.
Cost of revenue and gross profit.
| | | | | | | | | | | | | | | |
| | | Year ended | | | | | | | |
| | | December 29,
2007 | | | December 30,
2006 | | | Change | |
| | | | | $ | | | % | |
| | | (in thousands, except percentages) | |
Cost of revenue | | $ | 304,183 | | | $ | 283,400 | | | $ | 20,783 | | | 7 | % |
Gross profit | | $ | 48,972 | | | $ | 76,976 | | | $ | (28,004 | ) | | (36 | )% |
Gross margin | | | 13.9 | % | | | 21.4 | % | | | n/a | | | (35 | )% |
The decrease in gross margin in 2007 as compared to 2006 was primarily attributable to $16.6 million of charges to our E&O inventory and a more competitive pricing environment, as discussed above. Total gross excess and obsolete (“E&O”) charges increased $23.3 million in 2007 as compared to 2006. The majority of this consisted of a $20.6 million write down of excess and obsolete inventory that we recorded in the three months ended June 30, 2007 resulting primarily from customer driven technology platform shift from AMD to Intel, and next generation power supplies. These higher E&O charges were partially offset by a $6.7 million benefit from the sales of previously written off inventory. While we were able to partially offset lower ASP’s due to significant declines in memory pricing, a major component of our material cost. We were not able to lower other material and manufacturing costs to fully offset the decrease in the ASP Gross margin decreased approximately 550 basis points due to E&O and inventory charges, net of sales of previously written down inventory and 420 basis points due to higher manufacturing and service and support related costs. Share-based compensation included in cost of revenue decreased $0.8 million to $2.8 million in 2007 as compared to $3.6 million in 2006 due to lower fair value at grant in 2007.
Operating expenses.
| | | | | | | | | | | | | |
| | | Year ended | | | | | | |
| | | December 29,
2007 | | December 30,
2006 | | Change | |
| | | | | $ | | | % | |
| | | (in thousands, except percentages) | |
OPERATING EXPENSES: | | | | | | | | | | | | | |
Research and development | | $ | 26,281 | | $ | 13,645 | | $ | 12,636 | | | 93 | % |
Acquired in-process R&D | | $ | — | | $ | 2,840 | | $ | (2,840 | ) | | — | |
Sales and marketing | | $ | 34,245 | | $ | 27,051 | | $ | 7,194 | | | 27 | % |
General and administrative | | $ | 36,152 | | $ | 21,893 | | $ | 14,259 | | | 65 | % |
Impairment of goodwill | | $ | 23,872 | | $ | — | | $ | 23,872 | | | — | |
38
Research and development expense. For the year ended December 29, 2007, payroll, bonuses and related fringe benefits accounted for $8.2 million of the increase in research and development expense as compared to 2006. We added engineering personnel to support increased research and development activities and incurred a full year of costs related to personnel from the Terrascale acquisition, including $5.1 million of continual employment agreements in connection with the acquisition. Overall, we increased our research and development personnel 29% to 71 employees at the end of 2007 as compared to 55 employees at the end of the 2006. Amortization increased $2.2 million for the 2007 year compared to 2006, due to the acquisition of Terrascale. Professional services, recruiting and depreciation expenses increased a total of $3.7 million due to an increase in ongoing engineering and development activities. The share-based compensation expense included in research and development decreased to $4.9 million in 2007 from $5.1 million in 2006, due to lower fair value at grant date in 2007. We expect research and development expense to increase, in absolute dollars, in future periods as we intend to increase our engineering activities in the areas of storage, remote management and power systems.
Acquired in-process research and development. In connection with our acquisition of Terrascale, we incurred a $2.8 million charge for in-process research and development expenses in September 2006. There was no similar charge in 2007. The $2.8 million value allocated to projects that were identified as in-process research and development was charged to expense in the third quarter of 2006.
Sales and marketing expense. For the year ended December 29, 2007, payroll, bonuses and related fringe benefits accounted for $3.9 million of the increase in sales and marketing expenses as compared to the prior year and were mainly due to an increase in headcount needed to support increased sales and marketing activities. Headcount increased 7% to 78 employees at the end of 2007 as compared to 73 employees at the end of the prior year. The cost related to evaluations units to present and market our products to new customers increased to $3.0 million in 2007 from $1.8 million in 2006. We also incurred a charge in 2007 of $0.6 million related to a customer dispute settlement. Travel related expense increased by approximately $0.4 million primarily related to increased headcount to support revenue activities. Share-based compensation included in sales and marketing expense decreased $0.7 million to $5.5 million in 2007 as compared to approximately $6.2 million in 2006. We expect sales and marketing expense to increase, in absolute dollars, in future periods as we expect to expand our sales force in the United States and internationally. We also expect commission expense to grow in absolute dollars in future periods if our revenue increases.
General and administrative expense. For the year ended December 29, 2007 the primary increase in general and administrative was payroll, bonuses and related fringe benefits which accounted for $2.5 million of the increase in general and administrative expense as compared to the prior year and was primarily due to an decrease in headcount needed to support additional finance and administrative activities. Headcount increased 24% to 51 employees at the end of 2007 from 41 employees at the end of the 2006. Share-based compensation included in general and administrative expense increased $4.8 million to $10.7 million in 2007 as compared to $5.9 million in 2006. The charges related to our sales tax and VDA issues increased our expenses $3.3 million in 2007 compared to 2006. Rent, maintenance and associated costs increased $1.4 million for 2007 due to our relocating to new corporate offices. Fiscal year 2007 was our second year to meet the attestation requirements of Sarbanes-Oxley Act of 2002, and our audit, tax and compliance costs increased $1.9 million. Legal expense decreased $0.6 million primarily due to the conclusion of the Super Micro litigation.
Impairment of goodwill. For the year ended December 29, 2007, we had a $23.9 million charge related to impairment of goodwill. This charge was the result of our market capitalization at December 29, 2007 being less than our net assets, including goodwill. As required by SFAS No. 142, we determined our current fair value of our assets and liabilities and concluded that the entire recorded amount of goodwill had been impaired.
39
Other income/(expense).
| | | | | | | | | | | | | | | |
| | | Year ended | | | Change | |
| | | December 29, | | | December 30, | | |
| | | 2007 | | | 2006 | | | $ | | | % | |
| | | (in thousands, except percentages) | |
OTHER INCOME (EXPENSE)—Net: | | | | | | | | | | | | | | | |
Interest income | | $ | 8,236 | | | $ | 7,488 | | | $ | 748 | | | 10 | % |
Interest expense | | $ | (8 | ) | | $ | (13 | ) | | $ | 5 | | | (38 | )% |
Other income, net | | $ | 360 | | | $ | 822 | | | $ | (462 | ) | | (56 | )% |
Interest income. The increase in interest income was due to higher average cash, cash equivalents and short-term investment balances related to operating cash flows as well as higher interest rates in 2007 as compared to 2006.
Other income—net. Other income results primarily from the foreign exchange gains. The decrease in the foreign exchange gain resulted primarily from lower balances held in Euros for our European operations.
Provision for income taxes.
| | | | | | | | | | | | | |
| | | Year ended | | Change | |
| | | December 29, | | December 30, | |
| | | 2007 | | 2006 | | $ | | | % | |
| | | (in thousands, except percentages) | |
Tax provision | | $ | 6,567 | | $ | 8,372 | | $ | (1,805 | ) | | (22 | )% |
Our income tax provision recorded for the year ended December 29, 2007 includes approximately $13.2 million of charges relating to our valuation allowance for deferred tax assets recorded in prior years. During the second quarter of 2007 we revised our assessment of the realizability of our deferred tax assets and we concluded that it was more likely than not that our net deferred tax assets in excess of amounts recoverable through loss carry-backs and certain deferred tax liabilities would not be realizable. In addition, during 2007, tax benefits associated with current year losses have been recorded only to the extent of recoverable income taxes. As described below, a $253,000 tax benefit was also recorded in connection with the reversal of a liability previously recorded for an uncertain tax position and accrued interest as a result of a tax audit settled during the year and the voluntary filing of certain prior year multi-state returns.
Our effective tax rate for the year ended December 29, 2007 differs from the combined federal and state statutory rate primarily due to increases in our valuation allowance for deferred tax assets and the write-off of goodwill, a majority of which is not deductible or amortizable for U.S. tax purposes.
We adopted the provisions of FIN 48, on January 1, 2007. As a result of adoption, we recorded an increase to retained earnings of approximately $386,000. As of the date of adoption and after the impact of recognizing the decrease in the liability noted above, our unrecognized tax benefits totaled approximately $192,000 and would affect our effective tax rate if recognized. We recognize accrued interest related to unrecognized tax benefits and penalties, if incurred, as components of income tax expense. Accrued interest as of the date of adoption of FIN 48 was $101,000 ($61,000 net of related tax benefit). The unrecognized tax benefits and related accrued interest (net of related tax benefit) were recorded in the balance sheet as of the date of adoption as “Other Long-Term Liabilities.”
During 2007, the Internal Revenue Service completed its examination of our 2004 tax federal income tax return with no changes to the return. In addition, we voluntarily filed a number of prior year multi-state returns with various state tax authorities. As a result, we recorded in 2007 a $253,000 income tax benefit related to the reversal of previously recorded uncertain tax positions and accrued interest.
40
Our Canadian subsidiary was also recently notified that it will be subject to audit by the Quebec tax authorities for the 2003 to 2005 pre-acquisition tax years. There is no unrecognized tax benefit associated with Canadian federal or provincial income taxes.
The effective tax rate for the year ended December 30, 2006 differed from the combined federal and state net statutory income tax rates primarily due to certain stock compensation expenses for which deferred tax assets could not be recorded in accordance with SFAS 123R.
Comparison of the Years Ended December 30, 2006 and December 31, 2005
Revenue.
| | | | | | | | | | | | |
| | | Year ended | | | | | |
| | | December 30,
2006 | | December 31,
2005 | | Change | |
| | | | | $ | | % | |
| | | (in thousands, except percentages) | |
Revenue | | $ | 360,376 | | $ | 214,985 | | $ | 145,391 | | 68 | % |
Revenue growth in 2006 was due to an increase in units sold both to repeat customers as well as to new customers. Units sold increased to 93,800 in 2006 from 56,100 in 2005 and the average selling price of units sold was relatively flat at $3,800. Approximately 91% of our revenues in 2006 were attributed to sales to customers that had also purchased our products in 2005. In 2006, sales of our Foundation Series compute servers increased by 68% or $121.3 million to $300.2 million as compared to $178.9 million in the prior year. For the year ended December 30, 2006, sales of our Scale Out Series compute servers increased by 61% or $9.6 million to $25.3 million as compared to $15.7 million in the same period last year. Sales of our Foundation Series storage servers —which include our RapidScale products—increased 71% or $14.4 million to $34.8 million compared to $20.4 million prior year. In 2006, our RapidScale products revenue was approximately $0.7 million. Service revenues were slightly over 1% of total revenues in 2006 and less than 1% of total revenues in 2005.
Cost of revenue and gross profit.
| | | | | | | | | | | | | | |
| | | Year ended | | | | | | |
| | | December 30,
2006 | | | December 31,
2005 | | | Change | |
| | | | | $ | | % | |
| | | (in thousands, except percentages) | |
Cost of revenue | | $ | 283,400 | | | $ | 165,329 | | | $ | 118,071 | | 71 | % |
Gross profit | | $ | 76,976 | | | $ | 49,656 | | | $ | 27,320 | | 55 | % |
Gross margin | | | 21.4 | % | | | 23.1 | % | | | n/a | | (7 | )% |
The decrease in gross margin in 2006 as compared to 2005 was primarily attributable to higher manufacturing and service and support related costs and to a lesser extent a more competitive pricing environment. Total manufacturing and service and support costs increased to $18.2 million or 5.0% of total revenue in 2006 from $7.5 million or 3.5% of revenue in 2005. Gross margin decreased approximately 1.5% due to higher manufacturing and service and support related costs. Share-based compensation included in cost of revenue was $3.6 million in 2006 as compared to $91,000 in 2005 primarily due to the adoption of SFAS 123R. Higher stock based compensation in 2006 contributed to approximately 1.0% of the decrease in gross margin. In addition, we have faced an increasingly competitive pricing environment in our server business, especially in the fourth quarter of 2006. In the fourth quarter of 2006, we had to reduce our price significantly to win a large order from one of our top customers due to aggressive pricing by a competitor in order to maintain our market share with that particular customer. Overall, a more competitive pricing environment decreased our gross margin by approximately 0.2%.
41
Operating expenses.
| | | | | | | | | | | | |
| | | Year ended | | | | | |
| | | December 30,
2006 | | December 31,
2005 | | Change | |
| | | | | $ | | % | |
| | | (in thousands, except percentages) | |
OPERATING EXPENSES: | | | | | | | | | | | | |
Research and development | | $ | 13,645 | | $ | 2,247 | | $ | 11,398 | | 507 | % |
Acquired in-process R&D | | $ | 2,840 | | $ | — | | $ | 2,840 | | — | |
Sales and marketing | | $ | 27,051 | | $ | 15,402 | | $ | 11,649 | | 76 | % |
General and administrative | | $ | 21,893 | | $ | 8,390 | | $ | 13,503 | | 161 | % |
Research and development expense. For the year ended December 30, 2006, payroll, bonuses and related fringe benefits accounted for $3.7 million of the increase in research and development expense as compared to 2005. We added engineering personnel to support increased research and development activities and acquired additional engineering personnel from the Terrascale acquisition. Overall, we increased our research and development personnel to 53 employees at the end of 2006 as compared to 18 employees at the end of the previous year. Materials, small tools and equipment and professional service expense increased $1.4 million due to an increase in ongoing engineering activities. In connection with the acquisition of Terrascale, we incurred a $0.7 million charge for amortization of intangibles and other assets. There was no similar charge last year. The share-based compensation expense included in research and development was $5.1 million in 2006 as compared to $70,000 in 2005 primarily due to the adoption of SFAS 123R.
Acquired in-process research and development. In connection with our acquisition of Terrascale, we incurred a $2.8 million charge for in-process research and development expenses in September 2006. There was no similar charge in 2005. The $2.8 million value allocated to projects that were identified as in-process research and development was charged to expense in the third quarter of 2006. We determined the value assigned to in-process research and development primarily utilizing the income approach which presumes that the value of an asset can be estimated by the cash flows to be received over the life of the asset, discounted to present value utilizing a discount rate of 21%.
Sales and marketing expense. For the year ended December 30, 2006, payroll, bonuses and related fringe benefits accounted for $3.0 million of the increase in sales and marketing expenses as compared to the prior year and were mainly due to an increase in headcount needed to support increased sales and marketing activities. Headcount increased to 73 employees at the end of 2006 as compared to 46 employees at the end of the prior year. Commission expense accounted for $1.9 million of the increase due to the growth in revenue. Marketing activities, advertising, public relation and trade show expenses cumulatively increased approximately $0.7 million in 2006 as compared to the prior year. These increases were partially offset by increased co-marketing funds from our vendors. Travel related expense increased by approximately $0.3 million primarily related to increased headcount to support higher revenue generating activities. The adoption of SFAS 123R increased share-based compensation included in sales and marketing expense to $6.2 million in 2006 as compared to approximately $0.3 million in 2005.
General and administrative expense. For the year ended December 30, 2006, payroll, bonuses and related fringe benefits accounted for $1.3 million of the increase in general and administrative expense as compared to the prior year and was primarily due to an increase in headcount needed to support additional finance and administrative activities. Headcount increased to 34 employees at the end of 2006 from 19 employees at the end of the previous year. In addition, higher use of temporary labor and higher recruiting expenses increased general and administrative expense by approximately $0.5 million. Fiscal year 2006 was our first year to meet the attestation requirements of Sarbanes-Oxley Act of 2002. We incurred approximately $2.0 million higher professional service fees to support the initial implementation of a new enterprise resource planning system to assist in the documentation and identification of our internal reporting controls; and, to support management’s testing of those controls, as compared to fiscal year 2005. Legal expense increased $1.8 million primarily due to
42
the costs associated with the Super Micro litigation. Share-based compensation included in general and administrative expense was $5.9 million in 2006 as compared to approximately $0.1 million in 2005 primarily related to the adoption of SFAS 123R.
Other income/(expense).
| | | | | | | | | | | | | | |
| | | Year ended | | | Change | |
| | | December 30, | | | December 31, | | |
| | | 2006 | | | 2005 | | | $ | | % | |
| | | (in thousands, except percentages) | |
OTHER INCOME (EXPENSE)—Net: | | | | | | | | | | | | | | |
Change in fair value of embedded derivatives | | $ | — | | | $ | (4,192 | ) | | $ | 4,192 | | (100 | )% |
Interest income | | $ | 7,488 | | | $ | 509 | | | $ | 6,979 | | 1,371 | % |
Interest expense | | $ | (13 | ) | | $ | (1,537 | ) | | $ | 1,524 | | (99 | )% |
Other Income, net | | $ | 822 | | | $ | 23 | | | $ | 799 | | 3,474 | % |
Change in fair value of embedded derivatives. Derivative accounting associated with our preferred stock ceased in February 2005.
Interest income. The increase in interest income was due to higher average cash, cash equivalents and short-term investment balances related to the proceeds from our initial public offering in June 2005 and our follow-on offerings in December 2005 and March 2006.
Interest expense. In 2005, interest expense included $1.1 million of accretion of preferred stock dividends recorded as interest expense. With the redemption of our mandatorily redeemable preferred stock in June 2005 in connection with our initial public offering, we did not incur similar dividend expense beyond June 2005. In addition, with the proceeds from our public offering and follow-on offerings, we fully repaid the borrowings under our line of credit facility in 2005 and eliminated the need to utilize this line of credit facility in 2006.
Other income (expense)—net. The change in other income (expense), net resulted primarily from the foreign exchange gain of approximately $0.8 million in 2006 as compared to a gain of less than $0.1 million in 2005. The increase in the foreign exchange gain resulted primarily from balances held in Euros in the second quarter of 2006 for our European operations.
Provision for income taxes.
| | | | | | | | | | | | | |
| | | Year ended | | Change | |
| | | December 30, | | December 31, | |
| | | 2006 | | 2005 | | $ | | | % | |
| | | (in thousands, except percentages) | |
Tax provision | | $ | 8,372 | | $ | 9,908 | | $ | (1,536 | ) | | (16 | )% |
The effective tax rate for the year ended December 30, 2006 differed from the combined federal and state statutory rate primarily due to certain stock compensation expenses for which deferred tax assets could not be recorded in accordance with SFAS 123R. The effective tax rate for the year ended December 31, 2005 differed from the federal and state net statutory income tax rates primarily due to permanent tax differences associated with the accounting for embedded derivatives and preferred stock dividends recorded as interest expense.
Liquidity and Capital Resources
Historically, we have required capital principally to fund our working capital needs. We anticipate that our cash and cash equivalents and short-term investments as of December 29, 2007, will be sufficient to meet our working capital requirements, expansion plans and technology development projects for at least the next 12 months.
43
We had $198.1 million in cash, cash equivalents and short-term investments at December 29, 2007, as compared to $160.5 million at December 30, 2006, and $54.2 million at December 31, 2005. At December 29, 2007, we held $64.6 million of short-term investments consisting of various auction rate municipal bonds and variable rate municipal demand notes (“ARS”). Substantially all of these securities were collateralized by guaranteed student loans, insured or reinsured by the federal government. During February 2008, the Company reduced its investment in ARS to approximately $9.1 million. These securities had a successful auction reset subsequent to December 29, 2007, but failed in February 2008. If these securities remain in the portfolio and do not have a successful reset prior to March 29, 2008, (the end of the Company’s first quarter of fiscal 2008), they will need to be reclassified to long-term investments at their then fair value and an impairment charge may be required. The credit markets are currently experiencing significant uncertainty, and some of this uncertainty has impacted the markets where our auction rate securities would be offered. For additional information related to our investments in ARS investments see Note 12 in our Consolidated Financial Statements in this Form 10-K. At March 1, 2008, we had reduced our investments in ARS to $9.1 million. The adequacy of these resources to meet our liquidity needs beyond the next 12 months will depend on our growth, operating results and capital expenditures required to meet possible increased demand for our products. If we fail to reduce cash consumed by operations, or generate additional cash from our operations on a timely basis, we may not have the cash resources required to run our business and we may need to seek additional sources of funds to meet our needs.
| | | | | | | | | | | | |
| | | Year Ended | |
| | | December 29,
2007 | | | December 30,
2006 | | | December 31,
2005 | |
| | | (in thousands) | |
Consolidated Statements of Cash Flows Data: | | | | | | | | | | | | |
Net cash provided by (used in) operating activities | | $ | 46,075 | | | $ | (17,584 | ) | | $ | (28,384 | ) |
Net cash used in investing activities | | | (32,145 | ) | | | (140,904 | ) | | | (26,817 | ) |
Net cash provided by financing activities | | | 5,547 | | | | 159,870 | | | | 67,189 | |
Operating Activities
Despite a net loss of $69.6 million in 2007, net cash provided by operating activities increased to $46.1 million. This increase was due to four primary factors; accounts receivable, impairment of goodwill, share-based compensation, deferred income tax and to a lesser extent inventory and accounts payable.
The reduction in accounts receivable of $54.0 million resulted from very linear sales in the fourth quarter of 2007 compared to the back-end loaded fourth quarter of 2006.
Through improved supply management we decreased our inventory levels and purchases to respond to the sales trends in 2007. Improvements in our supply chain management are intended to ensure sufficient supply on hand to meet expected demand for our products. The decrease was predominantly in raw materials, where we took a net charge against of excess and obsolete inventory of $16.6 million. The improved supply chain management and more linear inventory purchases in the fourth quarter of 2007 as compared to the fourth quarter of 2006, allowed us to decrease inventory by $15.0 million and accounts payable by $13.9 million.
Non-cash charges totaling $67.7 million were comprised primarily of impairment of goodwill of $23.9 million, share-based compensation of $23.2 million, deferred income tax of $14.5 million and depreciation and amortization of $7.4 million.
The net use of cash for operating activities in 2006 was mainly due to significantly increased accounts receivable balances, resulting from significantly higher sales in 2006 due to a substantial portion of sales occurring in December 2006 as compared to December 2005. Although partially offset by higher collections, accounts receivable increased to $104.1 million at December 30, 2006, compared with $49.7 million last year. In addition, we increased our inventory levels and purchases to respond to the sales increases in 2006. At December 30, 2006, inventory was $68.1 million compared to $40.6 million at December 31, 2005. The increase
44
was predominantly in raw materials, intended to ensure sufficient supply on hand to meet expected demand for our products. Increases in accounts receivable and inventory were partially offset by the increases in accounts payable resulting from significantly higher purchases and spending for the increased sales activities in 2006.
Net cash used in operating activities in fiscal 2005 was used to fund net working capital increases in accounts receivable of $40.4 million and in inventories of $27.0 million. The increase in our accounts receivable balance at December 31, 2005 was attributable to higher sales volume during the fourth quarter of 2005 compared to the same period in 2004. The increase in inventory was mainly due to higher beginning backlog and work-in-process at December 29, 2004. The increase in our accounts receivable and inventory balances was partially offset by an increase in accounts payable of $17.4 million and an increase of $12.6 million in deferred revenues relating to sales we deferred at year end due to acceptance provisions and shipments of uncompleted systems. We anticipate that accounts receivable, inventory and accounts payable will continue to increase to the extent our business expands.
Investing Activities
During the year ended December 29, 2007, the net cash from operations along with funds on-hand were used primarily for investing. In 2007, we purchased approximately $584 million of securities and received proceeds from sales or maturities of securities of approximately $566 million. We paid $9.1 million to the former Terrascale shareholders for additional intangible property not acquired as part of the initial acquisition of Terrascale. We purchased approximately $4.5 million for property and equipment primarily related to research and development projects, as well as our corporate office relocation.
During the year ended December 30, 2006, we used net cash mainly for investing the funds received from the initial public offering and the follow-on public offerings. In addition, we completed our acquisition of Terrascale in September 2006 and paid $31.9 million in cash as of December 30, 2006 related to that transaction. We also purchased $3.9 million of property, plant and equipment due to investments in our infrastructure and systems, including the implementation of a new financial accounting system, to improve our process controls and procedures in our efforts to become compliant with Sarbanes-Oxley internal control over financial reporting requirements.
Cash used by investing activities during the year ended December 31, 2005, consisted of purchases of short-term marketable securities of $55.8 million and $1.8 million used for capital expenditures for computer hardware, office equipment and software applications. These were partially offset by sales and net maturities of our short-term marketable securities of $30.9 million.
Financing Activities
Cash provided by financing activities during the year ended December 29, 2007 was $5.5 million. Cash generated from financing activities included $1.6 million of excess tax benefits related to stock option exercises and proceeds of $2.7 million from stock option exercises and $1.8 million from employee stock purchases.
Cash provided by financing activities during the year ended December 30, 2006 was $159.9 million, mainly due to the proceeds of $138.5 million from a follow-on public offering completed in March 2006. Cash generated from financing activities also included $15.0 million of excess tax benefits related to stock option exercises and proceeds of $6.4 million from stock option exercises and employee stock purchases.
Net cash generated from financing activities in fiscal 2005 was $67.2 million, as compared to $11.6 million in fiscal 2004. In June 2005, we successfully completed our initial public offering, netting $67.8 million after issuance costs. With the net proceeds, we redeemed our mandatorily redeemable preferred stock in the amount of $24.7 million, repaid outstanding borrowings under our credit facility with Silicon Valley Bank in the amount of $14.1 million and repaid $3.0 million of notes payable to related parties. In the same period, we also repurchased
45
$6.0 million of shares from our founders. In December 2005, we completed a follow-on offering from which we received $46.8 million in net proceeds after issuance costs.
We expect to continue to invest in the business including working capital, capital expenditures and operating expenses. We intend to fund these activities with our cash reserves and cash generated from operations, if any. This increase in operating expenses may not result in an increase in our revenue and our anticipated revenue may not be sufficient to support these increased expenditures. We anticipate that operating expenses and working capital will constitute a material use of our cash resources.
Credit Facility
In September 2006, we entered into a line of credit agreement with a bank that provides for borrowings not to exceed $25.0 million. The line of credit agreement matured on September 29, 2007. There were no borrowings under the line of credit when it expired. We decided not renew or replace the facility.
Contractual Obligations and Commitments
The following are contractual obligations and commitments at December 29, 2007, associated with lease obligations and contractual commitments (in thousands):
| | | | | | | | | | | | | | | |
| | | Payments due by period |
| | | Total | | Less than
1 year | | 1 - 3
years | | 3 - 5
years | | More than
5 years |
Operating leases | | $ | 9,616 | | $ | 1,596 | | $ | 3,152 | | $ | 3,225 | | $ | 1,643 |
Purchase obligations | | | 31,157 | | | 29,662 | | | 1,495 | | | — | | | — |
| | | | | | | | | | | | | | | |
Total | | $ | 40,773 | | $ | 31,258 | | $ | 4,647 | | $ | 3,225 | | $ | 1,643 |
| | | | | | | | | | | | | | | |
In addition to a five-year lease entered in July 2004 for a building located in Milpitas, California and a three-year lease for an office in Seattle, Washington. We have a seven-year operating lease that commenced on December 1, 2006, for a 117,500 square foot facility, which will serve as our manufacturing and warehouse facility in Fremont, California. Lease payments increase annually and the total future minimum lease payments amount to $6.6 million over the lease term. The stated term of the lease is seven years, but we may extend the lease for an additional three years. As part of this agreement, we are required to maintain a $100,000 cash deposit or an unconditional and irrevocable fully cash-collateralized letter of credit as a form of security. The cash deposit for the lease building is included in other assets in the accompanying consolidated balance sheets as of December 29, 2007.
In November 2006, we signed an additional operating lease for a 40,316 square foot facility which will serve as our headquarters in Fremont, California. Lease payments increase annually and the total future minimum lease payments amount to $2.6 million over the lease term. The stated term of the lease is six years and ten months, commencing on March 1, 2007. We can extend the lease an additional 3 years at 95% of the current market rate. We are required to maintain a cash deposit of approximately $40,000 that is included in other assets in the accompanying consolidated balance sheets as of December 29, 2007.
In connection with agreements with our suppliers, we agreed to purchase certain units of inventory through 2008. As of December 29, 2007, there was a remaining commitment of $1.5 million.
From time to time, we issue blanket purchase orders to our contract manufacturers for the procurement of materials to be used for upcoming orders, particularly for those components that have long lead times. Blanket purchase orders vary in size depending on the projected requirements of the company. If we do not consume these materials on a timely basis or if our relationship with one of our contract manufacturers was to terminate, we could experience an abnormal increase to our inventory carrying amount and related accounts payable.
46
Other than the obligations, liabilities and commitments described above, we have no significant unconditional purchase obligations or similar instruments. We are not a guarantor of any other entities’ debt or other financial obligations.
We believe that our current cash balance will be sufficient to meet our needs for at least the next 12 months. If we require additional capital resources to expand our business internally or to acquire complementary technologies and businesses at any time in the future, we may seek to sell additional equity or debt securities or obtain other debt financing. The sale of additional equity or convertible debt securities could result in more dilution to our stockholders. Financing arrangements may not be available to us, or may not be available in amounts or on terms acceptable to us.
Off Balance Sheet Arrangements
We have no off balance sheet arrangements.
Related Party Transactions
Gary A. Griffiths, a member of the our Board of Directors since November 2004, is also President, Products for WebEx Communications, Inc, a Cisco Systems, Inc. company, and a provider of web-based conferencing solutions. WebEx is a customer of and a supplier to the our company. Revenue from WebEx was $0.6 million and $2.5 million in the years ended December 29, 2007 and December 30, 2006, respectively. At December 29, 2007, $58,052 was outstanding and included in accounts receivable and at December 30, 2006, $10,742 was outstanding and included in accounts receivable.
Recently Adopted Accounting Standards
In June 2006, the FASB issued Financial Accounting Standards Board Interpretation No. 48, “Accounting for Uncertainty in Income Tax—an Interpretation of Financial Accounting Standards Board Statement No. 109.” This interpretation clarifies the accounting and disclosures relating to the uncertainty about whether a tax return position will ultimately be sustained by the tax authorities. We adopted this interpretation on January 1, 2007. As part of the adoption, we recorded a reduction in our liability for unrecognized tax benefits of $386,000 which increased our January 1, 2007 balance of retained earnings.
In September 2006, the SEC issued SAB No. 108,Considering the Effects of Prior Year Misstatements when Quantifying Misstatements in Current Year Financial Statements(“SAB No. 108”). SAB No. 108 provides guidance on the consideration of the effects of prior year misstatements in quantifying current year misstatements for the purpose of a materiality assessment. SAB No. 108 establishes an approach that requires quantification of financial statement errors based on the effects of each of the company’s balance sheet, statement of operations and the related financial statement disclosures. Early application of the guidance in SAB No. 108 is encouraged in the interim periods of fiscal year ending after November 15, 2006. We adopted SAB No. 108 as of the year ended December 30, 2006. The adoption does not have a material impact on our consolidated results of operations and financial condition.
In September 2006, the FASB issued SFAS No. 157,Fair Value Measurements(“SFAS No. 157”),which defines fair value, establishes a framework for measuring fair value in generally accepted accounting principles, and expands disclosures about fair value measurements. SFAS No. 157 applies whenever other standards require (or permit) assets or liabilities to be measured at fair value, and does not expand the use of fair value in any new circumstances. SFAS No. 157 is effective for financial statements issued for fiscal years beginning after November 15, 2007. We do not expect the adoption of SFAS No. 157 to have a material impact on our consolidated results of operations, financial position and cash flows.
In February 2007, the FASB issued SFAS 159, The Fair Value Option for Financial Assets and Financial Liabilities—Including an Amendment of FASB Statement No. 115,which is effective for fiscal years beginning
47
after November 15, 2007. This statement permits an entity to choose to measure many financial instruments and certain other items at fair value at specified election dates. Subsequent unrealized gains and losses on items for which the fair value option has been elected will be reported in earnings. We do not expect the adoption of SFAS No. 159 to have a material impact on our consolidated results of operations, financial position and cash flows.
Item 7A. Quantitative and Qualitative Disclosures about Market Risk
Foreign Exchange Risk
We do not make material sales or have material purchase obligations outside of the United States and therefore do not generally have exposure to foreign currency exchange risks. As of December 29, 2007 and December 30, 2006, we had minimal exposure on value added tax receivables denominated in the Euro.
Investment Risk
Interest rate risk represents the risk of changes in value of a financial instrument caused by fluctuations in interest rates. We had no indebtedness as of December 29, 2007. An immediate 10% increase in the prime rate would not have a material effect on our interest expense. If and when we do enter into future borrowing arrangements, we may seek to manage exposure to interest rate changes by using a mix of debt maturities and variable- and fixed-rate debt, together with interest rate swaps where appropriate, to fix or lower our borrowing costs.
Our exposure to market risks for changes in interest rates relates primarily to our investment portfolio. As of December 29, 2007, our cash equivalents consisted of money market funds in the amount of $40.9 million, and our short-term investments consisted of $148.2 million of debt securities with effective maturities of three months or less. An assumed 50 basis points and 100 basis points adverse change to interest rates of these investments would result in a corresponding decline in interest income of approximately $0.4 and $0.8 million, respectively. As of December 30, 2006, our cash equivalents consisted of money market funds in the amount of $20.1 million, and our short-term investments consisted of $130.0 million of debt securities with effective maturities of three months or less. An assumed 50 basis points and 100 basis points adverse change to interest rates of these investments would have resulted in a corresponding decline in interest income of approximately $0.4 and $0.7 million, respectively. We do not hold short-term investments for trading purposes. Since we believe we have the ability to liquidate this portfolio or hold it to maturity, we do not expect our operating results or cash flows to be materially affected to any significant degree by a sudden change in market interest rates on our investment portfolio.
At December 29, 2007, we held $64.6 million of short-term investments consisting of various auction rate municipal bonds and variable rate municipal demand notes (“ARS”). Substantially all of these securities consisted of guaranteed student loans, insured or reinsured by the federal government. During February 2008, the Company reduced its investment in ARS to approximately $9.1 million. These securities had a successful auction reset subsequent to December 29, 2007, but failed in February 2008. If these securities remain in the portfolio and do not have a successful reset prior to March 29, 2008, (the end of the Company’s first quarter of fiscal 2008), they will need to be reclassified to long-term investments at their then fair value and an impairment charge may be required. The credit markets are currently experiencing significant uncertainty, and some of this uncertainty has impacted the markets where our auction rate securities would be offered. For additional information related to our investment in ARS, see Note 12 in our Consolidated Financial Statements of this Form 10-K.
48
Item 8.Financial Statements and Supplementary Data
Unaudited Selected Quarterly Consolidated Financial Information
The following tables set forth our unaudited quarterly consolidated statements of operations data for each of the eight quarters in the period ended December 29, 2007. These tables should be read in conjunction with our consolidated financial statements and accompanying notes included in this Annual Report on Form 10-K. We have prepared this unaudited information on the same basis as our audited consolidated financial statements. These tables include all adjustments, consisting only of normal recurring adjustments that we consider necessary for a fair presentation of our operating results for the quarters presented. Operating results for any quarter are not necessarily indicative of results for any subsequent periods.
| | | | | | | | | | | | | | | | | | | | | | | | | | | | | | | | |
| | | Quarter Ended | |
| | | April 1,
2006 | | | July 1,
2006 | | | September 30,
2006 | | | December 30,
2006 | | | March 31,
2007 | | | June 30,
2007 | | | September 29,
2007 | | | December 29,
2007 | |
| | | (Unaudited) | |
| | | (in thousands, except per share data) | |
Revenue | | $ | 84,392 | | | $ | 88,648 | | | $ | 80,460 | | | $ | 106,876 | | | $ | 72,023 | | | $ | 82,238 | | | $ | 87,243 | | | $ | 111,650 | |
Gross profit (loss) | | | 19,494 | | | | 20,183 | | | | 17,179 | | | | 20,120 | | | | 9,024 | | | | (6,934 | ) | | | 18,851 | | | | 28,030 | |
Income (loss) from operations | | | 9,318 | | | | 6,611 | | | | (2,949 | ) | | | (1,433 | ) | | | (17,874 | ) | | | (31,042 | ) | | | (2,689 | ) | | | (19,973 | ) |
Income (loss) before tax | | | 10,226 | | | | 9,243 | | | | (257 | ) | | | 632 | | | | (16,071 | ) | | | (29,004 | ) | | | (327 | ) | | | (17,588 | ) |
Income tax benefit (provision) | | | (4,254 | ) | | | (3,917 | ) | | | (132 | ) | | | (69 | ) | | | 5,914 | | | | (11,444 | ) | | | 332 | | | | (1,370 | ) |
Net income (loss) | | | 5,972 | | | | 5,326 | | | | (389 | ) | | | 563 | | | | (10,157 | ) | | | (40,448 | ) | | | 5 | | | | (18,957 | ) |
Net income (loss) per share attributable to common stockholders | | | | | | | | | | | | | | | | | | | | | | | | | | | | | | | | |
Basic | | $ | 0.25 | | | $ | 0.19 | | | $ | (0.01 | ) | | $ | 0.02 | | | $ | (0.36 | ) | | $ | (1.42 | ) | | $ | 0.00 | | | $ | (0.65 | ) |
| | | | | | | | | | | | | | | | | | | | | | | | | | | | | | | | |
Diluted | | $ | 0.23 | | | $ | 0.18 | | | $ | (0.01 | ) | | $ | 0.02 | | | $ | (0.36 | ) | | $ | (1.42 | ) | | $ | 0.00 | | | $ | (0.65 | ) |
| | | | | | | | | | | | | | | | | | | | | | | | | | | | | | | | |
Shares used in computing net income (loss) per share attributable to common stockholders | | | | | | | | | | | | | | | | | | | | | | | | | | | | | | | | |
Basic | | | 24,274 | | | | 27,693 | | | | 27,812 | | | | 28,012 | | | | 28,221 | | | | 28,564 | | | | 29,125 | | | | 29,233 | |
| | | | | | | | | | | | | | | | | | | | | | | | | | | | | | | | |
Diluted | | | 26,235 | | | | 29,250 | | | | 27,812 | | | | 29,452 | | | | 28,221 | | | | 28,564 | | | | 29,317 | | | | 29,233 | |
| | | | | | | | | | | | | | | | | | | | | | | | | | | | | | | | |
Revenue
Our business and operating results depend upon the capital procurement cycles of our customers. Due to large individual orders relative to our overall revenue, our quarterly revenue can fluctuate greatly from period to period. Over the past several years, we have experienced significant fluctuations in customer orders for our products, as can be seen in the table above.
Gross Profit
Gross profit can fluctuate greatly from quarter to quarter as a result of our revenue fluctuations. Our fixed costs in cost of revenue have steadily increased over the past two years with the implementation of SFAS 123R and the build out of our operational infrastructure. Our gross profit is impacted by quarterly volatility and decrease as revenue decreases due to a smaller revenue base in which to absorb the fixed overhead. Charges related to E&O caused by technology shifts, poor supply chain management or other changes, can have a significant impact on our gross profit. Our gross profit can also be affected by volatile price changes for components from our supplier base, particularly for DRAM, for which prices have fluctuated greatly in the past. In the quarter ended December 30, 2006, the price we had to pay for DRAM increased sharply. The sharp increase in the price resulted because we rely on three suppliers for this component and the only supplier that
49
could supply the quantities required was the highest price supplier. This negatively impacted our gross margin by approximately 170 basis points in the quarter. In the quarter ended June 30, 2007 we expensed $20.6 million related to the write down of E&O inventory. In the quarter ended September 29, 2007, we recorded a benefit of $2.6 million related to the sale of previously written down E&O inventory. In the quarter ended December 29, 2007, we recorded a benefit of $4.1 million related to the sale of previously written down E&O inventory.
Income (loss) from operations
Our operating income (loss) has been negatively impacted by the fact that operating expenses have increased sequentially in seven of the last eight quarters for research and development expenses, sales and marketing expenses and general and administrative expenses. The increases in research and development expenses are due to our efforts to improve functionality; develop technology to support new products such as our DC power, storage and modular data center products; and absorption of additional research and development staff in connection with the acquisition of Terrascale Technologies, Inc in the quarter ended September 30, 2006. Our sales and marketing expenses have increased in part due to expansion of sales support to existing customers, commission expense related to the growth in revenue and of our increased efforts to build our customer base. Our general and administrative expenses increased as we improved our infrastructure to support the additional requirements of being a public company. In the quarter ended September 30, 2006, we expensed $2.8 million for acquired in-process research and development in connection with the acquisition of Terrascale Technologies, Inc. In the quarter ended December 29, 2007 we expensed $23.9 million related to our impairment of goodwill.
50
Index to Consolidated Financial Statements
51
REPORT OF INDEPENDENT REGISTERED PUBLIC ACCOUNTING FIRM
To the Board of Directors and Stockholders of
Rackable Systems, Inc.:
We have audited the accompanying consolidated balance sheets of Rackable Systems, Inc. and subsidiaries (the “Company”) as of December 29, 2007 and December 30, 2006, and the related consolidated statements of operations, stockholders’ equity (deficit), and cash flows for each of the three years in the period ended December 29, 2007. These consolidated financial statements are the responsibility of the Company’s management. Our responsibility is to express an opinion on these consolidated financial statements based on our audits.
We conducted our audits in accordance with the standards of the Public Company Accounting Oversight Board (United States). Those standards require that we plan and perform the audit to obtain reasonable assurance about whether the financial statements are free of material misstatement. An audit includes examining, on a test basis, evidence supporting the amounts and disclosures in the financial statements. An audit also includes assessing the accounting principles used and significant estimates made by management, as well as evaluating the overall financial statement presentation. We believe that our audits provide a reasonable basis for our opinion.
In our opinion, such consolidated financial statements present fairly, in all material respects, the financial position of the Company at December 29, 2007 and December 30, 2006, and the results of its operations and its cash flows for each of the three years in the period ended December 29, 2007, in conformity with accounting principles generally accepted in the United States of America.
As discussed in Note 2 to the consolidated financial statements, effective January 1, 2006, the Company changed its method of accounting for stock-based compensation in accordance with guidance provided in Statement of Financial Accounting Standards No. 123(R), “Share-Based Payment.” Also as discussed in Note 2 to the consolidated financial statements, effective December 31, 2006, the Company adopted FASB Interpretation No. 48, “Accounting for Uncertainty in Income Taxes—an Interpretation of FASB No. 109.”
We have also audited, in accordance with the standards of the Public Company Accounting Oversight Board (United States), the Company’s internal control over financial reporting as of December 29, 2007, based on the criteria established inInternal Control—Integrated Framework issued by the Committee of Sponsoring Organizations of the Treadway Commission and our report dated March 12, 2008 expressed an adverse opinion on the Company’s internal control over financial reporting because of material weaknesses.
/s/ DELOITTE & TOUCHE, LLP
San Jose, California
March 12, 2008
52
RACKABLE SYSTEMS, INC. AND SUBSIDIARIES
CONSOLIDATED BALANCE SHEETS
(In thousands, except par value and share amounts)
| | | | | | | | |
| | | December 29,
2007 | | | December 30,
2006 | |
ASSETS | | | | | | | | |
CURRENT ASSETS: | | | | | | | | |
Cash and cash equivalents | | $ | 49,897 | | | $ | 30,446 | |
Short-term investments | | | 148,215 | | | | 130,025 | |
Accounts receivable, net of allowance for doubtful accounts of $434 and $328 at December 31, 2007 and 2006, respectively | | | 49,957 | | | | 104,070 | |
Inventories | | | 52,528 | | | | 68,137 | |
Deferred income taxes | | | 499 | | | | 7,408 | |
Deferred cost of sales | | | 456 | | | | 2,375 | |
Prepaids and other current assets | | | 19,000 | | | | 12,934 | |
| | | | | | | | |
Total current assets | | | 320,552 | | | | 355,395 | |
PROPERTY AND EQUIPMENT—Net | | | 8,285 | | | | 5,372 | |
GOODWILL | | | — | | | | 22,871 | |
INTANGIBLE ASSETS—Net | | | 22,732 | | | | 14,007 | |
OTHER ASSETS | | | 889 | | | | 9,125 | |
| | | | | | | | |
TOTAL | | $ | 352,458 | | | $ | 406,770 | |
| | | | | | | | |
LIABILITIES AND STOCKHOLDERS’ EQUITY | | | | | | | | |
CURRENT LIABILITIES: | | | | | | | | |
Accounts payable | | $ | 47,780 | | | $ | 61,102 | |
Accrued expenses | | | 16,382 | | | | 19,894 | |
Income taxes payable | | | — | | | | 247 | |
Deferred revenue | | | 5,190 | | | | 5,972 | |
| | | | | | | | |
Total current liabilities | | | 69,352 | | | | 87,215 | |
DEFERRED INCOME TAXES | | | 3,031 | | | | 431 | |
DEFERRED RENT | | | 868 | | | | 23 | |
DEFERRED REVENUE | | | 3,089 | | | | 3,412 | |
| | | | | | | | |
Total liabilities | | | 76,340 | | | | 91,081 | |
COMMITMENTS AND CONTINGENCIES (NOTE 11) | | | | | | | | |
STOCKHOLDERS’ EQUITY: | | | | | | | | |
Common stock, $0.001 par value; 120,000,000 shares authorized; 29,525,561 and 28,230,785 shares issued and outstanding at December 29, 2007 and December 30, 2006, respectively | | | 29 | | | | 28 | |
Additional paid-in capital | | | 440,725 | | | | 411,118 | |
Accumulated other comprehensive loss | | | (11 | ) | | | (3 | ) |
Accumulated deficit | | | (164,625 | ) | | | (95,454 | ) |
| | | | | | | | |
Total stockholders’ equity | | | 276,118 | | | | 315,689 | |
| | | | | | | | |
TOTAL | | $ | 352,458 | | | $ | 406,770 | |
| | | | | | | | |
See notes to consolidated financial statements.
53
RACKABLE SYSTEMS, INC. AND SUBSIDIARIES
CONSOLIDATED STATEMENTS OF OPERATIONS
(In thousands, except for share and per share amounts)
| | | | | | | | | | | | |
| | | Year Ended | |
| | | December 29,
2007 | | | December 30,
2006 | | | December 31,
2005 | |
REVENUE | | $ | 353,155 | | | $ | 360,376 | | | $ | 214,985 | |
COST OF REVENUE | | | 304,183 | | | | 283,400 | | | | 165,329 | |
| | | | | | | | | | | | |
GROSS PROFIT | | | 48,972 | | | | 76,976 | | | | 49,656 | |
| | | | | | | | | | | | |
OPERATING EXPENSES: | | | | | | | | | | | | |
Research and development | | | 26,281 | | | | 13,645 | | | | 2,247 | |
Acquired in-process research and development | | | — | | | | 2,840 | | | | — | |
Sales and marketing | | | 34,245 | | | | 27,051 | | | | 15,402 | |
General and administrative | | | 36,152 | | | | 21,893 | | | | 8,390 | |
Impairment of goodwill | | | 23,872 | | | | — | | | | — | |
| | | | | | | | | | | | |
Total operating expenses | | | 120,550 | | | | 65,429 | | | | 26,039 | |
| | | | | | | | | | | | |
INCOME (LOSS) FROM OPERATIONS | | | (71,578 | ) | | | 11,547 | | | | 23,617 | |
OTHER INCOME (EXPENSE)—Net: | | | | | | | | | | | | |
Change in fair value of embedded derivatives in preferred
stock | | | — | | | | — | | | | (4,192 | ) |
Interest income | | | 8,236 | | | | 7,488 | | | | 509 | |
Interest expense | | | (8 | ) | | | (13 | ) | | | (1,537 | ) |
Other income—net | | | 360 | | | | 822 | | | | 23 | |
| | | | | | | | | | | | |
Total other income (expense)—net | | | 8,588 | | | | 8,297 | | | | (5,197 | ) |
| | | | | | | | | | | | |
INCOME (LOSS) BEFORE INCOME TAX PROVISION | | | (62,990 | ) | | | 19,844 | | | | 18,420 | |
INCOME TAX PROVISION | | | (6,567 | ) | | | (8,372 | ) | | | (9,908 | ) |
| | | | | | | | | | | | |
NET INCOME (LOSS) | | $ | (69,557 | ) | | $ | 11,472 | | | $ | 8,512 | |
| | | | | | | | | | | | |
NET INCOME (LOSS) PER SHARE | | | | | | | | | | | | |
Basic | | $ | (2.42 | ) | | $ | 0.43 | | | $ | 0.86 | |
| | | | | | | | | | | | |
Diluted | | $ | (2.42 | ) | | $ | 0.40 | | | $ | 0.47 | |
| | | | | | | | | | | | |
SHARES USED IN NET INCOME (LOSS) PER SHARE | | | | | | | | | | | | |
Basic | | | 28,785,807 | | | | 26,947,888 | | | | 9,946,791 | |
| | | | | | | | | | | | |
Diluted | | | 28,785,807 | | | | 28,618,309 | | | | 18,040,017 | |
| | | | | | | | | | | | |
See notes to consolidated financial statements.
54
RACKABLE SYSTEMS, INC. AND SUBSIDIARIES
CONSOLIDATED STATEMENTS OF STOCKHOLDERS’ EQUITY (DEFICIT)
(In thousands, except for share amounts)
| | | | | | | | | | | | | | | | | | | | | | | | | | | |
| | | Common Stock | | | Additional
Paid-In
Capital | | | Deferred
Stock-Based
Comprehensive | | | Accumulated
Other
Compensation
Income (Loss) | | | Accumulated
Deficit | | | Total
Stockholders’
Equity
(Deficit) | |
| | | Shares | | | Amount | | | | | | |
BALANCE—January 1, 2005 | | 5,570,462 | | | $ | 6 | | | $ | 12,811 | | | $ | (2,134 | ) | | | — | | | $ | (115,438 | ) | | $ | (104,755 | ) |
Net income | | — | | | | — | | | | — | | | | — | | | | | | | | 8,512 | | | | 8,512 | |
Unrealized gain on short-term investments | | — | | | | — | | | | — | | | | — | | | | 1 | | | | — | | | | 1 | |
| | | | | | | | | | | | | | | | | | | | | | | | | | | |
Total comprehensive income | | | | | | | | | | | | | | | | | | | | | | | | | | 8,513 | |
| | | | | | | | | | | | | | | | | | | | | | | | | | | |
Reclassification of embedded derivatives in preferred stock (Note 11) | | — | | | | — | | | | 107,831 | | | | — | | | | — | | | | — | | | | 107,831 | |
Deferred stock-based compensation related to stock options granted to employees | | — | | | | — | | | | 433 | | | | (433 | ) | | | — | | | | — | | | | — | |
Amortization of deferred stock-based compensation—net of cancellations | | — | | | | — | | | | — | | | | 553 | | | | — | | | | — | | | | 553 | |
Reversal of deferred stock-based compensation related to cancellation of stock options | | — | | | | — | | | | (209 | ) | | | 209 | | | | — | | | | — | | | | — | |
Issuance of common stock upon exercise of stock options | | 412,738 | | | | — | | | | 373 | | | | — | | | | — | | | | — | | | | 373 | |
Income tax benefit relating to stock option exercises | | — | | | | — | | | | 3,028 | | | | — | | | | — | | | | — | | | | 3,028 | |
Issuance of common stock in connection with initial public offering net of issuance costs of $2,311 | | 6,250,000 | | | | 6 | | | | 67,433 | | | | — | | | | — | | | | — | | | | 67,439 | |
Issuance of common stock in connection with a follow on public offering net of issuance costs of $697 | | 2,600,000 | | | | 3 | | | | 46,230 | | | | — | | | | — | | | | — | | | | 46,233 | |
Conversion of Series A preferred stock into common stock | | 9,016,000 | | | | 9 | | | | (9 | ) | | | — | | | | — | | | | — | | | | — | |
Issuance of common stock as payment for accrued liabilities | | 7,332 | | | | — | | | | 50 | | | | — | | | | — | | | | — | | | | 50 | |
Repurchase of common stock from founders | | (816,083 | ) | | | (1 | ) | | | (5,999 | ) | | | — | | | | — | | | | — | | | | (6,000 | ) |
| | | | | | | | | | | | | | | | | | | | | | | | | | | |
BALANCE—December 31, 2005 | | 23,040,449 | | | $ | 23 | | | $ | 231,972 | | | $ | (1,805 | ) | | $ | 1 | | | $ | (106,926 | ) | | $ | 123,265 | |
Net income | | — | | | | — | | | | — | | | | — | | | | — | | | | 11,472 | | | | 11,472 | |
Unrealized gain on short-term investments | | — | | | | — | | | | — | | | | — | | | | 31 | | | | — | | | | 31 | |
Cumulative translation adjustment | | — | | | | — | | | | — | | | | — | | | | (35 | ) | | | — | | | | (35 | ) |
| | | | | | | | | | | | | | | | | | | | | | | | | | | |
Total comprehensive income | | | | | | | | | | | | | | | | | | | | | | | | | | 11,468 | |
| | | | | | | | | | | | | | | | | | | | | | | | | | | |
Issuance of common stock in connection with a follow on public offering net of issuance costs of $736 | | 4,230,850 | | | | 4 | | | | 138,448 | | | | — | | | | — | | | | — | | | | 138,452 | |
Issuance of common stock under employee stock option and employee stock purchase plan, net of taxes | | 839,486 | | | | 1 | | | | 6,447 | | | | | | | | | | | | | | | | 6,448 | |
Restricted common stock grants | | 120,000 | | | | — | | | | — | | | | — | | | | — | | | | — | | | | — | |
Income tax benefit relating to stock option exercises | | — | | | | — | | | | 14,971 | | | | — | | | | — | | | | — | | | | 14,971 | |
Stock-based compensation in connection with employee stock option plans and other | | — | | | | — | | | | 21,085 | | | | — | | | | — | | | | — | | | | 21,085 | |
Reversal of deferred stock-based compensation | | — | | | | — | | | | (1,805 | ) | | | 1,805 | | | | — | | | | — | | | | — | |
| | | | | | | | | | | | | | | | | | | | | | | | | | | |
BALANCE—December 30, 2006 | | 28,230,785 | | | $ | 28 | | | $ | 411,118 | | | $ | — | | | $ | (3 | ) | | $ | (95,454 | ) | | $ | 315,689 | |
Cumulative effect relating to adoption of FIN 48 | | — | | | | — | | | | — | | | | — | | | | — | | | | 386 | | | | 386 | |
| | | | | | | | | | | | | | | | | | | | | | | | | | | |
BALANCE—December 31, 2006 | | 28,230,785 | | | $ | 28 | | | $ | 411,118 | | | $ | — | | | $ | (3 | ) | | $ | (95,068 | ) | | $ | 316,075 | |
| | | | | | | | | | | | | | | | | | | | | | | | | | | |
Net loss | | — | | | | — | | | | — | | | | — | | | | — | | | | (69,557 | ) | | | (69,557 | ) |
Unrealized gain on short-term investments | | — | | | | — | | | | — | | | | — | | | | 16 | | | | — | | | | 16 | |
Cumulative translation adjustment | | — | | | | — | | | | — | | | | — | | | | (24 | ) | | | — | | | | (24 | ) |
| | | | | | | | | | | | | | | | | | | | | | | | | | | |
Total comprehensive loss | | | | | | | | | | | | | | | | | | | | | | | | | | (69,565 | ) |
| | | | | | | | | | | | | | | | | | | | | | | | | | | |
Issuance of common stock under employee stock option and employee stock purchase plan, net of taxes | | 1,062,012 | | | | 1 | | | | 3,907 | | | | | | | | | | | | | | | | 3,908 | |
Restricted common stock grants | | 232,764 | | | | — | | | | — | | | | — | | | | — | | | | — | | | | — | |
Income tax benefit relating to stock option exercises | | — | | | | — | | | | 1,839 | | | | — | | | | — | | | | — | | | | 1,839 | |
Stock-based compensation in connection with employee stock option plans and other | | — | | | | — | | | | 23,861 | | | | — | | | | — | | | | — | | | | 23,861 | |
| | | | | | | | | | | | | | | | | | | | | | | | | | | |
BALANCE—December 29, 2007 | | 29,525,561 | | | $ | 29 | | | $ | 440,725 | | | $ | — | | | $ | (11 | ) | | $ | (164,625 | ) | | $ | 276,118 | |
| | | | | | | | | | | | | | | | | | | | | | | | | | | |
See notes to consolidated financial statements.
55
RACKABLE SYSTEMS, INC. AND SUBSIDIARIES
CONSOLIDATED STATEMENTS OF CASH FLOWS
(In thousands)
| | | | | | | | | | | | |
| | | Year ended | |
| | | December 29,
2007 | | | December 30,
2006 | | | December 31,
2005 | |
CASH FLOWS FROM OPERATING ACTIVITIES: | | | | | | | | | | | | |
Net income (loss) | | $ | (69,557 | ) | | $ | 11,472 | | | $ | 8,512 | |
Adjustments to reconcile net income (loss) to net cash provided by (used in) operating activities: | | | | | | | | | | | | |
Depreciation and amortization | | | 7,473 | | | | 3,566 | | | | 3,926 | |
Loss on disposal of property and equipment | | | 73 | | | | — | | | | 2 | |
Impairment of fixed assets | | | 107 | | | | — | | | | — | |
Accrued interest income | | | — | | | | — | | | | (206 | ) |
Impairment of goodwill | | | 23,872 | | | | — | | | | — | |
Provision for doubtful accounts receivable | | | 105 | | | | 311 | | | | 61 | |
Deferred income taxes | | | 14,495 | | | | 5,351 | | | | (5,293 | ) |
Excess tax benefit of stock options exercised | | | (1,639 | ) | | | (14,971 | ) | | | — | |
Accretion for preferred stock dividends recorded as interest expense | | | — | | | | — | | | | 1,087 | |
Write-off of acquired in-process research and development | | | — | | | | 2,840 | | | | — | |
Stock-based compensation expense | | | 23,235 | | | | 20,755 | | | | 553 | |
Changes in fair value of embedded derivatives in preferred stock | | | — | | | | — | | | | 4,192 | |
Changes in operating assets and liabilities: | | | | | | | | | | | | |
Accounts receivable | | | 54,008 | | | | (53,833 | ) | | | (40,417 | ) |
Inventories | | | 15,042 | | | | (27,197 | ) | | | (27,026 | ) |
Prepaids and other assets | | | (5,919 | ) | | | (8,889 | ) | | | (2,949 | ) |
Accounts payable | | | (13,853 | ) | | | 32,055 | | | | 17,372 | |
Accrued expenses and deferred rent | | | (2,563 | ) | | | 11,199 | | | | 3,061 | |
Income taxes payable | | | 392 | | | | (2,932 | ) | | | 4,839 | |
Deferred cost of sales | | | 1,910 | | | | 6,200 | | | | (8,665 | ) |
Deferred revenue | | | (1,106 | ) | | | (3,511 | ) | | | 12,567 | |
| �� | | | | | | | | | | | |
Net cash provided by (used in) operating activities | | | 46,075 | | | | (17,584 | ) | | | (28,384 | ) |
| | | | | | | | | | | | |
CASH FLOWS FROM INVESTING ACTIVITIES: | | | | | | | | | | | | |
Purchases of marketable securities | | | (584,009 | ) | | | (547,017 | ) | | | (55,765 | ) |
Proceeds from sales and maturities of marketable securities | | | 565,836 | | | | 442,089 | | | | 30,907 | |
Purchases of property and equipment | | | (4,500 | ) | | | (3,938 | ) | | | (1,801 | ) |
Terrascale acquisition, net of cash acquired | | | (350 | ) | | | (31,886 | ) | | | — | |
Expenditures for intangibles | | | (9,122 | ) | | | (152 | ) | | | (158 | ) |
| | | | | | | | | | | | |
Net cash used in investing activities | | | (32,145 | ) | | | (140,904 | ) | | | (26,817 | ) |
| | | | | | | | | | | | |
56
RACKABLE SYSTEMS, INC. AND SUBSIDIARIES
CONDENSED CONSOLIDATED STATEMENTS OF CASH FLOWS—(Continued)
(In thousands)
| | | | | | | | | | | | |
| | | Year ended | |
| | | December 29,
2007 | | | December 30,
2006 | | | December 31,
2005 | |
CASH FLOWS FROM FINANCING ACTIVITIES: | | | | | | | | | | | | |
Repayments under line of credit, net | | | — | | | | — | | | | (14,061 | ) |
Repurchase of common stock from founders | | | — | | | | — | | | | (6,000 | ) |
Payment of notes payable to related parties | | | — | | | | — | | | | (3,000 | ) |
Proceeds from issuance of common stock upon initial public offering—net of issuance costs | | | — | | | | — | | | | 67,780 | |
Proceeds from issuance of common stock upon follow on offering—net of issuance costs | | | — | | | | 138,452 | | | | 46,835 | |
Excess tax benefit of stock options exercised | | | 1,639 | | | | 14,971 | | | | — | |
Repurchase of restricted stock | | | (617 | ) | | | — | | | | — | |
Proceeds from issuance of common stock upon exercise of stock options | | | 2,682 | | | | 4,906 | | | | 373 | |
Proceeds from issuance of common stock upon ESPP purchase | | | 1,843 | | | | 1,541 | | | | — | |
Redemption of mandatorily redeemable preferred stock | | | — | | | | — | | | | (24,738 | ) |
| | | | | | | | | | | | |
Net cash provided by financing activities | | | 5,547 | | | | 159,870 | | | | 67,189 | |
| | | | | | | | | | | | |
Effect of exchange rate changes on cash and cash equivalents | | | (26 | ) | | | (35 | ) | | | — | |
NET INCREASE IN CASH AND CASH EQUIVALENTS | | | 19,451 | | | | 1,347 | | | | 11,988 | |
CASH AND CASH EQUIVALENTS—Beginning of period | | | 30,446 | | | | 29,099 | | | | 17,111 | |
| | | | | | | | | | | | |
CASH AND CASH EQUIVALENTS—End of period | | $ | 49,897 | | | $ | 30,446 | | | $ | 29,099 | |
| | | | | | | | | | | | |
NON CASH INVESTING AND FINANCING ACTIVITIES: | | | | | | | | | | | | |
Reclassification of embedded derivatives in preferred stock to additional paid-in capital | | $ | — | | | $ | — | | | $ | 107,831 | |
| | | | | | | | | | | | |
Issuance of Common Stock as payment for accrued liabilities | | | — | | | | — | | | | 50 | |
| | | | | | | | | | | | |
Income tax benefit related to stock option exercises | | | — | | | | — | | | | 3,028 | |
| | | | | | | | | | | | |
Deferred compensation related to stock option grants, net of cancellations | | | — | | | | — | | | | 224 | |
| | | | | | | | | | | | |
Accrued stock issuance cost | | | — | | | | — | | | | 602 | |
| | | | | | | | | | | | |
Reclassification of stock issuance costs from other assets to stockholders’ equity | | | — | | | | — | | | | 341 | |
| | | | | | | | | | | | |
Unrealized gain on investments | | | 16 | | | | 32 | | | | 1 | |
| | | | | | | | | | | | |
Issuance of common stock in connection with conversion of mandatorily redeemable preferred stock | | | — | | | | — | | | | 9 | |
| | | | | | | | | | | | |
SUPPLEMENTAL DISCLOSURE OF OTHER CASH FLOW INFORMATION: | | | | | | | | | | | | |
Cash paid (refund) for income taxes | | | (68 | ) | | | 6,035 | | | | 10,840 | |
| | | | | | | | | | | | |
Cash paid for interest | | $ | — | | | $ | — | | | $ | 450 | |
| | | | | | | | | | | | |
See notes to consolidated financial statements.
57
RACKABLE SYSTEMS, INC. AND SUBSIDIARIES
NOTES TO CONSOLIDATED FINANCIAL STATEMENTS
1. BUSINESS
Rackable Systems, Inc. (“Rackable Systems” or the “Company”) was incorporated in the state of Delaware in December 2002 in connection with the acquisition of substantially all the assets and liabilities of Rackable Systems’ predecessor company referred to herein as Old Rackable. The Company has subsidiaries in Canada, Hong Kong and Ireland. The Company recently moved its headquarters from Milpitas, California to Fremont, California. The principal business of the Company is the design, manufacture and implementation of highly scalable compute servers and high-capacity storage systems, which are sold to customers such as large internet businesses, and companies in vertical markets such as semiconductor design, enterprise software, federal government, entertainment, financial services, oil and gas, biotechnology and pharmaceuticals.
2. SUMMARY OF SIGNIFICANT ACCOUNTING POLICIES
Fiscal Year. The Company has a 52-week fiscal year ending on the Saturday nearest to December 31, with 13 week quarters ending on the last Saturday of the period. Fiscal 2007 ended on December 29, 2007, fiscal 2006 ended on December 30, 2006 and fiscal 2005 ended on December 31, 2005.
Basis of consolidation. The consolidated financial statements include the accounts of the Company and its wholly owned subsidiaries. All material inter-company balances and transactions have been eliminated.
Foreign Currency Transactions. The Company uses the U.S. dollar as its functional currency for its Ireland and Hong Kong subsidiaries and therefore re-measurement of its financial statements is not required. Currency transaction gains (losses) are recognized in current operations resulting from translating its financial statements at the reporting date. The Company uses the Canadian dollar as its functional currency for its Canada subsidiary. Assets and liabilities denominated in non-U.S. dollars are re-measured into U.S. dollars at the rates of exchange in effect at the balance sheet dates. Revenue and expenses are translated at average exchange rates in effect during each period. Translation adjustments are included in stockholders’ equity in the consolidated balance sheet as a component of accumulated other comprehensive income (loss).
Use of estimates. The preparation of financial statements in accordance with accounting principles generally accepted in the U.S. requires management to make estimates and assumptions that affect the amounts reported in the Company’s combined financial statements and accompanying notes. Management bases its estimates on historical experience and various other assumptions believed to be reasonable. Although these estimates are based on management’s best knowledge of current events and actions that may impact us in the future, actual results may be different from the estimates. The Company’s critical accounting policies are those that affect the Company’s financial statements materially and involve difficult, subjective or complex judgments by management. Those policies are revenue recognition, asset impairment charges, inventory valuation, warranty, share-based compensation, valuation of goodwill and intangible assets and accounting for income taxes.
Cash and cash equivalents. The Company classifies highly liquid investments as cash equivalents if they do not have a maturity date as of the date of purchase. Cash and cash equivalents consist of cash deposited in checking and money market accounts.
Marketable Securities. The Company accounts for short-term marketable securities in accordance with the Financial Accounting Standards Board (“FASB”), Statement of Financial Accounting Standard (“SFAS”) No. 115, “Accounting for Certain Investments in Debt and Equity Securities”. The Company classifies marketable securities as available-for-sale at the time of purchase and re-evaluates such designation as of each consolidated balance sheet date. Our marketable securities include commercial paper, corporate bond, government securities and auction rate securities. Auction rate securities are securities that are structured with
58
RACKABLE SYSTEMS, INC. AND SUBSIDIARIES
NOTES TO CONSOLIDATED FINANCIAL STATEMENTS—(Continued)
short-term interest rate reset dates of generally less than ninety days but with contractual maturities that can be well in excess of ten years.
Our marketable securities are reported at fair value with the related unrealized gains and losses included in accumulated other comprehensive income (loss), a component of shareholders’ equity, net of tax. Realized gains or losses on the sale of marketable securities are determined using the specific-identification method and were not material for fiscal years 2007, 2006 and 2005. We evaluate our investments periodically for possible other-than-temporary impairment by reviewing factors such as the length of time and extent to which fair value has been below cost basis, the financial condition of the issuer and our ability and intent to hold the investment for a period of time which may be sufficient for anticipated recovery of market value. We record an impairment charge to the extent that the carrying value of our available for sale securities exceeds the estimated fair market value of the securities and the decline in value is determined to be other-than-temporary.
Accounts receivable. Accounts receivable are recorded at the invoiced amount and do not bear interest. Our accounts receivable have been reduced by an allowance for doubtful accounts, which is our best estimate of the amount of probable credit losses in our existing accounts receivable. We determine the allowance based on customer specific experience and the aging of our receivables, among other factors.
Inventory. Inventories, consisting primarily of server chassis, hard drives, microprocessors, memory chips, cooling fans and other equipment used in the manufacture of networking servers, are stated at the lower of first-in, first-out cost or market. Cost components include materials, labor and manufacturing overhead costs.
We assess the valuation of our inventory, including demonstration inventory, on a quarterly basis based upon estimates about future demand and actual usage. To the extent that we determine that we are holding excess or obsolete inventory, we write down the value of our inventory to its net realizable value. Such write-downs are reflected in cost of products and can be material in amount. Our inventory assessment involves difficult estimates of future events and, as a result, additional write-downs may be required. If actual market conditions are more favorable than anticipated, inventory previously written down may be sold to customers, resulting in lower cost of products and higher income from operations than expected in that period. Excess and obsolete inventory resulting from shifts in demand or changes in market conditions for raw materials and components can result in significant volatility in our costs of products.
In our inventory valuation analysis, we also include inventory that we could be obligated to purchase from our suppliers based on our production forecasts. To the extent that our committed inventory purchases exceed our forecasted productions needs, we write down the value of those inventories by taking a charge to our cost of products and increasing our supplier liability.
Property and Equipment. Property and equipment are stated at cost and are depreciated on a straight-line basis over their estimated useful lives (generally two to seven years). Leasehold improvements and assets acquired under capital leases are amortized using the straight-line method over the shorter of the estimated useful lives of the respective assets or the lease term. When assets are retired or disposed of, the assets and related accumulated depreciation and amortization are removed from our general ledger and the resulting gain or loss is reflected in the combined statement of operations.
Maintenance and repairs are charged to expense as incurred and improvements and betterments that enhance the life of the asset are capitalized. When assets are retired or otherwise disposed of, the cost and accumulated depreciation and amortization are removed.
59
RACKABLE SYSTEMS, INC. AND SUBSIDIARIES
NOTES TO CONSOLIDATED FINANCIAL STATEMENTS—(Continued)
Goodwill and intangible assets. In accordance with SFAS No. 142Goodwill and Other Intangible Assets,(“SFAS No. 142”). Goodwill is not amortized and is tested for impairment annually or whenever events or changes in circumstances indicate that the carrying value may not be recoverable in accordance with the Company’s policy. The Company has chosen the end of its fiscal month of December as the date of its annual impairment test. In accordance with SFAS No. 142, goodwill is evaluated for impairment at the reporting unit level. The Company considers itself a single reporting unit. The Chief Executive Officer (“CEO”), who is the Company’s chief operating decision maker, monitors the sales of various products, operations are managed and financial performance evaluated based upon the sales and production of multiple products employing common manufacturing and research and development resources, sales and administrative support, and facilities. The Company believes that any allocation of such shared expenses to various products would be impractical and arbitrary and it currently does not make such allocations internally.
Intangible assets are carried at cost less accumulated amortization. Amortization is computed using the straight-line method over the economic lives of the respective assets, generally two to seven years.
The process of evaluating the potential impairment of goodwill and other intangibles is highly subjective and requires significant judgment. We estimate expected future cash flows then compare the carrying value including goodwill and other intangibles to the discounted future cash flows. If the total of future cash flows is less than the carrying amount of the assets, we recognize an impairment loss based on the excess of the carrying amount over the fair value of the assets. Estimates of the future cash flows associated with the assets are critical to these assessments. Changes in these estimates based on changed economic conditions or business strategies could result in material impairment charges in future periods.
Impairment of Long-Lived Assets. The Company accounts for its long-lived assets in accordance with SFAS No. 144,Accounting for the Impairment or Disposal of Long-Lived Assets (“SFAS No. 144”). The Company evaluates its long-lived assets for indicators of possible impairment whenever events or changes in business circumstances indicate that the carrying amount of the assets may not be fully recoverable. An impairment loss would be recognized when estimated undiscounted future cash flows expected to result from the use of an asset and its eventual disposition are less than its carrying amount. Impairment, if any, is measured using discounted cash flows.
Revenue Recognition. The Company accounts for its revenues under the provisions of Staff Accounting Bulletin (“SAB”) No. 104,Revenue Recognition in Financial Statements(“SAB No. 104”), FASB Technical Bulletin No. 90-1,Accounting for Separately Priced Extended Warranty and Product Maintenance Contracts (“FTB 90-1”) and Statement of Position No. 97-2,Software Revenue Recognition(“SOP 97-2”).
Under the provisions of SAB No. 104, the Company recognizes revenues from sales of products, when persuasive evidence of an arrangement exists, shipment has occurred and title has transferred, the sales price is fixed and determinable, collection of the resulting receivable is reasonably assured, and all significant obligations have been met. Generally, this occurs at the time of shipment when risk of loss and title has passed to the customer.
Service revenue includes hardware maintenance and installation. Pursuant to SAB No. 104, the Company recognizes revenue from the sale of its products prior to completion of these services, as the Company’s product sales are not dependent on these services to be functional. Under FTB 90-1, revenue from hardware maintenance contracts, which are sold and invoiced separately, is recognized ratably over the contract term, generally one to three years. Installation services are typically requested by the Company’s new customers who have limited history with the products. Installation and related services are usually performed within one day after product delivery.
60
RACKABLE SYSTEMS, INC. AND SUBSIDIARIES
NOTES TO CONSOLIDATED FINANCIAL STATEMENTS—(Continued)
Where software is integrated with hardware and sold as a hardware appliance the Company provides unspecified software updates and enhancements to the software through service contracts. As a result, the Company accounts for revenue in accordance with SOP 97-2 for transactions involving the sale of software. Revenues earned on software arrangements involving multiple-elements are allocated to each element based on the Vendor Specific Objective Evidence (“VSOE”) of fair value. The VSOE of fair value of the undelivered elements (maintenance and support services) is generally determined based on the price charged for the undelivered element when sold separately or renewed. If VSOE cannot be obtained to determine fair value of the undelivered elements, revenue from the entire arrangement would be deferred and recognized as these elements are delivered.
On occasion, when a customer informs the Company that a product is defective, the Company will ship a replacement product at the customer’s request prior to the customer returning the defective product for repair. This enables the customer to use the replacement product until the defective product is repaired and returned to the customer. Generally, the Company does not charge for this service unless the customer fails to return the defective product, in which case the customer is billed for the replacement product and revenue is recognized at that time.
Estimated sales returns and warranty costs, based on historical experience, changes in customer demand, and other factors, are recorded at the time product revenue is recognized in accordance with SFAS No. 48,Revenue Recognition When Right of Return Exists and SFAS No. 5,Accounting for Contingencies, respectively.
Shipping and handling costs. Our shipping and handling costs charged to customers are included in net revenue and the associated expense is recorded in cost of revenue in the consolidated statements of operations for all years presented.
Deferred revenue. Deferred revenue is primarily comprised of extended warranty, revenue deferred for installations yet to be completed, and advanced billing and customer deposits for service, support and maintenance agreements. As well as product revenue for which performance obligations or customer acceptance is required. Deferred revenue is recorded when products or services provided are invoiced prior to the Company’s completion of the related performance obligations or customer acceptance. Deferred revenue is not recognized as revenue until the completion of those performance and acceptance criteria. Extended warranty and service support and VSOE deferrals are recognized ratably over the prerequisite service period.
Product Warranty. The Company’s warranty period for its products is generally one to three years. The Company accrues for estimated warranty costs concurrent with the recognition of revenue. The initial warranty accrual is based upon the Company’s historical experience and is included in accrued expenses and cost of revenue.
Share-based compensation.Effective January 1, 2006, the Company began accounting for its employee stock purchase and stock incentive plans under the provisions of SFAS No. 123 (revised 2004),Share-Based Compensation, (“SFAS No. 123R”), using the modified-prospective-transition method. SFAS No. 123R requires the recognition of the fair value of share-based compensation in net income. For grants subsequent to the adoption of SFAS No. 123R, the fair values of the Company’s unvested stock units are calculated based on the fair value of the Company’s common stock at the dates of grant. The fair values of the Company’s stock options and employee stock purchase plan awards are estimated using the Black-Scholes option-pricing model. Share-based compensation expense for awards granted after January 1, 2006, was recorded on a straight-line vesting basis in accordance with FASB Interpretation No. 28,Accounting for Stock Appreciation Rights and Other Variable Stock Option or Award Plans, (“FIN 28”) using the multiple-option approach, reduced for estimated
61
RACKABLE SYSTEMS, INC. AND SUBSIDIARIES
NOTES TO CONSOLIDATED FINANCIAL STATEMENTS—(Continued)
forfeitures. Prior to January 1, 2006, the Company accounted for share-based employee compensation arrangements in accordance with APB No. 25 (“APB No. 25”), and related interpretations, as permitted by FASB Statement No. 123 (“SFAS No. 123”.) Under APB No. 25, compensation cost was recognized based on the difference, if any, between the then fair value of the Company’s common stock on the date of grant and the amount an employee must pay to acquire the stock. Compensation cost was recorded in accordance with FIN 28, using the multiple-option approach. Under SFAS No. 123R, compensation expense for those options prior to the adoption of SFAS No. 123R continue to be expensed on the same basis as they were prior to its adoption, reduced for estimated forfeitures.
Research and development. Costs related to research, design and development of our products are charged to research and development expense as they are incurred.
Accounting for income taxes. The Company recorded a tax provision for the anticipated tax consequences of the reported results of operations. In accordance with SFAS No. 109,“Accounting for Income Taxes” (“SFAS No. 109”), the provision for income taxes is computed using the asset and liability method, under which deferred tax assets and liabilities are recognized for the expected future tax consequences of temporary differences between the financial reporting and tax bases of assets and liabilities, and for operating losses and tax credit carry-forwards. Deferred tax assets and liabilities are measured using the currently enacted tax rates that apply to taxable income in effect for the years in which those tax assets are expected to be realized or settled.
The Company is required to assess the realization of its net deferred tax assets and the need for a valuation allowance. This assessment requires that management make judgments and assess the weight of positive and negative evidence in accordance with the requirements of SFAS No. 109 for purposes of concluding whether it is more likely than not that the deferred tax assets will be realized. In 2007, the Company concluded that it was more likely than not that the U.S. deferred tax assets in excess of recoverable income taxes and certain deferred tax liabilities would not be realized. Accordingly, a valuation allowance was recorded for the excess deferred tax assets.
The effective tax rate varies based on a variety of factors, including overall profitability, the geographical mix of income before taxes and the related tax rates in the jurisdictions where we operate, restructuring and other one-time charges, as well as discrete events, such as settlements of future audits. The Company is subject to audits and examinations of tax returns by tax authorities in various jurisdictions, including the Internal Revenue Service. The Company regularly assesses the likelihood of adverse outcomes resulting from these examinations to determine the adequacy of our provision for income taxes.
In June 2006, the FASB issued interpretation No. 48,Accounting for Uncertainty in Income Taxes, an interpretation of FASB Statement No. 109(“FIN 48”). The Interpretation prescribes a recognition threshold and measurement attribute for the financial statement recognition and measurement of a tax position taken or expected to be taken in a tax return. The Interpretation also provides guidance on de-recognition, classification, interest and penalties, accounting for interim periods, disclosure and transition. FIN 48 is effective for fiscal years beginning after December 15, 2006 and was adopted by the Company in the first quarter of fiscal 2007. The cumulative effects of applying FIN 48 was recorded as an adjustment to retained earnings as of the beginning of the period of adoption. The adoption of FIN 48 did not have a material impact on the Company’s consolidated results of operations, balance sheet and cash flows.
Recently Issued Accounting Standards. In September 2006, the SEC issued SAB No. 108,Considering the Effects of Prior Year Misstatements when Quantifying Misstatements in Current Year Financial Statements(“SAB No. 108”). SAB No. 108 provides guidance on the consideration of the effects of prior year misstatements
62
RACKABLE SYSTEMS, INC. AND SUBSIDIARIES
NOTES TO CONSOLIDATED FINANCIAL STATEMENTS—(Continued)
in quantifying current year misstatements for the purpose of a materiality assessment. SAB No. 108 establishes an approach that requires quantification of financial statement errors based on the effects of each of the company’s balance sheet, statement of operations and the related financial statement disclosures. Early application of the guidance in SAB No. 108 is encouraged in the interim periods of fiscal year ending after November 15, 2006. The Company adopted SAB No. 108 as of the year ended December 30, 2006. The adoption did not have a material impact on its consolidated results of operations and financial condition.
In September 2006, the FASB issued SFAS No. 157,Fair Value Measurements(“SFAS No. 157”),which defines fair value, establishes a framework for measuring fair value in generally accepted accounting principles, and expands disclosures about fair value measurements. SFAS No. 157 applies whenever other standards require (or permit) assets or liabilities to be measured at fair value, and does not expand the use of fair value in any new circumstances. SFAS No. 157 is effective for financial statements issued for fiscal years beginning after November 15, 2007. The Company does not expect the adoption of SFAS No. 157 to have a material impact on the Company’s consolidated results of operations, financial position and cash flows.
In February 2007, the FASB issued SFAS 159, The Fair Value Option for Financial Assets and Financial Liabilities—Including an Amendment of FASB Statement No. 115,which is effective for fiscal years beginning after November 15, 2007. This statement permits an entity to choose to measure many financial instruments and certain other items at fair value at specified election dates. Subsequent unrealized gains and losses on items for which the fair value option has been elected will be reported in earnings. The Company does not expect the adoption of SFAS No. 159 to have a material impact on the Company’s consolidated results of operations, financial position and cash flows.
63
RACKABLE SYSTEMS, INC. AND SUBSIDIARIES
NOTES TO CONSOLIDATED FINANCIAL STATEMENTS—(Continued)
3. BALANCE SHEET
Short-Term Investments
At December 29, 2007 and December 30, 2006, all of the Company’s marketable debt securities were classified as available-for-sale and were carried at fair market value. The unrealized gains (losses) on available-for-sale securities are recorded in accumulated other comprehensive income (loss). Short-term investments consisted of the following at December 29, 2007 and December 30, 2006, respectively (in thousands):
| | | | | | | | | | | | | |
| | | Purchase/
Amortized Cost | | Gross
Unrealized
Gain | | Gross
Unrealized
Loss | | | Aggregate Fair
Value |
As of December 29, 2007 | | | | | | | | | | | | | |
U.S. notes and bonds | | $ | 10,206 | | $ | 25 | | $ | — | | | $ | 10,231 |
Federal agency notes | | | 50,437 | | | 37 | | | — | | | | 50,474 |
Commercial paper | | | 22,969 | | | — | | | (13 | ) | | | 22,956 |
Auction rate securities | | | 64,554 | | | — | | | — | | | | 64,554 |
| | | | | | | | | | | | | |
Total | | $ | 148,166 | | $ | 62 | | $ | (13 | ) | | $ | 148,215 |
| | | | | | | | | | | | | |
As of December 30, 2006 | | | | | | | | | | | | | |
Federal agency notes | | $ | 38,795 | | $ | 16 | | $ | — | | | $ | 38,811 |
Commercial paper | | | 64,413 | | | 17 | | | — | | | | 64,430 |
Auction rate securities | | $ | 26,785 | | $ | — | | $ | (1 | ) | | $ | 26,784 |
| | | | | | | | | | | | | |
| | $ | 129,993 | | $ | 33 | | $ | (1 | ) | | $ | 130,025 |
| | | | | | | | | | | | | |
See Note 12. Subsequent Events for information related to the Company’s investment in auction rate securities.
Accounts Receivable, net
Accounts receivable from Microsoft and Facebook accounted for 49% and 18% of total accounts receivable at December 29, 2007, respectively. Accounts receivable from Microsoft and Yahoo accounted for 42% and 21% of total accounts receivable at December 30, 2006, respectively.
Revenue from customers representing 10% or more of total revenue was as follows:
| | | | | | | | | |
| | | Year ended | |
| | | December 29,
2007 | | | December 30,
2006 | | | December 31,
2005 | |
Microsoft | | 36 | % | | 34 | % | | 14 | % |
Amazon | | 16 | % | | * | | | 24 | % |
Yahoo | | 12 | % | | 26 | % | | 22 | % |
| * | less than 10% of total revenue |
64
RACKABLE SYSTEMS, INC. AND SUBSIDIARIES
NOTES TO CONSOLIDATED FINANCIAL STATEMENTS—(Continued)
A summary of the activity in the reserves relating to doubtful accounts receivable and sales returns is as follows (in thousands):
| | | | | | | | | | | | | |
| | | Beginning
Balance | | Additions | | Reductions | | | Ending
Balance |
Accounts Receivable Reserve | | | | | | | | | | | | | |
Year ended December 31, 2005 | | $ | 152 | | $ | 61 | | $ | (196 | ) | | $ | 17 |
Year ended December 30, 2006 | | $ | 17 | | $ | 355 | | $ | (44 | ) | | $ | 328 |
Year ended December 29, 2007 | | $ | 328 | | $ | 299 | | $ | (193 | ) | | $ | 434 |
| | | | |
Sales Return Reserve | | | | | | | | | | | | | |
Year ended December 31, 2005 | | $ | 58 | | $ | 771 | | $ | (431 | ) | | $ | 398 |
Year ended December 30, 2006 | | $ | 398 | | $ | 1,040 | | $ | (1,301 | ) | | $ | 137 |
Year ended December 29, 2007 | | $ | 137 | | $ | 1,284 | | $ | (1,091 | ) | | $ | 330 |
Inventories
Inventories consist of the following (in thousands):
| | | | | | |
| | | December 29,
2007 | | December 30,
2006 |
Finished goods | | $ | 2,424 | | $ | 4,129 |
Evaluation units, net | | | 3,396 | | | 1,758 |
Work in process | | | 16,385 | | | 10,894 |
Raw materials | | | 30,933 | | | 51,356 |
| | | | | | |
Total inventories | | $ | 53,138 | | $ | 68,137 |
| | | | | | |
Property and Equipment, net
Property and equipment consist of the following (in thousands):
| | | | | | | | |
| | | December 29,
2007 | | | December 30,
2006 | |
Leasehold improvements | | $ | 1,484 | | | $ | 643 | |
Manufacturing equipment | | | 3,303 | | | | 1,711 | |
Furniture and fixtures | | | 1,127 | | | | 376 | |
Computer equipment | | | 6,858 | | | | 4,229 | |
Construction in progress | | | 362 | | | | 711 | |
Vehicles | | | 118 | | | | 118 | |
| | | | | | | | |
| | | 13,252 | | | | 7,788 | |
Less accumulated depreciation and amortization | | | (4,967 | ) | | | (2,416 | ) |
| | | | | | | | |
Property and equipment, net | | $ | 8,285 | | | $ | 5,372 | |
| | | | | | | | |
Depreciation and amortization of property and equipment for the years ended December 29, 2007, December 30, 2006 and December 31, 2005 was $3.0 million, $1.3 million and $0.6 million, respectively.
65
RACKABLE SYSTEMS, INC. AND SUBSIDIARIES
NOTES TO CONSOLIDATED FINANCIAL STATEMENTS—(Continued)
Goodwill
Goodwill consists of the excess cost related to the acquisition of Old Rackable in December 2002, and Terrascale in September 2006, as follows (in thousands):
| | | | |
As of December 30, 2006 | | $ | 22,871 | |
Additions | | | 1,001 | |
Impairment | | | (23,872 | ) |
| | | | |
As of December 29, 2007 | | $ | — | |
| | | | |
In the year ended December 29, 2007, the Company recorded an increase to goodwill related to the Terrascale acquisition totaling $1.0 million. In the fourth quarter of 2007, pursuant to the Company’s accounting policy, the Company performed the annual goodwill impairment analysis. The goodwill impairment test is a two-step process. The first step of the impairment analysis compares our fair value to our net book value. In determining fair value, the accounting guidance allows for the use of several valuation methodologies, although it states quoted market prices are the best evidence of fair value. Due to the decline of our market capitalization in December 2007, primarily as a result of tax attributes based on quoted market prices, the fair value was less than the net book value. If this occurs, the second step of the goodwill impairment analysis is conducted. The second step of the analysis compares the implied fair value of our goodwill to its carrying amount. If the carrying amount of goodwill exceeds its implied fair value, we recognize an impairment loss equal to that excess amount. The determination of the fair value of the goodwill is determined by valuing all of our other tangible and intangible assets and using a residual approach to determine the fair value of goodwill. As a result of this analysis, the Company concluded that the carrying amounts of goodwill exceeded their implied fair values and recorded an impairment loss of approximately $23.9 million.
Intangible Assets, net
Intangible assets are recorded at cost, less accumulated amortization. The following tables present details of the Company’s intangible assets as of December 29, 2007, (dollars in thousands):
| | | | | | | | | | | | | | |
| | | Useful Life
(Years) | | Gross | | Additions | | Accumulated
Amortization | | Net |
Rackable Systems | | | | | | | | | | | | | | |
Patents | | 5.00 | | $ | 4,891 | | $ | — | | $ | 4,626 | | $ | 265 |
Other intangibles | | 3.00 | | | 41 | | | — | | | 33 | | | 8 |
| | | | | | | | | | | | | | |
| | | | | 4,932 | | | — | | | 4,659 | | | 273 |
| | | | | | | | | | | | | | |
Terrascale Acquisition | | | | | | | | | | | | | | |
Existing technology | | 7.00 | | | 8,256 | | | — | | | 1,540 | | | 6,716 |
DPE | | 7.00 | | | | | | 13,097 | | | 1,404 | | | 11,693 |
Customer relationships | | 4.00 | | | 633 | | | — | | | 207 | | | 426 |
Maintenance contracts | | 6.00 | | | 35 | | | — | | | 8 | | | 27 |
Non-compete agreements | | 2.00 | | | 319 | | | — | | | 209 | | | 110 |
| | | | | | | | | | | | | | |
| | | | | 9,243 | | | 13,097 | | | 3,368 | | | 18,972 |
| | | | | | | | | | | | | | |
Tradename | | | | | 3,487 | | | — | | | — | | | 3,487 |
| | | | | | | | | | | | | | |
Total | | | | $ | 17,662 | | $ | 13,097 | | $ | 8,027 | | $ | 22,732 |
| | | | | | | | | | | | | | |
66
RACKABLE SYSTEMS, INC. AND SUBSIDIARIES
NOTES TO CONSOLIDATED FINANCIAL STATEMENTS—(Continued)
In December 2002, as a part of the acquisition of Old Rackable, the Company also recorded an intangible asset allocated to tradename in the amount of $3.5 million. This intangible asset is not amortizable.
Long-lived intangible assets with determinable economic life are tested for recoverability whenever events or circumstances indicate that their carrying amounts may not be recoverable. We determined the recoverability of long-lived intangible assets was not impaired at December 29, 2007, December 30, 2006 and December 31, 2005.
In the year ended December 29, 2007 and December 30, 2006, amortization of intangible assets was $4.4 million and $2.2 million, respectively. Amortization is computed using the straight-line method over the estimated useful life of the intangible asset. The Company expects that the annual amortization of acquired intangible assets will be as follows (in thousands):
| | | |
| | | Total |
2008 | | $ | 3,457 |
2009 | | | 3,339 |
2010 | | | 3,183 |
2011 | | | 3,056 |
2012 and beyond | | | 6,211 |
| | | |
Total amortization | | $ | 19,245 |
| | | |
Accrued Expenses
Accrued expenses consist of the following (in thousands):
| | | | | | |
| | | December 29,
2007 | | December 30,
2006 |
Accrued commission | | $ | 2,137 | | $ | 2,384 |
Accrued payroll and related expenses | | | 5,754 | | | 3,967 |
Accrued warranty | | | 2,038 | | | 868 |
Accrued sales and use tax | | | 3,828 | | | 10,671 |
Other accrued expenses | | | 2,625 | | | 2,004 |
| | | | | | |
Total accrued expenses | | $ | 16,382 | | $ | 19,894 |
| | | | | | |
In December 2005, the Company identified potential state sales tax and use tax liabilities relating to prior year product sales to customers outside of California. In fiscal year 2006, the Company was notified by the State of California of their intent to conduct a routine sale and use tax audit. At December 30, 2006 the gross tax liability for these two items was estimated at $7.2 million and included in accrued sales and use tax.
During 2007, the Company made payments for sale and use tax of $11.7 million to various states and the State of California, and accrued an additional $2.6 million. The additional accrual was a result of additional information received from customers during the year relating to the tax disposition of their transactions with the Company in the various states and California.
67
RACKABLE SYSTEMS, INC. AND SUBSIDIARIES
NOTES TO CONSOLIDATED FINANCIAL STATEMENTS—(Continued)
Warranty Accrual
The changes in our warranty accrual for the year ended December 29, 2007 is as follows (in thousands):
| | | | | | | | | | | | |
| | | December 29,
2007 | | | December 30,
2006 | | | December 31,
2005 | |
Balance—beginning of year | | $ | 868 | | | $ | 726 | | | $ | 550 | |
Current year accrual | | | 3,117 | | | | 2,088 | | | | 1,198 | |
Warranty expenditures charged to accrual | | | (1,947 | ) | | | (1,946 | ) | | | (1,022 | ) |
| | | | | | | | | | | | |
Balance—end of year | | $ | 2,038 | | | $ | 868 | | | $ | 726 | |
| | | | | | | | | | | | |
Accumulated Other Comprehensive Loss
Comprehensive loss consists of the following (in thousands):
| | | | |
| | | Accumulated Other
Comprehensive Loss | |
Balance as of December 31, 2005 | | $ | 1 | |
Change in unrealized loss on investments | | | 31 | |
Change in cumulative translation adjustment | | | (35 | ) |
| | | | |
Balance as of December 30, 2006 | | | (3 | ) |
Change in unrealized loss on investments | | | 16 | |
Change in cumulative translation adjustment | | | (24 | ) |
| | | | |
Balance as of December 29, 2007 | | $ | (11 | ) |
| | | | |
68
RACKABLE SYSTEMS, INC. AND SUBSIDIARIES
NOTES TO CONSOLIDATED FINANCIAL STATEMENTS—(Continued)
4. EARNINGS PER SHARE
In accordance with SFAS No. 128,Earnings Per Share, basic net income (loss) per common share has been computed by using the weighted average number of shares of common stock outstanding during the period, less the shares subject to repurchase. The following table sets forth the computation of basic and diluted net income (loss) per share (in thousands, except share and per share data):
| | | | | | | | | | | |
| | | Year ended |
| | | December 29,
2007 | | | December 30,
2006 | | | December 31,
2005 |
Numerators: | | | | | | | | | | | |
Net income (loss) | | $ | (69,557 | ) | | $ | 11,472 | | | $ | 8,512 |
| | | | | | | | | | | |
Denominators: | | | | | | | | | | | |
Weighted-average common shares outstanding | | | 28,785,807 | | | | 26,987,778 | | | | 9,946,791 |
Unvested common shares subject to repurchase | | | — | | | | (39,890 | ) | | | — |
| | | | | | | | | | | |
Weighted-average shares—Basic | | | 28,785,807 | | | | 26,947,888 | | | | 9,946,791 |
Dilutive effect of employee stock options | | | — | | | | 1,560,597 | | | | 2,036,324 |
Dilutive effect of employee stock purchase plan | | | — | | | | 103,958 | | | | — |
Dilutive effect of Series A convertible preferred stock (assuming conversion, using appropriate conversion ratio, to common shares) | | | — | | | | — | | | | 6,056,902 |
Dilutive effect of unvested common shares subject to repurchase | | | — | | | | 5,866 | | | | — |
| | | | | | | | | | | |
Weighted-average shares—Diluted | | | 28,785,807 | | | | 28,618,309 | | | | 18,040,017 |
Net income (loss) per common share—Basic | | $ | (2.42 | ) | | $ | 0.43 | | | $ | 0.86 |
| | | | | | | | | | | |
Net income (loss) per common share—Diluted | | $ | (2.42 | ) | | $ | 0.40 | | | $ | 0.47 |
| | | | | | | | | | | |
For the year ended December 29, 2007, December 30, 2006 and December 31, 2005 the Company had stock options outstanding which could potentially dilute basic earnings per share in the future, but the incremental shares from the assumed exercise of these stock options were excluded in the computation of diluted net loss per share, as their effect would have been anti-dilutive. The number of such outstanding stock options consisted of the following:
| | | | |
| Year ended |
December 29,
2007 | | December 30,
2006 | | December 31,
2005 |
| 2,892,480 | | 1,257,796 | | 51,058 |
| | | | | |
5. SHARE BASED COMPENSATION
Share-Based Benefit Plans
In 2005, the Company’s Board of Directors adopted and its stockholders approved the Company’s 2005 Equity Incentive Plan (the “2005 Plan”), 2005 Non-Employee Directors’ Stock Option Plan and 2005 Employee Stock Purchase Plan (the “2005 ESPP”). The aggregate number of shares of common stock authorized for grant
69
RACKABLE SYSTEMS, INC. AND SUBSIDIARIES
NOTES TO CONSOLIDATED FINANCIAL STATEMENTS—(Continued)
under each plan is 3,675,565; 104,831 and 602,591 shares, respectively. Each plan contains a provision that automatically increases the number of shares of common stock reserved for issuance on January 1 of each year. During the year ended December 29, 2007, the number of stock options authorized for issuance under each Plan was increased by 1,129,231; 38,164 and 282,307, respectively.
Rackable Systems adopted the 2006 New Recruit Equity Incentive Plan (the “2006 Plan”) in January 2006 which allows the Company to grant non-statutory stock awards for up to 1,000,000 shares of common stock. The aggregate number of shares of common stock authorized for grant under the 2006 Plan is 1,988,862. The 2006 Plan provides for the grant of the following stock awards: (i) non-statutory stock options, (ii) stock purchase awards, (iii) stock bonus awards, (iv) stock appreciation rights, (v) stock unit awards, and (vi) other stock awards. The exercise price of each non-statutory stock option shall be not less than one hundred percent (100%) of the fair market value of the common stock subject to the option on the date the option is granted. Stock awards expire ten years from the date of grant, or such shorter period specified in the option agreement. The options generally vest at a rate of 25% per year over four years from the date the option is granted. The total shares of common stock reserved for the 2006 Plan was increased by 500,000 shares in August 2006 and by another 500,000 shares in January 2007. Terrascale options were converted into options to purchase 30,419 shares of Rackable common stock at $5.86 per share and were issued from the 2006 Plan, during the September 2006 (see Note 7).
The Company issues new shares of its common stock upon exercise of stock options, issuance of restricted stock awards (“RSA”), restricted stock units (“RSU”) and issuance of shares purchased under its 2005 ESPP. RSAs differ from RSUs in that RSAs result in issuance of common stock with all rights upon grant, with the exception of the ability to sell the common stock. Among those rights, are rights to vote and to receive dividends RSAs are included in weighted common stock outstanding and as such are used in calculations of earnings per share. Common stock to be issued for grants of RSUs are not issued until the RSU vests and do not have rights of voting or to receive dividends.
In connection with the stock options granted to employees under the 2002 Plan, Rackable Systems recorded cumulative deferred share-based compensation which represents the difference between the option exercise price and the deemed fair market value of the common stock determined for financial reporting purposes on the grant date. The unamortized balance of $1.8 million at December 31, 2005 was offset against additional paid in capital in the first fiscal quarter of 2006 with the adoption of SFAS No. 123R.
Adoption of SFAS 123R
On January 1, 2006, the Company adopted the provisions of SFAS 123R requiring the Company to recognize expenses related to the fair value of the Company’s share-based compensation awards. The Company elected to use the modified prospective application method. Under this method, SFAS 123R is applied to new awards and to awards modified, repurchased, or cancelled after the effective date. Additionally, compensation cost for the portion of awards for which the requisite service has not been rendered (such as unvested options) that was outstanding as of the date of adoption shall be recognized as the remaining requisite services are rendered. The compensation cost relating to unvested awards at the date of adoption is based on the grant-date fair value of those awards as calculated for pro forma disclosures under the original SFAS 123. Additionally, under SFAS 123R, the 2005 ESPP is considered a compensatory plan, which requires the recognition of compensation cost for grants made under the ESPP. The Company recognizes compensation expense for all share-based payment awards over the requisite service period for each separately vesting portion of the award as if the awards were, in-substance, multiple awards. As required by SFAS 123R, management made an estimate of expected forfeitures and is recognizing compensation costs only for those equity awards expected to vest.
70
RACKABLE SYSTEMS, INC. AND SUBSIDIARIES
NOTES TO CONSOLIDATED FINANCIAL STATEMENTS—(Continued)
Stock Compensation Expense
Prior to adoption of SFAS 123R, the Company’s share-based employee compensation plans were accounted for under the recognition and measurement provisions of Accounting Principles Board Opinion (“APB”) No. 25,Accounting for Stock Issued to Employees (“APB 25”), and related Interpretations, as permitted by SFAS 123. The Company recognized stock-based compensation cost in its statement of operations for periods prior to January 1, 2006 for certain options granted prior to the Company’s initial public offering of its common stock in June 2005 based upon the intrinsic value, the difference between the deemed fair value of the Company’s common stock and the exercise price at the date of grant. The Company recorded share-based compensation expense associated with option grants for common stock of approximately $0.6 million for the year ended December 31, 2005.
As required by SFAS 148 prior to the adoption of FAS 123R, the pro forma effects on net income (loss) and net income (loss) per share for the year ended December 31, 2005 as if the Company had applied the fair value recognition provisions of original SFAS 123 on stock compensation awards (rather than applying the intrinsic value measurement provisions of APB 25) are as follows (amounts in thousands, except for per share amounts):
| | | | |
| | | Year Ended
December 31,
2005 | |
Net income as reported | | $ | 8,512 | |
Add employee stock-based compensation as reported | | | 553 | |
Deduct stock-based compensation determined under the fair value based method for all awards—net of tax | | | (3,394 | ) |
| | | | |
Pro forma net income as reported | | $ | 5,671 | |
| | | | |
Basic net income per share—as reported | | $ | 0.86 | |
| | | | |
Diluted net income per share—as reported | | $ | 0.47 | |
| | | | |
Basic net income per share—pro forma | | $ | 0.57 | |
| | | | |
Diluted net income per share—pro forma | | $ | 0.31 | |
| | | | |
Tender Offer
On June 11, 2007, the Company filed a tender offer on Schedule TO (“Tender Offer”) with the SEC under which holders of options with exercise prices greater than $16.00 per share could tender their options in exchange for restricted stock unit awards granted under the 2005 Equity Incentive Plan based upon the following exchange ratios:
| | |
Exercise Price Range | | Stock Options Shares per
Restricted Stock Unit |
$16.00 - $24.99 | | 2 to 1 |
$25.00 - $34.99 | | 3 to 1 |
$35.00 and above | | 3.5 to 1 |
The restricted stock unit awards are subject to vesting in equal quarterly installments through August 15, 2009 (if the grant date of the option being tendered was prior to October 1, 2006) or August 15, 2010 (if the grant date of the option being tendered was after October 1, 2006). The tender offer provided that the option holder could and must submit their election to participate in the tender offer no later than July 10, 2007, and could
71
RACKABLE SYSTEMS, INC. AND SUBSIDIARIES
NOTES TO CONSOLIDATED FINANCIAL STATEMENTS—(Continued)
amend their election up to that date. Furthermore, this tender offer was not available to the Company’s then current, directors or named executive officers and the Company could at its sole discretion amend, extend or withdraw the tender offer at any time prior to closing.
The Company completed the Tender Offer on July 10, 2007. As a result, the Company accepted for exchange options to purchase an aggregate of 2,238,883 shares of the Company’s common stock from 187 eligible participants, representing 87% of the shares subject to options that were eligible to be exchanged in the Offer to Exchange as of May 31, 2007. Upon the terms and subject to the conditions set forth in the Tender Offer to Exchange, the Company issued restricted stock unit awards covering an aggregate of 893,828 shares of the Company’s common stock in exchange for the options surrendered pursuant to the Tender Offer to Exchange.
The fair value of the restricted stock unit awards was measured as the total of the unrecognized compensation cost of the original options tendered and the incremental compensation cost of the restricted stock unit awards on July 10, 2007, the date of cancellation. The incremental compensation cost was measured as the excess of the fair value of the restricted stock unit awards over the fair value of the options immediately before cancellation based on the share price and other pertinent factors at that date. The incremental cost of the 893,828 restricted stock unit awards was approximately $145,000. The unrecognized compensation costs of the 2,238,883 options cancelled were $17.1 million. The total fair value of the restricted stock unit awards on July 10, 2007 was $17.2 million and these costs will be amortized over the service period of the restricted stock unit awards. The service period of the restricted stock unit awards is longer than the service period of the options tendered.
Determining Fair Value
The fair value of share-based awards was estimated using the Black-Scholes model with the following weighted-average assumptions for the years ended December 29, 2007, December 30, 2006 and December 31, 2005, respectively.
| | | | | | | | | | | | |
| | | Year Ended | |
| | | December 29,
2007 | | | December 30,
2006 | | | December 31,
2005 | |
Option Plan Shares | | | | | | | | | | | | |
Dividend yield | | | — | | | | — | | | | — | |
Risk-free interest rate | | | 4.6 | % | | | 4.8 | % | | | 4.1 | % |
Volatility | | | 60 | % | | | 60 | % | | | 82 | % |
Weighted average expected life (in years) | | | 5.41 | | | | 5.61 | | | | 4.11 | |
Estimated annual forfeitures | | | 10.5 | % | | | 8.3 | % | | | n/a | |
Weighted average fair value | | $ | 9.04 | | | $ | 18.78 | | | $ | 8.82 | |
| | | |
ESPP shares | | | | | | | | | | | | |
Dividend yield | | | — | | | | — | | | | — | |
Risk-free interest rate | | | 4.5 | % | | | 4.9 | % | | | 3.5 | % |
Volatility | | | 50.0 | % | | | 54.0 | % | | | 63.0 | % |
Weighted average expected life (in years) | | | 1.25 | | | | 1.25 | | | | 1.41 | |
Weighted average fair value | | $ | 4.97 | | | $ | 11.02 | | | $ | 5.36 | |
The computation of expected life for the year ended December 29, 2007 is based on an analysis of the relevant industry sector post-vest termination rates and the exercise factors. The expected volatility is based on a combination of the implied and historical volatility for both the Company and its peer group. The interest rate is based on the implied yield currently available on U.S. Treasury zero-coupon issues with an equivalent remaining term. Where the expected term of the Company’s share-based awards do not correspond with the terms for which
72
RACKABLE SYSTEMS, INC. AND SUBSIDIARIES
NOTES TO CONSOLIDATED FINANCIAL STATEMENTS—(Continued)
interest rates are quoted, the Company performed a straight-line interpolation to determine the rate from the available term maturities. The estimated forfeiture rate was based on an analysis of the relevant industry sector pre-vest termination rate, as the Company believes that its historical forfeiture rates are not representative of future expectations, given that a substantial portion of the Company’s stock options were granted subsequent to its initial public offering in June 2005.
Stock Options and Restricted Stock Awards Activity
A summary of stock option activity as of December 29, 2007 is as follows:
| | | | | | | | | | | | | | |
| | | | Outstanding Options |
| | | Shares
Available
for Future
Grants | | | Shares | | | Weighted
Average
Exercise
Price | | Weighted
Average
Remaining
Contractual term
in years | | Aggregate
Intrinsic
Value |
Balance at December 29, 2004 | | 52,224 | | | 2,452,975 | | | $ | 1.92 | | | | | |
Additional shares authorized for grant | | 1,757,958 | | | — | | | | — | | | | | |
Options expired | | (11,230 | ) | | — | | | | — | | | | | |
Options granted (weighted average fair value of $8.82 per share) | | (1,544,029 | ) | | 1,544,029 | | | | 14.11 | | | | | |
Options exercised | | — | | | (412,738 | ) | | | 0.90 | | | | | |
Options cancelled | | 78,288 | | | (78,288 | ) | | | 6.69 | | | | | |
| | | | | | | | | | | | | | |
Balance at December 31, 2005 | | 333,211 | | | 3,505,978 | | | | 7.30 | | | | | |
Additional shares authorized for grant | | 2,688,041 | | | — | | | | — | | | | | |
Options granted (weighted average fair value of $18.78 per share) | | (2,638,917 | ) | | 2,638,917 | | | | 32.03 | | | | | |
Restricted awards granted | | (120,000 | ) | | — | | | | — | | | | | |
Options exercised | | — | | | (1,191,200 | ) | | | 4.77 | | | | | |
Options cancelled | | 182,224 | | | (182,224 | ) | | | 28.82 | | | | | |
| | | | | | | | | | | | | | |
Balance at December 30, 2006 | | 444,559 | | | 4,771,471 | | | | 20.78 | | | | | |
Additional shares authorized for grant | | 1,667,395 | | | — | | | | — | | | | | |
Options granted (weighted average fair value of $9.04 per share) | | (3,410,081 | ) | | 3,410,081 | | | | 15.87 | | | | | |
Restricted awards granted | | (1,339,993 | ) | | — | | | | — | | | | | |
Options exercised | | — | | | (895,178 | ) | | | 3.00 | | | | | |
Options cancelled | | 4,393,894 | | | (4,393,894 | ) | | | 25.63 | | | | | |
Restricted awards cancelled | | 265,925 | | | — | | | | — | | | | | |
Restricted awards forfeited for taxes | | 53,915 | | | — | | | | — | | | | | |
| | | | | | | | | | | | | | |
Balance at December 29, 2007 | | 2,075,614 | | | 2,892,480 | | | $ | 13.13 | | 8.61 | | $ | 1,064,809 |
| | | | | | | | | | | | | | |
Vested and expected to vest at December 29, 2007 | | | | | 2,371,256 | | | $ | 13.06 | | 8.61 | | $ | 978,335 |
| | | | | | | | | | | | | | |
Exercisable at December 29, 2007 | | | | | 571,095 | | | $ | 12.45 | | 7.58 | | $ | 636,466 |
| | | | | | | | | | | | | | |
The total intrinsic value of options exercised for the fiscal years ended December 29, 2007, December 30, 2006, and December 31, 2005 was $10.1 million, $37.2 million and $7.1 million, respectively.
73
RACKABLE SYSTEMS, INC. AND SUBSIDIARIES
NOTES TO CONSOLIDATED FINANCIAL STATEMENTS—(Continued)
As of December 29, 2007, there was $17.6 million of total unrecognized compensation cost related to non-vested stock options. That cost is expected to be recognized over a weighted average period of 1.7 years.
| | | | | | | | | | | | |
| | | Options Outstanding | | Options Exercisable |
Exercise Price
Range | | Number of
Outstanding
Options | | Weighted Average
Remaining
Contractual Life
(In Years) | | Weighted
Average
Exercise
Price | | Number of
Options
Exercisable | | Weighted
Average
Exercise
Price |
| $ 0.71 - $10.42 | | 327,225 | | 7.28 | | $ | 6.73 | | 118,481 | | $ | 4.35 |
| $10.88 - $12.10 | | 438,208 | | 9.04 | | $ | 11.69 | | 56,093 | | $ | 11.48 |
| $12.16 - $12.58 | | 281,251 | | 8.99 | | $ | 12.22 | | 8,459 | | $ | 12.22 |
| $12.82 - $12.82 | | 403,315 | | 6.81 | | $ | 12.82 | | 167,383 | | $ | 12.82 |
| $13.15 - $13.15 | | 83,000 | | 9.84 | | $ | 13.15 | | — | | $ | — |
| $13.23 - $13.23 | | 700,000 | | 9.45 | | $ | 13.23 | | 116,666 | | $ | 13.23 |
| $14.03 - $14.15 | | 381,000 | | 9.34 | | $ | 14.10 | | 4,999 | | $ | 14.04 |
| $14.41 - $37.91 | | 268,981 | | 8.20 | | $ | 21.78 | | 94,682 | | $ | 19.84 |
| $48.24 - $48.24 | | 9,500 | | 8.22 | | $ | 48.24 | | 4,332 | | $ | 48.24 |
| | | | | | | | | | | | | |
| $ 0.71 - $48.24 | | 2,892,480 | | 8.61 | | $ | 13.13 | | 571,095 | | $ | 12.45 |
| | | | | | | | | | | | |
The following table summarizes the Company’s restricted stock awards (“RSA”) activity for the year ended December 29, 2007:
| | | | | | |
| | | Number of
Shares | | | Weighted Average
Grant Date
Fair Value |
Balance at December 30, 2006 | | 120,000 | | | $ | 27.36 |
Awarded | | 343,040 | | | $ | 17.03 |
Released | | (69,128 | ) | | $ | 18.82 |
Forfeited | | (154,378 | ) | | $ | 25.82 |
| | | | | | |
Balance at December 29, 2007 | | 239,534 | | | $ | 16.03 |
| | | | | | |
As of December 29, 2007, there was $5.0 million of total unrecognized compensation cost related to RSA. That cost is expected to be recognized over a weighted average period of 3.7 years.
The following table summarizes the Company’s restricted stock units (“RSU”) activity for the year ended December 29, 2007:
| | | | | | | | | | | |
| | | Shares | | | Weighted
Average
Purchase
Price | | Average
Remaining
Contractual term
in years | | Aggregate
Intrinsic
Value |
Balance at December 30, 2006 | | — | | | $ | — | | | | | |
Awarded | | 996,953 | | | | — | | | | | |
Released | | (84,242 | ) | | | — | | | | | |
Forfeited | | (111,547 | ) | | | — | | | | | |
| | | | | | | | | | | |
Balance at December 29, 2007 | | 801,164 | | | | — | | 1.64 | | $ | 7,787,314 |
| | | | | | | | | | | |
Vested and expected to vest at December 29, 2007 | | 645,048 | | | | — | | 1.32 | | $ | 6,269,865 |
| | | | | | | | | | | |
Exercisable at December 29, 2007 | | — | | | | — | | — | | $ | — |
| | | | | | | | | | | |
74
RACKABLE SYSTEMS, INC. AND SUBSIDIARIES
NOTES TO CONSOLIDATED FINANCIAL STATEMENTS—(Continued)
As of December 29, 2007, there was $12.2 million of total unrecognized compensation cost related to RSU’s. That cost is expected to be recognized over a weighted average period of 2.7 years.
During the fiscal year ended December 29, 2007, 53,915 shares of RSA’s and RSU’s were delivered to the Company in payment of $630,457 of withholding tax obligations arising from the release of RSA’s and RSU’s. The withholding tax obligations were based upon the fair market value of the Company’s common stock on the vesting date.
At December 29, 2007, the total compensation cost related to options to purchase the Company’s common stock under the 2005 ESPP but not yet recognized was approximately $1.0 million. This cost will be amortized on a straight-line basis over periods of up to 1.8 years.
The following table shows the shares issued, and their respective weighted-average purchase price per share, pursuant to the 2005 ESPP during the twelve months ended December 29, 2007 and December 30, 2006.
| | | | | | |
| | | 2007 | | 2006 |
Shares issued | | | 166,834 | | | 143,286 |
| | | | | | |
Weighted-average purchase price per share | | $ | 11.04 | | $ | 10.75 |
| | | | | | |
The Company has reserved the following shares of authorized but un-issued common stock as of December 29, 2007:
| | |
Options available for grant under stock option plans | | 2,075,785 |
Employee stock purchase plan | | 602,591 |
| | |
Shares reserved and available for future grants | | 2,678,376 |
Restricted stock units issued and outstanding | | 800,249 |
Options issued and outstanding under stock option plans | | 2,892,480 |
| | |
Total | | 6,371,105 |
| | |
6. EMPLOYEE BENEFIT PLANS
Defined Contribution Plans—Effective September 1, 2003, Rackable Systems established a 401(k) retirement plan covering substantially all employees. The plan provides for voluntary salary reduction contributions up to the maximum allowed under Internal Revenue Service rules. The Company can make annual contributions to the plan at the discretion of the Board of Directors. The Company contributed $0.1 million for the year ended December 29, 2007 and has not made contributions for any other year presented.
7. ACQUISITION
On September 8, 2006, the Company completed its acquisition of Terrascale Technologies, Inc. (“Terrascale”). Terrascale is a provider of a clustered file system solution enabling high performance input/output (I/O) connectivity between servers and commodity-based storage subsystems. The purchase price was $39.4 million, which included $1.5 million related to a loan made to Terrascale prior to closing. The acquisition was accounted for using the purchase method of accounting in accordance with SFAS No. 141,Business Combinations (“SFAS 141”), and accordingly the Company’s consolidated financial statements from September 8, 2006 include the impact of the acquisition.
75
RACKABLE SYSTEMS, INC. AND SUBSIDIARIES
NOTES TO CONSOLIDATED FINANCIAL STATEMENTS—(Continued)
The purchase price includes $7.8 million of consideration which will vest and be paid out to continuing employees over the second through seventh quarters (the quarter ended April 1, 2007 through the quarter ended June 30, 2008) following the closing based on continued employment and will be accounted for as compensation expense. For the year ended December 29, 2007, $3.9 million was paid.
Terrascale stock options were exchanged in the merger and became options to purchase 30,419 shares of Rackable Systems common stock at an exercise price of $5.86 per share which had a fair value of $0.6 million, as of September 8, 2006.
The total adjusted purchase price of $33.3 million is the total purchase price of $39.4 million plus $2.0 million of acquisition related expenses less $7.8 million of consideration to be paid out to continuing employees and approximately $0.3 million related to the fair value of unvested and unearned stock options. This total purchase price was allocated to the tangible and intangible assets acquired and liabilities assumed based upon their respective estimated fair values at the acquisition date with the excess purchase price allocated to goodwill. The valuation of the identifiable intangible assets acquired was prepared based on management’s estimates and assumptions. The following table summarizes the estimated fair value of assets acquired and liabilities assumed at the date of acquisition (in thousands):
| | | |
Current assets | | $ | 2,235 |
Property and equipment | | | 195 |
In-process research and development | | | 2,840 |
Amortizable intangible assets: | | | |
Existing technology | | | 8,256 |
Customer relationships | | | 633 |
Contract backlog and maintenance contracts | | | 263 |
Non-competition agreements | | | 319 |
Goodwill | | | 20,401 |
| | | |
Total assets acquired | | | 35,142 |
Current liabilities | | | 1,197 |
Long-term liabilities | | | 514 |
| | | |
Total liabilities assumed | | | 1,711 |
| | | |
Net assets acquired | | $ | 33,431 |
| | | |
The following unaudited pro forma consolidated financial data represents the combined results of operations as if Terrascale’ business had been combined with the Company at the beginning of the period. This pro forma financial data includes the straight line amortization of intangibles over their respective estimated useful lives (in thousands, except per share amounts):
| | | | | | |
| | | Year ended |
| | | December 30, 2006 | | December 31, 2005 |
Revenue | | $ | 360,832 | | $ | 215,164 |
Operating income | | $ | 11,638 | | $ | 20,296 |
Net income | | $ | 11,829 | | $ | 5,724 |
Basic income per share | | $ | 0.44 | | $ | 0.58 |
| | | | | | |
Diluted income per share | | $ | 0.41 | | $ | 0.32 |
| | | | | | |
76
RACKABLE SYSTEMS, INC. AND SUBSIDIARIES
NOTES TO CONSOLIDATED FINANCIAL STATEMENTS—(Continued)
The unaudited pro forma results of operations are presented for illustrative purposes only and are not intended to represent what the Company’s results of operations would have been if the acquisition had occurred on those dates or to project the Company’s results of operations for any future period. Since the Company and Terrascale were not under common control or management for any period presented prior to the acquisition, the unaudited pro forma results of operations may not be comparable to, or indicative of, future performance. These results do not reflect any additional costs or cost savings resulting from the acquisition.
With the exception of $2.8 million of IPRD, the identified intangible assets consisting of existing technology, customer relationships, contract backlog and maintenance contracts and non-competition agreements will be amortized on a straight-line basis over their estimated useful lives, with a weighted average life of approximately 5.5 years. The entire amount of Goodwill recorded from this acquisition is tax deductible over 15 years.
Development projects that had not reached technological feasibility, and had no future alternative uses were classified as IPRD. The $2.8 million value allocated to projects that were identified as IPRD was charged to expense in the third quarter of 2006. The Company’s IPRD relates to developing a new version of the current software platform. The value assigned to IPRD was primarily determined utilizing the income approach which presumes that the value of an asset can be estimated by the net economic benefit (i.e. cash flows) to be received over the life of the asset, discounted to present value utilizing a discount rate of 21%. The cost to complete the IPRD projects was approximately $0.9 million and was completed in 2007.
On April 4, 2007, the Company and the former shareholders of Terrascale executed an agreement for the Company’s purchase of all of the rights of the Distributed Parity Engine (“DPE”), a patent application and intellectual property rights related to a technology previously licensed to the Company. Originally, the Company had an option to retain the rights to DPE technology for a payment of $9.0 million to the former shareholders. The option expired on March 6, 2007. The Company and the former shareholders subsequently agreed to transfer the rights to the DPE technology to the Company for a cash payment of $9.1 million and the Company recorded an additional $4.0 million to recognize a deferred tax liability as required by EITF No. 98-11 because the amount paid for the asset differs from its tax basis.
8. DEFERRED REVENUE AND DEFERRED COST OF GOODS SOLD
The Company accounts for its revenue under the provisions of SAB No. 104,Revenue Recognition in Financial Statements (“SAB No. 104”). Under the provisions of SAB No. 104, revenue is recorded at the later of the time of shipment when title and risk of loss passes to the customer or when customer acceptance periods expire, generally within 15 days of receipt by the customer. At December 29, 2007, the Company had deferred product revenue of $1.1 million related to shipments to customers pending acceptance. The remaining deferred revenue of $7.2 million at December 29, 2007 pertains to revenue from maintenance and extended warranty arrangements that are recognized ratably over the contract period and professional support services which had not been completed as of the balance sheet dates. Deferred product costs associated with deferred revenue were $0.5 million at December 29, 2007.
At December 30, 2006, the Company had deferred revenue and related deferred product costs of $3.0 million and $2.4 million, respectively, related to shipments to customers pending acceptance. The remaining deferred revenue of $6.4 million at December 30, 2006, pertains to revenue from extended warranty arrangements that are recognized ratably over the warranty period and professional support services which had not been completed as of the balance sheet dates.
77
RACKABLE SYSTEMS, INC. AND SUBSIDIARIES
NOTES TO CONSOLIDATED FINANCIAL STATEMENTS—(Continued)
9. ENTERPRISE AND RELATED GEOGRAPHIC INFORMATION
The Company is managed by its executive officers in Fremont, California. The Company’s chief operating decision maker is the Chief Executive Officer (“CEO”). Based on the financial information reviewed by the CEO, the Company has determined that it operates in a single reportable segment. Revenue from both domestic and international customers and on a percentage basis by country (based on the address of the customer on the invoice) was as follows (in thousands, except percentage amounts):
| | | | | | | | | | | | |
| | | Year Ended | |
| | | December 29,
2007 | | | December 30,
2006 | | | December 31,
2005 | |
Domestic revenue | | $ | 332,906 | | | $ | 328,426 | | | $ | 209,485 | |
International revenue | | | 20,249 | | | | 31,950 | | | | 5,500 | |
| | | | | | | | | | | | |
Total revenue | | $ | 353,155 | | | $ | 360,376 | | | $ | 214,985 | |
| | | | | | | | | | | | |
Revenue by country: | | | | | | | | | | | | |
United States | | | 94 | % | | | 91 | % | | | 97 | % |
Ireland | | | 2 | % | | | 5 | % | | | — | |
Republic of China | | | 1 | % | | | 1 | % | | | 2 | % |
Others | | | 3 | % | | | 3 | % | | | 1 | % |
| | | | | | | | | | | | |
Total | | | 100 | % | | | 100 | % | | | 100 | % |
| | | | | | | | | | | | |
Sales revenue for the high-density compute server and high-capacity storage system for the years ended December 30, 2007, December 30, 2006 and December 31, 2005 were as follows (in thousands):
| | | | | | | | | |
| | | Year Ended |
| | | December 29,
2007 | | December 30,
2006 | | December 31,
2005 |
Compute servers | | $ | 322,926 | | $ | 325,537 | | $ | 194,570 |
Storage systems | | | 30,229 | | | 34,839 | | | 20,415 |
| | | | | | | | | |
Total revenue | | $ | 353,155 | | $ | 360,376 | | $ | 214,985 |
| | | | | | | | | |
Over 90% of the Company’s property, plant and equipment were located in the US for the years ended December 29, 2007 and December 30, 2006.
10. INCOME TAXES
Income (loss) before income taxes consisted of the following (in thousands):
| | | | | | | | | | | | |
| | | December 29,
2007 | | | December 30,
2006 | | | December 31,
2005 | |
Domestic | | $ | (31,957 | ) | | $ | 21,633 | | | $ | 18,532 | |
Foreign | | | (31,033 | ) | | | (1,789 | ) | | | (112 | ) |
| | | | | | | | | | | | |
Total | | $ | (62,990 | ) | | $ | 19,844 | | | $ | 18,420 | |
| | | | | | | | | | | | |
78
RACKABLE SYSTEMS, INC. AND SUBSIDIARIES
NOTES TO CONSOLIDATED FINANCIAL STATEMENTS—(Continued)
The income tax provisions for the years ended December 29, 2007, December 30, 2006 and December 31, 2005 consisted of the following in (thousands):
| | | | | | | | | | | | |
| | | December 29,
2007 | | | December 30,
2006 | | | December 31,
2005 | |
Current: | | | | | | | | | | | | |
Federal | | $ | (5,944 | ) | | $ | 14,831 | | | $ | 12,091 | |
State | | | (117 | ) | | | 3,162 | | | | 3,110 | |
Foreign | | | (174 | ) | | | 94 | | | | — | |
| | | | | | | | | | | | |
Total | | | (6,235 | ) | | | 18,087 | | | | 15,201 | |
| | | | | | | | | | | | |
Deferred | | | | | | | | | | | | |
Federal | | | 12,942 | | | | (8,087 | ) | | | (4,671 | ) |
State | | | 1,903 | | | | (1,085 | ) | | | (622 | ) |
Foreign | | | (2,043 | ) | | | (543 | ) | | | — | |
| | | | | | | | | | | | |
Total | | | 12,802 | | | | (9,715 | ) | | | (5,293 | ) |
| | | | | | | | | | | | |
Total tax expense | | $ | 6,567 | | | $ | 8,372 | | | $ | 9,908 | |
| | | | | | | | | | | | |
Current tax provision (benefit) in 2007, 2006 and 2005 includes $1.8 million, $15.0 million, and $3.0 million respectively, of tax benefits from stock options and other employee incentive plan awards which has been recorded to additional paid-in capital.
The following table provides a reconciliation of statutory income tax rate for the years ended December 29, 2007, December 30, 2006 and December 31, 2005:
| | | | | | | | | |
| | | December 29,
2007 | | | December 30,
2006 | | | December 31,
2005 | |
Federal statutory rate provision (benefit) | | (35 | )% | | 35 | % | | 35 | % |
Change in fair value of embedded derivatives | | 0 | % | | 0 | % | | 8 | % |
Stock based compensation | | 0 | % | | 2 | % | | 1 | % |
State tax, net of federal tax benefit | | (4 | )% | | 5 | % | | 8 | % |
Preferred stock dividends recorded as interest expense | | 0 | % | | 0 | % | | 2 | % |
Foreign taxes | | (3 | )% | | 0 | % | | 0 | % |
Goodwill impairment | | 4 | % | | 0 | % | | 0 | % |
Valuation allowance | | 50 | % | | 0 | % | | 0 | % |
Other | | (2 | )% | | 0 | % | | 0 | % |
| | | | | | | | | |
| | 10 | % | | 42 | % | | 54 | % |
| | | | | | | | | |
79
RACKABLE SYSTEMS, INC. AND SUBSIDIARIES
NOTES TO CONSOLIDATED FINANCIAL STATEMENTS—(Continued)
The Company accounts for income taxes using an asset and liability approach. Deferred income tax assets and liabilities result from temporary differences between the tax basis of assets and liabilities and their reported amounts in the financial statements that will result in taxable or deductible amounts in future years. Valuation allowances are provided when necessary to reduce deferred tax assets to the amount expected to be realized.
Significant components of the deferred tax assets and liabilities at December 29, 2007 and December 30, 2006, were as follows (in thousands):
| | | | | | | | |
| | | December 29,
2007 | | | December 30,
2006 | |
Deferred tax assets | | | | | | | | |
Inventory | | $ | 5,522 | | | $ | 4,485 | |
State taxes | | | — | | | | 1,217 | |
Accrued vacation | | | 468 | | | | 386 | |
Accrued warranty | | | 2,049 | | | | 739 | |
Accrued expense and reserves | | | 724 | | | | 467 | |
Deferred revenue | | | 316 | | | | 964 | |
Deferred rent | | | 346 | | | | 9 | |
Stock compensation | | | 12,894 | | | | 6,811 | |
Purchase accounting | | | 11,136 | | | | 1,503 | |
Net operating losses and tax credit carryforwards | | | 3,260 | | | | 2,489 | |
Other | | | 148 | | | | 32 | |
Valuation allowance | | | (31,552 | ) | | | — | |
| | | | | | | | |
Total deferred tax assets | | $ | 5,311 | | | $ | 19,102 | |
Deferred tax liabilities | | | | | | | | |
Intangible assets | | $ | (7,300 | ) | | $ | (2,758 | ) |
Deferred expenses | | | (184 | ) | | | (891 | ) |
Depreciation | | | (140 | ) | | | (162 | ) |
Other | | | (2 | ) | | | — | |
| | | | | | | | |
Total deferred tax liabilities | | | (7,627 | ) | | | (3,811 | ) |
| | | | | | | | |
Net deferred tax assets (liabilities) | | $ | (2,315 | ) | | $ | 15,291 | |
| | | | | | | | |
Classified in the Consolidated Balance Sheet as follows (in thousands):
| | | | | | | | |
| | | December 29,
2007 | | | December 30,
2006 | |
Current deferred income taxes | | $ | 499 | | | $ | 7,408 | |
Non-current other assets | | | 217 | | | | 8,314 | |
Non-current deferred income taxes | | | (3,031 | ) | | | (431 | ) |
| | | | | | | | |
Net deferred tax assets (liabilities) | | $ | (2,315 | ) | | $ | 15,291 | |
| | | | | | | | |
The valuation allowance for deferred tax assets increased to $31.6 million in 2007. There was no valuation allowance in 2006 or 2005. The valuation allowance was recorded in 2007 based on management’s judgment that it was more likely than not that U.S. deferred tax assets in excess of recoverable income taxes and certain deferred tax liabilities would not be realized.
As of December 29, 2007, the Company has state and foreign tax net operating loss carry forwards and foreign research credit carryovers of $14.4 million, $8.1 million and $0.2 million, respectively. Certain of the
80
RACKABLE SYSTEMS, INC. AND SUBSIDIARIES
NOTES TO CONSOLIDATED FINANCIAL STATEMENTS—(Continued)
state and foreign net operating loss carry forwards start to expire in 2012 and 2009, respectively, if not utilized and the foreign research credit carry forwards start to expire in 2016 if not utilized. Approximately $6.1 million of the state tax net operating loss carry forwards are attributable to excess tax benefits associated with stock option and other equity plans, the benefit of which will be credited to additional paid-in capital when and if realized.
In June 2006, the FASB issued FIN 48. This interpretation clarifies the accounting and disclosures relating to the uncertainty about whether a tax return position will ultimately be sustained by the tax authorities. The Company adopted this interpretation on December 31, 2006. As part of the adoption, the Company recorded a reduction in our liability for unrecognized tax benefits of $386,000 which increased our December 31, 2006 balance of retained earnings. A reconciliation of the beginning and ending amount of unrecognized tax benefits for 2007 is as follows (in thousands):
| | | | |
Balance as of December 31, 2006 | | $ | 192 | |
Settlements with tax authorities | | | (192 | ) |
| | | | |
Balance as of December 29, 2007 | | $ | — | |
| | | | |
During 2007, the Internal Revenue Service completed its examination of the Company’s 2004 tax federal income tax return with no changes to the return. The Company also filed a number of prior year multi-state returns on a voluntary basis with state taxing authorities. As a result, the Company recorded a $253,000 income tax benefit related to the reversal of previously recorded uncertain tax positions and accrued interest.
The Company classifies interest expense and penalties related to unrecognized tax benefits and interest income on tax overpayments as components of income tax expense. As of December 29, 2007, there were no interest or penalties recognized on the Company’s consolidated balance sheet. The total amount of interest reversed in the Company’s consolidated statement of operations for 2007 was $61,000.
The Company’s U.S. federal returns for 2003 and prior years are no longer subject to examination. The Company’s state returns for years prior to 2002 are no longer subject to examination.
The Company’s foreign subsidiaries file income tax returns in the countries in which they have operations. Generally, these countries have statutes of limitations ranging from 4 to 6 years. Years still open to examination by foreign tax authorities in the Company’s major filing jurisdiction of Canada are 2003 through 2007. The Company’s Canadian subsidiary was recently notified that it will be subject to audit by the Quebec tax authorities for the 2003 to 2005 pre-acquisition tax years. As of December 29, 2007, there are no unrecorded tax benefits associated with these years that are subject to the tax audit.
11. COMMITMENTS AND CONTINGENCIES
Operating Leases—In November 2006, the Company signed an operating lease for a 40,316 square foot facility which will serve as the Company’s headquarters in Fremont, California. Lease payments escalate annually and the total future minimum lease payments amount to $2.6 million over the lease term. The stated term of the lease is six years and ten months, commencing on March 1, 2007. The Company can extend the lease an additional 3 years at 95% of the current market rate. The Company is required to maintain a cash deposit of approximately $40,000 included in other assets in the accompanying consolidated balance sheets as of December 29, 2007.
81
RACKABLE SYSTEMS, INC. AND SUBSIDIARIES
NOTES TO CONSOLIDATED FINANCIAL STATEMENTS—(Continued)
The Company signed a seven-year operating lease, commencing on December 1, 2006, for an 117,500 square foot facility which serves as the Company’s manufacturing and warehouse facility in Fremont, California. Lease payments escalate annually and the total future minimum lease payments amount to $6.6 million over the lease term. The stated term of the lease is seven years, but the Company may extend the lease for an additional three years at the then current market rate. As part of this agreement, the Company is required to maintain a $100,000 cash deposit or an unconditional and irrevocable fully cash-collateralized letter of credit as a form of security. The cash deposit for the lease building is included in other assets in the accompanying consolidated balance sheet as of December 29, 2007.
The Company also leases another facility under an operating lease in Milpitas, California, which expires on June 30, 2009. According to the terms of the lease, the Company is responsible for its proportionate share of maintenance, taxes and insurance expenses.
It is the Company’s policy to record rent expense over the term of the lease on a straight-line method, including any rent holiday periods. Leasehold improvements are capitalized and amortized over the shorter of the estimated life of the improvements or the term of the lease.
Future minimum lease payments under operating leases are as follows (in thousands):
| | | |
Year ending December 31, 2008 | | $ | 1,596 |
Year ending December 30, 2009 | | | 1,681 |
Year ending December 29, 2010 | | | 1,471 |
Year ending December 31, 2011 | | | 1,565 |
Year ending December 30, 2012 | | | 1,660 |
Thereafter | | | 1,643 |
| | | |
Total | | $ | 9,616 |
| | | |
Total rent expense for the years ended December 29, 2007, December 30, 2006 and December 31, 2005 was approximately $2.2 million, $0.8 million and $0.5 million, respectively.
Purchase Commitments—In connection with supplier agreements, the Company agreed to purchase certain units of inventory through 2008. As of December 29, 2007, there was a remaining commitment of approximately $1.5 million.
Indemnification Agreements—The Company enters into standard indemnification agreements with its customers and certain other business partners in the ordinary course of business. These agreements include provisions for indemnifying the customer against any claim brought by a third party to the extent any such claim alleges that the Company’s product infringes a patent, copyright or trademark, or misappropriates a trade secret, of that third party. The agreements generally limit the scope of the available remedies in a variety of industry- standard methods, including, but not limited to, product usage and geography-based limitations, a right to control the defense or settlement of any claim, and a right to replace or modify the infringing products to make them non-infringing. The Company has not incurred significant expenses related to these indemnification agreements and no material claims for such indemnifications were outstanding as of December 29, 2007. As a result, the Company believes the estimated fair value of these indemnification agreements, if any, to be de minimus; accordingly, no liability has been recorded with respect to such indemnifications as of December 29, 2007.
82
RACKABLE SYSTEMS, INC. AND SUBSIDIARIES
NOTES TO CONSOLIDATED FINANCIAL STATEMENTS—(Continued)
12. SUBSEQUENT EVENTS
As of December 29, 2007, the Company held $64.6 million of various auction rate municipal bonds and variable rate municipal demand notes (“ARS”), collateralized by student loans. Substantially all of these securities consisted of guaranteed student loans, insured or reinsured by the federal government. The Company has not recorded an impairment charge as the Company believes the $64.6 million carrying value is not impaired as of December 29, 2007, due to the fact that these ARS investments had successful resets in January 2008.
During February 2008, the Company reduced its investment in ARS to approximately $9.1 million. These securities had a successful auction reset subsequent to December 29, 2007, but failed in February 2008. If these securities remain in the portfolio and do not have a successful reset prior to March 29, 2008, (the end of the Company’s first quarter of fiscal 2008), they will need to be reclassified to long-term investments at their then fair value and an impairment charge may be required.
13. RELATED PARTY TRANSACTIONS
Gary A. Griffiths, a member of the Company’s Board of Directors since November 2004, is also President, Products for WebEx Communications, Inc, a Cisco Systems, Inc. company, a provider of web-based conferencing solutions. WebEx is a customer of and a supplier to the Company. Revenue from WebEx was $0.6 million and $2.5 million in the years ended December 29, 2007 and December 30, 2006, respectively. At December 29, 2007 and December 30, 2006, $58,052 and $10,752, respectively, was outstanding and included in accounts receivable.
83
Item 9. Changes in and Disagreements with Accountants on Accounting and Financial Disclosure
None.
Item 9A. Controls and Procedures
Evaluation of Disclosure Controls and Procedures
Our management, including our chief executive officer and chief financial officer, has evaluated the effectiveness of our disclosure controls and procedures to ensure that the information included in reports we file under the Securities Exchange Act of 1934, as amended, or the Exchange Act, is processed and reported within the appropriate time periods. As discussed in more detail below, our management has concluded that these disclosure controls and procedures were ineffective as of December 29, 2007 due to material weaknesses that we identified in our internal control over financial reporting, specifically related to inventory valuation and accounting for income taxes.
Management’s Report on Internal Control over Financial Reporting
Our management is responsible for establishing and maintaining adequate internal control over financial reporting as defined in Rules 13a-15(f) of the Exchange Act. We have designed our internal controls to provide reasonable, but not absolute, assurance that our financial statements are prepared in accordance with generally accepted accounting principles in the United States of America. We assess the effectiveness of our internal controls based on the criteria set forth in theInternal Control—Integrated Frameworkdeveloped by the Committee of Sponsoring Organizations of the Treadway Commission.
In performing the assessment, our management has identified two material weaknesses in internal control over financial reporting as of December 29, 2007 as follows:
Inventory Valuation
Our management has concluded that the controls over our accounting for inventory valuation did not operate effectively as of December 29, 2007. In particular, errors were detected in the inventory valuation for the annual financial statements resulting from: (i) items relating to the calculation of purchase price variances and excess and obsolete inventory reserve adjustments and; (ii) reviews of inventory valuations not being performed with sufficient precision. Due to the number and magnitude of the errors identified resulting from these internal control deficiencies and the absence of mitigating controls, management has concluded that these internal control deficiencies constitute a material weakness in our internal control over financial reporting because there is a reasonable possibility that a material misstatement of the annual financial statements would not have been prevented or detected on a timely basis.
Accounting for Income Taxes
Our management has concluded that the controls over our accounting for income taxes did not operate effectively as of December 29, 2007. In particular, errors were detected in the tax calculations for the annual financial statements resulting from: (i) current period tax calculations not being accurately prepared, and (ii) reviews of tax calculations not being performed with sufficient precision. Due to the magnitude of the error identified resulting from these internal control deficiencies and the absence of mitigating controls, management has concluded that these internal control deficiencies constitute a material weakness in our internal control over financial reporting because there is a reasonable possibility that a material misstatement of the annual financial statements would not have been prevented or detected on a timely basis.
Due to these two material weaknesses, management has concluded that our internal control over financial reporting was not effective as of December 29, 2007. Our independent registered public accounting firm, Deloitte & Touche LLP, has issued an auditors’ report on the effectiveness of our internal control over financial reporting, which is included [herein] [in Item 8 of the Annual Report on Form 10-K].
84
Changes in Internal Control over Financial Reporting
Except for the material weaknesses described above, there have been no changes in our internal control over financial reporting in the fourth quarter of 2007 that have materially affected, or are reasonably likely to materially affect, our internal control over financial reporting.
Remedial Efforts
We commenced a number of efforts to remediate the two material weaknesses noted above. These efforts will continue and include the following:
Inventory Valuation
We have begun the process of remediating the material weakness in accounting for inventory valuation by expanding the automation of our processes and placing an emphasis on hiring personnel with strong operational experience. We will continue to make changes as necessary and are implementing additional remedial steps as indicated below:
| | • | | We are automating the key components of our calculation for the provision for excess and obsolete inventory and purchase price variances |
| | • | | We are enhancing the training and education of our inventory and cost accounting personnel. |
| | • | | We are improving our review processes for various calculations relating to inventory valuation. |
We believe the above steps will provide us with the infrastructure and processes necessary to remediate the inventory valuation material weakness. We will continue to implement these remedial steps to ensure operating effectiveness of the improved internal controls over financial reporting.
Accounting for Income Taxes
We have begun the process of remediating the material weakness in accounting for income taxes, as noted below:
| | • | | We are enhancing procedures for higher quality reviews of the provision for income tax, including improving our accounting close processes to allow for increased review time. |
| | • | | We are identifying opportunities to automated the tax provision process including software tools that would reduce the number of manual spreadsheets that we use to calculate the income tax provision on a quarterly and annual basis |
| | • | | We are also evaluating the need for additional staffing in the accounting function to support close processes and the preparation and review of tax and related matters. |
We believe the above steps will provide us with the infrastructure and processes necessary to remediate the income tax accounting material weakness. We will continue to implement these remedial steps to ensure operating effectiveness of the improved internal controls over financial reporting.
Inherent Limitation on the Effectiveness of Internal Controls
The effectiveness of any system of internal control over financial reporting, including ours, is subject to inherent limitations, including the exercise of judgment in designing, implementing, operating, and evaluating the controls and procedures, and the inability to eliminate misconduct completely. Accordingly, any system of internal control over financial reporting, including ours, no matter how well designed and operated, can only provide reasonable, not absolute assurances. In addition, projections of any evaluation of effectiveness to future periods are subject to the risk that controls may become inadequate because of changes in conditions, or that the degree of compliance with the policies or procedures may deteriorate. We intend to continue to monitor and upgrade our internal controls as necessary or appropriate for our business, but cannot assure you that such improvements will be sufficient to provide us with effective internal control over financial reporting.
85
REPORT OF INDEPENDENT REGISTERED PUBLIC ACCOUNTING FIRM
To the Board of Directors and Stockholders of Rackable Systems, Inc.:
We have audited the internal control over financial reporting of Rackable Systems, Inc. and its subsidiaries (the “Company”) as of December 29, 2007, based on the criteria established in Internal Control—Integrated Framework issued by the Committee of Sponsoring Organizations of the Treadway Commission. The Company’s management is responsible for maintaining effective internal control over financial reporting and for its assessment of the effectiveness of internal control over financial reporting, included in the accompanying Management’s Report on Internal Control over Financial Reporting. Our responsibility is to express an opinion on the Company’s internal control over financial reporting based on our audit.
We conducted our audit in accordance with the standards of the Public Company Accounting Oversight Board (United States). Those standards require that we plan and perform the audit to obtain reasonable assurance about whether effective internal control over financial reporting was maintained in all material respects. Our audit included obtaining an understanding of internal control over financial reporting, assessing the risk that a material weakness exists, testing and evaluating the design and operating effectiveness of internal control based on that risk, and performing such other procedures as we considered necessary in the circumstances. We believe that our audit provides a reasonable basis for our opinion.
A company’s internal control over financial reporting is a process designed by, or under the supervision of, the company’s principal executive and principal financial officers, or persons performing similar functions, and effected by the company’s board of directors, management, and other personnel to provide reasonable assurance regarding the reliability of financial reporting and the preparation of financial statements for external purposes in accordance with generally accepted accounting principles. A company’s internal control over financial reporting includes those policies and procedures that (1) pertain to the maintenance of records that, in reasonable detail, accurately and fairly reflect the transactions and dispositions of the assets of the company; (2) provide reasonable assurance that transactions are recorded as necessary to permit preparation of financial statements in accordance with generally accepted accounting principles, and that receipts and expenditures of the company are being made only in accordance with authorizations of management and directors of the company; and (3) provide reasonable assurance regarding prevention or timely detection of unauthorized acquisition, use, or disposition of the company’s assets that could have a material effect on the financial statements.
Because of the inherent limitations of internal control over financial reporting, including the possibility of collusion or improper management override of controls, material misstatements due to error or fraud may not be prevented or detected on a timely basis. Also, projections of any evaluation of the effectiveness of the internal control over financial reporting to future periods are subject to the risk that the controls may become inadequate because of changes in conditions, or that the degree of compliance with the policies or procedures may deteriorate.
A material weakness is a deficiency, or a combination of deficiencies, in internal control over financial reporting, such that there is a reasonable possibility that a material misstatement of the company’s annual or interim financial statements will not be prevented or detected on a timely basis. The following material weaknesses have been identified and included in management’s assessment:
| | • | | The Company’s controls over accounting for inventory did not operate effectively as of December 29, 2007. In particular, errors were detected in the inventory accounting in the interim and annual financial statements resulting from (1) inaccurate record preparation relating to purchase price variances, variance capitalization, physical count, obsolescence reserve computations and inventory purchase cutoff, and (2) reviews of inventory calculations not being performed with sufficient precision. Due to the number and magnitude of the errors identified resulting from these internal control deficiencies and the absence of mitigating controls, there is a reasonable possibility that a material misstatement of the interim and |
86
| | annual financial statements would not have been prevented or detected on a timely basis by the Company’s controls. |
| | • | | The Company’s controls over accounting for income taxes did not operate effectively as of December 29, 2007. In particular, errors were detected in the tax calculations for the annual financial statements resulting from: (1) current period tax calculations not being accurately prepared, and (2) reviews of tax calculations not being performed with sufficient precision. Due to the number and magnitude of the errors identified resulting from these internal control deficiencies and the absence of mitigating controls, there is a reasonable possibility that a material misstatement of the interim and annual financial statements would not have been prevented or detected on a timely basis by the Company’s controls. |
These material weaknesses were considered in determining the nature, timing, and extent of audit tests applied in our audit of the consolidated financial statements as of and for the year ended December 29, 2007, of the Company and this report does not affect our report on such consolidated financial statements.
In our opinion, because of the effect of the material weaknesses identified above on the achievement of the objectives of the control criteria, the Company has not maintained effective internal control over financial reporting as of December 29, 2007, based on the criteria established inInternal Control—Integrated Framework issued by the Committee of Sponsoring Organizations of the Treadway Commission.
We have also audited, in accordance with the standards of the Public Company Accounting Oversight Board (United States), the consolidated financial statements as of and for the year ended December 29, 2007, of the Company and our report dated March 12, 2008 expressed an unqualified opinion on those consolidated financial statements and includes an explanatory paragraph relating to the adoption of Statement of Financial Standards No. 123(R), “Share-Based Payment,” effective January 1, 2006 and the adoption of FASB Interpretation No. 48, “Accounting for Uncertainty in Income Taxes—an Interpretation of FASB No. 109,” effective December 31, 2006.
/s/ DELOITTE & TOUCHE, LLP
San Jose, California
March 12, 2008
87
Item 9A(T). Controls and Procedures
Not Applicable
Item 9B. Other Information
None.
88
PART III
Item 10. Directors, Executive Officers and Corporate Governance
The information required by this Item is incorporated herein by reference from the sections entitled “Proposal 1—Election of Directors,” “Compliance with Section 16(a) of the Exchange Act,” and “Code of Ethics,” and “Corporate Governance” contained in our proxy statement for our 2008 Annual Meeting of Stockholders (the “Proxy Statement”) provided however, that the information required by this Item with respect to our executive officers is contained in Item 1 of Part I of this Annual Report under the heading “Executive Officers.”
Addition of Two New Directors
In June 2007, we engaged a search firm to identify for us additional directors to enhance the strength of our Board of Directors. This search, which was conducted during the months of July 2007 through January 2008, resulted in our appointing General Michael W. Hagee and Douglas R. King to our Board of Directors at the beginning of February 2008.
General Hagee brings to our Board more than 43 years of experience in the U.S. military and government sector, having served as a member of the Joint Chiefs of Staff; Commandant of the U.S. Marine Corps; and Commanding General of the 1st Marine Expeditionary Force.
Mr. King is a Certified Public Accountant with more than 30 years of experience in the accounting industry. He most recently served as the Managing Partner of the San Francisco office of Ernst & Young LLP. With the addition of Mr. King to our Board, we have strengthened the depth of financial and accounting expertise on our Board.
The Proxy Statement will provide additional information with respect to our two new directors, as well as our other Board members.
Corporate Governance Guidelines
At the direction of our Board of Directors in December 2007, we conducted an internal review of our corporate governance profile and, as a result, our Nominating and Corporate Governance Committee recommended to our Board of Directors, and our Board of Directors adopted, our Corporate Governance Guidelines in March 2008. In addition, our Board amended our bylaws to provide for the addition of majority voting requirements as described in the Corporate Governance Guidelines. The Corporate Governance Guidelines establish, among other things:
| | • | | Limits on the numbers of board memberships that may be held by our directors |
| | • | | Majority voting requirements for elections of directors |
| | • | | Requirement that directors who change their job responsibilities offer to resign |
| | • | | Director education expectations |
| | • | | Director and executive officer minimum stock ownership expectations |
The Corporate Governance Guidelines and revised bylaws may be accessed on our website atwww.rackable.com. The Proxy Statement will provide a further description of our Corporate Governance Guidelines.
89
Item 11.Executive Compensation
The information required by this Item is incorporated herein by reference from the sections entitled “Compensation Committee” in “Proposal 1—Election of Directors,” and “Executive Compensation and Related Information,” of in the Proxy Statement.
Item 12.Security Ownership of Certain Beneficial Owners and Management and Related Stockholder Matters
The information required by this Item is incorporated herein by reference from the section entitled “Security Ownership of Certain Beneficial Owners and Management” and “Equity Compensation Plan Information” of the Proxy Statement.
Item 13.Certain Relationships and Related Transactions, and Director Independence
The information required by this Item is incorporated herein by reference from the section entitled “Certain Relationships and Related Transactions, and Director Independence” and “Proposal 1—Election of Directors” in the Proxy Statement.
Item 14.Principal Accounting Fees and Services
The information required by this Item is incorporated herein by reference from the section entitled “Principal Accounting Fees and Services” in the Proxy Statement.
90
PART IV
Item 15.Exhibits, Financial Statement Schedules
(a) 1. Financial Statements
See Index to Consolidated Financial Statements in Item 8 of this Annual Report on Form 10-K, which is incorporated herein by reference.
2. Financial Statement Schedules
All other financial statement schedules have been omitted because they are either not applicable or the required information is shown in the consolidated financial statements or notes thereto.
3. Exhibits
See the Exhibit Index which follows the signature page of this Annual Report on Form 10-K, which is incorporated herein by reference.
(b) Exhibits
See Item 15(a) (3) above.
(c) Financial Statement Schedules
See Item 15(a) (2) above.
91
SIGNATURES
Pursuant to the requirements of Section 13 or 15(d) of the Securities Exchange Act of 1934, the registrant has duly caused this report to be signed on its behalf by the undersigned, thereunto duly authorized.
| | |
| RACKABLE SYSTEMS, INC. |
By: | | /s/ MADHU RANGANATHAN |
| | | Madhu Ranganathan Chief Financial Officer |
Dated: March 13, 2008
POWER OF ATTORNEY
KNOW ALL PERSONS BY THESE PRESENT, that each person whose signature appears below constitutes and appoints Mark J. Barrenechea, Madhu Ranganathan and Maurice Leibenstern, and each of them, acting individually, as his or her attorney-in-fact, each with full power of substitution and resubstitution, for him or her and in his or her name, place and stead, in any and all capacities, to sign any and all amendments to this Annual Report on Form 10-K, and to file the same, with all exhibits thereto, and other documents in connection therewith, with the Securities and Exchange Commission, granting unto said attorneys-in-fact and agents, and each of them, full power and authority to do and perform each and every act and thing requisite and necessary to be done in connection therewith and about the premises, as fully to all intents and purposes as he or she might or could do in person, hereby ratifying and confirming all that said attorneys-in-fact and agents, or any of them, or their or his substitute or substitutes, may lawfully do or cause to be done by virtue hereof.
Pursuant to the requirements of the Securities Exchange Act of 1934, this report has been signed below by the following persons on behalf of the registrant and in the capacities and on the dates indicated.
| | | | |
Signature | | Title | | Date |
| | |
/s/ MARK J. BARRENECHEA Mark J. Barrenechea | | Chief Executive Officer and Director
(Principal Executive Officer) | | March 13, 2008 |
| | |
/s/ MADHU RANGANATHAN Madhu Ranganathan | | Chief Financial Officer (Principal
Financial and Accounting Officer) | | March 13, 2008 |
| | |
/s/ CHARLES M. BOESENBERG Charles M. Boesenberg | | Director | | March 13, 2008 |
| | |
/s/ GARY A. GRIFFITHS Gary A. Griffiths | | Director | | March 13, 2008 |
| | |
/s/ MICHAEL W. HAGEE Michael W. Hagee | | Director | | March 13, 2008 |
| | |
/s/ DOUGLAS R. KING Douglas R. King | | Director | | March 13, 2008 |
| | |
/s/ HAGI SCHWARTZ Hagi Schwartz | | Director | | March 13, 2008 |
| | |
/s/ RONALD D. VERDOORN Ronald D. Verdoorn | | Director | | March 13, 2008 |
92
EXHIBIT INDEX
| | | | | | | | | | | | |
Exhibit
Number | | Exhibit Description | | Incorporated by Reference | | Filing Date | | Filed
Herewith |
| | | Form | | Ex. No. | | File No. | | |
| 2.1 | | Asset Acquisition Agreement, dated December 23, 2002, by and between GNJ, Inc. (f.k.a. Rackable Systems, Inc.) and Registrant | | S-1 | | 2.1 | | 333-122576 | | 2/4/2005 | | |
| | | | | | |
| 2.2 | | Share Purchase Agreement dated as of August 29, 2006, by and among Rackable Systems, Inc., Rackable Systems Canada Acquisition ULC, Terrascale Technologies Inc. and the other parties identified on Schedule A thereto. | | 8-K | | 2.1 | | 000-51333 | | 8/30/2006 | | |
| | | | | | |
| 3.1 | | Amended and Restated Certificate of Incorporation. | | 10-Q | | 3.1 | | 000-51333 | | 8/12/2005 | | |
| | | | | | |
| 3.2 | | Amended and Restated Bylaws. | | 8-K | | 3.2 | | 000-51333 | | 3/7/2008 | | |
| | | | | | |
| 4.1 | | Reference is made to Exhibits 3.1, and 3.2. | | | | | | | | | | |
| | | | | | |
| 4.2 | | Form of Specimen Stock Certificate. | | S-1A/2 | | 4.2 | | 333-122576 | | 5/2/2005 | | |
| | | | | | |
| 10.1 | | Securities Purchase Agreement by and among the Registrant and the other purchasers set forth therein dated as of December 23, 2002, as amended through April 28, 2005. | | S-1 | | 10.1 | | 333-122576 | | 2/4/2005 | | |
| | | | | | |
| 10.2 | | Registration Agreement, dated December 23, 2002, by and among the Registrant and certain investors and founders named therein. | | S-1 | | 10.2 | | 333-122576 | | 2/4/2005 | | |
| | | | | | |
| 10.3 | | Amendment No. 1 to Registration Agreement, dated February 2, 2005, among the Registrant, Rackable Investment LLC and the founders named therein. | | S-1 | | 10.3 | | 333-122576 | | 2/4/2005 | | |
| | | | | | |
| 10.4 | | Amendment No. 2 to Registration Agreement, dated May 19, 2005, among the Registrant, Rackable Investment LLC and the founders named therein. | | S-1A/4 | | 10.44 | | 333-122576 | | 5/27/2005 | | |
| | | | | | |
| 10.5 | | Founders Repurchase and Rights Agreement, dated December 23, 2002, by and among Registrant, GNJ, Inc. (f.k.a. Rackable Systems, Inc.), Rackable Investments LLC and the founders named therein. | | S-1 | | 10.4 | | 333-122576 | | 2/4/2005 | | |
| | | | | | |
| 10.6 | | Amendment No. 1 to the Founders Repurchase and Rights Agreement, dated May 19, 2005, among the Registrant, Rackable Investments LLC and the founders named therein. | | S-1A/4 | | 10.43 | | 333-122576 | | 2/4/2005 | | |
| | | | | | |
| 10.7 | | Amendment to Registration Agreement and Founder Repurchase and Rights Agreement, dated November 16, 2005, by and among Registrant, Rackable Investment LLC, Parthenon Investors II, L.P. and the founders named therein. | | S-1A/1 | | 10.7 | | 333-129573 | | 11/9/2005 | | |
| | | | | | |
| 10.8* | | Form of Indemnity Agreement entered into by Registrant with each of its directors and certain executive officers. | | S-1 | | 10.7 | | 333-122576 | | 2/4/2005 | | |
93
| | | | | | | | | | | | |
Exhibit
Number | | Exhibit Description | | Incorporated by Reference | | Filing Date | | Filed
Herewith |
| | | Form | | Ex. No. | | File No. | | |
| 10.9* | | 2002 Stock Option Plan and form of related agreements. | | S-1 | | 10.8 | | 333-122576 | | 2/4/2005 | | |
| | | | | | |
| 10.10* | | 2005 Equity Incentive Plan. | | S-1 | | 10.9 | | 333-122576 | | 2/4/2005 | | |
| | | | | | |
| 10.11* | | 2005 Non-Employee Directors’ Stock Option Plan. | | S-1 | | 10.10 | | 333-122576 | | 2/4/2005 | | |
| | | | | | |
| 10.12* | | 2005 Employee Stock Purchase Plan. | | S-1 | | 10.11 | | 333-122576 | | 2/4/2005 | | |
| | | | | | |
| 10.13 | | Lease Agreement, dated as of November 27, 2001, by and between the Registrant and EOP-Industrial Portfolio, L.L.C. | | S-1 | | 10.12 | | 333-122576 | | 2/4/2005 | | |
| | | | | | |
| 10.14 | | First Amendment to Lease Agreement, dated as of April 22, 2004, by and between the Registrant and EOP-Industrial Portfolio, L.L.C. | | S-1 | | 10.13 | | 333-122576 | | 2/4/2005 | | |
| | | | | | |
| 10.15 | | Second Amendment to Lease Agreement dated October 26, 2005, by and between Registrant and RREEF America Reit II Corp. (as successor in interest to EOP-Industrial Portfolio, L.L.C.). | | S-1A/1 | | 10.16 | | 333-129573 | | 11/9/2005 | | |
| | | | | | |
| 10.16* | | Employment Agreement, dated as of December 23, 2002, by and between the Registrant and Giovanni Coglitore. | | S-1 | | 10.17 | | 333-122576 | | 2/4/2005 | | |
| | | | | | |
| 10.17* | | First Amendment to the Employment Agreement, dated November 16, 2005, by and between Registrant and Giovanni Coglitore. | | S-1A/1 | | 10.27 | | 333-129573 | | 11/9/2005 | | |
| | | | | | |
| 10.18* | | Executive Compensation Summary. | | | | | | | | | | X |
| | | | | | |
| 10.19 | | Director Compensation Arrangements. | | 10-K | | 10.31 | | 000-51333 | | 2/28/2007 | | |
| | | | | | |
| 10.20 | | Promissory Note dated December 31, 2004, issued by the Registrant to Giovanni Coglitore. | | S-1 | | 10.29 | | 333-122576 | | 2/4/2005 | | |
| | | | | | |
| 10.21 | | Stock Repurchase Agreement, dated February 2, 2005, between the Registrant and Giovanni Coglitore. | | S-1 | | 10.32 | | 333-122576 | | 2/4/2005 | | |
| | | | | | |
| 10.22* | | Offer letter, dated August 18, 2004, from the Registrant to Hagi Schwartz. | | S-1 | | 10.35 | | 333-122576 | | 2/4/2005 | | |
| | | | | | |
| 10.23* | | Offer letter, dated November 4, 2004, from the Registrant to Gary Griffiths. | | S-1 | | 10.37 | | 333-122576 | | 2/4/2005 | | |
| | | | | | |
| 10.24* | | Offer letter dated March 18, 2005, from the Registrant to Ronald D. Verdoorn. | | S-1A/2 | | 10.42 | | 333-122576 | | 5/2/2005 | | |
| | | | | | |
| 10.25 | | Stockholders’ Voting Agreement by and among the Registrant, Rackable Investment LLC, GNJ, Inc., and the founders named therein dated December 23, 2002. | | S-1 | | 10.40 | | 333-122576 | | 2/4/2005 | | |
| | | | | | |
| 10.26* | | Form of Stock Option Agreement under the 2006 New Recruit Equity Incentive Plan. | | 8-K | | 10.2 | | 000-51333 | | 1/30/2006 | | |
94
| | | | | | | | | | | | |
Exhibit
Number | | Exhibit Description | | Incorporated by Reference | | Filing Date | | Filed
Herewith |
| | | Form | | Ex. No. | | File No. | | |
| 10.27* | | Offer letter dated October 28, 2005 from the Registrant to Madhu Ranganathan. | | 10-K | | 10.58 | | 000-51333 | | 2/22/2006 | | |
| | | | | | |
| 10.28* | | 2006 Management Bonus Plan. | | 10-K | | 10.60 | | 000-51333 | | 2/22/2006 | | |
| | | | | | |
| 10.29 | | Amendment to Registration Agreement, dated February 28, 2006, by and between Rackable Systems, Inc., Rackable Investment LLC, Parthenon Investors II, L.P. and the founders named therein. | | S-1/A1 | | 10.8 | | 333-131977 | | 3/1/2006 | | |
| | | | | | |
| 10.30 | | Net Lease Agreement dated June 26, 2006 by and among Rackable Systems, Inc. and Fremont Landing Investors, LLC. | | 8-K | | 10.62 | | 000-51333 | | 8/25/2006 | | |
| | | | | | |
| 10.31* | | Amended and Restated 2006 New Recruit Equity Inventive Plan. | | | | | | | | | | |
| | | | | | |
| 10.32* | | Executive Change in Control Benefit Plan and Form of Participation Notices. | | 8-K | | 10.1 | | 000-51333 | | 9/5/2006 | | |
| | | | | | |
| 10.33* | | Form of Option Agreement and Grant Notices under the 2005 Equity Incentive Plan. | | 8-K | | 10.2 | | 000-51333 | | 9/5/2006 | | |
| | | | | | |
| 10.34* | | Form of Stock Bonus Award Agreement and Grant Notice under the 2005 Equity Incentive Plan. | | 8-K | | 10.3 | | 000-51333 | | 9/5/2006 | | |
| | | | | | |
| 10.35 | | Loan Agreement, dated September 29, 2006, between Rackable Systems, Inc. and HSBC Bank USA, National Association. | | 8-K | | 10.01 | | 000-51333 | | 10/4/2006 | | |
| | | | | | |
| 10.36 | | Revolving Note, dated September 29, 2006 executed by the Company in favor of HSBC Bank USA, National Association. | | 8-K | | 10.02 | | 000-51333 | | 10/4/2006 | | |
| | | | | | |
| 10.37* | | Form of Stock Option Agreement and Grant Notice with Outside Directors under the 2002 Stock Option Plan. | | 10-Q | | 10.10 | | 000-51333 | | 11/14/2006 | | |
| | | | | | |
| 10.38* | | Form of Non-statutory Stock Option Agreement under the 2005 Non-Employee Directors’ Stock Option Plan. | | 10-Q | | 10.11 | | 000-51333 | | 11/14/2006 | | |
| | | | | | |
| 10.39* | | Separation Letter, executed as of December 7, 2006, by and between the Registrant and Tom Gallivan. | | 8-K | | 10.1 | | 000-51333 | | 12/11/2006 | | |
| | | | | | |
| 10.40* | | Retention Agreement, dated January 9, 2007, by and between Rackable Systems, Inc. and Giovanni Coglitore. | | 8-K | | 10.1 | | 000-51333 | | 1/11/2007 | | |
| | | | | | |
| 10.41* | | Retention Bonus Agreement, dated September 12, 2006, by and between Rackable Systems, Inc. and Giovanni Coglitore. | | 8-K | | 10.2 | | 000-51333 | | 1/11/2007 | | |
| | | | | | |
| 10.42* | | First Amendment to Retention Bonus Agreement, dated January 9, 2007, by and between Rackable Systems, Inc. and Giovanni Coglitore. | | 8-K | | 10.3 | | 000-51333 | | 1/11/2007 | | |
95
| | | | | | | | | | | | |
Exhibit
Number | | Exhibit Description | | Incorporated by Reference | | Filing Date | | Filed
Herewith |
| | | Form | | Ex. No. | | File No. | | |
| 10.43* | | Offer Letter, dated August 21, 2006, by and between the Registrant and Charles Boesenberg. | | 10-K | | 10.6 | | 000-51333 | | 2/28/2007 | | |
| | | | | | |
| 10.44* | | Offer Letter, dated November 17, 2006, by and between the Registrant and Mark Barrenechea. | | 10-K | | 10.61 | | 000-51333 | | 2/28/2007 | | |
| | | | | | |
| 10.45* | | Change in Control Severance Benefit Plan. | | 8-K | | 10.1 | | 000-51333 | | 10/6/2006 | | |
| | | | | | |
| 10.46 | | Lease, dated November 1, 2006, between Renco Bayside Investors and the Registrant. | | 8-K | | 10.10 | | 000-51333 | | 11/6/2006 | | |
| | | | | | |
| 10.47* | | Management Bonus Plan for the Second Half of 2007. | | 8-K | | — | | 000-51333 | | 9/8/2007 | | |
| | | | | | |
| 10.48 | | First Amendment to the Employment Agreement, dated September 19, 2007, by and between Rackable Systems, Inc. and Madhu Ranganathan. | | 8-K | | 10.1 | | 000-51333 | | 9/26/2007 | | |
| | | | | | |
| 10.49 | | Second Amendment to Employment Agreement, dated June 28, 2007, by and between Rackable Systems, Inc. and Giovanni Coglitore. | | 10-Q | | 10.7 | | 000-51333 | | 8/9/2007 | | |
| | | | | | |
| 10.50 | | Employment Agreement, dated August 22, 2007, by and between Rackable Systems, Inc. and Maurice Leibenstern | | 10-Q | | 10.5 | | 000-51333 | | 11/8/2007 | | |
| | | | | | |
| 10.51 | | First Amendment to Employment Agreement, dated September 19, 2007, by and between Rackable Systems, Inc. and Maurice Leibenstern | | 10-Q | | 10.6 | | 000-51333 | | 11/8/2007 | | |
| | | | | | |
| 10.52 | | Employment Agreement, dated May 24, 2007, between Rackable Systems Inc and Mark J. Barrenechea | | 8-K | | 10.1 | | 000-51333 | | 5/30/2007 | | |
| | | | | | |
| 10.53* | | Officer Compensation Changes in First Quarter 2007 | | 8-K | | — | | 000-51333 | | 1/31/2007 | | |
| | | | | | |
| 10.54* | | Compensation arrangements in connection with April 29, 2007 management changes | | 8-K | | — | | 000-51333 | | 5/1/2007 | | |
| | | | | | |
| 10.55 | | Waiver and Amendment to Loan Agreement, dated March 31, 2007, between Rackable Systems, Inc. and HSBC Bank, USA National Association. | | 10-Q | | 10.7 | | 000-51333 | | 5/10/2007 | | |
| | | | | | |
| 10.56 | | Change in Compensation for Gautham Sastri | | 8-K | | — | | 000-51333 | | 5/1/2007 | | |
| | | | | | |
| 10.57 | | Separation Agreement, dated May 15, 2007, by and between Rackable Systems, Inc. and Tom Barton | | 8-K | | 10.1 | | 000-51333 | | 5/22/2007 | | |
| | | | | | |
| 10.58 | | Separation Agreement dated May 23, 2007, between Rackable Systems Inc and Todd Ford | | 8-K | | 10.1 | | 000-51333 | | 5/28/2007 | | |
| | | | | | |
| 10.59* | | Form of 2005 Equity Incentive Plan Restricted Stock Unit Grant Notice and Restricted Stock Unit Award Agreement | | 8-K | | 10.1 | | 000-51333 | | 6/8/2007 | | |
| | | | | | |
| 10.60* | | Cash compensation arrangements with the non-employee Directors | | 10-Q | | 10.6 | | 000-51333 | | 8/9/2007 | | |
96
| | | | | | | | | | | | |
Exhibit
Number | | Exhibit Description | | Incorporated by Reference | | Filing Date | | Filed
Herewith |
| | | Form | | Ex. No. | | File No. | | |
| | | | | | |
| 21.1 | | Subsidiaries of the Company. | | | | | | | | | | X |
| | | | | | |
| 23.1 | | Consent of Independent Registered Public Accounting Firm. | | | | | | | | | | X |
| | | | | | |
| 24.1 | | Power of Attorney. (Included on the signature page hereto). | | | | | | | | | | |
| | | | | | |
| 31.1 | | Certification required by Rule 13a-14(a) or Rule 15d-14(a). | | | | | | | | | | X |
| | | | | | |
| 31.2 | | Certification required by Rule 13a-14(a) or Rule 15d-14(a). | | | | | | | | | | X |
| | | | | | |
| 32.1** | | Certifications required by Rule 13a-14(b) or Rule 15d-14(b) and Section 1350 of Chapter 63 of Title 18 of the United States Code (18 U.S.C. §1350) | | | | | | | | | | X |
| * | Indicates a management contract or compensatory plan or arrangement. |
| ** | The certification attached as Exhibit 32.1 accompanies the Annual Report on Form 10-K pursuant to Section 906 of the Sarbanes-Oxley Act of 2002 and shall not be deemed “filed” by Rackable Systems, Inc. for purposes of Section 18 of the Securities Exchange |
97