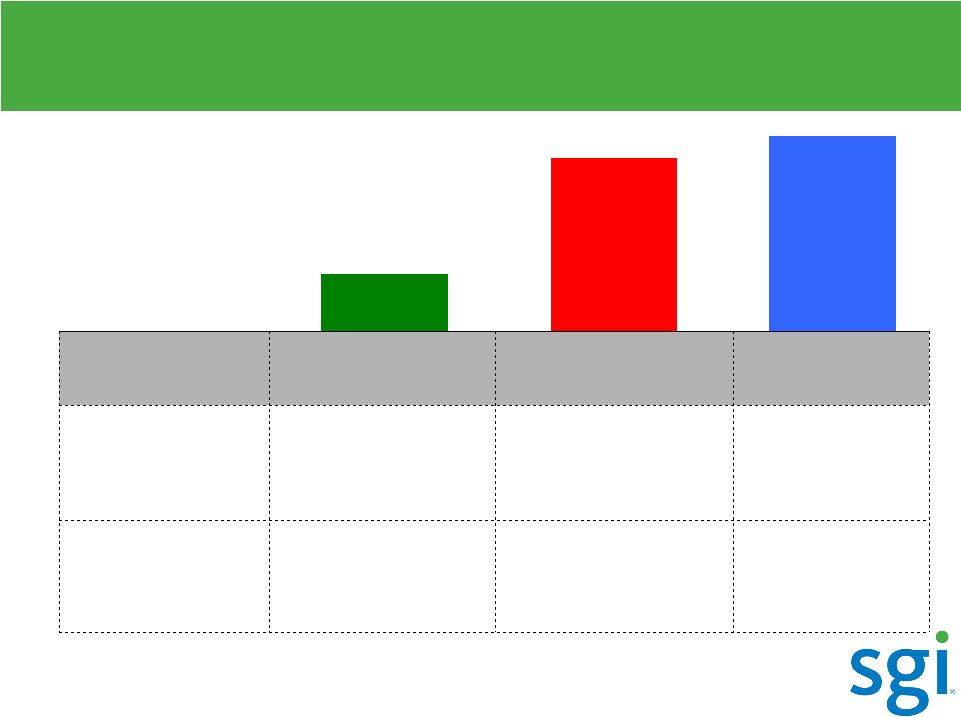
25 © 2010 SGI Proprietary GAAP / Non-GAAP Reconciliation Silicon Graphics International Corp. Q4 FISCAL 2010 FINANCIAL RESULTS RECONCILIATION OF SELECTED GAAP MEASURES TO NON-GAAP MEASURES (1) ($ in thousands, except per share data) Three Months Ended June 25, Three Months Ended March 26, Three Months Ended June 26, Year Ended June 25, 2010 2010 2010 2010 2009 2009 2010 2010 GAAP Adj. Non-GAAP GAAP Adj. Non-GAAP GAAP Adj. Non-GAAP GAAP Adj. Non-GAAP TOTAL REVENUES 101,637 $ 20,568 $ 122,205 $ 107,820 $ 21,109 $ 128,929 $ 58,419 $ 2,058 $ 60,477 $ 403,717 $ 121,619 $ 525,336 $ Included in the above results: SOP 97-2 (now ASC 985-605) (2) (20,568) 20,568 - (21,109) 21,109 - (2,058) 2,058 - (121,619) 121,619 - COST OF REVENUES 82,022 $ 10,867 $ 92,889 $ 78,900 $ 14,567 $ 93,467 $ 53,341 $ (2,052) $ 51,289 $ 314,128 $ 68,048 $ 382,176 $ Included in the above results: SOP 97-2 (now ASC 985-605) (2) (11,368) 11,368 - (15,669) 15,669 - (1,391) 1,391 - (79,004) 79,004 - Amortization of intangible assets (3) 360 (360) - 322 (322) - 875 (875) - 1,313 (1,313) - Inventory step up (4) 15 (15) - 625 (625) - 2,262 (2,262) - 2,722 (2,722) - Stock-based compensation (5) 126 (126) - 155 (155) - 306 (306) - 691 (691) - Excess and obsolete and related (recoveries) (6) - - - - - - - - - 6,230 (6,230) - GROSS PROFIT 19,615 $ 9,701 $ 29,316 $ 28,920 $ 6,542 $ 35,462 $ 5,078 $ 4,110 $ 9,188 $ 89,589 $ 53,571 $ 143,160 $ GROSS MARGIN % 19.3% 24.0% 26.8% 27.5% 8.7% 15.2% 22.2% 27.3% OPERATING EXPENSES 44,291 $ (1,267) $ 43,024 $ 46,165 $ (2,966) $ 43,199 $ 9,127 $ 19,546 $ 28,673 $ 176,239 $ (10,660) $ 165,579 $ Included in the above results: Amortization of intangible assets (3) 1,402 (1,402) - 526 (526) - 270 (270) - 4,986 (4,986) - Stock-based compensation (5) 1,011 (1,011) - 1,006 (1,006) - 1,225 (1,225) - 4,136 (4,136) - Restructuring (7) 1,561 (1,561) - 1,434 (1,434) - 1,270 (1,270) - 5,213 (5,213) - Tradename impairment (8) - - - - - - 2,520 (2,520) - - - - Gain on settlement agreement (9) - - - - - - (5,000) 5,000 - - - - Acquisition related (10) (2,707) 2,707 - - - - (19,831) 19,831 - (3,675) 3,675 - INCOME (LOSS) FROM CONTINUING OPERATIONS (24,676) $ 10,968 $ (13,708) $ (17,245) $ 9,508 $ (7,737) $ (4,049) $ (15,436) $ (19,485) $ (86,650) $ 64,231 $ (22,419) $ OPERATING MARGIN % -24.3% -11.2% -16.0% -6.0% -6.9% -32.2% -21.5% -4.3% OTHER INCOME, Net (3,505) $ - $ (3,505) (2,461) $ - $ (2,461) 1,175 $ - $ 1,175 (6,652) $ - $ (6,652) INCOME TAX EFFECTS: PROVISION/(BENEFIT) (11) (511) $ - $ (511) $ 556 $ - $ 556 $ (2,277) $ 2,568 $ 291 $ (4,441) $ 56 $ (4,385) $ NET INCOME/(LOSS) FROM CONTINUING OPERATIONS (27,670) $ (16,702) $ (20,262) $ (10,754) $ (597) $ (18,601) $ (88,861) $ (24,686) $ NET INCOME/(LOSS) PER SHARE FROM CONTINUING OPERATIONS (0.91) $ (0.55) $ (0.67) $ (0.36) $ (0.02) $ (0.62) $ (2.95) $ (0.82) $ SHARES USED IN COMPUTING NET LOSS PER SHARE 30,121 30,121 30,097 30,097 29,794 29,794 30,130 30,130 |


