Filed by UnitedGlobalCom, Inc. pursuant to
Rule 425 under the Securities Act of 1933
Subject Company: UnitedGlobalCom, Inc.
Commission File No. 000-49658
Subject Company: Liberty Global, Inc.
Registration Statement File No. 333-124583
The following slides were presented at UnitedGlobalCom's First Quarter Conference Call on May 10, 2005.

Searchable text section of graphics shown above
UnitedGlobalCom, Inc.
[GRAPHIC]
First Quarter 2005
Investor Call
May 10, 2005
[LOGO]
[GRAPHIC]
“Safe Harbor”
Safe Harbor Statement Under the Private Securities Litigation Reform Act of 1995:
Forward-Looking Statements: Except for historical information contained herein, this presentation contains forward-looking statements, including guidance given for 2005, expectations about RGU growth, planned increases in the speed of our broadband internet products and anticipated cost savings and synergies from the recent VTR-Métropolis merger. The statement about the Company’s proposed business combination with Liberty Media International (“LMI”) and acquisition of NTL Ireland are also forward-looking statements within the meaning of the Private Securities Litigation Reform Act of 1995. These forward- looking statements involve certain risks and uncertainties that could cause actual results to differ materially from those expressed or implied by these statements. These risks and uncertainties include our ability to complete the proposed merger with LMI by obtaining the approval of holders of a majority of the aggregate voting power of our shares not beneficially owned by LMI, Liberty Media Corporation (“Liberty”) or any of their respective subsidiaries or any of the executive officers of directors of LMI, Liberty or the Company and satisfaction of other conditions necessary to close the merger, regulatory approval for the acquisition of NTL Ireland, continued use by subscribers and potential subscribers of the Company’s services, changes in the technology and competition, our ability to achieve expected operational efficiencies and economies of scale, our ability to generate expected revenue and achieve assumed margins including, to the extent annualized figures imply forward-looking projections, continued performance comparable with the period annualized, as well as other factors detailed from time to time in the Company’s filings with the Securities and Exchange Commission. These forward-looking statements speak only as of the date of this release. The Company expressly disclaims any obligation or undertaking to disseminate any updates or revisions to any guidance and other forward-looking statement contained herein to reflect any change in the Company’s expectations with regard thereto or any change in events, conditions or circumstances on which any such statement is based.
Please refer to the Appendix at the end of this presentation, as well as the Company’s Press Release dated May 10, 2005 and SEC filings, for definitions of the following terms which are used herein including: Operating Cash Flow (OCF), Free Cash Flow, Revenue Generating Units (RGUs), and Average Revenue per Unit (ARPU), as well as a GAAP reconciliation of non-GAAP financial measures.
May 10, 2005 | [LOGO] |
2
Additional Information
Liberty Global, Inc. (“Liberty Global”) has filed a Registration Statement on Form S-4 containing a definitive joint proxy statement/prospectus related to the proposed business combination between LMI and UGC. UGC STOCKHOLDERS AND OTHER INVESTORS ARE URGED TO READ THE DEFINITIVE JOINT PROXY STATEMENT/PROSPECTUS BECAUSE IT CONTAINS IMPORTANT INFORMATION ABOUT THE BUSINESS COMBINATION. Investors may obtain a copy of the definitive joint proxy statement/prospectus and other documents related to the business combination free of charge at the SEC’s website (http://www.sec.gov). In addition, copies of the definitive joint proxy statement/prospectus and other related documents filed by the parties to the merger may be obtained free of charge by directing a request to UnitedGlobalCom, Inc., 4643 South Ulster Street, Suite 1300, Denver, Colorado 80237, Attention: Investor Relations Department, telephone: 303-770-4001.
Participants in Solicitation
The directors and executive officers of UGC and other persons may be deemed to be participants in the solicitation of proxies in respect of the proposed business combination. Information regarding UGC’s directors and executive officers and other participants in the proxy solicitation and a description of their direct and indirect interests, by security holdings or otherwise, is available in the definitive joint proxy statement/prospectus contained in the above-referenced Registration Statement.
3
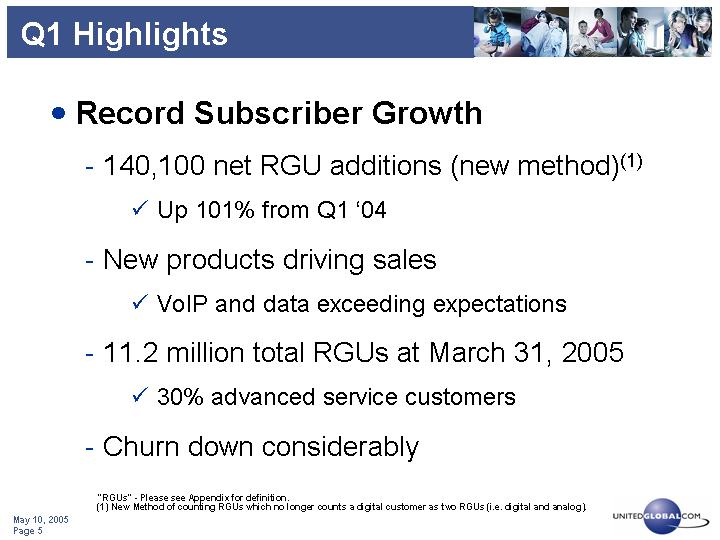
Q1 Highlights
• Record Subscriber Growth
• 140,100 net RGU additions (new method)(1)
• Up 101% from Q1 ‘04
• New products driving sales
• VoIP and data exceeding expectations
• 11.2 million total RGUs at March 31, 2005
• 30% advanced service customers
• Churn down considerably
“RGUs” - - Please see Appendix for definition.
(1) New Method of counting RGUs which no longer counts a digital customer as two RGUs (i.e. digital and analog).
5
• Financial Targets Exceeded
• Revenue up 38% on currency-adjusted basis(1)
• vs. 20% full-year guidance target
• OCF up 28% (currency-adjusted)
• vs. 20% full-year guidance target
• Over $1.1 billion annualized OCF
• 2005 Guidance Targets Confirmed
“Operating Cash Flow” - Please see Appendix for a definition and reconciliation with net income (loss).
(1) Currency-adjusted to eliminate foreign exchange rate (FX) differences between the periods for all markets. See Appendix for detailed calculations.
6
• New Product Launches on Track
• Digital phone (VoIP) now in three markets
• 140,000 sales and 85,000 Net Adds since launch
• “Extreme” data products rolling out
• 10-26 Mbps speeds (NL, BE, NO, SW, SK)
• Accelerated digital conversion in NL progressing
• Working towards Q4 launch
• Off-net DSL and MVNO commercial-ready
7
• Other Key Initiatives
• VTR-Metropolis merger closed in Chile
• NTL Ireland transaction announced
• Dutch programming plans progressing
• Champions League extended for 3 years
• Canal+ set to close pending regulatory approval
• Liberty Global transaction
• Shareholder vote set for June 14, 2005
8
RGU Results
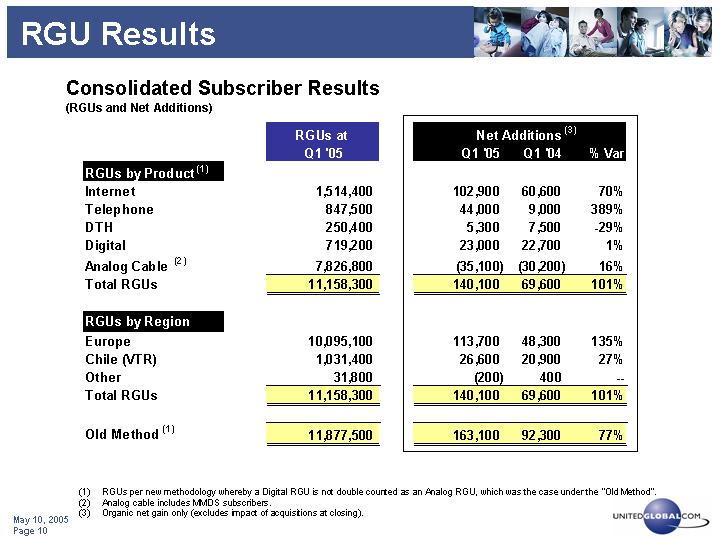
Consolidated Subscriber Results
(RGUs and Net Additions)
|
| RGUs at |
| Net Additions (3) |
| ||||
|
| Q1 ‘05 |
| Q1 ‘05 |
| Q1 ‘04 |
| % Var |
|
RGUs by Product (1) |
|
|
|
|
|
|
|
|
|
Internet |
| 1,514,400 |
| 102,900 |
| 60,600 |
| 70 | % |
Telephone |
| 847,500 |
| 44,000 |
| 9,000 |
| 389 | % |
DTH |
| 250,400 |
| 5,300 |
| 7,500 |
| -29 | % |
Digital |
| 719,200 |
| 23,000 |
| 22,700 |
| 1 | % |
Analog Cable (2) |
| 7,826,800 |
| (35,100 | ) | (30,200 | ) | 16 | % |
Total RGUs |
| 11,158,300 |
| 140,100 |
| 69,600 |
| 101 | % |
|
|
|
|
|
|
|
|
|
|
RGUs by Region |
|
|
|
|
|
|
|
|
|
Europe |
| 10,095,100 |
| 113,700 |
| 48,300 |
| 135 | % |
Chile (VTR) |
| 1,031,400 |
| 26,600 |
| 20,900 |
| 27 | % |
Other |
| 31,800 |
| (200 | ) | 400 |
| — |
|
Total RGUs |
| 11,158,300 |
| 140,100 |
| 69,600 |
| 101 | % |
|
|
|
|
|
|
|
|
|
|
Old Method (1) |
| 11,877,500 |
| 163,100 |
| 92,300 |
| 77 | % |
(1) RGUs per new methodology whereby a Digital RGU is not double counted as an Analog RGU, which was the case under the “Old Method”.
(2) Analog cable includes MMDS subscribers.
(3) Organic net gain only (excludes impact of acquisitions at closing).
10
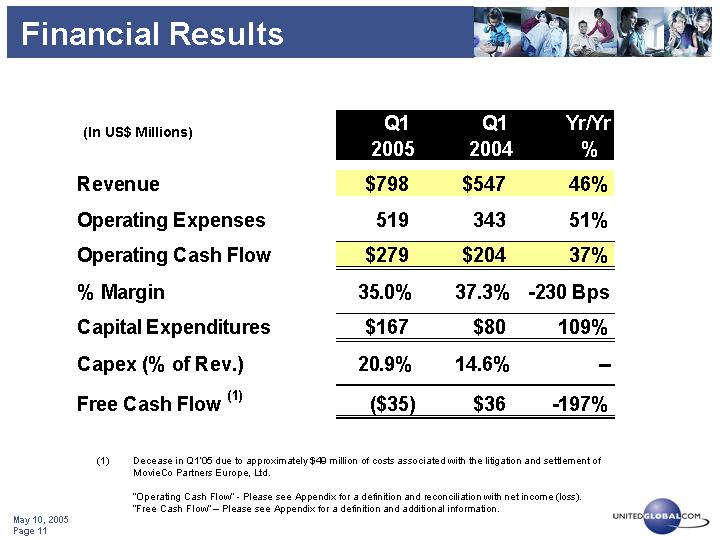
Financial Results
(In US$ Millions) |
| Q1 |
| Q1 |
| Yr/Yr |
| ||
|
|
|
|
|
|
|
| ||
Revenue |
| $ | 798 |
| $ | 547 |
| 46 | % |
|
|
|
|
|
|
|
| ||
Operating Expenses |
| 519 |
| 343 |
| 51 | % | ||
|
|
|
|
|
|
|
| ||
Operating Cash Flow |
| $ | 279 |
| $ | 204 |
| 37 | % |
|
|
|
|
|
|
|
| ||
% Margin |
| 35.0 | % | 37.3 | % | -230 Bps |
| ||
|
|
|
|
|
|
|
| ||
Capital Expenditures |
| $ | 167 |
| $ | 80 |
| 109 | % |
|
|
|
|
|
|
|
| ||
Capex (% of Rev.) |
| 20.9 | % | 14.6 | % | — |
| ||
|
|
|
|
|
|
|
| ||
Free Cash Flow (1) |
| $ | (35 | ) | $ | 36 |
| -197 | % |
(1) Decease in Q1’05 due to approximately $49 million of costs associated with the litigation and settlement of MovieCo Partners Europe, Ltd.
“Operating Cash Flow” - Please see Appendix for a definition and reconciliation with net income (loss).
“Free Cash Flow” – Please see Appendix for a definition and additional information.
11
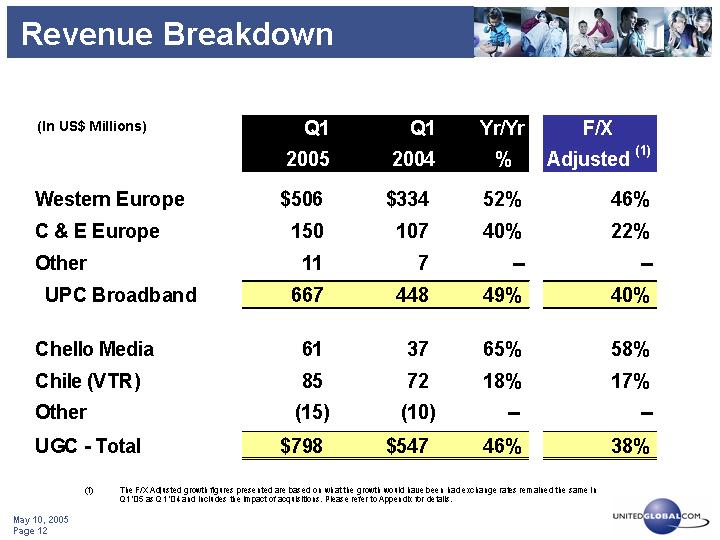
Revenue Breakdown
(In US$ Millions) |
| Q1 |
| Q1 |
| Yr/Yr |
| F/X |
| ||
|
|
|
|
|
|
|
|
|
| ||
Western Europe |
| $ | 506 |
| $ | 334 |
| 52 | % | 46 | % |
|
|
|
|
|
|
|
|
|
| ||
C & E Europe |
| 150 |
| 107 |
| 40 | % | 22 | % | ||
|
|
|
|
|
|
|
|
|
| ||
Other |
| 11 |
| 7 |
| — |
| — |
| ||
|
|
|
|
|
|
|
|
|
| ||
UPC Broadband |
| 667 |
| 448 |
| 49 | % | 40 | % | ||
|
|
|
|
|
|
|
|
|
| ||
Chello Media |
| 61 |
| 37 |
| 65 | % | 58 | % | ||
|
|
|
|
|
|
|
|
|
| ||
Chile (VTR) |
| 85 |
| 72 |
| 18 | % | 17 | % | ||
|
|
|
|
|
|
|
|
|
| ||
Other |
| (15 | ) | (10 | ) | — |
| — |
| ||
|
|
|
|
|
|
|
|
|
| ||
UGC - Total |
| $ | 798 |
| $ | 547 |
| 46 | % | 38 | % |
(1) The F/X Adjusted growth figures presented are based on what the growth would have been had exchange rates remained the same in Q1 ‘05 as Q1 ‘04 and includes the impact of acquisitions. Please refer to Appendix for details.
12
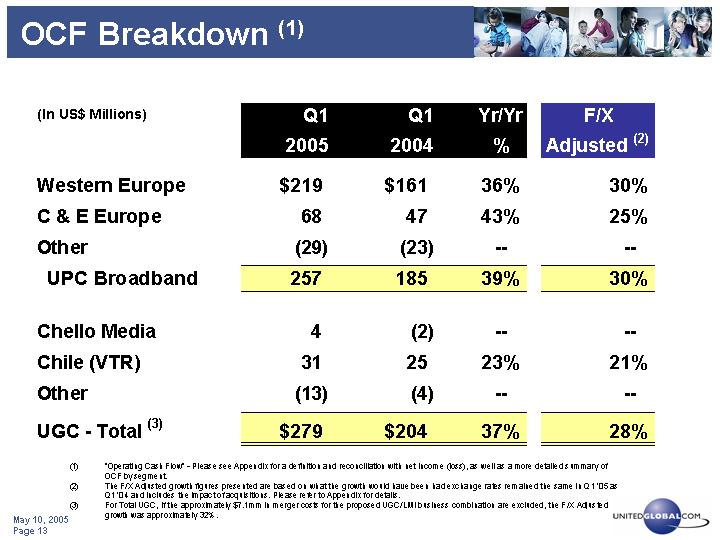
OCF Breakdown (1)
(In US$ Millions) |
| Q1 |
| Q1 |
| Yr/Yr |
| F/X |
| ||
|
|
|
|
|
|
|
|
|
| ||
Western Europe |
| $ | 219 |
| $ | 161 |
| 36 | % | 30 | % |
|
|
|
|
|
|
|
|
|
| ||
C & E Europe |
| 68 |
| 47 |
| 43 | % | 25 | % | ||
|
|
|
|
|
|
|
|
|
| ||
Other |
| (29 | ) | (23 | ) | — |
| — |
| ||
|
|
|
|
|
|
|
|
|
| ||
UPC Broadband |
| 257 |
| 185 |
| 39 | % | 30 | % | ||
|
|
|
|
|
|
|
|
|
| ||
Chello Media |
| 4 |
| (2 | ) | — |
| — |
| ||
|
|
|
|
|
|
|
|
|
| ||
Chile (VTR) |
| 31 |
| 25 |
| 23 | % | 21 | % | ||
|
|
|
|
|
|
|
|
|
| ||
Other |
| (13 | ) | (4 | ) | — |
| — |
| ||
|
|
|
|
|
|
|
|
|
| ||
UGC - Total (3) |
| $ | 279 |
| $ | 204 |
| 37 | % | 28 | % |
(1) “Operating Cash Flow” - Please see Appendix for a definition and reconciliation with net income (loss), as well as a more detailed summary of OCF by segment.
(2) The F/X Adjusted growth figures presented are based on what the growth would have been had exchange rates remained the same in Q1 ‘05 as Q1 ‘04 and includes the impact of acquisitions. Please refer to Appendix for details.
(3) For Total UGC, if the approximately $7.1mm in merger costs for the proposed UGC/LMI business combination are excluded, the F/X Adjusted growth was approximately 32%.
13
Financial Results
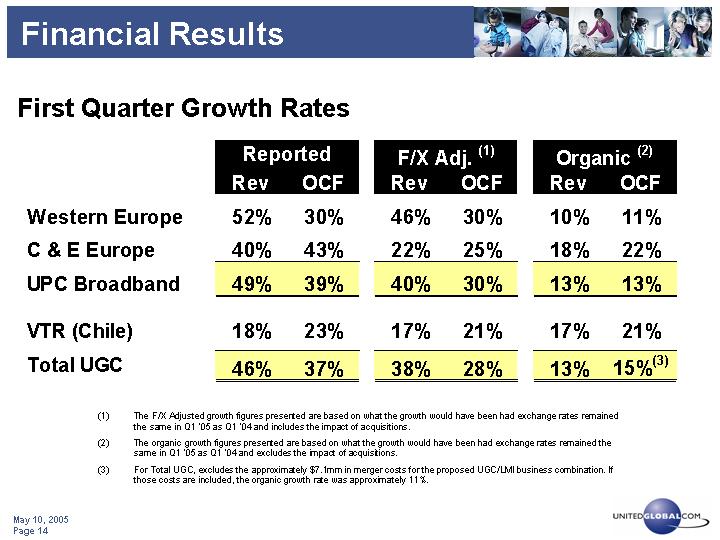
First Quarter Growth Rates
|
| Reported |
| F/X Adj. (1) |
| Organic (2) |
| ||||||
|
| Rev |
| OCF |
| Rev |
| OCF |
| Rev |
| OCF |
|
|
|
|
|
|
|
|
|
|
|
|
|
|
|
Western Europe |
| 52 | % | 30 | % | 46 | % | 30 | % | 10 | % | 11 | % |
|
|
|
|
|
|
|
|
|
|
|
|
|
|
C & E Europe |
| 40 | % | 43 | % | 22 | % | 25 | % | 18 | % | 22 | % |
|
|
|
|
|
|
|
|
|
|
|
|
|
|
UPC Broadband |
| 49 | % | 39 | % | 40 | % | 30 | % | 13 | % | 13 | % |
|
|
|
|
|
|
|
|
|
|
|
|
|
|
VTR (Chile) |
| 18 | % | 23 | % | 17 | % | 21 | % | 17 | % | 21 | % |
|
|
|
|
|
|
|
|
|
|
|
|
|
|
Total UGC |
| 46 | % | 37 | % | 38 | % | 28 | % | 13 | % | 15 | %(3) |
(1) The F/X Adjusted growth figures presented are based on what the growth would have been had exchange rates remained the same in Q1 ‘05 as Q1 ‘04 and includes the impact of acquisitions.
(2) The organic growth figures presented are based on what the growth would have been had exchange rates remained the same in Q1 ‘05 as Q1 ‘04 and excludes the impact of acquisitions.
(3) For Total UGC, excludes the approximately $7.1mm in merger costs for the proposed UGC/LMI business combination. If those costs are included, the organic growth rate was approximately 11%.
14
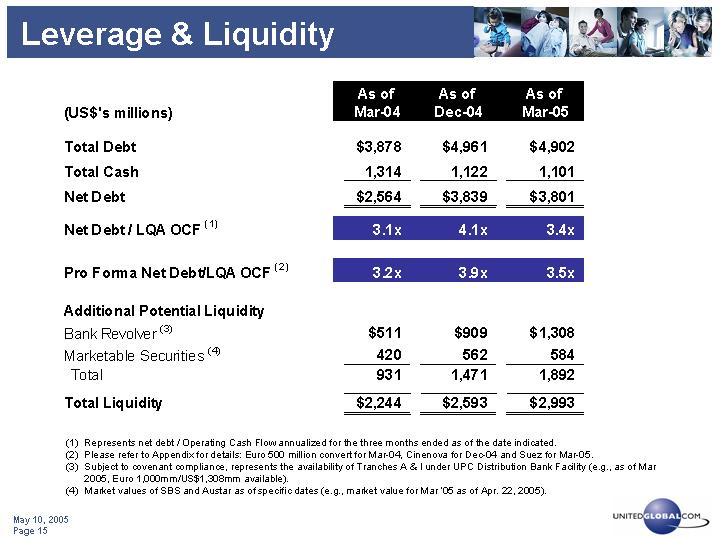
Leverage & Liquidity
(US$’s millions) |
| As of |
| As of |
| As of |
| |||
|
|
|
|
|
|
|
| |||
Total Debt |
| $ | 3,878 |
| $ | 4,961 |
| $ | 4,902 |
|
|
|
|
|
|
|
|
| |||
Total Cash |
| 1,314 |
| 1,122 |
| 1,101 |
| |||
|
|
|
|
|
|
|
| |||
Net Debt |
| $ | 2,564 |
| $ | 3,839 |
| $ | 3,801 |
|
|
|
|
|
|
|
|
| |||
Net Debt / LQA OCF (1) |
| 3.1 | x | 4.1 | x | 3.4 | x | |||
|
|
|
|
|
|
|
| |||
Pro Forma Net Debt/LQA OCF (2) |
| 3.2 | x | 3.9 | x | 3.5 | x | |||
|
|
|
|
|
|
|
| |||
Additional Potential Liquidity |
|
|
|
|
|
|
| |||
Bank Revolver (3) |
| $ | 511 |
| $ | 909 |
| $ | 1,308 |
|
Marketable Securities (4) |
| 420 |
| 562 |
| 584 |
| |||
Total |
| 931 |
| 1,471 |
| 1,892 |
| |||
|
|
|
|
|
|
|
| |||
Total Liquidity |
| $ | 2,244 |
| $ | 2,593 |
| $ | 2,993 |
|
(1) Represents net debt / Operating Cash Flow annualized for the three months ended as of the date indicated.
(2) Please refer to Appendix for details: Euro 500 million convert for Mar-04, Cinenova for Dec-04 and Suez for Mar-05.
(3) Subject to covenant compliance, represents the availability of Tranches A & I under UPC Distribution Bank Facility (e.g., as of Mar 2005, Euro 1,000mm/US$1,308mm available).
(4) Market values of SBS and Austar as of specific dates (e.g., market value for Mar ‘05 as of Apr. 22, 2005).
15
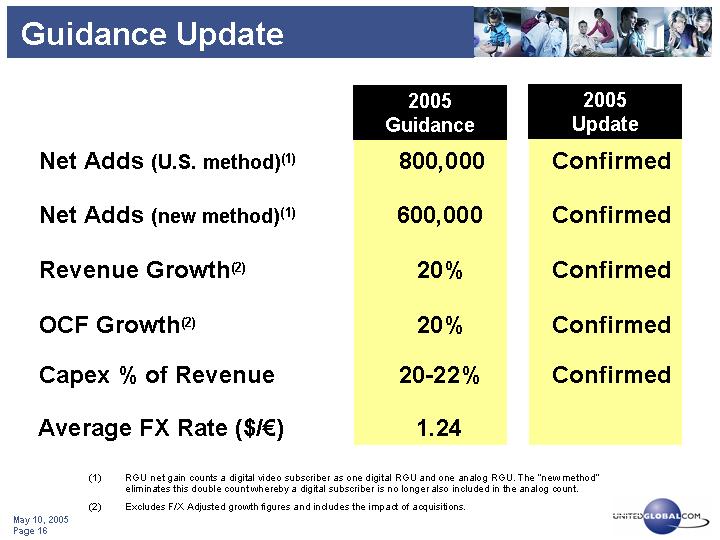
Guidance Update
|
| 2005 |
| 2005 |
|
|
|
|
|
|
|
Net Adds (U.S. method)(1) |
| 800,000 |
| Confirmed |
|
|
|
|
|
|
|
Net Adds (new method)(1) |
| 600,000 |
| Confirmed |
|
|
|
|
|
|
|
Revenue Growth(2) |
| 20 | % | Confirmed |
|
|
|
|
|
|
|
OCF Growth(2) |
| 20 | % | Confirmed |
|
|
|
|
|
|
|
Capex % of Revenue |
| 20-22 | % | Confirmed |
|
|
|
|
|
|
|
Average FX Rate ($/€) |
| 1.24 |
|
|
|
(1) RGU net gain counts a digital video subscriber as one digital RGU and one analog RGU. The “new method” eliminates this double count whereby a digital subscriber is no longer also included in the analog count.
(2) Excludes F/X Adjusted growth figures and includes the impact of acquisitions.
16
Digital Migration in Holland
• What is the Plan?
• Aggressively migrate all analog cable customers in the Netherlands to digital platform
• Roll-out scheduled for Q4 2005
• Over 2 million digital boxes
• Why?
• Reclaim digital high ground
• Gateway for new service delivery
• Favorable economics
18
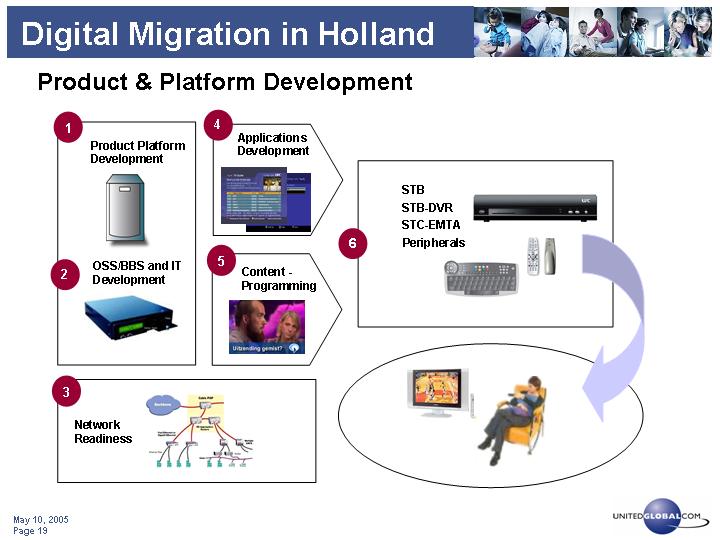
Product & Platform Development
Product Platform Development
[GRAPHIC]
OSS/BBS and IT Development
[GRAPHIC]
Network Readiness
[GRAPHIC]
Applications Development
[GRAPHIC]
Content - Programming
[GRAPHIC]
STB STB-DVR STC-EMTA Peripherals
[GRAPHIC]
[GRAPHIC]
19
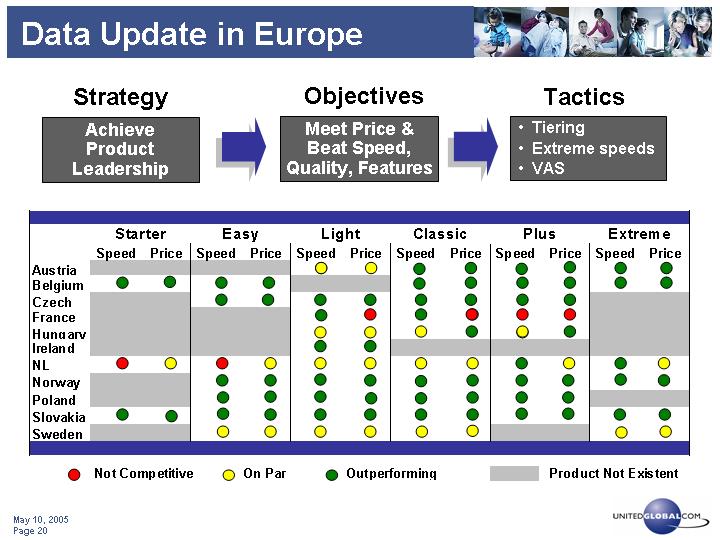
Data Update in Europe
Strategy |
| Objectives |
| Tactics |
|
|
|
|
|
|
|
Achieve |
| Meet Price & |
| • Tiering • Extreme speeds • VAS |
|
|
| Starter |
| Easy |
| Light |
| Classic |
| Plus |
| Extreme | ||||||||||||
|
| Speed |
| Price |
| Speed |
| Price |
| Speed |
| Price |
| Speed |
| Price |
| Speed |
| Price |
| Speed |
| Price |
Austria |
|
|
|
|
|
|
|
|
|
|
|
|
|
|
|
|
|
|
|
|
|
|
|
|
Belgium |
|
|
|
|
|
|
|
|
|
|
|
|
|
|
|
|
|
|
|
|
|
|
|
|
Czech |
|
|
|
|
|
|
|
|
|
|
|
|
|
|
|
|
|
|
|
|
|
|
|
|
France |
|
|
|
|
|
|
|
|
|
|
|
|
|
|
|
|
|
|
|
|
|
|
|
|
Hungary |
|
|
|
|
|
|
|
|
|
|
|
|
|
|
|
|
|
|
|
|
|
|
|
|
Ireland |
|
|
|
|
|
|
|
|
|
|
|
|
|
|
|
|
|
|
|
|
|
|
|
|
NL |
|
|
|
|
|
|
|
|
|
|
|
|
|
|
|
|
|
|
|
|
|
|
|
|
Norway |
|
|
|
|
|
|
|
|
|
|
|
|
|
|
|
|
|
|
|
|
|
|
|
|
Poland |
|
|
|
|
|
|
|
|
|
|
|
|
|
|
|
|
|
|
|
|
|
|
|
|
Slovakia |
|
|
|
|
|
|
|
|
|
|
|
|
|
|
|
|
|
|
|
|
|
|
|
|
Sweden |
|
|
|
|
|
|
|
|
|
|
|
|
|
|
|
|
|
|
|
|
|
|
|
|
|
|
|
| Product Not Existent |
20
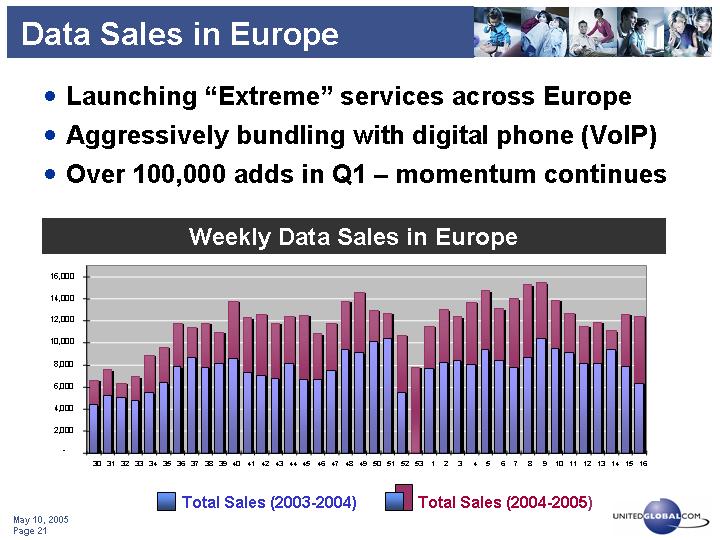
Data Sales in Europe
• Launching “Extreme” services across Europe
• Aggressively bundling with digital phone (VoIP)
• Over 100,000 adds in Q1 – momentum continues
Weekly Data Sales in Europe
[CHART]
21
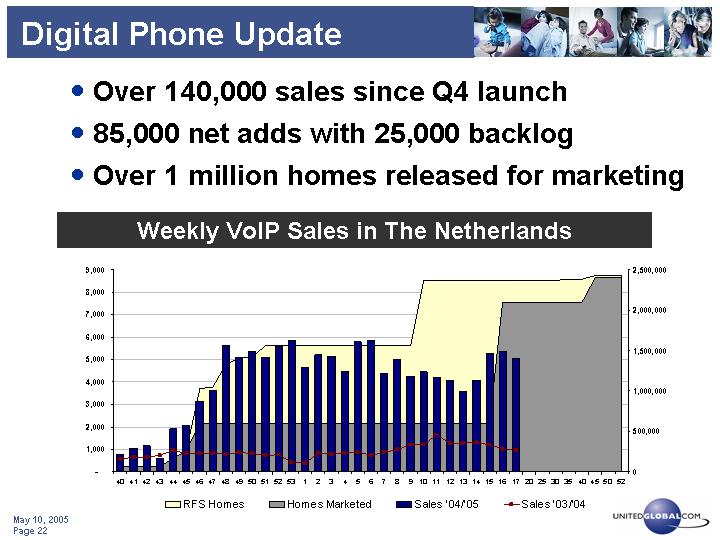
Digital Phone Update
• Over 140,000 sales since Q4 launch
• 85,000 net adds with 25,000 backlog
• Over 1 million homes released for marketing
Weekly VoIP Sales in The Netherlands
[CHART]
22
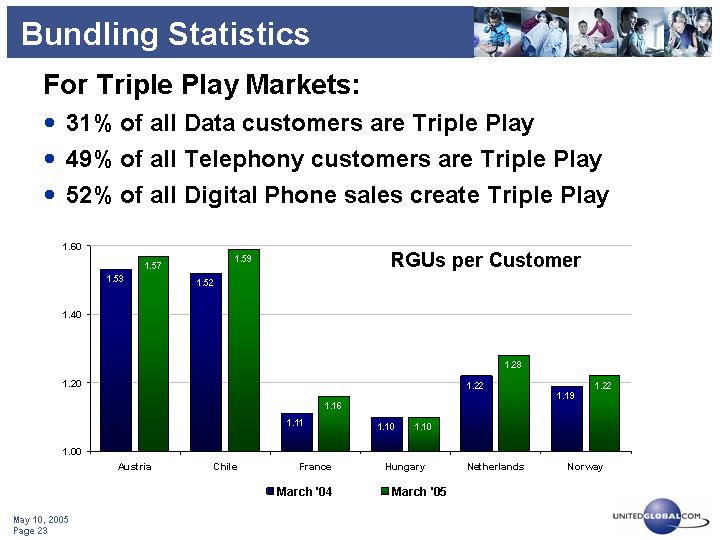
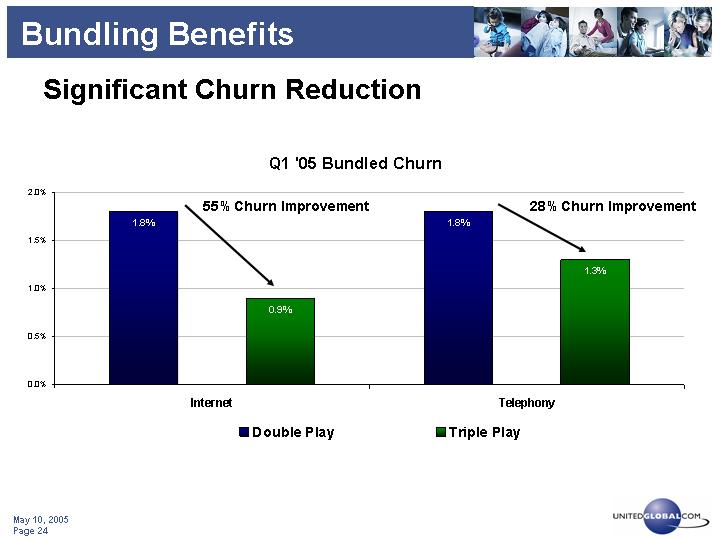
Bundling Statistics
For Triple Play Markets:
• 31% of all Data customers are Triple Play
• 49% of all Telephony customers are Triple Play
• 52% of all Digital Phone sales create Triple Play
RGUs per Customern
[CHART]
23
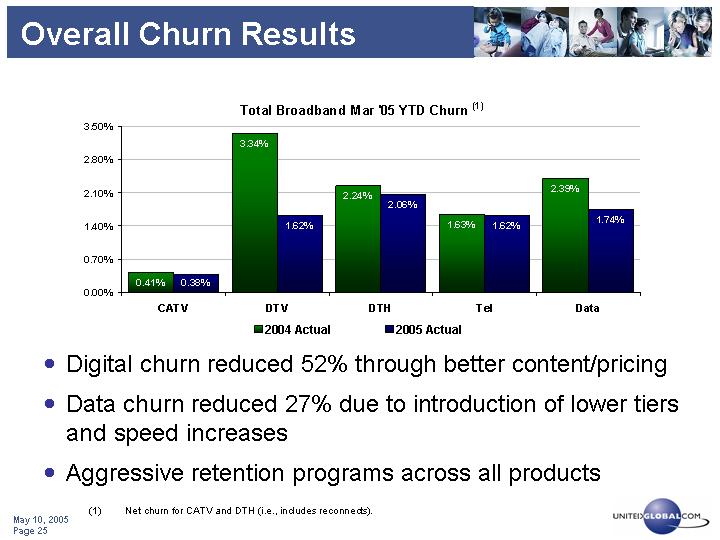
Overall Churn Results
Total Broadband Mar '05 YTD Churn (1)
[CHART]
• Digital churn reduced 52% through better content/pricing
• Data churn reduced 27% due to introduction of lower tiers and speed increases
• Aggressive retention programs across all products
(1) Net churn for CATV and DTH (i.e., includes reconnects).
25
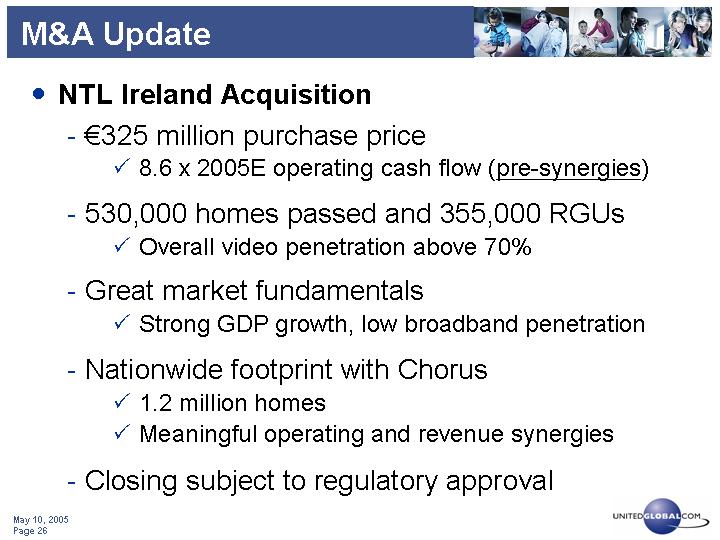
M&A Update
• NTL Ireland Acquisition
• €325 million purchase price
• 8.6 x 2005E operating cash flow (pre-synergies)
• 530,000 homes passed and 355,000 RGUs
• Overall video penetration above 70%
• Great market fundamentals
• Strong GDP growth, low broadband penetration
• Nationwide footprint with Chorus
• 1.2 million homes
• Meaningful operating and revenue synergies
• Closing subject to regulatory approval
26
Conclusions
• Solid Q1 Results Across the Board
• 2005 Guidance Targets Confirmed
• Continued Focus on Operating Efficiency, Capital Discipline, and Execution
• Exploiting Strategic Opportunities Wisely, Acquisition Pipeline Active
27
Appendix
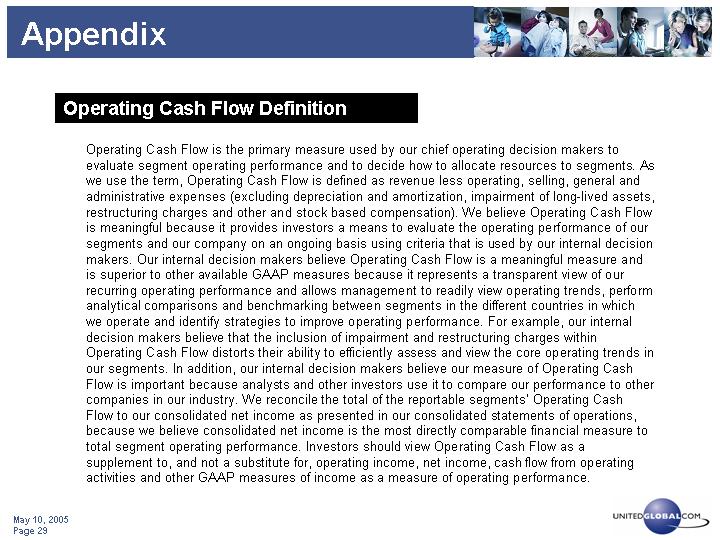
Operating Cash Flow Definition
Operating Cash Flow is the primary measure used by our chief operating decision makers to evaluate segment operating performance and to decide how to allocate resources to segments. As we use the term, Operating Cash Flow is defined as revenue less operating, selling, general and administrative expenses (excluding depreciation and amortization, impairment of long-lived assets, restructuring charges and other and stock based compensation). We believe Operating Cash Flow is meaningful because it provides investors a means to evaluate the operating performance of our segments and our company on an ongoing basis using criteria that is used by our internal decision makers. Our internal decision makers believe Operating Cash Flow is a meaningful measure and is superior to other available GAAP measures because it represents a transparent view of our recurring operating performance and allows management to readily view operating trends, perform analytical comparisons and benchmarking between segments in the different countries in which we operate and identify strategies to improve operating performance. For example, our internal decision makers believe that the inclusion of impairment and restructuring charges within Operating Cash Flow distorts their ability to efficiently assess and view the core operating trends in our segments. In addition, our internal decision makers believe our measure of Operating Cash Flow is important because analysts and other investors use it to compare our performance to other companies in our industry. We reconcile the total of the reportable segments’ Operating Cash Flow to our consolidated net income as presented in our consolidated statements of operations, because we believe consolidated net income is the most directly comparable financial measure to total segment operating performance. Investors should view Operating Cash Flow as a supplement to, and not a substitute for, operating income, net income, cash flow from operating activities and other GAAP measures of income as a measure of operating performance.
May 10, 2005 | [LOGO] |
29
Other Definitions
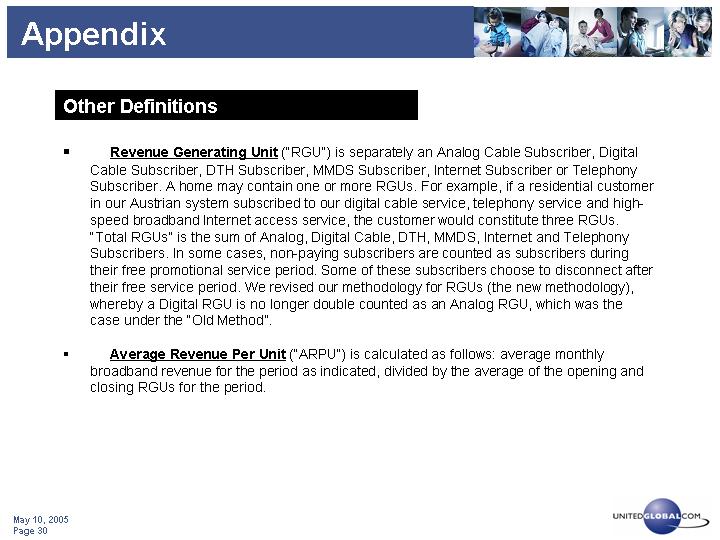
• Revenue Generating Unit (“RGU”) is separately an Analog Cable Subscriber, Digital Cable Subscriber, DTH Subscriber, MMDS Subscriber, Internet Subscriber or Telephony Subscriber. A home may contain one or more RGUs. For example, if a residential customer in our Austrian system subscribed to our digital cable service, telephony service and high-speed broadband Internet access service, the customer would constitute three RGUs. “Total RGUs” is the sum of Analog, Digital Cable, DTH, MMDS, Internet and Telephony Subscribers. In some cases, non-paying subscribers are counted as subscribers during their free promotional service period. Some of these subscribers choose to disconnect after their free service period. We revised our methodology for RGUs (the new methodology), whereby a Digital RGU is no longer double counted as an Analog RGU, which was the case under the “Old Method”.
• Average Revenue Per Unit (“ARPU”) is calculated as follows: average monthly broadband revenue for the period as indicated, divided by the average of the opening and closing RGUs for the period.
30
Non-GAAP Reconciliations
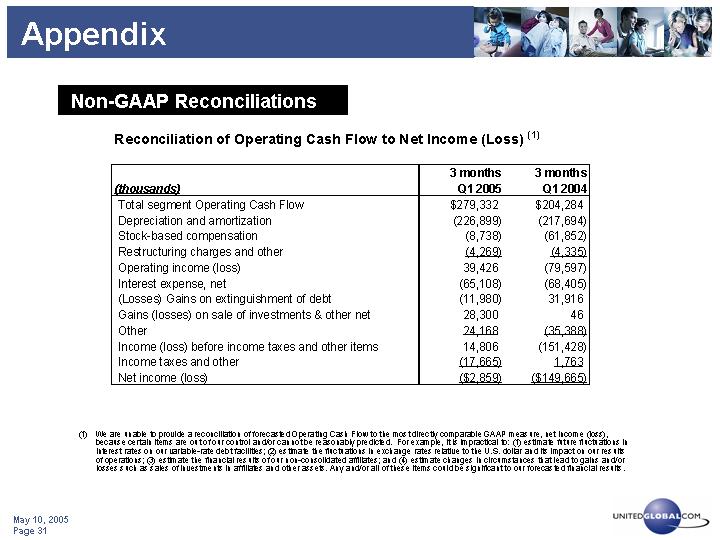
Reconciliation of Operating Cash Flow to Net Income (Loss) (1)
(thousands) |
| 3 months |
| 3 months |
| ||||
Total segment Operating Cash Flow |
| $ | 279,332 |
| $ | 204,284 |
| ||
Depreciation and amortization |
| (226,899 | ) | (217,694 | ) | ||||
Stock-based compensation |
| (8,738 | ) | (61,852 | ) | ||||
Restructuring charges and other |
| (4,269 | ) | (4,335 | ) | ||||
Operating income (loss) |
| 39,426 |
| (79,597 | ) | ||||
Interest expense, net |
| (65,108 | ) | (68,405 | ) | ||||
(Losses) Gains on extinguishment of debt |
| (11,980 | ) | 31,916 |
| ||||
Gains (losses) on sale of investments & other net |
| 28,300 |
| 46 |
| ||||
Other |
| 24,168 |
| (35,388 | ) | ||||
Income (loss) before income taxes and other items |
| 14,806 |
| (151,428 | ) | ||||
Income taxes and other |
| (17,665 | ) | 1,763 |
| ||||
Net income (loss) |
| $ | (2,859 | ) | $ | (149,665 | ) | ||
(1) We are unable to provide a reconciliation of forecasted Operating Cash Flow to the most directly comparable GAAP measure, net income (loss), because certain items are out of our control and/or cannot be reasonably predicted. For example, it is impractical to: (1) estimate future fluctuations in interest rates on our variable-rate debt facilities; (2) estimate the fluctuations in exchange rates relative to the U.S. dollar and its impact on our results of operations; (3) estimate the financial results of our non-consolidated affiliates; and (4) estimate changes in circumstances that lead to gains and/or losses such as sales of investments in affiliates and other assets. Any and/or all of these items could be significant to our forecasted financial results.
31
Non-GAAP Reconciliations
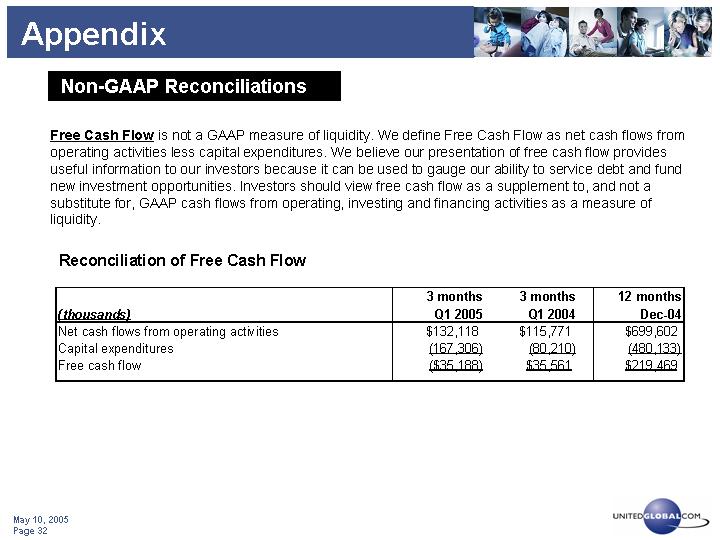
Free Cash Flow is not a GAAP measure of liquidity. We define Free Cash Flow as net cash flows from operating activities less capital expenditures. We believe our presentation of free cash flow provides useful information to our investors because it can be used to gauge our ability to service debt and fund new investment opportunities. Investors should view free cash flow as a supplement to, and not a substitute for, GAAP cash flows from operating, investing and financing activities as a measure of liquidity.
Reconciliation of Free Cash Flow
(thousands) |
| 3 months |
| 3 months |
| 12 months |
| |||
Net cash flows from operating activities |
| $ | 132,118 |
| $ | 115,771 |
| $ | 699,602 |
|
Capital expenditures |
| (167,306 | ) | (80,210 | ) | (480,133 | ) | |||
Free cash flow |
| $ | (35,188 | ) | $ | 35,561 |
| $ | 219,469 |
|
32
Pro-Forma Leverage
|
| Q4 ‘03 |
| Q1 ‘04 |
| Q2 ‘04 |
| Q3 ‘04 |
| Q4 ‘04 |
| Q1 ‘05 |
| ||||||
Debt Summary: |
|
|
|
|
|
|
|
|
|
|
|
|
| ||||||
UPC Broadband Bank Facility |
| $ | 3,698,586 |
| $ | 3,584,272 |
| $ | 3,224,816 |
| $ | 3,495,406 |
| $ | 3,927,830 |
| $ | 3,985,596 |
|
UGC Convertible Notes |
| — |
| — |
| 553,325 |
| 557,454 |
| 655,809 |
| 588,997 |
| ||||||
UPC Polska Notes |
| 317,372 |
| — |
| — |
| — |
| — |
| — |
| ||||||
UPC Polska 2007 Notes |
| — |
| 101,701 |
| 101,701 |
| — |
| — |
| — |
| ||||||
VTR Bank Facility |
| 123,000 |
| 93,198 |
| 88,586 |
| 83,972 |
| 97,941 |
| 93,236 |
| ||||||
Telenet Notes |
| — |
| — |
| — |
| — |
| 87,821 |
| 72,269 |
| ||||||
Old UGC Senior Notes |
| 24,627 |
| 24,627 |
| 24,627 |
| 24,627 |
| 24,627 |
| — |
| ||||||
Notes payable, related party |
| 102,728 |
| — |
| — |
| — |
| 108,414 |
| 103,990 |
| ||||||
Subject to compromise: short term debt |
| 5,099 |
| — |
| — |
| — |
| — |
| — |
| ||||||
Other |
| 80,493 |
| 74,198 |
| 55,980 |
| 60,653 |
| 58,880 |
| 58,286 |
| ||||||
Total Debt |
| $ | 4,351,905 |
| $ | 3,877,996 |
| $ | 4,049,035 |
| $ | 4,222,112 |
| $ | 4,961,322 |
| $ | 4,902,374 |
|
Less: UPC Polska notes (1) |
| (322,471 | ) | — |
| — |
| — |
| — |
| — |
| ||||||
Add: UPC Polska note (2) |
| 101,701 |
| — |
| — |
| — |
| — |
| — |
| ||||||
Less: Notes Payable, related party (3) |
| (102,728 | ) | — |
| — |
| — |
| — |
| — |
| ||||||
Less: VTR GlobalCom (4) |
| (25,233 | ) | — |
| — |
| — |
| — |
| — |
| ||||||
Add: Euro Convertible (5) |
| 630,279 |
| 605,400 |
| — |
| — |
| — |
| — |
| ||||||
Add: Noos Acquisition (6) |
| — |
| — |
| 127,042 |
| — |
| — |
| — |
| ||||||
Pro-Forma Debt |
| $ | 4,633,453 |
| $ | 4,483,396 |
| $ | 4,176,077 |
| $ | 4,222,112 |
| $ | 4,961,322 |
| $ | 4,902,374 |
|
|
|
|
|
|
|
|
|
|
|
|
|
|
| ||||||
Cash Summary |
|
|
|
|
|
|
|
|
|
|
|
|
| ||||||
Cash & cash equivalents |
| $ | 310,361 |
| $ | 1,275,785 |
| $ | 1,368,677 |
| $ | 981,638 |
| $ | 1,028,993 |
| $ | 1,066,084 |
|
Restricted cash |
| 25,052 |
| 18,169 |
| 20,237 |
| 23,367 |
| 43,640 |
| 16,866 |
| ||||||
Short-term liquid investments |
| 2,134 |
| 19,621 |
| 207,194 |
| 111,536 |
| 48,965 |
| 18,361 |
| ||||||
Total Cash |
| 337,547 |
| 1,313,575 |
| 1,596,108 |
| 1,116,541 |
| 1,121,598 |
| 1,101,311 |
| ||||||
Rights Offering and Liberty Preemptive Rights (3) |
| 1,075,385 |
| — |
| — |
| — |
| — |
| — |
| ||||||
Less: VTR GlobalCom (4) |
| (25,233 | ) | — |
| — |
| — |
| — |
| — |
| ||||||
Less: UPC Polska payment (2) |
| (81,361 | ) | — |
| — |
| — |
| — |
| — |
| ||||||
Add: Euro Convertible (5) |
| 617,673 |
| 593,292 |
| — |
| — |
| — |
| — |
| ||||||
Less: Noos Acquisition (6) |
| — |
| — |
| (514,130 | ) | — |
| — |
| — |
| ||||||
Less: Cinenova/Movieco Settlement (7) |
| — |
| — |
| — |
| — |
| (70,651 | ) | — |
| ||||||
Less: Suez’ minority interest in UPC France (8) |
| — |
| — |
| — |
| — |
| — |
| $ | (116,189 | ) | |||||
Pro-Forma Cash |
| $ | 1,924,011 |
| $ | 1,906,867 |
| $ | 1,081,978 |
| $ | 1,116,541 |
| $ | 1,050,947 |
| $ | 985,122 |
|
|
|
|
|
|
|
|
|
|
|
|
|
|
| ||||||
Net Debt |
| $ | 4,014,358 |
| $ | 2,564,421 |
| $ | 2,452,927 |
| $ | 3,105,571 |
| $ | 3,839,724 |
| $ | 3,801,063 |
|
|
|
|
|
|
|
|
|
|
|
|
|
|
| ||||||
Pro-Forma Net Debt |
| $ | 2,709,442 |
| $ | 2,576,529 |
| $ | 3,094,098 |
| $ | 3,105,571 |
| $ | 3,910,375 |
| $ | 3,917,252 |
|
|
|
|
|
|
|
|
|
|
|
|
|
|
| ||||||
Operating Cash Flow (“OCF”) |
| $ | 186,014 |
| $ | 204,284 |
| $ | 196,299 |
| $ | 246,907 |
| $ | 231,743 |
| $ | 279,332 |
|
Add: Noos Operating Cash Flow (6) |
| — |
| — |
| 26,129 |
| — |
| — |
| — |
| ||||||
Add: Cinenova/Movieco Settlement (7) |
| — |
| — |
| — |
| — |
| 21,995 |
| — |
| ||||||
Pro-Forma Operating Cash Flow (“OCF”) |
| $ | 186,014 |
| $ | 204,284 |
| $ | 222,428 |
| $ | 246,907 |
| $ | 253,738 |
| $ | 279,332 |
|
|
|
|
|
|
|
|
|
|
|
|
|
|
| ||||||
Net Debt / Annualized OCF (OCF * 4) |
| 5.4 | x | 3.1 | x | 3.1 | x | 3.1 | x | 4.1 | x | 3.4 | x | ||||||
Pro Forma Net Debt / Pro-Forma Annualized OCF |
| 3.6 | x | 3.2 | x | 3.5 | x | 3.1 | x | 3.9 | x | 3.5 | x | ||||||
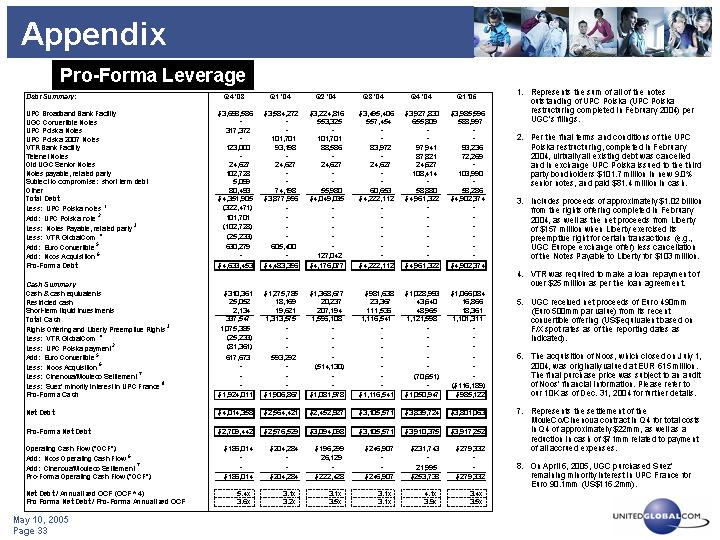
(1). Represents the sum of all of the notes outstanding of UPC Polska (UPC Polska restructuring completed in February 2004) per UGC’s filings.
(2). Per the final terms and conditions of the UPC Polska restructuring, completed in February 2004, virtually all existing debt was cancelled and in exchange UPC Polska issued to the third party bondholders $101.7 million in new 9.0% senior notes, and paid $81.4 million in cash.
(3). Includes proceeds of approximately $1.02 billion from the rights offering completed in February 2004, as well as the net proceeds from Liberty of $157 million when Liberty exercised its preemptive right for certain transactions (e.g., UGC Europe exchange offer) less cancellation of the Notes Payable to Liberty for $103 million.
(4). VTR was required to make a loan repayment of over $25 million as per the loan agreement.
(5). UGC received net proceeds of Euro 490mm (Euro 500mm par value) from its recent convertible offering (US$ equivalent based on F/X spot rates as of the reporting dates as indicated).
(6). The acquisition of Noos, which closed on July 1, 2004, was originally valued at EUR 615 million. The final purchase price was subject to an audit of Noos’ financial information. Please refer to our 10K as of Dec. 31, 2004 for further details.
(7). Represents the settlement of the MovieCo/Cinenova contract in Q4 for total costs in Q4 of approximately $22mm, as well as a reduction in cash of $71mm related to payment of all accrued expenses.
(8). On April 6, 2005, UGC purchased Suez’ remaining minority interest in UPC France for Euro 90.1mm (US$116.2mm).
33
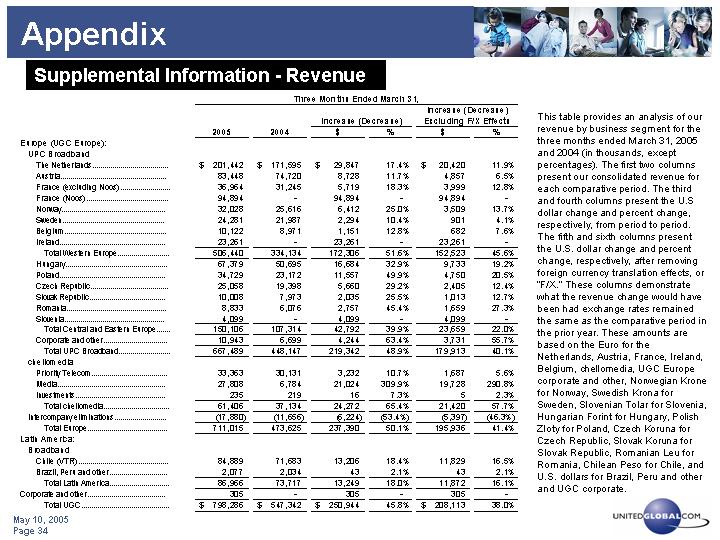
Supplemental Information - Revenue
|
| Three Months Ended March 31, |
| ||||||||||||||
|
|
|
|
|
|
|
|
|
| Increase (Decrease) |
| ||||||
|
|
|
|
|
| Increase (Decrease) |
| Excluding F/X Effects |
| ||||||||
|
| 2005 |
| 2004 |
| $ |
| % |
| $ |
| % |
| ||||
Europe (UGC Europe): |
|
|
|
|
|
|
|
|
|
|
|
|
| ||||
UPC Broadband |
|
|
|
|
|
|
|
|
|
|
|
|
| ||||
The Netherlands |
| $ | 201,442 |
| $ | 171,595 |
| $ | 29,847 |
| 17.4 | % | $ | 20,420 |
| 11.9 | % |
Austria |
| 83,448 |
| 74,720 |
| 8,728 |
| 11.7 | % | 4,857 |
| 6.5 | % | ||||
France (excluding Noos) |
| 36,964 |
| 31,245 |
| 5,719 |
| 18.3 | % | 3,999 |
| 12.8 | % | ||||
France (Noos) |
| 94,894 |
| — |
| 94,894 |
| — |
| 94,894 |
| — |
| ||||
Norway |
| 32,028 |
| 25,616 |
| 6,412 |
| 25.0 | % | 3,509 |
| 13.7 | % | ||||
Sweden |
| 24,281 |
| 21,987 |
| 2,294 |
| 10.4 | % | 901 |
| 4.1 | % | ||||
Belgium |
| 10,122 |
| 8,971 |
| 1,151 |
| 12.8 | % | 682 |
| 7.6 | % | ||||
Ireland |
| 23,261 |
| — |
| 23,261 |
| — |
| 23,261 |
| — |
| ||||
Total Western Europe |
| 506,440 |
| 334,134 |
| 172,306 |
| 51.6 | % | 152,523 |
| 45.6 | % | ||||
Hungary |
| 67,379 |
| 50,695 |
| 16,684 |
| 32.9 | % | 9,733 |
| 19.2 | % | ||||
Poland |
| 34,729 |
| 23,172 |
| 11,557 |
| 49.9 | % | 4,750 |
| 20.5 | % | ||||
Czech Republic |
| 25,058 |
| 19,398 |
| 5,660 |
| 29.2 | % | 2,405 |
| 12.4 | % | ||||
Slovak Republic |
| 10,008 |
| 7,973 |
| 2,035 |
| 25.5 | % | 1,013 |
| 12.7 | % | ||||
Romania |
| 8,833 |
| 6,076 |
| 2,757 |
| 45.4 | % | 1,659 |
| 27.3 | % | ||||
Slovenia |
| 4,099 |
| — |
| 4,099 |
| — |
| 4,099 |
| — |
| ||||
Total Central and Eastern Europe |
| 150,106 |
| 107,314 |
| 42,792 |
| 39.9 | % | 23,659 |
| 22.0 | % | ||||
Corporate and other |
| 10,943 |
| 6,699 |
| 4,244 |
| 63.4 | % | 3,731 |
| 55.7 | % | ||||
Total UPC Broadband |
| 667,489 |
| 448,147 |
| 219,342 |
| 48.9 | % | 179,913 |
| 40.1 | % | ||||
chellomedia |
|
|
|
|
|
|
|
|
|
|
|
|
| ||||
Priority Telecom |
| 33,363 |
| 30,131 |
| 3,232 |
| 10.7 | % | 1,687 |
| 5.6 | % | ||||
Media |
| 27,808 |
| 6,784 |
| 21,024 |
| 309.9 | % | 19,728 |
| 290.8 | % | ||||
Investments |
| 235 |
| 219 |
| 16 |
| 7.3 | % | 5 |
| 2.3 | % | ||||
Total chellomedia |
| 61,406 |
| 37,134 |
| 24,272 |
| 65.4 | % | 21,420 |
| 57.7 | % | ||||
Intercompany eliminations |
| (17,880 | ) | (11,656 | ) | (6,224 | ) | (53.4 | )% | (5,397 | ) | (46.3 | )% | ||||
Total Europe |
| 711,015 |
| 473,625 |
| 237,390 |
| 50.1 | % | 195,936 |
| 41.4 | % | ||||
Latin America: |
|
|
|
|
|
|
|
|
|
|
|
|
| ||||
Broadband |
|
|
|
|
|
|
|
|
|
|
|
|
| ||||
Chile (VTR) |
| 84,889 |
| 71,683 |
| 13,206 |
| 18.4 | % | 11,829 |
| 16.5 | % | ||||
Brazil, Peru and other |
| 2,077 |
| 2,034 |
| 43 |
| 2.1 | % | 43 |
| 2.1 | % | ||||
Total Latin America |
| 86,966 |
| 73,717 |
| 13,249 |
| 18.0 | % | 11,872 |
| 16.1 | % | ||||
Corporate and other |
| 305 |
| — |
| 305 |
| — |
| 305 |
| — |
| ||||
Total UGC |
| $ | 798,286 |
| $ | 547,342 |
| $ | 250,944 |
| 45.8 | % | $ | 208,113 |
| 38.0 | % |
This table provides an analysis of our revenue by business segment for the three months ended March 31, 2005 and 2004 (in thousands, except percentages). The first two columns present our consolidated revenue for each comparative period. The third and fourth columns present the U.S dollar change and percent change, respectively, from period to period. The fifth and sixth columns present the U.S. dollar change and percent change, respectively, after removing foreign currency translation effects, or “F/X.” These columns demonstrate what the revenue change would have been had exchange rates remained the same as the comparative period in the prior year. These amounts are based on the Euro for the Netherlands, Austria, France, Ireland, Belgium, chellomedia, UGC Europe corporate and other, Norwegian Krone for Norway, Swedish Krona for Sweden, Slovenian Tolar for Slovenia, Hungarian Forint for Hungary, Polish Zloty for Poland, Czech Koruna for Czech Republic, Slovak Koruna for Slovak Republic, Romanian Leu for Romania, Chilean Peso for Chile, and U.S. dollars for Brazil, Peru and other and UGC corporate.
34
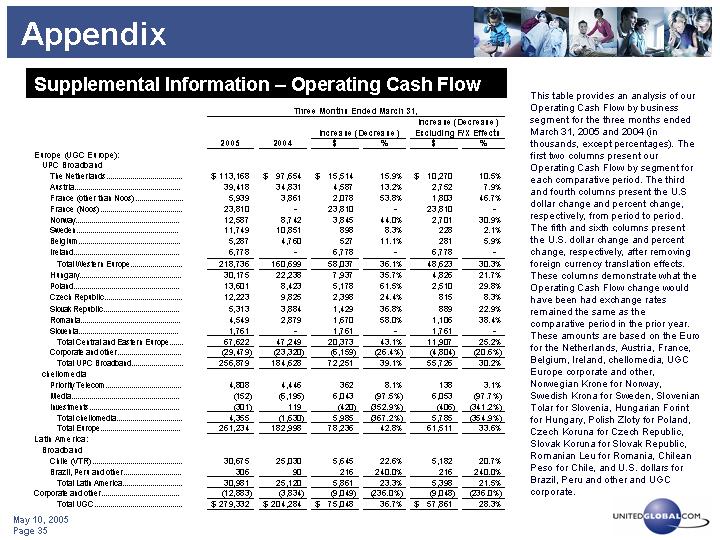
Supplemental Information – Operating Cash Flow
|
| Three Months Ended March 31, |
| ||||||||||||||
|
|
|
|
|
|
|
|
|
| Increase (Decrease) |
| ||||||
|
|
|
|
|
| Increase (Decrease) |
| Excluding F/X Effects |
| ||||||||
|
| 2005 |
| 2004 |
| $ |
| % |
| $ |
| % |
| ||||
Europe (UGC Europe): |
|
|
|
|
|
|
|
|
|
|
|
|
| ||||
UPC Broadband |
|
|
|
|
|
|
|
|
|
|
|
|
| ||||
The Netherlands |
| $ | 113,168 |
| $ | 97,654 |
| $ | 15,514 |
| 15.9 | % | $ | 10,270 |
| 10.5 | % |
Austria |
| 39,418 |
| 34,831 |
| 4,587 |
| 13.2 | % | 2,752 |
| 7.9 | % | ||||
France (other than Noos) |
| 5,939 |
| 3,861 |
| 2,078 |
| 53.8 | % | 1,803 |
| 46.7 | % | ||||
France (Noos) |
| 23,810 |
| — |
| 23,810 |
| — |
| 23,810 |
| — |
| ||||
Norway |
| 12,587 |
| 8,742 |
| 3,845 |
| 44.0 | % | 2,701 |
| 30.9 | % | ||||
Sweden |
| 11,749 |
| 10,851 |
| 898 |
| 8.3 | % | 228 |
| 2.1 | % | ||||
Belgium |
| 5,287 |
| 4,760 |
| 527 |
| 11.1 | % | 281 |
| 5.9 | % | ||||
Ireland |
| 6,778 |
| — |
| 6,778 |
| — |
| 6,778 |
| — |
| ||||
Total Western Europe |
| 218,736 |
| 160,699 |
| 58,037 |
| 36.1 | % | 48,623 |
| 30.3 | % | ||||
Hungary |
| 30,175 |
| 22,238 |
| 7,937 |
| 35.7 | % | 4,826 |
| 21.7 | % | ||||
Poland |
| 13,601 |
| 8,423 |
| 5,178 |
| 61.5 | % | 2,510 |
| 29.8 | % | ||||
Czech Republic |
| 12,223 |
| 9,825 |
| 2,398 |
| 24.4 | % | 815 |
| 8.3 | % | ||||
Slovak Republic |
| 5,313 |
| 3,884 |
| 1,429 |
| 36.8 | % | 889 |
| 22.9 | % | ||||
Romania |
| 4,549 |
| 2,879 |
| 1,670 |
| 58.0 | % | 1,106 |
| 38.4 | % | ||||
Slovenia |
| 1,761 |
| — |
| 1,761 |
| — |
| 1,761 |
| — |
| ||||
Total Central and Eastern Europe |
| 67,622 |
| 47,249 |
| 20,373 |
| 43.1 | % | 11,907 |
| 25.2 | % | ||||
Corporate and other |
| (29,479 | ) | (23,320 | ) | (6,159 | ) | (26.4 | )% | (4,804 | ) | (20.6 | )% | ||||
Total UPC Broadband |
| 256,879 |
| 184,628 |
| 72,251 |
| 39.1 | % | 55,726 |
| 30.2 | % | ||||
chellomedia |
|
|
|
|
|
|
|
|
|
|
|
|
| ||||
Priority Telecom |
| 4,808 |
| 4,446 |
| 362 |
| 8.1 | % | 138 |
| 3.1 | % | ||||
Media |
| (152 | ) | (6,195 | ) | 6,043 |
| (97.5 | )% | 6,053 |
| (97.7 | )% | ||||
Investments |
| (301 | ) | 119 |
| (420 | ) | (352.9 | )% | (406 | ) | (341.2 | )% | ||||
Total chellomedia |
| 4,355 |
| (1,630 | ) | 5,985 |
| (367.2 | )% | 5,785 |
| (354.9 | )% | ||||
Total Europe |
| 261,234 |
| 182,998 |
| 78,236 |
| 42.8 | % | 61,511 |
| 33.6 | % | ||||
Latin America: |
|
|
|
|
|
|
|
|
|
|
|
|
| ||||
Broadband |
|
|
|
|
|
|
|
|
|
|
|
|
| ||||
Chile (VTR) |
| 30,675 |
| 25,030 |
| 5,645 |
| 22.6 | % | 5,182 |
| 20.7 | % | ||||
Brazil, Peru and other |
| 306 |
| 90 |
| 216 |
| 240.0 | % | 216 |
| 240.0 | % | ||||
Total Latin America |
| 30,981 |
| 25,120 |
| 5,861 |
| 23.3 | % | 5,398 |
| 21.5 | % | ||||
Corporate and other |
| (12,883 | ) | (3,834 | ) | (9,049 | ) | (236.0 | )% | (9,048 | ) | (236.0 | )% | ||||
Total UGC |
| $ | 279,332 |
| $ | 204,284 |
| $ | 75,048 |
| 36.7 | % | $ | 57,861 |
| 28.3 | % |
This table provides an analysis of our Operating Cash Flow by business segment for the three months ended March 31, 2005 and 2004 (in thousands, except percentages). The first two columns present our Operating Cash Flow by segment for each comparative period. The third and fourth columns present the U.S dollar change and percent change, respectively, from period to period. The fifth and sixth columns present the U.S. dollar change and percent change, respectively, after removing foreign currency translation effects. These columns demonstrate what the Operating Cash Flow change would have been had exchange rates remained the same as the comparative period in the prior year. These amounts are based on the Euro for the Netherlands, Austria, France, Belgium, Ireland, chellomedia, UGC Europe corporate and other, Norwegian Krone for Norway, Swedish Krona for Sweden, Slovenian Tolar for Slovenia, Hungarian Forint for Hungary, Polish Zloty for Poland, Czech Koruna for Czech Republic, Slovak Koruna for Slovak Republic, Romanian Leu for Romania, Chilean Peso for Chile, and U.S. dollars for Brazil, Peru and other and UGC corporate.
35