Exhibit 99.1
Jupiter Telecommunications Co., Ltd.
(Translation from Japanese disclosure to JASDAQ)
January 30, 2008
[U.S. GAAP]
Consolidated Annual Financial Results Release
For the Year Ended December 31, 2007
Jupiter Telecommunications Co., Ltd. (Consolidated)
Company code number: 4817 (URL http://www.jcom.co.jp/)
Shares traded: JASDAQ
Executive position of legal representative: Tomoyuki Moriizumi, Chief Executive Officer
Please address all communications to:
Koji Kobayashi, | IR Department |
| Phone: +81-3-6765-8157 |
| E-Mail: KobayashiKo@jupiter.jcom.co.jp |
Expected date of Annual Shareholder’s meeting : March 27, 2008
Expected date of filing of annual report: March 27, 2008
1. Consolidated operating results (From January 1, 2007 to December 31, 2007)
(1) Consolidated financial results
(In millions of yen, with fractional amounts rounded)
|
| Revenue |
| Operating income |
| Income before Income |
| Net Income |
| ||||||||
|
|
|
| % |
|
|
| % |
|
|
| % |
|
|
| % |
|
December 31, 2007 |
| 264,508 |
| 19.2 |
| 42,816 |
| 35.6 |
| 37,506 |
| 36.4 |
| 23,992 |
| (2.0 | ) |
December 31, 2006 |
| 221,915 |
| 21.2 |
| 31,582 |
| 29.0 |
| 27,503 |
| 64.2 |
| 24,481 |
| 26.6 |
|
|
| Net income per |
| Net income per |
| Net income ratio |
| Income before |
| Income before |
|
|
| (Yen) |
| (Yen) |
| % |
| % |
| % |
|
December 31, 2007 |
| 3,650.27 |
| 3,638.93 |
| 7.9 |
| 5.7 |
| 14.2 |
|
December 31, 2006 |
| 3,844.83 |
| 3,838.33 |
| 9.3 |
| 4.8 |
| 12.4 |
|
(Notes)
1. Equity in earnings of affiliates;
For the year ended December 31, 2007: 291 million yen For the year ended December 31, 2006: 371 million yen
2. The percentages shown next to revenue, operating income, income before income taxes and net income represent year-on-year changes.
(2) Consolidated financial position
|
| Total assets |
| Shareholders’ equity |
| Equity capital ratio |
| Shareholders’ equity |
|
|
| (Millions of yen) |
| (Millions of yen) |
| % |
| (Yen) |
|
December 31, 2007 |
| 680,416 |
| 330,009 |
| 48.5 |
| 48,195.11 |
|
December 31, 2006 |
| 625,948 |
| 277,296 |
| 44.3 |
| 43,445.59 |
|
(3) Consolidated cash flow statement
|
| Cash flows from |
| Cash flows from |
| Cash flows from |
| Balance of cash & |
|
|
| (Millions of yen) |
| (Millions of yen) |
| (Millions of yen) |
| (Millions of yen) |
|
December 31, 2007 |
| 95,226 |
| (52,728 | ) | (40,094 | ) | 22,890 |
|
December 31, 2006 |
| 80,003 |
| (121,601 | ) | 26,801 |
| 20,486 |
|
1
2. Dividend information
|
| Annual cash dividends per |
| Total amount of annual |
| Dividends payout ratio |
| Total amount of |
|
|
| Yen |
| Million yen |
|
|
|
|
|
December 31, 2006 |
| 0.00 |
| — |
| — |
| — |
|
December 31, 2007 |
| 0.00 |
| — |
| — |
| — |
|
December 31, 2008 (forecast) |
| — |
| — |
| — |
| — |
|
3. Consolidated forecasts for December 2008 term (from January 1, 2008 to December 31, 2008)
|
| Revenue |
| Operating income |
| Income before |
| Net income |
| Net income |
| ||||||||
|
| (Millions of yen) |
| (%) |
| (Millions of yen) |
| (%) |
| (Millions of yen) |
| (%) |
| (Millions of yen) |
| (%) |
| (Yen) |
|
Annual |
| 295,000 |
| 11.5 |
| 50,000 |
| 16.8 |
| 45,000 |
| 20.0 |
| 27,000 |
| 12.5 |
| 4,107.94 |
|
(Notes)
1. The percentages shown next to revenue, operating income, income before income taxes and net income represent year-on-year changes
4. Other information
(1) Change of material subsidiaries : None
(2) Change of accounting policy
1. Change in accounting methods in accordance with change in accounting policy : None
2. Change in accounting methods other than above : None
(3) Outstanding shares
1. Number of issued shares at end of term (consolidated):
As of December 31, 2007: 6,927,357 shares As of December 31, 2006: 6,382,611 shares
2. Number of treasury stock:
As of December 31, 2007: 80,000 shares As of December 31, 2006: 0 shares
(note) Regarding number of shares basis of per share data, please refer to page 24.
2
(Ref) Parent Company Only [JAPANESE GAAP]
1. Operating results (From January 1, 2007 to December 31, 2007)
(1) Financial results
|
|
|
| (In millions of yen, with fractional amounts rounded) |
| ||||||||||||
|
|
|
|
|
| ||||||||||||
|
| Revenue |
| Operating income |
| Ordinary income |
| Net Income |
| ||||||||
|
|
|
| % |
|
|
| % |
|
|
| % |
|
|
| % |
|
December 31, 2007 |
| 107,807 |
| 7.5 |
| 8,147 |
| 88.3 |
| 8,656 |
| 30.7 |
| 6,327 |
| (2.4 | ) |
December 31, 2006 |
| 100,288 |
| 33.7 |
| 4,326 |
| 242.2 |
| 6,625 |
| 214.2 |
| 6,482 |
| — |
|
|
| Net income per share |
| Net income per share |
|
|
| (yen) |
| (yen) |
|
December 31, 2007 |
| 962.71 |
| 959.72 |
|
December 31, 2006 |
| 1,018.01 |
| 1,016.29 |
|
The percentages shown next to revenue, operating income, ordinary income and net income represent year-on-year changes.
(2) Financial position
(In millions of yen, with fractional amounts rounded)
|
| Total assets |
| Net assets |
| Equity capital ratio |
| Net assets |
|
|
| (Millions of yen) |
| (Millions of yen) |
| (%) |
| (Yen) |
|
December 31, 2007 |
| 427,146 |
| 246,458 |
| 57.7 |
| 35,991.30 |
|
December 31, 2006 |
| 374,352 |
| 193,155 |
| 51.6 |
| 30,262.71 |
|
(Notes) Stockholders’ equity: As of December 31, 2007 ¥246,444 million As of December 31, 2006 ¥193,155 million
(Cautionary note regarding future-related information)
The forecasts contained in this report have been prepared on the basis of information that is currently available. Because such estimates are inherently very uncertain, actual results may differ from the forecasts. The Company does not guarantee that it will achieve these estimated results and advises readers to refrain from depending solely on these forecasts. Readers should also note that the Company is under no obligation to revise this information on a regular basis.
3
I. Business Results
(1) Analysis of Business Results
The Jupiter Telecommunications Co., Ltd. (the Company)’s consolidated group (the J:COM Group, its consolidated subsidiaries, and equity-method affiliate) positioned this fiscal year as one for cementing the foundations for sustainable growth, and steadily moved forward with its Volume plus Value growth strategy. Furthermore, on September 1, 2007, the J:COM Group acquired interests in various thematic channels through its merger with Jupiter TV Co., Ltd. (JTV), thereby making the J:COM Group the largest multiple channel operator in Japan. This allows the J:COM Group to provide the multi-channel market with integrated services ranging from the content creation and the supply of programs to program distribution for customers.
The status of various efforts to implement its growth strategy is as follows:
1. Volume strategy
In addition to direct sales representative, the J:COM Group increased its emphasis on strategic sales channels targeting potential customers where higher growth is forecasted. Notably, subscriber numbers have been increasing steadily, in part as a result of i) promoting bulk contracts for multiple dwelling units (MDUs), which convert MDUs into a stable revenue source and ii) agency sales by the regional volume retailers, real-estate companies and stores that play the role of wholesale distributing agents for the J:COM Group’s broadband services.
The J:COM Group continues to seek equity-based alliances and acquire cable television companies. One result will be the January 2008 acquisition of a controlling interest in Kyoto Cable Communications Co., Ltd. (KCC), which the Company initially acquired a 46.6% interest in November 2007 and treated under the equity method of accounting for the remainder of 2007. As a result of this additional step acquisition, KCC will become a consolidated subsidiary from January 2008.
Furthermore, the CATV operation business of Kobe City Development & Management Foundation will be transferred to J:COM Kobe-Ashiya, at the end of February 2008. As a result, the operations of such CATV business will be consolidated in the Company’s results from February 2008.
2. Value strategy
To increase the average monthly revenue per unit (ARPU), the J:COM Group is moving forward with increasing the number of services offered per subscribing household (bundle ratio) and enhancing the added value of existing services.
In the area of cable television services, the J:COM Group strengthened its lineup of digital services by introducing a total of seven new channels, including basic and premium channels. The Company is also moving forward with the shift to high-definition (HD) broadcasting. The conversion of one standard definition (SD) channel to HD and the addition of an HD channel to its original SD channel has increased the ratio of HD channels to total channels offered (including terrestrial digital broadcasting and broadcasting satellite digital broadcasting) to 25%.
In fiscal 2006, the J:COM Group introduced its digital video recording service (HDR) using a set-top box that enables recording of HD broadcasts to an internal hard disk drive. This
4
service enables up to 20 hours of internal hard disk drive recording of terrestrial, broadcasting satellite, and cable television digital programming in its original HD quality. Other features include the ability to record one program while watching another or record two programs at the same time. The HDR has become popular for its features and its perceived cost / performance ratio to users. In addition, the continued expansion of the HDR service is driving increases in ARPU. As of the end of December 31, 2007 J:COM had received 254 thousand requests for subscription to HDR service.
Due in part to the success of the HDR service, the cable television digital migration rate (the percentage of CATV subscribing households who have digital CATV service) as of the end of the year ended December 31, 2007 was 67%, an increase from 52% as of December 31 2006.
In the area of high-speed Internet access services, the J:COM Group introduced J:COM NET Ultra 160Mbps, a super high-speed Internet service for single dwelling units and small-scale MDUs at most of its system operators in the Kansai region in September 2007, and one system operator in the Kanto region (former J:COM Setamachi Co., Ltd.) in October 2007.
J:COM NET Ultra 160Mbps uses existing cable network technology, and is intended to heighten customer satisfaction and compete with fiber to the home (FTTH). Customer response has been strong, and this service is expected to be further launched in 2008 to the remainder of the J:COM Group managed system operators.
3. New businesses
The J:COM Group entered the advertising media business, for the purpose of diversifying income sources, utilizing the customer base built through its existing businesses and the diverse media resources of the J:COM Group (community channels, video on demand services (VOD), programming information guide, magazines, etc.). One step in this was the July 2007 acquisition of Recruit Visual Communications Co., Ltd. (renamed Jupiter Visual Communications, Co., Ltd.), formerly a wholly owned subsidiary of Recruit Co., Ltd. Further, in September 2007, Dentsu Inc. took a capital position in Jupiter Visual Communications, and joint development of new advertising media and methods commenced.
4. Moving forward with the new Content Strategy, created in response to the merger with JTV
As a result of the merger with JTV, the Company became Japan’s largest multi-channel operator (MCO). As a MCO, the Company develops, manages and distributes pay television services through various distribution infrastructures, principally cable and direct-to-home satellite service providers. As of December 31, 2007, the J:COM Group owned four channels through wholly or majority owned subsidiaries and had investments ranging from 10% to 50% in ten additional channels. Each channel is either number one in their genre or has the potential to become number one in the number of households with service available and essential channels to composite a wide variety of channels. The J:COM Group’s majority owned channels are Japan’s largest foreign movie channel (Movie Plus), Japan’s largest golf dedicated channel (Golf Network), a women’s entertainment channel (LaLa TV) and a new channel which is planned to launch in April 2008 (Channel Ginga). Channels in which the J:COM Group holds investments include four sports channels owned by J SPORTS Broadcasting Corporation, and a documentary program channel (Discovery Channel) and an animal entertainment channel (Animal Planet).
In order to improve demand for multi-channel services, the J:COM Group seeks to develop
5
higher quality channels through maximizing use of our management resources such as customer base and sales systems which make it possible for us to understand directly the needs of customers by this merger. One of the first measures taken was the establishment of Channel Ginga Co., Ltd. (Channel Ginga), a new channel operator, on November 29, 2007. Channel Ginga is scheduled to begin broadcasting 24 hours a day in HD format, featuring a comprehensive selection of foreign and Japanese documentaries, travel shows, history and art, television dramas, period plays, entertainment, and many more genres. The programming comes mainly from the Japan Broadcasting Corporation (NHK) archives, the United Kingdom’s British Broadcasting Corporation, and from three networksin the United States. Channel Ginga is based on the concept of building a lineup of high-quality programming with appeal that transcends generational boundaries and is intended to increase the satisfaction of existing customers and add new customers.
As a result of the above-mentioned measures, the total number of subscribing households at consolidated managed system operators increased by 146,900 from December 31, 2006 to 2,659,100 households (or 6%) at December 31, 2007. By type of service, cable television subscribers grew by 78,700 households (or 4%) from December 31, 2006 to 2,188,000 households at December 31, 2007. The number of high-speed Internet access and telephony services subscribers increased by 102,800 (or 9%), and 192,700 (or 17%), respectively, to 1,211,600 and 1,312,600 households, respectively, as of December 31, 2007. The bundle ratio improved from 1.73 as of December 31, 2006 to 1.77 as of December 31, 2007. ARPU decreased from ¥7,787 for the year-ended December 31, 2006 to ¥7,687 for the year-ended December 2007.
Overview of business results
Revenue
Total revenue increased by ¥42,593 million, or 19% from ¥221,915 million for the year ended December 31, 2006 to ¥264,508 million for the year ended December 31, 2007.
Subscription fees increased by ¥33,546 million, or 17%, from ¥196,515 million for the year ended December 31, 2006 to ¥230,061 million for the year ended December 31, 2007. This increase was due primarily to a 9% organic growth of subscription fees and addition of subscription fees from newly consolidated subsidiaries.
Cable television subscription fees increased by ¥20,268 million, or 20%, from ¥102,803 million for the year ended December 31, 2006 to ¥123,071 million for the year ended December 31, 2007. High-speed Internet subscription fees increased by ¥8,437 million, or 15% from ¥58,121 million for the year ended December 31, 2006 to ¥66,558 million for the year ended December 31, 2007. Telephony subscription fees increased by ¥4,841 million, or 14%, from ¥35,591 million for the twelve months ended December 31, 2006 to ¥40,432 million for the year ended December 31, 2007. The 20% increase in cable television subscription revenue was due to a 8% organic growth in subscription fees and the increasing proportion of cable television subscribers who subscribe to our digital service, for which we charge a higher fee compared to analog service. As of December 31, 2007, 67% of cable television subscribers were receiving our digital service, compared to 52% as of December 31, 2006. The increase in high-speed Internet subscription revenue was primarily attributable to a 8% organic growth in subscription fees offset by product bundling discounts. The increase in Telephony revenue was attributable to a 12% organic increase in subscription fees that was offset by a decrease in telephony ARPU.
6
Other revenue increased by ¥9,047 million, or 36%, from ¥25,400 million for the year ended December 31, 2006 to ¥34,447 million for the year ended December 31, 2007. This increase is related to individually insignificant increases in various revenue categories including poor reception compensation, construction, installation, advertising, program production, commission and other fees, and charges and sales made to our unconsolidated managed franchises for management, programming, construction materials and other services.
Operating Costs and Expenses
Operating and programming costs increased by ¥12,451 million, or 13%, from ¥92,297 million for the year ended December 31, 2006 to ¥104,748 million for the year ended December 31, 2007. This increase includes ¥7,755 million that is attributable to the aggregate impact of acquisitions and costs directly related to growth of our subscriber base. Increases in labor and related costs, network and maintenance costs, and other individually insignificant items also contributed to the increase.
Selling, general and administrative expenses increased by ¥8,730 million, or 20%, from ¥43,992 million for the year ended December 31, 2006 to ¥52,722 million for the year ended December 31, 2007. This increase is attributable to the aggregate impact of acquisitions and higher labor and employee related costs.
Depreciation and amortization expenses increased by ¥10,178 million, or 19%, from ¥54,044 million for the year ended December 31, 2006 to ¥64,222 million for the year ended December 31, 2007. This increase is primarily attributable to the aggregate impact of acquisitions and additions to fixed assets related to the installation of services to new customers.
Operating income, as a result, increased by ¥11,234 million, or 36%, from ¥31,582 million for the year ended December 31, 2006 to ¥42,816 million for the year ended December 31, 2007.
Interest expense, net increased by ¥754 million, or 21%, from ¥3,522 million for the year ended December 31, 2006 to ¥4,276 million for the year ended December 31, 2007. The increase is primarily due to ¥52 billion of additional borrowings related to the acquisition of Cable West in September 2006.
Income before income taxes increased by ¥10,003 million, or 36%, from ¥27,503 million for the year ended December 31, 2006 to ¥37,506 million for the year ended December 31,2007 for the reasons above.
Income tax expense increased by ¥10,492 million, or 347%, from ¥3,022 million for the year ended December 31, 2006 to ¥13,514 million for the year ended December 31, 2007. The income tax expense of ¥13,514 million in the year ended December 31, 2007 included ¥2,707 million of net deferred tax benefits recognized as a result of the reversal of valuation allowances for certain franchises as we believe the related deferred tax assets will be realizable in future years.
Net income decreased by ¥489 million, or 2%, from ¥24,481 million for the year ended December 31, 2006 to ¥23,992 million for the year ended December 31, 2007 for the reasons set forth above.
7
(2) Outlook for the coming fiscal year
(In millions in yen)
|
| Revenue |
| Operating |
| Income before |
| Net income |
|
December 31, 2007 (Actual) |
| 264,508 |
| 42,816 |
| 37,506 |
| 23,992 |
|
December 31, 2008 (Forecast) |
| 295,000 |
| 50,000 |
| 45,000 |
| 27,000 |
|
Change (%) |
| 11.5 |
| 16.8 |
| 20.0 |
| 12.5 |
|
As the growth of the paid multi-channel broadcast market slows, the J:COM Group also expects to see other major communications companies make serious forays into the multi-channel market in the coming fiscal year. This is likely to mean that the J:COM Group’s operating environment will become even more difficult. On the other hand, the J:COM Group anticipates that the entry of other companies into the paid multi-channel broadcast market will raise public awareness of the industry, increasing the presence of the industry as a whole, and energizing the entire market.
Acting on this assessment of the situation, the J:COM Group will work to achieve sustainable growth through growth in volume, enhancement of value, and improving quality of programming. To achieve growth in volume, the Company will move forward with the diversification of sales channels, which will increase customer contact points and expand the subscriber base.
To enhance value, the Company will move ahead with efforts to increase the added value of existing services. In the area of cable television services, the convenience and functionality of the J:COM Group’s digital television services will be upgraded. In the area of high-speed Internet access services, the Company will introduce services not yet offered by its competitors, including nationwide 160Mbps super high-speed Internet access service.
In the effort to upgrade the quality of content, the Company will continue the shift to HD broadcasting and create attractive programming. This will heighten the level of subscriber satisfaction and tap into new subscriber demographics.
As a result of the measures described above, the J:COM Group makes the following forecasts consolidated performance for the coming fiscal year: revenue of ¥295,000 million, operating income of ¥50,000 million, income before income taxes of ¥45,000 million, and net income of ¥27,000 million.
8
(3) Financial position
Asset, Liability and Stockholders’ equity
Total assets increased by ¥54,468 million, from ¥625,948 million as of December 31, 2006 to ¥680,416 million as of December 31, 2007. The increase was primarily due to increase in goodwill, investments, and intangible assets in accordance with the merger with JTV.
Total liabilities increased by ¥406 million, from ¥344,602 million as of December 31, 2006 to ¥345,008 million as of December 31, 2007. The increase was primarily due to the merger with JTV, partially offset by a decrease in long-term debt.
Stockholders’ equity increased by ¥52,713 million, from ¥277,296 million as of December, 2006 to ¥330,009 million as of December 31, 2007. The increase was primarily due to the merger with JTV and current net income, partially offset by acquisition of treasury stock.
Cash flows
For the year ended December 31, 2007, our cash and cash equivalents increased by ¥2,404 million, from ¥20,486 million to ¥22,890 million, primarily as a result of cash provided by operating activities, offset by cash used for capital expenditures, payment of long-term debt and capital lease obligations.
Cash Provided by Operating Activities. Net cash provided by operating activities was ¥95,226 million for the year ended December 31 2007, compared to ¥80,003 million for the year ended December 31, 2006, or an increase of ¥15,223 million. The increase was primarily the result of a ¥21,220 million increase in revenue less selling, general and administrative and operating expenses (exclusive of stock compensation, depreciation, amortization).
Cash Used in Investing Activities. Net cash used in investing activities was ¥52,728 million for the year ended December 31, 2007, compared to ¥121,601 million for the year ended December 31, 2006, or a decrease of ¥68,873 million, primarily due to the ¥56,771 million decrease in acquisitions of new subsidiaries, net of cash acquired.
Cash Used in Financing Activities. Net cash used in financing activities was ¥40,094 million for the year ended December 31, 2007, compared to net cash provided by financing activities of ¥26,801 million for the year ended December 31, 2006. The net cash used in financing activities for the year ended December 31, 2007 consisted of ¥24,751 million net payments of short term loans and long-term debt, ¥15,689 million of principle payments under capital lease obligations, and ¥7,520 million of acquisition of treasury stock, offset by ¥2,973 million in proceeds from the issuance of common stock.
(4) Fundamental policy regarding the distribution of profits
The J:COM Group’s long-term profit distribution policy is designed to increase shareholder value through distributions while maintaining its strong financial position. Accordingly, the Company has resolved to declare the company’s first dividend payment from midterm dividend for the fiscal year ending December 31, 2008 at a board meeting which was held on January 30.
9
(5) Risk management
The J:COM Group has implemented organizational and structural risk management measures. However, should risks emerge, the possibility exists that they could significantly affect the J:COM Group’s business results, financial position, or cash flows.
As of December 31, 2007, risks of the J:COM Group (some of which are outside of the control of the J:COM Group) were as follows:
1. Risks associated with the J:COM Group’s businesses
· An ineffective strategy for gaining new subscribers.
· Turnover among sales staff can reduce the effectiveness of marketing activities, causing the failure to maintain subscribers and the loss of opportunities to gain new subscribers.
· Risk that the J:COM Group might be unable to secure the funds, equipment, or obtain regulatory approvals needed for network expansion.
· Reduction in opportunities to expand operations through the acquisition of other businesses.
· Changes in the performance of J:COM Group companies might have a negative effect on operating results.
· Risks associated with non-compliance with certain regulations (for instance, claims for damages resulting from the unauthorized release of personal information).
2. Risks associated with business relationships
· Adverse developments, including the cessation of transactions, in the J:COM Group’s relationships with programming suppliers, network infrastructure providers, suppliers of service reception and transmission equipment (digital set-top boxes, etc.), and other CATV and satellite broadcast operators.
3. Risks associated with markets
· Intensifying competition with other firms in the same line of business as the J:COM Group, and adverse trends in markets.
4. Legal and regulatory risks
· Stricter government regulations, revisions to laws, etc.
5. Risks associated with natural and man-made disasters
· Outage of the J:COM Group’s transmission facilities due to natural disasters, terrorist attacks, etc.
For more detailed information on the foregoing, see the J:COM annual securities report scheduled for submission in March 2008.
10
11
III. Management Policy
(1) Fundamental management policy
The basic management philosophy of the J:COM Group defines the Company’s mission as enhancing the sense of affluence felt by its customers in their daily lives by meeting their needs through state-of-the-art visual, audio, and high-speed Internet services based on advanced technology.
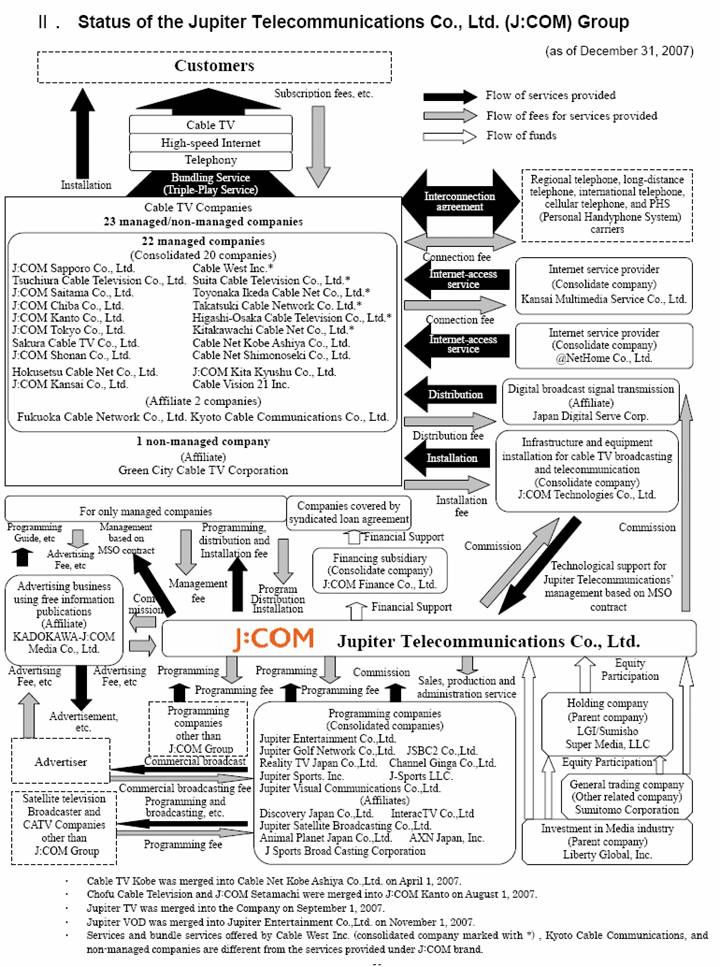
To realize its management philosophy, the J:COM Group provides three services as a comprehensive one-stop provider: (1) cable television (J:COM TV), (2) high-speed Internet access (J:COM NET), and (3) telephony services (J:COM PHONE). These services are provided through the J:COM Group’s managed system operators (listed in the “II. Status of the J:COM Group” chart), which utilize the J:COM broadband (high speed, large capacity) network. Through such services, the J:COM Group endeavors each day to build close, trusting relationships with customers and local communities, while working to become the kind of company that can return the benefits of its achievements to local communities and shareholders.
As noted above, on September 1, 2007, the J:COM Group acquired interests in various thematic channels through its merger with JTV, thereby making the J:COM Group the largest multiple channel operator in Japan. As a leading company in the broadcasting and telecommunications industries, the J:COM Group plans to leverage improvements in programming quality to stimulate growth in the demand for multi-channel services, thereby increasing its shareholder value by expanding both its cable television and programming distribution businesses.
(2) Target management indices
The J:COM Group’s services primarily target individual subscribers, and its greatest strength is one-stop shopping for bundled services at reasonable prices. Revenue, subscriber numbers, bundle ratio, ARPU, and churn rate are important management indicators for evaluating success.
In terms of profitability, the Company believes that operating cash flow (OCF) and OCF margins are important management indices.
(3) Medium- and long-term management strategies, and issues requiring action
The J:COM Group positioned this fiscal year as one for cementing the foundations for sustainable growth. In brief, by implementing the Volume plus Value Strategy to drive growth, J:COM worked to increase subscriber numbers (volume growth) and raise ARPU (value enhancement). In addition, the J:COM Group initiated its content strategy with the September 2007 merger with JTV.
Next fiscal year, the J:COM Group will continue to strive for higher shareholder value through sustainable growth, produced by increases in volume, the enhancement of value, and the improvement of programming quality.
12
1. Volume strategy
To increase subscriber numbers, the J:COM Group will be taking the following actions:
Increasing penetration rates in existing areas by promoting multiple-tiered sales channels.
The J:COM Group is striving to strengthen its sales and marketing capabilities, and increase its customer contact points in existing markets by diversifying sales channels to increase subscriber penetration rates.
Principle measures are described below:
· Bulk sales
· Strengthening agency sales
· Increasing the number of J:COM shops near commuter train stations
· Strengthening Web marketing
· Vigorous marketing to households receiving only J:COM retransmission services
Expanding new areas by acquiring or forging equity-based alliances with cable television companies.
The J:COM Group is endeavoring to increase subscriber numbers by extending its network, and strengthening its sales and marketing capabilities to convert the approximately 4.28 million retransmission only homes to paying subscribers.
At the same time, it will remain the J:COM Group’s policy to pursue opportunities for equity-based alliances or friendly mergers, focusing primarily on cable television companies that are operating in areas close to J:COM Group system operators.
Pursuing management efficiency through reorganization
The J:COM Group is pursuing increased efficiency in group management through mergers with consolidated subsidiaries, with the ultimate goal of achieving the competitiveness required for sustainable growth throughout the J:COM Group. On January 1, 2008, J:COM Kansai Co., Ltd., Cable West, Inc., and Hokusetsu Cable Net Co., Ltd., merged to form Japan’s largest CATV company, J:COM West Co., Ltd. These mergers of group companies and other reorganization measures will not only strengthen the J:COM Group’s financial position and heighten its management efficiency, but also advance its regional strategy by increasing the J:COM Group’s regional presence.
2. Value strategy
To increase ARPU, the J:COM Group is moving forward with increasing the bundle ratio and enhancing the added value of existing services.
Principle measures are described below:
Cable television (J:COM TV)
To strengthen the competitiveness of the J:COM Group against satellite broadcast and communications services, the J:COM Group is moving forward with the provision of its three major digital services: HD programming, VOD, and HDR. The J:COM Group will continue
13
to convert programming with high audience ratings to HD format in the coming fiscal year. To increase the customer convenience of its HDR services, the J:COM Group is studying the introduction of a higher-performance HDR service with functions exceeding those presently offered. The J:COM Group will also continue to upgrade its VOD services through further expansion of HD content and on demand content that each channel individually offers, which is called Channel-on-Demand.
Through the provision of these digital services, the J:COM Group intends to migrate all of its analog customers to digital service by the end of 2009.
In April 2008, the J:COM Group will launch the newly established Channel Ginga. Also in April 2008, the J:COM Group’s channel lineup will be enhanced by the addition of the SCI-FI Channel, NBC Universal’s flagship channel. This will be Japan’s introduction of the channel, which is popular overseas. It specializes in science fiction movies and series, and also presents a solid schedule of Japanese anime programming.
High-speed Internet access (J:COM NET)
Efforts were made to increase customer satisfaction by offering an extended range of basic services including exciting broadband content, as well as various security services, up to five e-mail accounts, and a generous amount of personal Web space, in addition to offering package discounts for bundled services.
In September 2007, J:COM introduced J:COM NET Ultra 160Mbps, a super high-speed Internet service at most of its system operators in the Kansai region and at J:COM Setamachi in the Kanto region. The J:COM Group is scheduled to launch the service for the rest of its service areas in 2008, through its hybrid fiber coaxial (HFC) network.
Telephony service (J:COM PHONE)
The J:COM Group offers the J:COM PHONE service as a primary fixed-line telephony service with comparable quality to the services of Nippon Telegraph and Telephone (NTT) East Corporation and NTT West Corporation, but at a lower monthly rate and with lower call charges. The Company is striving to raise customer satisfaction by offering services such as local number portability and volume discounts for high usage customers, in addition to discounted rates for calls between subscribers. Other services include affordable optional services and discounts for bundled services.
3. New businesses and value added services
The J:COM Group continued to expand its advertising media business and diversify its revenue sources through the joint development of advertising products, including media and cross-marketing of VOD, together with Jupiter Visual Communications, Co., Ltd., which became a subsidiary of the Company in July 2007.
The J:COM Group emphasizes the provision of new value-added services that it can offer on its own network, in addition to existing services. One such service is an earthquake alert early warning service for households, scheduled to launch in January 2008. J:COM will use its cable network to forward the earthquake early warnings transmitted by the Japan Meteorological Agency to households. This allows the J:COM Group to provide much more accurate seismic data and earthquake alert arrival time to our subscribers, compared to information provided by other CATV companies. This service can help to enhance the safety of local communities while increasing customer satisfaction.
14
4. Expanding the content business
The J:COM Group will work to enhance programming quality by adding the creation and supply of exciting programming to its existing cable television business.
In order to improve the programming on its channels, and to develop higher quality programming, the J:COM Group began using data from the Digital Audience Rating service, which was launched in the summer of 2006, as well as subscriber opinions gathered by direct sales representatives and call centers.
Meanwhile, the J:COM Group will shut down struggling channels, and continually reexamine the channel lineup to enhance the programming to subscribers.
(4) Preparation and operation of internal management structure
(a) Fundamental policy on creation of an internal control system
At a meeting held on June 28, 2006, the Company’s Board of Directors made the decision to adopt a fundamental policy that mandates the creation of an internal control system, in accordance with Article 362 of Japan’s Company Act and Article 100 of the Enforcement Regulations for the Company Act.
(b) Organization and structure for internal auditing
The Company’s Internal Auditing Department, which reports directly to the Company’s president, is responsible for internal audits of the entire internal organization and the J:COM Group companies. The department audits internal Company organizations and J:COM Group companies. As a rule, audits are conducted every two years, according to an auditing plan. Audit findings are submitted as reports to the Company’s president. After the audits, the internal organizations and the J:COM Group companies are routinely monitored to track the progress of improvements to address deficiencies uncovered by audits.
The Internal Auditing Department and statutory auditors work independently but maintain close communications. The Internal Auditing Department reports the findings of audits to the full-time statutory auditor, in order to contribute to audits by the board of statutory auditors.
(c) Internal Control Committee
As a consolidated subsidiary of Liberty Global, Inc., which is listed on the U.S. NASDAQ Stock Exchange, the Company has been required to be in compliance with the Sarbanes-Oxley Act since year ended December 31, 2006. In May 2005, the Company established the Internal Control Committee and the Internal Control Project Secretariat (reorganized and renamed the Internal Control Promotion Department in March 2006) to perform concrete planning and execution under the direction of the Internal Control Committee. The Company is engaged in the establishment and strengthening of an internal controls system, primarily in response to the Sarbanes-Oxley Act. The Company will be required to be in compliance with Japan’s Financial Instruments and Exchange Law, which will make the submission of an “Internal Control Report” compulsory, when it comes into force in fiscal 2009.
(d) Compliance Committee
The Compliance Committee at the Company is responsible for strengthening and promoting a company-wide structure for compliance. The Company has prepared a compliance manual that is distributed to all officers and employees of J:COM Group companies, and conducts
15
compliance training in an effort to secure a solid foundation for ensuring compliance.
In addition, the Company has been promoting its “Speak Up” initiative for internal reporting at J:COM Group companies since May 2005. The initiative provides an avenue for employees to speak up about compliance issues through direct consultation with the Compliance Committee and outside lawyers. The initiative functions as a safeguard against situations that, for whatever reason, make it difficult to deal with or report compliance issues under the normal chain of command. In May 2006, the Company’s full-time auditor was added to the list of contact persons for employees to report information.
(e) Information Security Committee
The Information Security Committee at the Company meets regularly to promote stronger measures for information security. The Information Security Committee’s initiatives include implementing security-hole measures for all systems. The Company is also taking steps to strengthen its protection of personal information. Almost all group companies have acquired certification under the Privacy Mark program operated by Japan Information Processing Development Corporation.
As part of its risk management structure, the Company has passed out “risk management manuals” to all the J:COM Group companies, to ensure stable provision of services and swift response to network interruptions.
16
IV. Consolidated Annual Financial Statements
JUPITER TELECOMMUNICATIONS CO., LTD.
AND SUBSIDIARIES
CONSOLIDATED STATEMENTS OF OPERATIONS
|
| (YEN IN MILLIONS, EXCEPT SHARE AND PER SHARE AMOUNTS) |
| ||||||
|
|
|
| ||||||
|
| Year ended December |
| Year ended December |
| Change |
| ||
Account |
| Amount |
| Amount |
| Amount |
| (%) |
|
Revenue: |
|
|
|
|
|
|
|
|
|
Subscription fees |
| 230,061 |
| 196,515 |
| 33,546 |
| 17.1 |
|
Other |
| 34,447 |
| 25,400 |
| 9,047 |
| 35.6 |
|
|
| 264,508 |
| 221,915 |
| 42,593 |
| 19.2 |
|
Operating costs and expenses |
|
|
|
|
|
|
|
|
|
Operating and programming costs |
| (104,748 | ) | (92,297 | ) | (12,451 | ) | (13.5 | ) |
Selling, general and administrative |
| (52,722 | ) | (43,992 | ) | (8,730 | ) | (19.8 | ) |
Depreciation and amortization |
| (64,222 | ) | (54,044 | ) | (10,178 | ) | (18.8 | ) |
|
| (221,692 | ) | (190,333 | ) | (31,359 | ) | (16.5 | ) |
Operating income |
| 42,816 |
| 31,582 |
| 11,234 |
| 35.6 |
|
Other income (expenses): |
|
|
|
|
|
|
|
|
|
Interest expense, net: |
|
|
|
|
|
|
|
|
|
Related parties |
| (1,332 | ) | (1,109 | ) | (223 | ) | (20.1 | ) |
Other |
| (2,944 | ) | (2,413 | ) | (531 | ) | (22.0 | ) |
Other income, net |
| 558 |
| 253 |
| 305 |
| 119.2 |
|
Income before income taxes and other items |
| 39,098 |
| 28,313 |
| 10,785 |
| 38.1 |
|
Equity in earnings of affiliates |
| 291 |
| 371 |
| (80 | ) | (21.5 | ) |
Minority interest in net income of consolidated subsidiaries |
| (1,883 | ) | (1,181 | ) | (702 | ) | (59.4 | ) |
Income before income taxes |
| 37,506 |
| 27,503 |
| 10,003 |
| 36.4 |
|
Income tax expense |
| (13,514 | ) | (3,022 | ) | (10,492 | ) | (347.1 | ) |
Net income |
| 23,992 |
| 24,481 |
| (489 | ) | (2.0 | ) |
Per Share data |
|
|
|
|
|
|
|
|
|
Net income per share – basic |
| 3,650.27 |
| 3,844.83 |
| (194.56 | ) | (5.1 | ) |
Net income per share – diluted |
| 3,638.93 |
| 3,838.33 |
| (199.40 | ) | (5.2 | ) |
Weighted average number of ordinary shares outstanding – basic |
| 6,572,638 |
| 6,367,220 |
| 205,418 |
| 3.2 |
|
Weighted average number of ordinary shares outstanding – diluted |
| 6,593,130 |
| 6,378,001 |
| 215,129 |
| 3.4 |
|
|
|
|
|
|
|
|
|
|
|
(Note) Percentages are calculated based on amounts before rounding.
17
JUPITER TELECOMMUNICATIONS CO., LTD.
AND SUBSIDIARIES
CONSOLIDATED BALANCE SHEETS
|
| (YEN IN MILLIONS) |
| ||||
|
|
|
| ||||
|
| December 31, 2007 |
| December 31, 2006 |
| Change |
|
Account |
| Amount |
| Amount |
| Amount |
|
Current assets: |
|
|
|
|
|
|
|
Cash and cash equivalents |
| 22,890 |
| 20,486 |
| 2,404 |
|
Accounts receivable |
| 13,198 |
| 14,245 |
| (1,047 | ) |
Allowance for doubtful accounts |
| (356 | ) | (378 | ) | 22 |
|
Deferred tax asset–current |
| 11,738 |
| 11,877 |
| (139 | ) |
Prepaid expenses and other current assets |
| 5,164 |
| 4,669 |
| 495 |
|
Total current assets |
| 52,634 |
| 50,899 |
| 1,735 |
|
Investments: |
|
|
|
|
|
|
|
Investments in affiliates |
| 19,502 |
| 2,469 |
| 17,033 |
|
Investments in other securities, at cost |
| 2,139 |
| 801 |
| 1,338 |
|
Total investments |
| 21,641 |
| 3,270 |
| 18,371 |
|
Property and equipment, at cost: |
|
|
|
|
|
|
|
Land |
| 2,789 |
| 2,845 |
| (56 | ) |
Distribution system and equipment |
| 523,599 |
| 480,363 |
| 43,236 |
|
Support equipment and buildings |
| 39,148 |
| 32,554 |
| 6,594 |
|
|
| 565,536 |
| 515,762 |
| 49,774 |
|
Less accumulated depreciation |
| (228,341 | ) | (180,594 | ) | (47,747 | ) |
Total property and equipment, at cost |
| 337,195 |
| 335,168 |
| 2,027 |
|
Other assets: |
|
|
|
|
|
|
|
Goodwill |
| 221,493 |
| 202,267 |
| 19,226 |
|
Identifiable intangible asset – customer lists, net |
| 32,862 |
| 21,181 |
| 11,681 |
|
Deferred tax asset–non current |
| 4,423 |
| 5,629 |
| (1,206 | ) |
Other |
| 10,168 |
| 7,534 |
| 2,634 |
|
Total other assets |
| 268,946 |
| 236,611 |
| 32,335 |
|
Total assets |
| 680,416 |
| 625,948 |
| 54,468 |
|
18
|
| December 31, 2007 |
| December 31, 2006 |
| Change |
|
Account |
| Amount |
| Amount |
| Amount |
|
Current liabilities: |
|
|
|
|
|
|
|
Short-term loans |
| 2,625 |
| 2,000 |
| 625 |
|
Long-term debt–current portion |
| 21,308 |
| 16,158 |
| 5,150 |
|
Capital lease obligations–current portion |
|
|
|
|
|
|
|
Related parties |
| 11,671 |
| 10,893 |
| 778 |
|
Other |
| 2,947 |
| 1,988 |
| 959 |
|
Accounts payable |
| 24,279 |
| 26,166 |
| (1,887 | ) |
Income tax payable |
| 7,082 |
| 3,411 |
| 3,671 |
|
Deposit from related parties |
| 3,536 |
| — |
| 3,536 |
|
Deferred revenue–current portion |
| 6,088 |
| 4,862 |
| 1,226 |
|
Accrued expenses and other liabilities |
| 6,236 |
| 5,424 |
| 812 |
|
Total current liabilities |
| 85,772 |
| 70,902 |
| 14,870 |
|
|
|
|
|
|
|
|
|
Long-term debt, less current portion |
| 143,219 |
| 173,455 |
| (30,236 | ) |
Capital lease obligations, less current portion: |
|
|
|
|
|
|
|
Related parties |
| 34,335 |
| 30,595 |
| 3,740 |
|
Other |
| 6,911 |
| 6,986 |
| (75 | ) |
Deferred revenue |
| 54,708 |
| 55,044 |
| (336 | ) |
Redeemable preferred stock of consolidated subsidiary |
| 500 |
| 500 |
| — |
|
Deferred tax liability – non current |
| 12,643 |
| 4,604 |
| 8,039 |
|
Other liabilities |
| 6,920 |
| 2,516 |
| 4,404 |
|
Total liabilities |
| 345,008 |
| 344,602 |
| 406 |
|
Minority interests |
| 5,399 |
| 4,050 |
| 1,349 |
|
Shareholders’ equity: |
|
|
|
|
|
|
|
Ordinary shares no par value |
| 116,734 |
| 115,232 |
| 1,502 |
|
Additional paid-in capital |
| 231,493 |
| 196,335 |
| 35,158 |
|
Accumulated deficit |
| (10,079 | ) | (34,071 | ) | 23,992 |
|
Accumulated other comprehensive loss |
| (619 | ) | (200 | ) | (419 | ) |
Treasury stock |
| (7,520 | ) | (0 | ) | (7,520 | ) |
Total shareholders’ equity |
| 330,009 |
| 277,296 |
| 52,713 |
|
Total liabilities, minority interests and shareholders’ equity |
| 680,416 |
| 625,948 |
| 54,468 |
|
(Note)The Company presented “Deferred tax liabilities-non current” separately from “Other Liabilities” for all periods presented
19
JUPITER TELECOMMUNICATIONS CO., LTD.
AND SUBSIDIARIES
Consolidated Statements of Shareholders’ Equity
(YEN IN MILLIONS)
|
| Ordinary |
| Additional paid |
| Comprehensive |
| Accumulated |
| Accumulated |
| Treasury Stock at cost |
| Total |
|
Balance at January 1, 2006 |
| 114,481 |
| 195,219 |
|
|
| (58,353 | ) | 98 |
| (0 | ) | 251,445 |
|
Net Income |
|
|
|
|
| 24,481 |
| 24,481 |
|
|
|
|
| 24,481 |
|
Unrecognized loss of acquired companies |
|
|
|
|
|
|
| (199 | ) |
|
|
|
| (199 | ) |
Other comprehensive income: |
|
|
|
|
|
|
|
|
|
|
|
|
|
|
|
Changes in the fair value of derivative financial instruments |
|
|
|
|
| (298 | ) |
|
| (298 | ) |
|
| (298 | ) |
Comprehensive income |
|
|
|
|
| 24,183 |
|
|
|
|
|
|
| — |
|
Stock option exercise |
| 751 |
| 782 |
|
|
|
|
|
|
|
|
| 1,533 |
|
Stock compensation (includes paid not issued options) |
|
|
| 334 |
|
|
|
|
|
|
|
|
| 334 |
|
Purchase of treasury stock |
|
|
|
|
|
|
|
|
|
|
| (0 | ) | (0 | ) |
Balance at December 31, 2006 |
| 115,232 |
| 196,335 |
|
|
| (34,071 | ) | (200 | ) | (0 | ) | 277,296 |
|
Net income: |
|
|
|
|
| 23,992 |
| 23,992 |
|
|
|
|
| 23,992 |
|
Unrecognized loss of acquired companies |
|
|
|
|
|
|
| — |
|
|
|
|
| — |
|
Other comprehensive income: |
|
|
|
|
|
|
|
|
|
|
|
|
|
|
|
Changes in the fair value of derivative financial instruments |
|
|
|
|
| (419 | ) |
|
| (419 | ) |
|
| (419 | ) |
Comprehensive income |
|
|
|
|
| 23,573 |
|
|
|
|
|
|
|
|
|
Stock option exercise |
| 1,502 |
| 1,470 |
|
|
|
|
|
|
|
|
| 2,972 |
|
Stock compensation (includes paid not issued options) |
|
|
| 141 |
|
|
|
|
|
|
|
|
| 141 |
|
Increase due to merger |
|
|
| 33,547 |
|
|
|
|
|
|
|
|
| 33,547 |
|
Purchase of treasury stock |
|
|
|
|
|
|
|
|
|
|
| (7,520 | ) | (7,520 | ) |
Balance at December 31, 2007 |
| 116,734 |
| 231,493 |
|
|
| (10,079 | ) | (619 | ) | (7,520 | ) | 330,009 |
|
20
JUPITER TELECOMMUNICATIONS CO., LTD.
AND SUBSIDIARIES
CONSOLIDATED STATEMENTS OF CASH FLOWS
(YEN IN MILLIONS)
|
| Year ended December |
| Year ended December |
|
Classification |
| Amount |
| Amount |
|
Cash flows from operating activities: |
|
|
|
|
|
Net income |
| 23,992 |
| 24,481 |
|
Adjustments to reconcile net income to net cash provided by operating activities: |
|
|
|
|
|
Depreciation and amortization |
| 64,222 |
| 54,044 |
|
Equity in earnings of affiliates |
| (291 | ) | (371 | ) |
Minority interest in net income of consolidated subsidiaries |
| 1,883 |
| 1,181 |
|
Stock compensation expenses |
| 140 |
| 332 |
|
Deferred income taxes |
| 1,657 |
| (1,328 | ) |
Changes in operating assets and liabilities, excluding effects of business combinations: |
|
|
|
|
|
Decrease in accounts receivable, net |
| 2,477 |
| 436 |
|
(Increase)/decrease in prepaid expenses and other current assets |
| 214 |
| (674 | ) |
(Increase)/decrease in other assets |
| (2,478 | ) | 1,102 |
|
Increase in accounts payable |
| 412 |
| 864 |
|
Increase in accrued expenses and other liabilities |
| 2,834 |
| 2,501 |
|
Increase/(decrease) in deferred revenue |
| 164 |
| (2,565 | ) |
Net cash provided by operating activities |
| 95,226 |
| 80,003 |
|
Cash flows from investing activities: |
|
|
|
|
|
Capital expenditures |
| (46,348 | ) | (48,460 | ) |
Acquisitions of new subsidiaries, net of cash acquired |
| 634 |
| (56,137 | ) |
Investments in and advances to affiliates |
| (1,138 | ) | — |
|
Loan to related parties |
| (5,166 | ) | — |
|
Principle received from related party |
| 1,350 |
| — |
|
Acquisition of minority interests in consolidated subsidiaries |
| (2,543 | ) | (17,587 | ) |
Other investing activities |
| 483 |
| 583 |
|
Net cash used in investing activities |
| (52,728 | ) | (121,601 | ) |
Cash flows from financing activities: |
|
|
|
|
|
Proceeds from issuance of common stock |
| 2,973 |
| 1,533 |
|
Purchase of treasury stock |
| (7,520 | ) | (0 | ) |
Net increase in short-term loans |
| 335 |
| 93 |
|
Proceeds from long-term debt |
| 613 |
| 106,789 |
|
Principal payments of long-term debt |
| (25,699 | ) | (66,975 | ) |
Principal payments under capital lease obligations |
| (15,689 | ) | (13,455 | ) |
Other financing activities |
| 4,893 |
| (1,184 | ) |
Net cash provided by (used in) financing activities |
| (40,094 | ) | 26,801 |
|
Net increase/(decrease) in cash and cash equivalents |
| 2,404 |
| (14,797 | ) |
Cash and cash equivalents at beginning of year |
| 20,486 |
| 35,283 |
|
Cash and cash equivalents at end of term |
| 22,890 |
| 20,486 |
|
21
Summary of significant accounting policies
1. Scope of consolidation
(1) Number of consolidated subsidiaries: 32
(2) The names of the Company’s consolidated subsidiaries are shown in “II. Status of the Jupiter Telecommunications Co., Ltd.(J:COM) Group”.
2. Scope of application of equity method
(1) Number of equity method affiliates: 11
(2) The names of these affiliates are shown in “II.Status of the Jupiter Telecommunications Co., Ltd.(J:COM) Group”.
3. Fiscal year end
The fiscal year end for all consolidated subsidiaries is the same as the date of consolidation
4. Significant accounting policies
(1) Accounting standards used to prepare financial statements
The Company prepares its annual consolidated financial statements using terminology, forms and methods of preparation required under accounting principles generally accepted in the United States of America.
(2) Securities valuation standards and valuation method
To value its securities, the Company applies Statement of Financial Accounting Standards (“SFAS”) No. 115, “Accounting for Certain Investments in Debt and Equity Securities.”
Investments in affiliates (excluding loans): |
| Equity method |
Investments in other securities: |
| Cost method |
When investments in affiliates and unmarketable stocks decline in value, the Company considers the possibility of recognizing impairment losses, if such declines are deemed to be other-than-temporary.
(3) Valuation standards and valuation methods for derivatives
The Company accounts for derivatives based on SFAS No.133 “Accounting for Certain Derivative Instruments and Hedging Activities” as amended. According to SFAS No. 133, as amended, all derivatives must be fairly valued and recognized on the balance sheet as assets or liabilities.
· Derivative instrument designated and effectively active as a fair value hedge:
Changes in the fair value of derivative instruments and of the assets or liabilities being hedged are recognized as periodic income/loss.
· Derivative instrument designated as cash flow hedge—regarding the portion effectively active as a hedge:
Until income/losses on the assets or liabilities being hedged are recognized on the income statement, they must be recognized as other comprehensive income/loss.
· Derivative instrument designated as cash flow hedge—regarding the portion that is not effectively active as a hedge:
Recognized as periodic income/loss.
· Derivative instruments not designated as hedge:
Changes in fair value recognized as periodic income/loss.
(4) Accounting for long-lived assets
For long-term assets other than goodwill, the Company evaluates the need for impairment losses on the guidance in SFAS No. 144 “Accounting for the Impairment or Disposal of Long-Lived Assets”, whenever events or changes in circumstances indicate that the carrying amount of an asset may not be recoverable.
(5) Depreciation method for tangible fixed assets
The straight-line method is applied.
Useful lives of major assets:
Distribution equipment: |
| 10 - 17 years |
Buildings: |
| 15 - 40 years |
Support equipment and buildings: |
| 5 - 15 years |
(Assets acquired through capital leases are depreciated over periods ranging from 2-20 years.)
(6) Valuation standards and valuation methods for goodwill
The Company recognizes as goodwill the difference between costs of acquisition of consolidated subsidiaries and the estimated fair value of the net assets of applicable companies.
In accordance with SFAS No. 142, “Goodwill and Other Intangible Assets,” the Company conducts an impairment test once each year or whenever an event occurs that suggests the possibility of impairment.
22
(7) Accounting methods of Asset Retirement Obligation
The company applies FASB Interpretation No. 47 which clarifies that the term asset retirement obligation as used in FASB Statement No.143, Accounting for Asset Retirement Obligations. This interpretation requires us to recognize a liability for the fair value of a conditional asset retirement obligation if the fair value of the liability can be reasonably estimated.
(8) Standards for recognition of important allowances
Bad debt allowance
The Company calculates a bad debt allowance on the basis of our best estimate of probable future losses on accounts receivable. It also recognizes estimated uncollectible amounts when such allowances are required.
(9) Lease transactions
The Company accounts for leases in accordance with SFAS No.13 “Accounting for Leases.”
(10) Amortization of identifiable intangible assets
Intangible assets consist of customer relationships, which are amortized over the expected lives of our customers (up to 10 years).
Intangible assets consist of distribution franchise, which are amortized over the expected lives of our customers (up to 20 years).
(11) Income Taxes
The Company and its subsidiaries account for income taxes under the asset and liability method. Deferred tax assets and liabilities are recognized for the future tax consequences attributable to differences between the financial statement carrying amounts of existing assets and liabilities and their respective tax bases and operating loss and tax credit carryforwards. Deferred tax assets and liabilities are measured using enacted tax rates expected to apply to taxable income in the years in which those temporary differences are expected to be recovered or settled. The effect on deferred tax assets and liabilities of a change in tax rates is recognized in income in the period that includes the enactment date.
(12) Revenue Recognition
The Company and its subsidiaries recognize cable television, high-speed Internet access, telephony and programming revenues when such services are provided to subscribers. Revenues derived from other sources are recognized when services are provided, events occur or products are delivered. Initial subscriber installation revenues are recognized in the period in which the related services are provided to the extent of direct selling costs. Any remaining amount is deferred and recognized over the estimated average period that the subscribers are expected to remain connected to the cable television system. Historically, installation revenues have been less than related direct selling costs, therefore such revenues have been recognized as installations are completed.The Company and its subsidiaries provide poor reception rebroadcasting services to noncable television viewers suffering from poor reception of television waves caused by artificial obstacles. The Company and its subsidiaries enter into agreements with parties that have built obstacles causing poor reception for construction and maintenance of cable facilities to provide such services to the affected viewers at no cost to them during the agreement period. Under these agreements, the Company and its subsidiaries receive up-front, lump-sum compensation payments for construction and maintenance. Revenues from these agreements have been deferred and are being recognized in income on a straight-line basis over the agreement periods which are generally 20 years. Such revenues are included in revenue - other in the accompanying consolidated statements of operations.The Company’s channels distribute programming to individual satellite platform subscribers through an agreement with the platform operator which provides subscriber management services to channels in return for a fee based on subscription revenues. Individual satellite subscribers pay a monthly fee for programming channels under the terms of rolling one-month subscription contracts. Cable and broadband service providers generally pay a per-subscriber fee for the right to distribute the company’s programming on their systems under the terms of generally annual distribution contracts. Revenue for such services is recognized in the periods in which programming services are provided to cable, satellite and broadband subscribers.
(13) Stock compensation
The FASB issued SFAS No. 123 (Revised 2004) (SFAS No. 123R) in December 2004. SFAS No. 123R is a revision of SFAS No. 123 Accounting for Stock-Based Compensation. SFAS No. 123R requires a public entity to measure the cost of employee services received in exchange for an award of equity instruments based on the grant-date fair value of the award. That cost will be recognized over the period during which an employee is required to provide service in exchange for the award. The company has applied the modified prospective method to adopt SFAS No. 123R since January 1, 2006.
(14) Business combination
The company merged with JTV on September 1, 2007 by issuing the company’s ordinary shares to LGI and Sumitomo in exchange for their JTV ordinary shares. Under the provisions of SFAS 141, Business Combinations, the JTV interest acquired from LGI, our consolidating parent has been treated as a transaction between entities under common control (recognized at book value), whereas, the JTV interest acquired from Sumitomo has been accounted for using the purchase method of accounting (recognized at fair value). Accordingly, the excess of our
23
acquisition costs over the fair value of net assets acquired from JTV was allocated to goodwill. The opening balance sheet of JTV is based on preliminary purchase price allocations and is therefore subject to adjustment based on our final assessment of the fair value of tangible and intangible assets and liabilities.
Notes to Annual Consolidated Financial Statements
Segment Information
(1) Operating segments
The Jupiter Telecommunications Group (the Company and its consolidated subsidiaries) operates a single segment which it calls the broadband businesses. Therefore, information on operating segments has been omitted in this section.
(2) Segment information by region
Because the Company does not have any overseas subsidiaries or branches, this section is not applicable.
Earning per share
|
| Year ended |
| ||||
|
| 2007 |
| 2006 |
| ||
Net income (Yen in Million) |
| ¥ | 23,992 |
| ¥ | 24,481 |
|
|
|
|
|
|
| ||
Weighted average common shares outstanding: |
|
|
|
|
| ||
Basic |
| 6,572,638 |
| 6,367,220 |
| ||
Effect of dilutive common stock equivalents |
| 20,492 |
| 10,781 |
| ||
Diluted |
| 6,593,130 |
| 6,378,001 |
| ||
|
|
|
|
|
| ||
Earnings per share (Yen): |
|
|
|
|
| ||
Basic |
| ¥ | 3,650.27 |
| ¥ | 3,844.83 |
|
Diluted |
| ¥ | 3,638.93 |
| ¥ | 3,838.33 |
|
Subsequent events
None
24
J:COM
Highlights of 2007 |
January 30, 2008
Jupiter Telecommunications Co., Ltd.
Unit: Yen in 100 million (rounding in 10 million yen)
|
|
|
|
|
|
|
|
|
|
|
| ||||||||||
P/L |
| Year ended 2007 | Year ended 2006 | Change |
| Forecasts for the | 2007 results vs |
| Explanation of changes | ||||||||||||
|
|
| |||||||||||||||||||
| Amount | % |
|
| |||||||||||||||||
|
|
|
|
|
|
|
|
|
|
|
|
| |||||||||
Revenue: |
|
|
|
|
|
|
|
|
|
| Subscription fee breakdown: Cable TV 1,231(+203, or +20%), HS Internet 666(+84, or +15%), Telephony 404(+48, or +14%). Effect of acquisitions (+163)
Effect of acquisitions (+63)
Effect of acquisitions (+226)
In line with increase in subscribers, increases in labor and other related costs, network ,maintenance, and construction. Effect of acquisitions (+78)
Increase due to effect of acquisitions (+67), and higher labor and employee related costs.
“Increase in fixed assets related to the installation of services to new customers. Effect of acquisitions (+67)
Primarily, due to additional borrowings related to the acquisition of CW. | ||||||||||
| Subscription fee |
| 2,301 | 1,965 | 335 | 17% |
|
|
|
|
| ||||||||||
|
|
|
|
|
|
|
|
|
|
|
| ||||||||||
| Other |
| 344 | 254 | 90 | 36% |
|
|
|
|
| ||||||||||
|
| Total |
| 2,645 | 2,219 | 426 | 19% |
| 2,950 | 12% |
|
| |||||||||
Operating costs and expenses: |
|
|
|
|
|
|
|
|
|
| |||||||||||
| Operating & programming costs |
| 1,047 | 923 | 125 | 13% |
|
|
|
|
| ||||||||||
|
|
|
|
|
|
|
|
|
|
|
| ||||||||||
| Selling, general & administrative |
| 527 | 440 | 87 | 20% |
|
|
|
|
| ||||||||||
|
|
|
|
|
|
|
|
|
|
|
| ||||||||||
| Depreciation & amortization |
| 642 | 540 | 102 | 19% |
|
|
|
|
| ||||||||||
Operating income |
| 428 | 316 | 112 | 36% |
| 500 | 17% |
|
| |||||||||||
Other income (expense): |
|
|
|
|
|
|
|
|
|
| |||||||||||
| Interest expense, net |
| 43 | 35 | 8 | 21% |
|
|
|
|
| ||||||||||
| Other income, net |
| 6 | 3 | 3 | 119% |
|
|
|
|
| ||||||||||
Income before tax, equity, minority |
| 391 | 283 | 108 | 38% |
|
|
|
|
| |||||||||||
| Equity in earnings of affiliates |
| 3 | 4 | (1) | (21)% |
|
|
|
|
| ||||||||||
| Minority interest in net income |
| 19 | 12 | 7 | 59% |
|
|
|
|
| ||||||||||
Income before income taxes |
| 375 | 275 | 100 | 36% |
| 450 | 20% |
|
| |||||||||||
| Income taxes |
| 135 | 30 | 105 | 347% |
|
|
|
|
| ||||||||||
Net income |
| 240 | 245 | (5) | (2)% |
| 270 | 13% |
|
| |||||||||||
|
|
|
|
|
|
|
|
|
|
|
|
|
| ||||||||
|
|
|
|
|
|
|
|
|
|
|
|
|
|
|
|
|
|
| |||
OCF *1 |
| 1,072 | 860 | 212 | 25% |
|
|
|
|
|
|
|
|
|
|
| |||||
Margin |
|
| 40.5% | 38.7% | 1.8% |
|
|
|
|
|
|
|
|
|
|
|
| ||||
*1 : OCF (Operating Cash Flow) : Revenue less Operating & programming costs less Selling, general & administrative expenses (exclusive of stock compensation, depreciation, and amortization) |
|
|
|
|
|
|
|
| |||||||||||||
|
|
|
|
|
|
|
|
|
|
|
|
|
|
|
|
|
|
| |||
Assets and Liabilities |
| As of Dec. | As of Dec. | Change |
|
|
|
|
|
| Capital |
| Year ended December 31, 2007 | Year ended | Change | ||||||
|
|
|
|
|
|
|
| Amount | % | ||||||||||||
|
|
|
|
|
|
|
|
|
|
|
|
|
|
|
|
|
|
|
| ||
Total Assets |
| 6,804 | 6,259 | 545 |
|
|
|
|
|
| Capital expenditures |
| 463 | 485 | (21) | (4)% | |||||
Equity |
| 3,300 | 2,773 | 527 |
|
|
|
|
|
| Capital lease expenditure |
| 189 | 174 | 15 | 9% | |||||
Equity capital ratio to total assets |
| 49% | 44% | 4% |
|
|
|
|
|
| Total |
| 653 | 659 | (6) | (1)% | |||||
Debt |
| 2,230 | 2,421 | (191) |
|
|
|
|
|
|
|
|
|
|
|
|
| ||||
Net Debt |
| 2,001 | 2,216 | (215) |
|
|
|
|
|
|
|
|
|
|
|
|
| ||||
D/E Ratio (Net) |
| 0.61 | 0.80 | (0.19) |
|
|
|
|
|
|
|
|
|
|
|
|
| ||||
|
|
|
|
|
|
|
|
|
|
|
|
|
|
|
|
|
|
|
| ||
|
|
|
|
|
|
|
|
|
|
|
|
|
|
| |||||||
Cash Flows |
| Year ended | Year ended |
| Explanation |
|
|
|
|
|
|
|
|
| |||||||
|
|
|
|
|
|
|
|
|
|
|
|
|
|
| |||||||
Cash provided by operating activities |
| 952 | 800 |
| OCF(1,072) |
|
|
|
|
|
|
|
|
| |||||||
Cash used in investing activities |
| (527) | (1,216) |
| Capital expenditure(463) |
|
|
|
|
|
|
|
|
| |||||||
|
|
|
|
|
|
|
|
|
|
|
|
|
|
|
| ||||||
| Free Cash Flow |
| 299 | 141 |
| (Cash provided by operating activities 952) - (Capital expenditure incl. Capital Lease 653) |
|
|
|
|
|
|
|
|
| ||||||
|
|
|
|
|
|
|
|
|
|
|
|
|
| ||||||||
Cash used in financing activities |
| (401) | 268 |
| Principal payment of debt (248) and capital lease (157) |
|
|
|
|
|
|
|
| ||||||||
Increase/(decrease) in cash |
| 24 | (148) |
|
|
|
|
|
|
|
|
|
| ||||||||
(Note) Amount and percentages are calculated based on financial statements in Change column.
(Cautionary note regarding future-related information) |
The forecasts contained in this report have been prepared on the basis of information that is currently available. Because such estimates are inherently very uncertain, actual results may differ from the forecasts. The Company does not guarantee that it will achieve these estimated results and advises readers to refrain from depending solely on these forecasts. Readers should also note that the Company is under no obligation to revise this information on a regular basis. |
25
J:COM
Highlights of 2007 |
J:COM Group |
| As of Dec. 31 | As of Dec. 31 | Change |
| Explanation of changes |
| ||||||||||
|
|
|
|
|
|
|
|
|
| ||||||||
|
|
|
|
|
|
|
| Merger of Kobe Ashiya with Cable TV Kobe(-1), and Kanto with Setamachi and Chofu.(-2) |
| ||||||||
Consolidated subsidiaries |
|
|
|
|
|
|
| ||||||||||
|
| CATV company |
| 20 | 23 | (3) | (a) | Acquisition of Jupiter Visual Communications.(+1) |
| ||||||||
|
| Others |
| 12 | 4 | 8 |
| “In line with merger with Jupiter TV, Jupiter Entertainment, Jupiter Golf Network, Jupiter VOD, |
| ||||||||
|
| Total |
| 32 | 27 | 5 | (1) | Reality TV Japan, JSBC2, Jupiter Sports and J Sports LLC were consolidated.(+7) Later, Jupiter VOD |
| ||||||||
Equity-method affiliates |
|
|
|
|
| merged with Jupiter Entertainment.(-1) Establishment of Channel Ginga.(+1)” |
| ||||||||||
|
| CATV company |
| 3 | 2 | 1 | (b) |
|
| ||||||||
|
| Others |
| 8 | 3 | 5 |
| Kyoto Cable Communications became equity-method affiliates.(+1) |
| ||||||||
|
|
|
|
|
|
|
|
|
| ||||||||
|
| Total |
| 11 | 5 | 6 | (2) | In line with merger with Jupiter TV, Discovery Japan, Animal Planet Japan, J SPORTS Broadcasting, |
| ||||||||
|
| Group total (1) + (2) |
| 43 | 32 | 11 |
| AXN Japan, Jupiter Satellite and Intrac TV were included. (+6) |
| ||||||||
|
| CATV company Total |
| 23 | 25 | (2) |
| Jupiter VOD became subsidiaries.(-1)” |
| ||||||||
|
|
|
|
|
|
|
|
|
|
|
|
|
|
|
|
|
|
|
|
|
|
|
|
|
|
|
|
|
|
|
|
|
|
|
|
Consolidated systems (A+B) *7 |
|
|
|
|
|
|
| A. Consolidated systems |
|
|
|
|
|
| |||
Operational Data |
| As of Dec. 31 | As of Dec. 31 | Change |
|
|
| As of Dec. 31, | As of Dec. 31 | Change |
|
|
|
|
| ||
|
|
|
|
|
|
|
|
|
|
|
|
|
|
|
|
|
|
RGUs |
|
|
|
|
|
|
|
|
|
|
|
|
|
|
|
| |
|
| CATV |
| 2,188,000 | 2,109,300 | 78,700 |
|
|
| 1,866,400 | 1,799,700 | 66,700 |
|
|
|
|
|
|
| of which digital service |
| 1,470,200 | 1,088,900 | 381,300 |
|
|
| 1,241,200 | 921,300 | 319,900 |
|
|
|
|
|
|
| HS Internet access |
| 1,470,200 | 1,108,800 | 102,800 |
|
|
| 1,066,200 | 978,900 | 87,300 |
|
|
|
|
|
|
| Telephony |
| 1,312,600 | 1,119,900 | 192,700 |
|
|
| 1,243,900 | 1,097,000 | 146,900 |
|
|
|
|
|
|
| Total |
| 4,712,200 | 4,338,000 | 374,200 |
|
|
| 4,176,500 | 3,875,600 | 300,900 |
|
|
|
|
|
|
|
|
|
|
|
|
|
|
|
|
|
|
|
|
|
|
|
Customers connected |
| 2,659,100 | 2,512,200 | 146,900 |
|
|
| 2,301,300 | 2,177,500 | 123,800 |
|
|
|
|
| ||
|
|
|
|
|
|
|
|
|
|
|
|
|
|
|
|
|
|
Homes passed |
| 9,438,200 | 9,206,100 | 232,100 |
|
|
| 8,039,900 | 7,807,800 | 232,100 |
|
|
|
|
| ||
|
|
|
|
|
|
|
|
|
|
|
|
|
|
|
|
|
|
Average number of RGUs per customer |
| 1.77 | 1.73 | 0.04 |
|
|
| 1.81 | 1.78 | 0.03 |
|
|
|
|
| ||
|
|
|
|
|
|
|
|
|
|
|
|
|
|
|
|
|
|
Rate of customers taking 3 services |
| 24.8% | — | — |
|
|
| 26.7% | 24.8% | 1.9% |
|
|
|
|
| ||
|
|
|
|
|
|
|
|
|
|
|
|
|
|
|
|
|
|
ARPU *2 |
| \7,687 | — | — |
|
|
| \7,946 | 7,787 | \159 |
|
|
|
|
| ||
| (Average revenue per customer per month) |
| 3* |
|
|
|
|
| *3 | *4 |
|
|
|
|
|
| |
Monthly churn rate *5 |
|
|
|
|
|
|
|
|
|
|
|
|
|
|
| ||
|
| CATV |
| 1.0% | — | — |
|
|
| 1.0% | 1.1% | (0.1)% |
|
|
|
|
|
|
| HS Internet access |
| 1.3% | — | — |
|
|
| 1.3% | 1.3% | (0.0)% |
|
|
|
|
|
|
| Telephony |
| 0.7% | — | — |
|
|
| 0.8% | 0.8% | (0.0)% |
|
|
|
|
|
|
|
|
|
|
|
|
|
|
|
|
|
|
|
|
|
|
|
|
|
|
|
|
|
|
|
|
|
|
|
|
|
|
|
|
|
[Reference] |
|
|
|
|
|
|
|
|
|
|
|
|
|
|
| ||
|
|
|
|
|
|
|
|
|
|
|
|
|
|
|
|
|
|
Total of managed systems *7 *8 |
|
|
|
|
|
|
| B. CW Group *6 |
|
|
|
|
| ||||
|
|
|
|
|
|
|
|
|
|
|
|
|
|
| |||
Operational Data |
| As of Dec. 31 | As of Dec. 31 | Change |
|
|
| As of Dec. 31, | As of Dec. 31 | Change |
|
|
|
|
| ||
|
|
|
|
|
|
|
|
|
|
|
|
|
|
|
|
|
|
RGUs |
|
|
|
|
|
|
|
|
|
|
|
|
|
|
|
| |
|
| CATV |
| 2,274,600 | 2,195,900 | 78,700 |
|
|
| 321,600 | 309,600 | 12,000 |
|
|
|
|
|
|
| of which digital service |
| 1,523,100 | 1,127,500 | 395,600 |
|
|
| 229,000 | 167,600 | 61,400 |
|
|
|
|
|
|
| HS Internet access |
| 1,254,600 | 1,149,100 | 105,500 |
|
|
| 145,400 | 129,900 | 15,500 |
|
|
|
|
|
|
| Telephony |
| 1,370,800 | 1,173,600 | 197,200 |
|
|
| 68,700 | 22,900 | 45,800 |
|
|
|
|
|
|
| Total |
| 4,900,000 | 4,518,600 | 381,400 |
|
|
| 535,700 | 462,400 | 73,300 |
|
|
|
|
|
|
|
|
|
|
|
|
|
|
|
|
|
|
|
|
|
|
|
Customers connected |
| 2,772,200 | 2,621,700 | 150,500 |
|
|
| 357,800 | 334,700 | 23,100 |
|
|
|
|
| ||
|
|
|
|
|
|
|
|
|
|
|
|
|
|
|
| ||
Homes passed |
| 9,973,000 | 9,736,000 | 237,000 |
|
|
| 1,398,300 | 1,398,300 | 0 |
|
|
|
|
| ||
|
|
|
|
|
|
|
|
|
|
|
|
|
|
|
| ||
Average number of RGUs per customer |
| 1.77 | 1.72 | 0.05 |
|
|
| 1.50 | 1.38 | 0.12 |
|
|
|
|
| ||
|
|
|
|
|
|
|
|
|
|
|
|
|
|
|
| ||
Rate of customers taking 3 services |
| 24.6% | — | — |
|
|
| 13.0% | — | — |
|
|
|
|
| ||
|
|
|
|
|
|
|
|
|
|
|
|
|
|
|
|
|
|
ARPU *2 |
| \7,673 | — | — |
|
|
| \6,013 | — | — |
|
|
|
|
| ||
| (Average revenue per customer per month) |
| *3 |
|
|
|
|
| *3 |
|
|
|
|
|
|
| |
Monthly churn rate *5 |
|
|
|
|
|
|
|
|
|
|
|
|
|
|
| ||
|
| CATV |
| 1.1% | — | — |
|
|
| 1.3% | — | — |
|
|
|
|
|
|
| HS Internet access |
| 1.3% | — | — |
|
|
| 1.4% | — | — |
|
|
|
|
|
|
| Telephony |
| 0.8% | — | — |
|
|
| 0.6% | — | — |
|
|
|
|
|
*2: | ARPU per customer connected is calculated as follows: average total revenue of our consolidated franchises (excluding installation, poor reception, and other revenues) for the period, divided by the weighted-average number of connected customers during the period. |
*3: | Monthly average for January - December, 2007 |
*4: | Monthly average for January - December, 2006 |
*5: | Churn Rate = monthly number of disconnects from a service / the monthly weighted average number of subscribers /12 |
*6: | CW consists of 6 managed systems and an MSO. Telephony service is offered as “Cable Plus Phone.” Numbers for homes passed are preliminary and subject to adjustments until we have completed our review of such information. |
*7: | Because data as of Dec. 31, 2006 are not able to be calculated in the same method as those as of Dec. 31, 2007, Rate of customers taking 3 services, ARPU and Monthly churn rate as of Dec. 31, 2006 are left out. |
|
|
*8: | Kyoto Cable Communications Co., Ltd. (KCC) data is excluded because it is preliminary and subject to adjustment until J:COM has completed its review and determined that it is presented in accordance with J:COM policies. |
26