Exhibit 99.1
Jupiter Telecommunications Co., Ltd.
(Translation from Japanese disclosure to JASDAQ)
April 28, 2009
[U.S. GAAP]
Consolidated Quarterly Financial Results Release
For the Three Months Ended March 31, 2009
Jupiter Telecommunications Co., Ltd. (Consolidated)
Company code number: 4817 (URL http://www.jcom.co.jp/)
Shares traded: JASDAQ
Executive position of legal representative: Tomoyuki Moriizumi, President and Chief Executive Officer
Please address all communications to:
Yuichi Sekiguchi, IR Department Phone: +81-3-6765-8157 E-Mail: sekiguchiyui@jupiter.jcom.co.jp
Expected date of filing of Quarterly report: May 14, 2009 |
| Expected date of dividend payment: - |
(Fractional amounts rounded)
1. Consolidated operating results (From January 1, 2009 to March 31, 2009)
(1) Consolidated financial results
|
| Revenue |
| Operating income |
| Income before |
| ||||||
|
| (Millions of yen) |
| % |
| (Millions of yen) |
| % |
| (Millions of yen) |
| % |
|
Three months ended March 31, 2009 |
| 80,808 |
| 13.0 |
| 15,479 |
| 15.6 |
| 14,700 |
| 17.3 |
|
Three months ended March 31, 2008 |
| 71,492 |
| 12.3 |
| 13,386 |
| 29.9 |
| 12,535 |
| 31.6 |
|
|
| Net income attributable to |
| Net income attributable to |
| Net income attributable to |
| ||
|
| (Millions of yen) |
| % |
| (Yen) |
| (Yen) |
|
Three months ended March 31, 2009 |
| 6,949 |
| 4.3 |
| 1,013.18 |
| 1,013.07 |
|
Three months ended March 31, 2008 |
| 6,661 |
| 21.4 |
| 972.57 |
| 970.94 |
|
(Note) The percentages next to revenue, operating income, income before noncontrolling interests and income taxes and net income attributable to J:COM shareholders represent year-on-year changes.
(2) Consolidated financial position
|
| Total assets |
| J:COM |
| Equity capital ratio |
| J:COM shareholders’ |
|
|
| (Millions of yen) |
| (Millions of yen) |
| % |
| (Yen) |
|
March 31, 2009 |
| 759,160 |
| 354,810 |
| 46.7 |
| 51,725.27 |
|
December 31, 2008 |
| 755,670 |
| 349,352 |
| 46.2 |
| 50,940.10 |
|
2. Dividend information
|
| Cash dividend per share (Yen) |
| ||||||||
|
| End of the first |
| End of the second |
| End of the third |
| Year- end |
| Annual cash dividend |
|
Year ended December 31, 2008 |
| — |
| 500.00 |
| — |
| 250.00 |
| 750.00 |
|
Year ending December 31, 2009 |
| — |
|
|
|
|
|
|
|
|
|
Year ending December 31, 2009 (forecasts) |
|
|
| 490.00 |
| — |
| 490.00 |
| 980.00 |
|
(Note) Change in forecast of dividends during the three months ended March 31,2009: None
3. Consolidated forecasts for December 2009 term (from January 1, 2009 to December 31, 2009)
|
| Revenue |
| Operating income |
| Income before |
| Net income attributable |
| Net income attributable |
| ||||||||
|
| (Millions of yen) |
| (%) |
| (Millions of yen) |
| (%) |
| (Millions of yen) |
| (%) |
| (Millions of yen) |
| (%) |
| (Yen) |
|
Annual |
| 330,000 |
| 12.1 |
| 60,000 |
| 11.8 |
| 54,500 |
| 9.6 |
| 29,000 |
| 3.7 |
| 4,227.83 |
|
(Note) The percentages shown next to revenue, operating income, income before noncontrolling interests and income taxes and net income attributable to J:COM shareholders represent year-on-year changes.
Change in forecast for the fiscal year ending December 31, 2009 during the three months ended March 31,2009: -
1
Jupiter Telecommunications Co., Ltd.
4. Other
(1) Changes of significant consolidated subsidiaries : None
(2) Adoption of simplified method or specific method to quarterly consolidated financial statements: None
(3) Change in significant accounting policies, procedures and presentation in quarterly consolidated financial statements:
(i) Changes due to revision of accounting standards and other regulations : Yes
(ii) Others : None
(Note) Please refer to page 6.
(4) Outstanding shares
(i) Number of issued shares at end of term (consolidated):
As of March 31, 2009: 6,939,508 shares |
| As of December 31, 2008: 6,938,107 shares |
(ii) Number of treasury stock:
As of March 31, 2009: 80,000 shares |
| As of December 31, 2008: 80,000 shares |
(iii) Number of weighed average stock:
Three months ended March 31, 2009: 6,858,728 shares |
| Three months ended March 31, 2008: 6,848,764 shares |
(Cautionary note regarding future-related information)
The forecasts contained in this report have been prepared on the basis of information that is currently available. Because such estimates are inherently very uncertain, actual results may differ from the forecasts. The Company does not guarantee that it will achieve these estimated results and advises readers to refrain from depending solely on these forecasts. Readers should also note that the Company is under no obligation to revise this information on a regular basis.
2
Jupiter Telecommunications Co., Ltd.
1. Qualitative information regarding consolidated business results
Throughout the first quarter of the fiscal year ending December 31, 2009, the Japanese economy experienced extremely harsh operating conditions. As the downturn in the economy grew in severity, the corporate sector implemented various corrective measures including cutbacks in capital investment and personnel. Against this backdrop, those markets in which Jupiter Telecommunications Co., Ltd. (“J:COM” or “the Company”) and its consolidated group (“the J:COM Group”) operates, were experiencing increased competition. With less than two and a half years remaining before the complete changeover to terrestrial digital broadcasting in 2011, this heightened competition was mainly attributable to the full-fledged entry of major telecommunications companies into the pay multi-channel broadcast market. Under these circumstances, the J:COM Group has taken measures to recapture the growth trend in its cable television operations by strengthening our follow-up service regime to encourage new CATV subscriptions and by enhancing its digital television services, both of which are principal themes in fiscal 2009. To this end, the Company launched the following initiatives in the first quarter ended March 31, 2009.
In the area of sales and marketing, J:COM took steps to further diversify its sales routes. The Company increased its network of J:COM Shops, allowing customers to better experience the J:COM Group’s menu of services on a first-hand basis. As a result of these endeavors, the number of J:COM Shops rose from 50 as of December 31, 2008 to 61 as of March 31, 2009.
As a part of the J:COM Group’s efforts to strengthen and expand its TV services, J:COM adopted the three major pillars for this approach. In addition to enhancing its lineup of digital channels with the shift to high-definition (HD) broadcasting, the Company also emphasized its Video-on-Demand (VOD) capabilities and integrated tuner and digital recorder set top box (HDR), which enables the recording of HD broadcasts to an internal hard disk drive .
During 2009, J:COM plans to complement its selection of seven HD broadcast channels by launching an additional ten channels that will cover a wide genre of films and dramas. By the end of the year, HD broadcasts will account for approximately 40% of the J:COM TV Digital lineup. After commencing broadcasts of the NHK on Demand service in December 2008, J:COM took steps during the first quarter of 2009 to broaden the appeal of its VOD services. In order to attract an increasing number of subscribers, the Company fortified sales of its Catch Up program, which allows unlimited access to shows that subscribers were unable to watch at its regular broadcast time, by offering the first month free of charge. In February 2009, the Company launched Fuji TV on Demand, which covers a host of popular programs broadcast by Fuji TV. To date, VOD access to primetime and other terrestrial broadcasts have been rare. Through the “J:COM on Demand” service, subscribers will gain increased access to popular programming content. Based on these initiatives, the growing awareness of VOD services is expected to drive future market growth and expansion.
Offering added convenience and significant cost performance, the number of HDR contracts has also seen steady growth. As of March 31, 2009, the aggregate number of subscribing amounted to 424,500.
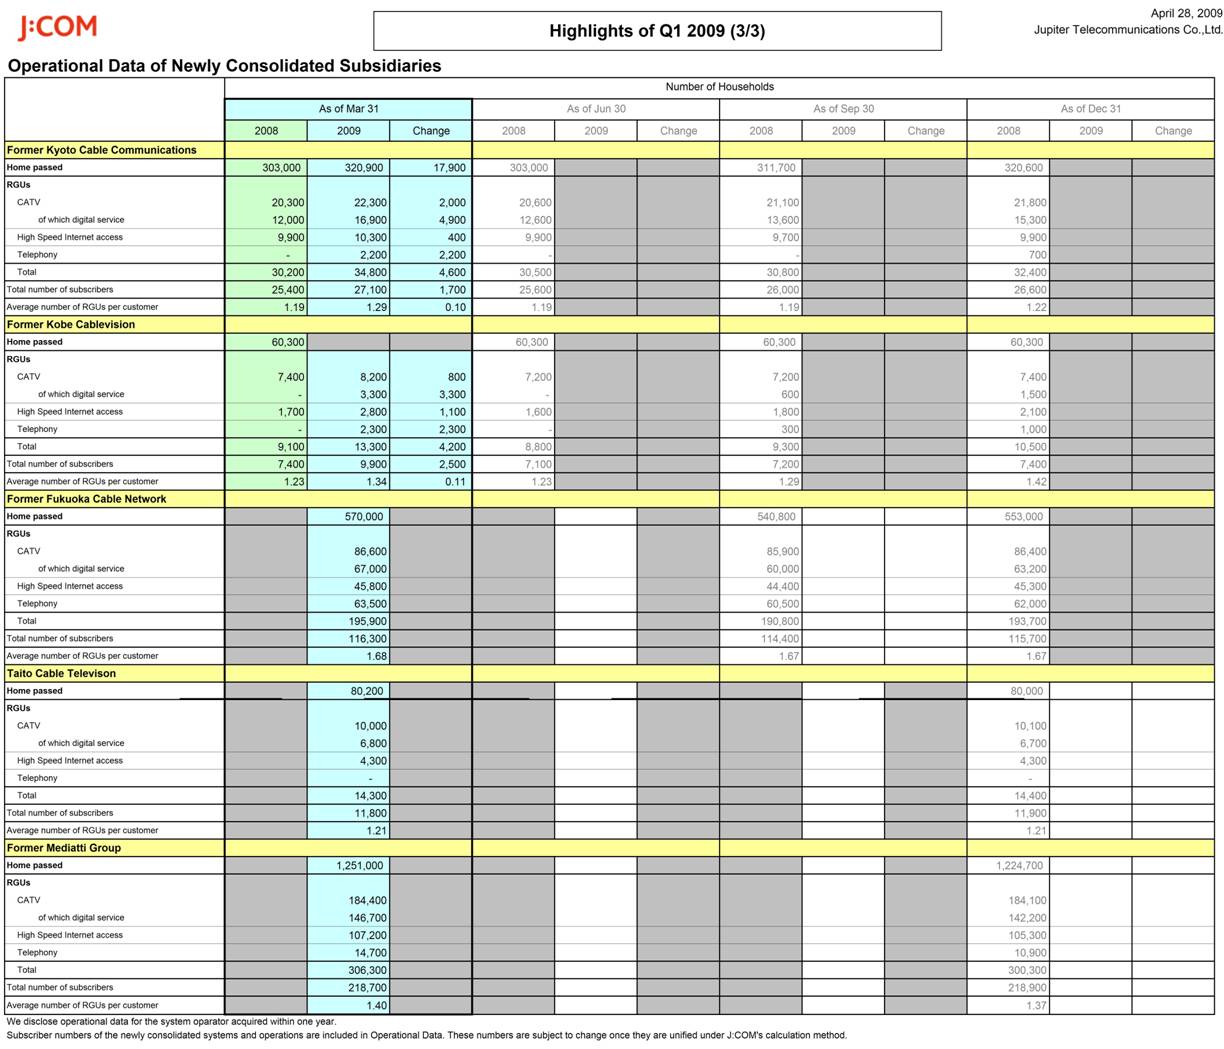
In 2008, the J:COM Group acquired five cable television companies and businesses as a part of its overall growth strategy. Among a number of benefits, this served to expand the J:COM Group’s service area. In the fiscal year under review, the Company plans to place considerable emphasis on streamlining the integration of these networks as well as accelerating the integration of the newly acquired companies and businesses, which will ensure consistency with regard to product and service content, as well as customer management systems. In addition, measures are being taken to ensure that J:COM’s accumulated skills, know-how, and established marketing techniques become entrenched throughout the entire J:COM Group. Following the decision during the first quarter of 2009 to formally merge its wholly-owned subsidiary, Mediatti Communications, Inc. into the Company on April 1, 2009, J:COM will press forward with efforts to realize increased operating efficiency as a result.
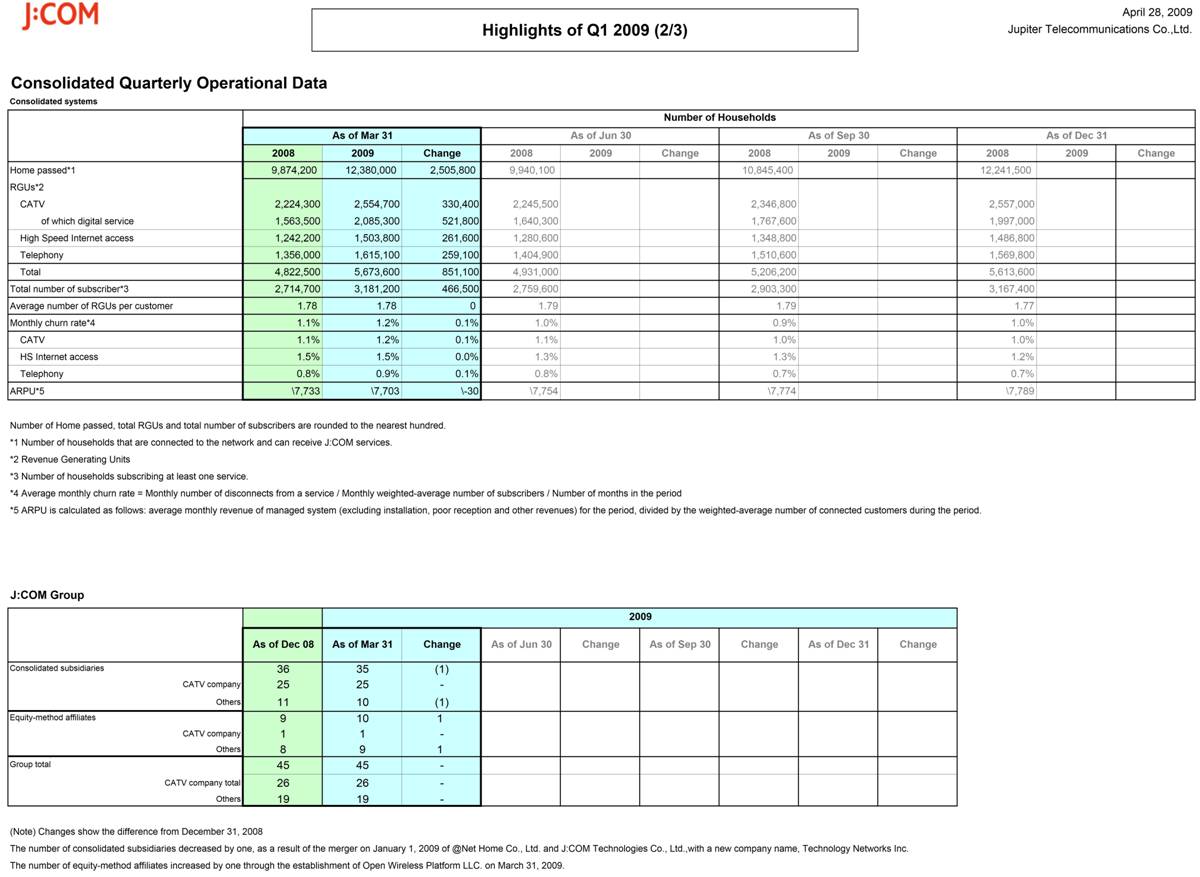
As a result of the above, the total number of subscribing households (the number of households that subscribe to one or more services) of consolidated managed system operators as of March 31, 2009 rose to 3,181,200 households, an increase of 466,500 households (17%) from March 31, 2008. By type of service, cable television subscribers grew by 330,400 households (15%) from March 31, 2008 to 2,554,700 households as of March 31, 2009. Of this total, the number of J:COM TV Digital subscribers
3
Jupiter Telecommunications Co., Ltd.
rose by 521,800 households (33%) to 2,085,300 households as of March 31, 2009, accounting for 82% of all cable television subscribers. The number of high-speed Internet access and telephony services subscribers increased by 261,600 households (21%) and 259,100 households (19%), respectively as compared to March 31, 2008, rising to 1,503,800 households and 1,615,100 households, respectively as of March 31, 2009.
The number of services offered per subscribing household (bundle ratio) was unchanged at 1.78 as of March 31, 2009 from March 31, 2008. However, excluding the impact of Jyohoku New Media Co., Ltd. and former Mediatti group companies, the bundle ratio increased to 1.81. The average monthly revenue per subscribing household (ARPU) decreased from ¥7,733 for the three months ended March 31, 2008 to ¥7,703 for the three months ended March 31, 2009. However, excluding the impact of Jyohoku New Media Co., Ltd. and former Mediatti group companies, ARPU increased to ¥7,792.
In the following discussion, J:COM quantifies the impact of acquisitions on its results of operations. The acquisition impact represents the Company’s estimate of the difference between the operating results of the period under comparison that is attributable to the timing of an acquisition. In general, we base our estimate of the acquisition impact on an acquired entity’s operating results during the first three months following the acquisition date such that changes from those operating results in subsequent periods are considered to be organic changes. Included as acquisitions are (i) the January 2008 acquisition of Kyoto Cable Communications Co., Ltd., (ii) the February 2008 business transfer from the Kobe City Development & Management Foundation (arrangement for Cablenet Kobe-Ashiya Co., Ltd., to take over a portion of the service area of Kobe Cable Vision), (iii) the August 2008 consolidation of Fukuoka Cable Network Co., Ltd., and (iv) the December 2008 acquisition of Jyohoku New Media Co., Ltd. (Taito Cable Television), and (v) the December 2008 acquisition of Mediatti Communications, Inc. and its subsidiaries.
Revenue
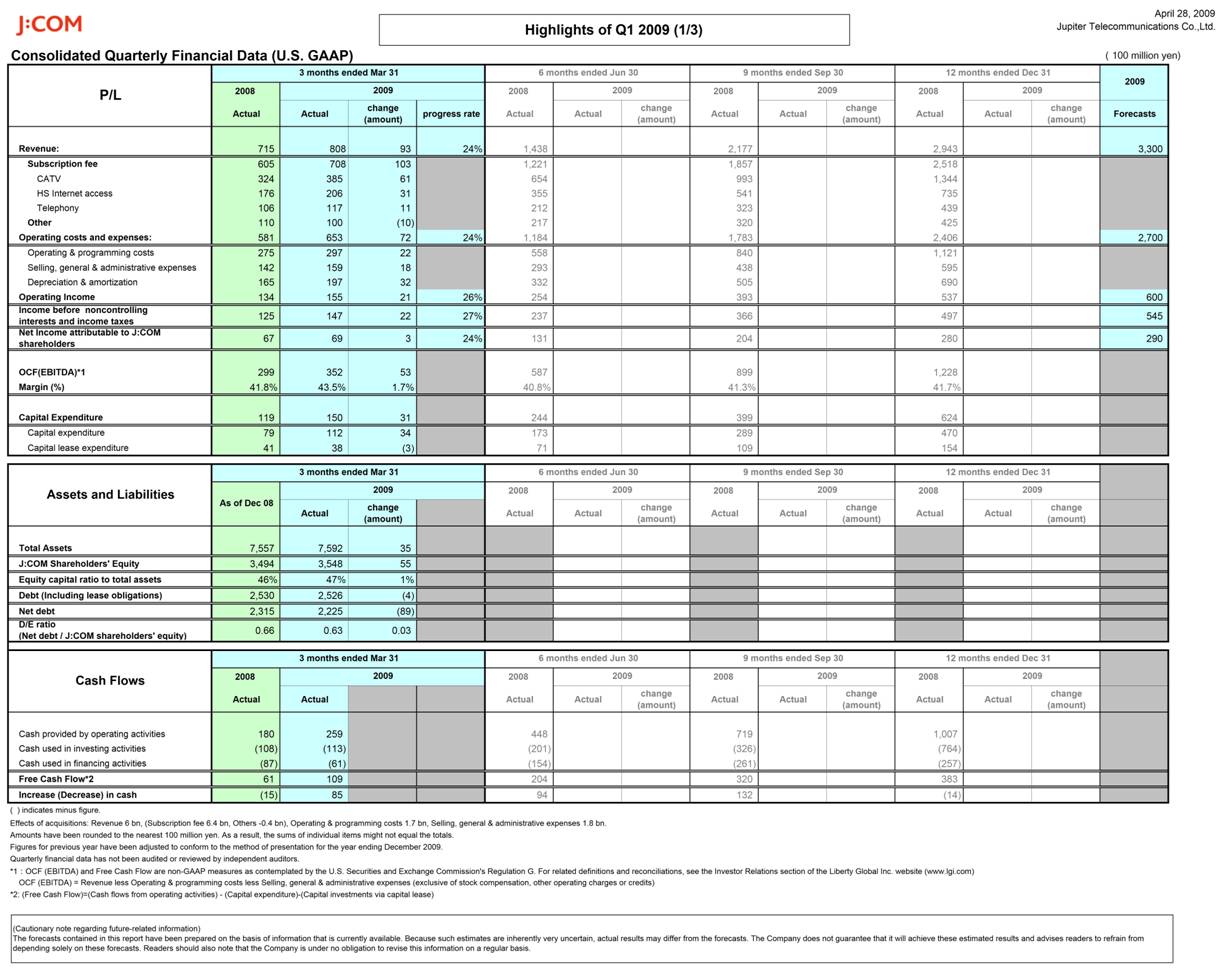
Total revenue increased by ¥9,316 million, or 13% from ¥71,492 million for the three months ended March 31, 2008 to ¥80,808 million for the three months ended March 31, 2009. This increase includes ¥6,003 million that is attributable to the aggregate impact of acquisitions. Excluding the effects of these acquisitions, total revenue increased by ¥3,313 million, or 5%.
Subscription fees increased by ¥10,298 million, or 17%, from ¥60,489 million for the three months ended March 31, 2008 to ¥70,787 million for the three months ended March 31, 2009. This increase includes ¥6,373 million that is attributable to the aggregate impact of acquisitions. Excluding the impact of acquisitions, subscription fees increased by ¥3,925 million, or 7%.
Cable television subscription fees increased by ¥6,109 million, or 19%, from ¥32,379 million for the three months ended March 31, 2008 to ¥38,488 million for the three months ended March 31, 2009. The increase in cable television subscription revenue includes a 5% organic increase in subscription fees that is attributable to an increase in the average number of digital cable subscribers, for which we charge a higher fee compared to our analog cable service, and the associated increase in ARPU. As of March 31, 2009, 82% of cable television subscribers were receiving our digital service, compared to 70% as of March 31, 2008.
High-speed Internet subscription fees increased by ¥3,063 million, or 17% from ¥17,551 million for the three months ended March 31, 2008 to ¥20,614 million for the three months ended March 31, 2009. The increase in high-speed Internet subscription revenue includes a 10% organic increase in subscription fees that is attributable to the net effect of (i) an increase in the average number of high-speed Internet subscribers, and (ii) lower ARPU due to product bundling discounts.
Telephony subscription fees increased by ¥1,126 million, or 11%, from ¥10,559 million for the three months ended March 31, 2008 to ¥11,685 million for the three months ended March 31, 2009. The increase in telephony subscription revenue includes a 6% organic increase in subscription fees that is attributable to (i) an increase in the average number of telephony subscribers and (ii) lower ARPU due to a decrease in call volumes.
Other revenue decreased by ¥982 million, or 9%, from ¥11,003 million for the three months ended March 31, 2008 to ¥10,021 million for the three months ended March 31, 2009. This decrease is primarily attributable to less construction and installation revenue.
4
Jupiter Telecommunications Co., Ltd.
Operating Costs and Expenses
Operating and programming costs increased by ¥2,224 million, or 8%, from ¥27,477 million for the three months ended March 31, 2008 to ¥29,701 million for the three months ended March 31, 2009. This increase includes ¥1,658 million that is attributable to the aggregate impact of acquisitions. The remaining increase is due primarily to cost directly related to growth of our subscriber base.
Selling, general and administrative expenses increased by ¥1,757 million, or 12%, from ¥14,174 million for the three months ended March 31, 2008 to ¥15,931 million for the three months ended March 31, 2009. This increase includes ¥1,811 million that is attributable to the aggregate impact of acquisitions. The remaining increase is primarily attributable to increases in personnel costs.
Depreciation and amortization expenses increased by ¥3,242 million, or 20%, from ¥16,455 million for the three months ended March 31, 2008 to ¥19,697 million for the three months ended March 31, 2009. This increase is attributable to the aggregate impact of acquisitions and additions to fixed assets related to the installation of services to new customers.
Operating income, as a result of the above items, increased by ¥2,093 million, or 16% from ¥13,386 million for the three months ended March 31, 2008 to ¥15,479 million for the three months ended March 31, 2009.
Interest expense, net increased by ¥313 million, or 30%, from ¥1,041 million for the three months ended March 31, 2008 to ¥1,354 million for the three months ended March 31, 2009.
Income before noncontrolling interests and income taxes increased by ¥2,165 million, or 17% from ¥12,535 million for the three months ended March 31, 2008 to ¥14,700 million for the three months ended March 31, 2009.
Net income attributable to J:COM shareholders increased by ¥288 million, or 4%, from ¥6,661 million for the three months ended March 31, 2008 to ¥6,949 million for the three months ended March 31, 2009 for the reasons set forth above.
2. Financial position
Asset, Liability and Shareholders’ equity
Total assets increased by ¥3,490 million, from ¥755,670 million as of December 31, 2008 to ¥759,160 million as of March 31, 2009. The increase is primarily due to cash provided from operations in the first quarter of 2009.
Total liabilities decreased by ¥2,397 million, from ¥397,383 million as of December 31, 2008 to ¥394,986 million as of March 31, 2009. The decrease is primarily due to a decrease in deferred revenue, income tax payable and capital lease obligations.
Total J:COM shareholders’ equity increased by ¥5,458 million, from ¥349,352 million as of December 31, 2008 to ¥354,810 million as of March 31, 2009. The increase is primarily due to net income attributable to J:COM shareholders for the three months ended March 31, 2009.
Cash flows
For the three months ended March 31, 2009, the net cash provided by our operating activities of ¥25,906 million, and existing cash and cash equivalent was used to fund net cash used in our investing and financing activities of ¥11,289 million and ¥6,068 million, respectively.
Cash Provided by Operating Activities. Net cash flows provided by operating activities increased ¥7,906 million, or 44% from ¥18,000 million for the three months ended March 31, 2008 to ¥25,906 million for the three months ended March 31, 2009. The increase is primarily attributable to the net effect of an increase in cash generated from our revenues, an increase in cash paid for income taxes and changes in working capital accounts.
Cash Used in Investing Activities. Net cash used in investing activities remained relatively consistent and increased ¥520 million from ¥10,769 million for the three months ended March 31, 2008 to ¥11,289 million for the three months ended March 31, 2009. The net cash used for the three month ended March 31, 2009 primarily consisted of ¥11,247 million for capital expenditures.
5
Jupiter Telecommunications Co., Ltd.
Cash Used in Financing Activities. Net cash used in financing activities decreased ¥2,658 million from ¥8,726 million for the three months ended March 31, 2008 to ¥6,068 million for the three months ended March 31, 2009. The ¥6,068 net cash used in financing activities for the three months ended March 31, 2009 consisted of ¥30,288 million principle payments of long-term debt, ¥4,840 million of principle payments under capital lease obligations and ¥1,715 million of dividends paid to shareholders offset by ¥30,000 million of proceeds from long-term debt, ¥111 million of proceeds from the issuance of common stock and ¥387 million of other financing activities.
3. Outlook for the coming fiscal year
As the company adopted SFAS160 effective January 1, 2009 for details, see page 6, 4. Others, Accounting Change Note, J:COM disclose “Income before noncontrolling interests and income taxes” in place of “income before income taxes”.
Other than the above, the company does not make any change in the forecasts.
(In millions in yen)
|
| Revenue |
| Operating Income |
| Income before |
| Net income attributable to |
|
Year ending December 31, 2009 (Forecast) |
| 330,000 |
| 60,000 |
| 54,500 |
| 29,000 |
|
Year-on-year-Change (%) |
| 12.1 |
| 11.8 |
| 9.6 |
| 3.7 |
|
4. Others
(1) Changes of significant consolidated subsidiaries
None
(2) Adoption of simplified method or specific method to quarterly consolidated financial statements
None
(3) Change in significant accounting policies, procedures and presentation in quarterly consolidated financial statements:
(i) Changes due to revision of accounting standards and other regulations : Yes
(ii) Others : None
Accounting Change Note
SFAS 160
In December 2007, the Financial Accounting Standards Board (FASB) issued Statement of Financial Accounting Standards (SFAS) No.160 (SFAS160). SFAS 160 establishes accounting and reporting standards for the noncontrolling interest in a subsidiary and for the deconsolidation of a subsidiary. It also states that a noncontrolling interest in a subsidiary is an ownership interest in a consolidated entity that should be reported as equity in the consolidated financial statements. In addition, SFAS 160 requires (i) that consolidated net income include the amounts attributable to both the parent and noncontrolling interest, (ii) that a parent recognize a gain or loss in net income when a subsidiary is deconsolidated and (iii) expanded disclosures that clearly identify and distinguish between the interests of the parent owners and the interests of the noncontrolling owners of a subsidiary. SFAS 160 is effective for fiscal periods, and interim periods within those fiscal years, beginning on or after December 15, 2008. The Company adopted SFAS 160 effective January 1, 2009 and such adoption resulted in (i) a change in the presentation of minority interests in subsidiaries, which was reclassified to “noncontrolling interests” within equity as of January 1, 2009.
6
Jupiter Telecommunications CO., Ltd.
5. Consolidated Financial Statements
JUPITER TELECOMMUNICATIONS CO., LTD.
AND SUBSIDIARIES
CONSOLIDATED STATEMENTS OF INCOME
(YEN IN MILLIONS, EXCEPT SHARE AND PER SHARE AMOUNTS)
|
| Three months ended March 31, 2009 |
| Three months ended March 31, 2008 |
| Change |
| Year ended |
| ||
Account |
| Amount |
| Amount |
| Amount |
| (%) |
| Amount |
|
Revenue: |
|
|
|
|
|
|
|
|
|
|
|
Subscription fees |
| 70,787 |
| 60,489 |
| 10,298 |
| 17.0 |
| 251,849 |
|
Other |
| 10,021 |
| 11,003 |
| (982 | ) | (8.9 | ) | 42,459 |
|
|
| 80,808 |
| 71,492 |
| 9,316 |
| 13.0 |
| 294,308 |
|
Operating costs and expenses |
|
|
|
|
|
|
|
|
|
|
|
Operating and programming costs |
| (29,701 | ) | (27,477 | ) | (2,224 | ) | (8.1 | ) | (112,099 | ) |
Selling, general and administrative |
| (15,931 | ) | (14,174 | ) | (1,757 | ) | (12.4 | ) | (59,514 | ) |
Depreciation and amortization |
| (19,697 | ) | (16,455 | ) | (3,242 | ) | (19.7 | ) | (69,020 | ) |
|
| (65,329 | ) | (58,106 | ) | (7,223 | ) | (12.4 | ) | (240,633 | ) |
Operating income |
| 15,479 |
| 13,386 |
| 2,093 |
| 15.6 |
| 53,675 |
|
Other income (expenses) : |
|
|
|
|
|
|
|
|
|
|
|
Interest expense, net: |
|
|
|
|
|
|
|
|
|
|
|
Related parties |
| (518 | ) | (357 | ) | (161 | ) | (45.1 | ) | (1,479 | ) |
Other |
| (836 | ) | (684 | ) | (152 | ) | (22.2 | ) | (3,240 | ) |
Equity in earnings of affiliates |
| 322 |
| 222 |
| 100 |
| 44.9 |
| 600 |
|
Other income, net |
| 253 |
| (32 | ) | 285 |
| — |
| 177 |
|
Income before noncontrolling interests and income taxes |
| 14,700 |
| 12,535 |
| 2,165 |
| 17.3 |
| 49,733 |
|
Income tax expense |
| (7,046 | ) | (5,346 | ) | (1,700 | ) | (31.8 | ) | (19,476 | ) |
Net income |
| 7,654 |
| 7,189 |
| 465 |
| 6.5 |
| 30,257 |
|
Less: Net earnings attributable to noncontrolling interests |
| (705 | ) | (528 | ) | (177 | ) | (33.5 | ) | (2,293 | ) |
Net income attributable to J:COM shareholders |
| 6,949 |
| 6,661 |
| 288 |
| 4.3 |
| 27,964 |
|
|
|
|
|
|
|
|
|
|
|
|
|
Per share data |
|
|
|
|
|
|
|
|
|
|
|
Net income attributable to J:COM shareholders per share |
|
|
|
|
|
|
|
|
|
|
|
— basic |
| 1,013.18 |
| 972.57 |
| 40.61 |
| 4.2 |
| 4,079.61 |
|
— diluted |
| 1,013.07 |
| 970.94 |
| 42.13 |
| 4.3 |
| 4,076.17 |
|
Weighted average number of ordinary shares outstanding |
|
|
|
|
|
|
|
|
|
|
|
— basic |
| 6,858,728 |
| 6,848,764 |
| 9,964 |
| 0.1 |
| 6,854,535 |
|
— diluted |
| 6,859,487 |
| 6,860,312 |
| (825 | ) | (0.0 | ) | 6,860,334 |
|
(Note) Percentages are calculated based on amounts before rounded in Change column.
7
Jupiter Telecommunications CO., Ltd.
JUPITER TELECOMMUNICATIONS CO., LTD.
AND SUBSIDIARIES
CONSOLIDATED BALANCE SHEETS
(YEN IN MILLIONS)
|
| March 31, 2009 |
| December 31, 2008 |
| Change |
|
Account |
| Amount |
| Amount |
| Amount |
|
Current assets: |
|
|
|
|
|
|
|
Cash and cash equivalents |
| 30,052 |
| 21,503 |
| 8,549 |
|
Accounts receivable |
| 13,988 |
| 14,838 |
| (850 | ) |
Allowance for doubtful accounts |
| (432 | ) | (396 | ) | (36 | ) |
Deferred tax assets - current |
| 11,706 |
| 11,429 |
| 277 |
|
Prepaid expenses and other current assets |
| 6,910 |
| 7,250 |
| (340 | ) |
Total current assets |
| 62,224 |
| 54,624 |
| 7,600 |
|
|
|
|
|
|
|
|
|
Investments: |
|
|
|
|
|
|
|
Investments in affiliates |
| 13,750 |
| 13,363 |
| 387 |
|
Investments in other securities, at cost |
| 2,142 |
| 2,141 |
| 1 |
|
Total investments |
| 15,892 |
| 15,504 |
| 388 |
|
|
|
|
|
|
|
|
|
Property and equipment, at cost: |
|
|
|
|
|
|
|
Land |
| 3,918 |
| 3,056 |
| 862 |
|
Distribution system and equipment |
| 633,434 |
| 620,017 |
| 13,417 |
|
Support equipment and buildings |
| 46,569 |
| 45,580 |
| 989 |
|
|
| 683,921 |
| 668,653 |
| 15,268 |
|
Less accumulated depreciation |
| (303,042 | ) | (284,919 | ) | (18,123 | ) |
Total property and equipment |
| 380,879 |
| 383,734 |
| (2,855 | ) |
|
|
|
|
|
|
|
|
Other assets: |
|
|
|
|
|
|
|
Goodwill |
| 245,848 |
| 246,196 |
| (348 | ) |
Identifiable intangible assets , net |
| 36,808 |
| 38,159 |
| (1,351 | ) |
Deferred tax assets — non current |
| 4,385 |
| 4,137 |
| 248 |
|
Other |
| 13,124 |
| 13,316 |
| (192 | ) |
Total other assets |
| 300,165 |
| 301,808 |
| (1,643 | ) |
Total assets |
| 759,160 |
| 755,670 |
| 3,490 |
|
8
Jupiter Telecommunications CO., Ltd.
(YEN IN MILLIONS)
|
| March 31, 2009 |
| December 31, 2008 |
| Change |
|
Account |
| Amount |
| Amount |
| Amount |
|
Current liabilities: |
|
|
|
|
|
|
|
Short-term loans |
| 6,545 |
| 6,092 |
| 453 |
|
Long-term debt—current portion |
| 12,407 |
| 12,453 |
| (46 | ) |
Capital lease obligations—current portion |
|
|
|
|
|
|
|
Related parties |
| 15,512 |
| 15,355 |
| 157 |
|
Other |
| 3,268 |
| 3,108 |
| 160 |
|
Accounts payable |
| 21,563 |
| 21,298 |
| 265 |
|
Income taxes payable |
| 5,345 |
| 9,907 |
| (4,562 | ) |
Deposit from related parties |
| 4,426 |
| 4,124 |
| 302 |
|
Deferred revenue — current portion |
| 7,097 |
| 7,314 |
| (217 | ) |
Accrued expenses and other liabilities |
| 10,966 |
| 10,059 |
| 907 |
|
Total current liabilities |
| 87,129 |
| 89,710 |
| (2,581 | ) |
|
|
|
|
|
|
|
|
Long-term debt, less current portion |
| 170,246 |
| 170,488 |
| (242 | ) |
Capital lease obligations, less current portion: |
|
|
|
|
|
|
|
Related parties |
| 38,046 |
| 38,705 |
| (659 | ) |
Other |
| 6,552 |
| 6,763 |
| (211 | ) |
Deferred revenue |
| 64,724 |
| 66,537 |
| (1,813 | ) |
Deferred tax liabilities — non current |
| 12,492 |
| 11,827 |
| 665 |
|
Other liabilities |
| 15,797 |
| 13,353 |
| 2,444 |
|
Total liabilities |
| 394,986 |
| 397,383 |
| (2,397 | ) |
|
|
|
|
|
|
|
|
Shareholders’ equity: |
|
|
|
|
|
|
|
Ordinary shares no par value |
| 117,218 |
| 117,162 |
| 56 |
|
Additional paid-in capital |
| 226,440 |
| 226,388 |
| 52 |
|
Retained earnings |
| 19,691 |
| 14,457 |
| 5,234 |
|
Treasury stock |
| (7,520 | ) | (7,520 | ) | — |
|
Accumulated other comprehensive loss |
| (1,019 | ) | (1,135 | ) | 116 |
|
Total J:COM shareholders’ equity |
| 354,810 |
| 349,352 |
| 5,458 |
|
Noncontrolling interests in subsidiaries |
| 9,364 |
| 8,935 |
| 429 |
|
Total shareholders’ equity |
| 364,174 |
| 358,287 |
| 5,887 |
|
Total liabilities and shareholders’ equity |
| 759,160 |
| 755,670 |
| 3,490 |
|
9
Jupiter Telecommunications CO., Ltd.
JUPITER TELECOMMUNICATIONS CO., LTD.
AND SUBSIDIARIES
CONSOLIDATED STATEMENTS OF CASH FLOWS
(YEN IN MILLIONS)
|
| Three months ended March 31, 2009 |
| Three months ended March 31, 2008 |
| Year ended December 31, 2008 |
|
Classification |
| Amount |
| Amount |
| Amount |
|
Cash flows from operating activities: |
|
|
|
|
|
|
|
Net income |
| 7,654 |
| 7,189 |
| 30,257 |
|
Adjustments to reconcile net income to net cash provided by operating activities: |
|
|
|
|
|
|
|
Depreciation and amortization |
| 19,697 |
| 16,455 |
| 69,020 |
|
Equity in earnings of affiliates |
| (322 | ) | (222 | ) | (600 | ) |
Stock compensation expenses |
| — |
| 16 |
| 55 |
|
Deferred income taxes |
| (350 | ) | 1,117 |
| 2,772 |
|
Non-cash gain from forgiveness of debt |
| — |
| — |
| (135 | ) |
Changes in operating assets and liabilities, excluding effects of business combinations: |
|
|
|
|
|
|
|
Decrease in accounts receivable, net |
| 878 |
| 18 |
| 96 |
|
Decrease/(increase) in prepaid expenses and other current assets |
| 159 |
| 219 |
| (1,273 | ) |
Decrease/(increase) in other assets |
| 203 |
| (670 | ) | (2,339 | ) |
Decrease in accounts payable |
| (928 | ) | (5,446 | ) | (3,418 | ) |
Increase/(decrease) in accrued expenses and other liabilities |
| (248 | ) | (715 | ) | 7,247 |
|
Increase/(decrease) in deferred revenue |
| (837 | ) | 39 |
| (990 | ) |
Net cash provided by operating activities |
| 25,906 |
| 18,000 |
| 100,692 |
|
Cash flows from investing activities: |
|
|
|
|
|
|
|
Capital expenditures |
| (11,247 | ) | (7,857 | ) | (46,972 | ) |
Acquisitions of new subsidiaries, net of cash acquired |
| — |
| (1,108 | ) | (27,700 | ) |
Acquisition of business operation |
| — |
| (1,710 | ) | (1,710 | ) |
Other investing activities |
| (42 | ) | (94 | ) | 25 |
|
Net cash used in investing activities |
| (11,289 | ) | (10,769 | ) | (76,357 | ) |
Cash flows from financing activities: |
|
|
|
|
|
|
|
Proceeds from issuance of common stock |
| 111 |
| 426 |
| 856 |
|
Acquisition of noncontrolling interests in consolidated subsidiaries |
| (176 | ) | — |
| — |
|
Net increase/(decrease) in short-term loans |
| 453 |
| (50 | ) | (294 | ) |
Proceeds from long-term debt |
| 30,000 |
| 284 |
| 55,284 |
|
Principal payments of long-term debt |
| (30,288 | ) | (5,532 | ) | (62,438 | ) |
Principal payments under capital lease obligations |
| (4,840 | ) | (4,065 | ) | (17,105 | ) |
Cash dividend paid to shareholders |
| (1,715 | ) | — |
| (3,428 | ) |
Other financing activities |
| 387 |
| 211 |
| 1,403 |
|
Net cash used in financing activities |
| (6,068 | ) | (8,726 | ) | (25,722 | ) |
Net increase/(decrease) in cash and cash equivalents |
| 8,549 |
| (1,495 | ) | (1,387 | ) |
Cash and cash equivalents at beginning of year |
| 21,503 |
| 22,890 |
| 22,890 |
|
Cash and cash equivalents at end of period |
| 30,052 |
| 21,395 |
| 21,503 |
|
10
Jupiter Telecommunications CO., Ltd.
Assumptions for Going Concern
None
Segment Information
(1) Operating segments
The Company’s channel services are considered a separate operating segment, however, due to the insignificant size of these channel service operations, management has determined it has one reportable segment “Broadband communications services”. Therefore, information on operating segments is not applicable in this section.
(2) Segment information by region
Since the Company does not have any overseas subsidiaries or branches, this section is not applicable.
Significant Changes in Shareholders’ Equity
None
11
12
13
14