EXHIBIT 99.1
Jupiter Telecommunications Co., Ltd .
(Translation from Japanese disclosure to JASDAQ)
April 30, 2008
[U.S. GAAP]
Consolidated Quarterly Financial Results Release
For the Three Months Ended March 31, 2008
Jupiter Telecommunications Co., Ltd. (Consolidated)
Company code number: 4817 (URL http://www.jcom.co.jp/)
Shares traded: JASDAQ
Executive position of legal representative: Tomoyuki Moriizumi, Chief Executive Officer
Please address all communications to:
| | |
Koji Kobayashi, IR Department | | Phone: +81-3-6765-8157 E-Mail: KobayashiKo@jupiter.jcom.co.jp |
1. Consolidated operating results (From January 1, 2008 to March 31, 2008)
(1) Consolidated financial results
| | | | | | | | | | | | |
| | | (In millions of yen, with fractional amounts rounded) |
| | | Revenue | | Operating income | | Income before
income taxes |
| _ | | (Millions of yen) | | % | | (Millions of yen) | | % | | (Millions of yen) | | % |
Three months ended March 31, 2008 | | 71,492 | | 12.3 | | 13,386 | | 29.9 | | 12,007 | | 32.4 |
Three months ended March 31, 2007 | | 63,672 | | 24.6 | | 10,307 | | 34.9 | | 9,070 | | 29.1 |
| | | | | | | | | | | | |
Year ended December 31, 2007 | | 264,508 | | 19.2 | | 42,816 | | 35.6 | | 37,506 | | 36.4 |
| | | | | | | | | | | | |
| | | |
| | | Net income | | Net income per share | | Net income per share
(diluted) |
| | | (Millions of yen) | | % | | (Yen) | | (Yen) |
Three months ended March 31, 2008 | | 6,661 | | 21.4 | | 972.57 | | 970.94 |
Three months ended March 31, 2007 | | 5,488 | | 25.6 | | 858.95 | | 855.00 |
| | | | | | | | |
Year ended December 31, 2007 | | 23,992 | | 2.0 | | 3,650.27 | | 3,638.93 |
| | | | | | | | |
(Notes) The percentages next to revenue, operating income, income before income taxes and net income represent year-on-year changes.
(2) Consolidated financial position
| | | | | | | | |
| | | Total assets | | Shareholders’ equity | | Equity capital ratio
to total assets | | Shareholders' equity
per share |
| | | (Millions of yen) | | (Millions of yen) | | % | | (Yen) |
March 31, 2008 | | 681,320 | | 336,683 | | 49.4 | | 49,132.04 |
March 31, 2007 | | 627,550 | | 284,168 | | 45.3 | | 44,381.72 |
| | | | | | | | |
December 31, 2007 | | 680,416 | | 330,009 | | 48.5 | | 48,195.11 |
| | | | | | | | |
(3) Consolidated cash flow statement
| | | | | | | | | | |
| | | Cash flows from
operating activities | | Cash flows from
investing activities | | | Cash flows from
financing activities | | | Balance of cash &
cash equivalents |
| | | (Millions of yen) | | (Millions of yen) | | | (Millions of yen) | | | (Millions of yen) |
Three months ended March 31, 2008 | | 18,000 | | (10,769 | ) | | (8,726 | ) | | 21,395 |
Three months ended March 31, 2007 | | 21,762 | | (10,721 | ) | | (6,425 | ) | | 25,102 |
| | | | | | | | | | |
Year ended December 31, 2007 | | 95,226 | | (52,728 | ) | | (40,094 | ) | | 22,890 |
| | | | | | | | | | |
1
Jupiter Telecommunications Co., Ltd .
2. Dividend information
| | | | | | | | | |
| | | Dividend per share (Yen) |
| | | Interim | | Year- end | | Annual cash dividend |
December 31, 2007 | | | — | | | — | | ¥ | 0.00 |
December 31, 2008 | | | | | | | | ¥ | 750 |
December 31, 2008 (forecasts) | | ¥ | 500 | | ¥ | 250 | |
(Notes) Projected interim dividend amount per share (¥500) includes ¥250 as a special dividend.
3. Consolidated forecasts for December 2008 term (from January 1, 2008 to December 31, 2008)
The performance of the J:COM Group is generally in accordance with its forecasts. Accordingly, there are no changes to the consolidated forecasts for the fiscal year ending December 31, 2008, which were released on January 30, 2008.
4. Other information
(1) Change of material subsidiaries : None
(2) Adoption of any simplified accounting method : None
(3) Change of accounting policy : None
(Cautionary note regarding future-related information)
The forecasts contained in this report have been prepared on the basis of information that is currently available. Because such estimates are inherently very uncertain, actual results may differ from the forecasts. The Company does not guarantee that it will achieve these estimated results and advises readers to refrain from depending solely on these forecasts. Readers should also note that the Company is under no obligation to revise this information on a regular basis.
2
Jupiter Telecommunications Co., Ltd .
1. Qualitative information regarding consolidated business results
In response to stagnant growth in the multiple pay channel television market, Jupiter Telecommunications Co., Ltd.’ s consolidated group (the J:COM Group or the Company) has marked 2008 as a year for reshaping its growth strategy in cable television services. Accordingly, the J:COM Group has pushed forward with its content strategy and its Volume plus Value growth strategy in the quarter ended March 31, 2008.
In pursuit of its content strategy, the J:COM Group launched the newly established Channel Ginga in April. To strengthen the channel line-up, the J:COM Group also introduced new channels on its J:COM TV Digital service including the suspense and mystery drama channel FOX CRIME in March and NBC Universal’s SCI FI Channel in April.
To diversify its sales channels, the J:COM Group continues to focus on the development of its multi-tier marketing channels. It increased the number of J:COM Shops by 13 to a total of 29 for the first three months ended March 31, 2008. These small shops are in locations in high foot traffic areas, such as train stations and supermarkets, and give potential customers the opportunity to familiarize themselves with the J:COM services first-hand. These shops not only promote new subscribers, but also serve as a contact point for existing subscribers.
In addition to the measures described above, the J:COM Group is also expanding the geographic availability of its 160Mbps super high-speed Internet access services, which is intended to compete with fiber-to-the-home services and increase customer satisfaction with its existing customers.
The J:COM Group continues to seek acquisitions and equity alliances with other cable television companies, as evidenced by the acquisition of a controlling interest in Kyoto Cable Communications Co., Ltd., which became a consolidated subsidiary at the end of January 2008. Additionally, at the end of February, its consolidated subsidiary Cablenet Kobe Ashiya Co., Ltd., acquired the cable television business of the Kobe City Development & Management Foundation. These measures further expanded J:COM’s coverage area, specifically in the Kansai region.
As a result of the measures outlined above, the total number of subscribing households (the number of households that subscribe to one or more services) of consolidated managed system operators as of March 31, 2008 rose to 2,714,700 households, an increase of 182,100 households (7%) from March 31, 2007. By type of service, cable television subscribers grew by 110,600 households (5%) from March 31, 2007 to 2,224,300 households as of March 31, 2008. Of this total, the number of J:COM TV Digital subscribers rose by 397,800 households (34%) to 1,563,500 households as of March 31, 2008, accounting for 70% of all cable television subscribers. The number of high-speed Internet access and telephony services subscribers increased by 119,800 households (11%) and 193,100 households (17%), respectively as compared to March 31, 2007, rising to 1,242,200 households and 1,356,000 households, respectively as of March 31, 2008. The number of services offered per subscribing household (bundle ratio) improved to 1.78 as of March 31, 2008 as compared to 1.74 at March 31, 2007.
The average monthly revenue per subscribing household (ARPU) increased from ¥7,638 for the three months ended March 31, 2007 to ¥7,733 for the three months ended March 31, 2008.
In the following discussion, we quantify the impact of acquisitions on our results of operations. Included as acquisitions are (i) the July 2007 acquisition of Jupiter Visual Communications Co., Ltd., (ii) the September 2007 merger with Jupiter TV Co., Ltd. and (iii) the January 2008 acquisition of Kyoto Cable Communications Co., Ltd.
Revenue
Total revenue increased by ¥7,820 million, or 12% from ¥63,672 million for the three months ended March 31, 2007 to ¥71,492 million for the three months ended March 31, 2008. This increase includes ¥3,305 million that is attributable to the aggregate impact of acquisitions. Excluding the effects of these acquisitions, total revenue increased by ¥4,515 million, or 7%.
3
Jupiter Telecommunications Co., Ltd .
Subscription fees increased by ¥4,787 million, or 9%, from ¥55,702 million for the three months ended March 31, 2007 to ¥60,489 million for the three months ended March 31, 2008. This increase includes ¥328 million that is attributable to the aggregate impact of acquisitions. Excluding the impact of acquisitions, subscription fees increased by ¥4,459 million, or 8%.
Cable television subscription fees increased by ¥2,354 million, or 8%, from ¥30,025 million for the three months ended March 31, 2007 to ¥32,379 million for the three months ended March 31, 2008. The increase in cable television subscription revenue includes a 7% organic increase in subscription fees that is attributable to an increase in the average number of digital cable subscribers, for which we charge a higher fee compared to our analog cable service, and the associated increase in ARPU. As of March 31, 2008, 70% of cable television subscribers were receiving our digital service, compared to 55% as of March 31, 2007.
High-speed Internet subscription fees increased by ¥1,416 million, or 9% from ¥16,135 million for the three months ended March 31, 2007 to ¥17,551 million for the three months ended March 31, 2008. The increase in high-speed Internet subscription revenue includes an 8% organic increase in subscription fees that is attributable to the net effect of (i) an increase in the average number of high-speed Internet subscribers, and (ii) lower ARPU due to product bundling discounts.
Telephony subscription fees increased by ¥1,017 million, or 11%, from ¥9,542 million for the three months ended March 31, 2007 to ¥10,559 million for the three months ended March 31, 2008. The increase in telephony subscription revenue includes an 11% organic increase in subscription fees that is attributable to (i) an increase in the average number of telephony subscribers and (ii) lower ARPU due to a decrease in call volumes.
Other revenue increased by ¥3,033 million, or 38%, from ¥7,970 million for the three months ended March 31, 2007 to ¥11,003 million for the three months ended March 31, 2008. This increase includes ¥ 2,977 million that is attributable to the aggregate impact of acquisitions. The acquisition impact is mainly attributable to the merger with Jupiter TV Co., Ltd.
Operating Costs and Expenses
Operating and programming costs increased by ¥1,713 million, or 7%, from ¥25,764 million for the three months ended March 31, 2007 to ¥27,477 million for the three months ended March 31, 2008. This increase includes ¥1,246 million that is attributable to the aggregate impact of acquisitions. The remaining increase is due primarily to cost directly related to growth of our subscriber base.
Selling, general and administrative expenses increased by ¥1,905 million, or 16%, from ¥12,269 million for the three months ended March 31, 2007 to ¥14,174 million for the three months ended March 31, 2008. This increase includes ¥1,292 million that is attributable to the aggregate impact of acquisitions. The remaining increase is primarily attributable to increases in personnel costs.
Depreciation and amortization expenses increased by ¥1,123 million, or 7%, from ¥15,332 million for the three months ended March 31, 2007 to ¥16,455 million for the three months ended March 31, 2008. This increase is attributable to the aggregate impact of acquisitions and additions to fixed assets related to the installation of services to new customers.
Operating income, as a result of the above items, increased by ¥3,079 million, or 30% from ¥10,307 million for the three months ended March 31, 2007 to ¥13,386 million for the three months ended March 31, 2008.
Interest expense, net decreased by ¥8 million, or 1%, from ¥1,049 million for the three months ended March 31, 2007 to ¥1,041 million for the three months ended March 31, 2008.
Income before income taxes increased by ¥2,937 million, or 32% from ¥9,070 million for the three months ended March 31, 2007 to ¥12,007 million for the three months ended March 31, 2008.
Net income increased by ¥1,173 million, or 21%, from ¥5,488 million for the three months ended March 31, 2007 to ¥6,661 million for the three months ended March 31, 2008 for the reasons set forth above.
4
Jupiter Telecommunications Co., Ltd .
2. Financial position
Asset, Liability and Stockholders’ equity
Total assets increased by ¥904 million, from ¥680,416 million as of December 31, 2007 to ¥681,320 million as of March 31, 2008. The increase is primarily due to acquisitions made in the first quarter.
Total liabilities decreased by ¥6,537 million, from ¥345,008 million as of December 31, 2007 to ¥338,471 million as of March 31, 2008. The decrease is primarily due to a decrease in accounts payable, income tax payable and long-term debt.
Stockholders’ equity increased by ¥6,674 million, from ¥330,009 million as of December 31, 2007 to ¥336,683 million as of March 31, 2008. The increase is primarily due to net income for the three months ended March 31, 2008.
Cash flows
For the three months ended March 31, 2008, the net cash provided by our operating activities of ¥18,000 million, and existing cash and cash equivalent was used to fund net cash used in our investing and financing activities of ¥10,769 million and ¥8,726 million, respectively.
Cash Provided by Operating Activities. Net cash flows provided by operating activities decreased ¥3,762 million, or 17% from ¥21,762 million for the three months ended March 31, 2007 to ¥18,000 million for the three months ended March 31, 2008. The decrease is primarily attributable to (i) an increase in cash used for our operating and SG&A expenses, (ii) an increase in cash paid for income taxes and (iii) an increase in cash used as a result of changes in our working capital accounts. These decrease were partially offset by an increase in our revenue for the three months ended March 31, 2008.
Cash Used in Investing Activities.Net cash used in investing activities remained relatively consistent and increased ¥48 million from ¥10,721 million for the three months ended March 31, 2007 to ¥10,769 million for the three months ended March 31, 2008. The net cash used for the three month ended March 31, 2008 primarily consisted of ¥2,818 million for our acquisition of new subsidiary and business operations and ¥7,857 million for capital expenditures.
Cash Used in Financing Activities. Net cash used in financing activities increased ¥2,301 million, or 36% from ¥6,425 million for the three months ended March 31, 2007 to ¥8,726 million for the three months ended March 31, 2008. The increase is primarily attributable to (i) a ¥1,245 million increase in net principal repayments of debt and capital lease obligations and (ii) a ¥1,267 million decrease in proceeds received from the issuance of our common stock.
3. Others
| (1) | Changes in significant consolidated subsidiaries |
None
| (2) | Adoption of simplified accounting method |
None
| (3) | Change in accounting principles and procedures |
None
5
Jupiter Telecommunications Co., Ltd .
4. Consolidated Financial Statements
JUPITER TELECOMMUNICATIONS CO., LTD.
AND SUBSIDIARIES
CONSOLIDATED STATEMENTS OF INCOME
| | | | | | | | | | | | | | | |
| | | (YEN IN MILLIONS, EXCEPT SHARE AND PER SHARE AMOUNTS) | |
| | | Three months
ended
March 31, 2008 | | | Three months
ended
March 31, 2007 | | | Change | | | Year ended
Dec. 31, 2007 | |
Account | | Amount | | | Amount | | | Amount | | | (%) | | | Amount | |
Revenue: | | | | | | | | | | | | | | | |
Subscription fees | | 60,489 | | | 55,702 | | | 4,787 | | | 8.6 | | | 230,061 | |
Other | | 11,003 | | | 7,970 | | | 3,033 | | | 38.1 | | | 34,447 | |
| | | | | | | | | | | | | | | |
| | 71,492 | | | 63,672 | | | 7,820 | | | 12.3 | | | 264,508 | |
| | | | | | | | | | | | | | | |
Operating costs and expenses | | | | | | | | | | | | | | | |
Operating and programming costs | | (27,477 | ) | | (25,764 | ) | | (1,713 | ) | | (6.6 | ) | | (104,748 | ) |
Selling, general and administrative | | (14,174 | ) | | (12,269 | ) | | (1,905 | ) | | (15.5 | ) | | (52,722 | ) |
Depreciation and amortization | | (16,455 | ) | | (15,332 | ) | | (1,123 | ) | | (7.3 | ) | | (64,222 | ) |
| | | | | | | | | | | | | | | |
| | (58,106 | ) | | (53,365 | ) | | (4,741 | ) | | (8.9 | ) | | (221,692 | ) |
| | | | | | | | | | | | | | | |
Operating income | | 13,386 | | | 10,307 | | | 3,079 | | | 29.9 | | | 42,816 | |
Other income (expenses) : | | | | | | | | | | | | | | | |
Interest expense, net: | | | | | | | | | | | | | | | |
Related parties | | (357 | ) | | (322 | ) | | (35 | ) | | (10.7 | ) | | (1,332 | ) |
Other | | (684 | ) | | (727 | ) | | 43 | | | 5.8 | | | (2,944 | ) |
Equity in earnings of affiliates | | 222 | | | 43 | | | 179 | | | 409.1 | | | 291 | |
Other income, net | | (32 | ) | | 224 | | | (256 | ) | | — | | | 558 | |
| | | | | | | | | | | | | | | |
Income before income taxes and other items | | 12,535 | | | 9,525 | | | 3,010 | | | 31.6 | | | 39,389 | |
Minority interest in net income of consolidated subsidiaries | | (528 | ) | | (455 | ) | | (73 | ) | | (16.1 | ) | | (1, 883 | ) |
| | | | | | | | | | | | | | | |
| | | | | | | | | | | | | | | |
Income before income taxes | | 12,007 | | | 9,070 | | | 2,937 | | | 32.4 | | | 37,506 | |
Income tax expense | | (5,346 | ) | | (3,582 | ) | | (1,764 | ) | | (49.2 | ) | | (13,514 | ) |
| | | | | | | | | | | | | | | |
Net income | | 6,661 | | | 5,488 | | | 1,173 | | | 21.4 | | | 23,992 | |
| | | | | | | | | | | | | | | |
Per Share data | | | | | | | | | | | | | | | |
Net income per share – basic | | 972.57 | | | 858.95 | | | 113.62 | | | 13.2 | | | 3,650.27 | |
Net income per share – diluted | | 970.94 | | | 855.00 | | | 115.94 | | | 13.6 | | | 3,638.93 | |
Weighted average number of ordinary shares outstanding – basic | | 6,848,764 | | | 6,389,166 | | | 459,598 | | | 7.2 | | | 6,572,638 | |
Weighted average number of ordinary shares outstanding – diluted | | 6,860,312 | | | 6,418,690 | | | 441,622 | | | 6.9 | | | 6,593,130 | |
(Note) Percentages are calculated based on amounts before rounded in Change column.
6
Jupiter Telecommunications Co., Ltd .
JUPITER TELECOMMUNICATIONS CO., LTD.
AND SUBSIDIARIES
CONSOLIDATED BALANCE SHEETS
| | | | | | | | | |
| | | (YEN IN MILLIONS) | |
| | | March 31,
2008 | | | December 31,
2007 | | | Change | |
Account | | Amount | | | Amount | | | Amount | |
Current assets: | | | | | | | | | |
Cash and cash equivalents | | 21,395 | | | 22,890 | | | (1,495 | ) |
Accounts receivable | | 13,527 | | | 13,198 | | | 329 | |
Allowance for doubtful accounts | | (378 | ) | | (356 | ) | | (22 | ) |
Deferred tax asset - current | | 11,353 | | | 11,738 | | | (385 | ) |
Prepaid expenses and other current assets | | 5,063 | | | 5,164 | | | (101 | ) |
| | | | | | | | | |
Total current assets | | 50,960 | | | 52,634 | | | (1,674 | ) |
| | | | | | | | | |
Investments: | | | | | | | | | |
Investments in affiliates | | 15,094 | | | 19,502 | | | (4,408 | ) |
Investments in other securities, at cost | | 2,141 | | | 2,139 | | | 2 | |
| | | | | | | | | |
Total investments | | 17,235 | | | 21,641 | | | (4,406 | ) |
| | | | | | | | | |
Property and equipment, at cost: | | | | | | | | | |
Land | | 2,923 | | | 2,789 | | | 134 | |
Distribution system and equipment | | 539,454 | | | 523,599 | | | 15,855 | |
Support equipment and buildings | | 39,710 | | | 39,148 | | | 562 | |
| | | | | | | | | |
| | 582,087 | | | 565,536 | | | 16,551 | |
| | | | | | | | | |
Less accumulated depreciation | | (241,844 | ) | | (228,341 | ) | | (13,503 | ) |
| | | | | | | | | |
Total property and equipment, at cost | | 340,243 | | | 337,195 | | | 3,048 | |
| | | | | | | | | |
Other assets: | | | | | | | | | |
Goodwill | | 226,011 | | | 221,493 | | | 4,518 | |
Identifiable intangible asset , net | | 33,687 | | | 32,862 | | | 825 | |
Deferred tax asset – non current | | 2,533 | | | 4,423 | | | (1,890 | ) |
Other | | 10,651 | | | 10,168 | | | 483 | |
| | | | | | | | | |
Total other assets | | 272,882 | | | 268,946 | | | 3,936 | |
| | | | | | | | | |
Total assets | | 681,320 | | | 680,416 | | | 904 | |
| | | | | | | | | |
7
Jupiter Telecommunications Co., Ltd .
| | | | | | | | | |
| | | (YEN IN MILLIONS) | |
| | | March 31,
2008 | | | December 31,
2007 | | | Change | |
Account | | Amount | | | Amount | | | Amount | |
Current liabilities: | | | | | | | | | |
Short-term loans | | 2,575 | | | 2,625 | | | (50 | ) |
Long-term debt–current portion | | 21,324 | | | 21,308 | | | 16 | |
Capital lease obligations–current portion | | | | | | | | | |
Related parties | | 12,105 | | | 11,671 | | | 434 | |
Other | | 3,046 | | | 2,947 | | | 99 | |
Accounts payable | | 20,342 | | | 24,279 | | | (3,937 | ) |
Income taxes payable | | 2,969 | | | 7,082 | | | (4,113 | ) |
Deposit from related parties | | 3,573 | | | 3,536 | | | 37 | |
Deferred revenue – current portion | | 6,038 | | | 6,088 | | | (50 | ) |
Accrued expenses and other liabilities | | 8,177 | | | 6,236 | | | 1,941 | |
| | | | | | | | | |
Total current liabilities | | 80,149 | | | 85,772 | | | (5,623 | ) |
| | | | | | | | | |
Long-term debt, less current portion | | 138,365 | | | 143,219 | | | (4,854 | ) |
Capital lease obligations, less current portion: | | | | | | | | | |
Related parties | | 34,954 | | | 34,335 | | | 619 | |
Other | | 6,751 | | | 6,911 | | | (160 | ) |
Deferred revenue | | 57,985 | | | 54,708 | | | 3,277 | |
Redeemable preferred stock of consolidated subsidiary | | 500 | | | 500 | | | — | |
Deferred tax liability – non current | | 10,334 | | | 12,643 | | | (2,309 | ) |
Other liabilities | | 9,433 | | | 6,920 | | | 2,513 | |
| | | | | | | | | |
Total liabilities | | 338,471 | | | 345,008 | | | (6,537 | ) |
| | | | | | | | | |
Minority interests | | 6,166 | | | 5,399 | | | 767 | |
| | | | | | | | | |
Shareholders’ equity: | | | | | | | | | |
Ordinary shares no par value | | 116,944 | | | 116,734 | | | 210 | |
Additional paid-in capital | | 231,725 | | | 231,493 | | | 232 | |
Accumulated deficit | | (3,418 | ) | | (10,079 | ) | | 6,661 | |
Treasury stock | | (7,520 | ) | | (7,520 | ) | | — | |
Accumulated other comprehensive income | | (1,048 | ) | | (619 | ) | | (429 | ) |
| | | | | | | | | |
Total shareholders’ equity | | 336,683 | | | 330,009 | | | 6,674 | |
| | | | | | | | | |
Total liabilities, minority interests and shareholders’ equity | | 681,320 | | | 680,416 | | | 904 | |
| | | | | | | | | |
8
Jupiter Telecommunications Co., Ltd .
JUPITER TELECOMMUNICATIONS CO., LTD.
AND SUBSIDIARIES
CONSOLIDATED STATEMENTS OF CASH FLOWS
| | | | | | | | | |
| | | (YEN IN MILLIONS) | |
| | | Three months ended
March 31, 2008 | | | Three months ended
March 31, 2007 | | | Year ended
December 31, 2007 | |
Classification | | Amount | | | Amount | | | Amount | |
Cash flows from operating activities: | | | | | | | | | |
Net income | | 6,661 | | | 5,488 | | | 23,992 | |
Adjustments to reconcile net income to net cash provided by operating activities: | | | | | | | | | |
Depreciation and amortization | | 16,455 | | | 15,332 | | | 64,222 | |
Equity in earnings of affiliates | | (222 | ) | | (43 | ) | | (291 | ) |
Minority interest in net income of consolidated subsidiaries | | 528 | | | 455 | | | 1,883 | |
Stock compensation expenses | | 16 | | | 45 | | | 140 | |
Deferred income taxes | | 1,117 | | | 742 | | | 1,657 | |
Changes in operating assets and liabilities, excluding effects of business combinations: | | | | | | | | | |
(Increase)/decrease in accounts receivable, net | | 18 | | | (198 | ) | | 2,477 | |
Decrease in prepaid expenses and other current assets | | 219 | | | 352 | | | 214 | |
Increase in other assets | | (670 | ) | | (558 | ) | | (2,478 | ) |
Increase/(decrease) in accounts payable | | (5,446 | ) | | (3,346 | ) | | 412 | |
Increase/(decrease) in accrued expenses and other liabilities | | (715 | ) | | 3,569 | | | 2,834 | |
Increase/(decrease) in deferred revenue | | 39 | | | (76 | ) | | 164 | |
| | | | | | | | | |
Net cash provided by operating activities | | 18,000 | | | 21,762 | | | 95,226 | |
| | | | | | | | | |
Cash flows from investing activities: | | | | | | | | | |
Capital expenditures | | (7,857 | ) | | (10,689 | ) | | (46,348 | ) |
Acquisitions of new subsidiaries, net of cash acquired | | (1,108 | ) | | — | | | 634 | |
Acquisition of business operation | | (1,710 | ) | | — | | | — | |
Investments in and advances to affiliates | | (19 | ) | | — | | | (1,138 | ) |
Loan to related party | | — | | | — | | | (5,166 | ) |
Principle received from related party | | — | | | — | | | 1,350 | |
Acquisition of minority interests in consolidated subsidiaries | | (75 | ) | | (19 | ) | | (2,543 | ) |
Other investing activities | | 0 | | | (13 | ) | | 483 | |
| | | | | | | | | |
Net cash used in investing activities | | (10,769 | ) | | (10,721 | ) | | (52,728 | ) |
| | | | | | | | | |
Cash flows from financing activities: | | | | | | | | | |
Proceeds from issuance of common stock | | 426 | | | 1,693 | | | 2,973 | |
Purchase of treasury stock | | — | | | — | | | (7,520 | ) |
Change in short-term loans | | (50 | ) | | (100 | ) | | 335 | |
Proceeds from long-term debt | | 284 | | | 253 | | | 613 | |
Principal payments of long-term debt | | (5,532 | ) | | (4,243 | ) | | (25,699 | ) |
Principal payments under capital lease obligations | | (4,065 | ) | | (4,028 | ) | | (15,689 | ) |
Other financing activities | | 211 | | | — | | | 4,893 | |
| | | | | | | | | |
Net cash used in financing activities | | (8,726 | ) | | (6,425 | ) | | (40,094 | ) |
| | | | | | | | | |
Net increase/(decrease) in cash and cash equivalents | | (1,495 | ) | | 4,616 | | | 2,404 | |
| | | | | | | | | |
Cash and cash equivalents at beginning of year | | 22,890 | | | 20,486 | | | 20,486 | |
| | | | | | | | | |
Cash and cash equivalents at end of term | | 21,395 | | | 25,102 | | | 22,890 | |
| | | | | | | | | |
9
Jupiter Telecommunications Co., Ltd .
Segment Information
The J:COM Group has determined it has one reportable segment “Broadband services”. Therefore, information on operating segments is omitted in this section.
| (2) | Segment information by region |
Because the J:COM Group does not have any overseas subsidiaries or branches, this section is not applicable.
10
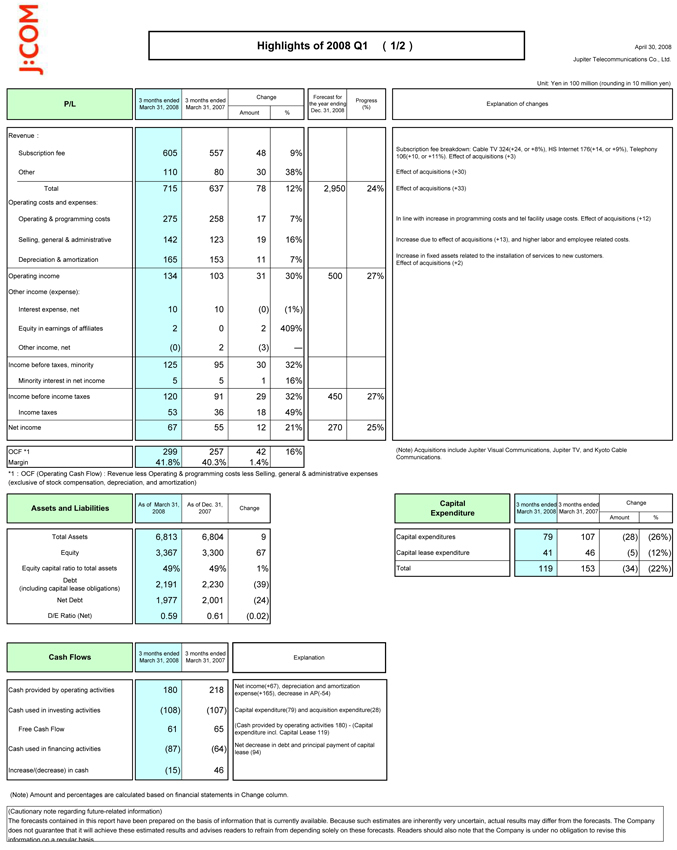
Highlights of 2008 Q1(1/2) April 30, 2008
Jupiter Telecommunications Co., Ltd.
Unit: Yen in 100 million (rounding in 10 million yen)
Change Forecast for
3 months ended 3 months ended Progress
P/L the year ending
March 31, 2008 March 31, 2007(%)
Amount % Dec. 31, 2008
Revenue:
Subscription fee 605 557 48 9%
Other 110 80 30 38%
Total 715 637 78 12% 2,950 24%
Operating costs and expenses:
Operating & programming costs 275 258 17 7%
Selling, general & administrative 142 123 19 16%
Depreciation & amortization 165 153 11 7%
Operating income 134 103 31 30% 500 27%
Other income (expense):
Interest expense, net 10 10(0) (1%)
Equity in earnings of affiliates 2 0 2 409%
Other income, net(0) 2(3) : Income before taxes, minority 125 95 30 32% Minority interest in net income 5 5 1 16%
Income before income taxes 120 91 29 32% 450 27% Income taxes 53 36 18 49%
Net income 67 55 12 21% 270 25%
OCF *1 299 257 42 16% Margin 41.8% 40.3% 1.4%
*1: OCF (Operating Cash Flow) : Revenue less Operating & programming costs less Selling, general & administrative expenses (exclusive of stock compensation, depreciation, and amortization)
As of March 31, As of Dec. 31,
Assets and Liabilities Change 2008 2007
Total Assets 6,813 6,804 9
Equity 3,367 3,300 67
Equity capital ratio to total assets 49% 49% 1%
Debt 2,191 2,230(39)
(including capital lease obligations)
Net Debt 1,977 2,001(24)
D/E Ratio (Net) 0.59 0.61(0.02)
3 months ended 3 months ended
Cash Flows Explanation
March 31, 2008 March 31, 2007
Net income (+67), depreciation and amortization
Cash provided by operating activities 180 218 expense (+165), decrease in AP (-54)
Cash used in investing activities (108) (107) Capital expenditure (79) and acquisition expenditure (28) (Cash provided by operating activities 180)—(Capital
Free Cash Flow 61 65 expenditure incl. Capital Lease 119)
Net decrease in debt and principal payment of capital
Cash used in financing activities (87) (64) lease (94)
Increase/(decrease) in cash (15) 46
Explanation of changes
Subscription fee breakdown: Cable TV 324(+24, or +8%), HS Internet 176(+14, or +9%), Telephony 106(+10, or +11%). Effect of acquisitions (+3)
Effect of acquisitions (+30)
Effect of acquisitions (+33)
In line with increase in programming costs and tel facility usage costs. Effect of acquisitions (+12)
Increase due to effect of acquisitions (+13), and higher labor and employee related costs.
Increase in fixed assets related to the installation of services to new customers. Effect of acquisitions (+2)
(Note) Acquisitions include Jupiter Visual Communications, Jupiter TV, and Kyoto Cable Communications.
Capital 3 months ended 3 months ended Change Expenditure March 31, 2008 March 31, 2007 Amount %
Capital expenditures 79 107(28) (26%) Capital lease expenditure 41 46(5) (12%)
Total 119 153(34) (22%)
(Note) Amount and percentages are calculated based on financial statements in Change column.
(Cautionary note regarding future-related information)
(Cautionary note regarding future-related information)
The forecasts contained in this report have been prepared on the basis of information that is currently available. Because such estimates are inherently very uncertain, actual results may differ from the forecasts. The Company does not guarantee that it will achieve these estimated results and advises readers to refrain from depending solely on these forecasts. Readers should also note that the Company is under no obligation to revise this information on a regular basis.
11
April 30, 2008
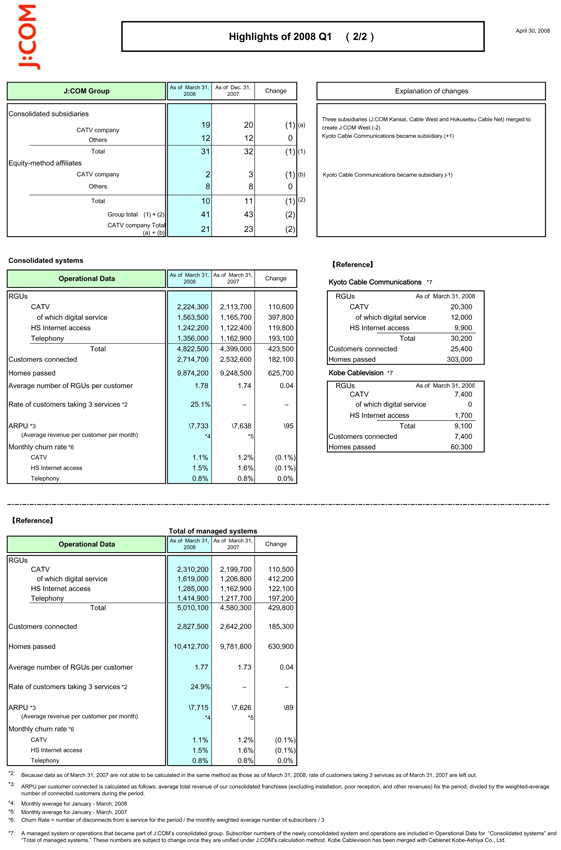
Highlights of 2008 Q1 (2/2)
As of March 31, As of Dec. 31,
J:COM Group Change
2008 2007
Consolidated subsidiaries
19 20 (1) (a) CATV company Others 12 12 0
Total 31 32 (1) (1)
Equity-method affiliates
CATV company 2 3 (1) (b) Others 8 8 0 Total 10 11(1) (2) Group total (1) (2) 41 43 (2) CATV company Total 21 23 (2) (a) + (b)
Explanation of changes
Three subsidiaries (J:COM Kansai, e Net) merged Cable create J:COM West.(-2) Kyoto Cable Communications became subsidiary
Kyoto Cable Communications became subsidiary
Consolidated systems
As of March 31, As of March 31,
Operational Data Change
2008 2007
RGUs
CATV 2,224,300 2,113,700 110,600 of which digital service 1,563,500 1,165,700 397,800 HS Internet access 1,242,200 1,122,400 119,800 Telephony 1,356,000 1,162,900 193,100 Total 4,822,500 4,399,000 423,500 Customers connected 2,714,700 2,532,600 182,100 Homes passed 9,874,200 9,248,500 625,700 Average number of RGUs per customer 1.78 1.74 0.04
Rate of customers taking 3 services *2 25.1% – –
ARPU *3 \7,733 \7,638 \95
(Average revenue per customer per month) *4 *5
Monthly churn rate *6
CATV 1.1% 1.2%(0.1%)
HS Internet access 1.5% 1.6%(0.1%)
Telephony 0.8% 0.8% 0.0%
[Reference]
Kyoto Cable Communications *7
RGUs As of March 31,2008
CATV 20,300 of which digital service 12,000 HS Internet access 9,900 Total 30,200 Customers connected 25,400 Homes passed 303,000 Kobe Cablevision *7
RGUs As of March 31, 2008
CATV 7,400 of which digital 0 HS Internet access 1,700 Total 9,100 Customers connected 7,400 Homes passed 60,300
[Reference]
Total of managed systems
As of March 31, As of March 31,
Operational Data Change
2008 2007
RGUs
CATV 2,310,200 2,199,700 110,500 of which digital service 1,619,000 1,206,800 412,200 HS Internet access 1,285,000 1,162,900 122,100 Telephony 1,414,900 1,217,700 197,200 Total 5,010,100 4,580,300 429,800
Customers connected 2,827,500 2,642,200 185,300
Homes passed 10,412,700 9,781,800 630,900
Average number of RGUs per customer 1.77 1.73 0.04
Rate of customers taking 3 services *2 24.9% – –
ARPU *3 \7,715 \7,626 \89
(Average revenue per customer per month) *4 *5
Monthly churn rate *6
CATV 1.1% 1.2%(0.1%)
HS Internet access 1.5% 1.6%(0.1%)
Telephony 0.8% 0.8% 0.0%
*2: Because data as of March 31, 2007 are not able to be calculated in the same method as those as of March 31, 2008, rate of customers taking 3 services as of March 31, 2007 are left out.
*3: ARPU per customer connected is calculated as follows: average total revenue of our consolidated franchises (excluding installation, poor reception, and other revenues) for the period, divided by the weighted-average number of connected customers during the period.
*4: Monthly average for January—March, 2008 *5: Monthly average for January—March, 2007
*6: Churn Rate = number of disconnects from a service for the period / the monthly weighted average number of subscribers / 3
*7: A managed system or operations that became part of J:COM’s consolidated group. Subscriber numbers of the newly consolidated system and operations are included in Operational Data for “Consolidated systems” and “Total of managed systems.” These numbers are subject to change once they are unified under J:COM's calculation method. Kobe Cablevision has been merged with Cablenet Kobe-Ashiya Co., Ltd.
12