Exhibit 99.1
(Translation from Japanese disclosure to JASDAQ)
January 29, 2009
[U.S. GAAP]
Consolidated Annual Financial Results Release
For the Year Ended December 31, 2008
Jupiter Telecommunications Co., Ltd. (Consolidated)
Company code number: 4817 (URL http://www.jcom.co.jp/)
Shares traded: JASDAQ
Executive position of legal representative: Tomoyuki Moriizumi, Chief Executive Officer
Please address all communications to:
| | | | |
Yuichi Sekiguchi, IR Department | | Phone: +81-3-6765-8157 | | E-Mail:sekiguchiyui@jupiter.jcom.co.jp |
Expected date of Annual Shareholder’s meeting: March 25, 2009
Expected date of filing of annual report: March 25, 2009
| 1. | Consolidated operating results (From January 1, 2008 to December 31, 2008) |
| (1) | Consolidated financial results |
| | | | | | | | | | | | | | | | | |
| | | (In millions of yen, with fractional amounts rounded) | |
| | | Revenue | | Operating
income | | Income before
income taxes | | Net income | |
| | | % | | % | | % | | % | |
December 31, 2008 | | 294,308 | | 11.3 | | 53,675 | | 25.4 | | 47,440 | | 26.5 | | 27,964 | | 16.6 | |
December 31, 2007 | | 264,508 | | 19.2 | | 42,816 | | 35.6 | | 37,506 | | 36.4 | | 23,992 | | (2.0 | ) |
| | | | | | | | | | |
| | | Net income per
share | | Net income per
share (diluted) | | Net income ratio
to net worth | | Income before
income tax ratio
to total assets | | Income before
income tax ratio
to total revenue |
| | | (Yen) | | (Yen) | | % | | % | | % |
December 31, 2008 | | 4,079.61 | | 4,076.17 | | 8.2 | | 6.6 | | 16.1 |
December 31, 2007 | | 3,650.27 | | 3,638.93 | | 7.9 | | 5.7 | | 14.2 |
(Notes)
| 1. | Equity in earnings of affiliates; |
For the year ended December 31, 2008: 600 million yen For the year ended December 31, 2007: 291 million yen
| 2. | The percentages shown next to revenue, operating income, income before income taxes and net income represent year-on-year changes. |
| (2) | Consolidated financial position |
| | | | | | | | |
| | | Total assets | | Shareholders’ equity | | Equity capital ratio
to total assets | | Shareholders’ equity
per share |
| | | (Millions of yen) | | (Millions of yen) | | % | | (Yen) |
December 31, 2008 | | 755,670 | | 349,352 | | 46.2 | | 50,940.10 |
December 31, 2007 | | 680,416 | | 330,009 | | 48.5 | | 48,195.11 |
| (3) | Consolidated cash flow statement |
| | | | | | | | | | |
| | | Cash flows from
operating activities | | Cash flows from
investing activities | | | Cash flows from
financing activities | | | Balance of cash &
cash equivalents |
| | | (Millions of yen) | | (Millions of yen) | | | (Millions of yen) | | | (Millions of yen) |
December 31, 2008 | | 100,692 | | (76,357 | ) | | (25,722 | ) | | 21,503 |
December 31, 2007 | | 95,226 | | (52,728 | ) | | (40,094 | ) | | 22,890 |
1
| | | | | | | | | | | | |
| | | Annual cash dividends per share
(Yen) | | Total amount of
annual cash
dividends
(Millions of yen) | | Dividends
payout ratio% | | Total amount of
dividends ratio to
shareholders’ equity % |
| | | Interim | | Year-end | | Total | | | |
December 31, 2007 | | — | | — | | 0.00 | | — | | — | | — |
December 31, 2008 | | 500.00 | | 250.00 | | 750.00 | | 5,143 | | 18.4 | | 1.5 |
| | | | | | | | | | | | |
December 31, 2009 (Forecasts) | | 490.00 | | 490.00 | | 980.00 | | | | 23.2 | | |
| | | | | | | | | | | | |
(Notes) Interim dividend amount per share ¥500 includes ¥250 as a special dividend.
| 3. | Consolidated forecasts for December 2009 term (from January 1, 2009 to December 31, 2009) |
| | | | | | | | | | | | | | | | | | |
| | | Revenue | | Operating income | | Income before
income taxes | | Net income | | Net income per
share |
| | | (Millions of yen) | | (%) | | (Millions of yen) | | (%) | | (Millions of yen) | | (%) | | (Millions of yen) | | (%) | | (Yen) |
Annual | | 330,000 | | 12.1 | | 60,000 | | 11.8 | | 52,000 | | 9.6 | | 29,000 | | 3.7 | | 4,228.57 |
| (Notes) | The percentages shown next to revenue, operating income, income before income taxes and net income represent year-on-year changes |
| (1) | Change in significant consolidated subsidiaries : None |
| (2) | Change in significant accounting and reporting policies |
| | 1. | Change in accounting methods in accordance with change in accounting policy: None |
| | 2. | Change in accounting methods other than above: None |
| | 1. | Number of issued shares at end of term (consolidated): |
As of December 31, 2008: 6,938,107 shares As of December 31, 2007: 6,927,357 shares
| | 2 | Number of treasury stock: |
As of December 31, 2008: 80,000 shares As of December 31, 2007: 80,000 shares
(note) Regarding number of shares basis of per share data, please refer to page 22.
2
(Ref) Parent Company Only [JAPANESE GAAP]
| 1. | Operating results (From January 1, 2008 to December 31, 2008) |
| | | | | | | | | | | | | | | | | |
| | | (In millions of yen, with fractional amounts rounded) | |
| | | Revenue | | Operating
income | | Ordinary
income | | Net income | |
| | | % | | % | | % | | % | |
December 31, 2008 | | 117,933 | | 9.4 | | 10,448 | | 28.2 | | 10,477 | | 21.0 | | 6,982 | | 10.4 | |
December 31, 2007 | | 107,807 | | 7.5 | | 8,147 | | 88.3 | | 8,656 | | 30.7 | | 6,327 | | (2.4 | ) |
| | | | |
| | | Net income
per share | | Net income per share
(diluted) |
| | | (Yen) | | (Yen) |
December 31, 2008 | | 1,018.59 | | 1,017.73 |
December 31, 2007 | | 962.71 | | 959.72 |
The percentages shown next to revenue, operating income, ordinary income and net income represent year-on-year changes.
| | | | | | | | |
| | | (In millions of yen, with fractional amounts rounded) |
| | | Total assets | | Net assets | | Equity capital ratio
to total assets | | Net assets
per share |
| | | (Millions of yen) | | (Millions of yen) | | (%) | | (Yen) |
December 31, 2008 | | 439,479 | | 250,404 | | 57.0 | | 36,505.18 |
December 31, 2007 | | 427,146 | | 246,458 | | 57.7 | | 35,991.30 |
(Notes) Stockholders’ equity: As of December 31, 2008 ¥250,356 million As of December 31, 2007 ¥246,444 million
(Cautionary note regarding future-related information)
The forecasts contained in this report have been prepared on the basis of information that is currently available. Because such estimates are inherently very uncertain, actual results may differ from the forecasts. The Company does not guarantee that it will achieve these estimated results and advises readers to refrain from depending solely on these forecasts. Readers should also note that the Company is under no obligation to revise this information on a regular basis.
3
| (1) | Analysis of Business Results |
Jupiter Telecommunications Co., Ltd., (“the Company”) and its consolidated group (“the J:COM Group”)—its consolidated subsidiaries and equity-method affiliates—made the fiscal year ended December 31, 2008 one for reestablishing a growth trend in its cable television services. In addition, the J:COM Group made steady progress with its Volume plus Value growth and Content strategies.
The status of various efforts to implement its growth strategy is as follows:
The J:COM Group has taken steps to increase the number of customer contact points by diversifying sales routes. As a part of these endeavors, in addition to its traditional direct sales representative approach, the J:COM Group has placed particular emphasis on efforts to strengthen its marketing activities at J:COM Shops. As of December 31, 2008, the number of J:COM Shops had increased to 50.
In its efforts to form equity-based alliances, as well as purchase other cable television companies and businesses, the J:COM Group undertook several strategic acquisitions. As a result, successful measures were implemented to expand the J:COM Group’s service area. Specific endeavors during the fiscal year ended December 31, 2008 were as follows:
| | • | | J:COM acquired 99.2% of the outstanding stock of Kyoto Cable Communications Co., Ltd., (also known as Miyavision), making the acquisition a consolidated subsidiary at the end of January 2008. |
| | • | | Consolidated subsidiary Cablenet Kobe Ashiya Co., Ltd., acquired the cable television business of the Kobe City Development & Management Foundation at the end of February 2008. |
| | • | | J:COM acquired additional outstanding stock of Fukuoka Cable Network Co., Ltd. (FCN), the J:COM Group’s only equity-method affiliate among its cable television network. As a result, FCN became a J:COM Group’s consolidated subsidiary as of August 25, 2008. |
| | • | | J:COM acquired a 97.9% equity share of Jyohoku New Media Co., Ltd., (also known as Taito Cable Television), which adjoins a J:COM Group service area, on December 1, 2008. Jyohoku New Media was accordingly included as a consolidated subsidiary. |
| | • | | J:COM acquired 100% of the outstanding stock of Mediatti Communications, Inc., Japan’s third largest multiple systems operator, making the acquisition a consolidated subsidiary on December 25, 2008. |
In addition, the J:COM Group implemented various measures aimed at reorganizing its consolidated subsidiaries and operations, resulting in continued improvement of its operational efficiency and competitiveness. As part of these initiatives, J:COM West Co., Ltd., and Kyoto Cable Communications merged on December 1, 2008.
To increase the average monthly revenue per unit (ARPU), the J:COM Group worked diligently to enhance the number of services offered per subscribing household (the bundle ratio) and enhance the added value of existing services.
In the area of cable television services, and as a facet of its activities to market its video on demand (VOD) capabilities, the J:COM Group broadcasted a preview of the Warner Bros. production “Speed Racer,” in conjunction with Asmik Ace Entertainment Inc., a motion picture distribution company, via “J:COM On Demand” on the same day as the movie’s DVD release. Moreover, following the launch of the distribution service NHK on Demand by Japan Broadcasting Corporation (NHK) on December 1, 2008, the J:COM Group began broadcasts of the service on the same day. This is a service that allows viewers to enjoy the NHK television programming of their choice and convenience. NHK on Demand consists of two types of services: NHK Archive Selection provides selected past programs from NHK’s vast library and Catch-up programs, which are available to viewers who have missed programs for a period of about a week after they were originally broadcast on one of five different NHK terrestrial and satellite channels. Adding this new service to the J:COM lineup is expected to increase both the overall number of VOD service users and the utilization of the “J:COM on Demand” service.
4
Introduced in fiscal 2006, the J:COM Group’s digital video recording service (HDR), which enables the recording of HD broadcasts to an internal hard disk drive using a set-top box, has also experienced steady growth in its number of subscribers. HDR offers a variety of benefits including enhanced convenience, becoming popular for both its features and perceived cost/performance ratio to users. As of December 31, 2008, J:COM had 404,800 subscribers to its HDR service. This contributed significantly to ARPU growth. Furthermore, the Company launched a new “HDR Plus” high-specification and functionality service across all service areas on December 17, 2008.
“HDR Plus” features an enhanced DVD drive with digital high-definition video recording capability as well as an expanded 500 gigabyte hard disk. It delivers approximately four times more recording capacity as compared to the conventional HDR service. With the introduction of “HDR Plus”, J:COM expects to increase its base of digital service users while improving customer satisfaction.
By the end of July 2008, the J:COM Group had also added J:COM NET Ultra 160M Course, a super high-speed 160 Mbps Internet access service priced at ¥6,300 per month, to its existing J:COM Net 30M Course priced at ¥5,775 per month. As a competitive service that exceeds the Internet access speed provided by its 100 Mbps “fiber to the home” (FTTH) services, and one that delivers other value-added features, including enhanced security and competitive usage fees, J:COM NET Ultra 160M Course is forecasted to generate further growth in subscriber numbers. In this manner, J:COM is well positioned to offer an Internet access service menu that compares favorably with those provided by other major communications companies. As a result of this initiative, as well as to the introduction of J:COM NET Ultra 160M Course, the number of subscribing households has increased and resulted in an ARPU improvement.
As a result of the merger with Jupiter TV Co., Ltd. (JTV) in September 2007, the Company became Japan’s largest multi-channel operator (MCO). The J:COM Group provides sixteen specialized pay-television channel services through various distribution infrastructures including cable and direct-to-home satellite service providers. Leveraging synergies gained from this merger, the J:COM Group takes full advantage of resources such as its funding capabilities, customer base and customer information, including opinions and requests collected directly by sales representatives as well as call centers. In this manner, the J:COM Group is taking steps to improve programming quality, review and enhance channel contents, and continually provide appealing programs to its customers. As a part of these endeavors, the J:COM Group began broadcasting Channel Ginga in April 2008. At the same time, the J:COM Group enhanced its channel lineup through the addition of two highly rated U.S. channels, FOXCRIME and the SCIFI Channel.
In bolstering the programming content quality of the new Channel Ginga in autumn 2008, the J:COM Group enhanced the satisfaction of its existing subscribing households while further expanding the breadth of its audience. Furthermore in December 2008, the Company launched the commercial-free “Cinema Channel” that focuses mainly on Hollywood box-office hits, topical movies, and unforgettable film classics.
With less than three years remaining in the countdown to the complete changeover to terrestrial digital broadcasting in July 2011, the J:COM Group recognizes that its response to this change will be critical. For this reason, the J:COM Group launched the Digital Project in October 2008, and will actively promote an early completion to the shift to terrestrial digital broadcasting, targeting the first half of 2010, while working to provide increasingly sophisticated services. At the same time, the J:COM Group has identified this opportunity as a potential means to increase the number of subscribers and further bolster its revenue stream. In promoting the aforementioned Digital Project, the J:COM Group will endeavor to secure increased acceptance of terrestrial digital broadcasting and growth in the number of multi-channel viewing households.
As a result of the measures mentioned above, the total number of subscribing households (the number of households that subscribe to one or more services) at consolidated system operators increased by 508,300 or 19% from December 31, 2007 to 3,167,400 households at December 31, 2008. By type of service, cable television subscribers grew by 369,000 households or 17% from December 31, 2007 to 2,557,000 households at December 31, 2008. The number of high-speed Internet access and telephony services subscribers increased by 275,200 or 23%, and 257,200 or 20%, respectively, to 1,486,800 and 1,569,800 households, respectively, as of December 31, 2008. The bundle ratio was unchanged at 1.77 as of December 31, 2008 from December 31, 2007. However, excluding the impact of five acquisitions in 2008, the bundle ratio increased to 1.82 as of December 31, 2008. ARPU increased from ¥7,687 for the year-ended December 31, 2007 to ¥ 7,789 for the year-ended December 2008.
5
Overview of business results
In the following discussion, we quantify the impact of acquisitions on our results of operations. The acquisition impact represents our estimate of the difference between the operating results of the periods under comparison that is attributable to the timing of an acquisition. In general, we base our estimate of the acquisition impact on an acquired entity’s operating results during the first three months following the acquisition date such that changes from those operating results in subsequent periods are considered to be organic changes. Included as acquisition are (i) the July 2007 acquisition of Jupiter Visual Co. Ltd, (ii) the September 2007 merger with Jupiter TV Co., Ltd. and its subsidiaries and affiliates (JTV Group), (iii) the January 2008 acquisition of Kyoto Cable Communications Co. Ltd., (iv) the February 2008 acquisition of Kobe City Development & Management Foundation, (v) the August 2008 acquisition of Fukuoka Cable Network Co., Ltd., and (vi) the December 2008 acquisition of Jyohoku New Media., Ltd. (Taito Cable Television).
Revenue
Total revenue increased by ¥29,800 million, or 11% from ¥264,508 million for the year ended December 31, 2007 to ¥ 294,308 million for the year ended December 31, 2008. This increase includes ¥11,761 million that is attributable to the aggregate impact of acquisitions. Excluding the impact of acquisitions, total revenue increased by ¥18,039 million, or 7%.
Subscription fees increased by ¥21,788 million, or 9%, from ¥230,061 million for the year ended December 31, 2007 to ¥251,849 million for the year ended December 31, 2008. This increase includes ¥5,305 million that is due to the aggregate impact of acquisitions. Excluding the impact of acquisitions, subscriber fees increased by ¥16,483 million, or 7%.
Cable television subscription fees increased by ¥11,354 million, or 9% from ¥123,071 million for the year ended December 31, 2007 to ¥134,425 million for the year ended December 31, 2008. The increase in cable television subscription revenue includes a 6% organic increase in subscription fees that is attributable to an increase in the average number of digital cable subscribers, for which we charge a higher fee compared to our analog cable service, and the associated increase in ARPU. As of December 31, 2008, 78% of cable television subscribers were receiving our digital service, compared to 67% as of December 31, 2007.
High-speed Internet subscription fees increased by ¥6,921 million, or 10% from ¥66,558 million for the year ended December 31, 2007 to ¥ 73,479 million for the year ended December 31, 2008. The increase in high-speed Internet subscription revenue includes a 9% organic increase in subscription fees that is attributable to the net effect of (i) an increase in the average number of high-speed Internet subscribers and (ii) lower ARPU due to product bundling discounts.
Telephony subscription fees increased by ¥3,513 million, or 9%, from ¥40,432 million for the year ended December 31, 2007 to ¥ 43,945 million for the year ended December 31, 2008. The increase in telephony subscription revenue is attributable to the net effect of (i) an increase in the average number of telephony subscribers and (ii) lower ARPU due to a decrease in call volumes.
Other revenue increased by ¥8,012 million, or 23%, from ¥34,447 million for the year ended December 31, 2007 to ¥42,459 million for the year ended December 31, 2008. This increase includes ¥6,456 million that is attributable to the aggregate impact to acquisitions. The acquisition impact is mainly due to the merger with Jupiter TV Co. Ltd.
Operating Costs and Expenses
Operating and programming costs increased by ¥7,351 million, or 7%, from ¥104,748 million for the year ended December 31, 2007 to ¥112,099 million for the year ended December 31, 2008. This increase includes ¥ 3,799 million that is attributable to the aggregate impact of acquisitions. The remaining increase is due primarily to costs directly related to growth of our subscriber base.
Selling, general and administrative expenses increased by ¥ 6,792 million, or 13%, from ¥52,722 million for the year ended December 31, 2007 to ¥59,514 million for the year ended December 31, 2008. This increase includes ¥4,248 million that is attributable to the aggregate impact of acquisitions The remaining increase is primarily attributable to increases in personnel costs.
6
Depreciation and amortization expenses increased by ¥4,798 million, or 7%, from ¥64,222 million for the year ended December 31, 2007 to ¥69,020 million for the year ended December 31, 2008. This increase is attributable to the aggregate impact of acquisitions and additions to fixed assets related to the installation of services to new customers.
Operating income, as a result of the above items, increased by ¥10,859 million, or 25%, from ¥42,816 million for the year ended December 31, 2007 to ¥53,675 million for the year ended December 31, 2008.
Interest expense, net increased by ¥443 million, or 10%, from ¥4,276 million for the year ended December 31, 2007 to ¥4,719 million for the year ended December 31, 2008.
Income before income taxes increased by ¥9,934 million, or 26%, from ¥37,506 million for the year ended December 31, 2007 to ¥47,440 million for the year ended December 31, 2008.
Net income increased by ¥3,972 million, or 17%, from ¥23,992 million for the year ended December 31, 2007 to ¥27,964 million for the year ended December 31, 2008 for the reasons set forth above.
Outlook for the coming fiscal year
| | | | | | | | |
| | | | | | | (In millions in yen) |
| | | Revenue | | Operating
Income | | Income before
Income Taxes | | Net
Income |
December 31, 2008 (Actual) | | 294,308 | | 53,675 | | 47,440 | | 27,964 |
December 31, 2009 (Forecast) | | 330,000 | | 60,000 | | 52,000 | | 29,000 |
Change (%) | | 12.1 | | 11.8 | | 9.6 | | 3.7 |
Despite a downturn in the pace of overall growth in the cable industry, signs are emerging that other major telecommunications companies are entering the pay multi-channel broadcast market in earnest. As a result, the J:COM Group’s operating environment is becoming increasingly competitive. At the same time, market entry by companies outside the industry is serving to raise public awareness. This is expected to help reenergize the market. With less than three years to the complete changeover to terrestrial digital broadcasting, the J:COM Group will renew its efforts to secure widespread acceptance of the various and diverse digital broadcast services while further enhancing the enjoyment and numbers of pay multi-channel broadcast subscribers. In this context, the trend toward digitization is recognized as a significant opportunity for the J:COM Group.
Guided by the Digital Project, a key initiative that the J:COM Group has continued to promote since its launch toward the end of 2008, the Company will work diligently to secure volume growth, enhance value and improve programming quality against the backdrop of the aforementioned market conditions.
As a part of its efforts to secure volume growth, the J:COM Group will bolster marketing across newly expanded areas, leveraging the Company’s acquisition activities over the previous year. At the same time, the J:COM Group will continue to diversify its sales channels and strive to expand its subscriber base.
To enhance value, the Company will move forward with efforts to increase the convenience and functionality of the J:COM Group’s digital television services. In addition, the Company will seek to differentiate itself from other companies by providing comprehensive after-care customer services. Through these means, the J:COM Group expects to increases its competitive position.
With the aim of improving programming quality, the Company will accelerate its shift to HD broadcasting while creating and producing attractive content. This is expected to increase the level of customer satisfaction.
7
Taking into consideration the aforementioned measures, consolidated revenues are expected to total ¥330,000 million for the fiscal year ending December 31, 2009, and the J:COM Group forecasts consolidated operating income, income before income taxes and net income of ¥ 60,000 million, ¥52,000 million and ¥29,000 million, respectively.
The J:COM Group’s consolidated performance forecasts, which are based on business plans for the full fiscal year, do not provide performance forecasts for the first half (cumulative basis).
Asset, Liability and Stockholders’ equity
Total assets increased by ¥75,254 million, from ¥680,416 million as of December 31, 2007 to ¥755,670 million as of December 31, 2008. The increase was primarily due to acquisitions made in 2008.
Total liabilities increased by ¥52,375 million, from ¥345,008 million as of December 31, 2007 to ¥397,383 million as of December 31, 2008. The increase was primarily due to acquisitions made in 2008 and borrowings made in connection with the Mediatti acquisition.
Stockholders’ equity increased by ¥19,343 million, from ¥330,009 million as of December, 2007 to ¥349,352 million as of December 31, 2008. The increase was primarily due to current net income partially offset by distributions and dividends paid.
Cash flows
For the year ended December 31, 2008, the net cash provided by our operating activities of ¥100,692 million and existing cash and cash equivalent was used to fund net cash used in our investing and financing activities of ¥76,357 million and ¥25,722 million, respectively.
Cash Provided by Operating Activities
Net cash flows provided by operating activities increased ¥5,466 million from ¥95,226 million for the year ended December 31, 2007 to ¥100,692 million for the year ended December 31, 2008. The increase is primarily attributable to an increase in our net income, offset by an increase in cash paid for income taxes and changes in our working capital accounts.
Cash Used in Investing Activities
Net cash used in investing activities increased ¥23,629 million from ¥52,728 million for the year ended December 31, 2007 to ¥76,357 million for the year ended December 31, 2008. The net cash used for the year ended December 31, 2008 primarily consisted of ¥46,972 million for capital expenditures and ¥29,410 million for our acquisition of new subsidiaries and the acquisition of business operations.
Cash Used in Financing Activities
Net cash used in financing activities decreased ¥14,372 million from ¥40,094 million for the year ended December 31, 2007 to ¥25,722 million for the year ended December 31, 2008. The ¥25,772 net cash used in financing activities for the year ended December 31, 2008 consisted of ¥17,105 million of principle payments under capital lease obligations, ¥7,448 million net payments of short term loans and long-term debt, ¥3,428 million of dividends paid to shareholders, offset by ¥856 million of proceeds from the issuance of common stock and ¥1,403 million of other financing activities.
8
| (3) | Fundamental policy regarding the distribution of profits |
J:COM recognizes that the distribution of profits to shareholders is an important management issue. In this context, the Company will endeavor to consistently supplement the J:COM Group’s internal reserves for use in potential future investments such as the acquisition of other companies and businesses as well as capital expenditures, while at the same time maintaining stable and continuous returns to shareholders. As such, J:COM undertook the payment of an interim cash dividend of ¥500 per share, which included a special cash dividend of ¥250 per share. In connection with the year-end cash dividend, the Company plans to pay ¥250 per share.
Looking ahead, J:COM will continue to promote sustainable growth while working positively to return profits to shareholders. In fiscal 2009, the year ending December 31, 2009, the Company plans to pay an annual cash dividend of ¥980 per share, comprising an interim cash dividend of ¥490 per share and a year-end cash dividend of ¥490 per share, compared with ¥750 per share in fiscal 2008 taking into consideration of the J:COM Group’s business results and other factors.
The J:COM Group has implemented organizational and structural risk management measures. However, should risks emerge, the possibility exists that they could significantly affect the J:COM Group’s business results, financial position, or cash flows.
As of December 31, 2008, risks to the J:COM Group (some of which are outside of the control of the J:COM Group) were as follows:
1. Risks associated with the J:COM Group’s businesses
| | • | | An ineffective strategy for gaining new subscribers. |
| | • | | Turnover among sales staff can reduce the effectiveness of marketing activities, causing the failure to maintain subscribers and the loss of opportunities to gain new subscribers. |
| | • | | Risk that the J:COM Group might be unable to secure the funds, equipment, or obtain regulatory approvals needed for network expansion. |
| | • | | Reduction in opportunities to expand operations through the acquisition of other businesses. |
| | • | | Changes in the performance of J:COM Group companies might have a negative effect on operating results. |
| | • | | Risks associated with non-compliance with certain regulations (for instance, claims for damages resulting from the unauthorized release of personal information). |
2. Risks associated with business relationships
| | • | | Adverse developments, including the cessation of transactions, in the J:COM Group’s relationships with programming suppliers, network infrastructure providers, suppliers of service reception and transmission equipment (digital set-top boxes, etc.), and other CATV and satellite broadcast operators. |
3. Risks associated with markets
| | • | | Intensifying competition with other firms in the same line of business as the J:COM Group, and adverse trends in markets. |
4. Risks associated with changes in global macroeconomic conditions
| | • | | As concerns surrounding a downturn in the global economy increase, current macroeconomic conditions may have a negative impact on the Company’s performance. |
5. Legal and regulatory risks
| | • | | Stricter government regulations, revisions to laws, etc. |
6. Risks associated with natural and man-made disasters
| | • | | Outage of the J:COM Group’s transmission facilities due to natural disasters, terrorist attacks, etc. |
For more detailed information on the foregoing, please refer to the J:COM annual securities report scheduled for submission in March 2009.
9
| II. | Status of the Jupiter Telecommunications Co., Ltd. (J:COM) Group |
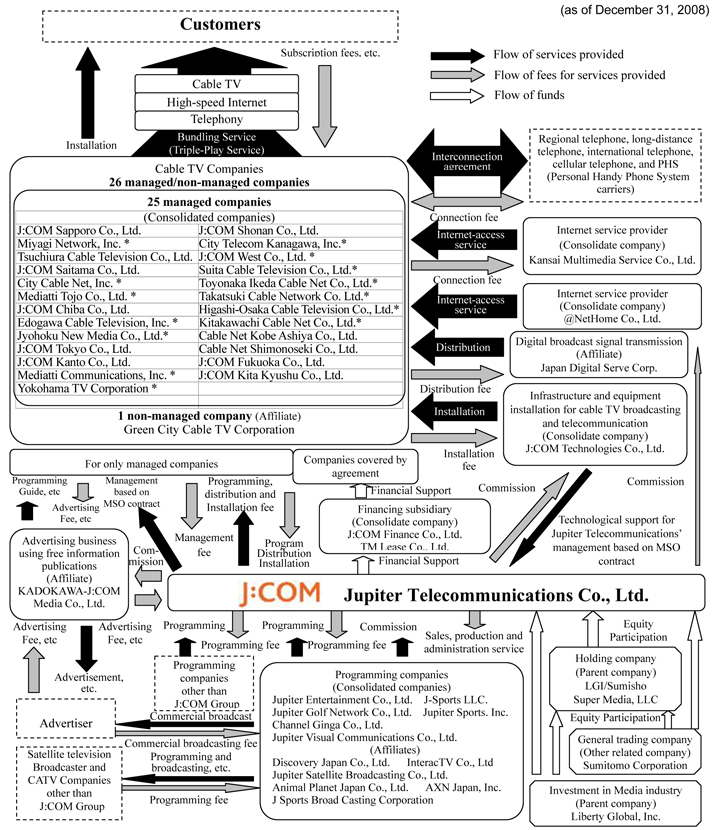
| • | | Services and bundle services offered by the company marked with * and non-managed companies are different from the services provided under J:COM brand. |
10
| (1) | Fundamental management policy |
The basic management philosophy of the J:COM Group defines the Company’s mission as enhancing the sense of affluence felt by its customers in their daily lives by meeting their needs through state-of-the-art visual, audio, and high-speed Internet access services based on advanced technology.
To realize its management philosophy, the J:COM Group provides three services as a comprehensive one-stop provider: (1) cable television (J:COM TV), (2) high-speed Internet access (J:COM NET) and (3) telephony services (J:COM PHONE). These services are provided through the J:COM Group’s system operators (listed in the “II. Status of the Jupiter Telecommunications., Ltd. (J:COM) Group” chart), which utilize the J:COM broadband (high speed, large capacity) network. Through such services, the J:COM Group endeavors each day to build close, trusting relationships with customers and local communities, while working to become the kind of company that can return the benefits of its achievements to local communities and shareholders.
As noted above, on September 1, 2007, the J:COM Group acquired interests in various thematic channels through its merger with JTV, thereby making the J:COM Group the largest multiple channel operator in Japan. As a leading company in the broadcasting and telecommunications industries, the J:COM Group plans to leverage improvements in programming quality to stimulate growth in the demand for multi-channel services, thereby increasing its shareholder value by expanding both its cable television and programming distribution businesses.
| (2) | Target management indices |
The J:COM Group’s services primarily target individual subscribers, and its greatest strength is one-stop shopping for bundled services at reasonable prices. Revenue, subscribers, bundle ratio, ARPU, and churn rates are important management indicators for evaluating success.
In terms of profitability, the Company believes that operating cash flow (OCF) and OCF margins are important management indices for measuring its operating results and its ability to leverage its operating costs.
| (3) | Medium- and long-term management strategies, and issues requiring action |
The J:COM Group positioned the fiscal year ended December 31, 2008 as one for reestablishing a growth trend in its cable television operations. In this context, the J:COM Group continued to promote its Volume plus Value and Content growth strategies. Looking ahead to the fiscal year ending December 31, 2009 and beyond, the J:COM Group will also work to increase subscriber numbers (volume growth), raise ARPU (value growth), and enhance programming quality as a part of continued efforts to secure overall sustainable growth. Through these means, the J:COM Group will endeavor to promote higher corporate value.
To increase subscriber numbers, the J:COM Group will be taking the following actions:
Increasing penetration rates in existing areas by promoting diversified sales channels
The J:COM Group is striving to strengthen its sales and marketing capabilities, and increase its customer contact points in existing markets by diversifying sales channels to increase subscriber penetration rates. Its principle measures are described below:
| | • | | Strengthening agency sales |
| | • | | Increasing the number of J:COM Shops near commuter train stations and shopping areas |
| | • | | Strengthening Web marketing |
| | • | | Vigorous marketing to households receiving only J:COM retransmission services |
The J:COM Group endeavors to increase subscriber numbers by extending its network as well as by strengthening its sales and marketing capabilities to convert the approximately 5 million retransmission only homes to paying subscribers.
11
Expanding new areas by M&A
As a key pillar that underpins the J:COM Group’s efforts to increase subscribers in existing areas and to promote its volume strategy, J:COM will proactively consider mergers and acquisitions that complement its existing business activities both in substance and geographic area.
In addition to the inclusion of Jyohoku New Media Co., Ltd. (also known as Taito Cable Television), a cable television service provider operating mainly in Taito Ward, Tokyo, within the J:COM Group’s scope of consolidation as a consolidated subsidiary in December 2008, J:COM also acquired 100% of the outstanding stock of Mediatti Communications, Inc. Previously the third largest cable TV operator in Japan with six consolidated cable television systems operating mainly in the Kanto region, Mediatti also became a wholly owned subsidiary of J:COM in December 2008. Looking ahead, it will remain the J:COM Group’s policy to pursue opportunities for equity-based alliance and friendly mergers focusing primarily on cable television companies that are operating in close proximity to J:COM Group system operators as the means to further expand its service area.
The J:COM Group is pursuing increased efficiency in management by merging its consolidated subsidiaries, with the ultimate goal of achieving the competitiveness required for sustainable growth throughout the J:COM Group. These mergers of the J:COM Group companies and other reorganization measures will not only strengthen the J:COM Group’s financial position and heighten its management efficiency, but also advance its regional strategy by increasing the J:COM Group’s regional presence as well as its credibility with customers.
To increase ARPU, the J:COM Group is moving forward with increasing the bundle ratio and enhancing the added value of existing services. Its principle measures are described below:
Cable television (J:COM TV)
To strengthen its competitiveness against satellite broadcast and communications carriers, the J:COM Group is moving forward with efforts to bolster and augment its three major digital services: VOD, HDR, and HD programming. In order to increase the customer convenience of its HDR services, the J:COM Group is introducing a higher-performance HDR service with functions exceeding those presently offered. As a part of these endeavors, J:COM launched a new HDR Plus service in December 2008 and is consistently striving to increase the number of new digital service subscribers as well as to further enhance customer satisfaction.
In addition, the J:COM Group will continue to upgrade its VOD services by augmenting measures that only the J:COM Group can initiate. While further expanding HD content as well as Channel-on-Demand services (on-demand content offered by each individual channel), the J:COM Group will bolster the appeal of its high-definition quality programming via J:COM On Demand with the inclusion of the previously mentioned NHK on Demand and other services.
Moving toward July 2011 and the complete changeover to terrestrial digital broadcasting, the J:COM Group recognizes that its efforts in this area will play an increasingly important role in the future. The J:COM Group established the Digital Project Promotion Office in October 2008, to serve as its central coordinating body, and has launched the group-wide Digital Project. Through these means, the J:COM Group will actively promote the smooth migration to terrestrial digital broadcasting, endeavor to further increase the number of households utilizing its cable television services, and attempt to achieve a 100% digital conversion rate during 2010.
| 3. | New business and value added services |
The J:COM Group emphasizes the provision of new value-added services that can be offered on its own network in addition to existing services. Commenced in January 2008, one such service is an earthquake alert early warning service for households. This service was extended to cable television operators outside the J:COM Group as well as local government and other authorities in April 2008 and September 2008, respectively. In specific terms, the J:COM Group uses its cable network to forward the Earthquake Early Warnings transmitted by the Japan Meteorological Agency to the aforementioned parties. The J:COM Group’s earthquake alert early warning service adopts a terminal computation method that incorporates the longitude and latitude of each customer’s designated terminal as well as site data of installation areas (information transmitted by the independent administrative agency National Research Institute for Earth Science and Disaster Prevention). When compared to information provided by other CATV companies, the J:COM Group is able to provide much more accurate seismic intensity data and tremor arrival times to our subscribers.
12
Moreover, in February 2008, the consolidated subsidiary J:COM Tokyo Co., Ltd., which is accredited as a broadcaster on telecommunications services, began providing Internet access as well as a fixed telephone service to all condominiums within THE TOKYO TOWERS. Located in Kachidoki, Chuo Ward, Tokyo, this pair of buildings is a large residential complex in an area outside the existing service area. Based on the experience gained through THE TOKYO TOWERS, the J:COM Group will aggressively expand its services by pursuing similar initiatives.
Drawing on each of the aforementioned services, the J:COM Group endeavors to increase customer satisfaction and contribute to the safety of local communities.
| 4. | Expanding the content strategy |
The J:COM Group will work to enhance programming quality by adding the creation and supply of exciting programming to its existing cable television business. In order to improve the programming on its channels and to develop appealing, higher quality programming, the J:COM Group began using data from the digital viewership rating service, which was launched in the summer of 2006, as well as subscriber opinions gathered by direct sales representatives and call centers. At the same time, its channel lineup is being continuously reexamined. Furthermore, the J:COM Group will continue to place considerable emphasis on efforts to convert highly rated, widely viewed programs to a high-definition format.
13
| IV. | Consolidated Annual Financial Statements |
JUPITER TELECOMMUNICATIONS CO., LTD.
AND SUBSIDIARIES
CONSOLIDATED INCOME STATEMENTS
(YEN IN MILLIONS, EXCEPT SHARE AND PER SHARE AMOUNTS)
| | | | | | | | | | | | |
| | | Year ended
December 31,
2008 | | | Year ended
December 31,
2007 | | | Change | |
Account | | Amount | | | Amount | | | Amount | | | (%) | |
Revenue: | | | | | | | | | | | | |
Subscription fees | | 251,849 | | | 230,061 | | | 21,788 | | | 9.5 | |
Other | | 42,459 | | | 34,447 | | | 8,012 | | | 23.3 | |
| | | | | | | | | | | | |
| | 294,308 | | | 264,508 | | | 29,800 | | | 11.3 | |
| | | | | | | | | | | | |
Operating costs and expenses | | | | | | | | | | | | |
Operating and programming costs | | (112,099 | ) | | (104,748 | ) | | (7,351 | ) | | (7.0 | ) |
Selling, general and administrative | | (59,514 | ) | | (52,722 | ) | | (6,792 | ) | | (12.9 | ) |
Depreciation and amortization | | (69,020 | ) | | (64,222 | ) | | (4,798 | ) | | (7.5 | ) |
| | | | | | | | | | | | |
| | (240,633 | ) | | (221,692 | ) | | (18,941 | ) | | (8.5 | ) |
| | | | | | | | | | | | |
Operating income | | 53,675 | | | 42,816 | | | 10,859 | | | 25.4 | |
Other income (expenses): | | | | | | | | | | | | |
Interest expense, net: | | | | | | | | | | | | |
Related parties | | (1,479 | ) | | (1,332 | ) | | (147 | ) | | (11.1 | ) |
Other | | (3,240 | ) | | (2,944 | ) | | (296 | ) | | (10.1 | ) |
Equity in earnings of affiliates | | 600 | | | 291 | | | 309 | | | 106.1 | |
Other income, net | | 177 | | | 558 | | | (381 | ) | | (68.3 | ) |
| | | | | | | | | | | | |
Income before income taxes and other items | | 49,733 | | | 39,389 | | | 10,344 | | | 26.3 | |
Minority interest in net income of consolidated subsidiaries | | (2,293 | ) | | (1,883 | ) | | (410 | ) | | (21.7 | ) |
| | | | | | | | | | | | |
Income before income taxes | | 47,440 | | | 37,506 | | | 9,934 | | | 26.5 | |
Income tax expense | | (19,476 | ) | | (13,514 | ) | | (5,962 | ) | | (44.1 | ) |
| | | | | | | | | | | | |
Net income | | 27,964 | | | 23,992 | | | 3,972 | | | 16.6 | |
| | | | | | | | | | | | |
Per Share data | | | | | | | | | | | | |
Net income per share – basic | | 4,079.61 | | | 3,650.27 | | | 429.34 | | | 11.8 | |
Net income per share – diluted | | 4,076.17 | | | 3,638.93 | | | 437.24 | | | 12.0 | |
Weighted average number of ordinary shares outstanding – basic | | 6,854,535 | | | 6,572,638 | | | 281,897 | | | 4.3 | |
Weighted average number of ordinary shares outstanding – diluted | | 6,860,334 | | | 6,593,130 | | | 267,204 | | | 4.1 | |
(Note) Percentages are calculated based on amounts before rounding.
14
JUPITER TELECOMMUNICATIONS CO., LTD.
AND SUBSIDIARIES
CONSOLIDATED BALANCE SHEETS
(YEN IN MILLIONS)
| | | | | | | | | |
| | | December 31, 2008 | | | December 31, 2007 | | | Change | |
Account | | Amount | | | Amount | | | Amount | |
Current assets: | | | | | | | | | |
Cash and cash equivalents | | 21,503 | | | 22,890 | | | (1,387 | ) |
Accounts receivable | | 14,838 | | | 13,198 | | | 1,640 | |
Allowance for doubtful accounts | | (396 | ) | | (356 | ) | | (40 | ) |
Deferred tax asset–current | | 11,429 | | | 11,738 | | | (309 | ) |
Prepaid expenses and other current assets | | 7,250 | | | 5,164 | | | 2,086 | |
| | | | | | | | | |
Total current assets | | 54,624 | | | 52,634 | | | 1,990 | |
| | | | | | | | | |
Investments: | | | | | | | | | |
Investments in affiliates | | 13,363 | | | 19,502 | | | (6,139 | ) |
Investments in other securities, at cost | | 2,141 | | | 2,139 | | | 2 | |
| | | | | | | | | |
Total investments | | 15,504 | | | 21,641 | | | (6,137 | ) |
| | | | | | | | | |
Property and equipment, at cost: | | | | | | | | | |
Land | | 3,056 | | | 2,789 | | | 267 | |
Distribution system and equipment | | 620,017 | | | 523,599 | | | 96,418 | |
Support equipment and buildings | | 45,580 | | | 39,148 | | | 6,432 | |
| | | | | | | | | |
| | 668,653 | | | 565,536 | | | 103,117 | |
| | | | | | | | | |
Less accumulated depreciation | | (284,919 | ) | | (228,341 | ) | | (56,578 | ) |
| | | | | | | | | |
Total property and equipment, at cost | | 383,734 | | | 337,195 | | | 46,539 | |
| | | | | | | | | |
Other assets: | | | | | | | | | |
Goodwill | | 246,196 | | | 221,493 | | | 24,703 | |
Identifiable intangible asset, net | | 38,159 | | | 32,862 | | | 5,297 | |
Deferred tax asset–non current | | 4,137 | | | 4,423 | | | (286 | ) |
Other | | 13,316 | | | 10,168 | | | 3,148 | |
| | | | | | | | | |
Total other assets | | 301,808 | | | 268,946 | | | 32,862 | |
| | | | | | | | | |
Total assets | | 755,670 | | | 680,416 | | | 75,254 | |
| | | | | | | | | |
15
| | | | | | | | | |
| | | December 31, 2008 | | | December 31, 2007 | | | Change | |
Account | | Amount | | | Amount | | | Amount | |
Current liabilities: | | | | | | | | | |
Short-term loans | | 6,092 | | | 2,625 | | | 3,467 | |
Long-term debt–current portion | | 12,453 | | | 21,308 | | | (8,855 | ) |
Capital lease obligations–current portion | | | | | | | | | |
Related parties | | 15,355 | | | 11,671 | | | 3,684 | |
Other | | 3,108 | | | 2,947 | | | 161 | |
Accounts payable | | 21,298 | | | 24,279 | | | (2,981 | ) |
Income tax payable | | 9,907 | | | 7,082 | | | 2,825 | |
Deposit from related parties | | 4,124 | | | 3,536 | | | 588 | |
Deferred revenue–current portion | | 7,314 | | | 6,088 | | | 1,226 | |
Accrued expenses and other liabilities | | 10,059 | | | 6,236 | | | 3,823 | |
| | | | | | | | | |
Total current liabilities | | 89,710 | | | 85,772 | | | 3,938 | |
| | | | | | | | | |
Long-term debt, less current portion | | 170,488 | | | 143,219 | | | 27,269 | |
Capital lease obligations, less current portion: | | | | | | | | | |
Related parties | | 38,705 | | | 34,335 | | | 4,370 | |
Other | | 6,763 | | | 6,911 | | | (148 | ) |
Deferred revenue | | 66,537 | | | 54,708 | | | 11,829 | |
Redeemable preferred stock of consolidated subsidiary | | — | | | 500 | | | (500 | ) |
Deferred tax liability – non current | | 11,827 | | | 12,643 | | | (816 | ) |
Other liabilities | | 13,353 | | | 6,920 | | | 6,433 | |
| | | | | | | | | |
Total liabilities | | 397,383 | | | 345,008 | | | 52,375 | |
| | | | | | | | | |
Minority interests | | 8,935 | | | 5,399 | | | 3,536 | |
| | | | | | | | | |
Shareholders’ equity: | | | | | | | | | |
Ordinary shares no par value | | 117,162 | | | 116,734 | | | 428 | |
Additional paid-in capital | | 226,388 | | | 231,493 | | | (5,105 | ) |
Retained earnings | | 14,457 | | | (10,079 | ) | | 24,536 | |
Treasury stock | | (7,520 | ) | | (7,520 | ) | | — | |
Accumulated other comprehensive loss | | (1,135 | ) | | (619 | ) | | (516 | ) |
| | | | | | | | | |
Total shareholders’ equity | | 349,352 | | | 330,009 | | | 19,343 | |
| | | | | | | | | |
Total liabilities, minority interests and shareholders’ equity | | 755,670 | | | 680,416 | | | 75,254 | |
| | | | | | | | | |
16
JUPITER TELECOMMUNICATIONS CO., LTD.
AND SUBSIDIARIES
Consolidated Statements of Shareholders’ Equity
(YEN IN MILLIONS)
| | | | | | | | | | | | | | | | | | | | |
| | | Ordinary
Shares | | Additional paid
in capital | | | Comprehensive
Income/(Loss) | | | Retained
earnings/
(Accumulated
Deficit) | | | Accumulated
Other
Comprehensive
Income/(Loss) | | | Treasury
Stock at
cost | | | Total
Shareholders’
Equity | |
Balance at December 31, 2006 | | 115,232 | | 196,335 | | | | | | (34,071 | ) | | (200 | ) | | (0 | ) | | 277,296 | |
Net income: | | | | | | | 23,992 | | | 23,992 | | | | | | | | | 23,992 | |
Unrecognized loss of acquired companies | | | | | | | | | | — | | | | | | | | | — | |
Other comprehensive income: | | | | | | | | | | | | | | | | | | | | |
Changes in the fair value of derivative financial instruments | | | | | | | (419 | ) | | | | | (419 | ) | | | | | (419 | ) |
| | | | | | | | | | | | | | | | | | | | |
Comprehensive income | | | | | | | 23,573 | | | | | | | | | | | | | |
| | | | | | | | | | | | | | | | | | | | |
Ordinary shares issued upon exercise of Stock options | | 1,502 | | 1,470 | | | | | | | | | | | | | | | 2,972 | |
Stock compensation (includes paid not issued options) | | | | 141 | | | | | | | | | | | | | | | 141 | |
Increase due to merger | | | | 33,547 | | | | | | | | | | | | | | | 33,547 | |
Purchase of treasury stock | | | | | | | | | | | | | | | | (7,520 | ) | | (7,520 | ) |
| | | | | | | | | | | | | | | | | | | | |
Balance at December 31, 2007 | | 116,734 | | 231,493 | | | | | | (10,079 | ) | | (619 | ) | | (7,520 | ) | | 330,009 | |
Net income: | | | | | | | 27,964 | | | 27,964 | | | | | | | | | 27,964 | |
Other comprehensive income: | | | | | | | | | | | | | | | | | | | | |
Unrealized gain on cash flow hedge | | | | | | | (516 | ) | | | | | (516 | ) | | | | | (516 | ) |
| | | | | | | | | | | | | | | | | | | | |
Comprehensive income | | | | | | | 27,448 | | | | | | | | | | | | | |
| | | | | | | | | | | | | | | | | | | | |
Stock compensation | | | | 55 | | | | | | | | | | | | | | | 55 | |
Ordinary shares issued upon exercise of Stock options | | 428 | | 428 | | | | | | | | | | | | | | | 856 | |
Distribution to Parent in connection with Mediatti acquisition | | | | (5,588 | ) | | | | | | | | | | | | | | (5,588 | ) |
Dividend paid | | | | | | | | | | (3,428 | ) | | | | | | | | (3,428 | ) |
Retirement of treasury stock | | | | (0 | ) | | | | | | | | | | | 0 | | | — | |
| | | | | | | | | | | | | | | | | | | | |
Balance at December 31, 2008 | �� | 117,162 | | 226,388 | | | | | | 14,457 | | | (1,135 | ) | | (7,520 | ) | | 349,352 | |
| | | | | | | | | | | | | | | | | | | | |
17
JUPITER TELECOMMUNICATIONS CO., LTD.
AND SUBSIDIARIES
CONSOLIDATED STATEMENTS OF CASH FLOWS
(YEN IN MILLIONS)
| | | | | | |
| | | Year ended
December 31, 2008 | | | Year ended
December 31, 2007 | |
Classification | | Amount | | | Amount | |
Cash flows from operating activities: | | | | | | |
Net income | | 27,964 | | | 23,992 | |
Adjustments to reconcile net income to net cash provided by operating activities: | | | | | | |
Depreciation and amortization | | 69,020 | | | 64,222 | |
Equity in earnings of affiliates | | (600 | ) | | (291 | ) |
Minority interest in net income of consolidated subsidiaries | | 2,293 | | | 1,883 | |
Stock compensation expenses | | 55 | | | 140 | |
Deferred income taxes | | 2,772 | | | 1,657 | |
Non-cash gain from forgiveness of debt | | (135 | ) | | — | |
Changes in operating assets and liabilities, excluding effects of business combinations: | | | | | | |
Decrease in accounts receivable, net | | 96 | | | 2,477 | |
Decrease/(increase) in prepaid expenses and other current assets | | (1,273 | ) | | 214 | |
Increase in other assets | | (2,339 | ) | | (2,478 | ) |
Increase/(decrease) in accounts payable | | (3,418 | ) | | 412 | |
Increase in accrued expenses and other liabilities | | 7,247 | | | 2,834 | |
Increase/(decrease) in deferred revenue | | (990 | ) | | 164 | |
| | | | | | |
Net cash provided by operating activities | | 100,692 | | | 95,226 | |
| | | | | | |
Cash flows from investing activities: | | | | | | |
Capital expenditures | | (46,972 | ) | | (46,348 | ) |
Acquisitions of new subsidiaries, net of cash acquired | | (27,700 | ) | | 634 | |
Acquisition of business operation | | (1,710 | ) | | — | |
Investments in and advances to related party | | — | | | (1,138 | ) |
Loan to related party | | — | | | (5,166 | ) |
Principle received from related party | | — | | | 1,350 | |
Acquisition of minority interests in consolidated subsidiaries | | (132 | ) | | (2,543 | ) |
Other investing activities | | 157 | | | 483 | |
| | | | | | |
Net cash used in investing activities | | (76,357 | ) | | (52,728 | ) |
| | | | | | |
Cash flows from financing activities: | | | | | | |
Proceeds from issuance of common stock | | 856 | | | 2,973 | |
Purchase of treasury stock | | — | | | (7,520 | ) |
Net increase/(decrease) in short-term loans | | (294 | ) | | 335 | |
Proceeds from long-term debt | | 55,284 | | | 613 | |
Principal payments of long-term debt | | (62,438 | ) | | (25,699 | ) |
Principal payments under capital lease obligations | | (17,105 | ) | | (15,689 | ) |
Cash dividend paid to shareholders | | (3,428 | ) | | — | |
Other financing activities | | 1,403 | | | 4,893 | |
| | | | | | |
Net cash used in financing activities | | (25,722 | ) | | (40,094 | ) |
| | | | | | |
Net increase/(decrease) in cash and cash equivalents | | (1,387 | ) | | 2,404 | |
| | | | | | |
Cash and cash equivalents at beginning of year | | 22,890 | | | 20,486 | |
| | | | | | |
Cash and cash equivalents at end of term | | 21,503 | | | 22,890 | |
| | | | | | |
18
Summary of significant accounting policies
| | (1) | Number of consolidated subsidiaries: 36 |
| | (2) | The names of the Company’s consolidated subsidiaries are shown in “II. Status of the Jupiter Telecommunications Co., Ltd. (J:COM) Group”. |
| 2. | Scope of application of equity method |
| | (1) | Number of equity method affiliates: 9 |
| | (2) | The names of these affiliates are shown in “II. Status of the Jupiter Telecommunications Co., Ltd. (J:COM) Group”. |
| 3. | Significant accounting policies |
| | (1) | Accounting standards used to prepare financial statements |
The Company prepares its annual consolidated financial statements using terminology, forms and methods of preparation required under accounting principles generally accepted in the United States of America.
| | (2) | Securities valuation standards and valuation method |
To value its securities, the Company applies Statement of Financial Accounting Standards (“SFAS”) No. 115, “Accounting for Certain Investments in Debt and Equity Securities.”
| | |
| Investments in affiliates (excluding loans): | | Equity method |
| Investments in other securities: | | Cost method |
When investments in affiliates and unmarketable stocks decline in value, the Company considers the possibility of recognizing impairment losses, if such declines are deemed to be other-than-temporary.
| (3) | Valuation standards and valuation methods for derivatives |
The Company accounts for derivatives based on SFAS No.133 “Accounting for Certain Derivative Instruments and Hedging Activities” as amended. According to SFAS No. 133, as amended, all derivatives must be fairly valued and recognized on the balance sheet as assets or liabilities.
| | • | | Derivative instrument designated and effectively active as a fair value hedge: |
Changes in the fair value of derivative instruments and of the assets or liabilities being hedged are recognized as periodic income/loss.
| | • | | Derivative instrument designated as cash flow hedge—regarding the portion effectively active as a hedge: |
Until income/losses on the assets or liabilities being hedged are recognized on the income statement, they must be recognized as other comprehensive income/loss.
| | • | | Derivative instrument designated as cash flow hedge—regarding the portion that is not effectively active as a hedge: |
Recognized as periodic income/loss.
| | • | | Derivative instruments not designated as hedge: |
Changes in fair value recognized as periodic income/loss.
| (4) | Accounting for long-lived assets |
For long-term assets other than goodwill, the Company evaluates the need for impairment losses on the guidance in SFAS No. 144 “Accounting for the Impairment or Disposal of Long-Lived Assets”, whenever events or changes in circumstances indicate that the carrying amount of an asset may not be recoverable.
| (5) | Depreciation method for tangible fixed assets |
The straight-line method is applied.
Useful lives of major assets:
| | |
| Distribution system and equipment: | | 10 - 17 years |
| Buildings and structures: | | 15 - 40 years |
| Support equipment: | | 5 - 15 years |
(Assets acquired through capital leases are depreciated over periods ranging from 2-20 years.)
| (6) | Valuation standards and valuation methods for goodwill |
The Company recognizes as goodwill the difference between costs of acquisition of consolidated subsidiaries and the estimated fair value of the net assets of applicable companies.
In accordance with SFAS No. 142, “Goodwill and Other Intangible Assets,” the Company conducts an impairment test once each year or whenever an event occurs that suggests the possibility of impairment.
| (7) | Accounting methods of Asset Retirement Obligation |
The company applies FASB Interpretation No. 47 which clarifies that the term asset retirement obligation as used in FASB Statement No.143, Accounting for Asset Retirement Obligations. This interpretation requires us to recognize a liability for the fair value of a conditional asset retirement obligation if the fair value of the liability can be reasonably estimated.
| (8) | Standards for recognition of important allowances |
19
Bad debt allowance
The Company calculates a bad debt allowance on the basis of our best estimate of probable future losses on accounts receivable. It also recognizes estimated uncollectible amounts when such allowances are required.
The Company accounts for leases in accordance with SFAS No.13 “Accounting for Leases.”
| (10) | Amortization of identifiable intangible assets |
Intangible assets consist of customer relationships, which are amortized over the expected lives of our customers (up to 10 years).
Intangible assets consist of distribution franchise, which are amortized over the expected lives of our customers (up to 20 years).
The Company and its subsidiaries account for income taxes under the asset and liability method. Deferred tax assets and liabilities are recognized for the future tax consequences attributable to differences between the financial statement carrying amounts of existing assets and liabilities and their respective tax bases and operating loss and tax credit carryforwards. Deferred tax assets and liabilities are measured using enacted tax rates expected to apply to taxable income in the years in which those temporary differences are expected to be recovered or settled. The effect on deferred tax assets and liabilities of a change in tax rates is recognized in income in the period that includes the enactment date.
The Company and its subsidiaries recognize cable television, high-speed Internet access, telephony and programming revenues when such services are provided to subscribers. Revenues derived from other sources are recognized when services are provided, events occur or products are delivered. Initial subscriber installation revenues are recognized in the period in which the related services are provided to the extent of direct selling costs. Any remaining amount is deferred and recognized over the estimated average period that the subscribers are expected to remain connected to the cable television system. Historically, installation revenues have been less than related direct selling costs, therefore such revenues have been recognized as installations are completed.
The Company and its subsidiaries provide poor reception rebroadcasting services to noncable television viewers suffering from poor reception of television waves caused by artificial obstacles. The Company and its subsidiaries enter into agreements with parties that have built obstacles causing poor reception for construction and maintenance of cable facilities to provide such services to the affected viewers at no cost to them during the agreement period. Under these agreements, the Company and its subsidiaries receive up-front, lump-sum compensation payments for construction and maintenance. Revenues from these agreements have been deferred and are being recognized in income on a straight-line basis over the agreement periods which are generally 20 years. Such revenues are included in revenue - other in the accompanying consolidated statements of operations.
The Company’s channels distribute programming to individual satellite platform subscribers through an agreement with the platform operator which provides subscriber management services to channels in return for a fee based on subscription revenues. Individual satellite subscribers pay a monthly fee for programming channels under the terms of rolling one-month subscription contracts. Cable and broadband service providers generally pay a per-subscriber fee for the right to distribute the company’s programming on their systems under the terms of generally annual distribution contracts. Revenue for such services is recognized in the periods in which programming services are provided to cable, satellite and broadband subscribers.
The FASB issued SFAS No. 123 (Revised 2004) (SFAS No. 123R) in December 2004. SFAS No. 123R is a revision of SFAS No. 123 Accounting for Stock-Based Compensation. SFAS No. 123R requires a public entity to measure the cost of employee services received in exchange for an award of equity instruments based on the grant-date fair value of the award. That cost will be recognized over the period during which an employee is required to provide service in exchange for the award. The company has applied the modified prospective method to adopt SFAS No. 123R since January 1, 2006.
| (14) | Significant business combination |
On September 1, 2007, the Company merged with JTV by issuing ordinary shares to LGI and Sumitomo in exchange for their ordinary shares in JTV. Under the provisions of SFAS 141,Business Combinations, the JTV interest acquired from LGI, our consolidating parent has been treated as a transaction between entities under common control and recognized at book value, whereas, the JTV interest acquired from Sumitomo has been accounted for using the purchase method of accounting and recognized at fair value. Accordingly, the excess of our acquisition costs over the fair value of net assets acquired from JTV was allocated to goodwill. The opening balance sheet of JTV is considered final. The purchase price allocation of JTV was updated in 2008, however considered final as of the quarter ended September 30, 2008.
20
On December 25, 2008 the Company acquired a 100% interest in Mediatti Communications, Inc., (Mediatti) a broadband communications provider in Japan. Mediatti was partially owned by our parent company Liberty Global Inc., (LGI). Under the provisions of SFAS 141,Business Combinations, the Mediatti interest acquired from LGI has been treated as a transaction between entities under common control and the Mediatti interest acquired from third parties has been accounted for using the purchase method of accounting. The aggregate cost basis assigned to Mediatti interest acquired has been allocated to the acquired identifiable net assets based on the preliminary assessment of their respective fair values, with the excess of the aggregate cost basis over the preliminary fair values allocated to goodwill. The purchase price allocation is considered preliminary and subject to adjustment.
A summary of the purchase price and opening balance sheets for the above significant acquisitions during the years ended December 31, 2007 and 2008 is presented below (Yen in millions):
| | | | | | | | |
| | | Year Ended December 31, 2008 | |
| | | Jupiter TV | | | Mediatti | |
Cash, receivables and other assets | | ¥ | 15,888 | | | ¥ | 10,031 | |
Property and equipment | | | 1,025 | | | | 27,403 | |
Goodwill | | | 18,507 | | | | 19,737 | |
Intangible asset | | | 15,380 | | | | 4,555 | |
Debt and capital lease obligations | | | (3,061 | ) | | | (26,307 | ) |
Other liabilities | | | (13,793 | ) | | | (6,839 | ) |
| | | | | | | | |
Total purchase price | | ¥ | 33,946 | | | ¥ | 28,580 | |
| | | | | | | | |
Purchase price: | | | | | | | | |
Cash consideration | | ¥ | — | | | ¥ | 28,351 | |
Stock issuance | | | 33,547 | | | | — | |
Investment in affiliates | | | — | | | | — | |
Direct acquisition costs | | | 399 | | | | 229 | |
| | | | | | | | |
| | ¥ | 33,946 | | | ¥ | 28,580 | |
| | | | | | | | |
The opening balance sheet of Mediatti is based on preliminary purchase price allocations and is therefore subject to adjustment based on our final assessment of fair values of tangible and intangible assets and liabilities.
Notes to Annual Consolidated Financial Statements
Segment Information
The Company’s new channel services are considered a separate operating segment, however, due to the insignificant size of these channel service operations, management has determined it has one reportable segment “Broadband communications services” as of December 31, 2008. Therefore, information on operating segments is not applicable in this section.
| (2) | Segment information by region |
Because the Company does not have any overseas subsidiaries or branches, this section is not applicable.
21
Earning per share
| | | | | | |
| | | 2008 | | 2007 |
Net income (Yen in Million) | | ¥ | 27,964 | | ¥ | 23,992 |
Weighted average common shares outstanding: | | | |
Basic | | | 6,854,535 | | | 6,572,638 |
Effect of dilutive common stock equivalents | | | 5,799 | | | 20,492 |
| | | | | | |
Diluted | | | 6,860,334 | | | 6,593,130 |
| | | | | | |
Earnings per share (Yen): | | | |
Basic | | ¥ | 4,079.61 | | ¥ | 3,650.27 |
Diluted | | ¥ | 4,076.17 | | ¥ | 3,638.93 |
Subsequent events
None
22
| V. | Annual financial Statements (Parent Company Only-Japanese GAAP) |
For the Year Ended December 31, 2008
JUPITER TELECOMMUNICATIONS CO., LTD
(Parent Company Only-Japanese GAAP)
INCOME STATEMENTS
(YEN IN MILLIONS)
| | | | | | | | | | | |
Account | | Year ended
December 31, 2008 | | Year ended
December 31, 2007 | | | Change | |
| | | Amount | | Amount | | | Amount | | | (%) | |
Sales | | 117,933 | | 107,807 | | | 10,126 | | | 9.4 | |
Cost of sales | | 93,448 | | 87,952 | | | 5,496 | | | 6.2 | |
| | | | | | | | | | | |
Gross income | | 24,485 | | 19,855 | | | 4,630 | | | 23.3 | |
| | | | | | | | | | | |
Selling, general & administrative expenses | | 14,037 | | 11,708 | | | 2,329 | | | 19.9 | |
Wages and salaries | | 4,605 | | 3,678 | | | 927 | | | 25.2 | |
Retirement cost | | 89 | | 69 | | | 20 | | | 29.0 | |
Employee’s benefit | | 698 | | 661 | | | 37 | | | 5.6 | |
Rent expense | | 1,322 | | 890 | | | 432 | | | 48.5 | |
Repair expense | | 878 | | — | | | 878 | | | — | |
Consulting expenses | | 2,162 | | 2,226 | | | (64 | ) | | (2.9 | ) |
Depreciation expense | | 1,131 | | 1,044 | | | 87 | | | 8.3 | |
Amortization of goodwill | | 779 | | 541 | | | 238 | | | 44.0 | |
Other | | 2,373 | | 2,599 | | | (226 | ) | | (8.7 | ) |
| | | | | | | | | | | |
Operating income | | 10,448 | | 8,147 | | | 2,301 | | | 28.2 | |
| | | | | | | | | | | |
Non-Operating profit | | 2,758 | | 3,635 | | | (877 | ) | | (24.1 | ) |
Interest revenue | | 2,212 | | 2,814 | | | (602 | ) | | (21.4 | ) |
Dividends | | 129 | | 373 | | | (244 | ) | | (65.4 | ) |
Guarantee fee | | 91 | | 104 | | | (13 | ) | | (12.5 | ) |
Other | | 326 | | 344 | | | (18 | ) | | (5.2 | ) |
Non-Operating charges | | 2,729 | | 3,126 | | | (397 | ) | | (12.7 | ) |
Interest expense | | 2,434 | | 2,597 | | | (163 | ) | | (6.3 | ) |
Long term prepaid guarantees amortization | | 188 | | 219 | | | (31 | ) | | (14.2 | ) |
Stock issue cost amortization | | — | | 214 | | | (214 | ) | | (100.0 | ) |
Other | | 107 | | 96 | | | 11 | | | 11.5 | |
| | | | | | | | | | | |
Ordinary income | | 10,477 | | 8,656 | | | 1,821 | | | 21.0 | |
| | | | | | | | | | | |
Extraordinary gains | | 710 | | — | | | 710 | | | — | |
Gain on sale of affiliate company | | 428 | | — | | | 428 | | | — | |
Gain on goodwill amortization of previous year | | 282 | | — | | | 282 | | | — | |
| | | | | | | | | | | |
Extraordinary losses | | 144 | | 59 | | | 85 | | | 144.1 | |
Loss on one-time amortization of loan expense | | 144 | | 59 | | | 85 | | | 144.1 | |
| | | | | | | | | | | |
Net income before taxes | | 11,043 | | 8,597 | | | 2,446 | | | 28.5 | |
Income taxes & inhabitant taxes | | 32 | | 3,661 | | | (3,629 | ) | | (99.1 | ) |
Income taxes - deferred | | 4,029 | | (1,391 | ) | | 5,420 | | | — | |
| | | | | | | | | | | |
Net income after taxes | | 6,982 | | 6,327 | | | 655 | | | 10.4 | |
| | | | | | | | | | | |
| * | Fractional rounded makes some differences between sum of breakdown and total in Change column. |
| * | The Company presented “Repair expense” separately from “Selling, general & administrative expenses -Other” for the year ended December 31, 2008 and included the expense of 576 million yen in “Other” for the year ended December 31, 2007 |
23
JUPITER TELECOMMUNICATIONS CO., LTD
(Parent Company Only-Japanese GAAP)
BALANCE SHEETS
(YEN IN MILLIONS)
| | | | | | | | | |
Account | | December 31,
2008 | | | December 31,
2007 | | | Change | |
| | Amount | | | Amount | | | Amount | |
Current assets: | | | | | | | | | |
Cash and cash equivalents | | 402 | | | 1,437 | | | (1,035 | ) |
Accounts receivable-Trade | | 12,091 | | | 11,533 | | | 558 | |
Securities | | 10,495 | | | 14,290 | | | (3,795 | ) |
Inventories | | 1,848 | | | 359 | | | 1,489 | |
Prepaid expenses | | 645 | | | 622 | | | 23 | |
Deposit | | 5,000 | | | 4,000 | | | 1,000 | |
Deferred tax asset | | 4,408 | | | 845 | | | 3,563 | |
Other current assets | | 3,943 | | | 4,332 | | | (389 | ) |
| | | | | | | | | |
Total current assets | | 38,832 | | | 37,418 | | | 1,414 | |
| | | | | | | | | |
Fixed assets: | | | | | | | | | |
Buildings | | 1,008 | | | 1,041 | | | (33 | ) |
Other structure | | 27 | | | 30 | | | (3 | ) |
Machinery and equipment | | 1,418 | | | 1,462 | | | (44 | ) |
Land | | 429 | | | 429 | | | — | |
| | | | | | | | | |
Tangible fixed assets | | 2,882 | | | 2,962 | | | (80 | ) |
| | | | | | | | | |
| | | | | | | | | |
Goodwill | | 6,744 | | | 15,680 | | | (8,936 | ) |
Software | | 3,853 | | | 4,106 | | | (253 | ) |
Other intangible fixed asset | | 17 | | | 14 | | | 3 | |
| | | | | | | | | |
Intangible fixed assets | | 10,614 | | | 19,800 | | | (9,186 | ) |
| | | | | | | | | |
| | | | | | | | | |
Investment securities | | 2,706 | | | 2,706 | | | — | |
Investments to subsidiaries and affiliates | | 297,427 | | | 269,612 | | | 27,815 | |
Long-term loans to others | | 233 | | | 251 | | | (18 | ) |
Long-term loans to related parties | | 84,500 | | | 92,300 | | | (7,800 | ) |
Long-term prepaid expenses | | 543 | | | 753 | | | (210 | ) |
Guarantees | | 1,717 | | | 1,315 | | | 402 | |
Other investments | | 25 | | | 29 | | | (4 | ) |
| | | | | | | | | |
Total investment and other assets | | 387,151 | | | 366,966 | | | 20,185 | |
| | | | | | | | | |
Total fixed assets | | 400,647 | | | 389,728 | | | 10,919 | |
| | | | | | | | | |
Total Assets | | 439,479 | | | 427,146 | | | 12,333 | |
| | | | | | | | | |
Current liabilities: | | | | | | | | | |
Accounts payable-Trade | | 7,012 | | | 7,964 | | | (952 | ) |
Long-term debt-current portion | | 8,984 | | | 18,075 | | | (9,091 | ) |
Accrued liabilities | | 2,672 | | | 2,630 | | | 42 | |
Accrued expenses | | 1,380 | | | 1,492 | | | (112 | ) |
Income tax payable | | 221 | | | 4,076 | | | (3,855 | ) |
Withheld payable | | 387 | | | 2,614 | | | (2,227 | ) |
Other current liabilities | | 182 | | | 37 | | | 145 | |
| | | | | | | | | |
Total current liabilities | | 20,838 | | | 36,888 | | | (16,050 | ) |
| | | | | | | | | |
Fixed liabilities: | | | | | | | | | |
Long-term debt | | 155,984 | | | 128,151 | | | 27,833 | |
Deferred tax liability | | 10,313 | | | 14,620 | | | (4,307 | ) |
Other long term liabilities | | 1,940 | | | 1,029 | | | 911 | |
| | | | | | | | | |
Total fixed liabilities | | 168,237 | | | 143,800 | | | 24,437 | |
| | | | | | | | | |
Total Liabilities | | 189,075 | | | 180,688 | | | 8,387 | |
| | | | | | | | | |
Stockholders’ equity | | | | | | | | | |
Common stock | | 117,162 | | | 116,734 | | | 428 | |
Capital surplus: | | | | | | | | | |
Capital reserve | | 31,302 | | | 30,873 | | | 429 | |
Additional paid-in capital | | 94,132 | | | 94,132 | | | — | |
| | | | | | | | | |
Total Capital Surplus | | 125,434 | | | 125,005 | | | 429 | |
| | | | | | | | | |
Accumulated profit | | | | | | | | | |
Retained earnings carried forward | | 16,363 | | | 12,809 | | | 3,554 | |
| | | | | | | | | |
Total retained earnings | | 16,363 | | | 12,809 | | | 3,554 | |
| | | | | | | | | |
Treasury stock | | (7,520 | ) | | (7,520 | ) | | (0 | ) |
| | | | | | | | | |
Total Stockholder’s equity | | 251,439 | | | 247,028 | | | 4,411 | |
| | | | | | | | | |
Revaluation surplus | | | | | | | | | |
Deferred hedge loss | | (1,083 | ) | | (584 | ) | | (499 | ) |
| | | | | | | | | |
Total Revaluation surplus | | (1,083 | ) | | (584 | ) | | (499 | ) |
| | | | | | | | | |
Stock option | | 48 | | | 14 | | | 34 | |
| | | | | | | | | |
Total Net Assets | | 250,404 | | | 246,458 | | | 3,946 | |
| | | | | | | | | |
Total Liabilities & Net Assets | | 439,479 | | | 427,146 | | | 12,333 | |
| | | | | | | | | |
24
(Note)
| | | | | | |
| | | December 31,
2008 | | December 31,
2007 |
1. Accumulated depreciation of Tangible fixed assets | | ¥ | 1,531 million | | ¥ | 1,176 million |
2. Guarantee liabilities (for bank loan)* | | ¥ | 20,145 million | | ¥ | 23,926 million |
| * | Other than above guarantee liabilities, we have ¥2,846 million (USD 32 million), ¥4,069 million (USD 37 million) exchange reservation contract on behalf of certain subsidiaries and affiliates in 2008 and 2007 respectively. |
25
JUPITER TELECOMMUNICATIONS CO., LTD
(Parent Company Only-Japanese GAAP)
Statement of stockholders’ equity
| | |
| For the 12 month ended December 31, 2007 | | (Yen in millions) |
| | | | | | | | | | | | | | | | | | | | | |
| | | Stockholders’ equity | |
| | Common
stock | | Advance on
subscription | | | Capital Surplus | | Retained Earnings | | Treasury
stock | | | Total
Stockholders’
equity | |
| | | | Capital
reserve | | Additional
paid-in
capital | | Total capital
surplus | | Accumulated
profit | | Total
retained
earnings | | |
| | | | | | | Retained earnings
carried forward | | | |
Balance at December 31, 2006 | | 115,232 | | 32 | | | 29,371 | | 42,230 | | 71,601 | | 6,482 | | 6,482 | | (0 | ) | | 193,347 | |
Movement for this period | | | | | | | | | | | | | | | | | | | | | |
Net income | | | | | | | | | | | | | 6,327 | | 6,327 | | | | | 6,327 | |
JTV merger | | | | | | | | | 51,902 | | 51,902 | | | | | | | | | 51,902 | |
Treasury stock | | | | | | | | | | | | | | | | | (7,520 | ) | | (7,520 | ) |
Stock option exercise | | 1,486 | | | | | 1,486 | | | | 1,486 | | | | | | | | | 2,972 | |
Reclass from Advance on subscription to Common stock or Capital reserve | | 16 | | (32 | ) | | 16 | | | | 16 | | | | | | | | | — | |
Movement other than Stockholders’ equity item | | | | | | | | | | | | | | | | | | | | | |
Total movement | | 1,502 | | (32 | ) | | 1,502 | | 51,902 | | 53,404 | | 6,327 | | 6,327 | | (7,520 | ) | | 53,681 | |
Balance at December 31, 2007 | | 116,734 | | — | | | 30,873 | | 94,132 | | 125,005 | | 12,809 | | 12,809 | | (7,520 | ) | | 247,028 | |
| | | | | | | | | | | |
| | | Revaluation surplus | | | Stock option | | Total Net
assets | |
| | Deferred hedge
loss | | | Total revaluation
surplus | | | |
Balance at December 31, 2006 | | (192 | ) | | (192 | ) | | — | | 193,155 | |
Movement for this period | | | | | | | | | | | |
Net income | | | | | | | | | | 6,327 | |
JTV merger | | | | | | | | | | 51,902 | |
Treasury stock | | | | | | | | | | (7,520 | ) |
Stock option exercise | | | | | | | | | | 2,972 | |
Reclass from Advance on subscription to Common stock or Capital reserve | | | | | | | | | | — | |
Movement other than Stockholders’ equity item | | (392 | ) | | (392 | ) | | 14 | | (378 | ) |
Total movement | | (392 | ) | | (392 | ) | | 14 | | 53,303 | |
Balance at December 31, 2007 | | (584 | ) | | (584 | ) | | 14 | | 246,458 | |
26
| | |
| For the 12 month ended December 31, 2008 | | (Yen in millions) |
| | | | | | | | | | | | | | | | | | | | | | |
| | | Stockholders’ equity | |
| | Common
stock | | Capital Surplus | | | Retained Earnings | | | Treasury
stock | | | Total
Stockholders’
equity | |
| | | Capital
reserve | | Additional
paid-in
capital | | | Total capital
surplus | | | Accumulated
profit | | | Total retained
earnings | | | |
| | | | | | Retained earnings
carried forward | | | | |
Balance at December 31, 2007 | | 116,734 | | 30,873 | | 94,132 | | | 125,005 | | | 12,809 | | | 12,809 | | �� | (7,520 | ) | | 247,028 | |
Movement for this period | | | | | | | | | | | | | | | | | | | | | | |
Dividend | | | | | | | | | | | | (3,428 | ) | | (3,428 | ) | | | | | (3,428 | ) |
Net income | | | | | | | | | | | | 6,982 | | | 6,982 | | | | | | 6,982 | |
Retirement of treasury stock | | | | | | (0 | ) | | (0 | ) | | | | | | | | 0 | | | — | |
Stock option exercise | | 428 | | 429 | | | | | 429 | | | | | | | | | | | | 857 | |
Movement other than Stockholders’ equity item | | | | | | | | | | | | | | | | | | | | | | |
Total movement | | 428 | | 429 | | (0 | ) | | 429 | | | 3,554 | | | 3,554 | | | 0 | | | 4,411 | |
Balance at December 31, 2008 | | 117,162 | | 31,302 | | 94,132 | | | 125,434 | | | 16,363 | | | 16,363 | | | (7,520 | ) | | 251,439 | |
| | | | | | | | | | | |
| | | Revaluation surplus | | | Stock option | | Total Net
assets | |
| | Deferred hedge
loss | | | Total revaluation
surplus | | | |
Balance at December 31, 2007 | | (584 | ) | | (584 | ) | | 14 | | 246,458 | |
Movement for this period | | | | | | | | | | | |
Dividend | | | | | | | | | | (3,428 | ) |
Net income | | | | | | | | | | 6,982 | |
Retirement of treasury stock | | | | | | | | | | — | |
Stock option exercise | | | | | | | | | | 857 | |
Movement other than Stockholders’ equity item | | (499 | ) | | (499 | ) | | 34 | | (465 | ) |
Total movement | | (499 | ) | | (499 | ) | | 34 | | 3,946 | |
Balance at December 31, 2008 | | (1,083 | ) | | (1,083 | ) | | 48 | | 250,404 | |
27
Significant Accounting Policies
| 1. | Securities Valuation Method |
Investments to subsidiaries and affiliates
Acquisition cost by the moving average method
Other investments
Non-marketable Securities
Acquisition cost by the moving average method
Lower of cost or market by the moving average method
| 3. | Depreciation Method of Tangible Fixed Assets |
The straight-line method is applied.
| | |
| Buildings | | 15–50 years |
| Other structures | | 10–60 years |
| Machinery and equipment | | 4–15 years |
| 4. | Amortization Method of Intangible Fixed Assets |
Straight-line method
With regard to software for in-house use, straight-line method over estimated in-house useful life (5 years).
With regard to goodwill, straight-line method over 10 years
| 5. | Long term Prepaid Expenses |
Amortized using straight-line method.
| | (1) | Allowance for Bad debts |
Calculate based on historical bad debt ratio approach for general receivables and on debtor’s financial evaluation approach for particular doubtfuls.
| 7. | Important foreign exchange hedge method |
| | (1) | Hedge accounting method |
Deferred hedge method is applied. When allotment is applicable, such method is used.
| | (2) | Measure and object for hedge |
Hedge measure: Foreign exchange reserve, and interest swap
| | |
| Object for hedge: | | Account receivables and payables in foreign currency, and interest of debt loans with variable interest rate |
The Company tries to minimize the risks of foreign exchange fluctuations of account receivables and payables in foreign currency as well as the risks of fluctuations of interest rate for debt loans based on the Company’s internal regulations.
Valuation is done comparing reserved rates and actual rates at closing dates and settlement dates. With regard to interest swap, valuation is done by the interest risk as object for hedge being diminished.
Except for finance lease where ownership is expected to transfer to the lessee, the accounting method for lease transactions in conformance with accounting policy of general lease transaction is applied.
Consumption taxes are excluded from income and expenses in Statement of Operations, and net of payables / receivables of Consumption Taxes are recorded in Balance Sheet.
Change of Significant Accounting Policies (Parent Only-Japanese GAAP)
Due to early adoption of new accounting guidance, JICPA Accounting Standard Committee Report No. 10 (The revision of the practical guidance for deferred income tax accounting for stand alone financial statements), our operating income and ordinary income both increased by ¥844 million and our net income before taxes increased by ¥1,125 million.
28
Additional Information
Business combination
Based on the JTV valuation report updated by the supplemental information we had acquired during the current half year, the purchase price allocation was finalized since the previous purchase price allocation was based on preliminary estimates of fair value with the available data at the time.
The carrying amount of goodwill was adjusted based on the final purchase price allocation and the application of new practical guidelines, deferred tax accounting for financial statement, as follow.
(Yen in Millions)
| | | |
Account | | Change in goodwill | |
<Purchase price allocation> | | | |
Current assets (Other current assets) | | 12 | |
Non-current assets (Investments in subsidiaries and affiliates) | | 7,168 | |
| | | |
Subtotal | | 7,180 | |
<Effect of early adoption of new accounting guidance > | | | |
Other long-term liabilities (Deferred income tax) | | (15,619 | ) |
| | | |
Total | | (8,439 | ) |
| | | |
Changes in executives
As soon as the information becomes available, we will disclose it.
(Currently expected on February 27, 2009)
29
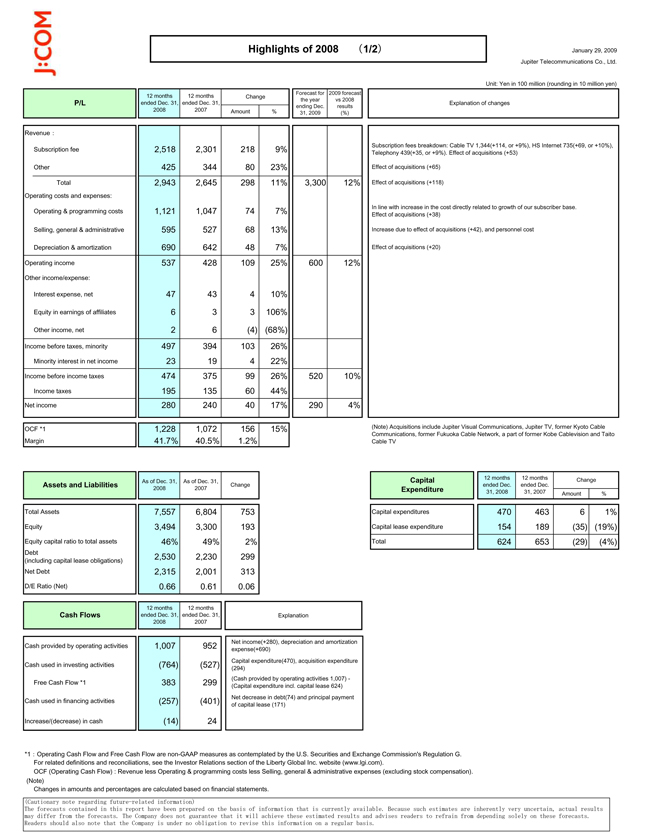
Highlights of 2008 (1/2) January 29, 2009
Jupiter Telecommunications Co., Ltd.
Unit: Yen in 100 million (rounding in 10 million yen)
P/L 12 months ended Dec. 31, 2008 12 months ended Dec. 31, 2007 Change Forecast for the year ending Dec. 31, 2009 2009 forecast vs 2008 results (%)
Amount%
Revenue:
Subscription fee 2,518 2,301 218 9%
Other 425 344 80 23%
Total 2,943 2,645 298 11% 3,300 12%
Operating costs and expenses:
Operating & programming costs 1,121 1,047 74 7%
Selling, general & administrative 595 527 68 13%
Depreciation & amortization 690 642 48 7%
Operating income 537 428 109 25% 600 12%
Other income/expense:
Interest expense, net 47 43 4 10%
Equity in earnings of affiliates 6 3 3 106%
Other income, net 2 6 (4)(68%)
Income before taxes, minority 497 394 103 26%
Minority interest in net income 23 19 4 22%
Income before income taxes 474 375 99 26% 520 10%
Income taxes 195 135 60 44%
Net income 280 240 40 17% 290 4%
OCF *1 1,228 1,072 156 15%
Margin 41.7% 40.5% 1.2%
Assets and Liabilities
As of Dec. 31, As of Dec. 31, Change 2008 2007
Total Assets 7,557 6,804 753
Equity 3,494 3,300 193
Equity capital ratio to total assets 46% 49% 2%
Debt (including capital lease obligations) 2,530 2,230 299
Net Debt 2,315 2,001 313
D/E Ratio (Net) 0.66 0.61 0.06
Cash Flows 12 months ended Dec. 31, 2008 12 months ended Dec. 31, 2007
Cash provided by operating activities 1,007 952
Cash used in investing activities (764) (527)
Free Cash Flow *1 383 299
Cash used in financing activities (257) (401)
Increase/(decrease) in cash (14) 24
Explanation
Net income(+280), depreciation and amortization expense (+690)
Capital expenditure(470), acquisition expenditure (294)
(Cash provided by operating activities 1,007) - (Capital expenditure incl. capital lease 624)
Net decrease in debt(74) and principal payment of capital lease (171)
*1: Operating Cash Flow and Free Cash Flow are non-GAAP measures as contemplated by the U.S. Securities and Exchange Commission’s Regulation G.
For related definitions and reconciliations, see the Investor Relations section of the Liberty Global Inc. website (www.lgi.com).
OCF (Operating Cash Flow) : Revenue less Operating & programming costs less Selling, general & administrative expenses (excluding stock compensation).
(Note)
Changes in amounts and percentages are calculated based on financial statements.
(Cautionary note regarding future-related information)
The forecasts contained in this report have been prepared on the basis of information that is currently available. Because such estimates are inherently very uncertain, actual results may differ from the forecasts. The Company does not guarantee that it will achieve these estimated results and advises readers to refrain from depending solely on these forecasts. Readers should also note that the Company is under no obligation to revise this information on a regular basis.
Explanation of changes
Subscription fees breakdown: Cable TV 1,344(+114, or +9%), HS Internet 735(+69, or +10%), Telephony 439(+35, or +9%). Effect of acquisitions (+53)
Effect of acquisitions (+65)
Effect of acquisitions (+118)
In line with increase in the cost directly related to growth of our subscriber base. Effect of acquisitions (+38)
Increase due to effect of acquisitions (+42), and personnel cost
Effect of acquisitions (+20)
(Note) Acquisitions include Jupiter Visual Communications, Jupiter TV, former Kyoto Cable Communications, former Fukuoka Cable Network, a part of former Kobe Cablevision and Taito Cable TV
Capital Expenditure 12 months ended Dec. 31, 2008 12 months ended Dec. 31, 2007 Change
Amount%
Capital expenditures 470 463 6 1%
Capital lease expenditure 154 189 (35)(19%)
Total 624 653 (29)(4%)
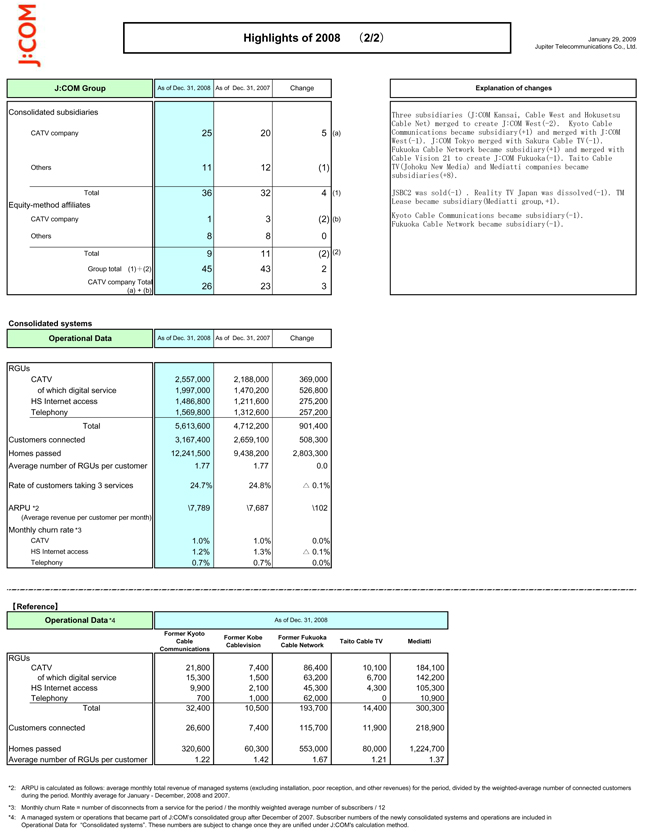
Highlights of 2008 (2/2) January 29, 2009
Jupiter Telecommunications Co., Ltd.
J:COM Group As of Dec. 31, 2008 As of Dec. 31, 2007 Change
Consolidated subsidiaries
CATV company 25 20 5 (a)
Others 11 12(1)
Total 36 32 4 (1)
Equity-method affiliates
CATV company 1 3 (2)(b)
Others 8 8 0
Total 9 11 (2)(2)
Group total (1) + (2) 45 43 2
CATV company Total (a) + (b) 26 23 3
Consolidated systems
Operational Data As of Dec. 31, 2008 As of Dec. 31, 2007 Change
RGUs
CATV 2,557,000 2,188,000 369,000
of which digital service 1,997,000 1,470,200 526,800
HS Internet access 1,486,800 1,211,600 275,200
Telephony 1,569,800 1,312,600 257,200
Total 5,613,600 4,712,200 901,400
Customers connected 3,167,400 2,659,100 508,300
Homes passed 12,241,500 9,438,200 2,803,300
Average number of RGUs per customer 1.77 1.77 0.0
Rate of customers taking 3 services 24.7% 24.8%D 0.1%
ARPU *2 \7,789 \7,687 \102
(Average revenue per customer per month)
Monthly churn rate *3
CATV 1.0% 1.0% 0.0%
HS Internet access 1.2% 1.3%D 0.1%
Telephony 0.7% 0.7% 0.0%
[Reference]
Operational Data *4 As of Dec. 31, 2008
Former Kyoto Cable Communications Former Kobe Cablevision Former Fukuoka Cable Network Taito Cable TV Mediatti
RGUs
CATV 21,800 7,400 86,400 10,100 184,100
of which digital service 15,300 1,500 63,200 6,700 142,200
HS Internet access 9,900 2,100 45,300 4,300 105,300
Telephony 700 1,000 62,000 0 10,900
Total 32,400 10,500 193,700 14,400 300,300
Customers connected 26,600 7,400 115,700 11,900 218,900
Homes passed 320,600 60,300 553,000 80,000 1,224,700
Average number of RGUs per customer 1.22 1.42 1.67 1.21 1.37
*2: ARPU is calculated as follows: average monthly total revenue of managed systems (excluding installation, poor reception, and other revenues) for the period, divided by the weighted-average number of connected customers during the period. Monthly average for January - December, 2008 and 2007.
*3: Monthly churn Rate = number of disconnects from a service for the period / the monthly weighted average number of subscribers / 12
*4: A managed system or operations that became part of J:COM’s consolidated group after December of 2007. Subscriber numbers of the newly consolidated systems and operations are included in Operational Data for “Consolidated systems”. These numbers are subject to change once they are unified under J:COM’s calculation method.
Explanation of changes
Three subsidiaries (J:COM Kansai, Cable West and Hokusetsu Cable Net) merged to create J:COM West(-2). Kyoto Cable Communications became subsidiary(+1) and merged with J:COM West(-1). J:COM Tokyo merged with Sakura Cable TV(-1). Fukuoka Cable Network became subsidiary(+1) and merged with Cable Vision 21 to create J:COM Fukuoka(-1). Taito Cable TV(Johoku New Media) and Mediatti companies became subsidiaries(+8).
JSBC2 was sold(-1) . Reality TV Japan was dissolved(-1). TM Lease became subsidiary(Mediatti group,-1).
Kyoto Cable Communications became subsidiary(-1).