As filed with the Securities and Exchange Commission on July 2, 2024
UNITED STATES
SECURITIES AND EXCHANGE COMMISSION
Washington, D.C. 20549
FORM N-CSR
CERTIFIED SHAREHOLDER REPORT OF
REGISTERED MANAGEMENT INVESTMENT COMPANIES
Investment Company Act file number: 811- 21715
NEUBERGER BERMAN ALTERNATIVE FUNDS
(Exact Name of Registrant as specified in charter)
c/o Neuberger Berman Investment Advisers LLC
1290 Avenue of the Americas
New York, New York 10104-0002
(Address of Principal Executive Offices – Zip Code)
Joseph V. Amato
Chief Executive Officer and President
Neuberger Berman Alternative Funds
c/o Neuberger Berman Investment Advisers LLC
1290 Avenue of the Americas
New York, New York 10104-0002
Lori L. Schneider, Esq.
K&L Gates LLP
1601 K Street, N.W.
Washington, D.C. 20006-1600
(Names and Addresses of agents for service)
Registrant’s telephone number, including area code: (212) 476-8800
Date of fiscal year end: October 31
Date of reporting period: April 30, 2024
Form N-CSR is to be used by management investment companies to file reports with the Commission not later than 10 days after the transmission to stockholders of any report that is required to be transmitted to stockholders under Rule 30e-1 under the Investment Company Act of 1940 (17 CFR 270.30e-1). The Commission may use the information provided on Form N-CSR in its regulatory, disclosure review, inspection, and policymaking roles.
A registrant is required to disclose the information specified by Form N-CSR, and the Commission will make this information public. A registrant is not required to respond to the collection of information contained in Form N-CSR unless the Form displays a currently valid Office of Management and Budget (“OMB”) control number. Please direct comments concerning the accuracy of the information collection burden estimate and any suggestions for reducing the burden to Secretary, Securities and Exchange Commission, 100 F Street, NE, Washington, DC 20549-1090. The OMB has reviewed this collection of information under the clearance requirements of 44 U.S.C. § 3507.
Item 1. Report to Shareholders.
| (a) | Following are copies of the semi-annual reports transmitted to shareholders pursuant to Rule 30e-1 under the Act. |
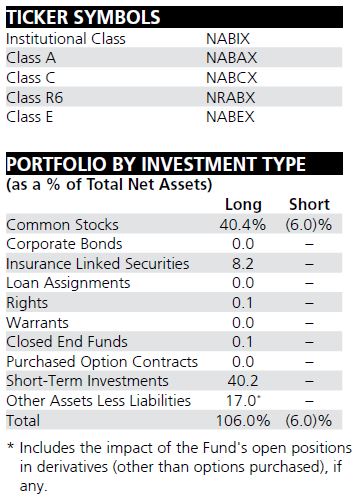
| Neuberger Berman Alternative Funds Institutional Class Shares Class A Shares Class C Shares Class R6 Shares Class E Shares
Absolute Return Multi-Manager Fund |
| Semi-Annual Report
April 30, 2024 |
The Securities and Exchange Commission has adopted new regulations that will result in changes to the design and delivery of annual and semi-annual reports beginning in July 2024.
Unless you have elected to receive shareholder reports and other communications from the Fund electronically, instead of by mail, paper copies of the Fund’s new, streamlined shareholder reports will be mailed to you beginning in July 2024. If you would like to receive shareholder reports and other communications from the Fund electronically instead of by mail, you may make that request at any time by contacting your financial intermediary or investment provider (such as an insurance company, broker-dealer or bank) or, if you are a direct investor, by logging into your account at https://www.nb.com/en/us/funds or calling 800.877.9700. If you are a direct investor and have previously elected to receive shareholder reports electronically, you will continue to receive reports electronically and need not take any action. |
| | Contents | |
| | | |
| | | 1 |
| | | 2 |
| | | 8 |
| | | 10 |
| | | 31 |
| | | 36 |
| | | 50 |
The “Neuberger Berman” name and logo and “Neuberger Berman Investment Advisers LLC” name are registered service marks of Neuberger Berman Group LLC. The individual Fund name in this piece is either a service mark or registered service mark of Neuberger Berman Investment Advisers LLC, an affiliate of Neuberger Berman BD LLC, distributor, member FINRA. ©2024 Neuberger Berman BD LLC, distributor. All rights reserved.
Dear Shareholder,
I am pleased to present this semi-annual shareholder report for Neuberger Berman Absolute Return Multi- Manager Fund covering the six-month period ended April 30, 2024 (the reporting period).
Global financial markets overcame several challenges and generated positive results over the reporting period. While inflation moderated, it remained “sticky” and led to changing expectations for monetary policy easing. Investor sentiment was also impacted by tighter credit conditions, wars in Ukraine and the Middle East, and numerous other geopolitical events. Despite these and other factors, the global economy was largely resilient, especially in the U.S. Against this backdrop, the stock and bond markets were volatile at times, but rallied during the reporting period.
When the reporting period began, there were hopes that inflation would continue easing and the U.S. Federal Reserve Board (Fed) would orchestrate a “soft landing” for the economy. There were also indications that the central bank would begin lowering interest rates in 2024. However, with inflation remaining above the Fed’s target, it held the federal funds rate at a range between 5.25%–5.50% throughout the period—the highest level since 2001. In addition, the central bank remained steadfast in its goal of reining in inflation, leading to expectations that rates would remain “higher for longer.”
Looking at the stock market, it moved higher over the first five months of the reporting period. Signs that the global economy would avert a recession, hopes for central bank easing, and overall solid corporate results propelled the market higher. A portion of those gains were then given back in April 2024, given the prospect for fewer rate cuts during the year. All told, the MSCI All Country World Index (Net) gained 19.77% over the reporting period. Meanwhile, the S&P 500® Index returned 20.98% and reached several new all-time highs prior to the April setback. Looking at the bond market, short- and long-term Treasury yields moved lower (yields and bond prices generally move in the opposite direction). For the reporting period, the broad taxable investment-grade bond market, as measured by the Bloomberg U.S. Aggregate Bond Index, returned 4.97%.
Market participants have adjusted their expectations for the number of interest rate cuts several times so far in 2024, indicative of the lack of clarity regarding the economic outlook. Continued conflict in the Middle East has driven oil prices higher and may serve to cause a further spike in inflation, while in the U.S., recent data points showing strong wage growth but weakening consumer confidence have left the economic picture unclear.
The Fund continues to diversify its portfolio among a variety of strategies, while seeking to position defensively and hoping to benefit from elevated volatility.
Thank you for your support and trust. We look forward to continuing to serve your investment needs in the years to come.
Sincerely,
Joseph V. Amato
President and CEO
Neuberger Berman Alternative Funds
Absolute Return Multi-Manager Fund
Commentary (Unaudited)
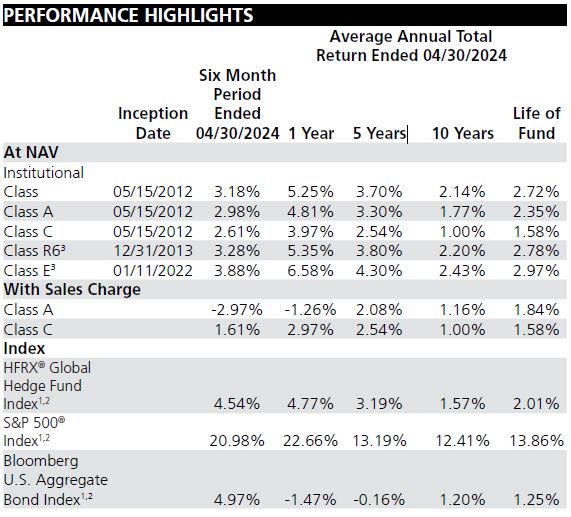
Neuberger Berman Absolute Return Multi-Manager Fund Institutional Class generated a 3.18% total return for the six-month period ended April 30, 2024 (the reporting period), underperforming its primary benchmark, the HFRX® Global Hedge Fund Index (the Index), which posted a 4.54% total return for the same period. (Performance for all share classes is provided in the table following this letter.)
The overall U.S. equity market, as measured by the S&P 500® Index, generated outstanding results during the reporting period. Several factors impacted the market, including a resilient U.S. economy, generally solid corporate profits, “sticky” inflation, changing investor sentiment regarding future U.S. Federal Reserve Board (Fed) monetary policy, and several geopolitical events. Despite periods of volatility, the S&P 500 Index returned 20.98% during the reporting period. Meanwhile, the overall U.S. taxable investment-grade bond market, as measured by the Bloomberg U.S. Aggregate Bond Index, returned 4.97% for the same period.
Gains from long/short equity, merger arbitrage/event driven and insurance linked strategies outpaced losses from global macro/managed futures strategies during the reporting period. From a risk management perspective, we were pleased that the Fund’s volatility and betas* (risk) relative to the S&P 500 and Bloomberg U.S. Aggregate Bond indices were all in line with our expectations.
The allocation to long/short equity strategies contributed to performance, as gains from longs outweighed losses from shorts. The merger arbitrage/event driven allocation contributed to performance, as several deals progressed and closed during the reporting period. The allocation to insurance linked was also a contributor, as catastrophe bonds generated income and prices rallied with no impairment to any bonds.
The allocation to global macro/managed futures strategies was a small detractor from performance during the reporting period, as losses from the managed futures strategy outweighed gains from the systematic currency strategy. Within the managed futures strategy, gains from commodities, cash and equities were outpaced by losses in currencies and interest rate positioning. Within the systematic currency strategy, positive performance was driven by cash holdings and a long position in the U.S. dollar versus several currencies, while there were small losses in interest rate positioning.
The Fund’s aggregate use of futures, forward foreign currency, swap and purchased and written option contracts detracted from performance during the reporting period.
Market expectations for rates cuts have varied significantly in recent months, highlighting the degree of uncertainty around the path for interest rates. While the Fed has pushed back on the market’s initial forecast of six cuts this year, there is still evidence that they would like to reduce rates when the data permits. However, with inflation data showing signs of stickiness, there remains limited consensus around the outlook in the short- term. Continued conflict in the Middle East and the Ukraine may keep pressure on energy prices, while at the same time, recent strength in jobs and wage data point to robustness within the domestic economy. That said, corporate default activity continues to pick up and companies now face the prospect of raising capital at higher interest rates, and consumer confidence remains fragile. Given this dynamic, we continue to seek to position the portfolio defensively and hope to benefit from more elevated volatility.
At the end of the reporting period, the Fund’s largest allocation was to merger arbitrage/event driven strategies. While M&A activity slowed over most of 2023, we have seen evidence of this picking up. We believe current deal volumes and relatively wide spreads offer ample opportunities to put capital to work with the potential for attractive returns. The Fund’s second largest allocation was to global macro/managed futures strategies. We believe that increases in market volatility may be beneficial for these strategies. The Fund’s third largest strategy allocation was to long/short equity. We continue to anticipate a high dispersion of winners and losers over the medium term, driven by a number of factors, including inflation, increasing costs of capital, currency effects, and varying levels of economic sensitivity. Lastly, the Fund’s smallest position was an opportunistic allocation to catastrophe bonds. They benefited from strong supply/demand dynamics in the catastrophe bond and reinsurance markets, offering attractive yields in our view.
Sincerely,
David Kupperman, Jeff Majit and Fred Ingham
Portfolio Managers
*
| Beta is a measure of the systematic risk of a portfolio. It is the covariance of the portfolio and a market index divided by the variance of the market index. Beta measures the historical sensitivity of a portfolio’s returns to movements in the market index. The beta of the market index will always be one. A portfolio with a beta above the market index (i.e., >1) means that the portfolio has greater volatility than the market index. If the beta of the portfolio is 1.2, a market increase in return of 1% implies a 1.2% increase in the portfolio’s return. If the beta of the portfolio is 0.8, a market decrease in return of 1% implies a 0.8% decrease in the portfolio’s return. |
Information about principal risks of investing in the Fund is set forth in the prospectus and statement of additional information.
The portfolio composition, industries and holdings of the Fund are subject to change without notice.
The opinions expressed are those of the Fund’s portfolio managers and subadvisers. The opinions are as of the date of this report and are subject to change without notice.
Absolute Return Multi-Manager Fund (Unaudited)
 | | |
| | |
The performance data quoted represent past performance and do not indicate future results. Current performance may be lower or higher than the performance data quoted. For current performance data, including current to the most recent month-end, please visit www.nb.com/performance.
The results shown in the table reflect the reinvestment of income dividends and other distributions, if any. The results do not reflect the effect of taxes a shareholder would pay on Fund distributions or on the redemption of Fund shares.
The investment return and principal value of an investment will fluctuate and shares, when redeemed, may be worth more or less than their original cost.
Returns would have been lower if Neuberger Berman Investment Advisers LLC (“NBIA”) had not reimbursed certain expenses and/or waived a portion of the investment management fees during certain of the periods shown. Repayment by a class (of expenses previously reimbursed and/or fees previously waived by NBIA) will decrease the class’s returns. Please see Note B in the Notes to Consolidated Financial Statements for specific information regarding expense reimbursement and/or fee waiver arrangements.
As stated in the Fund’s most recent prospectus, the total annual operating expense ratios for fiscal year 2023 were 2.52%, 2.88%, 3.66%, 2.71% and 2.38% for Institutional Class, Class A, Class C, Class R6 and Class E shares, respectively (before expense reimbursements and/or fee waivers, if any). The expense ratios were 2.04%, 2.40%, 3.15%, 2.26% and 0.68% for Institutional Class, Class A, Class C, Class R6 and Class E shares, respectively, after expense reimbursements and/or fee waivers. The expense ratios for the semi-annual period ended April 30, 2024, can be found in the Consolidated Financial Highlights section of this report.
Returns shown with a sales charge reflect the deduction of the current maximum initial sales charge of 5.75% for Class A shares and the contingent deferred sales charge (CDSC) for Class C shares. The CDSC for Class C shares is 1.00%, which is reduced to 0% after 1 year. The performance of the Fund’s share classes will differ primarily due to different sales charge structures and class expenses. Please see the prospectus for more information about sales charge structures, if any, and class expenses for your share class.
1
| Please see “Glossary of Indices” on page 6 for a description of indices. Please note that individuals cannot invest directly in any index. The S&P 500® and the Bloomberg U.S. Aggregate Bond Indices do not take into account any fees, expenses or tax consequences of investing in the individual securities that they track. The HFRX® Global Hedge Fund Index does take into account fees and expenses, but not tax consequences, of investing since it is based on the underlying hedge funds’ net returns. Data about the performance of an index are prepared or obtained by NBIA and reflect the reinvestment of income dividends and other distributions, if any. The Fund may invest in securities not included in a described index and generally does not invest in all securities included in a described index. |
2
| The date used to calculate Life of Fund performance for the index is the inception date of the oldest share class. |
3
| The performance information for Class R6 and Class E prior to the classes’ respective inception dates is that of the Institutional Class of Neuberger Berman Absolute Return Multi-Manager Fund. The performance information for the Institutional Class has not been adjusted to take into account differences in class specific operating expenses. The Institutional Class has higher expenses and typically lower returns than Class R6 and Class E. |
For more complete information on any of the Neuberger Berman Alternative Funds, call us at (800) 877-9700, or visit our website at www.nb.com.
Glossary of Indices (Unaudited)
| Bloomberg U.S. Aggregate Bond Index: | The index measures the investment grade, U.S. dollar-denominated, fixed-rate, taxable bond market and includes Treasuries, government-related and corporate securities, mortgage-backed securities (MBS) (agency fixed-rate and hybrid adjustable rate mortgage (ARM) pass-throughs), asset-backed securities (ABS), and commercial mortgage-backed securities (CMBS) (agency and nonagency). Effective August 24, 2021 all Bloomberg Barclays fixed income indices were rebranded as “Bloomberg indices”. |
| | |
HFRX® Global Hedge Fund Index:
| The index is designed to be representative of the overall composition of the hedge fund universe. It is comprised of all eligible hedge fund strategies; including but not limited to convertible arbitrage, distressed securities, equity hedge, equity market neutral, event driven, macro, merger arbitrage, and relative value arbitrage. The strategies are asset weighted based on the distribution of assets in the hedge fund industry. Constituent funds are selected from an eligible pool of the more than 7,500 funds worldwide that report to the Hedge Fund Research (HFR) Database. Constituent funds must meet all of the following criteria: report monthly; report performance net of all fees; be U.S. dollar denominated; be active and accepting new investments; have a minimum 24 month track record; and the fund’s manager must have at least $50 million in assets under management. The index is rebalanced quarterly. |
| | |
| S&P 500® Index: | The index is a float-adjusted, market capitalization-weighted index that focuses on the large-cap segment of the U.S. equity market, and includes a significant portion of the total value of the market. |
(This page intentionally left blank)
Information About Your
Fund’s Expenses (Unaudited)
As a Fund shareholder, you incur two types of costs: (1) transaction costs, including sales charges (loads) on purchase payments or redemption proceeds (if applicable); and (2) ongoing costs, including management fees, distribution and/or service (12b-1) fees (if applicable), and other Fund expenses. This example is intended to help you understand your ongoing costs (in U.S. dollars) of investing in the Fund and compare these costs with the ongoing costs of investing in other mutual funds.
This table is designed to provide information regarding costs related to your investments. The following examples are based on an investment of $1,000 made at the beginning of the six month period ended April 30, 2024 and held for the entire period. The table illustrates the Fund’s costs in two ways:
Actual Expenses and Performance: | The first section of the table provides information about actual account values and actual expenses in dollars, based on the Fund’s actual performance during the period indicated. You may use the information in this line, together with the amount you invested, to estimate the expenses you paid over the period. Simply divide your account value by $1,000 (for example, an $8,600 account value divided by $1,000 = 8.6), then multiply the result by the number in the first section of the table under the heading entitled “Expenses Paid During the Period” to estimate the expenses you paid over the period. |
| | |
Hypothetical Example for Comparison Purposes:
| The second section of the table provides information about hypothetical account values and hypothetical expenses based on the Fund’s actual expense ratio and an assumed rate of return at 5% per year before expenses. This return is not the Fund’s actual return. The hypothetical account values and expenses may not be used to estimate the actual ending account balance or expenses you paid for the period. You may use this information to compare the ongoing costs of investing in the Fund versus other funds. To do so, compare the expenses shown in this 5% hypothetical example with the 5% hypothetical examples that appear in the shareholder reports of other funds. |
Please note that the expenses in the table are meant to highlight your ongoing costs only and do not include any transaction costs, such as sales charges (loads) (if applicable). Therefore, the information under the heading “Hypothetical (5% annual return before expenses)” is useful in comparing ongoing costs only, and will not help you determine the relative total costs of owning different funds. In addition, if these transaction costs were included, your costs would have been higher.
Expense Example (Unaudited)
Neuberger Berman Alternative Funds
| | | ACTUAL HYPOTHETICAL (5% ANNUAL RETURN BEFORE EXPENSES) | |
| | | | Expenses Paid | | | | Expenses Paid | |
| | Beginning | Ending | During the | | Beginning | Ending | During the | |
| Absolute Return | Account | Account | Period | | Account | Account | Period | |
| Multi-Manager | Value | Value | 11/1/2023 - | Expense | Value | Value | 11/1/2023 - | Expense
|
| Fund | 11/1/2023 | 4/30/2024 | 4/30/2024(1)(3) | Ratio | 11/1/2023 | 4/30/2024 | 4/30/2024(2)(3) | Ratio
|
| Institutional Class | $1,000.00 | $1,031.80 | $9.14 | 1.81% | $1,000.00 | $1,015.86 | $9.07 | 1.81% |
| Class A | $1,000.00 | $1,029.80 | $10.75 | 2.13% | $1,000.00 | $1,014.27 | $10.67 | 2.13% |
| Class C | $1,000.00 | $1,026.10 | $14.51 | 2.88% | $1,000.00 | $1,010.54 | $14.40 | 2.88% |
| Class R6 | $1,000.00 | $1,032.80 | $8.44 | 1.67% | $1,000.00 | $1,016.56 | $8.37 | 1.67% |
| Class E | $1,000.00 | $1,038.80 | $2.43 | 0.48% | $1,000.00 | $1,022.48 | $2.41 | 0.48% |
| (1) | For each class, expenses are equal to the annualized expense ratio for the class, multiplied by the average account value over the period, multiplied by 182/366 (to reflect the one-half year period shown), unless otherwise indicated. |
| (2) | Hypothetical expenses are equal to the annualized expense ratios for each class, multiplied by the average account value over the period (assuming a 5% annual return), multiplied by 182/366 (to reflect the one-half year period shown). |
| (3) | Includes expenses of the Fund's subsidiary (See Note A of the Notes to Consolidated Financial Statements). |
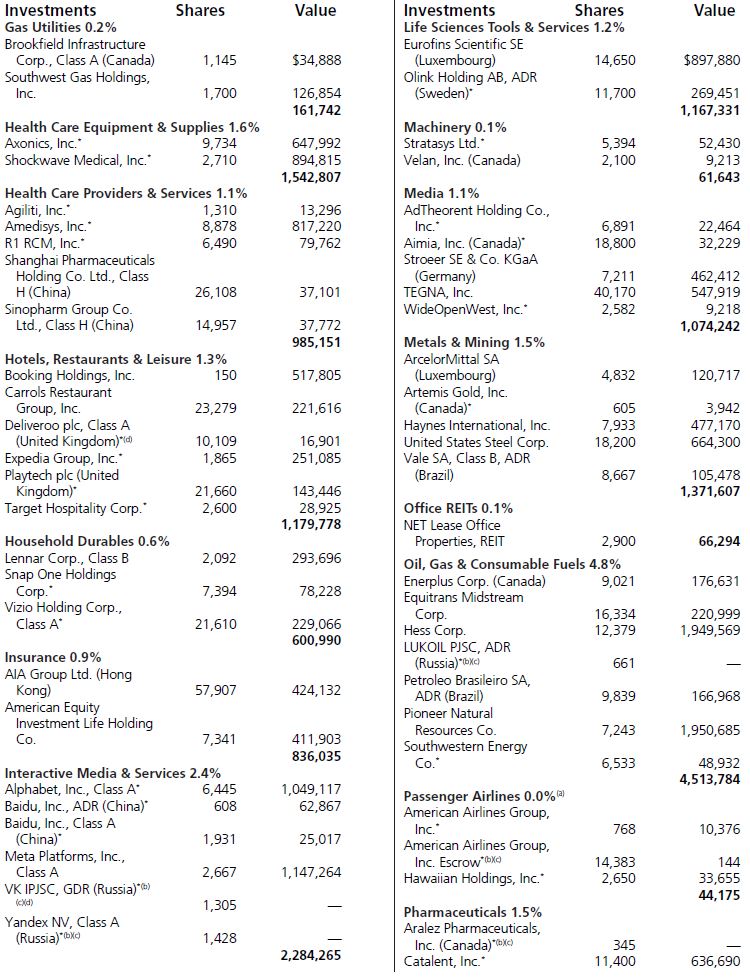
Consolidated Schedule of Investments Absolute Return Multi-Manager Fund^ (Unaudited) April 30, 2024
See Notes to Consolidated Financial Statements
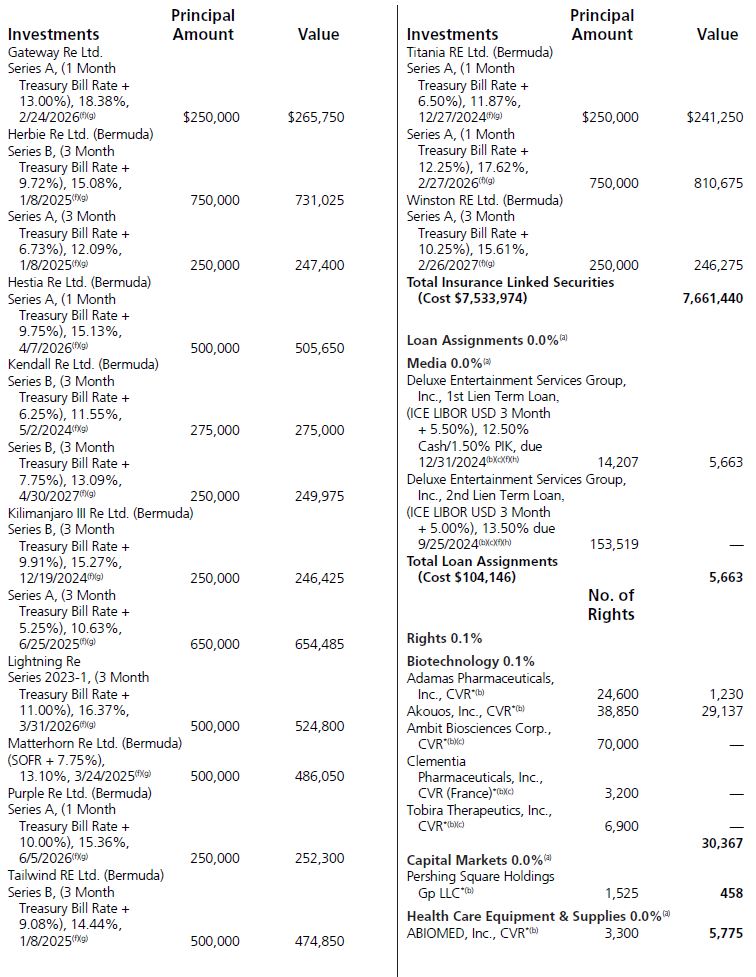
Consolidated Schedule of Investments Absolute Return Multi-Manager Fund^ (Unaudited) (cont'd)
See Notes to Consolidated Financial Statements
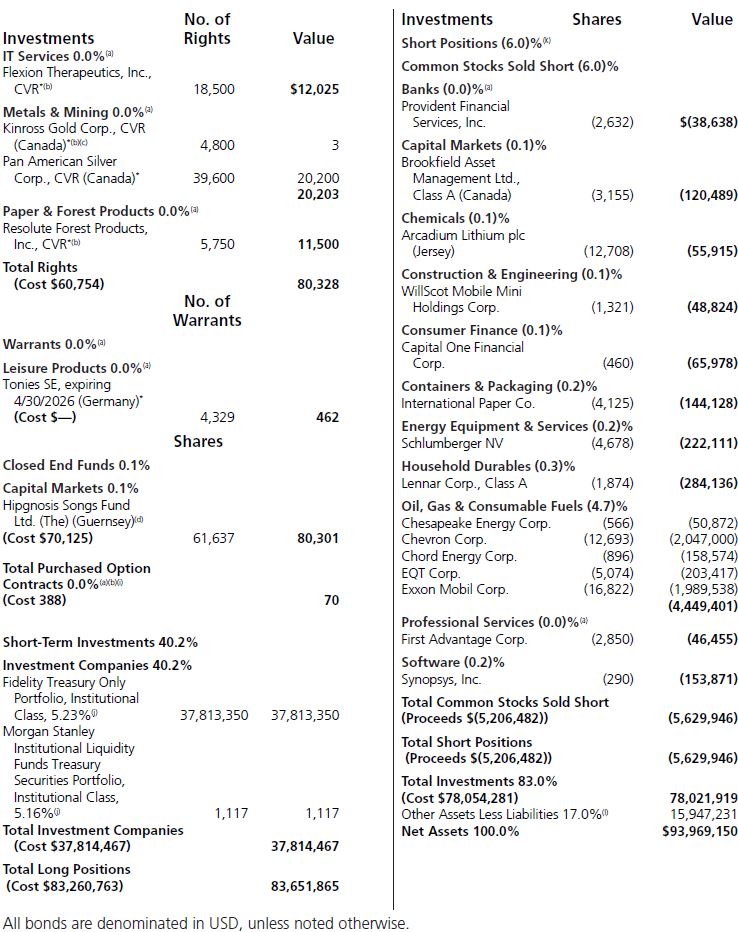
Consolidated Schedule of Investments Absolute Return Multi-Manager Fund^ (Unaudited) (cont'd)
See Notes to Consolidated Financial Statements
Consolidated Schedule of Investments Absolute Return Multi-Manager Fund^ (Unaudited) (cont'd)
See Notes to Consolidated Financial Statements
Consolidated Schedule of Investments Absolute Return Multi-Manager Fund^ (Unaudited) (cont'd)
See Notes to Consolidated Financial Statements
Consolidated Schedule of Investments Absolute Return Multi-Manager Fund^ (Unaudited) (cont’d)
*
| Non-income producing security. |
(a)
| Represents less than 0.05% of net assets of the Fund. |
(b)
| Value determined using significant unobservable inputs. |
(c)
| Security fair valued as of April 30, 2024, in accordance with procedures approved by the valuation designee. Total value of all such securities at April 30, 2024, amounted to $5,880, which represents 0.0% of net assets of the Fund. |
(d)
| Security exempt from registration pursuant to Regulation S under the Securities Act of 1933, as amended. Regulation S applies to securities offerings that are made outside of the United States and do not involve directed selling efforts in the United States and as such may have restrictions on resale. At April 30, 2024, these securities amounted to $492,116 of long positions which represents 0.5% of net assets of the Fund. |
(e)
| Defaulted security. |
(f)
| Variable or floating rate security. The interest rate shown was the current rate as of April 30, 2024, and changes periodically. |
(g)
| Securities were purchased or sold short under Rule 144A of the Securities Act of 1933, as amended, or are otherwise restricted and, unless registered under the Securities Act of 1933 or exempted from registration, may only be sold to qualified institutional investors or may have other restrictions on resale. At April 30, 2024, these securities amounted to $7,661,440 of long positions, which represents 8.2% of net assets of the Fund. |
(h)
| Payment-in-kind (PIK) security. |
(i)
| See "Purchased option contracts" under Derivative Instruments. |
(j)
| Represents 7-day effective yield as of April 30, 2024. |
(k)
| At April 30, 2024, the Fund had approximately $5,626,126 deposited in one or more accounts to satisfy collateral requirements for borrowing in connection with securities sold short. |
(l)
| Includes the impact of the Fund’s open positions in derivatives at April 30, 2024. |
Abbreviations
ADR
| American Depositary Receipt |
CVR
| Contingent Value Rights |
GDR
| Global Depositary Receipt |
ICE
| Intercontinental Exchange |
IPJSC
| International Public Joint Stock Company |
LIBOR
| London Interbank Offered Rate |
SA
| Société Anonyme |
SOFR
| Secured Overnight Financing Rate |
USD
| United States Dollar |
See Notes to Consolidated Financial Statements
Consolidated Schedule of Investments Absolute Return Multi-Manager Fund^ (Unaudited) (cont’d)
| LONG POSITIONS BY COUNTRY | | |
Country | Investments at
Value
| Percentage of Net Assets
|
| United States | $29,681,125 | 31.5% |
| Bermuda | 6,170,610 | 6.5% |
| China | 2,106,404 | 2.2% |
| Germany | 1,470,813 | 1.6% |
| Luxembourg | 1,018,597 | 1.0% |
| Brazil | 870,709 | 0.9% |
| Canada | 821,734 | 0.9% |
| Ireland | 700,280 | 0.7% |
| Netherlands | 486,925 | 0.5% |
| South Korea | 451,891 | 0.5% |
| Hong Kong | 424,132 | 0.5% |
| Switzerland | 403,295 | 0.4% |
| Sweden | 269,451 | 0.3% |
| United Kingdom | 164,881 | 0.2% |
| Taiwan | 163,268 | 0.2% |
| Mexico | 153,860 | 0.2% |
| Jordan | 149,058 | 0.2% |
| Guernsey | 80,301 | 0.1% |
| Jersey | 70,325 | 0.1% |
| Guatemala | 62,434 | 0.1% |
| Israel | 61,640 | 0.1% |
| Singapore | 49,325 | 0.1% |
| Spain | 6,340 | 0.0%(a) |
| Short-Term Investments and Other Assets-Net | 53,761,698 | 57.2% |
| Short Positions (See summary below) | (5,629,946) | (6.0)% |
| | $93,969,150 | 100.0%
|
| SHORT POSITIONS BY COUNTRY | | |
Country | | Percentage of
Net Assets
|
| United States | $(5,453,542) | (5.8)% |
| Canada | (120,489) | (0.1)% |
| Jersey | (55,915) | (0.1)% |
| Total Short Positions | $(5,629,946) | (6.0)% |
(a) Represents less than 0.05% of net assets of the Fund.
See Notes to Consolidated Financial Statements
Consolidated Schedule of Investments Absolute Return Multi-Manager Fund^ (Unaudited) (cont’d)
Derivative Instruments
Futures contracts ("futures")
At April 30, 2024, open positions in futures for the Fund were as follows:
Description | Number of Contracts | Expiration
Date | Notional
Amount
| Value and Unrealized Appreciation/ (Depreciation) |
| Long Contracts |
| Brent Crude Oil | 6 | 5/2024 | $517,980 | $(4,419) |
| CAC 40 10 Euro Index | 2 | 5/2024 | 169,802 | (2,110) |
| HSCEI | 1 | 5/2024 | 40,204 | 1,116 |
| IFSC NIFTY 50 Index | 2 | 5/2024 | 91,000 | 856 |
| MSCI Singapore Index | 5 | 5/2024 | 111,022 | 307 |
| OMXS30 Index | 4 | 5/2024 | 92,519 | 2,497 |
| RBOB Gasoline | 3 | 5/2024 | 339,091 | (3,118) |
| SGX FTSE China A50 Index | 2 | 5/2024 | 25,118 | 583 |
| SGX FTSE Taiwan Index | 2 | 5/2024 | 137,180 | 1,768 |
| WTI Crude Oil | 7 | 5/2024 | 573,510 | (9,374) |
| 100 oz Gold | 4 | 6/2024 | 921,160 | (8,878) |
| Australia 10 Year Bond | 1 | 6/2024 | 72,897 | (2,615) |
| Australia 3 Year Bond | 3 | 6/2024 | 205,057 | (2,459) |
| Brent Crude Oil | 3 | 6/2024 | 256,830 | (704) |
| EURO STOXX 50 Index | 3 | 6/2024 | 156,782 | (1,940) |
| Euro-BTP | 1 | 6/2024 | 124,852 | (598) |
| Euro-Bund | 1 | 6/2024 | 138,821 | (2,210) |
| Euro-OAT | 3 | 6/2024 | 401,705 | (6,076) |
| Foreign Exchange MXN/USD | 6 | 6/2024 | 173,970 | (4,434) |
| Foreign Exchange USD/NOK | 1 | 6/2024 | 99,713 | 5,286 |
| Foreign Exchange ZAR/USD | 1 | 6/2024 | 26,475 | (2) |
| FTSE 100 Index | 3 | 6/2024 | 305,834 | 3,568 |
| FTSE/JSE Top 40 Index | 1 | 6/2024 | 37,716 | 119 |
| Lean Hogs | 6 | 6/2024 | 245,940 | (2,146) |
| MSCI Emerging Markets E-Mini Index | 2 | 6/2024 | 104,200 | (434) |
| Nikkei 225 Index | 7 | 6/2024 | 170,745 | 2,304 |
| S&P 500 E-Mini Index | 1 | 6/2024 | 253,350 | (1,789) |
| SPI 200 Index | 1 | 6/2024 | 124,459 | 619 |
| TOPIX Index | 1 | 6/2024 | 174,175 | 3,741 |
| Brent Crude Oil | 3 | 7/2024 | 254,730 | (5,354) |
| Cocoa | 1 | 7/2024 | 92,830 | (2,083) |
| Coffee 'C' | 4 | 7/2024 | 324,975 | 5,164 |
| Copper | 3 | 7/2024 | 342,338 | 12,707 |
| FCOJ-A | 1 | 7/2024 | 54,532 | (790) |
| Rapeseed | 1 | 7/2024 | 24,452 | (40) |
See Notes to Consolidated Financial Statements
Consolidated Schedule of Investments Absolute Return Multi-Manager Fund^ (Unaudited) (cont’d)
Description | Number of Contracts | Expiration Date | Notional
Amount
| Value and
Unrealized Appreciation/ (Depreciation) |
| Robusta Coffee | 5 | 7/2024 | $201,050 | $8,619 |
| Silver | 1 | 7/2024 | 133,270 | (9,757) |
| WTI Crude Oil | 1 | 11/2024 | 77,950 | 378 |
| Total Long Contracts | | | $7,598,234 | $(21,698) |
| | | | | |
Description
| Number of Contracts | Expiration Date | Notional
Amount
| Value and
Unrealized
Appreciation/
(Depreciation)
|
| Short Contracts | | | | |
| Natural Gas | (10) | 5/2024 | $(199,100) | $130 |
| Canada 10 Year Bond | (6) | 6/2024 | (509,890) | 6,834 |
| CBOE Volatility Index | (7) | 6/2024 | (111,664) | (1,629) |
| Euro-Bobl | (21) | 6/2024 | (2,609,336) | 4,160 |
| Euro-BTP | (2) | 6/2024 | (249,703) | (849) |
| Euro-Bund | (2) | 6/2024 | (277,643) | 551 |
| Euro-OAT | (1) | 6/2024 | (133,902) | (753) |
| Euro-Schatz | (41) | 6/2024 | (4,599,109) | 22,371 |
| Foreign Exchange AUD/USD | (112) | 6/2024 | (7,271,040) | 151,202 |
| Foreign Exchange CAD/USD | (4) | 6/2024 | (290,900) | 6,041 |
| Foreign Exchange CHF/USD | (18) | 6/2024 | (2,461,050) | 106,981 |
| Foreign Exchange EUR/USD | (68) | 6/2024 | (9,093,725) | 224,804 |
| Foreign Exchange GBP/USD | (5) | 6/2024 | (390,844) | 9,192 |
| Foreign Exchange JPY/USD | (19) | 6/2024 | (1,517,269) | 104,290 |
| Foreign Exchange NZD/USD | (4) | 6/2024 | (235,900) | 6,673 |
| Japan 10 Year Bond | (1) | 6/2024 | (916,210) | 1,133 |
| Palladium | (1) | 6/2024 | (95,280) | 5,617 |
| S&P 500 E-Mini Index | (7) | 6/2024 | (1,773,450) | 60,828 |
| Short-Term Euro-BTP | (5) | 6/2024 | (561,667) | 80 |
| Sugar No. 11 | (7) | 6/2024 | (152,174) | 6,948 |
| U.S. Treasury 2 Year Note | (14) | 6/2024 | (2,837,188) | 20,952 |
| U.S. Treasury 5 Year Note | (24) | 6/2024 | (2,513,813) | 22,636 |
| U.S. Treasury 10 Year Note | (30) | 6/2024 | (3,223,125) | 53,240 |
| U.S. Treasury Long Bond | (2) | 6/2024 | (227,625) | 4,216 |
| U.S. Treasury Ultra Bond | (1) | 6/2024 | (119,563) | 1,092 |
| Canola | (13) | 7/2024 | (116,718) | 3,587 |
| Corn | (21) | 7/2024 | (469,087) | 3,685 |
| Cotton No. 2 | (4) | 7/2024 | (156,860) | 5,389 |
| Soybean | (9) | 7/2024 | (523,350) | 12,915 |
| Soybean Meal | (8) | 7/2024 | (281,520) | (12,010) |
| Soybean Oil | (10) | 7/2024 | (258,060) | 23,489 |
| Wheat | (7) | 7/2024 | (211,138) | (9,405) |
| 3 Month CORRA | (20) | 9/2024 | (3,457,487) | 104 |
See Notes to Consolidated Financial Statements
Consolidated Schedule of Investments Absolute Return Multi-Manager Fund^ (Unaudited) (cont’d)
Description
| Number of Contracts | Expiration Date | Notional
Amount
| Value and
Unrealized Appreciation/ (Depreciation) |
| 3 Month EURIBOR | (26) | 9/2024 | $(6,693,665) | $9,073 |
| 3 Month CORRA | (10) | 12/2024 | (1,732,103) | 643 |
| 3 Month EURIBOR | (14) | 12/2024 | (3,611,191) | 7,201 |
| 3 Month SOFR | (25) | 12/2024 | (5,924,688) | 14,597 |
| 3 Month SONIA | (12) | 12/2024 | (3,563,654) | 2,278 |
| 3 Month CORRA | (8) | 3/2025 | (1,387,934) | 1,148 |
| 3 Month EURIBOR | (12) | 3/2025 | (3,100,269) | 5,202 |
| 3 Month SOFR | (18) | 3/2025 | (4,272,300) | 13,937 |
| 3 Month SONIA | (7) | 3/2025 | (2,082,078) | 900 |
| 3 Month CORRA | (7) | 6/2025 | (1,216,095) | 965 |
| 3 Month EURIBOR | (12) | 6/2025 | (3,104,592) | 4,126 |
| 3 Month SOFR | (16) | 6/2025 | (3,804,400) | 17,191 |
| 3 Month SONIA | (7) | 6/2025 | (2,085,030) | 1,449 |
| 3 Month CORRA | (3) | 9/2025 | (521,865) | 589 |
| 3 Month EURIBOR | (14) | 9/2025 | (3,626,132) | 6,222 |
| 3 Month SOFR | (15) | 9/2025 | (3,573,000) | 13,431 |
| 3 Month SONIA | (8) | 9/2025 | (2,386,141) | 1,946 |
| 3 Month EURIBOR | (8) | 12/2025 | (2,074,103) | 3,515 |
| 3 Month SOFR | (13) | 12/2025 | (3,101,963) | 14,710 |
| 3 Month SONIA | (7) | 12/2025 | (2,090,497) | 1,775 |
| 3 Month EURIBOR | (6) | 3/2026 | (1,556,618) | 2,420 |
| 3 Month SOFR | (13) | 3/2026 | (3,106,025) | 11,399 |
| 3 Month SONIA | (3) | 3/2026 | (897,005) | 1,341 |
| 3 Month EURIBOR | (6) | 6/2026 | (1,557,418) | 1,927 |
| 3 Month SOFR | (13) | 6/2026 | (3,109,113) | 11,272 |
| 3 Month SONIA | (3) | 6/2026 | (897,849) | 1,702 |
| 3 Month EURIBOR | (6) | 9/2026 | (1,558,139) | 1,395 |
| 3 Month SOFR | (11) | 9/2026 | (2,632,575) | 6,352 |
| 3 Month SONIA | (3) | 9/2026 | (898,598) | 1,281 |
| 3 Month SOFR | (11) | 12/2026 | (2,633,950) | 5,239 |
| 3 Month SONIA | (3) | 12/2026 | (899,207) | 1,296 |
| 3 Month SOFR | (6) | 12/2027 | (1,438,275) | 2,050 |
| Total Short Contracts | | | $(128,981,862) | $1,013,066 |
| Total Futures | | | | $991,368 |
| | | | | |
| For the six months ended April 30, 2024, the average notional value for the months where the Fund had futures outstanding was $58,412,907 for long positions and $(84,131,363) for short positions. At April 30, 2024, the Fund had $1,694,096 deposited in segregated accounts to cover margin requirements on open futures. |
See Notes to Consolidated Financial Statements
Consolidated Schedule of Investments Absolute Return Multi-Manager Fund^ (Unaudited) (cont’d)
Forward foreign currency contracts ("forward contracts")
At April 30, 2024, open forward contracts for the Fund were as follows:
Currency Purchased
| Currency Sold | Counterparty | Settlement Date | Net Unrealized Appreciation/ (Depreciation) |
| GBP | 129,644 | USD | 161,570 | JPM | 5/17/2024 | $439 |
| AUD | 6,580,000 | JPY | 639,287,766 | SG | 6/20/2024 | 184,416 |
| AUD | 60,000 | USD | 38,896 | SG | 6/20/2024 | 30 |
| BRL** | 170,000 | USD | 32,079 | SG | 6/20/2024 | 503 |
| CAD | 10,000 | USD | 7,237 | SG | 6/20/2024 | 33 |
| CZK | 12,920,000 | USD | 547,502 | SG | 6/20/2024 | 798 |
| EUR | 1,211,669 | PLN | 5,230,000 | SG | 6/20/2024 | 7,233 |
| GBP | 30,000 | USD | 37,343 | SG | 6/20/2024 | 154 |
| HUF | 10,520,000 | USD | 28,511 | SG | 6/20/2024 | 100 |
| ILS | 160,000 | USD | 42,758 | SG | 6/20/2024 | 99 |
| INR** | 73,400,000 | USD | 877,558 | SG | 6/20/2024 | 62 |
| JPY | 100,052,334 | AUD | 980,000 | SG | 6/20/2024 | 3,453 |
| JPY | 5,160,000 | USD | 32,873 | SG | 6/20/2024 | 95 |
| KRW** | 72,830,000 | USD | 52,242 | SG | 6/20/2024 | 434 |
| MXN | 4,270,000 | USD | 246,749 | SG | 6/20/2024 | 536 |
| PHP** | 3,060,000 | USD | 52,709 | SG | 6/20/2024 | 213 |
| PLN | 60,000 | EUR | 13,813 | SG | 6/20/2024 | 11 |
| PLN | 10,000 | USD | 2,460 | SG | 6/20/2024 | 4 |
| THB | 1,110,000 | USD | 30,000 | SG | 6/20/2024 | 71 |
| TRY | 52,494,397 | EUR | 1,410,000 | SG | 6/20/2024 | 31,550 |
| TRY | 45,600,000 | USD | 1,317,706 | SG | 6/20/2024 | 19,541 |
| USD | 2,979,771 | AUD | 4,550,000 | SG | 6/20/2024 | 27,876 |
| USD | 1,466,678 | BRL** | 7,460,000 | SG | 6/20/2024 | 36,896 |
| USD | 7,418,630 | CAD | 10,070,000 | SG | 6/20/2024 | 97,734 |
| USD | 4,234,937 | CHF | 3,730,000 | SG | 6/20/2024 | 154,342 |
| USD | 3,121,443 | CZK | 72,480,000 | SG | 6/20/2024 | 45,536 |
| USD | 3,778,688 | EUR | 3,480,000 | SG | 6/20/2024 | 57,103 |
| USD | 3,241,259 | GBP | 2,570,000 | SG | 6/20/2024 | 29,070 |
| USD | 276,061 | HUF | 100,610,000 | SG | 6/20/2024 | 2,436 |
| USD | 1,262,049 | ILS | 4,610,000 | SG | 6/20/2024 | 27,230 |
| USD | 7,645,812 | INR** | 638,630,000 | SG | 6/20/2024 | 9,904 |
| USD | 3,970,985 | JPY | 585,300,000 | SG | 6/20/2024 | 231,437 |
| USD | 2,526,149 | KRW** | 3,385,530,000 | SG | 6/20/2024 | 77,471 |
See Notes to Consolidated Financial Statements
Consolidated Schedule of Investments Absolute Return Multi-Manager Fund^ (Unaudited) (cont’d)
Currency Purchased | Currency Sold | Counterparty | Settlement Date | Net Unrealized Appreciation/ (Depreciation)
|
| |
|
| | | | |
| USD | 2,401,905 | MXN | 40,530,000 | SG | 6/20/2024 | $54,730 |
| USD | 2,345,896 | NOK | 25,090,000 | SG | 6/20/2024 | 84,393 |
| USD | 2,369,068 | NZD | 3,930,000 | SG | 6/20/2024 | 53,324 |
| USD | 2,862,318 | PHP** | 162,000,000 | SG | 6/20/2024 | 60,533 |
| USD | 2,574,139 | PLN | 10,270,000 | SG | 6/20/2024 | 43,852 |
| USD | 2,312,961 | SEK | 24,480,000 | SG | 6/20/2024 | 86,576 |
| USD | 4,786,817 | SGD | 6,420,000 | SG | 6/20/2024 | 72,654 |
| USD | 2,019,723 | THB | 72,540,000 | SG | 6/20/2024 | 54,598 |
| USD | 61,664 | ZAR | 1,160,000 | SG | 6/20/2024 | 280 |
| ZAR | 7,660,000 | USD | 401,987 | SG | 6/20/2024 | 3,361 |
| CLP** | 279,870,000 | USD | 287,451 | SG | 6/21/2024 | 3,926 |
| USD | 85,884 | CLP** | 81,720,000 | SG | 6/21/2024 | 805 |
| USD | 213,302 | CAD | 289,263 | JPM | 6/28/2024 | 2,979 |
| USD | 125,099 | GBP | 98,990 | JPM | 6/28/2024 | 1,369 |
| Total unrealized appreciation | | | | | $1,570,190 |
| | | | | | |
Currency Purchased | Currency Sold | Counterparty | Settlement Date | Net Unrealized Appreciation/ (Depreciation) |
| |
| | | | | |
| USD | 4,283,448 | EUR | 4,020,725 | JPM | 5/17/2024 | $(10,075) |
| AUD | 80,000 | JPY | 8,139,922 | SG | 6/20/2024 | (105) |
| AUD | 4,810,000 | USD | 3,168,304 | SG | 6/20/2024 | (47,730) |
| BRL** | 7,620,000 | USD | 1,499,323 | SG | 6/20/2024 | (38,872) |
| CAD | 7,530,000 | USD | 5,566,560 | SG | 6/20/2024 | (92,242) |
| CHF | 2,200,000 | USD | 2,476,328 | SG | 6/20/2024 | (69,543) |
| CZK | 50,290,000 | USD | 2,166,100 | SG | 6/20/2024 | (31,889) |
| EUR | 592,622 | PLN | 2,580,000 | SG | 6/20/2024 | (1,888) |
| EUR | 1,100,000 | TRY | 43,201,379 | SG | 6/20/2024 | (90,545) |
| EUR | 3,150,000 | USD | 3,439,347 | SG | 6/20/2024 | (70,678) |
| GBP | 2,720,000 | USD | 3,479,130 | SG | 6/20/2024 | (79,468) |
| HUF | 247,340,000 | USD | 679,615 | SG | 6/20/2024 | (6,933) |
| ILS | 4,850,000 | USD | 1,342,928 | SG | 6/20/2024 | (43,825) |
| INR** | 633,860,000 | USD | 7,609,005 | SG | 6/20/2024 | (30,130) |
| JPY | 375,736,641 | AUD | 3,830,000 | SG | 6/20/2024 | (84,159) |
| JPY | 298,370,000 | USD | 1,982,283 | SG | 6/20/2024 | (75,964) |
| KRW** | 1,779,880,000 | USD | 1,331,131 | SG | 6/20/2024 | (43,785) |
See Notes to Consolidated Financial Statements
Consolidated Schedule of Investments Absolute Return Multi-Manager Fund^ (Unaudited) (cont’d)
Currency Purchased
| Currency Sold | Counterparty | Settlement Date | Net Unrealized Appreciation/ (Depreciation) |
| |
| | | | | |
| MXN | 57,560,000 | USD | 3,379,953 | SG | 6/20/2024 | $(46,537) |
| NOK | 16,020,000 | USD | 1,515,129 | SG | 6/20/2024 | (71,156) |
| NZD | 3,020,000 | USD | 1,839,101 | SG | 6/20/2024 | (59,580) |
| PHP** | 94,730,000 | USD | 1,709,998 | SG | 6/20/2024 | (71,646) |
| PLN | 12,530,000 | EUR | 2,907,793 | SG | 6/20/2024 | (22,557) |
| PLN | 11,310,000 | USD | 2,872,056 | SG | 6/20/2024 | (85,539) |
| SEK | 14,790,000 | USD | 1,443,992 | SG | 6/20/2024 | (98,888) |
| SGD | 4,460,000 | USD | 3,352,165 | SG | 6/20/2024 | (77,216) |
| THB | 32,540,000 | USD | 896,767 | SG | 6/20/2024 | (15,250) |
| TRY | 1,180,000 | USD | 34,637 | SG | 6/20/2024 | (33) |
| USD | 315,774 | AUD | 490,000 | SG | 6/20/2024 | (2,119) |
| USD | 306,133 | BRL** | 1,610,000 | SG | 6/20/2024 | (2,440) |
| USD | 239,450 | CAD | 330,000 | SG | 6/20/2024 | (462) |
| USD | 421,409 | CZK | 9,990,000 | SG | 6/20/2024 | (2,546) |
| USD | 1,248,278 | EUR | 1,170,000 | SG | 6/20/2024 | (2,943) |
| USD | 522,486 | GBP | 420,000 | SG | 6/20/2024 | (2,462) |
| USD | 655,511 | HUF | 242,970,000 | SG | 6/20/2024 | (5,283) |
| USD | 287,112 | ILS | 1,080,000 | SG | 6/20/2024 | (2,174) |
| USD | 1,449,545 | INR** | 121,290,000 | SG | 6/20/2024 | (682) |
| USD | 28,875 | KRW** | 40,090,000 | SG | 6/20/2024 | (121) |
| USD | 327,694 | MXN | 5,710,000 | SG | 6/20/2024 | (2,983) |
| USD | 23,563 | NZD | 40,000 | SG | 6/20/2024 | (8) |
| USD | 12,426 | PHP** | 720,000 | SG | 6/20/2024 | (26) |
| USD | 250,224 | PLN | 1,020,000 | SG | 6/20/2024 | (1,079) |
| USD | 543,020 | SGD | 740,000 | SG | 6/20/2024 | (356) |
| USD | 40,613 | THB | 1,500,000 | SG | 6/20/2024 | (22) |
| USD | 1,141,061 | TRY | 41,060,000 | SG | 6/20/2024 | (63,047) |
| USD | 1,450,951 | ZAR | 27,750,000 | SG | 6/20/2024 | (17,506) |
| ZAR | 26,210,000 | USD | 1,395,761 | SG | 6/20/2024 | (8,790) |
| CLP** | 315,370,000 | USD | 333,284 | SG | 6/21/2024 | (4,949) |
| USD | 914,325 | CLP** | 889,560,000 | SG | 6/21/2024 | (11,809) |
| Total unrealized depreciation | | | | | $(1,498,040) |
| | | | | | |
| Net unrealized appreciation | | | | | $72,150 |
| | | | | | |
| ** Non-deliverable forward. |
| |
| For the six months ended April 30, 2024, the average notional value for the months where the Fund had forward contracts outstanding was $5,106,560. |
See Notes to Consolidated Financial Statements
Consolidated Schedule of Investments Absolute Return Multi-Manager Fund^ (Unaudited) (cont’d)
| Equity swap contracts ("equity swaps") |
| At April 30, 2024, the Fund had outstanding equity swaps as follows: |
| |
Over the counter equity swaps — Long(a) |
Counterparty | Reference Entity | | Notional Amount | Maturity Date | Variable- Rate(b) | Spread | Reference Rate | Frequency of Fund Receipt/ Payment | Value
and
Unrealized
Appreciation/ (Depreciation) |
| |
| | | | | | | | |
| MS | adidas AG | EUR | 578,452 | 2/17/2025 | 4.48% | 0.60% | 1M EURIBOR | T/1M | $242,812 |
| JPM | Alliance Aviation Services Ltd. | AUD | 29,456 | 7/15/2024 | 4.97% | 0.65% | 1D RBACR | T/1M | 2,269 |
| JPM | Altium Ltd. | AUD | 740,962 | 2/19/2025 | 4.97% | 0.65% | 1D RBACR | T/1M | 4,535 |
| JPM | Aluflexpack AG | CHF | 44,100 | 4/7/2025 | 1.60% | 0.15% | 1D SARON | T/1M | (542) |
| MS | Amundi SA | EUR | 1,866,906 | 2/17/2025 | 4.48% | 0.60% | 1M EURIBOR | T/1M | 87,491 |
| MS | Anima Holding SpA | EUR | 403,998 | 2/17/2025 | 4.48% | 0.60% | 1M EURIBOR | T/1M | 37,416 |
| JPM | Applus Services SA | EUR | 265,367 | 7/5/2024 | 4.54% | 0.65% | 1D ESTR | T/1M | 63,806 |
| JPM | Ascential plc | GBP | 181,790 | 11/4/2024 | 5.60% | 0.40% | 1D SONIA | T/1M | 24,631 |
| MS | Aspen Pharmacare Holdings Ltd. | USD | 79,740 | 12/17/2024 | 6.23% | 0.90% | 1D FEDEF | T/1M | 10,617 |
| JPM | Azure Minerals Ltd. | AUD | 39,948 | 12/23/2024 | 4.97% | 0.65% | 1D RBACR | T/1M | 24 |
| JPM | Believe SA | EUR | 43,770 | 2/17/2025 | 4.29% | 0.40% | 1D ESTR | T/1M | 902 |
| MS | Brenntag SE | EUR | 559,429 | 2/17/2025 | 4.48% | 0.60% | 1M EURIBOR | T/1M | 36,004 |
| MS | Bureau Veritas SA | EUR | 767,102 | 2/17/2025 | 4.48% | 0.60% | 1M EURIBOR | T/1M | 47,786 |
| MS | Croda International plc | GBP | 43,288 | 12/3/2024 | 5.84% | 0.64% | 1D SONIA | T/1M | (19,168) |
| JPM | CSR Ltd. | AUD | 444,500 | 3/7/2025 | 4.97% | 0.65% | 1D RBACR | T/1M | 1,833 |
| MS | Danone SA | EUR | 1,166,806 | 2/17/2025 | 4.48% | 0.60% | 1M EURIBOR | T/1M | 169,761 |
| JPM | Darktrace plc | USD | 103,500 | 4/30/2025 | 5.72% | 0.40% | 1D OBFR | T/1M | (13) |
| JPM | DS Smith plc | GBP | 192,290 | 4/2/2025 | 11.32% | 0.40% | 1D SONIA | T/1M | (9,239) |
| MS | Elis SA | EUR | 448,990 | 2/17/2025 | 4.48% | 0.60% | 1M EURIBOR | T/1M | 104,623 |
| JPM | Entain plc | GBP | 93,613 | 2/10/2025 | 5.60% | 0.40% | 1D SONIA | T/1M | (26,868) |
| MS | Eurofins Scientific SE | EUR | 260,006 | 2/17/2025 | 4.48% | 0.60% | 1M EURIBOR | T/1M | (46,420) |
| JPM | Gram Car Carriers ASA | NOK | 599,718 | 4/28/2025 | 5.02% | 0.40% | 1M NIBOR | T/1M | (1,799) |
| MS | Heidelberg Materials AG | EUR | 601,816 | 2/17/2025 | 4.48% | 0.60% | 1M EURIBOR | T/1M | 222,119 |
| MS | Hermes International SCA | EUR | 227,351 | 2/17/2025 | 4.48% | 0.60% | 1M EURIBOR | T/1M | 58,984 |
| MS | Holcim AG | CHF | 578,310 | 2/17/2025 | 2.03% | 0.58% | 1D SARON | T/1M | 181,594 |
| MS | Hypera SA | USD | 63,939 | 7/15/2024 | 5.98% | 0.65% | 1D FEDEF | T/1M | (40,956) |
| JPM | IMAX China Holding, Inc. | HKD | 641,546 | 7/17/2024 | 5.26% | 0.00% | 1D HONIA | T/1M | (28,011) |
| MS | ITV plc | GBP | 93,371 | 12/3/2024 | 5.84% | 0.64% | 1D SONIA | T/1M | (12,293) |
| MS | Kering SA | EUR | 383,460 | 2/17/2025 | 4.48% | 0.60% | 1M EURIBOR | T/1M | (287,460) |
| JPM | Kindred Group plc | SEK | 4,387,596 | 1/24/2025 | 4.42% | 0.40% | 1M STIBOR | T/1M | 4,609 |
| JPM | Lok'nStore Group plc | GBP | 57,615 | 4/15/2025 | 5.60% | 0.40% | 1D SONIA | T/1M | (768) |
| MS | LVMH Moet Hennessy Louis Vuitton SE | EUR | 172,691 | 2/17/2025 | 4.48% | 0.60% | 1M EURIBOR | T/1M | (8,111) |
| JPM | MorphoSys AG | EUR | 214,753 | 2/10/2025 | 4.54% | 0.65% | 1D ESTR | T/1M | 4,272 |
| MS | NAVER Corp. | USD | 62,841 | 8/15/2024 | 6.83% | 1.50% | 1D FEDEF | T/1M | (15,293) |
| JPM | Network International Holdings plc | GBP | 444,340 | 5/7/2024 | 5.60% | 0.40% | 1D SONIA | T/1M | 13,622 |
See Notes to Consolidated Financial Statements
Consolidated Schedule of Investments Absolute Return Multi-Manager Fund^ (Unaudited) (cont’d)
Counterparty
| Reference Entity | | Notional Amount | Maturity Date | Variable- Rate(b) | Spread | Reference Rate | Frequency of Fund Receipt/ Payment | Value
and
Unrealized
Appreciation/
(Depreciation)
|
| | | | | | | | | | |
| JPM | Orange Belgium SA | EUR | 14,128 | 12/11/2024 | 4.29% - 4.39% | 0.40% - 0.50% | 1D ESTR | T/1M | $(3,322) |
| JPM | PGS ASA | NOK | 708,173 | 12/27/2024 | 5.02% | 0.40% | 1M NIBOR | T/1M | 125 |
| JPM | Redrow plc | GBP | 52,655 | 2/28/2025 | 5.60% | 0.40% | 1D SONIA | T/1M | (1,211) |
| MS | Ryanair Holdings plc | EUR | 231,914 | 2/17/2025 | 4.48% | 0.60% | 1M EURIBOR | T/1M | 63,704 |
| MS | SAP SE | EUR | 105,384 | 2/17/2025 | 4.48% | 0.60% | 1M EURIBOR | T/1M | 40,363 |
| JPM | Shinko Electric Industries Co. Ltd. | JPY | 25,479,220 | 1/30/2025 | 0.43% | 0.35% | 1D MUTSC | T/1M | 2,826 |
| MS | Smith & Nephew plc | GBP | 410,681 | 12/3/2024 | 5.84% | 0.64% | 1D SONIA | T/1M | (92,488) |
| JPM | Spirent Communications plc | GBP | 128,218 | 3/7/2025 | 5.60% | 0.40% | 1D SONIA | T/1M | 15,445 |
| MS | Stroeer SE & Co. KGaA | EUR | 191,457 | 2/17/2025 | 4.48% | 0.60% | 1M EURIBOR | T/1M | 28,858 |
| JPM | Telecom Italia SpA | EUR | 12,132 | 11/25/2024 | 4.54% | 0.65% | 1D ESTR | T/1M | (1,956) |
| Total long positions of equity swaps | | | | | | | $875,113 |
| | | | | | | | |
Over the counter equity swaps — Short(c) |
Counterparty
| Reference Entity | | Notional
Amount | Maturity Date | Variable- Rate(b) | Spread | Reference Rate | Frequency
of Fund Receipt/ Payment | Value
and
Unrealized Appreciation/ (Depreciation) |
| |
| | | | | | | | |
| MS | Air Liquide SA | EUR | (504,934) | 2/17/2025 | 3.54% | (0.35)% | 1D ESTR | 1M/T | $(118,119) |
| MS | Allianz SE (Registered) | EUR | (414,830) | 2/17/2025 | 3.54% | (0.35)% | 1D ESTR | 1M/T | (79,892) |
| MS | AXA SA | EUR | (258,677) | 2/17/2025 | 3.54% | (0.35)% | 1D ESTR | 1M/T | (37,474) |
| JPM | Barratt Developments plc | GBP | (53,609) | 2/28/2025 | 4.80% | (0.40)% | 1D SONIA | 1M/T | 2,679 |
| MS | BASF SE | EUR | (170,568) | 2/17/2025 | 3.54% | (0.35)% | 1D ESTR | 1M/T | 6,143 |
| MS | Bayerische Motoren Werke AG | EUR | (119,867) | 2/17/2025 | 3.54% | (0.35)% | 1D ESTR | 1M/T | (6,318) |
| MS | Deutsche Post AG | EUR | (220,249) | 2/17/2025 | 3.54% | (0.35)% | 1D ESTR | 1M/T | 10,028 |
| MS | Enel SpA | EUR | (114,083) | 2/17/2025 | 3.49% | (0.40)% | 1D ESTR | 1M/T | (16,287) |
| MS | Engie SA | EUR | (234,874) | 2/17/2025 | 3.54% | (0.35)% | 1D ESTR | 1M/T | (47,276) |
| JPM | Grifols SA | USD | (5,518) | 4/15/2025 | 4.92% | (0.40)% | 1D OBFR | 1M/T | 59 |
| MS | H & M Hennes & Mauritz AB | SEK | (1,864,005) | 10/21/2024 | 3.61% | (0.40)% | 1W STIBOR | 1M/T | (20,525) |
| MS | Hannover Rueck SE | EUR | (260,288) | 2/17/2025 | 3.54% | (0.35)% | 1D ESTR | 1M/T | (65,166) |
| MS | Marks & Spencer Group plc | GBP | (313,951) | 12/3/2024 | 4.90% | (0.30)% | 1D SONIA | 1M/T | (142,213) |
| MS | Merck & Co., Inc. | USD | (205,201) | 12/17/2024 | 4.98% | (0.35)% | 1D FEDEF | 1M/T | (32,215) |
| MS | Next plc | GBP | (207,274) | 12/3/2024 | 4.90% | (0.30)% | 1D SONIA | 1M/T | (68,419) |
| MS | Schneider Electric SE | EUR | (427,404) | 2/17/2025 | 3.54% | (0.35)% | 1D ESTR | 1M/T | (137,485) |
| JPM | Smurfit Kappa Group plc | USD | (726,300) | 9/16/2024 | 4.57% | (0.75)% | 1D OBFR | 1M/T | (108,657) |
| MS | Swisscom AG (Registered) | CHF | (193,848) | 2/17/2025 | 1.10% | (0.35)% | 1D SARON | 1M/T | 28,366 |
| MS | Telefonica SA | EUR | (95,375) | 2/17/2025 | 3.49% | (0.40)% | 1D ESTR | 1M/T | (13,625) |
See Notes to Consolidated Financial Statements
Consolidated Schedule of Investments Absolute Return Multi-Manager Fund^ (Unaudited) (cont’d)
Counterparty
| Reference Entity | | Notional Amount | Maturity Date | Variable- Rate(b) | Spread | Reference Rate | Frequency of Fund Receipt/ Payment | Value
and
Unrealized Appreciation/ (Depreciation) |
| | | | | | | | | | |
| MS | Tencent Holdings Ltd. | USD | (266,302) | 7/23/2025 | 4.93% | (0.40)% | 1D FEDEF | 1M/T | $(21,299) |
| JPM | TGS ASA | NOK | (714,482) | 12/27/2024 | 3.37% - 3.57% | (1.25)% - (1.05)% | 1M NIBOR | 1M/T | 2,237 |
| MS | Vinci SA | EUR | (305,834) | 2/17/2025 | 3.54% | (0.35)% | 1D ESTR | 1M/T | (9,037) |
| Total short positions of equity swaps | | | | | | | $(874,495) |
| Total long and short positions of equity swaps | | | | | | $618 |
| Total financing costs and other receivables/(payables) of equity swaps | | | | $40,469 |
| Total long and short positions including financing costs and other receivables/(payables) of equity swaps | $41,087 |
(a)
| The Fund pays a specified rate based on a reference rate plus or minus a spread, and receives the total return on the reference entity. |
(b)
| Effective rate at April 30, 2024 |
(c)
| The Fund receives a specified rate based on a reference rate plus or minus a spread, and pays the total return on the reference entity. |
For the six months ended April 30, 2024, the average notional value for the months where the Fund had equity swaps outstanding was $14,185,757 for long positions and $(5,961,559) for short positions.
At April 30, 2024, the Fund had cash collateral of $1,840,000, $3,210,000 and $866,321 deposited in a segregated account for JPMorgan Chase Bank, NA, Morgan Stanley Capital Services LLC and Societe Generale, respectively, to cover collateral requirements on over the counter derivatives.
Purchased option contracts ("options purchased")At April 30, 2024, the Fund had outstanding options purchased as follows:
|
Description | Number of Contracts | Notional Amount | Exercise Price | Expiration Date | Value |
| Puts | | | | | |
| Software | | | | | |
| HashiCorp, Inc. | 14 | $70 | $30.00 | 5/17/2024 | $70(a)(b) |
| | | | | | |
| Total options purchased (cost $388) | | | | | $70
|
| | | | | | |
| (a) Value determined using significant unobservable inputs. |
| (b) Security fair valued as of April 30, 2024, in accordance with procedures approved by the valuation designee. |
Written option contracts ("options written")
At April 30, 2024, the Fund had outstanding options written as follows:
|
Description | Number of Contracts | Notional Amount | Exercise Price | Expiration Date | Value |
| Calls | | | | | |
| Energy Equipment & Services | | | | | |
| US Silica Holdings, Inc. | 8 | $(140) | $16.00 | 6/21/2024 | $(140) |
| | | | | | |
| Total options written (premium received $192) | | | | | $(140) |
| | | | | | |
For the six months ended April 30, 2024, the average market value for the months where the Fund had options purchased and options written outstanding was $70 for options purchased and $(391) for options written. |
See Notes to Consolidated Financial Statements
Consolidated Schedule of Investments Absolute Return Multi-Manager Fund^ (Unaudited) (cont’d)
| Abbreviations |
| CBOE | Chicago Board Options Exchange |
| CORRA | Canadian Overnight Repo Rate Average |
| ESTR | Euro Short-Term Rate |
| EURIBOR | Euro Interbank Offered Rate |
| FEDEF | Federal Funds Floating Rate |
| FTSE | Financial Times Stock Exchange |
| HONIA | Hong Kong Overnight Index Average |
| HSCEI | Hang Seng China Enterprises Index |
| IFSC | International Financial Service Centre |
| JPM | JPMorgan Chase Bank, NA |
| JSE | Johannesburg Stock Exchange |
| MS | Morgan Stanley Capital Services LLC |
| MSCI | Morgan Stanley Capital International |
| MUTSC | Bank of Japan Unsecured Overnight Call Rate |
| NIBOR | Norway Interbank Offered Rate |
| OBFR | Overnight Bank Funding Rate |
| OMX | Stockholm Stock Exchange |
| RBACR | Reserve Bank of Australia Cash Rate |
| SARON | Swiss Average Overnight Rate |
| SG | Societe Generale |
| SGX | Singapore Exchange |
| SOFR | Secured Overnight Financing Rate |
| SPI | Australian Benchmark Index |
| SONIA | Sterling Overnight Index Average Rate |
| STIBOR | Stockholm Interbank Offered Rate |
| TOPIX | Tokyo Stock Price Index |
| T | Termination Date |
| 1D | One Day |
| 1M | One Month |
| 1W | One Week |
| Currency Abbreviations |
| AUD | Australian Dollar |
| BRL | Brazilian Real |
| CAD | Canadian Dollar |
| CHF | Swiss Franc |
| CLP | Chilean Peso |
| CZK | Czech Republic Koruna |
| EUR | Euro |
| GBP | Pound Sterling |
| HKD | Hong Kong Dollar |
See Notes to Consolidated Financial Statements
Consolidated Schedule of Investments Absolute Return Multi-Manager Fund^ (cont’d)
| HUF | Hungarian Forint |
| ILS | Israeli New Shekel |
| INR | Indian Rupee |
| JPY | Japanese Yen |
| KRW | Korean Won |
| MXN | Mexican Peso |
| NOK | Norwegian Krone |
| NZD | New Zealand Dollar |
| PHP | Philippine Peso |
| PLN | Polish Zloty |
| SEK | Swedish Krona |
| SGD | Singapore Dollar |
| THB | Thailand Baht |
| TRY | Turkish Lira |
| USD | United States Dollar |
| ZAR | South African Rand |
The following is a summary, categorized by Level (See Note A of the Notes to Consolidated Financial Statements), of inputs used to value the Fund's long investments as of April 30, 2024:
| Asset Valuation Inputs | Level 1 | Level 2 | Level 3* | Total |
| Investments: | | | | |
| Common Stocks | | | | |
| Broadline Retail | $1,902,939 | $1,315,551 | $— | $3,218,490 |
| Capital Markets | 184,742 | — | — | 184,742 |
| Consumer Staples Distribution & Retail | 994,906 | — | — | 994,906 |
| Diversified Telecommunication Services | 134,897 | — | 362,914 | 497,811 |
| Food Products | — | 1,061,230 | — | 1,061,230 |
| Health Care Providers & Services | 910,278 | 74,873 | — | 985,151 |
| Insurance | 411,903 | 424,132 | — | 836,035 |
| Interactive Media & Services | 2,259,248 | 25,017 | — | 2,284,265 |
| Life Sciences Tools & Services | 269,451 | 897,880 | — | 1,167,331 |
| Media | 611,830 | 462,412 | — | 1,074,242 |
| Metals & Mining | 1,250,890 | 120,717 | — | 1,371,607 |
| Oil, Gas & Consumable Fuels | 4,513,784 | — | — | 4,513,784 |
| Passenger Airlines | 44,031 | — | 144 | 44,175 |
| Pharmaceuticals | 660,168 | 791,703 | — | 1,451,871 |
| Professional Services | 513,458 | 403,295 | — | 916,753 |
| Semiconductors & Semiconductor Equipment | 316,967 | 79,262 | — | 396,229 |
| Software | 1,272,892 | 742,672 | — | 2,015,564 |
| Specialty Retail | 239,432 | — | 14,050 | 253,482 |
| Technology Hardware, Storage & Peripherals | 554,594 | 394,914 | — | 949,508 |
| Trading Companies & Distributors | 146,337 | 672,930 | — | 819,267 |
Other Common Stocks(a) | 12,972,691 | — | — | 12,972,691 |
| Total Common Stocks | 30,165,438 | 7,466,588 | 377,108 | 38,009,134 |
Corporate Bonds(a) | — | — | — | — |
Insurance Linked Securities(a) | — | 7,661,440 | — | 7,661,440 |
Loan Assignments(a) | — | — | 5,663 | 5,663 |
| Rights | | | | |
See Notes to Consolidated Financial Statements
Consolidated Schedule of Investments Absolute Return Multi-Manager Fund^ (Unaudited) (cont’d)
| Asset Valuation Inputs (cont’d) | Level 1 | Level 2 | Level 3* | Total |
| Biotechnology | $— | $— | $30,367 | $30,367 |
| Capital Markets | — | — | 458 | 458 |
| Health Care Equipment & Supplies | — | — | 5,775 | 5,775 |
| IT Services | — | — | 12,025 | 12,025 |
| Metals & Mining | 20,200 | — | 3 | 20,203 |
| Paper & Forest Products | — | — | 11,500 | 11,500 |
| Total Rights | 20,200 | — | 60,128 | 80,328 |
Warrants(a) | 462 | — | — | 462 |
Closed End Funds(a) | — | 80,301 | — | 80,301 |
Options Purchased(b) | — | — | 70 | 70 |
| Short-Term Investments | — | 37,814,467 | — | 37,814,467 |
| Total Long Positions | $30,186,100 | $53,022,796 | $442,969 | $83,651,865 |
| (a) | The Consolidated Schedule of Investments provides information on the industry or sector categorization as well as a Positions by Country summary. |
| (b) | The "Purchased option contracts" table under Derivative Instruments provides information on the industry or sector categorization. |
| * | The following is a reconciliation between the beginning and ending balances of investments in which significant unobservable inputs (Level 3) were used in determining value: |
| | Common Stocks(a)(b) | Corporate Bonds(a)(c) | Loan Assignments(a) | Purchased Options(a) | Rights(a)(b) | Total |
Assets: Investments in Securities: | | | | | | |
| Beginning Balance as of November 1, 2023 | $1,470,019 | $– | $5,632 | $– | $71,320 | $1,546,971 |
| Transfers into Level 3 | – | – | – | – | – | — |
| Transfers out of Level 3 | – | – | – | – | – | – |
| Accrued discounts/(premiums) | – | – | – | – | – | – |
| Realized gain/(loss) | 420,480 | – | (27) | – | 12,582 | 433,035 |
Change in unrealized appreciation/ (depreciation) | (49,159) | – | 12 | (318) | (474) | (49,939) |
| Purchases | 58,197 | – | 106 | 388 | – | 58,691 |
| Sales | (1,522,429) | – | (60) | – | (23,300) | (1,545,789) |
| Balance as of April 30, 2024 | $377,108 | $– | $5,663 | $70 | $60,128 | $442,969 |
Net change in unrealized appreciation/ (depreciation) on investments still held as of April 30, 2024 | $5,143 | $– | $12 | $(318) | $462 | $5,299 |
| (a) | These securities were fair valued in accordance with procedures approved by the valuation designee. These investments did not have a material impact on the Fund’s net assets and therefore, disclosure of significant unobservable inputs used in formulating valuations is not presented. |
| (b) | These securities were valued based on a single quotation obtained from a dealer. The Fund does not have access to unobservable inputs and therefore cannot disclose such inputs used in formulating such quotation. |
See Notes to Consolidated Financial Statements
Consolidated Schedule of Investments Absolute Return Multi-Manager Fund^ (Unaudited) (cont’d)
| (c) | The reconciliation between beginning and ending balances of investments in which significant unobservable inputs (Level 3) were used is not presented as all values are zero. |
The following is a summary, categorized by Level (See Note A of the Notes to Consolidated Financial Statements), of inputs used to value the Fund's short investments as of April 30, 2024:
Liability Valuation Inputs | Level 1 | Level 2 | Level 3 | Total |
| Investments: | | | | |
Common Stocks Sold Short(a) | $(5,629,946) | $— | $— | $(5,629,946) |
| Total Short Positions | $(5,629,946) | $— | $— | $(5,629,946) |
| (a) | The Consolidated Schedule of Investments provides information on the industry or sector categorization as well as a Positions by Country summary. |
The following is a summary, categorized by level (See Note A of the Notes to Consolidated Financial Statements), of inputs used to value the Fund's derivatives as of April 30, 2024:
Other Financial Instruments | Level 1 | Level 2 | Level 3* | Total |
Futures(a) | | | | |
| Assets | $1,087,344 | $— | $— | $1,087,344 |
| Liabilities | (95,976) | — | — | (95,976) |
Forward contracts(a) | | | | |
| Assets | — | 1,570,190 | — | 1,570,190 |
| Liabilities | — | (1,498,040) | — | (1,498,040) |
| Swaps | | | | |
| Assets | — | 1,614,569 | — | 1,614,569 |
| Liabilities | — | (1,573,482) | — | (1,573,482) |
| Options Written | | | | |
| Liabilities | (140) | — | — | (140) |
| Total | $991,228 | $113,237 | $— | $1,104,465 |
| (a) | Futures and forward contracts are reported at the cumulative unrealized appreciation/(depreciation) of theinstruments. |
See Notes to Consolidated Financial Statements
Consolidated Schedule of Investments Absolute Return Multi-Manager Fund^ (Unaudited) (cont’d)
| * | The following is a reconciliation between the beginning and ending balances of investments in which significant unobservable inputs (Level 3) were used in determining value: |
Options Written(a) |
| Other Financial Instruments: | |
| Beginning Balance as of November 1, 2023 | $– |
| Transfers into Level 3 | – |
| Transfers out of Level 3 | – |
| Accrued discounts/(premiums) | – |
| Realized gain/(loss) | 182 |
| Change in unrealized appreciation/(depreciation) | (182) |
| Purchases | – |
| Sales | – |
| Balance as of April 30, 2024 | $– |
Net change in unrealized appreciation/(depreciation) on investments still held as of April 30, 2024 | $– |
(a)
| At the beginning of the year, options written were valued in accordance with procedures approved by the valuation designee. The Fund held no Level 3 derivatives at April 30, 2024 |
^
| A balance indicated with a “—”, reflects either a zero balance or an amount that rounds to less than 1. |
See Notes to Consolidated Financial Statements
Consolidated Statement of Assets and Liabilities (Unaudited)
Neuberger Berman Alternative Funds
| | | ABSOLUTE RETURN MULTI-MANAGER FUND | |
| | | April 30, 2024 | |
| Assets | | | |
| Investments in securities, at value* (Note A)—see Consolidated Schedule of Investments: | | | |
Unaffiliated issuers(a) | |
| $83,651,865 | |
| Cash | | | 2,161,299 | |
Foreign currency(b) | | | 81,749 | |
| Cash collateral segregated for short sales (Note A) | | | 5,626,126 | |
| Cash collateral segregated for over the counter derivatives (Note A) | | | 5,916,321 | |
| Dividends and interest receivable | | | 344,375 | |
| Receivable for securities sold | | | 129,464 | |
| Receivable for Fund shares sold | | | 7,339 | |
| Deposits with brokers for futures contracts (Note A) | | | 1,694,096 | |
| Receivable for variation margin on futures contracts (Note A) | | | 567,594 | |
| Receivable from administrator—net (Note B) | | | 32,432 | |
| Over the counter swap contracts, at value (Note A) | | | 1,614,569 | |
| Receivable for forward foreign currency contracts (Note A) | | | 1,570,190 | |
| Prepaid expenses and other assets | | | 107,342 | |
| | | |
| |
| Total Assets | | | 103,504,761 | |
| | | | | |
| Liabilities | | | | |
Investments sold short, at value (Note A)(c) | | | 5,629,946 | |
Options contracts written, at value (Note A)(d) | | | 140 | |
| Over the counter swap contracts, at value (Note A) | | | 1,573,482 | |
| Payable to investment manager—net (Note B) | | | 131,959 | |
| Payable for securities purchased | | | 409,443 | |
| Payable for Fund shares redeemed | | | 8,882 | |
| Payable for forward foreign currency contracts (Note A) | | | 1,498,040 | |
| Payable for audit fees | | | 91,219 | |
| Payable for custodian and accounting fees | | | 112,352 | |
| Other accrued expenses and payables | | | 80,148 | |
| | | |
| |
| Total Liabilities | | | 9,535,611 | |
| | | |
| |
| Net Assets | |
| $93,969,150 | |
| | | | | |
| Net Assets consist of: | | | | |
| Paid-in capital | |
| $203,675,685 | |
| Total distributable earnings/(losses) | | | (109,706,535 | ) |
| | | |
| |
| Net Assets | |
| $93,969,150 | |
See Notes to Consolidated Financial Statements
Consolidated Statement of Assets and Liabilities (Unaudited) (cont’d)
Neuberger Berman Alternative Funds
| | ABSOLUTE RETURN MULTI-MANAGER FUND |
| | April 30, 2024 |
| Net Assets | |
| Institutional Class | $82,631,954 |
| Class A | 6,869,438 |
| Class C | 2,085,842 |
| Class R6 | 111,607 |
| Class E | 2,270,309 |
| | |
| Shares Outstanding ($.001 par value; unlimited shares authorized) | |
| Institutional Class | 6,921,788 |
| Class A | 587,036 |
| Class C | 189,718 |
| Class R6 | 9,349 |
| Class E | 188,768 |
| | |
| Net Asset Value, offering and redemption price per share | |
| Institutional Class | $11.94 |
| Class R6 | $11.94 |
| Class E | $12.03 |
| | |
| Net Asset Value and redemption price per share | |
| Class A | $11.70 |
| | |
| Offering Price per share | |
| Class A‡ | $12.41 |
| | |
| Net Asset Value and offering price per share | |
| Class C^ | $10.99 |
| | |
| *Cost of Investments: | |
| (a) Unaffiliated issuers | $83,260,763 |
| (b) Total cost of foreign currency | $80,914 |
| (c) Proceeds from investments sold short | $5,206,482 |
| (d) Premium received from option contracts written | $192 |
| ‡ | On single retail sales of less than $50,000. On sales of $50,000 or more or in certain other circumstances described in the Fund’s prospectus, offering price is reduced. |
| | |
| ^ | Redemption price per share is equal to net asset value less any applicable contingent deferred sales charge. |
See Notes to Consolidated Financial Statements
Consolidated Statement of Operations (Unaudited)
Neuberger Berman Alternative Funds
| | | ABSOLUTE RETURN MULTI-MANAGER FUND | |
| | | For the Six Months Ended April 30, 2024 | |
| Investment Income: | | | |
| Income (Note A): | | | |
| Dividend income—unaffiliated issuers | |
| $1,645,510 | |
| Interest and other income—unaffiliated issuers | | | 711,545 | |
| Foreign taxes withheld | | | (60,623 | ) |
| | | | | |
| Total income | |
| $2,296,432 | |
| | | | | |
| Expenses: | | | | |
| Investment management fees (Note B) | | | 924,417 | |
| Administration fees (Note B): | | | | |
| Institutional Class | | | 72,631 | |
| Class A | | | 9,402 | |
| Class C | | | 2,888 | |
| Class R6 | | | 33 | |
| Distribution fees (Note B): | | | | |
| Class A | | | 9,040 | |
| Class C | | | 11,109 | |
| Shareholder servicing agent fees: | | | | |
| Institutional Class | | | 801 | |
| Class C | | | 399 | |
| Class R6 | | | 67 | |
| Class E | | | 56 | |
| Audit fees | | | 57,403 | |
| Custodian and accounting fees | | | 137,136 | |
| Insurance | | | 1,454 | |
| Legal fees | | | 67,265 | |
| Registration and filing fees | | | 56,605 | |
| Shareholder reports | | | 19,123 | |
| Trustees' fees and expenses | | | 23,717 | |
| Dividend and interest expense on securities sold short (Note A) | | | (90,976 | ) |
| Miscellaneous | | | 5,826 | |
| | | | | |
| Total expenses | | | 1,308,396 | |
| | | | | |
| Expenses reimbursed by Management (Note B) | | | (297,822 | ) |
| Investment management fees waived (Note B) | | | (19,811 | ) |
| Expenses reduced by custodian fee expense offset arrangement (Note A) | | | (38 | ) |
| | | | | |
| Total net expenses | | | 990,725 | |
| | | | | |
| Net investment income/(loss) | |
| $1,305,707 | |
See Notes to Consolidated Financial Statements
Consolidated Statement of Operations (Unaudited) (cont’d)
Neuberger Berman Alternative Funds
| | | ABSOLUTE RETURN MULTI-MANAGER FUND | |
| | | For the Six Months Ended April 30, 2024 | |
| Realized and Unrealized Gain/(Loss) on Investments (Note A): | | | |
| | | | |
| Net realized gain/(loss) on: | | | |
| Transactions in investment securities of unaffiliated issuers | | | 1,848,551 | |
| Closed short positions of unaffiliated issuers | | | (252,176 | ) |
| Settlement of forward foreign currency contracts | | | (1,158,345 | ) |
| Settlement of foreign currency transactions | | | 131,805 | |
| Expiration or closing of futures contracts | | | (562,302 | ) |
| Expiration or closing of option contracts written | | | 1,919 | |
| Expiration or closing of swap contracts | | | (156,067 | ) |
| | | | | |
| Change in net unrealized appreciation/(depreciation) in value of: | | | | |
| Investment securities of unaffiliated issuers | | | 1,719,212 | |
| Short positions of unaffiliated issuers | | | (358,434 | ) |
| Forward foreign currency contracts | | | (146,703 | ) |
| Foreign currency translations | | | (6,964 | ) |
| Futures contracts | | | (102,961 | ) |
| Option contracts written | | | (130 | ) |
| Swap contracts | | | 1,133,227 | |
| | | | | |
| Net gain/(loss) on investments | | | 2,090,632 | |
| | | | | |
| Net increase/(decrease) in net assets resulting from operations | |
| $3,396,339 | |
See Notes to Consolidated Financial Statements
Consolidated Statements of Changes in Net Assets
Neuberger Berman Alternative Funds
| |
| | | ABSOLUTE RETURN MULTI-MANAGER FUND | |
| | Six Months Ended April 30, 2024 (Unaudited) | | | Fiscal Year Ended October 31, 2023 | |
| Increase/(Decrease) in Net Assets: | | | | | | |
| | | | | | | |
| From Operations (Note A): | | | | | | |
Net investment income/(loss) | |
| $1,305,707 | | |
| $2,228,814 | |
Net realized gain/(loss) on investments | | | (146,615 | ) | | | (987,284 | ) |
Change in net unrealized appreciation/(depreciation) of investments | | | 2,237,247 | | | | (180,168 | ) |
| | | | | | | | | |
Net increase/(decrease) in net assets resulting from operations | | | 3,396,339 | | | | 1,061,362 | |
| | | | | | | | | |
| Distributions to Shareholders From (Note A): | | | | | | | | |
Distributable earnings: | | | | | | | | |
| Institutional Class | | | (995,555 | ) | | | (3,684,077 | ) |
| Class A | | | (44,822 | ) | | | (201,196 | ) |
| Class C | | | — | | | | (48,441 | ) |
| Class R6 | | | (1,400 | ) | | | (794 | ) |
| Class E | | | (48,897 | ) | | | (82,978 | ) |
| | | | | | | | | |
Total distributions to shareholders | | | (1,090,674 | ) | | | (4,017,486 | ) |
| | | | | | | | | |
| From Fund Share Transactions (Note D): | | | | | | | | |
Proceeds from shares sold: | | | | | | | | |
| Institutional Class | | | 5,874,901 | | | | 92,015,015 | |
| Class A | | | 297,346 | | | | 1,776,608 | |
| Class C | | | 186,589 | | | | 669,908 | |
| Class R6 | | | 1,132 | | | | 143,172 | |
| Class E | | | 333,756 | | | | 948,072 | |
Proceeds from reinvestment of dividends and distributions: | | | | | | | | |
| Institutional Class | | | 943,791 | | | | 3,533,508 | |
| Class A | | | 38,408 | | | | 171,512 | |
| Class C | | | — | | | | 42,218 | |
| Class R6 | | | 1,106 | | | | — | |
| Class E | | | 48,897 | | | | 82,978 | |
Payments for shares redeemed: | | | | | | | | |
| Institutional Class | | | (37,342,582 | ) | | | (105,679,313 | ) |
| Class A | | | (1,271,546 | ) | | | (2,510,964 | ) |
| Class C | | | (539,517 | ) | | | (1,084,306 | ) |
| Class R6 | | | (31,919 | ) | | | (3,931,595 | ) |
| Class E | | | (536,578 | ) | | | (860,846 | ) |
| | | | | | | | | |
Net increase/(decrease) from Fund share transactions | | | (31,996,216 | ) | | | (14,684,033 | ) |
| | | | | | | | | |
| Net Increase/(Decrease) in Net Assets | | | (29,690,551 | ) | | | (17,640,157 | ) |
| | | | | | | | | |
| Net Assets: | | | | | | | | |
Beginning of period | | | 123,659,701 | | | | 141,299,858 | |
End of period | |
| $93,969,150 | | |
| $123,659,701 | |
See Notes to Consolidated Financial Statements
Notes to Consolidated Financial Statements Absolute Return Multi-Manager Fund (Unaudited)
Note A—Summary of Significant Accounting Policies:
| 1 | General: Neuberger Berman Alternative Funds (the “Trust”) is a Delaware statutory trust organized pursuant to an Amended and Restated Trust Instrument dated March 27, 2014. The Trust is registered as an open-end management investment company under the Investment Company Act of 1940, as amended (the “1940 Act”), and its shares are registered under the Securities Act of 1933, as amended. Neuberger Berman Absolute Return Multi-Manager Fund (the “Fund”) is a separate operating series of the Trust and is diversified. The Fund currently offers Institutional Class shares, Class A shares, Class C shares, Class R6 shares and Class E shares. The Trust’s Board of Trustees (the “Board”) may establish additional series or classes of shares without the approval of shareholders.
A balance indicated with a “—”, reflects either a zero balance or a balance that rounds to less than 1.
The assets of the Fund belong only to the Fund, and the liabilities of the Fund are borne solely by the Fund and no other series of the Trust.
The Fund is an investment company and accordingly follows the investment company accounting and reporting guidance of the Financial Accounting Standards Board (“FASB”) Accounting Standards Codification (“ASC”) Topic 946 “Financial Services—Investment Companies.”
The preparation of financial statements in accordance with U.S. generally accepted accounting principles (“GAAP”) requires Neuberger Berman Investment Advisers LLC (“Management” or “NBIA”) to make estimates and assumptions at the date of the financial statements. Actual results could differ from those estimates.
The Fund invests in commodity-related instruments through Neuberger Berman Cayman ARMM Fund I Ltd. (the “Subsidiary”), which is organized under the laws of the Cayman Islands. The Fund is and expects to remain the sole shareholder of the Subsidiary. The Subsidiary is governed by its own Board of Directors.
As of April 30, 2024, the value of the Fund’s investment in the Subsidiary was as follows:
|
Investment in
Subsidiary
| Percentage of
Net Assets
|
$13,198,806
| 14.0%
|
| | |
2
| Consolidation: The accompanying financial statements of the Fund present the consolidated accounts of the Fund and the Subsidiary. All intercompany accounts and transactions have been eliminated in consolidation. |
| |
| 3 | Portfolio valuation: In accordance with ASC 820 “Fair Value Measurement” (“ASC 820”), all investments held by the Fund are carried at the value that Management believes the Fund would receive upon selling an investment in an orderly transaction to an independent buyer in the principal or most advantageous market for the investment under current market conditions. Various inputs, including the volume and level of activity for the asset or liability in the market, are considered in valuing the Fund’s investments, some of which are discussed below. At times, Management may need to apply significant judgment to value investments in accordance with ASC 820.
ASC 820 established a three-tier hierarchy of inputs to create a classification of value measurements for disclosure purposes. The three-tier hierarchy of inputs is summarized in the three broad Levels listed below. |
| | ● | Level 1 – unadjusted quoted prices in active markets for identical investments |
| | | |
| | ● | Level 2 – other observable inputs (including quoted prices for similar investments, interest rates, prepayment speeds, credit risk, amortized cost, etc.) |
| | | |
| | ● | Level 3 – unobservable inputs (including the Fund’s own assumptions in determining the fair value of investments) |
| | The inputs or methodology used for valuing an investment are not necessarily an indication of the risk associated with investing in those securities.
The value of the Fund’s investments (long and short positions) in equity securities, closed end funds, rights, warrants and exchange-traded options purchased and written, for which market quotations are available, is generally determined by Management by obtaining valuations from independent pricing services based on the latest sale price quoted on a principal exchange or market for that security (Level 1 inputs). Securities traded primarily on the NASDAQ Stock Market are normally valued at the NASDAQ Official Closing Price (“NOCP”) provided by NASDAQ each business day. The NOCP is the most recently reported price as of 4:00:02 p.m., Eastern Time, unless that price is outside the range of the “inside” bid and asked prices (i.e., the bid and asked prices that dealers quote to each other when trading for their own accounts); in that case, NASDAQ will adjust the price to equal the inside bid or asked price, whichever is closer. Because of delays in reporting trades, the NOCP may not be based on the price of the last trade to occur before the market closes. If there is no sale of a security on a particular day, the independent pricing services may value the security based on market quotations.
The value of the Fund’s investments for long positions in debt securities is determined by Management primarily by obtaining valuations from independent pricing services based on bid quotations, or if quotations are not available, by methods that include various considerations based on security type (generally Level 2 inputs). In addition to the consideration of yields or prices of securities of comparable quality, coupon, maturity and type, indications as to values from dealers, and general market conditions, the following is a description of other Level 2 inputs and related valuation techniques used by independent pricing services to value certain types of debt securities held by the Fund:
Corporate Bonds. Inputs used to value corporate debt securities generally include relevant credit information, observed market movements, sector news, U.S. Treasury yield curve or relevant benchmark curve and other market information, which may include benchmark yield curves, reported trades, broker-dealer quotes, issuer spreads, comparable securities, and reference data, such as market research publications, when available (“Other Market Information”).
High Yield Securities. Inputs used to value high yield securities generally include a number of observations of equity and credit default swap curves related to the issuer and Other Market Information.
The value of insurance linked securities is determined by Management primarily by obtaining valuations from independent third-party pricing services based on bid quotations (Level 2 or 3 inputs).
The value of loan assignments is determined by Management primarily by obtaining valuations from independent pricing services based on broker quotes (generally Level 2 or Level 3 inputs depending on the number of quotes available).
The value of futures contracts is determined by Management by obtaining valuations from independent pricing services at the settlement price at the market close (Level 1 inputs).
The value of forward foreign currency contracts is determined by Management by obtaining valuations from independent pricing services based on actual traded currency rates on independent pricing services’ networks, along with other traded and quoted currency rates provided to the pricing services by leading market participants (Level 2 inputs).
The value of equity swaps is determined by Management by obtaining valuations from independent pricing services using the underlying asset and stated benchmark interest rate (Level 2 inputs).
Management has developed a process to periodically review information provided by independent pricing services for all types of securities.
Investments in non-exchange traded investment companies are valued using the respective fund’s daily calculated net asset value (“NAV”) per share (Level 2 inputs), when available.
If a valuation is not available from an independent pricing service, or if Management has reason to believe that the valuation received does not represent the amount the Fund might reasonably expect to receive on |
| | a current sale in an orderly transaction, Management seeks to obtain quotations from brokers or dealers (generally considered Level 2 or Level 3 inputs depending on the number of quotes available). If such quotations are not available, the security is valued using methods Management has approved in the good- faith belief that the resulting valuation will reflect the fair value of the security. Pursuant to Rule 2a-5 under the 1940 Act, the Board designated Management as the Fund’s valuation designee. As the Fund’s valuation designee, Management is responsible for determining fair value in good faith for all Fund investments. Inputs and assumptions considered in determining fair value of a security based on Level 2 or Level 3 inputs may include, but are not limited to, the type of security; the initial cost of the security; the existence of any contractual restrictions on the security’s disposition; the price and extent of public trading in similar securities of the issuer or of comparable companies; quotations or evaluated prices from broker-dealers or pricing services; information obtained from the issuer and analysts; an analysis of the company’s or issuer’s financial statements; an evaluation of the inputs that influence the issuer and the market(s) in which the security is purchased and sold.
The value of the Fund’s investments in foreign securities is generally determined using the same valuation methods and inputs as other Fund investments, as discussed above. Foreign security prices expressed in local currency values are normally translated from the local currency into U.S. dollars using the exchange rates as of 4:00 p.m. Eastern Time on days the New York Stock Exchange (“NYSE”) is open for business. Management has approved the use of ICE Data Services (“ICE”) to assist in determining the fair value of foreign equity securities when changes in the value of a certain index suggest that the closing prices on the foreign exchanges may no longer represent the amount that the Fund could expect to receive for those securities or when foreign markets are closed and U.S. markets are open. In each of these events, ICE will provide adjusted prices for certain foreign equity securities using a statistical analysis of historical correlations of multiple factors (Level 2 inputs). Management has also approved the use of ICE to evaluate the prices of foreign debt securities as of the time at which the Fund’s share price is calculated. ICE utilizes benchmark spread and yield curves and evaluates available market activity from the local close to the time as of which the Fund’s share price is calculated (Level 2 inputs) to assist in determining prices for certain foreign debt securities. In the case of both foreign equity and foreign debt securities, in the absence of precise information about the market values of these foreign securities as of the time at which the Fund’s share price is calculated, Management has determined based on available data that prices adjusted or evaluated in this way are likely to be closer to the prices the Fund could realize on a current sale than the prices of those securities established at the close of the foreign markets in which the securities primarily trade.
Fair value prices are necessarily estimates, and there is no assurance that such a price will be at or close to the price at which the security is next quoted or traded. |
| | |
4
| Foreign currency translations: The accounting records of the Fund and Subsidiary are maintained in U.S. dollars. Foreign currency amounts are normally translated into U.S. dollars using the exchange rate as of 4:00 p.m. Eastern Time, on days the NYSE is open for business, to determine the value of investments, other assets and liabilities. Purchase and sale prices of securities, and income and expenses, are translated into U.S. dollars at the prevailing rate of exchange on the respective dates of such transactions. Net unrealized foreign currency gain/(loss), if any, arises from changes in the value of assets and liabilities, other than investments in securities, as a result of changes in exchange rates and is stated separately in the Consolidated Statement of Operations. |
| | |
5
| Securities transactions and investment income: Securities transactions are recorded on trade date for financial reporting purposes. Dividend income is recorded on the ex-dividend date or, for certain foreign dividends, as soon as the Fund becomes aware of the dividends. Non-cash dividends included in dividend income, if any, are recorded at the fair market value of the securities received. Interest income, including accretion of discount (adjusted for original issue discount, where applicable) and amortization of premium, where applicable, is recorded on the accrual basis. Realized gains and losses from securities transactions and foreign currency transactions, if any, are recorded on the basis of identified cost and stated separately in the Consolidated Statement of Operations. Included in net realized gain/(loss) on investments are |
| | |
| | proceeds from the settlement of class action litigation(s) in which the Fund participated as a class member. The amount of such proceeds for the six months ended April 30, 2024, was $6,845. |
| | |
6
| Income tax information: The Fund is treated as a separate entity for U.S. federal income tax purposes. It is the policy of the Fund to continue to qualify for treatment as a regulated investment company (“RIC”) by complying with the requirements of the U.S. Internal Revenue Code applicable to RICs and to distribute substantially all of its net investment income and net realized capital gains to its shareholders. To the extent the Fund distributes substantially all of its net investment income and net realized capital gains to shareholders, no federal income or excise tax provision is required.
ASC 740 “Income Taxes” sets forth a minimum threshold for financial statement recognition of a tax position taken, or expected to be taken, in a tax return. The Fund recognizes interest and penalties, if any, related to unrecognized tax positions as an income tax expense in the Consolidated Statement of Operations. The Fund is subject to examination by U.S. federal and state tax authorities for returns filed for the tax years for which the applicable statutes of limitations have not yet expired. Management has analyzed the Fund's tax positions taken or expected to be taken on federal and state income tax returns for all open tax years (the current and the prior three tax years) and has concluded that no provision for income tax is required in the Fund's financial statements.
The Subsidiary is a controlled foreign corporation under the U.S. Internal Revenue Code. As a U.S. shareholder of a controlled foreign corporation, the Fund will include in its taxable income its share of the Subsidiary’s current earnings and profits (including net realized gains). Any deficit generated by the Subsidiary will be disregarded for purposes of computing the Fund’s taxable income in the current period and also disregarded for all future periods.
For federal income tax purposes, the estimated cost of investments held at April 30, 2024, was $88,941,494. The estimated gross unrealized appreciation was $4,467,746 and estimated gross unrealized depreciation was $13,820,950 resulting in net unrealized depreciation in value of investments of $9,353,204 based on cost for U.S. federal income tax purposes.
Income distributions and capital gain distributions are determined in accordance with income tax regulations, which may differ from GAAP. These differences are primarily due to differing treatments of income and gains on various investment securities held by the Fund, timing differences and differing characterization of distributions made by the Fund. The Fund may also utilize earnings and profits distributed to shareholders on redemption of their shares as part of the dividends-paid deduction for income tax purposes.
Any permanent differences resulting from different book and tax treatment are reclassified at year-end and have no impact on net income, NAV or NAV per share of the Fund. For the year ended October 31, 2023, the Fund recorded permanent reclassifications primarily related to tax adjustments due to partnerships and wholly owned subsidiary income and gain (loss).
For the year ended October 31, 2023, the Fund recorded the following permanent reclassifications: |
Paid-In Capital | Total Distributable Earnings/(Losses) |
($1,432,021)
| $1,432,021
|
| | |
| | The tax character of distributions paid during the years ended October 31, 2023, and October 31, 2022, was as follows: |
Distributions Paid From:
Ordinary Income
| Tax-Exempt
Income
| Long-Term Capital Gain
| Return of Capital
| Total
|
| 2023 | 2022
| 2023
| 2022
| 2023
| 2022
| 2023
| 2022
| 2023
| 2022
|
| $4,017,486 | $110,520 | $– | $– | $– | $– | $– | $– | $4,017,486
| $110,520 |
| | As of October 31, 2023, the components of distributable earnings (accumulated losses) on a U.S. federal income tax basis were as follows: |
| Undistributed | Undistributed |
| Loss | Other
| |
| Ordinary | Long-Term | Unrealized | Carryforwards | Temporary | |
| Income | Capital Gain | Depreciation | and Deferrals | Differences | Total |
| $1,090,272 | $— | $(11,595,927) | $(101,432,983) | $(73,562) | $(112,012,200) |
| | The temporary differences between book basis and tax basis distributable earnings are primarily due to losses disallowed and/or recognized on wash sales and straddles, mark-to-market on adjustments on swaps, futures and forward contracts, amortization of organizational expenses, tax adjustments related to swap contracts and other investments, mark-to-market adjustments on passive foreign investment companies (“PFICs”), tax adjustments due to partnerships, wholly owned subsidiary inclusions, and amortization adjustments.
To the extent the Fund’s net realized capital gains, if any, can be offset by capital loss carryforwards, it is the policy of the Fund not to distribute such gains. Capital loss carryforward rules allow for RICs to carry forward capital losses indefinitely and to retain the character of capital loss carryforwards as short-term or long-term. As determined at October 31, 2023, the Fund had unused capital loss carryforwards available for federal income tax purposes to offset net realized capital gains, if any, as follows: |
Capital Loss Carryforwards
|
Long-Term | Short-Term
|
$35,326,769
| $66,106,214
|
| | During the year ended October 31, 2023, the Fund utilized capital loss carryforwards of $1,495,619. |
| | |
7
| Foreign taxes: Foreign taxes withheld, if any, represent amounts withheld by foreign tax authorities, net of refunds recoverable.
Foreign capital gains on certain foreign securities may be subject to foreign taxes, which are accrued as applicable. At April 30, 2024, there were no outstanding balances of accrued capital gains taxes for the Fund.
As a result of several European Court of Justice (“ECJ”) court cases in certain countries across the European Union (“EU”), the Fund has filed tax reclaims for previously withheld taxes on dividends earned in those countries (“ECJ tax reclaims”). These additional filings are subject to various administrative proceedings by the local jurisdictions’ tax authorities within the EU, as well as a number of related judicial proceedings. When any such ECJ tax reclaims are "more likely than not" to not be sustained assuming examination by tax authorities due to the uncertainty that exists as to the ultimate resolution of these proceedings, the likelihood of receipt of these ECJ tax reclaims, and the potential timing of payment, no amounts are included in the Consolidated Statement of Assets and Liabilities. Income recognized, if any, for ECJ tax reclaims would be included in "Interest and other income—unaffiliated issuers" in the Consolidated Statement of Operations and the cost to file these additional ECJ tax reclaims, if any, would be included in "Miscellaneous and other fees" in the Consolidated Statement of Operations. |
| | |
8
| Distributions to shareholders: The Fund may earn income, net of expenses, daily on its investments. Distributions from net investment income and net realized capital gains, if any, are generally distributed once a year (usually in December) and are recorded on the ex-date.
It is the policy of the Fund to pass through to its shareholders substantially all REIT distributions and other income it receives, less operating expenses. The distributions received from REITs are generally composed of income, capital gains, and/or return of REIT capital, but the REITs do not report this information to the Fund until the following calendar year. For the year ended October 31, 2023, the character of distributions paid to shareholders of the Fund, if any, disclosed within the Consolidated Statements of Changes in Net Assets is based on estimates made at that time. Based on past experience it is possible that a portion of the Fund’s distributions during the current fiscal year, if any, will be considered tax return of capital, but the actual amount of the tax return of capital, if any, is not determinable until after the Fund’s fiscal year- |
| | end. After calendar year-end, when the Fund learns the nature of the distributions paid by REITs during that year, distributions previously identified as income may be recharacterized as return of capital and/or capital gain. After all applicable REITs have informed the Fund of the actual breakdown of distributions paid to the Fund during its fiscal year, estimates previously recorded are adjusted to reflect actual results. As a result, the composition of the Fund’s distributions as reported herein, may differ from the final composition determined after calendar year-end and reported to the Fund shareholders on IRS Form 1099-DIV. |
| | |
9
| Expense allocation: Certain expenses are applicable to multiple funds within a complex of related investment companies. Expenses directly attributable to a fund are charged to that fund. Expenses of the Trust that are not directly attributable to a particular series of the Trust (e.g., the Fund) are allocated among the series of the Trust, on the basis of relative net assets, except where a more appropriate allocation of expenses to each of the series can otherwise be made fairly. Expenses borne by the complex of related investment companies, which includes open-end and closed-end investment companies for which NBIA serves as investment manager, that are not directly attributable to a particular investment company in the complex (e.g., the Trust) or series thereof are allocated among the investment companies in the complex or series thereof on the basis of relative net assets, except where a more appropriate allocation of expenses to each of the investment companies in the complex or series thereof can otherwise be made fairly. The Fund’s expenses (other than those specific to each class) are allocated proportionally each day among its classes based upon the relative net assets of each class. |
| | |
10
| Investments in foreign securities: Investing in foreign securities may involve sovereign and other risks, in addition to the credit and market risks normally associated with domestic securities. These additional risks include the possibility of adverse political and economic developments (including political instability, nationalization, expropriation, or confiscatory taxation) and the potentially adverse effects of unavailability of public information regarding issuers, less governmental supervision and regulation of financial markets, reduced liquidity of certain financial markets, and the lack of uniform accounting, auditing, and financial reporting standards or the application of standards that are different or less stringent than those applied in the United States. Foreign securities also may experience greater price volatility, higher rates of inflation, and delays in settlement. |
| | |
11
| Securities sold short: The Fund may engage in short sales, which are sales of securities which have been borrowed from a third party on the expectation that the market price will decline. If the price of the securities decreases, the Fund will make a profit by purchasing the securities in the open market at a price lower than the one at which it sold the securities. If the price of the securities increases, the Fund may have to cover its short positions at a price higher than the short sale price, resulting in a loss. Gains are limited to the price at which the Fund sold the security short, while losses are potentially unlimited in size. The Fund pledges securities and/or other assets to the lender as collateral. Proceeds received from short sales may be maintained by the lender as collateral or may be released to the Fund and used to purchase additional securities or for any other purpose. Proceeds maintained by the lender are included in the “Cash collateral segregated for short sales” on the Consolidated Statement of Assets and Liabilities. The Fund is contractually responsible to remit to the lender any dividends and interest payable on securities while those securities are being borrowed by the Fund. The Fund may receive or pay the net of the interest charged by the prime broker on the borrowed securities and a financing charge for the difference in the market value of the short position and the cash collateral deposited with the broker. This income or fee is calculated daily based upon the market value of each borrowed security and a variable rate that is dependent on the availability of the security. These costs related to short sales (i.e., dividend and interest remitted to the lender and interest charged by the prime broker) are recorded as an expense of the Fund and are excluded from the contractual expense limitation. A net negative expense, if any, represents a gain to the Fund as the total cash rebates received exceeded the other costs related to short sales. The net amount of fees and rebates incurred are included in the “Dividend and interest expense on securities sold short” on the Consolidated Statement of Operations and were $164,284 for the six months ended April 30, 2024.
At April 30, 2024, the Fund had cash pledged in the amount of $5,626,126 to JPMorgan Chase Bank, NA (“JPM”), as collateral for short sales. In addition, JPM has a perfected security interest in these assets. |
| | |
12
| Investment company securities and exchange traded funds: The Fund may invest in shares of other registered investment companies, including exchange traded funds (“ETFs”), within the limitations |
| | prescribed by the 1940 Act, in reliance on rules adopted by the SEC, particularly Rule 12d1-4 or any other applicable exemptive relief. Rule 12d1-4 permits investments in other registered investment companies in excess of the limitations of the 1940 Act if the Fund complies with the conditions of the Rule. Shareholders of the Fund will indirectly bear their proportionate share of any management fees and other expenses paid by such other investment companies, in addition to the management fees and expenses of the Fund. |
| | |
13
| When-issued/delayed delivery securities: The Fund may purchase securities with delivery or payment to occur at a later date beyond the normal settlement period. At the time the Fund enters into a commitment to purchase a security, the transaction is recorded, and the value of the security is reflected in the NAV. The price of such security and the date when the security will be delivered and paid for are fixed at the time the transaction is negotiated. The value of the security may vary with market fluctuations. No interest accrues to the Fund until payment takes place. When-issued and delayed delivery transactions can have a leverage-like effect on the Fund, which can increase fluctuations in the Fund’s NAV. Certain risks may arise upon entering into when-issued or delayed delivery securities transactions from the potential inability of counterparties to meet the terms of their contracts or if the issuer does not issue the securities due to political, economic, or other factors. Additionally, losses may arise due to changes in the value of the underlying securities. |
| | |
14
| Derivative instruments: The Fund’s use of derivatives during the six months ended April 30, 2024, is described below. Please see the Consolidated Schedule of Investments for the Fund’s open positions in derivatives at April 30, 2024. The disclosure requirements of ASC 815 “Derivatives and Hedging” (“ASC 815”) distinguish between derivatives that qualify for hedge accounting and those that do not. Because investment companies value their derivatives at fair value and recognize changes in fair value through the Consolidated Statement of Operations, they do not qualify for hedge accounting. Accordingly, even though the Fund’s investments in derivatives may represent economic hedges, they are considered non-hedge transactions for purposes of this disclosure.
Rule 18f-4 under the 1940 Act regulates the use of derivatives for certain funds registered under the 1940 Act (“Rule 18f-4”). Unless the Fund qualifies as a “limited derivatives user” as defined in Rule 18f-4, the Fund is subject to a comprehensive derivatives risk management program, is required to comply with certain value-at-risk based leverage limits and is required to provide additional disclosure both publicly and to the SEC regarding its derivatives positions. If the Fund qualifies as a limited derivatives user, Rule 18f-4 requires the Fund to have policies and procedures to manage its aggregate derivatives risk.
Futures contracts: During the six months ended April 30, 2024, the Fund used futures for economic hedging purposes and to enhance returns.
At the time the Fund or Subsidiary enters into a futures contract, it is required to deposit with the futures commission merchant a specified amount of cash or liquid securities, known as “initial margin,” which is a percentage of the value of the futures contract being traded that is set by the exchange upon which the futures contract is traded. Each day, the futures contract is valued at the official settlement price of the board of trade or U.S. commodity exchange on which such futures contract is traded. Subsequent payments, known as “variation margin,” to and from the broker are made on a daily basis, or as needed, as the market price of the futures contract fluctuates. Daily variation margin adjustments, arising from this “mark to market,” are recorded by the Fund or Subsidiary as unrealized gains or losses.
Although some futures by their terms call for actual delivery or acquisition of the underlying securities or currency, in most cases the contracts are closed out prior to delivery by offsetting purchases or sales of matching futures. When the contracts are closed, the Fund or Subsidiary recognizes a gain or loss. Risks of entering into futures contracts include the possibility there may be an illiquid market, possibly at a time of rapidly declining prices, and/or a change in the value of the contract may not correlate with changes in the value of the underlying securities. Futures executed on regulated futures exchanges have minimal counterparty risk to the Fund or Subsidiary because the exchange’s clearinghouse assumes the position of the counterparty in each transaction. Thus, the Fund or Subsidiary is exposed to risk only in connection with the clearinghouse and not in connection with the original counterparty to the transaction.
For U.S. federal income tax purposes, futures transactions undertaken by the Fund or Subsidiary may cause the Fund or Subsidiary to recognize gains or losses from marking contracts to market even though its |
| positions have not been sold or terminated, may affect the character of the gains or losses recognized as long-term or short-term, and may affect the timing of some capital gains and losses realized by the Fund or Subsidiary. Also, the Fund’s or Subsidiary’s losses on transactions involving futures contracts may be deferred rather than being taken into account currently in calculating the Fund’s or Subsidiary’s taxable income.
Forward foreign currency contracts: During the six months ended April 30, 2024, the Fund used forward foreign currency contracts to hedge foreign currency and to enhance returns.
A forward contract is an agreement between two parties to buy or sell a specific currency for another at a set price on a future date and is individually negotiated and privately traded by currency traders and their customers in the interbank market. The market value of a forward contract fluctuates with changes in forward currency exchange rates. Forward contracts are marked to market daily, and the change in value is recorded by the Fund as an unrealized gain or loss. At the consummation of a forward contract to purchase or sell currency, the Fund may either exchange the currencies specified at the maturity of the forward contract or enter into a closing transaction involving the purchase or sale of an offsetting forward contract. Closing transactions with respect to forward contracts are usually performed with the counterparty to the original forward contract. The gain or loss arising from the difference between the U.S. dollar cost of the original contract and the value of the foreign currency in U.S. dollars upon closing a contract is included in “Net realized gain/(loss) on settlement of forward foreign currency contracts” in the Consolidated Statement of Operations. These contracts may involve market risk in excess of the unrealized gain or loss reflected in the Fund’s Consolidated Statement of Assets and Liabilities. In addition, the Fund could be exposed to risks associated with fluctuations in foreign currency and the risk the counterparty will fail to fulfill its obligation.
Equity swap contracts: During the six months ended April 30, 2024, the Fund used equity swaps to provide investment exposure to certain investments, primarily foreign securities.
Equity swaps are two-party contracts in which counterparties exchange the return on a specified reference security for the return based on a fixed or floating interest rate during the period of the swap. Upon entering an equity swap, the Fund may be required to pledge an amount of cash and/or other assets to the broker which is equal to a certain percentage of the contract amount (initial margin). Subsequent payments known as variation margins are made or received by the Fund periodically depending on the fluctuations in the value of the underlying security. Equity swaps are marked to market daily based on the value of the underlying reference entity and the change, if any, is recorded as an unrealized gain or loss. Equity swaps normally do not involve the delivery of securities or other underlying assets. Cash settlement in and out of the swap may occur at a reset date or any other date, at the discretion of the Fund and the counterparty, over the life of the agreement, and is generally determined based on limits and thresholds established as part of an agreement between the Fund and the counterparty. If the other party to an equity swap defaults, the Fund’s risk of loss consists of the net amount of payments that the Fund is contractually entitled to receive, if any. Equity swaps are derivatives, and their value can be very volatile. To the extent that future market trends, the values of assets or economic factors are not accurately analyzed and predicted, the Fund may suffer a loss, which may exceed the related amounts shown in the Consolidated Statement of Assets and Liabilities. Periodic payments received or paid by the Fund are recorded as realized gains or losses in the Consolidated Statement of Operations.
Options: During the six months ended April 30, 2024, the Fund used options written to generate incremental returns and used purchased options for economic hedging purposes, to manage or adjust the risk profile and investment exposure of the Fund or individual positions, to obtain or reduce exposure to certain markets, to establish net short or long positions for markets or securities and to enhance total return.
Premiums paid by the Fund upon purchasing a call or put option are recorded in the asset section of the Fund’s Consolidated Statement of Assets and Liabilities and are subsequently adjusted to the current market value. When an option is exercised, closed, or expired, the Fund realizes a gain or loss and the asset is eliminated. For purchased call options, the Fund’s loss is limited to the amount of the option premium paid.
Premiums received by the Fund upon writing a call option or a put option are recorded in the liability section of the Fund’s Consolidated Statement of Assets and Liabilities and are subsequently adjusted to the |
| | current market value. When an option is exercised, closed, or expired, the Fund realizes a gain or loss and the liability is eliminated.
When the Fund writes a call option on an underlying asset it does not own, its exposure on such an option is theoretically unlimited. When writing a covered call option, the Fund, in return for the premium, gives up the opportunity for profit from a price increase in the underlying security above the exercise price, but conversely retains the risk of loss should the price of the security decline. When writing a put option, the Fund, in return for the premium, takes the risk that it must purchase the underlying security at a price that may be higher than the current market price of the security. If a call or put option that the Fund has written expires unexercised, the Fund will realize a gain for the amount of the premium. All securities covering outstanding written options are held in escrow by the custodian bank.
At April 30, 2024, the Fund had the following derivatives (which did not qualify as hedging instruments under ASC 815), grouped by primary risk exposure: |
| | Asset Derivatives | | Liability Derivatives | |
| | Consolidated Statement of Assets and Liabilities Location | Value | Consolidated Statement of Assets and Liabilities Location | Value |
| Over the counter swaps | | | | |
| Equity risk | Over the counter swap contracts, at value(1) | | Over the counter swap contracts, at
value(1) | |
| | $1,614,569 | $(1,573,482) |
| Forward contracts | | | | |
| Foreign currency risk | Receivable for forward foreign currency contracts | | Payable for forward foreign currency contracts | |
| | 1,570,190 | (1,498,040) |
| Futures | | | | |
| Interest rate risk | Receivable/Payable for variation margin on futures contracts(2) | | Receivable/Payable for variation margin on futures contracts(2) | |
| | 305,941 | (15,560) |
| Foreign currency risk | Receivable/Payable for variation margin on futures contracts(2) | | Receivable/Payable for variation margin on futures contracts(2) | |
| | 614,469 | (4,436) |
| Equity risk | Receivable/Payable for variation margin on futures contracts(2) | | Receivable/Payable for variation margin on futures contracts(2) | |
| | 78,306 | (7,902) |
| Commodity risk | Receivable/Payable for variation margin on futures contracts(2) | | Receivable/Payable for variation margin on futures contracts(2) | |
| | 88,628 | (68,078) |
| Total Futures | | 1,087,344 | | (95,976) |
| Options purchased | | | | |
| Equity risk | Investments in securities, at value | 70 | Investments in securities, at value | – |
| Options written | | | | |
| Equity risk | Option contracts written, at value | – | Option contracts written, at value | (140) |
(1)
| “Over the counter swaps” reflects the cumulative unrealized appreciation/(depreciation) of the over the counter swap contracts plus accrued interest as of April 30, 2024. |
| | |
(2)
| “Futures” reflects the cumulative unrealized appreciation/(depreciation) of futures as of April 30, 2024, which is reflected in the Consolidated Statement of Assets and Liabilities under the caption “Total distributable earnings/(losses).” The current day’s variation margin as of April 30, 2024, if any, is reflected in the Consolidated Statement of Assets and Liabilities under the caption “Receivable/Payable for variation margin on futures contracts.” |
| | The impact of the use of these derivative instruments on the Consolidated Statement of Operations during the six months ended April 30, 2024, was as follows: |
| | | Net Realized Gain/ (Loss) on Derivatives(1) | | | Change in Net Unrealized Appreciation/ (Depreciation) on Derivatives(2) | |
| Over the counter swaps | | | | | | |
| Equity risk | |
| $(156,067 | ) | |
| $1,133,227 | |
| Futures | | | | | | | | |
| Interest rate risk | | | (1,065,895 | ) | | | (99,551 | ) |
| Foreign currency risk | | | (332,082 | ) | | | 207,185 | |
| Equity risk | | | (84,949 | ) | | | (149,313 | ) |
| Commodity risk | | | 920,624 | | | | (61,282 | ) |
| Total Futures | | | (562,302 | ) | | | (102,961 | ) |
| Forward contracts | | | | | | | | |
| Foreign currency risk | | | (1,158,345 | ) | | | (146,703 | ) |
| Options purchased | | | | | | | | |
| Equity risk | | | – | | | | (318 | ) |
| Options written | | | | | | | | |
| Equity risk | | | 1,919 | | | | (130 | ) |
(1)
| Net realized gain/(loss) on derivatives is located in the Consolidated Statement of Operations each under the caption, "Net realized gain/(loss) on:" |
| | | |
| | Forward contracts | Settlement of forward foreign currency contracts |
| | Futures | Expiration or closing of futures contracts |
| | Swaps | Expiration or closing of swap contracts |
| | Options purchased | Transactions in investment securities of unaffiliated issuers |
| | Options written | Expiration or closing of option contracts written |
| | | |
(2)
| Change in net unrealized appreciation/(depreciation) is located in the Consolidated Statement of Operations each under the caption, "Change in net unrealized appreciation/(depreciation) in value of:" |
| | | |
| | Forward contracts | Forward foreign currency contracts |
| | Futures | Future contracts
|
| | Swaps | Swap contracts |
| | Options purchased | Investment securities of unaffiliated issuers |
| | Options written | Option contracts written |
| | |
| While the Fund may receive rights and warrants in connection with its investments in securities, these rights and warrants are not considered “derivative instruments” under ASC 815. |
| | |
15
| Offsetting assets and liabilities: The Fund is required to disclose both gross and net information for assets and liabilities related to over the counter derivatives, repurchase and reverse repurchase agreements, and securities lending and securities borrowing transactions that are eligible for offset or subject to an enforceable master netting or similar agreement. The Fund’s over the counter derivative assets and liabilities at fair value by type are reported gross in the Consolidated Statement of Assets and Liabilities. The following tables present the Fund’s derivative assets and liabilities by counterparty, net of amounts available for offset under a master netting or similar agreement and net of the related collateral received by the Fund for assets and pledged by the Fund for liabilities as of April 30, 2024. |
| Description | Gross Amounts of
Assets Presented in the Consolidated Statement of Assets and Liabilities | Gross Amounts of Liabilities Presented in the Consolidated Statement of Assets and Liabilities |
Over the counter swap contracts
| $1,614,569 | $(1,573,482) |
| Forward contracts | 1,570,190 | (1,498,040) |
| Total | $3,184,759 | $(3,071,522) |
Gross Amounts Not Offset in the Consolidated Statement of Assets and Liabilities: |
|
| Assets
| | | | Liabilities
|
| Counterparty | Gross Amounts Presented in the Consolidated Statement of Assets and Liabilities | Liabilities Available for Offset | Collateral Received(a) | Net Amount(b) | Gross Amounts Presented in the Consolidated Statement of Assets and Liabilities | Assets Available for Offset | | |
SG
| $1,565,403 | $(1,487,965) | $– | $77,438 | $(1,487,965) | $1,487,965 | $– | $– |
JPM
| 242,687 | (192,461) | – | 50,226 | (192,461) | 192,461 | – | – |
MS
| 1,376,669 | 1,376,669) | – | – | (1,391,096) | 1,376,669 | 14,427 | – |
Total
| $3,184,759 | $(3,057,095) | $– | $127,664 | $(3,071,522) | $3,057,095 | $14,427 | $– |
(a)
| Collateral received (or pledged) is limited to an amount not to exceed 100% of the net amount of assets (or liabilities) in the tables presented above, for each respective counterparty. |
| | |
(b)
| A net amount greater than zero represents amounts subject to loss as of April 30, 2024, in the event of a counterparty failure. A net amount less than zero represents amounts under-collateralized to each counterparty as of April 30, 2024.
|
| | |
16
| Indemnifications: Like many other companies, the Trust’s organizational documents provide that its officers (“Officers”) and trustees (“Trustees”) are indemnified against certain liabilities arising out of the performance of their duties to the Trust. In addition, both in some of its principal service contracts and in the normal course of its business, the Trust enters into contracts that provide indemnifications to other parties for certain types of losses or liabilities. The Trust’s maximum exposure under these arrangements is unknown as this could involve future claims against the Trust or the Fund. |
| | |
17
| Expense offset arrangement: The Fund has an expense offset arrangement in connection with its custodian contract. For the six months ended April 30, 2024, the impact of this arrangement was a reduction in expenses of $38. |
| | |
18
| Other: All net investment income and realized and unrealized capital gains and losses of the Fund are allocated, on the basis of relative net assets, pro rata among its respective classes. |
Note B—Investment Management Fees, Administration Fees, Distribution Arrangements, and Other Transactions with Affiliates:
| | The Fund retains NBIA as its investment manager under a Management Agreement. For such investment management services, the Fund pays NBIA an investment management fee at the annual rate of 1.700% of the first $250 million of the Fund’s average daily net assets, 1.675% of the next $250 million, 1.650% of the next $250 million, 1.625% of the next $250 million, 1.600% of the next $500 million, 1.575% of the next $2.5 billion, and 1.550% of average daily net assets in excess of $4 billion.
NBIA has contractually agreed to waive its Class E management fee for the Fund. This undertaking lasts until October 31, 2025 and may not be terminated during its term without the consent of the Board. Management fees contractually waived pursuant to this waiver for Class E are not subject to recovery by NBIA. For the six months ended April 30, 2024, the total amount of management fees waived was $19,811, which is equivalent to an annualized percentage rate of 1.70% of Class E’s average daily net assets. Accordingly, for the six months ended April 30, 2024, the investment management fee pursuant to |
| | the Management Agreement was equivalent to an annual net effective rate of 1.70% of the Fund’s average daily net assets.
The Fund retains NBIA as its administrator under an Administration Agreement. The administration fee is assessed at the Class level and each share class of the Fund, as applicable, pays NBIA an annual administration fee equal to the following: 0.15% for Institutional Class; 0.26% for each of Class A and Class C; 0.05% for Class R6, each as a percentage of its average daily net assets. Class E shares do not pay an administration fee. Additionally, NBIA retains JPM as its sub-administrator under a Sub-Administration Agreement. NBIA pays JPM a fee for all services received under the Sub-Administration Agreement.
NBIA has contractually agreed to waive fees and/or reimburse certain expenses of the Institutional Class, Class A, Class C and Class R6 so that the total annual operating expenses of those classes do not exceed the expense limitations as detailed in the following table. These undertakings exclude interest, brokerage commissions, acquired fund fees and expenses, extraordinary expenses, taxes, including any expenses related to tax reclaims, and dividend and interest expenses relating to short sales, if any (commitment fees relating to borrowings are treated as interest for purposes of this exclusion) ("annual operating expenses"); consequently, net expenses may exceed the contractual expense limitations. The expenses of the Subsidiary are included in the total expenses used to calculate the reimbursement, which the Fund has agreed to share with the Subsidiary. For the six months ended April 30, 2024, these Subsidiary expenses amounted to $79,028.
At April 30, 2024, the Fund’s contingent liabilities to NBIA under the agreements were as follows: |
| | | Expenses Reimbursed In the Year Ended October 31, |
| | |
| 2021 | 2022
| 2023 | 2024 |
| | Subject to Repayment until October 31,
|
| | Contractual Expense Limitation(1) | Expiration | 2024 | 2025 | 2026 | 2027 |
| Institutional Class | 1.97% | 10/31/27 | $522,331 | $466,613 | $590,513 | $271,076 |
| Class A | 2.33% | 10/31/27 | 52,624 | 50,562 | 39,409 | 19,708 |
| Class C | 3.08% | 10/31/27 | 29,872 | 19,300 | 13,600 | 6,603 |
| Class R6 | 1.87% | 10/31/27 | 20,018 | 31,554 | 1,357 | 435 |
(1)
| Expense limitation per annum of the respective class' average daily net assets. |
| | |
| | The Fund has agreed that each of its respective classes will repay NBIA for fees and expenses waived or reimbursed for that class provided that repayment does not cause that class's annual operating expenses to exceed its contractual expense limitation in place at the time the fees and expenses were waived or reimbursed, or the expense limitation in place at the time the Fund repays NBIA, whichever is lower. Any such repayment must be made within three years after the year in which NBIA incurred the expense.
During the six months ended April 30, 2024, there was no repayment to NBIA under these agreements.
At April 30, 2024, NBIA engaged BH-DG Systematic Trading LLP, Crabel Capital Management, LLC, GAMCO Asset Management Inc., P/E Global, LLC and Portland Hill Asset Management Limited as subadvisers of the Fund to provide investment advisory services. NBIA compensates the subadvisers out of the investment management fees it receives from the Fund.
The Fund also has a distribution agreement with Neuberger Berman BD LLC (the “Distributor”) with respect to each class of shares. The Distributor acts as agent in arranging for the sale of class shares without sales commission or other compensation, except as described below for Class A and Class C shares, and bears the advertising and promotion expenses.
However, the Distributor receives fees from Class A and Class C under their distribution plans (each a “Plan”, collectively, the “Plans”) pursuant to Rule 12b-1 under the 1940 Act. The Plans provide that, as compensation for administrative and other services provided to these classes, the Distributor’s activities and expenses related to the sale and distribution of these classes, and ongoing services provided to |
| | investors in these classes, the Distributor receives from each of these classes a fee at the annual rate of 0.25% of Class A’s and 1.00% of Class C’s average daily net assets. The Distributor receives this amount to provide distribution and shareholder servicing for these classes and pays a portion of it to institutions that provide such services. Those institutions may use the payments for, among other purposes, compensating employees engaged in sales and/or shareholder servicing. The amount of fees paid by each class during any year may be more or less than the cost of distribution and other services provided to that class. FINRA rules limit the amount of annual distribution fees that may be paid by a mutual fund and impose a ceiling on the cumulative distribution fees paid. The Trust’s Plans comply with those rules.
Class A shares of the Fund are generally sold with an initial sales charge of up to 5.75% and no contingent deferred sales charge (“CDSC”), except that a CDSC of 1.00% applies to certain redemptions made within 18 months following purchases of $1 million or more without an initial sales charge. Class C shares of the Fund are sold with no initial sales charge and a 1.00% CDSC if shares are sold within one year after purchase.
For the six months ended April 30, 2024, the Distributor, acting as underwriter and broker-dealer, received net initial sales charges from the purchase of Class A shares and CDSCs from the redemption of Class A and Class C shares as follows: |
| | Underwriter
| Broker-Dealer
|
| | Net Initial
Sales Charge
| CDSC
| Net Initial
Sales Charge
| CDSC
|
Class A
| $742 | $— | $— | $— |
Class C
| — | 416
| — | — |
Note C—Securities Transactions:
| | During the six months ended April 30, 2024, there were purchase and sale transactions of long-term securities (excluding swaps, forward contracts, futures and written option contracts) as follows: |
Purchases | Securities Sold Short | Sales and Maturities | Covers on Securities Sold Short |
| | | | |
| $33,489,335 | $4,198,088 | $37,793,819 | $3,897,668 |
| | During the six months ended April 30, 2024, and October 31, 2023, no brokerage commissions on securities transactions were paid to affiliated brokers. |
Note D—Fund Share Transactions:
| | Share activity for the years ended April 30, 2024, and October 31, 2023, and October 31, 2022, was as follows: |
For the Six Months Ended April 30, 2024 | For the Year Ended October 31, 2023 |
| | Shares Sold | Shares Issued on Reinvestment of Dividends and Distributions | Shares Redeemed | Total | Shares Sold | Shares Issued on Reinvestment of Dividends and Distributions | Shares Redeemed | Total |
Institutional Class | 499,065 | 80,528 | (3,175,181) | (2,595,588) | 7,940,939 | 310,502 | (9,179,382) | (927,941) |
| Class A | 25,964 | 3,340 | (110,173) | (80,869) | 156,261 | 15,341 | (221,872) | (50,270) |
| Class C | 17,371 | — | (49,927) | (32,556) | 62,487 | 4,002 | (101,658) | (35,169) |
| Class R6 | 96 | 94 | (2,690) | (2,500) | 12,285 | — | (333,280) | (320,995) |
| Class E | 28,371 | 4,161 | (45,526) | (12,994) | 82,253 | 7,285 | (74,477) | 15,061 |
| Other: At April 30, 2024, there were no affiliated persons, as defined in the 1940 Act, owning the Fund’s outstanding shares. |
Note E—Line of Credit:
| | At April 30, 2024, the Fund was a participant in a syndicated committed, unsecured $700,000,000 line of credit (the “Credit Facility”), to be used only for temporary or emergency purposes. Series of other investment companies managed by NBIA also participate in this line of credit on substantially the same terms. Interest is charged on borrowings under the Credit Facility at the highest of (a) a federal funds effective rate plus 1.00% per annum, (b) a daily simple Secured Overnight Financing Rate (“SOFR”) plus 1.10% per annum, or (c) an overnight bank funding rate plus 1.00% per annum. The Credit Facility has an annual commitment fee of 0.15% per annum of the available line of credit, which is paid quarterly. The Fund has agreed to pay its pro rata share of the annual commitment fee, based on the ratio of its individual net assets to the net assets of all participants at the time the fee is due, and interest charged on any borrowing made by the Fund and other costs incurred by the Fund. Because several funds participate in the Credit Facility, there is no assurance that the Fund will have access to all or any part of the $700,000,000 at any particular time. There were no loans outstanding for the Fund under the Credit Facility at April 30, 2024. During the six months ended April 30, 2024, the Fund did not utilize the Credit Facility. |
Note F—Recent Accounting Pronouncement:
| | In June 2022, FASB issued Accounting Standards Update No. 2022-03, “Fair Value Measurement of Equity Securities Subject to Contractual Sale Restrictions” (“ASU 2022-03”). ASU 2022-03 clarifies the guidance in ASC 820, related to the measurement of the fair value of an equity security subject to contractual sale restrictions, where it eliminates the ability to apply a discount to the fair value of these securities, and introduces disclosure requirements related to such equity securities. The guidance is effective for fiscal years, and interim periods within those fiscal years, beginning after December 15, 2023, and allows for early adoption. Management is currently evaluating the impact of applying this update.
In December 2022, the FASB issued Accounting Standards Update No. 2022-06, “Reference Rate Reform (Topic 848)” (“ASU 2022-06”), which is an update to Accounting Standards Update No. 2021- 01, “Reference Rate Reform (Topic 848)” (“ASU 2021-01”) and defers the sunset date for applying the reference rate reform relief in Topic 848. ASU 2021-01 is an update of ASU 2020-04, which is in response to concerns about structural risks of interbank offered rates, and particularly the risk of cessation of LIBOR. Regulators have undertaken reference rate reform initiatives to identify alternative reference rates that are more observable or transaction based and less susceptible to manipulation. ASU 2020-04 provides optional guidance for a limited period of time to ease the potential burden in accounting for (or recognizing the effects of) reference rate reform on financial reporting. ASU 2020-04 is elective and applies to all entities, subject to meeting certain criteria, that have contracts, hedging relationships, and other transactions that reference LIBOR or another reference rate expected to be discontinued because of reference rate reform. The ASU 2021-01 update clarifies that certain optional expedients and exceptions in Topic 848 for contract modifications and hedge accounting apply to derivatives that are affected by the discounting transition. The amendments in this update are effective immediately through December 31, 2024, for all entities. Management does not expect ASU 2022-06 to have a material impact on the Fund’s consolidated financial statements. |
Note G—Subsequent Event:
| | The financial information included in this interim report is taken from the records of the Fund without audit by an independent registered public accounting firm. Annual reports contain audited financial statements. |
Consolidated Financial Highlights
Absolute Return Multi-Manager Fund
The following tables include selected data for a share outstanding throughout each period and other performance information derived from the Consolidated Financial Statements. Amounts that do not round to $0.01 or $(0.01) per share are presented as $0.00 or $(0.00), respectively. Ratios that do not round to 0.01% or (0.01)% are presented as 0.00% or (0.00)%, respectively. Net Assets with a zero balance, if any, may reflect actual amounts rounding to less than $0.1 million. A “—” indicates that the line item was not applicable in the corresponding period.
| | Net Asset Value, Beginning of Period | Net Investment Income/ (Loss)@ | Net Gains or Losses on Securities (both realized and unrealized) | Total From Investment Operations | Dividends from Net Investment Income | Distributions from Net Realized Capital Gains | Total Distributions |
| Institutional Class | | | | | | | |
| 04/30/2024 (Unaudited) | $11.68 | $0.14 | $0.23 | $0.37 | $(0.11) | $— | $(0.11) |
| 10/31/2023 | $11.87 | $0.19 | $(0.07) | $0.12 | $(0.31) | $— | $(0.31) |
| 10/31/2022 | $11.40 | $(0.11) | $0.60 | $0.49 | $(0.02) | $— | $(0.02) |
| 10/31/2021 | $10.80 | $(0.13) | $0.92 | $0.79 | $(0.19) | $— | $(0.19) |
| 10/31/2020 | $10.97 | $0.01 | $0.21 | $0.22 | $(0.39) | $— | $(0.39) |
| 10/31/2019 | $10.71 | $0.08 | $0.19 | $0.27 | $(0.01) | $— | $(0.01) |
| | | | | | | | |
| Class A | | | | | | | |
| 04/30/2024 (Unaudited) | $11.43 | $0.12 | $0.22 | $0.34 | $(0.07) | $— | $(0.07) |
| 10/31/2023 | $11.62 | $0.15 | $(0.07) | $0.08 | $(0.27) | $— | $(0.27) |
| 10/31/2022 | $11.19 | $(0.15) | $0.58 | $0.43 | $— | $— | $— |
| 10/31/2021 | $10.60 | $(0.18) | $0.92 | $0.74 | $(0.15) | $— | $(0.15) |
| 10/31/2020 | $10.78 | $(0.03) | $0.20 | $0.17 | $(0.35) | $— | $(0.35) |
| 10/31/2019 | $10.55 | $0.04 | $0.19 | $0.23 | $— | $— | $— |
| | | | | | | | |
| Class C | | | | | | | |
| 04/30/2024 (Unaudited) | $10.71 | $0.07 | $0.21 | $0.28 | $— | $— | $— |
| 10/31/2023 | $10.90 | $0.06 | $(0.06) | $— | $(0.19) | $— | $(0.19) |
| 10/31/2022 | $10.58 | $(0.23) | $0.55 | $0.32 | $— | $— | $— |
| 10/31/2021 | $10.03 | $(0.23) | $0.85 | $0.62 | $(0.07) | $— | $(0.07) |
| 10/31/2020 | $10.20 | $(0.10) | $0.20 | $0.10 | $(0.27) | $— | $(0.27) |
| 10/31/2019 | $10.06 | $(0.03) | $0.17 | $0.14 | $— | $— | $— |
| | | | | | | | |
| Class R6 | | | | | | | |
| 04/30/2024 (Unaudited) | $11.68 | $0.15 | $0.23 | $0.38 | $(0.12) | $— | $(0.12) |
| 10/31/2023 | $11.88 | $0.15 | $(0.02) | $0.13 | $(0.33) | $— | $(0.33) |
| 10/31/2022 | $11.41 | $(0.11) | $0.61 | $0.50 | $(0.03) | $— | $(0.03) |
| 10/31/2021 | $10.81 | $(0.14) | $0.94 | $0.80 | $(0.20) | $— | $(0.20) |
| 10/31/2020 | $10.98 | $0.01 | $0.21 | $0.22 | $(0.39) | $— | $(0.39) |
| 10/31/2019 | $10.71 | $0.09 | $0.19 | $0.28 | $(0.01) | $— | $(0.01) |
| | | | | | | | |
| Class E | | | | | | | |
| 04/30/2024 (Unaudited) | $11.82 | $0.22 | $0.23 | $0.45 | $(0.24) | $— | $(0.24) |
| 10/31/2023 | $11.97 | $0.36 | $(0.07) | $0.29 | $(0.44) | $— | $(0.44) |
| Period from 01/11/2022^ to 10/31/2022 | $11.17 | $(0.01) | $0.81 | $0.80 | $— | $— | $— |
See Notes to Consolidated Financial Highlights
Net Asset Value, End of Period | Total Return†d | Net Assets, End of Period (in millions) | Ratio of Gross Expenses to Average Net Assets# | Ratio of Gross Expenses to Average Net Assets (excluding dividend and interest expense relating to short sales)# | Ratio of Net Expenses to Average Net AssetsØ | Ratio
of Net
Expenses to Average Net Assets (excluding dividend and interest expense relating to short sales)Ø | Ratio of Net Investment Income/ (Loss) to Average Net Assets | Portfolio Turnover Rate (including securities sold short) | Portfolio
Turnover
Rate
(excluding securities
sold short) |
| | | | | | | | | | |
| $11.94 | 3.18%* | $82.6 | 2.37%** | 2.53%** | 1.81%** | 1.97%** | 2.42%** | 73%* | 73%* |
| $11.68 | 1.12% | $111.1 | 2.45% | 2.46% | 1.97% | 1.97% | 1.66% | 201% | 178% |
| $11.87 | 4.30% | $124.0 | 2.93% | 2.67% | 2.24% | 1.98% | (0.97)% | 204% | 204% |
| $11.40 | 7.40% | $61.4 | 2.94% | 2.74% | 2.17% | 1.97% | (1.16)% | 296% | 308% |
| $10.80 | 2.01% | $84.5 | 2.69% | 2.54% | 2.12% | 1.97% | 0.10% | 230% | 219% |
| $10.97 | 2.48% | $157.6 | 2.59% | 2.27% | 2.30% | 1.98% | 0.77% | 248% | 246% |
| | | | | | | | | | |
| $11.70 | 2.98%* | $6.9 | 2.67%** | 2.87%** | 2.13%** | 2.33%** | 2.06%** | 73%* | 73%* |
| $11.43 | 0.79% | $7.6 | 2.81% | 2.82% | 2.33% | 2.33% | 1.32% | 201% | 178% |
| $11.62 | 3.84% | $8.3 | 3.29% | 3.02% | 2.58% | 2.31% | (1.37)% | 204% | 204% |
| $11.19 | 7.07% | $6.9 | 3.32% | 3.11% | 2.54% | 2.33% | (1.60)% | 296% | 308% |
| $10.60 | 1.58% | $6.6 | 3.22% | 3.08% | 2.47% | 2.33% | (0.32)% | 230% | 219% |
| $10.78 | 2.18% | $7.3 | 2.98% | 2.65% | 2.67% | 2.33% | 0.40% | 248% | 246% |
| | | | | | | | | | |
| $10.99 | 2.61%* | $2.1 | 3.47%** | 3.67%** | 2.88%** | 3.08%** | 1.31%** | 73%* | 73%* |
| $10.71 | 0.01% | $2.4 | 3.59% | 3.59% | 3.08% | 3.08% | 0.57% | 201% | 178% |
| $10.90 | 3.02% | $2.8 | 4.08% | 3.82% | 3.35% | 3.08% | (2.16)% | 204% | 204% |
| $10.58 | 6.23% | $3.0 | 4.07% | 3.87% | 3.29% | 3.08% | (2.24)% | 296% | 308% |
| $10.03 | 0.96% | $4.7 | 3.82% | 3.67% | 3.23% | 3.08% | (0.98)% | 230% | 219% |
| $10.20 | 1.39% | $7.7 | 3.71% | 3.39% | 3.40% | 3.09% | (0.33)% | 248% | 246% |
| | | | | | | | | | |
| $11.94 | 3.28%* | $0.1 | 2.33%** | 2.53%** | 1.67%** | 1.87%** | 2.51%** | 73%* | 73%* |
| $11.68 | 1.13% | $0.1 | 2.64% | 2.33% | 2.19% | 1.87% | 1.27% | 201% | 178% |
| $11.88 | 4.40% | $4.0 | 2.86% | 2.59% | 2.14% | 1.87% | (1.00)% | 204% | 204% |
| $11.41 | 7.50% | $3.6 | 2.87% | 2.66% | 2.07% | 1.87% | (1.27)% | 296% | 308% |
| $10.81 | 2.10% | $1.6 | 2.59% | 2.45% | 2.01% | 1.87% | 0.07% | 230% | 219% |
| $10.98 | 2.64% | $1.4 | 2.55% | 2.21% | 2.22% | 1.88% | 0.84% | 248% | 246% |
| | | | | | | | | | |
| $12.03 | 3.88%* | $2.3 | 2.18%** | 2.38%** | 0.48%** | 0.68%** | 3.71%** | 73%* | 73%* |
| $11.82 | 2.53% | $2.4 | 2.31% | 2.31% | 0.60% | 0.61% | 3.07% | 201% | 178% |
| | | | | | | | | | |
| $11.97 | 7.16%* | $2.2 | 2.99%** | 2.66%** | 1.29%** | 0.96%** | (0.12)%** | 204%*ØØ | 204%*ØØ |
Notes to Consolidated Financial Highlights Absolute Return Multi-Manager Fund (Unaudited)
| @ | Calculated based on the average number of shares outstanding during each fiscal period. |
| | |
| † | Total return based on per share NAV reflects the effects of changes in NAV on the performance of the Fund during each fiscal period. Returns assume income dividends and other distributions, if any, were reinvested, but do not reflect the effect of sales charges. Results represent past performance and do not indicate future results. Current returns may be lower or higher than the performance data quoted. Investment returns and principal will fluctuate and shares, when redeemed, may be worth more or less than original cost. Total return would have been lower if Management had not reimbursed and/ or waived certain expenses. Total return would have been higher if Management had not recouped previously reimbursed and/or waived expenses. |
| | |
| d | The class action proceeds listed in Note A of the Notes to Consolidated Financial Statements had no impact on the Fund's total return for the six months ended April 30, 2024. Had the Fund not received class action proceeds in 2021, the total returns based on per share NAV for the year ended October 31, 2021 would have been: |
| | Institutional Class | 6.84% |
| | Class A
| 6.59% |
| | Class C
| 5.63% |
| | Class R6
| 7.13% |
| | The class action proceeds received in 2023, 2022, 2020, and 2019 had no impact on the Fund's total returns for the years ended October 31, 2023, 2022, 2020, and 2019.
|
| | |
| # | Represents the annualized ratios of net expenses to average daily net assets if Management had not reimbursed certain expenses and/or waived a portion of the investment management fee. |
| | |
*
| Not annualized. |
| | |
**
| Annualized. |
| | |
| ^ | The date investment operations commenced. |
| Ø | After reimbursement of expenses and/or waiver of a portion of the investment management fee by Management. The Fund is required to calculate an expense ratio without taking into consideration any expense reductions related to expense offset arrangements (see Note A in the Notes to Consolidated Financial Statements). Had the Fund not received expense reductions related to expense offset arrangements, the annualized ratios of net expenses to average daily net assets would have been: |
| Institutional Class | Class A | Class C | Class R6 | Class E |
Including dividend and interest expense relating to short sales | | | | | |
Six Months Ended April 30, 2024 (Unaudited) | 1.81% | 2.13% | 2.88% | 1.67% | 0.48% |
| Year Ended October 31, 2023 | 1.97% | 2.33% | 3.08% | 2.19% | 0.60% |
| Year Ended October 31, 2022 | 2.24% | 2.58% | 3.35% | 2.14% | 1.29%(a) |
| Year Ended October 31, 2021 | 2.17% | 2.54% | 3.29% | 2.07% | –% |
| Year Ended October 31, 2020 | 2.12% | 2.47% | 3.23% | 2.01% | –% |
| Year Ended October 31, 2019 | 2.30% | 2.67% | 3.40% | 2.22% | –% |
Excluding dividend and interest expense relating to short sales | | | | | |
Six Months Ended April 30, 2024 (Unaudited) | 1.97% | 2.33% | 3.08% | 1.87% | 0.68% |
| Year Ended October 31, 2023 | 1.97% | 2.33% | 3.08% | 1.87% | 0.61% |
| Year Ended October 31, 2022 | 1.98% | 2.31% | 3.08% | 1.87% | 0.96%(a) |
| Year Ended October 31, 2021 | 1.97% | 2.33% | 3.08% | 1.87% | –% |
| Year Ended October 31, 2020 | 1.97% | 2.33% | 3.08% | 1.87% | –% |
| Year Ended October 31, 2019 | 1.98% | 2.33% | 3.09% | 1.88% | –% |
| | (a) Period from January 11, 2022 (Commencement of Operations) to October 31, 2022. |
| | |
| ØØ | Portfolio turnover is calculated at the Fund level. Percentage indicated was calculated for the year ended October 31, 2022 for the Fund. |
Investment Manager and Administrator Neuberger Berman Investment Advisers LLC 1290 Avenue of the Americas New York, NY 10104-0002 Shareholder Services 800.877.9700 or 212.476.8800 Intermediary Client Services 800.366.6264
Distributor Neuberger Berman BD LLC 1290 Avenue of the Americas New York, NY 10104-0002 Shareholder Services 800.877.9700 or 212.476.8800 Intermediary Client Services 800.366.6264
Subadvisers BH-DG Systematic Trading LLP 55 Baker Street London W1U 7EU, United Kingdom
Crabel Capital Management, LLC 1999 Avenue of the Stars Suite 2550 Los Angeles, CA 90067
GAMCO Asset Management Inc. One Corporate Center Rye, NY 10580
P/E Global, LLC 75 State Street, 31st Floor Boston, MA 02109
Portland Hill Asset Management Limited 21 Knightsbridge London SW1X7LY, United Kingdom
| CustodianJPMorgan Chase & Co. 4 Chase Metrotech Center Brooklyn, NY 11245
Shareholder Servicing Agent SS&C Global Investor & Distribution Solutions, Inc. 430 West 7th Street, Suite 219189 Kansas City, MO 64105-1407
For Institutional Class Shareholders address correspondence to: Neuberger Berman Funds PO Box 219189 Kansas City, MO 64121-9189 Intermediary Client Services 800.366.6264
For Class A, Class C and Class R6 Shareholders: Please contact your investment provider
Legal Counsel K&L Gates LLP 1601 K Street, NW Washington, DC 20006-1600
Independent Registered Public Accounting Firm Ernst & Young LLP 200 Clarendon Street Boston, MA 02116 |
| |
| |
Proxy Voting Policies and Procedures
A description of the policies and procedures that the Trust uses to determine how to vote proxies relating to portfolio securities is available, without charge, by calling 800-877-9700 (toll-free) and on the SEC’s website at www.sec.gov Information regarding how the Trust voted proxies relating to portfolio securities during the most recent 12-month period ended June 30 is also available upon request, without charge, by calling 800-877-9700 (toll-free), on the SEC’s website at www.sec.gov and on Neuberger Berman’s website at www.nb.com.
Quarterly Portfolio Schedule
The Trust files a complete schedule of portfolio holdings for the Fund with the SEC for the first and third quarters of each fiscal year as an exhibit to its report on Form N-PORT. The Trust’s Form N-PORT is available on the SEC’s website at www.sec.gov. The portfolio holdings information on Form N-PORT is available upon request, without charge, by calling 800-877-9700 (toll-free).
Board Consideration of Additional Sub-Advisory Agreement: Crabel Capital Management, LLC
At meetings held on December 13-14, 2023, the Board of Trustees (the “Board”), of Neuberger Berman Alternative Funds (the “Trust”), including the Trustees who are not “interested persons” of the Trust or of Neuberger Berman Investment Advisers LLC (the “Manager”) (including its affiliates) (“Independent Trustees”), considered and approved a sub-advisory agreement with respect to Neuberger Berman Absolute Return Multi- Manager Fund (the “Fund”) between the Manager and Crabel Capital Management, LLC (“Crabel”) (the “Sub-Advisory Agreement”), which will be responsible for managing a portion of the assets of the Fund. The Independent Trustees were advised by counsel that is experienced in 1940 Act matters and that is independent of the Manager (“Independent Counsel”).
In evaluating the Sub-Advisory Agreement, the Board, including the Independent Trustees, reviewed materials furnished by Crabel in response to questions submitted by the Manager, the Independent Trustees and Independent Counsel, and met with senior representatives of the Manager regarding Crabel’s personnel, operations, compliance program and financial condition as they relate to the Fund.
The Board noted that the Manager and the Fund had obtained from the SEC an exemptive order that permitted the Manager to add or replace subadvisers to the Fund without a shareholder vote, provided the Independent Trustees approve the new subadviser and certain other steps are taken and that the Manager, pursuant to its agreement with the Fund and related subadviser oversight policies and procedures approved by the Board, is responsible for overseeing Crabel.
Provided below is a description of the Board’s contract approval process and the material factors that the Board considered at its meeting regarding the approval of the Sub-Advisory Agreement and the compensation to be paid thereunder. In connection with its approval of the Sub-Advisory Agreement, the Board evaluated the terms of the Sub-Advisory Agreement, the overall fairness of the Sub-Advisory Agreement to the Fund and whether the Sub-Advisory Agreement was in the best interests of the Fund and Fund shareholders. The Board’s determination to approve the Sub-Advisory Agreement was based on a comprehensive consideration of all information provided to the Board. This description is not intended to include all of the factors considered by the Board. In their deliberations, the Board members did not identify any particular information or factor that was all-important or controlling, and each Trustee may have attributed different weights to the various factors. The Board focused on the potential costs and benefits of the Sub-Advisory Agreement to the Fund and, through the Fund, its shareholders.
With respect to the nature, extent and quality of the services provided, the Board considered the investment philosophy and decision-making processes of, and the qualifications, experience, and capabilities of, and the resources available to, the portfolio management personnel of the Additional Sub-Adviser who would perform services for the Fund. The Board reviewed the performance for accounts managed by Crabel that were substantially similar in strategy to the strategy Crabel will use for the Fund, noting that the accounts may not be subject to the same investment guidelines or 1940 Act restrictions as the Fund. The Board considered the policies and practices regarding brokerage and allocation of portfolio transactions of Crabel and noted that the Manager would monitor the quality of the execution services provided by Crabel.
The Board also considered Crabel’s compliance history, as well as the scope of its compliance program, including the Fund’s Chief Compliance Officer’s and the Manager’s assessment of the program. The Board also considered whether there were any pending lawsuits, enforcement proceedings or regulatory investigations involving Crabel, and reviewed information regarding its financial condition, history of operations and any conflicts of interest in managing the Fund.
With respect to the overall fairness of the Sub-Advisory Agreement, the Board had previously considered the Fund’s fee structure as compared to a peer group of comparable funds and any fall-out (i.e. indirect) benefits likely to accrue to the Manager or its affiliates. The Manager indicated that similar comparative information was not available with respect to the amount paid to Crabel. The Board did, however, consider an estimate of the costs of the services to be provided and estimated profit or loss that would be realized by the Manager as a result of adding Crabel. The Board also considered the fees Crabel charges for products with investment objectives, and strategies that are similar to those of the Fund. The Board did not give substantial weight to the
estimated profitability data from Crabel because the Board did not view this data as being a key factor to its deliberations given the arm’s-length nature of the relationship between the Manager and Crabel with respect to the negotiation of subadvisory fee rate. To test its assumption of an arm’s-length fee rate, the Board requested from the Manager information about any other business relationships it has with Crabel. In addition, the Board noted that Crabel may not account for its profits on an account-by-account basis and may employ different methodologies in connection with its calculations.
Conclusions as to Additional Sub-Advisory Agreement
In approving the Sub-Advisory Agreement, the Board concluded that, in its business judgment, the terms of the Sub-Advisory Agreement are fair and reasonable and that approval of the Agreement is in the best interests of the Fund and its shareholders. In reaching this determination, the Board considered that Crabel could be expected to provide a high level of service to the Fund; that Crabel’s fees appeared to the Board to be reasonable given the nature, extent and quality of services expected to be provided; and that the expected benefits accruing to Crabel and its affiliates and the Manager and its affiliates by virtue of their relationship with the Fund were reasonable in light of the expected costs of providing the sub-advisory services and the expected benefits accruing to the Fund.
(This page intentionally left blank)
(This page intentionally left blank)
|  |
| |
| Neuberger Berman Investment Advisers LLC 1290 Avenue of the Americas New York, NY 10104–0002 Retail Services: 800.877.9700 Broker-Dealer and Institutional Services: 800.366.6264/888.556.9030 www.nb.com |
| |
| |
| Statistics and projections in this report are derived from sources deemed to be reliable but cannot be regarded as a representation of future results of the Fund. This report is prepared for the general information of shareholders and is not an offer of shares of the Fund. Shares are sold only through the currently effective prospectus which you can obtain by calling 877.628.2583. An investor should consider carefully a Fund’s investment objectives, risks and fees and expenses, which are described in its prospectus, before investing. |
| | |
| | |
| |  N0087 06/24 N0087 06/24 |
Neuberger Berman
Alternative Funds
Institutional Class Shares |
|
|
Semi-Annual Report
April 30, 2024
The Securities and Exchange Commission has adopted new regulations that will result in changes to the design and delivery of annual and semi-annual reports beginning in July 2024.
Unless you have elected to receive shareholder reports and other communications from the Fund electronically, instead of by mail, paper copies of the Fund's new, streamlined shareholder reports will be mailed to you beginning in July 2024. If you would like to receive shareholder reports and other communications from the Fund electronically instead of by mail, you may make that request at any time by contacting your financial intermediary or investment provider (such as an insurance company, broker-dealer or bank) or, if you are a direct investor, by logging into your account at https://www.nb.com/en/us/funds or calling 800.877.9700. If you are a direct investor and have previously elected to receive shareholder reports electronically, you will continue to receive reports electronically and need not take any action.
The "Neuberger Berman" name and logo and "Neuberger Berman Investment Advisers LLC" name are registered service marks of Neuberger Berman Group LLC. The individual Fund name in this piece is either a service mark or registered service mark of Neuberger Berman Investment Advisers LLC, an affiliate of Neuberger Berman BD LLC, distributor, member FINRA. ©2024 Neuberger Berman BD LLC, distributor. All rights reserved.
President’s Letter
Dear Shareholder,
I am pleased to present this semi-annual shareholder report for Neuberger Berman Long Short Fund covering the six-month period ended April 30, 2024 (the reporting period).
Global financial markets overcame several challenges and generated positive results over the reporting period. While inflation moderated, it remained "sticky" and led to changing expectations for monetary policy easing. Investor sentiment was also impacted by tighter credit conditions, wars in Ukraine and the Middle East, and numerous other geopolitical events. Despite these and other factors, the global economy was largely resilient, especially in the U.S. Against this backdrop, the stock and bond markets were volatile at times, but rallied during the reporting period.
When the reporting period began, there were hopes that inflation would continue easing and the U.S. Federal Reserve Board (Fed) would orchestrate a "soft landing" for the economy. There were also indications that the central bank would begin lowering interest rates in 2024. However, with inflation remaining above the Fed’s target, it held the federal funds rate at a range between 5.25%–5.50% throughout the period—the highest level since 2001. In addition, the central bank remained steadfast in its goal of reining in inflation, leading to expectations that rates would remain "higher for longer."
Looking at the stock market, it moved higher over the first five months of the reporting period. Signs that the global economy would avert a recession, hopes for central bank easing, and overall solid corporate results propelled the market higher. A portion of those gains were then given back in April 2024, given the prospect for fewer rate cuts during the year. All told, the MSCI All Country World Index (Net) gained 19.77% during the reporting period. Meanwhile, the S&P 500® Index returned 20.98% and reached several new all-time highs prior to the April setback. Looking at the bond market, short- and long-term Treasury yields moved lower (yields and bond prices generally move in the opposite direction). For the reporting period, the broad taxable investment-grade bond market, as measured by the Bloomberg U.S. Aggregate Bond Index, returned 4.97%.
Market participants have reduced their expectations for the number of interest rate cuts over the course of 2024, as inflation needs to fall further until it reaches central bank targets and there remains some concern among investors that this could remain "sticky" to the upside. The continued conflict in the Middle East has helped drive oil prices higher and may serve to cause a further spike in inflation, while on the other hand, in the U.S., some indicators point to declining economic growth and waning consumer confidence. As always, we continue our efforts to best understand company and portfolio-specific factors as we believe this environment is flush with a confluence of fiscal policy considerations, monetary policy stimulus, public health concerns, geopolitical uncertainty, commodity price volatility, inflation dynamics and sequencing question marks. As market dynamics change, we believe this can cause company market values to dislocate from their long-term potential values, creating a volatile environment with potential opportunities both long and short.
Thank you for your support and trust. We look forward to continuing to serve your investment needs in the years to come.
Sincerely,
Joseph V. Amato
President and CEO
Neuberger Berman Alternative Funds
Long Short Fund Commentary (Unaudited)
Neuberger Berman Long Short Fund Institutional Class generated a 5.28% total return for the six-month period ended April 30, 2024 (the reporting period), underperforming its primary benchmark, the HFRX® Equity Hedge Index (the Index), which returned 7.26% for the same period. (Performance for all share classes is provided in the table immediately following this letter.)
The overall U.S. equity market, as measured by the S&P 500® Index, generated outstanding results during the reporting period. Several factors impacted the market, including a resilient U.S. economy, generally solid corporate profits, “sticky” inflation, changing investor sentiment regarding future U.S. Federal Reserve Board (Fed) monetary policy, and several geopolitical events. Despite periods of volatility, the S&P 500 Index returned 20.98% during the reporting period.
We maintained our constructive yet highly selective outlook during the reporting period. This was reflected in the Fund’s net long and gross exposure during the period. The Fund's largest sector weights were in Information Technology, Consumer Discretionary and Financials during the reporting period.
We categorize the Fund’s long investment exposure into three groups: Capital Growth, Total Return and Opportunistic. Capital Growth continues to represent our largest allocation, followed by Total Return and Opportunistic. We continue to identify compelling opportunities in Capital Growth relative to Opportunistic, as the change catalyst that we look for in companies for the Opportunistic bucket becomes more difficult to execute at this stage of the cycle. The Fund’s short exposure includes both single name “Fundamental" shorts and “Market" shorts. During the reporting period, equity long exposure increased against the backdrop of improved economic conditions and attractive earnings outlook, while Fundamental shorts decreased. Market shorts, which consist primarily of sector, style and market cap-specific indices to help manage broader portfolio exposures, increased during the reporting period.
The Fund’s equity long exposure was additive to performance, while its Fundamental shorts detracted from performance.
The Fund’s aggregate use of futures, swap and option contracts detracted from performance during the reporting period.
Looking ahead, we recognize that while the economy is decelerating, it has been more resilient than many expected. At the same time, progress has been made by the Fed in the fight against inflation, all while economic growth remains strong. Yet, continued declines in existing home sales, weak manufacturing data and some early signs of a softening job market offer a clear indication that the Fed’s tightening cycle is having a real impact to the broader economy. Despite this, the Fed has remained steadfast in its commitment to fighting inflation. While Fed officials have indicated rates are likely at peak, uncertainty remains on how long they will remain at these elevated levels. Until we have more clarity on the path of the economy versus inflation and how that translates into actual rate cuts versus expectations, we anticipate continued market volatility. Furthermore, geopolitical tensions remain ever-present and rising, while political uncertainty may escalate with the advancing presidential campaign in the U.S. So, in the current environment, we believe the divergence in underlying companies’ operating performance will be ever more apparent going forward. As always, we continue our efforts to best understand company and portfolio-specific factors as we believe this environment is flush with a confluence of fiscal policy considerations, monetary policy stimulus, public health concerns, geopolitical uncertainty, commodity price volatility, inflation dynamics and sequencing question marks. As market dynamics change, we believe this can cause company market values to dislocate from their long-term potential values, creating a volatile environment with potential opportunities for both long and short investing.
Sincerely,
Charles Kantor and Marc Regenbaum
Portfolio Managers
Long Short Fund Commentary (Unaudited)
Information about principal risks of investing in the Fund is set forth in the prospectus and statement of additional information.
The portfolio composition, industries and holdings of the Fund are subject to change without notice.
The opinions expressed are those of the Fund’s portfolio managers. The opinions are as of the date of this report and are subject to change without notice.
Long Short Fund (Unaudited)
PORTFOLIO BY INVESTMENT TYPE |
(as a % of Total Net Assets) |
| | |
| | |
| | |
| | |
| | |
Master Limited Partnerships and Limited Partnerships | | |
| | |
Purchased Option Contracts | | |
| | |
Other Assets Less Liabilities* | | |
| | |
| Includes the impact of the Fund’s open positions in derivatives (other than options purchased), if any. |
| | | | |
| | Six Month
Period Ended
04/30/2024 | Average Annual Total Return
Ended 04/30/2024 |
| | | | |
| | | | | | |
| | | | | | |
| | | | | | |
| | | | | | |
| | | | | |
| | | | | | |
| | | | | | |
| | | | | | |
| | | | | |
| | | | | |
The performance data quoted represent past performance and do not indicate future results. Current performance may be lower or higher than the performance data quoted. For current performance data, including current to the most recent month-end, please visit www.nb.com/performance.
The results shown in the table reflect the reinvestment of income dividends and other distributions, if any. The results do not reflect the effect of taxes a shareholder would pay on Fund distributions or on the redemption of Fund shares.
The investment return and principal value of an investment will fluctuate and shares, when redeemed, may be worth more or less than their original cost.
Returns would have been lower if Neuberger Berman Investment Advisers LLC ("NBIA") had not reimbursed certain expenses and/or waived a portion of the investment management fees during certain of the periods shown. Repayment by a class (of expenses previously reimbursed and/or fees previously waived by NBIA) will decrease the class's returns. Please see Note B in the Notes to Consolidated Financial Statements for specific information regarding expense reimbursement and/or fee waiver arrangements.
As stated in the Fund’s most recent prospectus, the total annual operating expense ratios for fiscal year 2023 were 1.30%, 1.67% and 2.42% for Institutional Class, Class A and Class C shares, respectively (before expense reimbursements and/or fee waivers, if any). The expense ratios for the semi-annual period ended April 30, 2024, can be found in the Financial Highlights section of this report.
Returns shown with a sales charge reflect the deduction of the current maximum initial sales charge of 5.75% for Class A shares and the contingent deferred sales charge (CDSC) for Class C shares. The CDSC for Class C shares is 1.00%, which is reduced to 0% after 1 year. The performance of the Fund’s share classes will differ primarily due to different sales charge structures and class expenses. Please see the prospectus for more information about sales charge structures, if any, and class expenses for your share class.
| Please see "Glossary of Indices" on page 6 for a description of indices. Please note that individuals cannot invest directly in any index. The HFRX® Equity Hedge Index does take into account fees and expenses, but not the tax consequences, of investing since it is based on the underlying hedge funds’ net returns. The other indices described in this report do not take into account any fees, expenses or tax consequences of investing in the individual securities that they track. Data about the performance of an index are prepared or obtained by Neuberger Berman Investment Advisers LLC and reflect the reinvestment of income dividends and other distributions, if any. The Fund may invest in securities not included in a described index and generally does not invest in all securities included in a described index. |
| The date used to calculate Life of Fund performance for the index is the inception date of the oldest share class. |
For more complete information on any of the Neuberger Berman Alternative Funds, call us at (800) 877-9700, or visit our website at www.nb.com.
Glossary of Indices (Unaudited)
HFRX® Equity Hedge Index: | The index comprises equity hedge strategies. Equity hedge strategies maintain positions both long and short in primarily equity and equity derivative securities. A wide variety of investment processes can be employed to arrive at an investment decision, including both quantitative and fundamental techniques; strategies can be broadly diversified or narrowly focused on specific sectors and can range broadly in terms of levels of net exposure, leverage employed, holding period, concentrations of market capitalizations and valuation ranges of typical portfolios. Equity hedge managers would typically maintain at least 50%, and may in some cases be substantially entirely invested, in equities, both long and short. Constituent funds are selected from an eligible pool of the more than 7,500 funds worldwide that report to the Hedge Fund Research (HFR) Database. Constituent funds must meet all of the following criteria: report monthly; report performance net of all fees; be U.S. dollar-denominated; be active and accepting new investments; have a minimum 24 months track record; and the fund’s manager must have at least $50 million in assets under management. The index is rebalanced quarterly. |
| The index is a float-adjusted, market capitalization-weighted index that focuses on the large-cap segment of the U.S. equity market, and includes a significant portion of the total value of the market. |
Information About Your Fund’s Expenses (Unaudited)
As a Fund shareholder, you incur two types of costs: (1) transaction costs, including sales charges (loads) on purchase payments or redemption proceeds (if applicable); and (2) ongoing costs, including management fees, distribution and/or service (12b-1) fees (if applicable), and other Fund expenses. This example is intended to help you understand your ongoing costs (in U.S. dollars) of investing in the Fund and compare these costs with the ongoing costs of investing in other mutual funds.
This table is designed to provide information regarding costs related to your investments. The following examples are based on an investment of $1,000 made at the beginning of the six month period ended April 30, 2024 and held for the entire period. The table illustrates the Fund’s costs in two ways:
Actual Expenses and Performance: | The first section of the table provides information about actual account values and actual expenses in dollars, based on the Fund’s actual performance during the period indicated. You may use the information in this line, together with the amount you invested, to estimate the expenses you paid over the period. Simply divide your account value by $1,000 (for example, an $8,600 account value divided by $1,000 = 8.6), then multiply the result by the number in the first section of the table under the heading entitled "Expenses Paid During the Period" to estimate the expenses you paid over the period. |
Hypothetical Example for Comparison Purposes: | The second section of the table provides information about hypothetical account values and hypothetical expenses based on the Fund’s actual expense ratio and an assumed rate of return at 5% per year before expenses. This return is not the Fund’s actual return. The hypothetical account values and expenses may not be used to estimate the actual ending account balance or expenses you paid for the period. You may use this information to compare the ongoing costs of investing in a Fund versus other funds. To do so, compare the expenses shown in this 5% hypothetical example with the 5% hypothetical examples that appear in the shareholder reports of other funds. |
Please note that the expenses in the table are meant to highlight your ongoing costs only and do not include any transaction costs, such as sales charges (loads) (if applicable). Therefore, the information under the heading "Hypothetical (5% annual return before expenses)" is useful in comparing ongoing costs only, and will not help you determine the relative total costs of owning different funds. In addition, if these transaction costs were included, your costs would have been higher.
Expense Example (Unaudited)
Neuberger Berman Alternative Funds
| | HYPOTHETICAL (5% ANNUAL RETURN BEFORE EXPENSES) |
| Beginning
Account
Value
11/1/23 | Ending
Account
Value
4/30/24 | Expenses Paid
During the
11/1/23 – 4/30/24 | | Beginning
Account
Value
11/1/23 | Ending
Account
Value
4/30/24 | Expenses Paid
During the
Period(2)(3)
11/1/23 – 4/30/24 | |
|
| | | | | | | | |
| | | | | | | | |
| | | | | | | | |
| For each class, expenses are equal to the annualized expense ratio for the class, multiplied by the average account value over the period, multiplied by 182/366 (to reflect the one-half year period shown), unless otherwise indicated. |
| Includes expenses of the Fund’s Blocker (See Note A of the Notes to Consolidated Financial Statements). |
| Hypothetical expenses are equal to the annualized expense ratios for each class, multiplied by the average account value over the period (assuming a 5% annual return), multiplied by 182/366 (to reflect the one-half year period shown). |
Legend April 30, 2024 (Unaudited)
Neuberger Berman Alternative Funds
|
| = JPMorgan Chase Bank N.A. |
| = State Street Bank and Trust Company |
Index Periods/Payment Frequencies: |
| |
| |
|
| = London Interbank Offered Rate |
| = United States Overnight Bank Funding Rate |
| = Secured Overnight Financing Rate |
|
| = Neuberger Berman Investment Advisers LLC |
|
| |
Consolidated Schedule of Investments Long Short Fund^ (Unaudited) April 30, 2024
| |
|
|
|
|
| | |
| | |
| | |
| | |
Application Software 0.2% |
| | |
|
| | |
| | |
| | |
|
| | |
| | |
| | |
|
| | |
|
| | |
|
| | |
| | |
| | |
| | |
| | |
|
| | |
|
| Celebration Bidco Holdings LLC | |
Commercial Services & Supplies 1.0% |
| | |
Consumer Staples Distribution & Retail 2.6% |
| | |
| | |
| | |
| | |
Containers & Packaging 0.9% |
| | |
Diversified Consumer Services 0.3% |
| European Wax Center, Inc. Class A | |
| |
Diversified Consumer Services – cont'd |
| OneSpaWorld Holdings Ltd. | |
| | |
|
| Constellation Energy Corp. | |
| | |
| | |
| | |
Electrical Equipment 1.0% |
| | |
| | |
| | |
Electronic Equipment, Instruments & Components 2.0% |
| | |
| | |
| | |
| | |
|
| | |
|
| | |
| | |
| | |
| | |
|
| Lamb Weston Holdings, Inc. | |
| Mondelez International, Inc. Class A | |
| | |
Ground Transportation 3.0% |
| | |
| | |
| | |
| | |
Health Care Equipment & Supplies 1.0% |
| | |
Health Care Providers & Services 1.0% |
| | |
| | |
| | |
Hotels, Restaurants & Leisure 3.2% |
| First Watch Restaurant Group, Inc. | |
| Marriott International, Inc. Class A | |
| | |
See Notes to Consolidated Financial Statements
Consolidated Schedule of Investments Long Short Fund^ (Unaudited) (cont’d)
| |
Hotels, Restaurants & Leisure – cont'd |
| | |
| | |
|
| | |
|
| | |
Interactive Media & Services 6.3% |
| | |
| | |
| Meta Platforms, Inc. Class A | |
| | |
|
| | |
Life Sciences Tools & Services 1.1% |
| | |
| Thermo Fisher Scientific, Inc. | |
| | |
|
| | |
|
| | |
| | |
| | |
Oil, Gas & Consumable Fuels 1.4% |
| | |
Personal Care Products 0.1% |
| | |
|
| | |
| | |
| | |
Professional Services 2.8% |
| | |
| | |
| | |
| | |
Semiconductors & Semiconductor Equipment 3.8% |
| Advanced Micro Devices, Inc. | |
| | |
| | |
| | |
| | |
| | |
| |
|
| | |
| Arctic Wolf Networks, Inc. | |
| | |
| | |
| | |
| | |
| | |
| | |
| | |
| | |
| | |
| | |
| | |
|
| | |
| | |
| | |
|
| Asbury Automotive Group, Inc. | |
| | |
| Fanatics Holdings, Inc. Class A | |
| | |
| | |
| | |
Technology Hardware, Storage & Peripherals 2.0% |
| | |
Textiles, Apparel & Luxury Goods 1.1% |
| Lululemon Athletica, Inc. | |
| | |
| | |
|
Total Common Stocks
(Cost $3,923,565,041) | |
|
|
| | |
|
| | |
| | |
| | |
|
| Cybereason, Inc. Series F | |
| | |
See Notes to Consolidated Financial Statements
Consolidated Schedule of Investments Long Short Fund^ (Unaudited) (cont’d)
| |
|
| | |
| | |
|
| | |
| Signifyd, Inc. Series Seed | |
| | |
| | |
| | |
|
Total Preferred Stocks
(Cost $58,686,273) | |
| |
Master Limited Partnerships and Limited Partnerships 2.4% |
|
| Brookfield Infrastructure Partners LP
| |
| |
Oil, Gas & Consumable Fuels 1.7% |
| Enterprise Products Partners LP
| |
|
Total Master Limited Partnerships and Limited Partnerships
(Cost $133,595,043) | |
| |
|
|
| Uber Technologies, Inc., 8.00%, due 11/1/2026 | |
Machinery - Diversified 0.0%(f) |
| nVent Finance SARL, 4.55%, due 4/15/2028 | |
Miscellaneous Manufacturer 0.0%(f) |
| Anagram Holdings LLC/Anagram International, Inc., 5.00% Cash & 5.00% PIK, due 8/15/2026 | |
Office - Business Equipment 0.1% |
| CDW LLC/CDW Finance Corp., 2.67%, due 12/1/2026 | |
Real Estate Investment Trusts 0.0%(f) |
| SBA Communications Corp., 3.88%, due 2/15/2027 | |
Total Corporate Bonds
(Cost $31,385,458) | |
|
|
| Celebration Bidco LLC, Term Loan, (3 mo. USD Term SOFR + 8.00%), 13.30%, due 12/29/2028 (Cost $14,754,814) | |
See Notes to Consolidated Financial Statements
Consolidated Schedule of Investments Long Short Fund^ (Unaudited) (cont’d)
| |
|
|
|
| Arctic Wolf Networks, Inc., 0.00% Cash/3.00% PIK, due 9/29/2027 (Cost $19,850,000) | |
|
Total Purchased Option Contracts 0.0%(f)(j)
(Cost $918,192) | |
| |
|
|
Short-Term Investments 10.9% |
Investment Companies 10.9% |
| State Street Institutional U.S. Government Money Market Fund Premier Class, 5.25%(k) | |
| State Street Navigator Securities Lending Government Money Market Portfolio, 5.35%(k) | |
Total Short-Term Investments
(Cost $736,585,655) | |
Total Long Positions (96.3%)
(Cost $4,919,340,476) | |
| |
|
Short Positions ((12.8)%) |
Common Stocks Sold Short (12.8)% |
Air Freight & Logistics (0.1)% |
| Expeditors International of Washington, Inc.
| |
|
| | |
|
| Citizens Financial Group, Inc.
| |
|
| MarketAxess Holdings, Inc. | |
| | |
| | |
| | |
|
| | |
| | |
| | |
Consumer Staples Distribution & Retail (0.6)% |
| | |
| | |
| |
|
Consumer Staples Distribution & Retail – cont'd |
| Sprouts Farmers Market, Inc. | |
| | |
Electric Utilities (0.4)% |
| | |
| | |
| | |
Financial Services (0.3)% |
| | |
|
| | |
| | |
| | |
| | |
Health Care Providers & Services (0.4)% |
| | |
| | |
| | |
| | |
Hotels, Restaurants & Leisure (0.7)% |
| | |
| | |
| | |
| | |
See Notes to Consolidated Financial Statements
Consolidated Schedule of Investments Long Short Fund^ (Unaudited) (cont’d)
| |
|
|
| | |
Interactive Media & Services (0.4)% |
| | |
|
| International Business Machines Corp.
| |
Life Sciences Tools & Services (0.2)% |
| Agilent Technologies, Inc. | |
| Mettler-Toledo International, Inc. | |
| | |
| | |
|
| | |
| Illinois Tool Works, Inc. | |
| | |
| | |
| | |
|
| Interpublic Group of Cos., Inc. | |
| | |
| | |
| | |
|
| | |
Passenger Airlines (0.0)%(f) |
| | |
Personal Care Products (0.3)% |
| | |
Professional Services (0.4)% |
| ExlService Holdings, Inc. | |
| | |
| | |
| | |
| |
|
Semiconductors & Semiconductor Equipment (0.3)% |
| | |
| | |
| | |
|
| Palantir Technologies, Inc. | |
| | |
| | |
|
| | |
| | |
| | |
|
| | |
| | |
| | |
| | |
| Floor & Decor Holdings, Inc. | |
| | |
| Sally Beauty Holdings, Inc. | |
| | |
| | |
| | |
| | |
Technology Hardware, Storage & Peripherals (0.1)% |
| Super Micro Computer, Inc.
| |
Textiles, Apparel & Luxury Goods (0.4)% |
| | |
| | |
| | |
| | |
| | |
Total Short Positions (Proceeds $(790,291,729)) | |
|
Total Investments 83.5% (Cost $4,129,048,747) | |
Other Assets Less Liabilities 16.5% | |
| |
| Non-income producing security. |
| Value determined using significant unobservable inputs. |
See Notes to Consolidated Financial Statements
Consolidated Schedule of Investments Long Short Fund^ (Unaudited) (cont’d)
| Security fair valued as of April 30, 2024 in accordance with procedures approved by the valuation designee. Total value of all such securities at April 30, 2024 amounted to $299,352,433, which represents 4.4% of net assets of the Fund. |
| All or a portion of this security is on loan at April 30, 2024. Total value of all such securities at April 30, 2024 amounted to $6,735,780 for the Fund(see Note A of the Notes to Consolidated Financial Statements). |
| Security represented in Units. |
| Securities were purchased or sold short under Rule 144A of the Securities Act of 1933, as amended, or are otherwise restricted and, unless registered under the Securities Act of 1933 or exempted from registration, may only be sold to qualified institutional investors or may have other restrictions on resale. At April 30, 2024, these securities amounted to $9,685,150 of long positions and $0 of short positions, which represents 0.1% and 0.0%, respectively, of net assets of the Fund. |
| Represents less than 0.05% of net assets of the Fund. |
| |
| Payment-in-kind (PIK) security. |
| Variable or floating rate security. The interest rate shown was the current rate as of April 30, 2024 and changes periodically. |
| See "Purchased option contracts" under Derivative Instruments. |
| Represents 7-day effective yield as of April 30, 2024. |
| Represents investment of cash collateral received from securities lending. |
| Includes the impact of the Fund’s open positions in derivatives at April 30, 2024. |
# This security is subject to restrictions on resale. Total value of all such securities at April 30, 2024 amounted to $299,352,433, which represents 4.4% of net assets of the Fund. Acquisition dates shown with a range, if any, represent securities that were acquired over the period shown in the table.
| | | | Fair Value
Percentage
of Net Assets
as of
4/30/2024 |
A24 Films LLC (Preferred Units) | | | | |
Anagram Holdings LLC/Anagram International, Inc. | | | | |
Arctic Wolf Networks, Inc. | | | | |
Arctic Wolf Networks, Inc. (Convertible Bonds) | | | | |
| | | | |
Celebration Bidco Holdings LLC | | | | |
| | | | |
Cybereason, Inc. (Series F Preferred Shares) | | | | |
Druva, Inc. (Series 4 Preferred Shares) | | | | |
Druva, Inc. (Series 5 Preferred Shares) | | | | |
Fabletics LLC (Series G Preferred Shares) | | | | |
Fanatics Holdings, Inc. Class A | | | | |
Grammarly, Inc. (Series 3 Preferred Shares) | | | | |
| | | | |
Savage X, Inc. (Series C Preferred Shares) | | | | |
See Notes to Consolidated Financial Statements
Consolidated Schedule of Investments Long Short Fund^ (Unaudited) (cont’d)
| | | | Fair Value Percentage of Net Assets as of 4/30/2024 |
Signifyd, Inc. (Series A Preferred Shares) | | | | |
Signifyd, Inc. (Series Seed Preferred Shares) | | | | |
Videoamp, Inc. (Series F1 Preferred Shares) | | | | |
| | | | |
See Notes to Consolidated Financial Statements
Consolidated Schedule of Investments Long Short Fund^ (Unaudited) (cont’d)
Derivative Instruments
Futures contracts ("futures")
At April 30, 2024, open positions in futures for the Fund were as follows:
| | | | Value and
Unrealized
Appreciation/
(Depreciation) |
| | | | |
| | | | |
| | |
At April 30, 2024, the Fund had $62,928,497 deposited in a segregated account to cover margin requirements on open futures.
For the six months ended April 30, 2024, the average notional value for the months where the Fund had futures outstanding was $(1,378,722,954) for short positions.
Total return basket swap contracts ("total return basket swaps")
At April 30, 2024, the Fund had outstanding total return basket swaps(a) as follows:
Over-the-counter total return basket swaps—Short(b) |
| | | | | Frequency
of Fund
Receipt/
Payment | | |
| | | | | | | |
| | | | | | | |
| | | | | | | |
| | | | | | | |
| | | | | | | |
(a) The following table represents required component disclosures associated with the total return basket swaps:
| | | Unrealized
Appreciation/
(Depreciation) | |
| | | | |
Sprouts Farmers Market Inc | | | | |
| | | | |
| | | | |
| | | | |
| | | | |
| | | | |
Take-Two Interactive Software Inc | | | | |
Performance Food Group Co | | | | |
Monolithic Power Systems Inc | | | | |
| | | | |
See Notes to Consolidated Financial Statements
Consolidated Schedule of Investments Long Short Fund^ (Unaudited) (cont’d)
| | | Unrealized Appreciation/ (Depreciation) | |
| | | | |
| | | | |
| | | | |
Palantir Technologies Inc | | | | |
| | | | |
| | | | |
| | | | |
| | | | |
| | | | |
| | | | |
| | | | |
| | | | |
| | | | |
| | | | |
| | | | |
| | | | |
| | | | |
| | | | |
| | | | |
| | | | |
| | | | |
| | | | |
Live Nation Entertainment Inc | | | | |
Taylor Morrison Home Corp | | | | |
| | | | |
| | | | |
| | | | |
Royal Caribbean Cruises Ltd | | | | |
| | | | |
Chipotle Mexican Grill Inc | | | | |
| | | | |
| | | | |
| | | | |
| | | | |
| | | | |
| | | | |
| | | | |
| | | | |
RenaissanceRe Holdings Ltd | | | | |
| | | | |
| | | | |
| | | | |
| | | | |
Accrued Net Interest Receivable/(Payable) | | | |
| | | | |
| | | | |
Sprouts Farmers Market Inc | | | | |
See Notes to Consolidated Financial Statements
Consolidated Schedule of Investments Long Short Fund^ (Unaudited) (cont’d)
| | | Unrealized Appreciation/ (Depreciation) | |
| | | | |
| | | | |
| | | | |
| | | | |
| | | | |
| | | | |
Take-Two Interactive Software Inc | | | | |
Performance Food Group Co | | | | |
Monolithic Power Systems Inc | | | | |
| | | | |
| | | | |
| | | | |
Palantir Technologies Inc | | | | |
| | | | |
| | | | |
| | | | |
| | | | |
| | | | |
| | | | |
| | | | |
| | | | |
| | | | |
| | | | |
| | | | |
| | | | |
| | | | |
| | | | |
| | | | |
| | | | |
| | | | |
| | | | |
Live Nation Entertainment Inc | | | | |
Taylor Morrison Home Corp | | | | |
| | | | |
| | | | |
| | | | |
Royal Caribbean Cruises Ltd | | | | |
| | | | |
Chipotle Mexican Grill Inc | | | | |
| | | | |
| | | | |
| | | | |
| | | | |
| | | | |
| | | | |
| | | | |
| | | | |
See Notes to Consolidated Financial Statements
Consolidated Schedule of Investments Long Short Fund^ (Unaudited) (cont’d)
| | | Unrealized Appreciation/ (Depreciation) | |
| | | | |
RenaissanceRe Holdings Ltd | | | | |
| | | | |
| | | | |
| | | | |
| | | | |
Accrued Net Interest Receivable/(Payable) | | | |
| | | | |
| | | | |
Sprouts Farmers Market Inc | | | | |
| | | | |
| | | | |
| | | | |
| | | | |
| | | | |
Take-Two Interactive Software Inc | | | | |
Performance Food Group Co | | | | |
Monolithic Power Systems Inc | | | | |
| | | | |
| | | | |
| | | | |
Palantir Technologies Inc | | | | |
| | | | |
| | | | |
| | | | |
| | | | |
| | | | |
| | | | |
| | | | |
| | | | |
| | | | |
| | | | |
| | | | |
| | | | |
| | | | |
| | | | |
| | | | |
| | | | |
| | | | |
| | | | |
Live Nation Entertainment Inc | | | | |
Taylor Morrison Home Corp | | | | |
| | | | |
| | | | |
| | | | |
Royal Caribbean Cruises Ltd | | | | |
| | | | |
See Notes to Consolidated Financial Statements
Consolidated Schedule of Investments Long Short Fund^ (Unaudited) (cont’d)
| | | Unrealized Appreciation/ (Depreciation) | |
| | | | |
Chipotle Mexican Grill Inc | | | | |
| | | | |
| | | | |
| | | | |
| | | | |
| | | | |
| | | | |
| | | | |
| | | | |
RenaissanceRe Holdings Ltd | | | | |
| | | | |
| | | | |
| | | | |
| | | | |
Accrued Net Interest Receivable/(Payable) | | | |
| | | | |
| | | | |
| | | | |
| | | | |
| | | | |
| | | | |
| | | | |
| | | | |
| | | | |
| | | | |
| | | | |
| | | | |
| | | | |
| | | | |
| | | | |
| | | | |
| | | | |
| | | | |
Advanced Micro Devices Inc | | | | |
| | | | |
| | | | |
| | | | |
| | | | |
Thermo Fisher Scientific Inc | | | | |
| | | | |
| | | | |
| | | | |
| | | | |
| | | | |
| | | | |
| | | | |
See Notes to Consolidated Financial Statements
Consolidated Schedule of Investments Long Short Fund^ (Unaudited) (cont’d)
| | | Unrealized Appreciation/ (Depreciation) | |
| | | | |
| | | | |
| | | | |
| | | | |
| | | | |
| | | | |
Verizon Communications Inc | | | | |
| | | | |
| | | | |
| | | | |
International Business Machines Corp | | | | |
| | | | |
| | | | |
| | | | |
| | | | |
Philip Morris International Inc | | | | |
| | | | |
| | | | |
Goldman Sachs Group Inc/The | | | | |
| | | | |
| | | | |
| | | | |
| | | | |
| | | | |
Accrued Net Interest Receivable/(Payable) | | | |
| | | | |
Total Return Basket Swaps, at Value | | | |
| The Fund receives a specified rate based on a reference rate plus or minus a spread, and pays the total return on the reference entity. The cash flows may be denominated in various foreign currencies based on the local currencies of the positions within the swaps. |
| Effective rate at April 30, 2024. |
Total return swap contracts ("total return swaps")
At April 30, 2024, the Fund had outstanding over-the-counter total return swaps as follows:
Over-the-counter total return swaps—Short(a) |
| | | | | | | Frequency
of Fund
Receipt/
Payment | Unrealized
Appreciation/
(Depreciation) | Accrued
Net
Interest
Receivable/
(Payable) | |
| S&P 500 Equal
Weight Total
Return Index | | | | | | | | | | |
| S&P Retail
Select Industry
Index | | | | | | | | | | |
See Notes to Consolidated Financial Statements
Consolidated Schedule of Investments Long Short Fund^ (Unaudited) (cont’d)
| | | | | | | Frequency of Fund Receipt/ Payment | Unrealized Appreciation/ (Depreciation) | Accrued Net Interest Receivable/ (Payable) | |
| S&P Retail
Select Industry
Index | | | | | | | | | | |
| S&P Retail
Select Industry
Index | | | | | | | | | | |
| S&P Retail
Select Industry
Index | | | | | | | | | | |
| | | | | | | | | | | |
| The Fund receives a specified rate based on a reference rate plus or minus a spread, and pays the total return on the reference entity. |
| Effective rate at April 30, 2024. |
For the six months ended April 30, 2024, the average notional value for the months where the Fund had total return basket swaps and total return swaps, including contracts for difference, for the Fund was $(431,361,970) for short positions.
At April 30, 2024, the Fund had cash collateral of $81,090,000 deposited in a segregated account for JPMorgan Chase Bank N.A., to cover collateral requirements on over-the-counter derivatives.
Purchased option contracts ("options purchased")
At April 30, 2024, the Fund had outstanding options purchased as follows:
| | | | | |
| | | | |
Interactive Media & Services | | | | |
| | | | | |
Total options purchased (cost $918,192) | | | | |
Written option contracts ("options written")
At April 30, 2024, the Fund had outstanding options written as follows:
| | | | | |
|
Interactive Media & Services |
| | | | | |
Total options written (premium received $589,491) | |
For the six months ended April 30, 2024, the average market value for the months where the Fund had options purchased and options written outstanding was $605,361 and $(2,082,878), respectively.
See Notes to Consolidated Financial Statements
Consolidated Schedule of Investments Long Short Fund^ (Unaudited) (cont’d)
The following is a summary, categorized by Level (see Note A of the Notes to Consolidated Financial Statements), of inputs used to value the Fund’s long investments as of April 30, 2024:
| | | | |
| | | | |
| | | | |
| | | | |
| | | | |
| | | | |
| | | | |
| | | | |
| | | | |
| | | | |
| | | | |
Master Limited Partnerships and Limited Partnerships# | | | | |
| | | | |
| | | | |
| | | | |
| | | | |
| | | | |
| | | | |
| The Consolidated Schedule of Investments provides information on the industry or sector categorization. |
| The “Purchased option contracts” table under Derivative Instruments provides information on the industry or sector categorization. |
| The following is a reconciliation between the beginning and ending balances of investments in which significant unobservable inputs (Level 3) were used in determining value: |
| Beginning
balance as
of 11/1/2023 | Accrued
discounts/
(premiums) | | Change
in unrealized
appreciation/
(depreciation) | | | | | | Net change in
unrealized
appreciation/
(depreciation)
from
investments
still held as of
4/30/2024 |
Investments in Securities: |
| | | | | | | | | | |
| | | | | | | | | | |
| | | | | | | | | | |
| | | | | | | | | | |
| | | | | | | | | | |
| | | | | | | | | | |
| | | | | | | | | | |
(1) Quantitative Information about Level 3 Fair Value Measurements: |
| | | Significant unobservable
input(s) | | | Impact to
valuation
from
increase
in input(b) |
| | | Enterprise value
Revenue multiple(c) (EV/Revenue) | | | |
| | | | | | |
See Notes to Consolidated Financial Statements
Consolidated Schedule of Investments Long Short Fund^ (Unaudited) (cont’d)
| | | | | | |
| | | | | | |
| | | | | | |
| | | | | | |
| | | Enterprise value
Revenue multiple(c) (EV/Revenue) | | | |
| | | | | | |
| | | | | | |
| | | | | | |
| | | Enterprise value
Revenue multiple(c) (EV/Revenue) | | | |
| | | | | | |
| | | | | | |
| | | | | | |
| | | | | | |
| | | | | | |
(a) The weighted averages disclosed in the table above were weighted by relative fair value. |
(b) Represents the expected directional change in the fair value of the Level 3 investments that would result from an increase or decrease in the corresponding input. Significant changes in these inputs could result in significantly higher or lower fair value measurements. |
(c) Represents amounts used when the reporting entity has determined that market participants would use such multiples when pricing the investments. |
(2) At April 30, 2024, these investments were valued in accordance with procedures approved by the valuation designee. These investments did not have a material impact on the Fund’s net assets and, therefore, disclosure of significant unobservable inputs used in formulating valuations is not presented. |
(3) At the beginning of the period, these investments were valued in accordance with the procedures approved by the valuation designee. |
The following is a summary, categorized by Level (see Note A of the Notes to Consolidated Financial Statements), of inputs used to value the Fund’s short investments as of April 30, 2024:
Liability Valuation Inputs | | | | |
| | | | |
Common Stocks Sold Short# | | | | |
| | | | |
| The Consolidated Schedule of Investments provides information on the industry or sector categorization. |
See Notes to Consolidated Financial Statements
Consolidated Schedule of Investments Long Short Fund^ (Unaudited) (cont’d)
The following is a summary, categorized by Level (see Note A of the Notes to Consolidated Financial Statements), of inputs used to value the Fund’s derivatives as of April 30, 2024:
Other Financial Instruments | | | | |
| | | | |
| | | | |
| | | | |
| | | | |
| | | | |
| | | | |
| | | | |
| | | | |
| Futures are reported at the cumulative unrealized appreciation/(depreciation) of the instrument. |
^
A balance indicated with a "—", reflects either a zero balance or an amount that rounds to less than 1.
See Notes to Consolidated Financial Statements
Consolidated Statement of Assets and Liabilities (Unaudited)
Neuberger Berman Alternative Funds
| |
| |
|
|
Investments in securities, at value*† (Note A)—see Schedule of Investments: |
|
| |
| |
| |
Cash collateral segregated for short sales (Note A) | |
Cash collateral segregated for futures contracts (Note A) | |
Cash collateral segregated for option contracts | |
Cash collateral segregated for over-the-counter derivatives (Note A) | |
Dividends and interest receivable | |
Receivable for accumulated variation margin on futures contracts (Note A) | |
Receivable for Fund shares sold | |
Receivable for securities lending income (Note A) | |
Over-the-counter swap contracts, at value (Note A) | |
Prepaid expenses and other assets | |
| |
|
|
Investments sold short, at value(c) (Note A) | |
Over-the-counter swap contracts, at value (Note A) | |
Dividends payable for short sales | |
Payable to investment manager (Note B) | |
Option contracts written, at value(d) (Note A) | |
Payable for securities purchased | |
Payable for Fund shares redeemed | |
Payable to administrator—net (Note B) | |
| |
Payable for cash collateral on loaned securities (Note A) | |
Other accrued expenses and payables | |
| |
| |
| |
See Notes to Consolidated Financial Statements
Consolidated Statement of Assets and Liabilities (Unaudited)(cont’d)
Neuberger Berman Alternative Funds
| |
| |
|
|
| |
Total distributable earnings/(losses) | |
| |
|
|
| |
| |
| |
Shares Outstanding ($.001 par value; unlimited shares authorized) |
|
| |
| |
| |
Net Asset Value, offering and redemption price per share |
|
| |
Net Asset Value and redemption price per share |
|
| |
|
|
| |
Net Asset Value and offering price per share |
|
| |
†Securities on loan, at value: |
|
| |
|
|
| |
(b) Total cost of foreign currency | |
(c) Proceeds from investments sold short | |
(d) Premium received from option contracts written | |
| |
| On single retail sales of less than $50,000. On sales of $50,000 or more or in certain other circumstances described in the Fund's prospectus, offering price is reduced. |
| Redemption price per share is equal to net asset value less any applicable contingent deferred sales charge. |
See Notes to Consolidated Financial Statements
Consolidated Statement of Operations (Unaudited)
Neuberger Berman Alternative Funds
| |
| For the Six
Months Ended
April 30,
2024 |
| |
| |
Dividend income—unaffiliated issuers | |
Interest and other income—unaffiliated issuers | |
Income from securities loaned—net | |
| |
| |
| |
Investment management fees (Note B) | |
Administration fees (Note B): | |
| |
| |
| |
Distribution fees (Note B): | |
| |
| |
Shareholder servicing agent fees: | |
| |
| |
| |
| |
Subsidiary administration fees | |
Custodian and accounting fees | |
| |
| |
Registration and filing fees | |
| |
Trustees' fees and expenses | |
Dividend and interest expense on securities sold short (Note A) | |
Miscellaneous and other fees (Note A) | |
| |
Net investment income/(loss) | |
| |
See Notes to Consolidated Financial Statements
Consolidated Statement of Operations (Unaudited) (cont’d)
Neuberger Berman Alternative Funds
| |
| For the Six Months Ended April 30, 2024 |
Realized and Unrealized Gain/(Loss) on Investments (Note A): | |
Net realized gain/(loss) on: | |
Transactions in investment securities of unaffiliated issuers | |
Closed short positions of unaffiliated issuers | |
Settlement of foreign currency transactions | |
Expiration or closing of futures contracts | |
Expiration or closing of option contracts written | |
Expiration or closing of swap contracts | |
Change in net unrealized appreciation/(depreciation) in value of: | |
Investment securities of unaffiliated issuers | |
Short positions of unaffiliated issuers | |
Foreign currency translations | |
| |
| |
| |
Net gain/(loss) on investments | |
Net increase/(decrease) in net assets resulting from operations | |
See Notes to Consolidated Financial Statements
Consolidated Statements of Changes in Net Assets
Neuberger Berman Alternative Funds
| |
| | |
| | |
Increase/(Decrease) in Net Assets: |
|
|
From Operations (Note A): |
|
|
Net investment income/(loss) | | |
Net realized gain/(loss) on investments | | |
Change in net unrealized appreciation/(depreciation) of investments | | |
Net increase/(decrease) in net assets resulting from operations | | |
Distributions to Shareholders From (Note A): |
|
|
|
|
|
| | |
| | |
| | |
Total distributions to shareholders | | |
From Fund Share Transactions (Note D): |
|
|
Proceeds from shares sold: |
|
|
| | |
| | |
| | |
Proceeds from reinvestment of dividends and distributions: |
|
|
| | |
| | |
| | |
Payments for shares redeemed: |
|
|
| | |
| | |
| | |
Net increase/(decrease) from Fund share transactions | | |
Net Increase/(Decrease) in Net Assets | | |
|
|
|
| | |
| | |
See Notes to Consolidated Financial Statements
Notes to Consolidated Financial Statements Long Short Fund (Unaudited)
Note A—Summary of Significant Accounting Policies:
1
General: Neuberger Berman Alternative Funds (the "Trust") is a Delaware statutory trust organized pursuant to an Amended and Restated Trust Instrument dated March 27, 2014. The Trust is registered as an open-end management investment company under the Investment Company Act of 1940, as amended (the "1940 Act"), and its shares are registered under the Securities Act of 1933, as amended. Neuberger Berman Long Short Fund ("the Fund") is a separate operating series of the Trust. Under the 1940 Act, the status of a fund that was registered as non-diversified may, under certain circumstances, change to that of a diversified fund (the Fund became diversified in December 2014). The Fund currently offers Institutional Class shares, Class A shares and Class C shares. The Trust’s Board of Trustees (the "Board") may establish additional series or classes of shares without the approval of shareholders.
A balance indicated with a "—", reflects either a zero balance or a balance that rounds to less than 1.
The assets of the Fund belong only to the Fund, and the liabilities of the Fund are borne solely by the Fund and no other series of the Trust.
The Fund is an investment company and accordingly follows the investment company accounting and reporting guidance of the Financial Accounting Standards Board ("FASB") Accounting Standards Codification ("ASC") Topic 946 "Financial Services—Investment Companies."
The preparation of financial statements in accordance with U.S. generally accepted accounting principles ("GAAP") requires Management to make estimates and assumptions at the date of the financial statements. Actual results could differ from those estimates.
To facilitate compliance with certain requirements necessary to maintain its status as a regulated investment company ("RIC"), the Fund formed NB A24 Long Short Blocker LLC (the "Blocker"), a Delaware limited liability company, to hold interests in certain private placements. The Blocker is a wholly owned subsidiary of the Fund.
As of April 30, 2024, the value of the Fund's investment in the Blocker was as follows:
2
Consolidation: The accompanying financial statements of the Fund present the consolidated accounts of the Fund and the Blocker. All intercompany accounts and transactions have been eliminated in consolidation.
3
Portfolio valuation: In accordance with ASC 820 "Fair Value Measurement" ("ASC 820"), all investments held by the Fund are carried at the value that Management believes the Fund would receive upon selling an investment in an orderly transaction to an independent buyer in the principal or most advantageous market for the investment under current market conditions. Various inputs, including the volume and level of activity for the asset or liability in the market, are considered in valuing the Fund's investments, some of which are discussed below. At times, Management may need to apply significant judgment to value investments in accordance with ASC 820.
ASC 820 established a three-tier hierarchy of inputs to create a classification of value measurements for disclosure purposes. The three-tier hierarchy of inputs is summarized in the three broad Levels listed below.
•
Level 1 – unadjusted quoted prices in active markets for identical investments
•
Level 2 – other observable inputs (including quoted prices for similar investments, interest rates, prepayment speeds, credit risk, amortized cost, etc.)
•
Level 3 – unobservable inputs (including the Fund's own assumptions in determining the fair value of investments)
The inputs or methodology used for valuing an investment are not necessarily an indication of the risk associated with investing in those securities.
The value of the Fund's investments (long and short positions) in equity securities, preferred stocks, master limited partnerships and limited partnerships, and exchange-traded options purchased and written, for which market quotations are available, is generally determined by Management by obtaining valuations from independent pricing services based on the latest sale price quoted on a principal exchange or market for that security (Level 1 inputs). Securities traded primarily on the NASDAQ Stock Market are normally valued at the NASDAQ Official Closing Price ("NOCP") provided by NASDAQ each business day. The NOCP is the most recently reported price as of 4:00:02 p.m., Eastern Time, unless that price is outside the range of the "inside" bid and asked prices (i.e., the bid and asked prices that dealers quote to each other when trading for their own accounts); in that case, NASDAQ will adjust the price to equal the inside bid or asked price, whichever is closer. Because of delays in reporting trades, the NOCP may not be based on the price of the last trade to occur before the market closes. If there is no sale of a security on a particular day, the independent pricing services may value the security based on market quotations.
The value of the Fund's investments for long and short positions in debt securities is determined by Management primarily by obtaining valuations from independent pricing services based on bid or offer quotations, respectively, or if quotations are not available, by methods that include various considerations based on security type (generally Level 2 inputs). In addition to the consideration of yields or prices of securities of comparable quality, coupon, maturity and type, indications as to values from dealers, and general market conditions, the following is a description of other Level 2 inputs and related valuation techniques used by independent pricing services to value certain types of debt securities held by the Fund:
Corporate Bonds. Inputs used to value corporate debt securities generally include relevant credit information, observed market movements, sector news, U.S. Treasury yield curve or relevant benchmark curve, and other market information, which may include benchmark yield curves, reported trades, broker-dealer quotes, issuer spreads, comparable securities, and reference data, such as market research publications, when available ("Other Market Information").
Convertible Bonds. Inputs used to value convertible bonds generally include underlying stock data, conversion rates, credit-specific details, relevant listed bond and preferred stock prices and Other Market Information.
High Yield Securities. Inputs used to value high yield securities generally include a number of observations of equity and credit default swap curves related to the issuer and Other Market Information.
The value of loan assignments is determined by Management primarily by obtaining valuations from independent pricing services based on broker quotes (generally Level 2 or Level 3 inputs depending on the number of quotes available).
The value of futures contracts is determined by Management by obtaining valuations from independent pricing services at the settlement price at the market close (Level 1 inputs).
The value of total return swaps and total return basket swaps is determined by Management by obtaining valuations from independent pricing services using the underlying asset and stated benchmark interest rate (Level 2 inputs).
Management has developed a process to periodically review information provided by independent pricing services for all types of securities.
Investments in non-exchange traded investment companies are valued using the respective fund’s daily calculated net asset value ("NAV") per share (Level 2 inputs), when available.
If a valuation is not available from an independent pricing service, or if Management has reason to believe that the valuation received does not represent the amount the Fund might reasonably expect to receive on a
current sale in an orderly transaction, Management seeks to obtain quotations from brokers or dealers (generally considered Level 2 or Level 3 inputs depending on the number of quotes available). If such quotations are not available, the security is valued using methods Management has approved in the good-faith belief that the resulting valuation will reflect the fair value of the security. Pursuant to Rule 2a-5 under the 1940 Act, the Board designated Management as the Fund's valuation designee. As the Fund's valuation designee, Management is responsible for determining fair value in good faith for all Fund investments. Inputs and assumptions considered in determining fair value of a security based on Level 2 or Level 3 inputs may include, but are not limited to, the type of security; the initial cost of the security; the existence of any contractual restrictions on the security’s disposition; the price and extent of public trading in similar securities of the issuer or of comparable companies; quotations or evaluated prices from broker-dealers or pricing services; information obtained from the issuer and analysts; an analysis of the company’s or issuer’s financial statements; an evaluation of the inputs that influence the issuer and the market(s) in which the security is purchased and sold.
The value of the Fund's investments in foreign securities is generally determined using the same valuation methods and inputs as other Fund investments, as discussed above. Foreign security prices expressed in local currency values are normally translated from the local currency into U.S. dollars using the exchange rates as of 4:00 p.m., Eastern Time on days the New York Stock Exchange ("NYSE") is open for business. Management has approved the use of ICE Data Services ("ICE") to assist in determining the fair value of foreign equity securities when changes in the value of a certain index suggest that the closing prices on the foreign exchanges may no longer represent the amount that the Fund could expect to receive for those securities or when foreign markets are closed and U.S. markets are open. In each of these events, ICE will provide adjusted prices for certain foreign equity securities using a statistical analysis of historical correlations of multiple factors (Level 2 inputs). Management has also approved the use of ICE to evaluate the prices of foreign debt securities as of the time at which the Fund's share price is calculated. ICE utilizes benchmark spread and yield curves and evaluates available market activity from the local close to the time as of which the Fund's share price is calculated (Level 2 inputs) to assist in determining prices for certain foreign debt securities. In the case of both foreign equity and foreign debt securities, in the absence of precise information about the market values of these foreign securities as of the time at which the Fund's share price is calculated, Management has determined based on available data that prices adjusted or evaluated in this way are likely to be closer to the prices the Fund could realize on a current sale than the prices of those securities established at the close of the foreign markets in which the securities primarily trade.
Fair value prices are necessarily estimates, and there is no assurance that such a price will be at or close to the price at which the security is next quoted or traded.
4
Foreign currency translations: The accounting records of the Fund and the Blocker are maintained in U.S. dollars. Foreign currency amounts are normally translated into U.S. dollars using the exchange rate as of 4:00 p.m. Eastern Time, on days the NYSE is open for business, to determine the value of investments, other assets and liabilities. Purchase and sale prices of securities, and income and expenses, are translated into U.S. dollars at the prevailing rate of exchange on the respective dates of such transactions. Net unrealized foreign currency gain/(loss), if any, arises from changes in the value of assets and liabilities, other than investments in securities, as a result of changes in exchange rates and is stated separately in the Consolidated Statement of Operations.
5
Securities transactions and investment income: Securities transactions are recorded on trade date for financial reporting purposes. Dividend income is recorded on the ex-dividend date or, for certain foreign dividends, as soon as the Fund becomes aware of the dividends. Non-cash dividends included in dividend income, if any, are recorded at the fair market value of the securities received. Interest income, including accretion of discount (adjusted for original issue discount, where applicable) and amortization of premium, where applicable, is recorded on the accrual basis. Realized gains and losses from securities transactions and foreign currency transactions, if any, are recorded on the basis of identified cost and stated separately in the Consolidated Statement of Operations.
6
Income tax information: The Fund is treated as a separate entity for U.S. federal income tax purposes. It is the policy of the Fund to continue to qualify for treatment as a RIC by complying with the requirements of the U.S. Internal Revenue Code applicable to RICs and to distribute substantially all of its net investment income and net realized capital gains to its shareholders. To the extent the Fund distributes substantially all of its net investment income and net realized capital gains to shareholders, no federal income or excise tax provision is required.
ASC 740 "Income Taxes" sets forth a minimum threshold for financial statement recognition of a tax position taken, or expected to be taken, in a tax return. The Fund recognizes interest and penalties, if any, related to unrecognized tax positions as an income tax expense in the Consolidated Statement of Operations. The Fund is subject to examination by U.S. federal and state tax authorities for returns filed for the tax years for which the applicable statutes of limitations have not yet expired. Management has analyzed the Fund's tax positions taken or expected to be taken on federal and state income tax returns for all open tax years (the current and the prior three tax years) and has concluded that no provision for income tax is required in the Fund's financial statements.
For federal income tax purposes, the estimated cost of investments held at April 30, 2024 was $4,974,547,348. The estimated gross unrealized appreciation was $1,773,736,944 and estimated gross unrealized depreciation was $359,657,677 resulting in net unrealized appreciation in value of investments of $1,414,079,267 based on cost for U.S. federal income tax purposes.
Income distributions and capital gain distributions are determined in accordance with income tax regulations, which may differ from GAAP. These differences are primarily due to differing treatments of income and gains on various investment securities held by the Fund, timing differences and differing characterization of distributions made by the Fund. The Fund may also utilize earnings and profits distributed to shareholders on redemption of their shares as a part of the dividends-paid deduction for income tax purposes.
Any permanent differences resulting from different book and tax treatment are reclassified at year-end and have no impact on net income, NAV or NAV per share of the Fund. For the year ended October 31, 2023, the Fund recorded permanent reclassifications primarily related to one or more of the following: wholly owned subsidiary income, prior year true up adjustments, non-deductible expenses from partnerships and deemed distributions on shareholder redemptions. For the year ended October 31, 2023, the Fund recorded the following permanent reclassifications:
| | Total Distributable
Earnings/(Losses) |
| | |
The tax character of distributions paid during the years ended October 31, 2023, and October 31, 2022, was as follows:
As of October 31, 2023, the components of distributable earnings (accumulated losses) on a U.S. federal income tax basis were as follows:
| Undistributed
Ordinary
Income | Undistributed
Long-Term
Capital Gain | Unrealized
Appreciation/
(Depreciation) | Loss
Carryforwards
and Deferrals | Other
Temporary
Differences | |
| | | | | | |
The temporary differences between book basis and tax basis distributable earnings are primarily due to: losses disallowed and recognized on wash sales, straddles and unsettled short sales, mark-to-market adjustments on swaps, futures, amortization of organizational expenses, tax adjustments related to partnerships, swap contracts and other investments.
To the extent the Fund’s net realized capital gains, if any, can be offset by capital loss carryforwards, it is the policy of the Fund not to distribute such gains. Capital loss carryforward rules allow for RICs to carry forward capital losses indefinitely and to retain the character of capital loss carryforwards as short-term or long-term. As determined at October 31, 2023, the Fund had no unused capital loss carryforwards available for federal income tax purposes to offset future net realized capital gains.
The Blocker is taxed as a corporation under the U.S. Internal Revenue Code. As of October 31, 2023, the Fund had a gross deferred tax asset of $63,153 resulting from deferred interest expense, capital losses and net operating losses in the Blocker and a gross deferred tax liability of $91,585 resulting from appreciation of the underlying holding. As of October 31, 2023, the Blocker has a net deferred tax liability of $28,432.
7
Foreign taxes: Foreign taxes withheld, if any, represent amounts withheld by foreign tax authorities, net of refunds recoverable.
Foreign capital gains on certain foreign securities may be subject to foreign taxes, which are accrued as applicable. At April 30, 2024, there were no outstanding balances of accrued capital gains taxes for the Fund.
As a result of several European Court of Justice ("ECJ") court cases in certain countries across the European Union ("EU"), if the Fund invests in foreign securities in those countries, it may file tax reclaims for previously withheld taxes on dividends earned in those countries ("ECJ tax reclaims"). ECJ tax reclaims are subject to various administrative proceedings by the local jurisdictions’ tax authorities within the EU, as well as a number of related judicial proceedings. If an ECJ tax reclaim is "more likely than not" to not be sustained, assuming examination by tax authorities, due to the uncertainty that exists as to the ultimate resolution of these proceedings, the likelihood of receipt of these ECJ tax reclaims, and the potential timing of payment, then no amounts are included in the Consolidated Statement of Assets and Liabilities. Income recognized, if any, from ECJ tax reclaims would be included in "Interest and other income—unaffiliated issuers" in the Consolidated Statement of Operations and the cost to file these additional ECJ tax reclaims, if any, would be included in "Miscellaneous and other fees" in the Consolidated Statement of Operations.
8
Distributions to shareholders: The Fund may earn income, net of expenses, daily on its investments. Distributions from net investment income, if any, are recorded on the ex-date and generally distributed once a year (usually in December) for the Fund. Distributions from net realized capital gains, if any, generally are distributed once a year (usually in December) and are recorded on the ex-date.
It is the policy of the Fund to pass through to its shareholders substantially all real estate investment trust ("REIT") distributions and other income it receives, less operating expenses. The distributions received from REITs are generally composed of income, capital gains, and/or return of REIT capital, but the REITs do not report this information to these Funds until the following calendar year. For the year ended October 31, 2023 the character of distributions, if any, paid to shareholders of the Fund disclosed within the Consolidated Statement of Changes in Net Assets is based on estimates made at that time. Based on past experience it is possible that a portion of the Fund's distributions during the current fiscal year, if any, will be considered tax return of capital, but the actual amount of the tax return of capital, if any, is not determinable until after the Fund's fiscal year-end. After calendar year-end, when the Fund learns the nature of the distributions paid by REITs during that year, distributions previously identified as income may be recharacterized as return of capital and/or capital gain. After all applicable REITs have informed the Fund of the actual breakdown of distributions paid to the Fund during their fiscal year, estimates previously recorded are adjusted to reflect actual results. As a result, the composition of the Fund's distributions as reported herein may differ from the final composition determined after calendar year-end and reported to the Fund's shareholders on IRS Form 1099-DIV.
9
Expense allocation: Certain expenses are applicable to multiple funds within a complex of related investment companies. Expenses directly attributable to a fund are charged to that fund. Expenses of the
Trust that are not directly attributable to a particular series of the Trust (e.g., the Fund) are allocated among the series of the Trust, on the basis of relative net assets, except where a more appropriate allocation of expenses to each of the series can otherwise be made fairly. Expenses borne by the complex of related investment companies, which includes open-end and closed-end investment companies for which NBIA serves as investment manager, that are not directly attributable to a particular investment company in the complex (e.g., the Trust) or series thereof are allocated among the investment companies in the complex or series thereof on the basis of relative net assets, except where a more appropriate allocation of expenses to each of the investment companies in the complex or series thereof can otherwise be made fairly. The Fund’s expenses (other than those specific to each class) are allocated proportionally each day among its classes based upon the relative net assets of each class.
10
Investments in foreign securities: Investing in foreign securities may involve sovereign and other risks, in addition to the credit and market risks normally associated with domestic securities. These additional risks include the possibility of adverse political and economic developments (including political instability, nationalization, expropriation, or confiscatory taxation) and the potentially adverse effects of unavailability of public information regarding issuers, less governmental supervision and regulation of financial markets, reduced liquidity of certain financial markets, and the lack of uniform accounting, auditing, and financial reporting standards or the application of standards that are different or less stringent than those applied in the United States. Foreign securities also may experience greater price volatility, higher rates of inflation, and delays in settlement.
11
When-issued/delayed delivery securities: The Fund may purchase securities with delivery or payment to occur at a later date beyond the normal settlement period. At the time the Fund enters into a commitment to purchase a security, the transaction is recorded and the value of the security is reflected in the NAV. The price of such security and the date when the security will be delivered and paid for are fixed at the time the transaction is negotiated. The value of the security may vary with market fluctuations. No interest accrues to the Fund until payment takes place. When-issued and delayed delivery transactions can have a leverage-like effect on the Fund, which can increase fluctuations in the Fund’s NAV. Certain risks may arise upon entering into when-issued or delayed delivery securities transactions from the potential inability of counterparties to meet the terms of their contracts or if the issuer does not issue the securities due to political, economic, or other factors. Additionally, losses may arise due to changes in the value of the underlying securities.
12
Securities sold short: The Fund may engage in short sales, which are sales of securities which have been borrowed from a third party on the expectation that the market price will decline. If the price of the securities decreases, the Fund will make a profit by purchasing the securities in the open market at a price lower than the one at which it sold the securities. If the price of the securities increases, the Fund may have to cover its short positions at a price higher than the short sale price, resulting in a loss. Gains are limited to the price at which the Fund sold the security short, while losses are potentially unlimited in size. The Fund pledges securities and/or other assets, which may include cash collateral from securities lending activities, to the lender as collateral. Proceeds received from short sales may be maintained by the lender as collateral or may be released to the Fund and used to purchase additional securities or for any other purpose. Proceeds maintained by the lender are included in the "Cash collateral segregated for short sales" on the Consolidated Statement of Assets and Liabilities. The Fund is contractually responsible to remit to the lender any dividends and interest payable on securities while those securities are being borrowed by the Fund. The Fund may receive or pay the net of the interest charged by the prime broker on the borrowed securities and a financing charge for the difference in the market value of the short position and the cash collateral deposited with the broker. This income or fee is calculated daily based upon the market value of each borrowed security and a variable rate that is dependent on the availability of the security. These costs related to short sales (i.e., dividend and interest remitted to the lender and interest charged by the prime broker) are recorded as an expense of the Fund and are excluded from the contractual expense limitation. A net negative expense, if any, represents a gain to the Fund as the total cash rebates received exceeded the other costs related to short sales. The net amount of fees and rebates incurred during the six months ended April 30, 2024, are included in the "Dividend and interest expense on securities sold short" on the Consolidated Statement of Operations and are $11,722,336.
13
Investments in private companies: Investments in private companies, including companies that have not yet issued securities publicly in an initial public offering, involve greater risks than investments in securities of companies that have traded publicly on an exchange for extended periods of time. Investments in these companies are generally less liquid than investments in securities issued by public companies and may be difficult for the Fund to value. Private placements and other restricted securities may not be listed on an exchange and may have no active trading market. As a result of the absence of a public trading market, the prices of these securities may be more difficult to determine than publicly traded securities and these securities may involve heightened risk as compared to investments in securities of publicly traded companies. Private placements and other restricted securities may be illiquid, and it frequently can be difficult to sell them at a time when it may otherwise be desirable to do so or the Fund may be able to sell them only at prices that are less than what the Fund regards as their fair market value.
14
Derivative instruments: The Fund's use of derivatives during the six months ended April 30, 2024, is described below. Please see the Consolidated Schedule of Investments for the Fund's open positions in derivatives, if any, at April 30, 2024. The disclosure requirements of ASC 815 "Derivatives and Hedging" ("ASC 815") distinguish between derivatives that qualify for hedge accounting and those that do not. Because investment companies value their derivatives at fair value and recognize changes in fair value through the Consolidated Statement of Operations, they do not qualify for hedge accounting. Accordingly, even though the Fund's investments in derivatives may represent economic hedges, they are considered non-hedge transactions for purposes of this disclosure.
Rule 18f-4 under the 1940 Act, regulates the use of derivatives for certain funds registered under the 1940 Act ("Rule 18f-4"). Unless the Fund qualifies as a "limited derivatives user" as defined in Rule 18f-4, the Fund is subject to a comprehensive derivatives risk management program, is required to comply with certain value-at-risk based leverage limits and is required to provide additional disclosure both publicly and to the SEC regarding its derivatives positions. If the Fund qualifies as a limited derivatives user, Rule 18f-4 requires the Fund to have policies and procedures to manage its aggregate derivatives risk.
Futures contracts: During the six months ended April 30, 2024, the Fund used futures on broader market indices and U.S. Treasuries in an effort either to enhance returns or to manage or adjust the risk profile and the investment exposure of the Fund.
At the time the Fund enters into a futures contract, it is required to deposit with the futures commission merchant a specified amount of cash or liquid securities, known as "initial margin," which is a percentage of the value of the futures contract being traded that is set by the exchange upon which the futures contract is traded. Each day, the futures contract is valued at the official settlement price of the board of trade or U.S. commodity exchange on which such futures contract is traded. Subsequent payments, known as "variation margin," to and from the broker are made on a daily basis, or as needed, as the market price of the futures contract fluctuates. Daily variation margin adjustments, arising from this "mark to market," are recorded by the Fund as unrealized gains or losses.
Although some futures by their terms call for actual delivery or acquisition of the underlying securities or currency, in most cases the contracts are closed out prior to delivery by offsetting purchases or sales of matching futures. When the contracts are closed or expire, the Fund recognizes a gain or loss. Risks of entering into futures contracts include the possibility there may be an illiquid market, possibly at a time of rapidly declining prices, and/or a change in the value of the contract may not correlate with changes in the value of the underlying securities. Futures executed on regulated futures exchanges have minimal counterparty risk to the Fund because the exchange’s clearinghouse assumes the position of the counterparty in each transaction. Thus, the Fund is exposed to risk only in connection with the clearinghouse and not in connection with the original counterparty to the transaction.
For U.S. federal income tax purposes, the futures transactions undertaken by the Fund may cause the Fund to recognize gains or losses from marking contracts to market even though its positions have not been sold or terminated, may affect the character of the gains or losses recognized as long-term or short-term, and may affect the timing of some capital gains and losses realized by the Fund. Also, the Fund’s losses on transactions involving futures contracts may be deferred rather than being taken into account currently in calculating the Fund’s taxable income.
Total return basket swap contracts: During the six months ended April 30, 2024, the Fund used total return basket swaps to increase returns, reduce risks and for hedging purposes. The Fund may enter into a total return basket swap agreement to obtain exposure to a portfolio of long and short securities. Under the terms of the agreement, the swap is designed to function as a portfolio of direct investments in long and short equity or fixed income positions. The Fund has the ability to trade in and out of long and short positions within the swap and will receive all of the economic benefits and risks equivalent to direct investments in these positions such as: capital appreciation/(depreciation), corporate actions, and dividends and interest received and paid, all of which are reflected in the swap value. The swap value also includes interest charges and credits related to the notional values of the long and short positions and cash balances within the swap. These interest charges and credits are based on defined market rates plus or minus a specified spread and are referred to herein as "financing costs." Positions within the swap are reset periodically, and financing costs are reset according to the terms of the contract. During a reset, any unrealized gains (losses) on positions and accrued financing costs become available for cash settlement between the Fund and the swap counterparty. For over-the-counter ("OTC") total return basket swaps, cash settlement in and out of the swap may occur at a reset date or any other date, at the discretion of the Fund and the counterparty, over the life of the agreement, and is generally determined based on limits and thresholds established as part of an agreement between the Fund and the counterparty. A change in the market value of a total return basket swap contract is recognized as a change in unrealized appreciation/(depreciation) on swap contracts in the Consolidated Statement of Operations. Cash settlements between the Fund and the counterparty are recognized as realized gains (losses) on closing of swap contracts in the Consolidated Statement of Operations.
Total return swap contracts: During the six months ended April 30, 2024, the Fund used total return swaps, including CFDs, to increase returns, reduce risks and for hedging purposes. Total return swaps, including CFDs, involve commitments to pay fixed or floating rate interest in exchange for a market-linked return based on a notional amount. To the extent the total return of the reference security or index underlying the total return swap exceeds or falls short of the offsetting interest rate obligation, the Fund will receive a payment or make a payment to the counterparty, respectively. Certain risks may arise when entering into total return swap transactions, including counterparty default, liquidity or unfavorable changes in the value of the underlying reference security or index. The value of the swap is adjusted daily and the change in value, if any, is recorded as unrealized appreciation or (depreciation) in the Consolidated Statement of Assets and Liabilities. Payments received or made at the end of each measurement period are recorded as realized gain or loss in the Consolidated Statement of Operations. For OTC total return swaps, cash settlement in and out of the swaps may occur at a reset date or any other date, at the discretion of the Fund and the counterparty, over the life of the agreement, and is generally determined based on limits and thresholds established as part of an agreement between the Fund and the counterparty.
Options: During the six months ended April 30, 2024, the Fund used options written to enhance total returns. During the six months ended April 30, 2024, the Fund used options purchased either for hedging purposes or to enhance total returns.
Premiums paid by the Fund upon purchasing a call or put option are recorded in the asset section of the Fund’s Consolidated Statement of Assets and Liabilities and are subsequently adjusted to the current market value. When an option is exercised, closed, or expired, the Fund realizes a gain or loss and the asset is eliminated. For purchased call options, the Fund's loss is limited to the amount of the option premium paid.
Premiums received by the Fund upon writing a call option or a put option are recorded in the liability section of the Fund’s Consolidated Statement of Assets and Liabilities and are subsequently adjusted to the current market value. When an option is exercised, closed, or expired, the Fund realizes a gain or loss and the liability is eliminated.
When the Fund writes a call option on an underlying asset it does not own, its exposure on such an option is theoretically unlimited. When writing a covered call option, the Fund, in return for the premium, gives up the opportunity for profit from a price increase in the underlying security above the exercise price, but conversely retains the risk of loss should the price of the security decline. When writing a put option, the Fund, in return for the premium, takes the risk that it must purchase the underlying security at a price that
may be higher than the current market price of the security. If a call or put option that the Fund has written expires unexercised, the Fund will realize a gain for the amount of the premium. All securities covering outstanding written options are held in escrow by the custodian bank.
At April 30, 2024, the Fund had the following derivatives (which did not qualify as hedging instruments under ASC 815), grouped by primary risk exposure:
| | |
| Consolidated Statement of
Assets and Liabilities
Location | | Consolidated Statement of
Assets and Liabilities
Location | |
| | | | |
| Receivable/Payable for accumulated variation margin on futures contracts | | Receivable/Payable for accumulated variation margin on futures contracts | |
| | | | |
| Over-the-counter swap contracts, at value(a) | | Over-the-counter swap contracts, at value(a) | |
| | | | |
| Investments in securities, at value | | | |
| | | | |
| | | Option contracts written, at value | |
| "Over-the-counter swaps" reflect the cumulative unrealized appreciation/(depreciation) of the over-the-counter swap contracts plus accrued interest as of April 30, 2024. |
The impact of the use of these derivative instruments on the Consolidated Statement of Operations during the six months ended April 30, 2024, was as follows:
| | | Change in Net Unrealized
Appreciation/
(Depreciation) on
|
| | | |
| | | |
| | | |
| | | |
| | | |
| | | |
| | | |
| | | |
| Net realized gain/(loss) on derivatives is located in the Consolidated Statement of Operations each under the caption, "Net realized gain/(loss) on:" |
| Expiration or closing of futures contracts |
| Expiration or closing of swap contracts |
| Transactions in investment securities of unaffiliated issuers |
| Expiration or closing of option contracts written |
| Change in net unrealized appreciation/(depreciation) is located in the Consolidated Statement of Operations each under the caption, "Change in net unrealized appreciation/(depreciation) in value of:" |
| |
| |
| Investment securities of unaffiliated issuers |
| |
While the Fund may receive redeemable preference shares, rights and warrants in connection with its investments in securities, these preference shares, rights and warrants are not considered "derivative instruments" under ASC 815.
15
Securities lending: The Fund, using State Street as its lending agent, may loan securities to qualified brokers and dealers in exchange for negotiated lender’s fees. These fees, if any, would be disclosed within the Consolidated Statement of Operations under the caption "Income from securities loaned-net" and are net of expenses retained by State Street as compensation for its services as lending agent.
The initial collateral received by the Fund at the beginning of each transaction shall have a value equal to at least 102% of the prior day’s market value of the loaned securities (105% in the case of international securities). Collateral in the form of cash and/or securities issued or guaranteed by the U.S. government or its agencies, equivalent to at least 100% of the market value of securities, is maintained at all times. Thereafter, the value of the collateral is monitored on a daily basis, and collateral is moved daily between a counterparty and the Fund until the close of the transaction. Cash collateral is generally invested in a money market fund registered under the 1940 Act that is managed by an affiliate of State Street and is included in the Consolidated Statement of Assets and Liabilities under the caption "Investments in securities, at value—Unaffiliated Issuers." The total value of securities received as collateral for securities on loan is included in a footnote following the applicable Consolidated Schedule of Investments, but is not included within the Consolidated Statement of Assets and Liabilities because the receiving Fund does not have the right to sell or repledge the securities received as collateral. The risks associated with lending portfolio securities include, but are not limited to, possible delays in receiving additional collateral or in the recovery of the loaned securities. Any increase or decrease in the fair value of the securities loaned and any interest earned or dividends paid or owed on those securities during the term of the loan would accrue to the Fund.
As of April 30, 2024, the Fund had outstanding loans of securities to certain approved brokers, with a value of $6,735,780, for which it received collateral as follows:
| Remaining Contractual Maturity of the Agreements |
| | | | | |
Securities Lending Transactions(a) | | | | | |
| | | | | |
| Amounts represent the payable for loaned securities collateral received. |
16
Offsetting assets and liabilities: The Fund is required to disclose both gross and net information for assets and liabilities related to OTC derivatives, and securities lending and securities borrowing transactions that are eligible for offset or subject to an enforceable master netting or similar agreement. The Fund held one or more of these investments at April 30, 2024. The Fund's OTC derivative assets and liabilities at fair value by type and securities lending assets are reported gross in the Consolidated Statement of Assets and Liabilities. The following tables present derivative and securities lending assets and liabilities by counterparty, net of amounts available for offset under a master netting or similar agreement and net of the related collateral received by the Fund for assets and pledged by the Fund for liabilities as of April 30, 2024.
| Gross Amounts of Assets
Presented in the
Consolidated
Statement
of Assets and Liabilities | Gross Amounts of Liabilities
Presented in the
Consolidated
Statement
of Assets and Liabilities |
Over-the-counter swap contracts | | |
| | |
| | |
Gross Amounts Not Offset in the Consolidated Statement of Assets and Liabilities: |
| | |
| Gross Amounts
Presented in the
Consolidated
Statement
of Assets and
Liabilities | Liabilities
Available
for Offset | | | Gross Amounts
Presented in the
Consolidated
Statement
of Assets and
Liabilities | Assets
Available
for Offset | | |
| | | | | | | | |
| | | | | | | | |
| | | | | | | | |
| Collateral received (or pledged) is limited to an amount not to exceed 100% of the net amount of assets (or liabilities) in the tables presented above, for each respective counterparty. |
| A net amount greater than zero represents amounts subject to loss as of April 30, 2024, in the event of a counterparty failure. A net amount less than zero represents amounts under-collateralized to each counterparty as of April 30, 2024. |
17
Indemnifications: Like many other companies, the Trust’s organizational documents provide that its officers ("Officers") and trustees ("Trustees") are indemnified against certain liabilities arising out of the performance of their duties to the Trust. In addition, both in some of its principal service contracts and in the normal course of its business, the Trust enters into contracts that provide indemnifications to other parties for certain types of losses or liabilities. The Trust’s maximum exposure under these arrangements is unknown as this could involve future claims against the Trust or the Fund.
18
Investment company securities and exchange-traded funds: The Fund may invest in shares of other registered investment companies, including ETFs, within the limitations prescribed by the 1940 Act, in reliance on rules adopted by the SEC, particularly Rule 12d1-4 or any other applicable exemptive relief. Rule 12d1-4 permits fund of funds arrangements, and includes (i) limits on control and voting; (ii) required evaluations and findings; (iii) required fund of funds investment agreements; and (iv) limits on complex structures. Shareholders of the Fund will indirectly bear their proportionate share of any management fees and other expenses paid by such other investment companies, in addition to the management fees and expenses of the Fund.
19
Other: All net investment income and realized and unrealized capital gains and losses of the Fund are allocated, on the basis of relative net assets, pro rata among its respective classes.
Note B—Investment Management Fees, Administration Fees, Distribution Arrangements, and Other Transactions with Affiliates:
The Fund retains NBIA as its investment manager under a Management Agreement. For such investment management services, the Fund pays NBIA an investment management fee at an annual rate of 1.20% of the first $250 million of the Fund’s average daily net assets, 1.175% of the next $250 million, 1.15% of the next $250 million, 1.125% of the next $250 million, 1.10% of the next $500 million, 1.075% of the next $2.5 billion and 1.05% average daily net assets in excess of $4 billion. Accordingly, for the six months
ended April 30, 2024, the investment management fee pursuant to the Management Agreement was equivalent to an annual effective rate of 1.08% of the Fund’s average daily net assets.
The Fund retains NBIA as its administrator under an Administration Agreement. The administration fee is assessed at the class level and each share class of the Fund, as applicable, pays NBIA an annual administration fee equal to the following: 0.26% for each of Class A and Class C and 0.15% for Institutional Class, each as a percentage of its average daily net assets. Additionally, NBIA retains State Street as its sub-administrator under a Sub-Administration Agreement. NBIA pays State Street a fee for all services received under the Sub-Administration Agreement.
NBIA has contractually agreed to waive fees and/or reimburse certain expenses of the Institutional Class, Class A and Class C of the Fund so that the total annual operating expenses of those classes do not exceed the expense limitations as detailed in the following table. These undertakings exclude interest, brokerage commissions, acquired fund fees and expenses, taxes including any expenses relating to tax reclaims, dividend and interest expenses relating to short sales, and extraordinary expenses, if any (commitment fees relating to borrowings are treated as interest for purposes of this exclusion) ("annual operating expenses"); consequently, net expenses may exceed the contractual expense limitations. The expenses of the Blocker are included in the total expenses used to calculate the reimbursement, if any, which the Fund has agreed to share with the Blocker. For the six months ended April 30, 2024, the expenses of the Blocker amounted to $5,910.
At April 30, 2024, the Fund's contingent liabilities to NBIA under the contractual expense limitation agreements were as follows:
| | | Expenses Reimbursed in
Year Ended October 31, |
| | | | | | |
| | | Subject to Repayment until
October 31, |
| | | | | | |
| | | | | | |
| | | | | | |
| | | | | | |
| Expense limitation per annum of the respective class’s average daily net assets. |
The Fund has agreed that each of its respective classes will repay NBIA for fees and expenses waived or reimbursed for that class provided that repayment does not cause that class’s annual operating expenses to exceed its contractual expense limitation in place at the time the fees and expenses were waived or reimbursed, or the expense limitation in place at the time the Fund repays NBIA, whichever is lower. Any such repayment must be made within three years after the year in which NBIA incurred the expense.
During the six months ended April 30, 2024, there was no repayment to NBIA under these agreements.
The Fund also has a distribution agreement with Neuberger Berman BD LLC (the "Distributor") with respect to each class of shares. The Distributor acts as agent in arranging for the sale of class shares without sales commission or other compensation, except as described below for Class A and Class C shares, and bears the advertising and promotion expenses.
However, the Distributor receives fees from Class A and Class C under their distribution plans (each a "Plan", collectively the "Plans") pursuant to Rule 12b-1 under the 1940 Act. The Plans provide that, as compensation for administrative and other services provided to these classes, the Distributor’s activities and expenses related to the sale and distribution of these classes, and ongoing services provided to investors in these classes, the Distributor receives from each of these classes a fee at the annual rate of 0.25% of Class A’s and 1.00% of Class C’s average daily net assets. The Distributor receives this amount to provide
distribution and shareholder servicing for these classes and pays a portion of it to institutions that provide such services. Those institutions may use the payments for, among other purposes, compensating employees engaged in sales and/or shareholder servicing. The amount of fees paid by each class during any year may be more or less than the cost of distribution and other services provided to that class. FINRA rules limit the amount of annual distribution fees that may be paid by a mutual fund and impose a ceiling on the cumulative distribution fees paid. The Trust’s Plans comply with those rules.
Class A shares of the Fund are generally sold with an initial sales charge of up to 5.75% and no contingent deferred sales charge ("CDSC"), except that a CDSC of 1.00% applies to certain redemptions made within 18 months following purchases of $1 million or more without an initial sales charge. Class C shares of the Fund are sold with no initial sales charge and a 1.00% CDSC if shares are sold within one year after purchase.
For the six months ended April 30, 2024, the Distributor, acting as underwriter and broker-dealer, received net initial sales charges from the purchase of Class A shares and CDSCs from the redemption of Class A and Class C shares as follows:
Note C—Securities Transactions:
During the six months ended April 30, 2024, there were purchase and sale transactions of long-term securities (excluding swaps, futures and written option contracts) as follows:
| | | Covers on
Securities
Sold
Short |
| | | |
During the six months ended April 30, 2024, no brokerage commissions on securities transactions were paid to affiliated brokers.
Note D—Fund Share Transactions:
Share activity for the six months ended April 30, 2024, and for the year ended October 31, 2023, was as follows:
| For the Six Months Ended April 30, 2024 | For the Year Ended October 31, 2023 |
| | Shares
Issued on
Reinvestment
of Dividends
and
Distributions | | | | Shares
Issued on
Reinvestment
of Dividends
and
Distributions | | |
|
| | | | | | | | |
| | | | | | | | |
| | | | | | | | |
Other: At April 30, 2024, there were no affiliated persons, as defined in the 1940 Act, owning the Fund's outstanding shares.
Note E—Line of Credit:
At April 30, 2024, the Fund was a participant in a syndicated committed, unsecured $700,000,000 line of credit (the "Credit Facility"), to be used only for temporary or emergency purposes. Series of other investment companies managed by NBIA also participate in this line of credit on substantially the same terms. Interest is charged on borrowings under this Credit Facility at the highest of (a) a federal funds effective rate plus 1.00% per annum, (b) a daily simple Secured Overnight Financing Rate ("SOFR") plus 1.10% per annum, or (c) an overnight bank funding rate plus 1.00% per annum. The Credit Facility has an annual commitment fee of 0.15% per annum of the available line of credit, which is paid quarterly. The Fund has agreed to pay its pro rata share of the annual commitment fee, based on the ratio of its individual net assets to the net assets of all participants at the time the fee is due, and interest charged on any borrowing made by such Fund and other costs incurred by such Fund. Because several funds participate in the Credit Facility, there is no assurance that an individual fund will have access to all or any part of the $700,000,000 at any particular time. There were no loans outstanding for the Fund under the Credit Facility at April 30, 2024. During the six months ended April 30, 2024, the Fund did not use the Credit Facility.
Note F—Recent Accounting Pronouncements:
In June 2022, FASB issued Accounting Standards Update No. 2022-03, "Fair Value Measurement of Equity Securities Subject to Contractual Sale Restrictions" ("ASU 2022-03"). ASU 2022-03 clarifies the guidance in ASC 820, related to the measurement of the fair value of an equity security subject to contractual sale restrictions, where it eliminates the ability to apply a discount to the fair value of these securities, and introduces disclosure requirements related to such equity securities. The guidance is effective for fiscal years, and interim periods within those fiscal years, beginning after December 15, 2023, and allows for early adoption. Management is currently evaluating the impact of applying this update.
In December 2022, the FASB issued Accounting Standards Update No. 2022-06, "Reference Rate Reform (Topic 848)" ("ASU 2022-06"), which is an update to Accounting Standards Update No. 2021-01,"Reference Rate Reform (Topic 848)" ("ASU 2021-01") and defers the sunset date for applying the reference rate reform relief in Topic 848. ASU 2021-01 is an update of ASU 2020-04, which is in response to concerns about structural risks of interbank offered rates, and particularly the risk of cessation of LIBOR. Regulators have undertaken reference rate reform initiatives to identify alternative reference rates that are more observable or transaction based and less susceptible to manipulation. ASU 2020-04 provides optional guidance for a limited period of time to ease the potential burden in accounting for (or recognizing the effects of) reference rate reform on financial reporting. ASU 2020-04 is elective and applies to all entities, subject to meeting certain criteria, that have contracts, hedging relationships, and other transactions that reference LIBOR or another reference rate expected to be discontinued because of reference rate reform. The ASU 2021-01 update clarifies that certain optional expedients and exceptions in Topic 848 for contract modifications and hedge accounting apply to derivatives that are affected by the discounting transition. The amendments in this update are effective immediately through December 31, 2024, for all entities. Management does not expect ASU 2022-06 to have a material impact on the Fund's financial statements.
Note G—Unaudited Financial Information:
The financial information included in this interim report is taken from the records of the Fund without audit by an independent registered public accounting firm. Annual reports contain audited financial statements.
This page has been left blank intentionally
The following table includes selected data for a share outstanding throughout each period and other performance information derived from the Consolidated Financial Statements (Financial Statements for the years ended October 31, 2021, 2020 and 2019, respectively). Amounts that do not round to $0.01 or $(0.01) per share are presented as $0.00 or $(0.00), respectively. Ratios that do not round to 0.01% or (0.01)% are presented as 0.00% or (0.00)%, respectively. Net Assets with a zero balance, if any, may reflect actual amounts rounding to less than $0.1 million. A "—" indicates that the line item was not applicable in the corresponding period.
| Net Asset
Value,
Beginning
of Period | Net
Investment
Income/
(Loss)a | Net Gains
or
(Losses) on
Securities
(both
realized
and
unrealized) | Total From
Investment
Operations | Dividends
from Net
Investment
Income | Distributions
from Net
Realized
Capital
Gains | | |
|
|
| | | | | | | | |
| | | | | | | | |
| | | | | | | | |
| | | | | | | | |
| | | | | | | | |
| | | | | | | | |
|
|
| | | | | | | | |
| | | | | | | | |
| | | | | | | | |
| | | | | | | | |
| | | | | | | | |
| | | | | | | | |
|
|
| | | | | | | | |
| | | | | | | | |
| | | | | | | | |
| | | | | | | | |
| | | | | | | | |
| | | | | | | | |
See Notes to Consolidated Financial Highlights
Net Asset
Value,
End of
Period | | Net Assets,
End of
Period
(in millions) | Ratio
of Gross
Expenses to
Average Net
Assetsc | Ratio
of Gross
Expenses
to Average
Net Assets
(excluding
dividend
and interest
expense
relating to
short sales)c | Ratio
of Net
Expenses to
Average
Net
Assets | Ratio
of Net
Expenses
to Average
Net Assets
(excluding
dividend
and interest
expense
relating to
short sales) | Ratio
of Net
Investment
Income/
(Loss)
to
Average
Net
Assets | Portfolio
Turnover
Rate
(including
securities
sold short) | Portfolio
Turnover
Rate
(excluding
securities
sold short) |
| | | | | | | | | |
| | | | | | | | | |
| | | | | | | | | |
| | | | | | | | | |
| | | | | | | | | |
| | | | | | | | | |
| | | | | | | | | |
| | | | | | | | | |
|
| | | | | | | | | |
| | | | | | | | | |
| | | | | | | | | |
| | | | | | | | | |
| | | | | | | | | |
| | | | | | | | | |
| | | | | | | | | |
|
| | | | | | | | | |
| | | | | | | | | |
| | | | | | | | | |
| | | | | | | | | |
| | | | | | | | | |
| | | | | | | | | |
| | | | | | | | | |
Notes to Consolidated Financial Highlights Long Short Fund (Unaudited)
| Calculated based on the average number of shares outstanding during each fiscal period. |
| Total return based on per share NAV reflects the effects of changes in NAV on the performance of the Fund during each fiscal period. Returns assume income dividends and other distributions, if any, were reinvested, but do not reflect the effect of sales charges. Results represent past performance and do not indicate future results. Current returns may be lower or higher than the performance data quoted. Investment returns and principal will fluctuate and shares, when redeemed, may be worth more or less than original cost. Total return would have been lower if Management had not reimbursed and/or waived certain expenses. Total return would have been higher if Management had not recouped previously reimbursed and/or waived expenses. |
| Represents the annualized ratios of net expenses to average daily net assets if Management had not reimbursed certain expenses and/or waived a portion of the investment management fee. |
| Consolidated financial highlights. See Note A in the Notes to Consolidated Financial Statements. |
| |
| |
| The class action proceeds received in 2023, 2022, 2021, 2020 and 2019 had no impact on the Fund’s total returns for the years ended October 31, 2023, 2022, 2021, 2020 and 2019. |
| After the close of business on December 7, 2018, the Fund's Class A and Class C shares underwent a stock split. The per share data presented here has been retroactively adjusted to reflect this split. |
Investment Manager and Administrator
Neuberger Berman Investment Advisers LLC
1290 Avenue of the Americas
New York, NY 10104-0002
Shareholder Services
800.877.9700 or 212.476.8800
Intermediary Client Services 800.366.6264
Distributor
Neuberger Berman BD LLC
1290 Avenue of the Americas
New York, NY 10104-0002
Shareholder Services
800.877.9700 or 212.476.8800
Intermediary Client Services 800.366.6264
Custodian
State Street Bank and Trust Company
One Congress Street, Suite 1
Boston, MA 02114-2016
Shareholder Servicing Agent
SS&C Global Investor & Distribution Solutions, Inc.
430 West 7th Street, Suite 219189
Kansas City, MO 64105-1407
For Institutional Class Shareholders address correspondence to:
Neuberger Berman Funds
PO Box 219189
Kansas City, MO 64121-9189
Intermediary Client Services 800.366.6264
For Class A, Class C and Class R6 Shareholders:
Please contact your investment provider
Legal Counsel
K&L Gates LLP
1601 K Street, NW
Washington, DC 20006-1600
Independent Registered Public Accounting Firm
Ernst & Young LLP
200 Clarendon Street
Boston, MA 02116
Proxy Voting Policies and Procedures
A description of the policies and procedures that the Trust uses to determine how to vote proxies relating to portfolio securities is available, without charge, by calling 800-877-9700 (toll-free) and on the SEC’s website at www.sec.gov. Information regarding how the Trust voted proxies relating to portfolio securities during the most recent 12-month period ended June 30 is also available upon request, without charge, by calling 800-877-9700 (toll-free), on the SEC’s website at www.sec.gov, and on Neuberger Berman’s website at www.nb.com.
Quarterly Portfolio Schedule
The Trust files a complete schedule of portfolio holdings for each Fund with the SEC for the first and third quarters of each fiscal year as an exhibit to its report on Form N-PORT. The Trust’s Form N-PORT is available on the SEC’s website at www.sec.gov. The portfolio holdings information on Form N-PORT is available upon request, without charge, by calling 800-877-9700 (toll-free).
Neuberger Berman Investment Advisers LLC
1290 Avenue of the Americas
New York, NY 10104-0002
Retail Services: 800.877.9700
Broker-Dealer and Institutional Services: 800.366.6264/888.556.9030
www.nb.com
Statistics and projections in this report are derived from sources deemed to be reliable
but cannot be regarded as a representation of future results of the Fund. This report is prepared for the general information of shareholders and is not an offer of shares
of the Fund. Shares are sold only through the currently effective prospectus which you
can obtain by calling 877.628.2583. An investor should consider carefully a Fund’s
investment objectives, risks and fees and expenses, which are described in its prospectus, before investing.
L0088 06/24
| (b) | Not applicable to the Registrant. |
Item 2. Code of Ethics.
The Board of Trustees (“Board”) of Neuberger Berman Alternative Funds (“Registrant”) has adopted a code of ethics that applies to the Registrant’s principal executive officer, principal financial officer, principal accounting officer or controller, or persons performing similar functions (“Code of Ethics”). During the period covered by this Form N-CSR, there were no substantive amendments to the Code of Ethics and there were no waivers from the Code of Ethics granted to the Registrant’s principal executive officer, principal financial officer, principal accounting officer or controller, or persons performing similar functions.
Item 3. Audit Committee Financial Expert.
Not applicable to semi-annual reports on Form N-CSR.
Item 4. Principal Accountant Fees and Services.
Not applicable to semi-annual reports on Form N-CSR.
Item 5. Audit Committee of Listed Registrants.
| (a) | Not applicable to the Registrant. |
| (b) | Not applicable to the Registrant. |
Item 6. Investments.
| (a) | The complete schedule of investments for each series is disclosed in the Registrant’s semi-annual report, which is included in Item 1 of this Form N-CSR. |
| (b) | Not applicable to the Registrant. |
Item 7. Reserved.
Item 8. Reserved.
Item 9. Reserved.
Item 10. Reserved.
Item 11. Reserved.
Item 12. Disclosure of Proxy Voting Policies and Procedures for Closed-End Management Investment Companies.
Not applicable to the Registrant.
Item 13. Portfolio Managers of Closed-End Management Investment Companies.
Not applicable to the Registrant.
Item 14. Purchases of Equity Securities by Closed-End Management Investment Company and Affiliated Purchasers.
Not applicable to the Registrant.
Item 15. Submission of Matters to a Vote of Security Holders.
There were no changes to the procedures by which shareholders may recommend nominees to the Board.
Item 16. Controls and Procedures.
| (a) | Based on an evaluation of the disclosure controls and procedures (as defined in Rule 30a-3(c) under the Act) as of a date within 90 days of the filing date of this report, the Chief Executive Officer and President and the Treasurer and Principal Financial and Accounting Officer of the Registrant have concluded that such disclosure controls and procedures are effectively designed to ensure that information required to be disclosed by the Registrant on Form N-CSR is accumulated and communicated to the Registrant’s management to allow timely decisions regarding required disclosure. |
| (b) | There were no significant changes in the Registrant’s internal controls over financial reporting (as defined in Rule 30a-3(d) under the Act) that occurred during the period covered by this report that have materially affected, or are reasonably likely to materially affect, the Registrant’s internal control over financial reporting. |
Item 17. Disclosure of Securities Lending Activities for Closed-End Management Investment Companies.
Not applicable to the Registrant.
Item 18. Recovery of Erroneously Awarded Compensation.
Not applicable to the Registrant.
Item 19. Exhibits.
| (a)(2) | Not applicable to the Registrant. |
| (a)(4) | Not applicable to the Registrant. |
| (a)(5) | Not applicable to the Registrant. |
The certification furnished pursuant to Rule 30a-2(b) under the Act and Section 906 of the Sarbanes-Oxley Act will not be deemed “filed” for purposes of Section 18 of the Securities Exchange Act of 1934, as amended (“Exchange Act”), or otherwise subject to the liability of that section. Such certification will not be deemed to be incorporated by reference into any filing under the Securities Act of 1933, as amended, or the Exchange Act, except to the extent that the Registrant specifically incorporates it by reference.
SIGNATURES
Pursuant to the requirements of the Securities Exchange Act of 1934 and the Investment Company Act of 1940, the Registrant has duly caused this report to be signed on its behalf by the undersigned, thereunto duly authorized.
Neuberger Berman Alternative Funds
By: /s/ Joseph V. Amato
Joseph V. Amato
Chief Executive Officer and President
Date: July 2, 2024
Pursuant to the requirements of the Securities Exchange Act of 1934 and the Investment Company Act of 1940, this report has been signed below by the following persons on behalf of the Registrant and in the capacities and on the dates indicated.
By: /s/ Joseph V. Amato
Joseph V. Amato
Chief Executive Officer and President
Date: July 2, 2024
By: /s/ John M. McGovern
John M. McGovern
Treasurer and Principal Financial
and Accounting Officer
Date: July 2, 2024