UNITED STATES
SECURITIES AND EXCHANGE COMMISSION
Washington, D.C. 20549
SCHEDULE 14A INFORMATION
Proxy Statement Pursuant to Section 14(a) of
the Securities Exchange Act of 1934
(Amendment No. )
Filed by the Registrant x
Filed by a Party other than the Registrant ¨
Check the appropriate box:
| ¨ | Preliminary Proxy Statement | |
| ¨ | Confidential, for Use of the Commission Only (as permitted by Rule 14a-6(e)(2)) | |
| ¨ | Definitive Proxy Statement | |
| ¨ | Definitive Additional Materials | |
| x | Soliciting Material Pursuant to § 240.14a-12 | |
PIKE CORPORATION
(Name of Registrant as Specified In Its Charter)
(Name of Person(s) Filing Proxy Statement, if other than the Registrant)
Payment of Filing Fee (Check the appropriate box):
| x | No fee required. | |||
| ¨ | Fee computed on table below per Exchange Act Rules 14a-6(i)(1) and 0-11. | |||
| (1) | Title of each class of securities to which transaction applies:
| |||
| (2) | Aggregate number of securities to which transaction applies:
| |||
| (3) | Per unit price or other underlying value of transaction computed pursuant to Exchange Act Rule 0-11 (set forth the amount on which the filing fee is calculated and state how it was determined):
| |||
| (4) | Proposed maximum aggregate value of transaction:
| |||
| (5) | Total fee paid:
| |||
| ¨ | Fee paid previously with preliminary materials. | |||
| ¨ | Check box if any part of the fee is offset as provided by Exchange Act Rule 0-11(a)(2) and identify the filing for which the offsetting fee was paid previously. Identify the previous filing by registration statement number, or the Form or Schedule and the date of its filing. | |||
| (1) | Amount Previously Paid:
| |||
| (2) | Form, Schedule or Registration Statement No.:
| |||
| (3) | Filing Party:
| |||
| (4) | Date Filed:
| |||
As previously disclosed, on August 4, 2014, Pike Corporation, a North Carolina corporation (the “Company”), entered into an Agreement and Plan of Merger (the “Merger Agreement”) with Pioneer Parent, Inc., a Delaware corporation (“Parent”), and Pioneer Merger Sub, Inc., a North Carolina corporation and a direct, wholly-owned subsidiary of Parent (“Merger Sub”), providing for the merger of Merger Sub with and into the Company (the “Merger”), with the Company surviving the Merger as a wholly-owned subsidiary of Parent. A description of certain terms of the Merger Agreement is set forth in the Company’s Current Report on Form 8-K filed with the Securities and Exchange Commission (the “SEC”) on August 4, 2014 and incorporated herein by reference.
In connection with the proposed debt financing for the Merger, the Company intends to provide potential lenders with certain information with respect to the Company, the Merger Agreement and related information Parent requested be provided to such lenders in connection with such lenders’ evaluation of the proposed debt. A copy of the presentation materials is disclosed below; certain information contained therein has not been previously publicly disclosed.
Public Side Lender Presentation
September 11, 2014
Disclaimer
Each recipient, by accepting a copy of this Lenders’ Presentation, acknowledges that it is receiving confidential information and agrees with Pike Corporation (“Pike”) and J.P. Morgan Securities LLC (the “Lead Arranger”) that it shall keep such information confidential, will not disclose any such information to any person or entity other than those representatives of such recipient who are directly involved in the analysis of the credit facilities and will use such information only in connection with its evaluation of the credit facilities, provided that such recipient shall be permitted to disclose such information in the event that it is required to do so by law or regulation or requested to do so by any governmental agency or other regulatory authority having jurisdiction over it or is required to disclose such information in connection with any legal proceedings.
Statements in this presentation that are not historical facts are forward-looking statements. Forward-looking statements are based on Pike’s current expectations and beliefs and involve risks, uncertainties and assumptions. While the information provided herein is believed to be accurate and reliable, neither Pike nor the Lead Arranger makes any representation or warranty, express or implied, as to the accuracy or completeness of such information. Nothing contained within this presentation should be relied upon as a promise or representation as to future events or future operating results. Pike’s business is subject to a number of general risks that would affect any forward-looking statements. Such risks and other factors that may impact management’s assumptions are more particularly described in Pike’s filings with the Securities and Exchange Commission, including under the caption “Risk Factors” and “Forward Looking Statements” in its Annual Report on Form 10-K for the fiscal year ended June 30, 2013. The information contained herein speaks as of the date hereof and neither Pike nor the Lead Arranger has or undertakes any obligation to update such information as future events unfold. Estimates and assumptions are necessarily required in developing prospective financial information, and results can, and usually do, differ from those estimates and assumptions.
The information contained herein has been prepared to assist interested parties in making their own evaluation of Pike and the credit facilities and does not purport to be all-inclusive or to contain all of the information that a prospective participant may desire to achieve such evaluation.
Non-GAAP Financial Information:
This presentation contains non-GAAP financial information, specifically Pike’s earnings before interest, taxes, depreciation and amortization or “EBITDA.” A reconciliation of EBITDA to net income as determined in accordance with GAAP is presented in the Financial Overview section.
2
Presenters
Eric Pike, Chairman & Chief Executive Officer
Pike
Anthony Slater, Executive Vice President & Chief Financial Officer
Court Square Kevin Brown, Partner
J.P. Morgan Jack Smith, Managing Director
| 3 |
Agenda
I. Transaction Summary 5
II. Company Overview 12
III. Investment Highlights 18
IV. Industry and Market Overview 34
V. Financial Overview 38
VI. Q & A 45
VII. Appendix 46
| 4 |
Transaction Summary
Transaction Overview
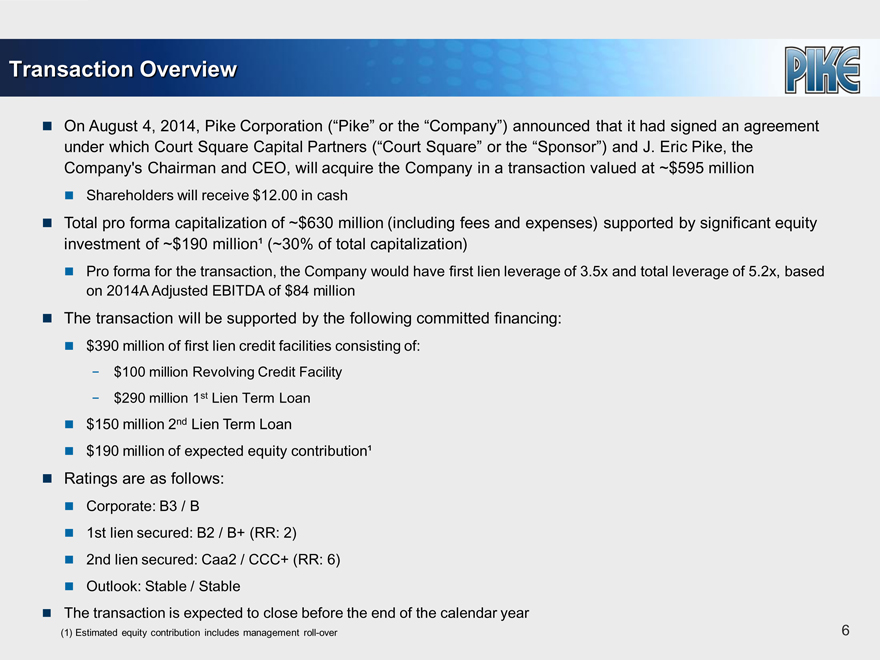
On August 4, 2014, Pike Corporation (“Pike” or the “Company”) announced that it had signed an agreement under which Court Square Capital Partners (“Court Square” or the “Sponsor”) and J. Eric Pike, the Company’s Chairman and CEO, will acquire the Company in a transaction valued at ~$595 million
Shareholders will receive $12.00 in cash
Total pro forma capitalization of ~$630 million (including fees and expenses) supported by significant equity investment of ~$190 million1 (~30% of total capitalization)
Pro forma for the transaction, the Company would have first lien leverage of 3.5x and total leverage of 5.2x, based on 2014A Adjusted EBITDA of $84 million
The transaction will be supported by the following committed financing:
$390 million of first lien credit facilities consisting of:
- $100 million Revolving Credit Facility
- $290 million 1st Lien Term Loan
$150 million 2nd Lien Term Loan
$190 million of expected equity contribution 1
Ratings are as follows:
Corporate: B3 / B
1st lien secured: B2 / B+ (RR: 2) 2nd lien secured: Caa2 / CCC+ (RR: 6) Outlook: Stable / Stable
The transaction is expected to close before the end of the calendar year
Estimated equity contribution includes management roll-over
| 6 |
Sources & Uses | Pro Forma Capitalization
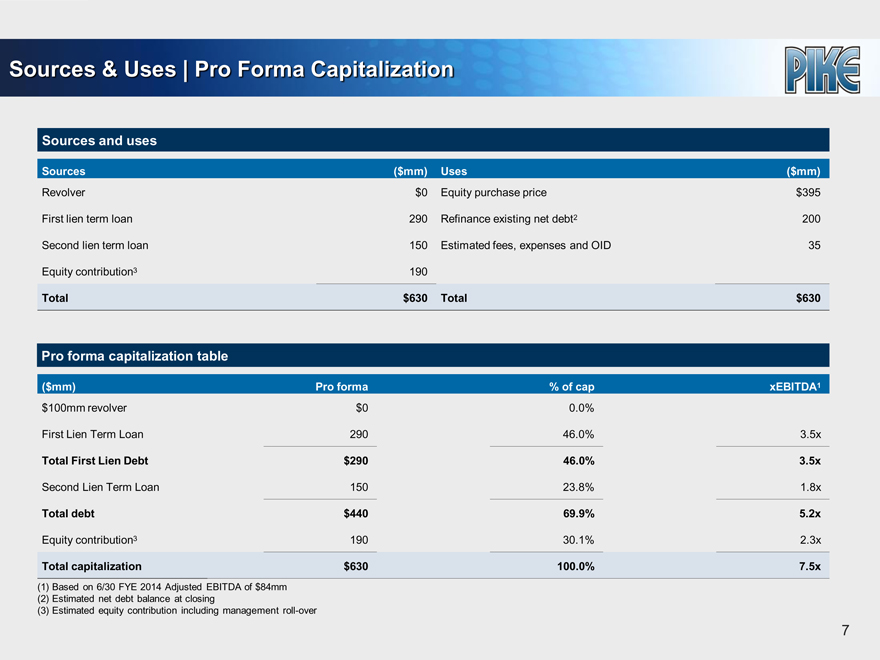
Sources and uses
Sources ($mm) Uses ($mm)
Revolver $0 Equity purchase price $395
First lien term loan 290 Refinance existing net debt2 200
Second lien term loan 150 Estimated fees, expenses and OID 35
Equity contribution3 190
Total $630 Total $630
Pro forma capitalization table
($mm) Pro forma % of cap xEBITDA1
$100mm revolver $0 0.0%
First Lien Term Loan 290 46.0% 3.5x
Total First Lien Debt $290 46.0% 3.5x
Second Lien Term Loan 150 23.8% 1.8x
Total debt $440 69.9% 5.2x
Total capitalization $630 100.0% 7.5x
Equity contribution3 190 30.1% 2.3x
(1) Based on 6/30 FYE 2014 Adjusted EBITDA of $84mm
(2) Estimated net debt balance at closing
(3) Estimated equity contribution including management roll-over
| 7 |
Summary Terms of the First Lien Credit Facilities
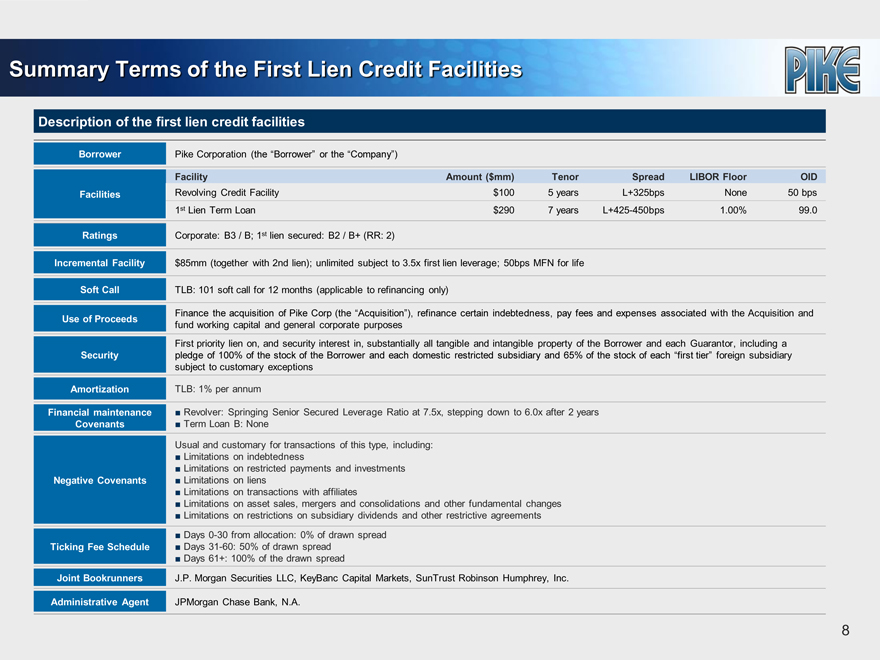
Description of the first lien credit facilities
Borrower Pike Corporation (the “Borrower” or the “Company”)
Facility Amount ($mm) Tenor Spread LIBOR Floor OID
Facilities Revolving Credit Facility $100 5 years L+325bps None 50 bps
1st Lien Term Loan $290 7 years L+425-450bps 1.00% 99.0
Ratings Corporate: B3 / B; 1st lien secured: B2 / B+ (RR: 2)
Incremental Facility $85mm (together with 2nd lien); unlimited subject to 3.5x first lien leverage; 50bps MFN for life
Soft Call TLB: 101 soft call for 12 months (applicable to refinancing only)
Use of Proceeds Finance the acquisition of Pike Corp (the “Acquisition”), refinance certain indebtedness, pay fees and expenses associated with the Acquisition and
fund working capital and general corporate purposes
First priority lien on, and security interest in, substantially all tangible and intangible property of the Borrower and each Guarantor, including a
Security pledge of 100% of the stock of the Borrower and each domestic restricted subsidiary and 65% of the stock of each “first tier” foreign subsidiary
subject to customary exceptions
Amortization TLB: 1% per annum
Financial maintenance Revolver: Springing Senior Secured Leverage Ratio at 7.5x, stepping down to 6.0x after 2 years
Covenants Term Loan B: None
Usual and customary for transactions of this type, including:
Limitations on indebtedness
Limitations on restricted payments and investments
Negative Covenants Limitations on liens
Limitations on transactions with affiliates
Limitations on asset sales, mergers and consolidations and other fundamental changes
Limitations on restrictions on subsidiary dividends and other restrictive agreements
Days 0-30 from allocation: 0% of drawn spread
Ticking Fee Schedule Days 31-60: 50% of drawn spread
Days 61+: 100% of the drawn spread
Joint Bookrunners J.P. Morgan Securities LLC, KeyBanc Capital Markets, SunTrust Robinson Humphrey, Inc.
Administrative Agent JPMorgan Chase Bank, N.A.
| 8 |
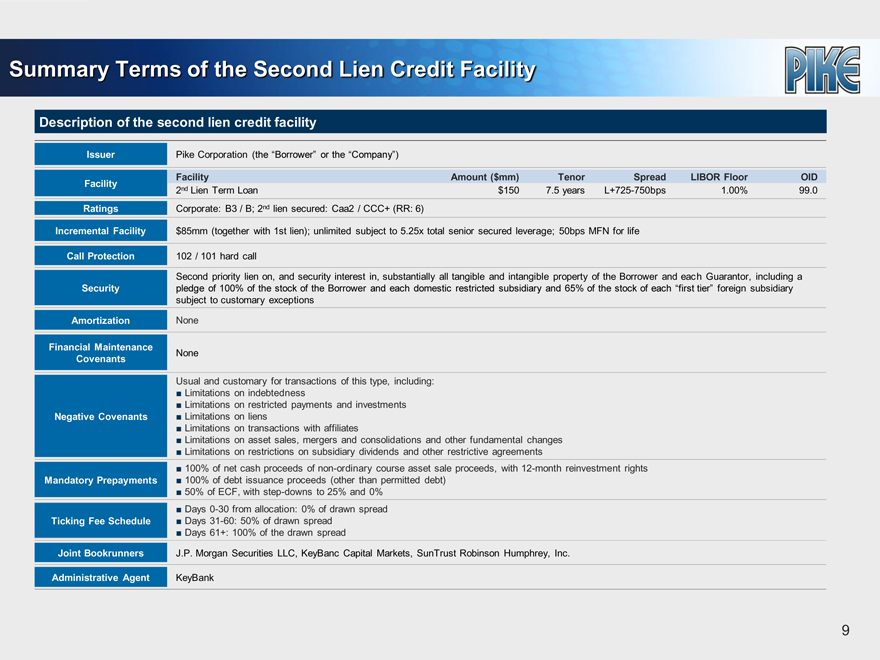
Summary Terms of the Second Lien Credit Facility
Description of the second lien credit facility
Issuer Pike Corporation (the “Borrower” or the “Company”)
Facility Amount ($mm) Tenor Spread LIBOR Floor OID
Facility 2nd Lien Term Loan $150 7.5 years L+725-750bps 1.00% 99.0
Ratings Corporate: B3 / B; 2nd lien secured: Caa2 / CCC+ (RR: 6)
Incremental Facility $85mm (together with 1st lien); unlimited subject to 5.25x total senior secured leverage; 50bps MFN for life
Call Protection 102 / 101 hard call
Second priority lien on, and security interest in, substantially all tangible and intangible property of the Borrower and each Guarantor, including a
Security pledge of 100% of the stock of the Borrower and each domestic restricted subsidiary and 65% of the stock of each “first tier” foreign subsidiary
subject to customary exceptions
Amortization None
Financial Maintenance None
Covenants
Usual and customary for transactions of this type, including:
Limitations on indebtedness
Limitations on restricted payments and investments
Negative Covenants Limitations on liens
Limitations on transactions with affiliates
Limitations on asset sales, mergers and consolidations and other fundamental changes
Limitations on restrictions on subsidiary dividends and other restrictive agreements
100% of net cash proceeds of non-ordinary course asset sale proceeds, with 12-month reinvestment rights
Mandatory Prepayments 100% of debt issuance proceeds (other than permitted debt)
50% of ECF, with step-downs to 25% and 0%
Days 0-30 from allocation: 0% of drawn spread
Ticking Fee Schedule Days 31-60: 50% of drawn spread
Days 61+: 100% of the drawn spread
Joint Bookrunners J.P. Morgan Securities LLC, KeyBanc Capital Markets, SunTrust Robinson Humphrey, Inc.
Administrative Agent KeyBank
9
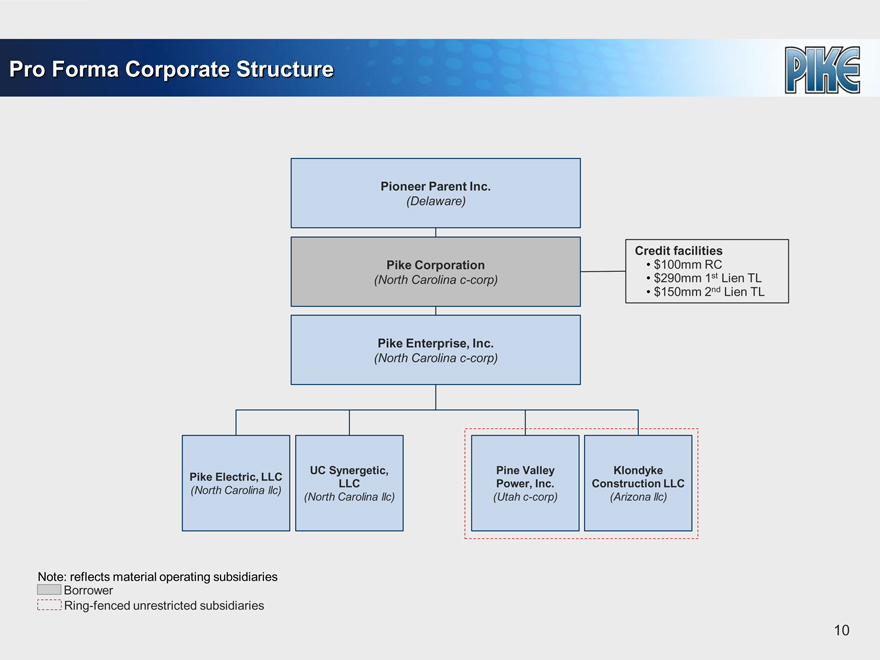
Pro Forma Corporate Structure
Pioneer Parent Inc.
(Delaware)
Pike Corporation
(North Carolina c-corp)
Pike Enterprise, Inc.
(North Carolina c-corp)
Credit facilities
$100mm RC
$290mm 1st Lien TL
$150mm 2nd Lien TL
Pike Electric, LLC
(North Carolina llc)
UC Synergetic, LLC
(North Carolina llc)
Pine Valley Power, Inc.
(Utah c-corp)
Klondyke Construction LLC
(Arizona llc)
Note: reflects material operating subsidiaries Borrower Ring-fenced unrestricted subsidiaries
10

Indicative Timeline
Bank holiday
Date Event
September 11th Lender meeting in New York
September 25th Commitments due
Prior to end of Expected closing
calendar year
11
Company Overview
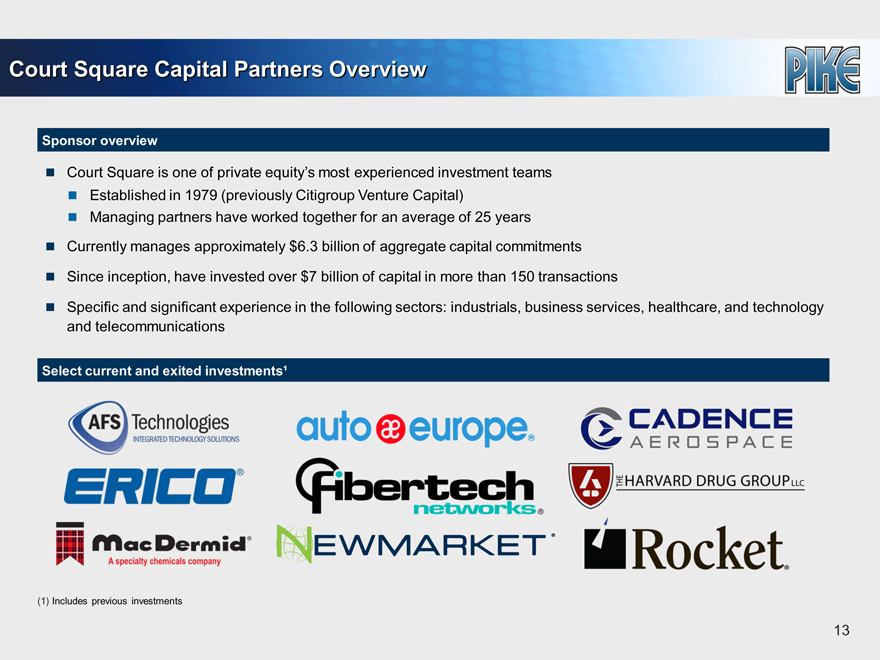
Court Square Capital Partners Overview
Sponsor overview
Court Square is one of private equity’s most experienced investment teams Established in 1979 (previously Citigroup Venture Capital) Managing partners have worked together for an average of 25 years Currently manages approximately $6.3 billion of aggregate capital commitments
Since inception, have invested over $7 billion of capital in more than 150 transactions
Specific and significant experience in the following sectors: industrials, business services, healthcare, and technology and telecommunications
Select current and exited investments¹
(1) Includes previous investments
| 13 |
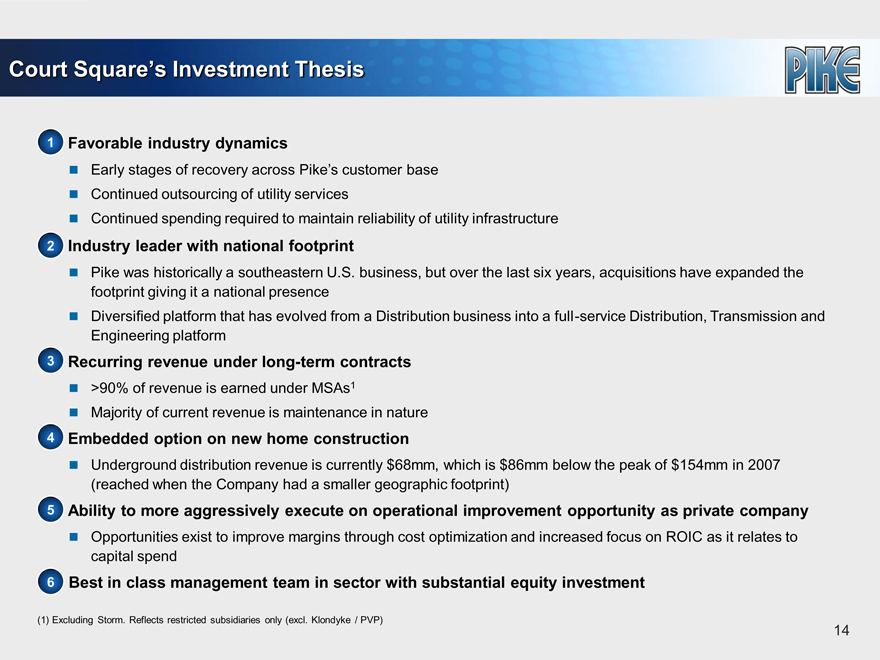
Court Square’s Investment Thesis
1 Favorable industry dynamics
Early stages of recovery across Pike’s customer base Continued outsourcing of utility services
Continued spending required to maintain reliability of utility infrastructure
2 Industry leader with national footprint
Pike was historically a southeastern U.S. business, but over the last six years, acquisitions have expanded the footprint giving it a national presence Diversified platform that has evolved from a Distribution business into a full-service Distribution, Transmission and Engineering platform
3 Recurring revenue under long-term contracts
>90% of revenue is earned under MSAs1
Majority of current revenue is maintenance in nature
4 Embedded option on new home construction
Underground distribution revenue is currently $68mm, which is $86mm below the peak of $154mm in 2007 (reached when the Company had a smaller geographic footprint)
5 Ability to more aggressively execute on operational improvement opportunity as private company
Opportunities exist to improve margins through cost optimization and increased focus on ROIC as it relates to capital spend
6 Best in class management team in sector with substantial equity investment
(1) Excluding Storm. Reflects restricted subsidiaries only (excl. Klondyke / PVP)
14
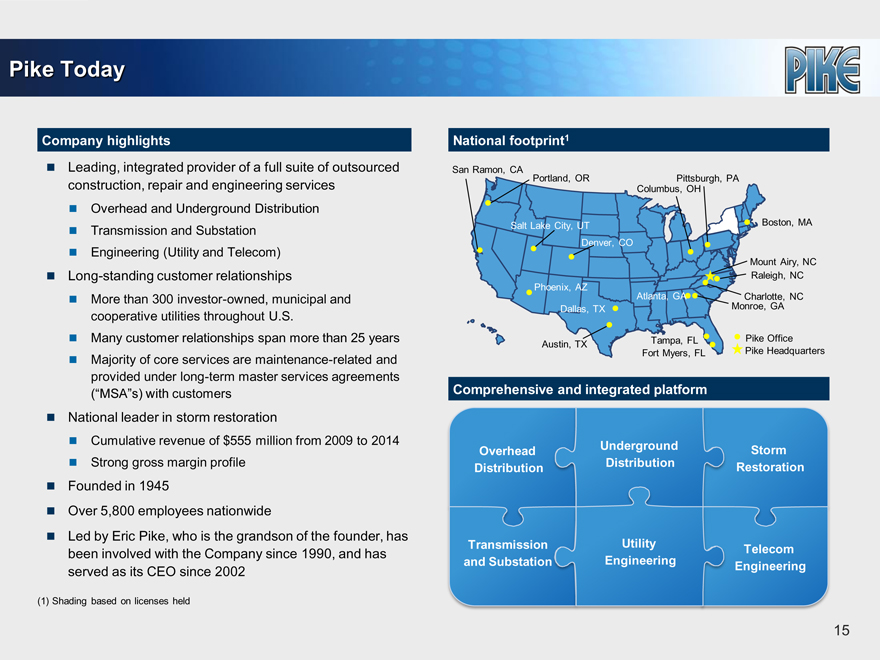
Pike Today
Company highlights
Leading, integrated provider of a full suite of outsourced construction, repair and engineering services
Overhead and Underground Distribution Transmission and Substation Engineering (Utility and Telecom)
Long-standing customer relationships More than 300 investor-owned, municipal and cooperative utilities throughout U.S.
Many customer relationships span more than 25 years Majority of core services are maintenance-related and provided under long-term master services agreements (“MSA“s) with customers
National leader in storm restoration Cumulative revenue of $555 million from 2009 to 2014 Strong gross margin profile
Founded in 1945 Over 5,800 employees nationwide
Led by Eric Pike, who is the grandson of the founder, has been involved with the Company since 1990, and has served as its CEO since 2002 (1) Shading based on licenses held National footprint1 San Ramon, CA Portland, OR Pittsburgh, PA Columbus, OH Boston, MA Mount Airy, NC Raleigh, NC Charlotte, NC Monroe, GA Pike Office Pike Headquarters
Salt Lake City, UT Denver, CO Phoenix, AZ Atlanta, GA
Dallas, TX Austin, TX Tampa, FL Fort Myers, FL
Comprehensive and integrated platform
Overhead Distribution Transmission and Substation Underground Distribution
Utility Engineering Storm Restoration Telecom Engineering
15
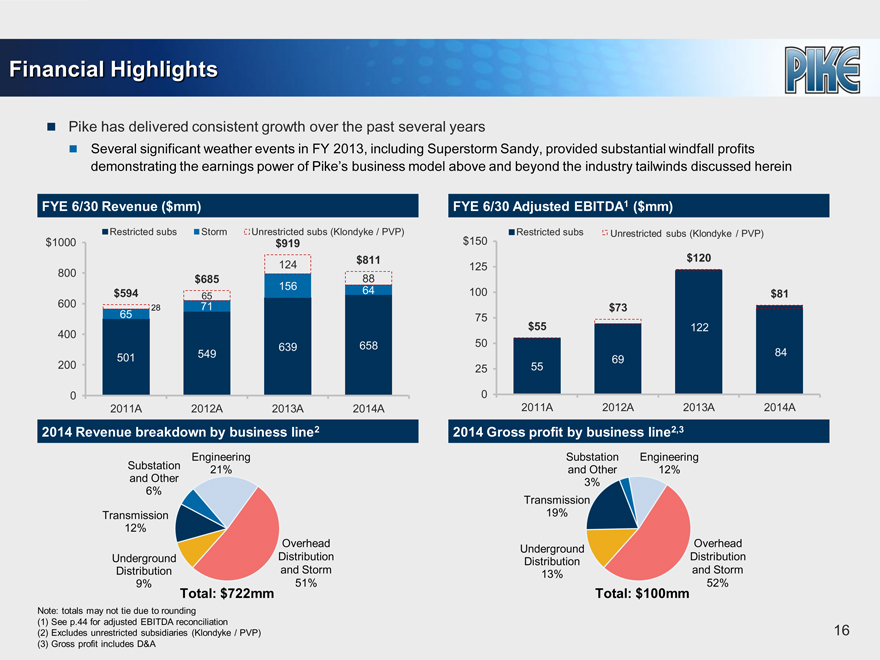
Financial Highlights
Pike has delivered consistent growth over the past several years
Several significant weather events in FY 2013, including Superstorm Sandy, provided substantial windfall profits demonstrating the earnings power of Pike’s business model above and beyond the industry tailwinds discussed herein
FYE 6/30 Revenue ($mm)
Restricted subs Storm Unrestricted subs (Klondyke / PVP)
$1000 $919
124 $811
800 $685 88
$594 156 64
65 600 28 71 65 400 639 658 200 501 549
0 2011A 2012A 2013A 2014A
FYE 6/30 Adjusted EBITDA1 ($mm)
Restricted subs Unrestricted subs (Klondyke / PVP)
$150
$120
125
100 $81
$73
75
$55 122
50
69 84
25 55
0
2011A 2012A 2013A 2014A
2014 Revenue breakdown by business line2
Substation and Other 6%
Transmission 12%
Underground Distribution 9%
Engineering 21%
Overhead Distribution and Storm 51%
Total: $722mm
Note: totals may not tie due to rounding (1) See p.44 for adjusted EBITDA reconciliation (2) Excludes unrestricted subsidiaries (Klondyke / PVP) (3) Gross profit includes D&A
2014 Gross profit by business line2,3
Substation and Other 3%
Transmission 19%
Underground Distribution 13%
Engineering 12%
Overhead Distribution and Storm 52%
Total: $100mm
16
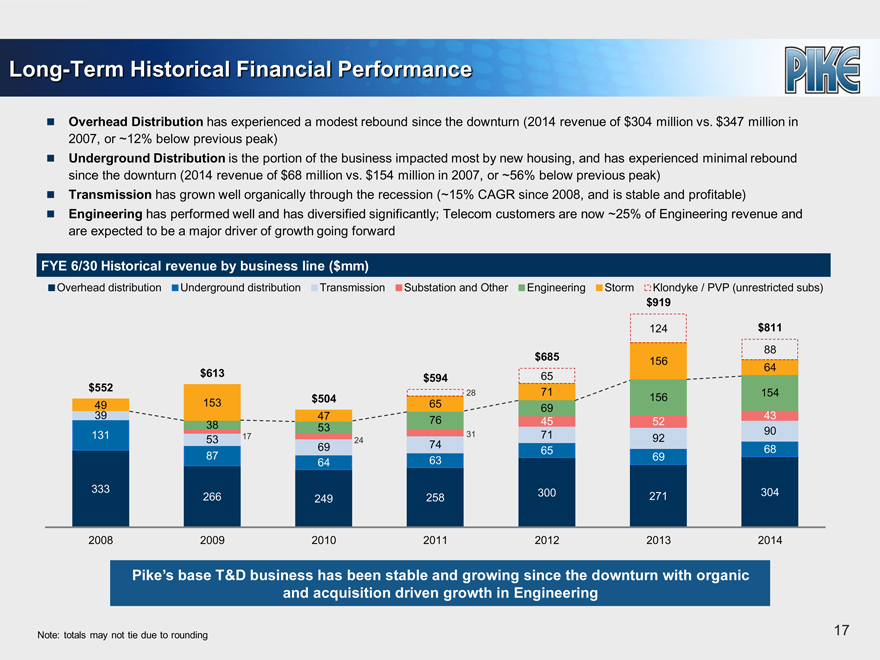
Long-Term Historical Financial Performance
Overhead Distribution has experienced a modest rebound since the downturn (2014 revenue of $304 million vs. $347 million in 2007, or ~12% below previous peak) Underground Distribution is the portion of the business impacted most by new housing, and has experienced minimal rebound since the downturn (2014 revenue of $68 million vs. $154 million in 2007, or ~56% below previous peak) Transmission has grown well organically through the recession (~15% CAGR since 2008, and is stable and profitable) Engineering has performed well and has diversified significantly; Telecom customers are now ~25% of Engineering revenue and are expected to be a major driver of growth going forward
FYE 6/30 Historical revenue by business line ($mm)
Overhead distribution Underground distribution Transmission Substation and Other Engineering Storm Klondyke / PVP (unrestricted subs)
$919
124 $811
88
$685 156
$613 $594 65 64
$552 28 71 154
49 153 $504 65 69 156
39 47 76 45 52 43
38 53 90
131 53 17 24 31 71 92
69 74 65 68
87 64 63 69
333 300 304
266 249 258 271
2008 2009 2010 2011 2012 2013 2014
Pike’s base T&D business has been stable and growing since the downturn with organic and acquisition driven growth in Engineering Note: totals may not tie due to rounding
17

Investment Highlights

Investment Highlights
1 Leading Integrated Provider of Turnkey Energy Solutions
2 Nationally Recognized Leader in Storm Response
3 Long-Standing Relationships Across Blue Chip Customer Base
4 MSAs Provide for Stable, Recurring Revenue Streams
5 Attractive, Contiguous Presence in Key Geographic Markets
6 Growth Sector with Significant Secular and Cyclical Upside
7 Best in Class Management Team with Substantial Equity Investment
19
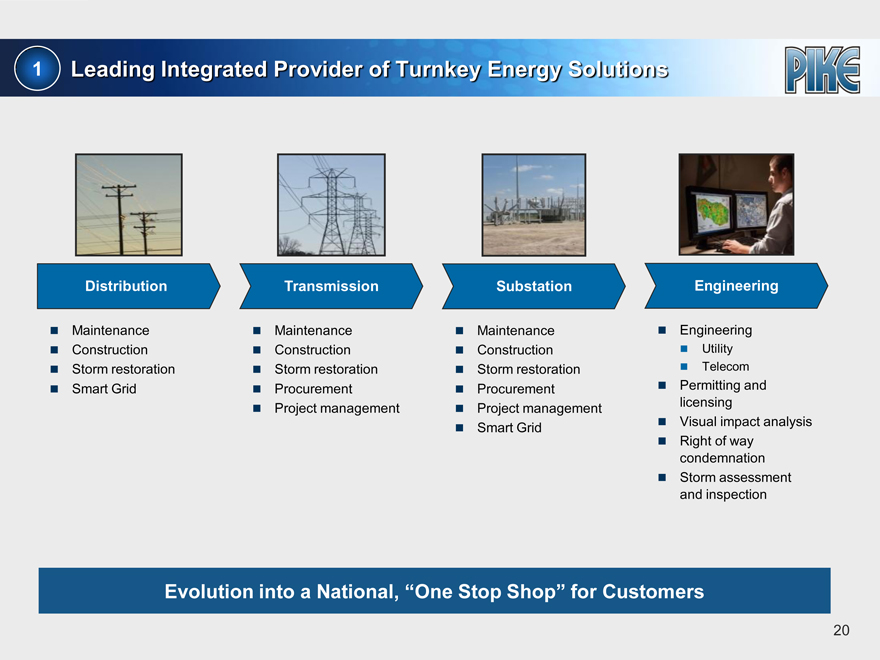
1 Leading Integrated Provider of Turnkey Energy Solutions
Distribution
Maintenance Construction Storm restoration Smart Grid
Transmission
Maintenance Construction Storm restoration Procurement Project management
Substation
Maintenance Construction Storm restoration Procurement Project management Smart Grid
Engineering
Engineering
Utility Telecom
Permitting and licensing Visual impact analysis Right of way condemnation Storm assessment and inspection
Evolution into a National, “One Stop Shop” for Customers
20
Construction Services Overview
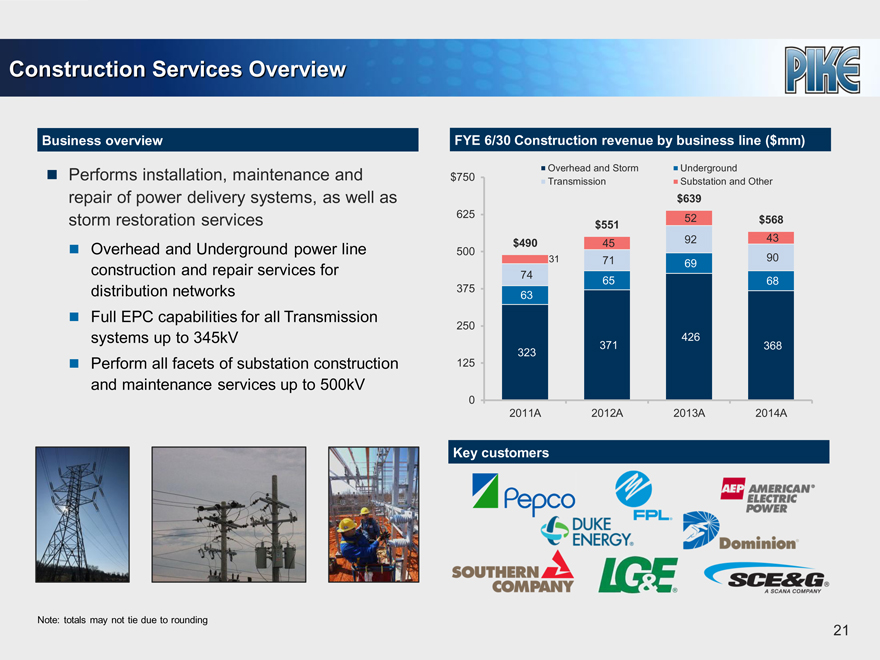
Business overview
Performs installation, maintenance and repair of power delivery systems, as well as storm restoration services
Overhead and Underground power line construction and repair services for distribution networks Full EPC capabilities for all
Transmission systems up to 345kV
Perform all facets of substation construction and maintenance services up to 500kV
Note: totals may not tie due to rounding
FYE 6/30 Construction revenue by business line ($mm)
Overhead and Storm Underground
$750 Transmission Substation and Other
$639
625 52 $568
$551
$490 45 92 43
500
31 71 69 90
74 65 68
375 63
250
426
323 371 368
125
0
2011A 2012A 2013A 2014A
Key customers
21
Overhead Distribution and Storm
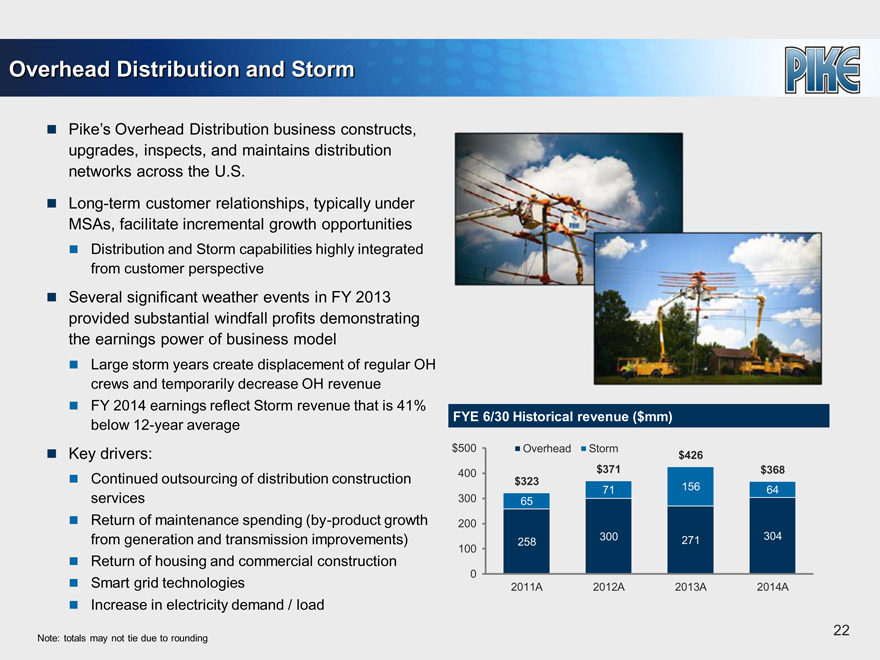
Pike’s Overhead Distribution business constructs, upgrades, inspects, and maintains distribution networks across the U.S.
Long-term customer relationships, typically under MSAs, facilitate incremental growth opportunities
Distribution and Storm capabilities highly integrated from customer perspective
Several significant weather events in FY 2013 provided substantial windfall profits demonstrating the earnings power of business model
Large storm years create displacement of regular OH crews and temporarily decrease OH revenue FY 2014 earnings reflect Storm revenue that is 41% below 12-year average
Key drivers:
Continued outsourcing of distribution construction services Return of maintenance spending (by-product growth from generation and transmission improvements) Return of housing and commercial construction Smart grid technologies Increase in electricity demand / load
Note: totals may not tie due to rounding
FYE 6/30 Historical revenue ($mm)
$500 Overhead Storm $426
400 $371 $368
$323 71 156 64
300 65
200
258 300 271 304
100
0
2011A 2012A 2013A 2014A
22
Underground Distribution
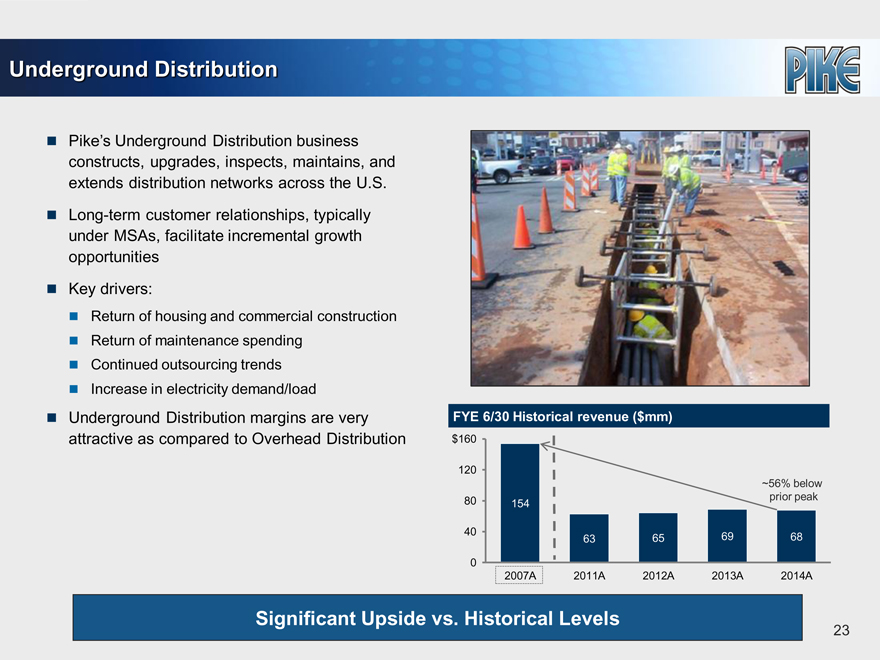
Pike’s Underground Distribution business constructs, upgrades, inspects, maintains, and extends distribution networks across the U.S. Long-term customer relationships, typically under MSAs, facilitate incremental growth opportunities Key drivers:
Return of housing and commercial construction Return of maintenance spending Continued outsourcing trends Increase in electricity demand/load
Underground Distribution margins are very attractive as compared to Overhead Distribution
FYE 6/30 Historical revenue ($mm)
$160
120
~56% below
80 154 prior peak
40 63 65 69 68
0
2007A 2011A 2012A 2013A 2014A
Significant Upside vs. Historical Levels
23
Transmission
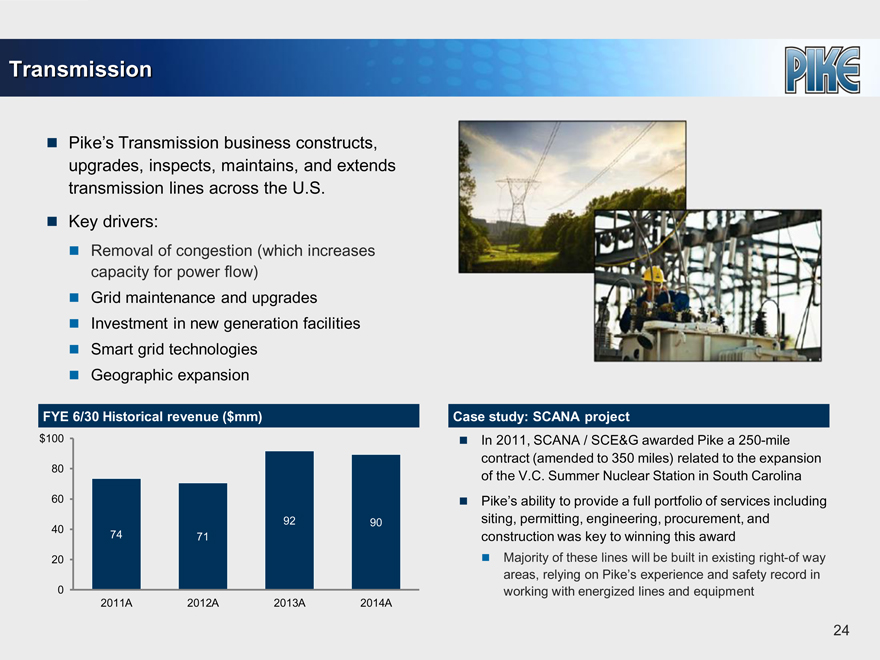
Pike’s Transmission business constructs, upgrades, inspects, maintains, and extends transmission lines across the U.S.
Key drivers:
Removal of congestion (which increases capacity for power flow) Grid maintenance and upgrades Investment in new generation facilities Smart grid technologies Geographic expansion
FYE 6/30 Historical revenue ($mm)
$100
80
60
92 90
40 74 71
20
0
2011A 2012A 2013A 2014A
Case study: SCANA project
In 2011, SCANA / SCE&G awarded Pike a 250-mile contract (amended to 350 miles) related to the expansion of the V.C. Summer Nuclear Station in South Carolina Pike’s ability to provide a full portfolio of services including siting, permitting, engineering, procurement, and construction was key to winning this award
Majority of these lines will be built in existing right-of way areas, relying on Pike’s experience and safety record in working with energized lines and equipment
24
Engineering Services Overview
Business overview
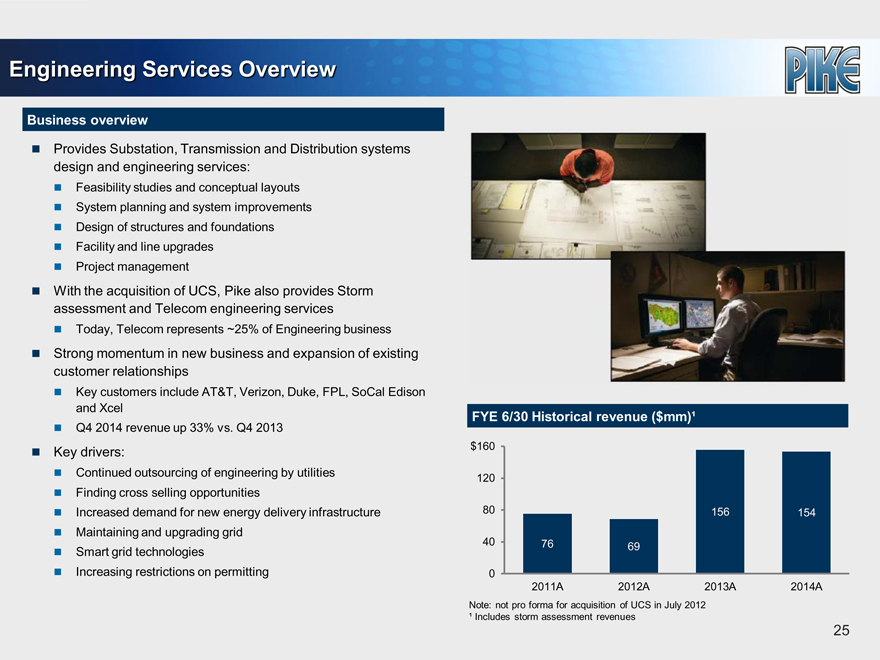
Provides Substation, Transmission and Distribution systems design and engineering services:
Feasibility studies and conceptual layouts System planning and system improvements Design of structures and foundations Facility and line upgrades Project management
With the acquisition of UCS, Pike also provides Storm assessment and Telecom engineering services
Today, Telecom represents ~25% of Engineering business
Strong momentum in new business and expansion of existing customer relationships
Key customers include AT&T, Verizon, Duke, FPL, SoCal Edison and Xcel Q4 2014 revenue up 33% vs. Q4 2013
Key drivers:
Continued outsourcing of engineering by utilities Finding cross selling opportunities Increased demand for new energy delivery infrastructure Maintaining and upgrading grid Smart grid technologies Increasing restrictions on permitting FYE 6/30 Historical revenue ($mm)¹
$160
120
80 156 154
40 76 69
0
2011A 2012A 2013A 2014A
Note: not pro forma for acquisition of UCS in July 2012
¹ Includes storm assessment revenues
25
2 Nationally Recognized Leader in Storm Response
Storm services overview
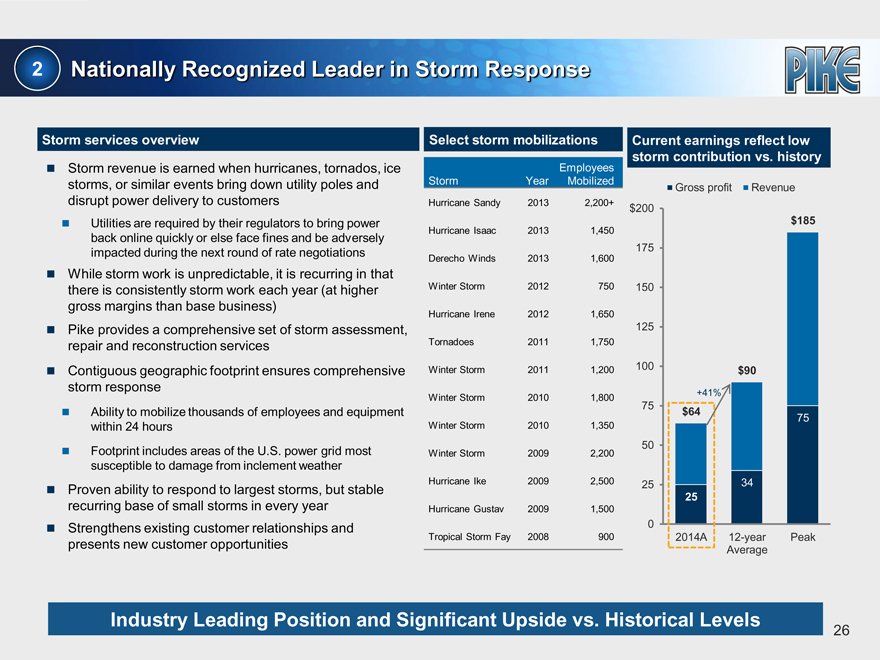
Storm revenue is earned when hurricanes, tornados, ice storms, or similar events bring down utility poles and disrupt power delivery to customers
Utilities are required by their regulators to bring power back online quickly or else face fines and be adversely impacted during the next round of rate negotiations
While storm work is unpredictable, it is recurring in that there is consistently storm work each year (at higher gross margins than base business) Pike provides a comprehensive set of storm assessment, repair and reconstruction services Contiguous geographic footprint ensures comprehensive storm response
Ability to mobilize thousands of employees and equipment within 24 hours Footprint includes areas of the U.S. power grid most susceptible to damage from inclement weather
Proven ability to respond to largest storms, but stable recurring base of small storms in every year Strengthens existing customer relationships and presents new customer opportunities
Select storm mobilizations
Employees
Storm Year Mobilized
Hurricane Sandy 2013 2,200+
Hurricane Isaac 2013 1,450
Derecho Winds 2013 1,600
Winter Storm 2012 750
Hurricane Irene 2012 1,650
Tornadoes 2011 1,750
Winter Storm 2011 1,200
Winter Storm 2010 1,800
Winter Storm 2010 1,350
Winter Storm 2009 2,200
Hurricane Ike 2009 2,500
Hurricane Gustav 2009 1,500
Tropical Storm Fay 2008 900
Current earnings reflect low
storm contribution vs. history
Gross profit Revenue
$200
$185
175
150
125
100 $90
+41%
75 $64
75
50
25 34
25
0
2014A 12-year Peak
Average
Industry Leading Position and Significant Upside vs. Historical Levels
26
3 Long-Standing Relationships Across Blue Chip Customer Base
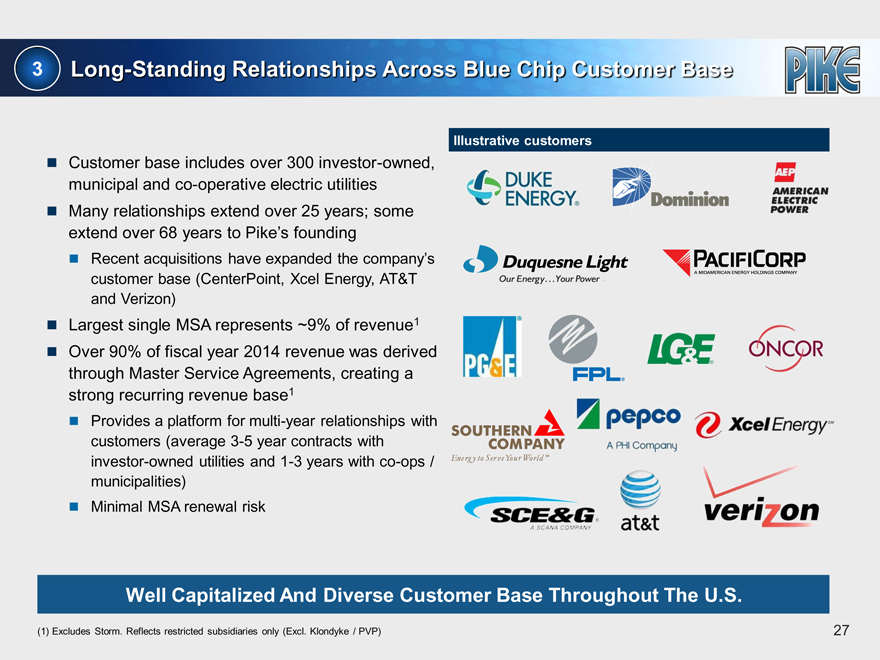
Customer base includes over 300 investor-owned, municipal and co-operative electric utilities Many relationships extend over 25 years; some extend over 68 years to Pike’s founding
Recent acquisitions have expanded the company’s customer base (CenterPoint, Xcel Energy, AT&T and Verizon)
Largest single MSA represents ~9% of revenue1 Over 90% of fiscal year 2014 revenue was derived through Master Service Agreements, creating a strong recurring revenue base1
Provides a platform for multi-year relationships with customers (average 3-5 year contracts with investor-owned utilities and 1-3 years with co-ops / municipalities) Minimal MSA renewal risk
Illustrative customers
Well Capitalized And Diverse Customer Base Throughout The U.S.
(1) Excludes Storm. Reflects restricted subsidiaries only (Excl. Klondyke / PVP)
27
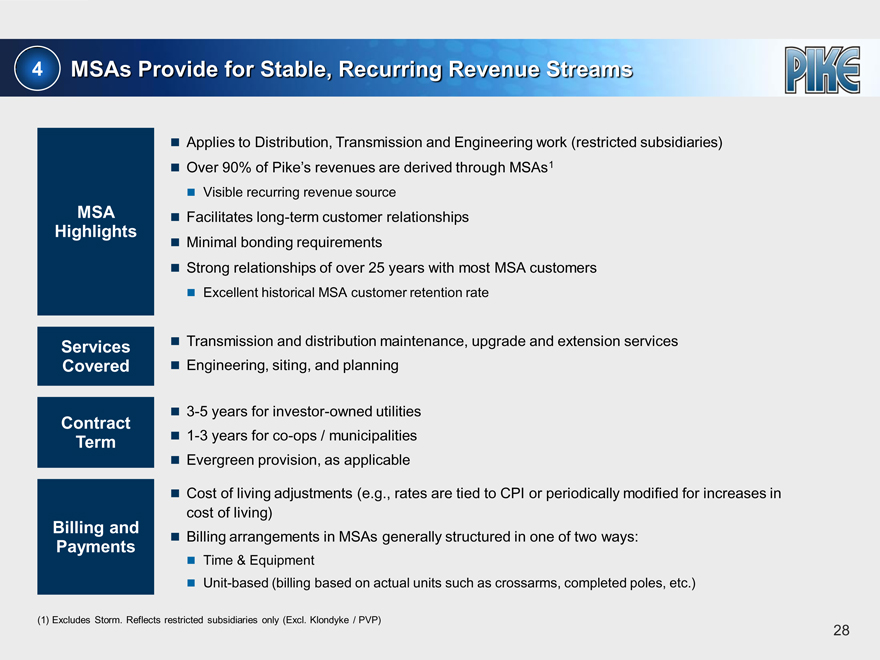
4 MSAs Provide for Stable, Recurring Revenue Streams
Applies to Distribution, Transmission and Engineering work (restricted subsidiaries)
Over 90% of Pike’s revenues are derived through MSAs1
Visible recurring revenue source
MSA Facilitates long-term customer relationships
Highlights
Minimal bonding requirements
Strong relationships of over 25 years with most MSA customers
Excellent historical MSA customer retention rate
Services Transmission and distribution maintenance, upgrade and extension services
Covered Engineering, siting, and planning
3-5 years for investor-owned utilities
Contract
Term 1-3 years for co-ops / municipalities
Evergreen provision, as applicable
Cost of living adjustments (e.g., rates are tied to CPI or periodically modified for increases in
cost of living)
Billing and
Payments Billing arrangements in MSAs generally structured in one of two ways:
Time & Equipment
Unit-based (billing based on actual units such as crossarms, completed poles, etc.)
(1) Excludes Storm. Reflects restricted subsidiaries only (Excl. Klondyke / PVP)
28
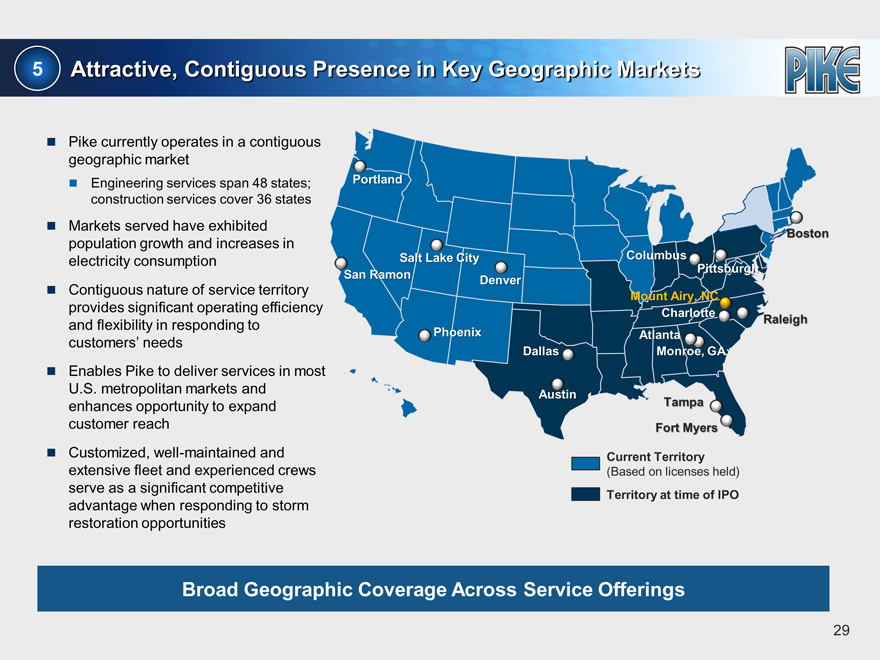
5 Attractive, Contiguous Presence in Key Geographic Markets
Pike currently operates in a contiguous geographic market
Engineering services span 48 states; construction services cover 36 states
Markets served have exhibited population growth and increases in electricity consumption Contiguous nature of service territory provides significant operating efficiency and flexibility in responding to customers’ needs Enables Pike to deliver services in most U.S. metropolitan markets and enhances opportunity to expand customer reach Customized, well-maintained and extensive fleet and experienced crews serve as a significant competitive advantage when responding to storm restoration opportunities
Portland
Boston
Salt Lake City Columbus
Pittsburgh
San Ramon Denver
Mount Airy, NC
Charlotte Raleigh
Phoenix Atlanta
Dallas Monroe, GA
Austin Tampa
Fort Myers
Current Territory
(Based on licenses held)
Territory at time of IPO
Broad Geographic Coverage Across Service Offerings 29
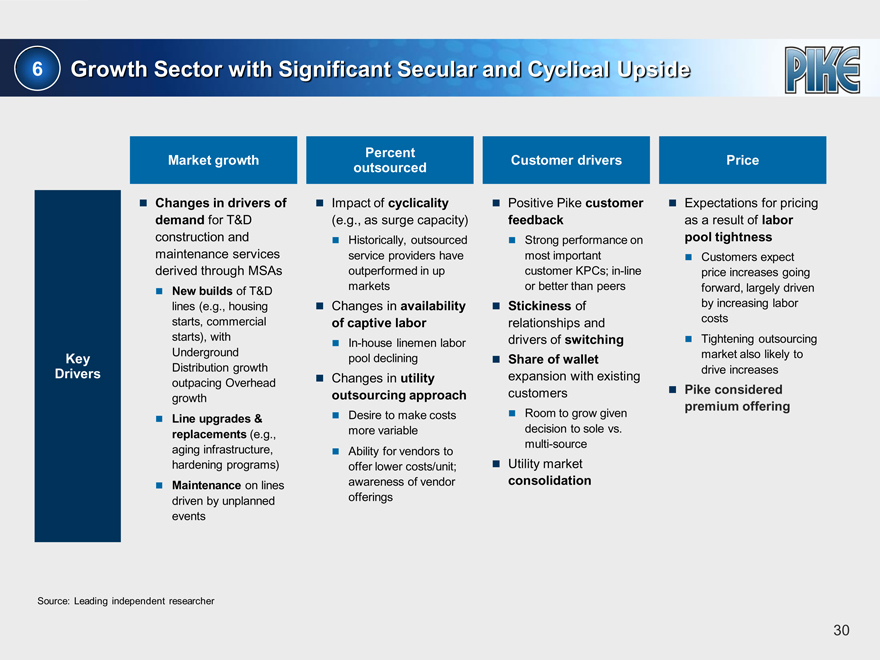
6 Growth Sector with Significant Secular and Cyclical Upside
Percent
Market growth Customer drivers Price
outsourced
Changes in drivers of Impact of cyclicality Positive Pike customer Expectations for pricing
demand for T&D (e.g., as surge capacity) feedback as a result of labor
construction and Historically, outsourced Strong performance on pool tightness
maintenance services service providers have most important Customers expect
derived through MSAs outperformed in up customer KPCs; in-line price increases going
New builds of T&D markets or better than peers forward, largely driven
lines (e.g., housing Changes in availability Stickiness of by increasing labor
starts, commercial of captive labor relationships and costs
starts), with In-house linemen labor drivers of switching Tightening outsourcing
Key Underground pool declining Share of wallet market also likely to
Drivers Distribution growth expansion with existing drive increases
outpacing Overhead Changes in utility
growth outsourcing approach customers Pike considered
premium offering
Line upgrades & Desire to make costs Room to grow given
replacements (e.g., more variable decision to sole vs.
aging infrastructure, Ability for vendors to multi-source
hardening programs) offer lower costs/unit; Utility market
Maintenance on lines awareness of vendor consolidation
driven by unplanned offerings
events
Source: Leading independent researcher
30
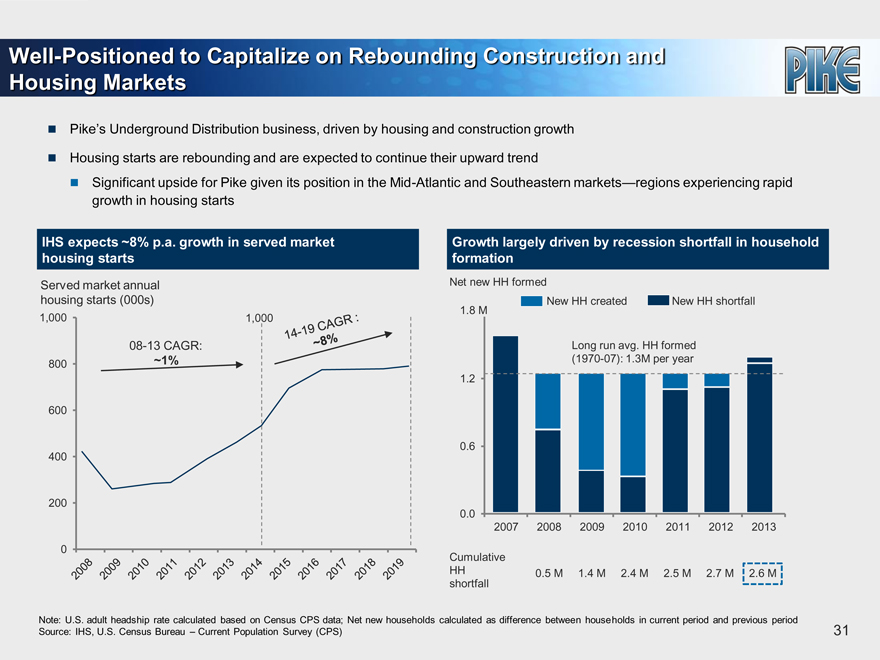
Well-Positioned to Capitalize on Rebounding Construction and Housing Markets
Pike’s Underground Distribution business, driven by housing and construction growth
Housing starts are rebounding and are expected to continue their upward trend
Significant upside for Pike given its position in the Mid-Atlantic and Southeastern markets—regions experiencing rapid growth in housing starts
IHS expects ~8% p.a. growth in served market
housing starts
Served market annual
housing starts (000s)
1,000 1,000
08-13 CAGR:
800 ~1%
600
400
200
0
14-19 EAGAR ~8%
2008 2009 2010 2011 2012 2013 2014 2015 2016 2017 2018 2019
Growth largely driven by recession shortfall in household
formation
Net new HH formed
New HH created New HH shortfall
1.8 M
Long run avg. HH formed
(1970-07): 1.3M per year
1.2
0.6
0.0
2007 2008 2009 2010 2011 2012 2013
Cumulative
HH 0.5 M 1.4 M 2.4 M 2.5 M 2.7 M 2.6 M
shortfall
Note: U.S. adult headship rate calculated based on Census CPS data; Net new households calculated as difference between households in current period and previous period Source: IHS, U.S. Census Bureau – Current Population Survey (CPS) 31
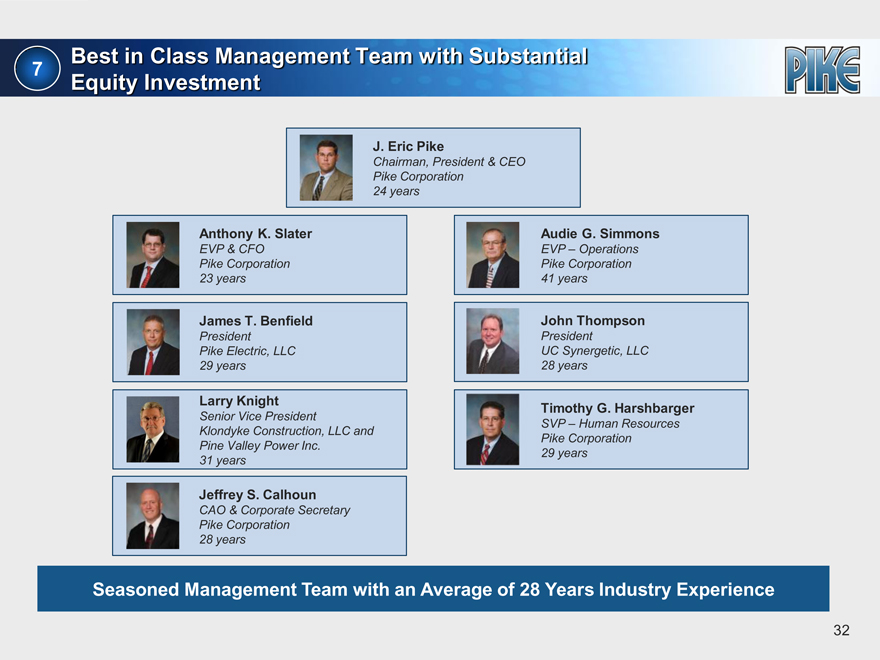
Best in Class Management Team with Substantial
7
Equity Investment
J. Eric Pike
Chairman, President & CEO Pike Corporation 24 years
Anthony K. Slater Audie G. Simmons
EVP & CFO EVP – Operations Pike Corporation Pike Corporation 23 years 41 years
James T. Benfield John Thompson
President President
Pike Electric, LLC UC Synergetic, LLC 29 years 28 years
Larry Knight
Timothy G. Harshbarger
Senior Vice President
SVP – Human Resources Klondyke Construction, LLC and Pike Corporation Pine Valley Power Inc.
29 years 31 years
Jeffrey S. Calhoun
CAO & Corporate Secretary Pike Corporation 28 years
Seasoned Management Team with an Average of 28 Years Industry Experience
32
Investment Highlights
1 Leading Integrated Provider of Turnkey Energy Solutions
2 Nationally Recognized Leader in Storm Response
3 Long-Standing Relationships Across Blue Chip Customer Base
4 MSAs Provide for Stable, Recurring Revenue Streams
5 Attractive, Contiguous Presence in Key Geographic Markets
6 Growth Sector with Significant Secular and Cyclical Upside
7 Best in Class Management Team with Substantial Equity Investment
33

Industry and Market Overview
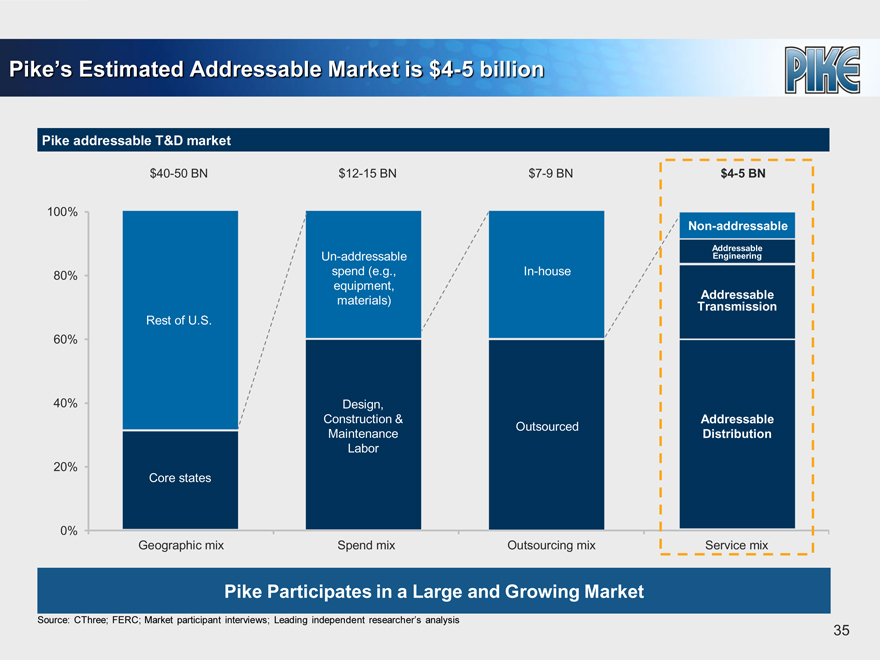
Pike’s Estimated Addressable Market is $4-5 billion
Pike addressable T&D market
$40-50 BN $12-15 BN $7-9 BN $4-5 BN
100%
Non-addressable
Addressable
Un-addressable Engineering
80% spend (e.g., In-house
equipment,
materials) Addressable
Transmission
Rest of U.S.
60%
40% Design,
Construction & Addressable
Outsourced
Maintenance Distribution
Labor
20%
Core states
0%
Geographic mix Spend mix Outsourcing mix Service mix
Pike Participates in a Large and Growing Market
Source: CThree; FERC; Market participant interviews; Leading independent researcher’s analysis
35
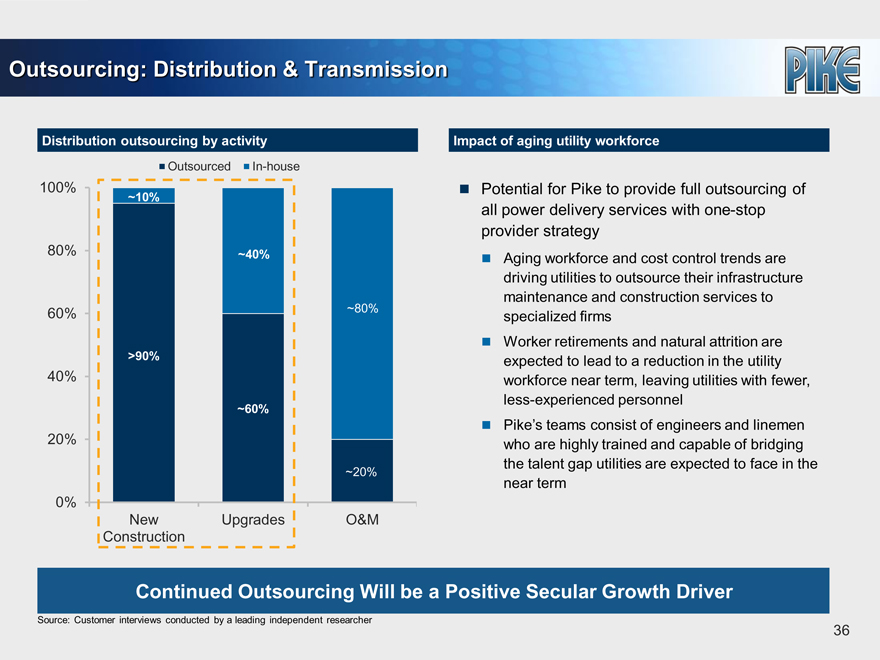
Outsourcing: Distribution & Transmission
Distribution outsourcing by activity
Outsourced In-house
100%
~10%
80% ~40%
60% ~80%
>90%
40%
~60%
20%
~20%
0%
New Upgrades O&M
Construction
Impact of aging utility workforce
Potential for Pike to provide full outsourcing of all power delivery services with one-stop provider strategy
Aging workforce and cost control trends are driving utilities to outsource their infrastructure maintenance and construction services to specialized firms Worker retirements and natural attrition are expected to lead to a reduction in the utility workforce near term, leaving utilities with fewer, less-experienced personnel Pike’s teams consist of engineers and linemen who are highly trained and capable of bridging the talent gap utilities are expected to face in the near term
Continued Outsourcing Will be a Positive Secular Growth Driver
Source: Customer interviews conducted by a leading independent researcher
36
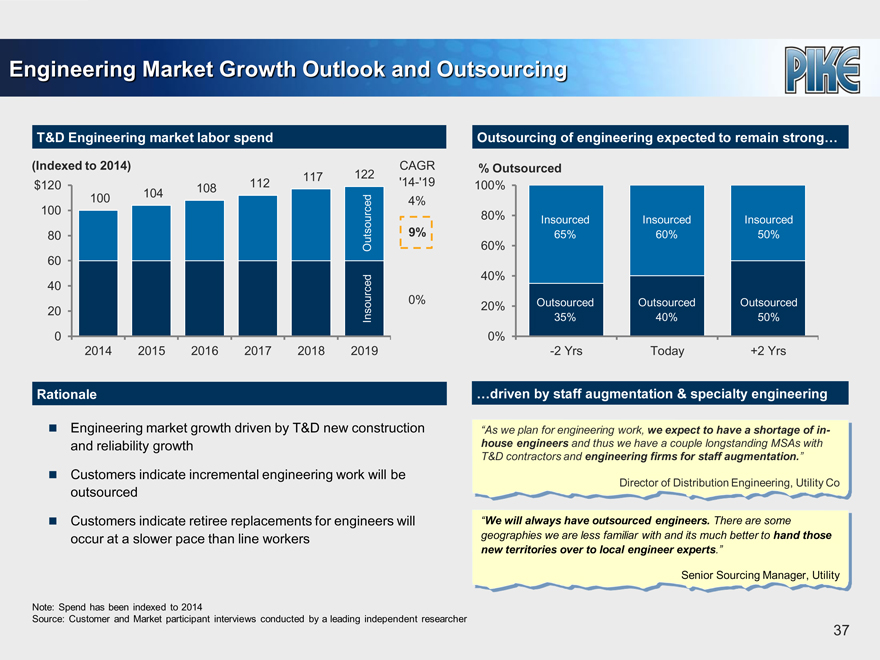
Engineering Market Growth Outlook and Outsourcing
T&D Engineering market labor spend
(Indexed to 2014) CAGR
112 117 122
$120 104 108 ‘14-‘19
100 4%
100
80 Outsourced 9%
60
40
0%
20 Insourced
0
2014 2015 2016 2017 2018 2019
Rationale
Engineering market growth driven by T&D new construction and reliability growth
Customers indicate incremental engineering work will be outsourced
Customers indicate retiree replacements for engineers will occur at a slower pace than line workers
Note: Spend has been indexed to 2014
Source: Customer and Market participant interviews conducted by a leading independent researcher
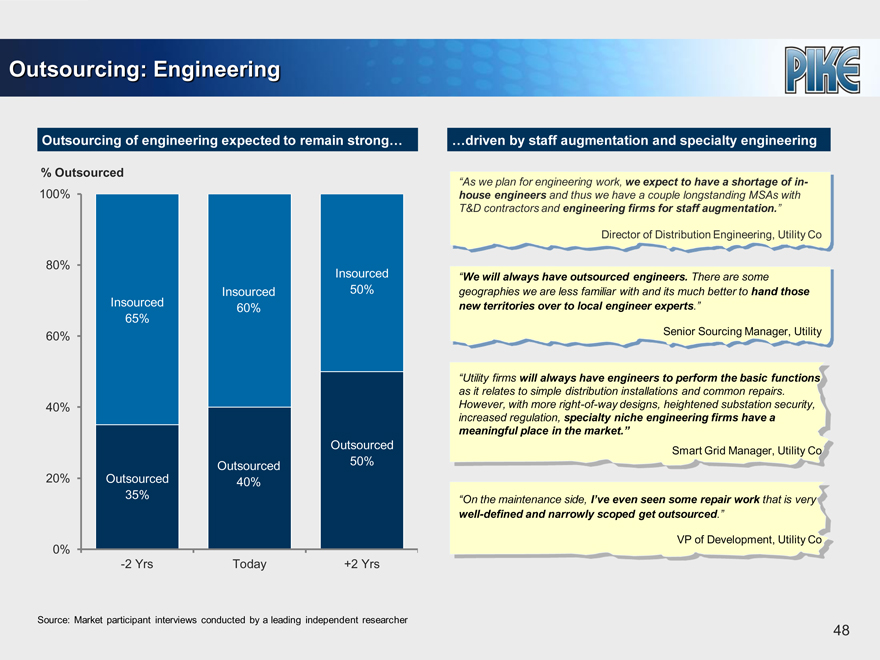
Outsourcing of engineering expected to remain strong…
% Outsourced
100%
80% Insourced Insourced Insourced
65% 60% 50%
60%
40%
20% Outsourced Outsourced Outsourced
35% 40% 50%
0%
-2 Yrs Today +2 Yrs
…driven by staff augmentation & specialty engineering
“As we plan for engineering work, we expect to have a shortage of in-house engineers and thus we have a couple longstanding MSAs
with T&D contractors and engineering firms for staff augmentation.”
Director of Distribution Engineering, Utility Co
“We will always have outsourced engineers. There are some geographies we are less familiar with and its much better to hand those new territories over to local engineer experts.”
Senior Sourcing Manager, Utility
37

Financial Overview
Financial Policies
Conservative financial policy as evidenced by lower leverage levels relative to competitors / comparables Key objective: deleverage as quickly as possible while strategically investing in the business Similar approach to Court Square’s historical investments Execute strategic initiatives to maximize EBITDA
Plan to pay down debt with excess cash flow and deleverage
Acquisitions are not expected to be a primary focus of Pike’s future growth strategy
- No acquisitions assumed in projections; all assumed growth is organic
Management incentives aligned with deleveraging goal
Compensation tied to performance goals, including EBITDA and free cash flow generation Maintain ample liquidity in the business $100 million revolving credit facility Maintain capex and working capital discipline, with increased focus on return on capital
39
Klondyke & Pine Valley Power
Acquired Klondyke and Pine Valley Power Inc. (“PVP”) in June 2010 and August 2011, respectively
Provided Pike with an expanded West Coast geographic footprint and union construction capabilities
Both businesses were profitable prior to Pike’s acquisition and continued to be profitable under Pike’s ownership through FY 2013, at which point performance started to deteriorate
Deterioration began when prior management undertook work that was new in both scope and customer focus Driven by a small number of specific projects
Senior management at Klondyke and PVP have been replaced; combined business now led by new highly-experienced executive and are being operated in close coordination with Pike corporate
Strategic shift towards more traditional MSA-oriented T&D business
Going forward, Klondyke and PVP have been ring-fenced as unrestricted subsidiaries
Cumulative cap of $15 million has been placed on future investments from restricted subsidiaries
Conservatively, business has been disregarded in the forecast period
Potential for significant upside / further enhancement of credit profile as businesses are turned around
Conservatively treated as ring-fenced subsidiaries – potential for significant upside and further credit enhancement
40
FY 2014 Financial Highlights
Restricted subsidiaries (excl. Klondyke / PVP)
FY 2013 was a high Storm year, demonstrating the power of Pike’s business model but also skewing YoY comparability on a consolidated basis Revenue totaled $722 million for FY 2014 Revenue excluding Storm totaled $658 million, up 3% YoY, primarily due to strong Distribution business. Excluding the decline in pass-through Engineering revenues, revenue was up ~5% YoY
Storm revenue totaled $64 million for FY 2014, compared to $156 million in FY 2013 Gross profit totaled $100 million, or 13.9% of revenue PF Adjusted EBITDA of $84 million
Unrestricted subsidiaries (Klondyke & PVP)
Revenue totaled $88 million for FY 2014 vs. $124 million in FY 2013, primarily due to a reduction of solar projects and a strategic shift towards more traditional MSA-oriented T&D projects EBITDA net loss of $(3.3) million in FY 2014 vs. $(1.3) million loss in FY 2013, primarily due to loss on initial PG&E projects
Note: FYE is 6/30
41
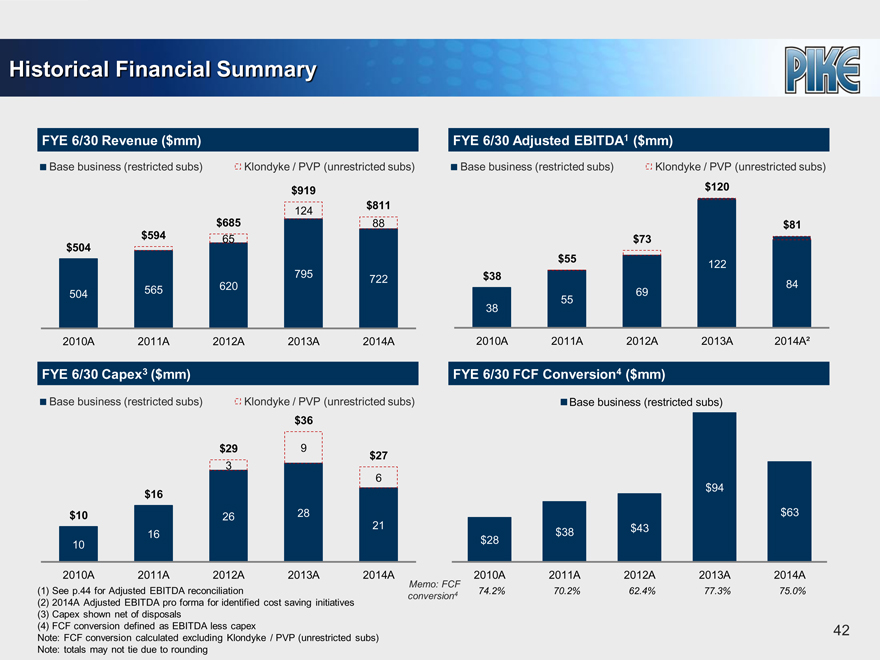
Historical Financial Summary
FYE 6/30 Revenue ($mm)
Base business (restricted subs) Klondyke / PVP (unrestricted subs) $919
124 $811 $685 88 $594 65 $504 795 722 565 620 504
2010A 2011A 2012A 2013A 2014A
FYE 6/30 Capex3 ($mm)
Base business (restricted subs) Klondyke / PVP (unrestricted subs)
$36
$29 9 $27
3 6
$16 $10 26 28 21 16 10
2010A 2011A 2012A 2013A 2014A
Memo: FCF
(1) See p.44 for Adjusted EBITDA reconciliation 4 conversion
(2) 2014A Adjusted EBITDA pro forma for identified cost saving initiatives
(3) Capex shown net of disposals
(4) FCF conversion defined as EBITDA less capex Note: FCF conversion calculated excluding Klondyke / PVP (unrestricted subs) Note: totals may not tie due to rounding
FYE 6/30 Adjusted EBITDA1 ($mm)
Base business (restricted subs) Klondyke / PVP (unrestricted subs)
$120
$81
$73
$55 122
$38
84
69
55
38
2010A 2011A 2012A 2013A 2014A²
FYE 6/30 FCF Conversion4 ($mm)
Base business (restricted subs)
$94
$63
$38 $43
$28
2010A 2011A 2012A 2013A 2014A
4 74.2% 70.2% 62.4% 77.3% 75.0%
42
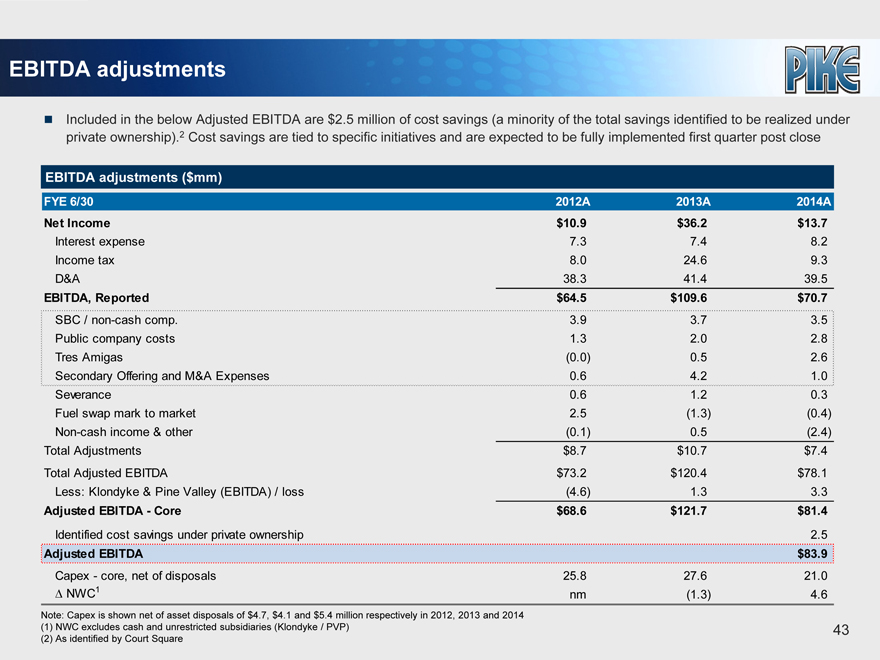
EBITDA adjustments
Included in the below Adjusted EBITDA are $2.5 million of cost savings (a minority of the total savings identified to be realized under private ownership).2 Cost savings are tied to specific initiatives and are expected to be fully implemented first quarter post close
EBITDA adjustments ($mm)
FYE 6/30 2012A 2013A 2014A
Net Income $10.9 $36.2 $13.7
Interest expense 7.3 7.4 8.2
Income tax 8.0 24.6 9.3
D&A 38.3 41.4 39.5
EBITDA, Reported $64.5 $109.6 $70.7
SBC / non-cash comp. 3.9 3.7 3.5
Public company costs 1.3 2.0 2.8
Tres Amigas (0.0) 0.5 2.6
Secondary Offering and M&A Expenses 0.6 4.2 1.0
Severance 0.6 1.2 0.3
Fuel swap mark to market 2.5 (1.3) (0.4)
Non-cash income & other (0.1) 0.5 (2.4)
Total Adjustments $8.7 $10.7 $7.4
Total Adjusted EBITDA $73.2 $120.4 $78.1
Less: Klondyke & Pine Valley (EBITDA) / loss (4.6) 1.3 3.3
Adjusted EBITDA—Core $68.6 $121.7 $81.4
Identified cost savings under private ownership 2.5
Adjusted EBITDA $83.9
Capex—core, net of disposals 25.8 27.6 21.0
NWC1 nm (1.3) 4.6
Note: Capex is shown net of asset disposals of $4.7, $4.1 and $5.4 million respectively in 2012, 2013 and 2014
| (1) | NWC excludes cash and unrestricted subsidiaries (Klondyke / PVP) |
| (2) | As identified by Court Square |
| 43 |
EBITDA adjustments (cont’d)
Set forth below is a summary of the primary EBITDA adjustments shown on the prior page
SBC and other non-cash compensation: expenses related to non-cash stock-based compensation
Public company costs: fees and expenses related to ongoing costs of being a listed public company that include board fees, investor relations, internal audit and Sarbanes Oxley, and other
Tres Amigas: unusual and non-recurring reserve adjustment in connection with engineering services provided to the planned $1.9 billion Tres Amigas “superstation” project (funding not yet received)
Secondary offering and M&A expenses
- Secondary offering: fees and expenses related to a secondary offering, a share repurchase and a special committee of the Company’s Board of Directors formed to evaluate strategic options in FY 2013
- M&A expenses: adjustment related to third party deal fees incurred in connection with the acquisitions of Pine Valley Power (FY 2012) and UC Synergetic (FY 2013), as well as the recent sale process
44

Q&A
Appendix
Outsourcing: Distribution & Transmission
Source: Customer interviews conducted by a leading independent researcher
47
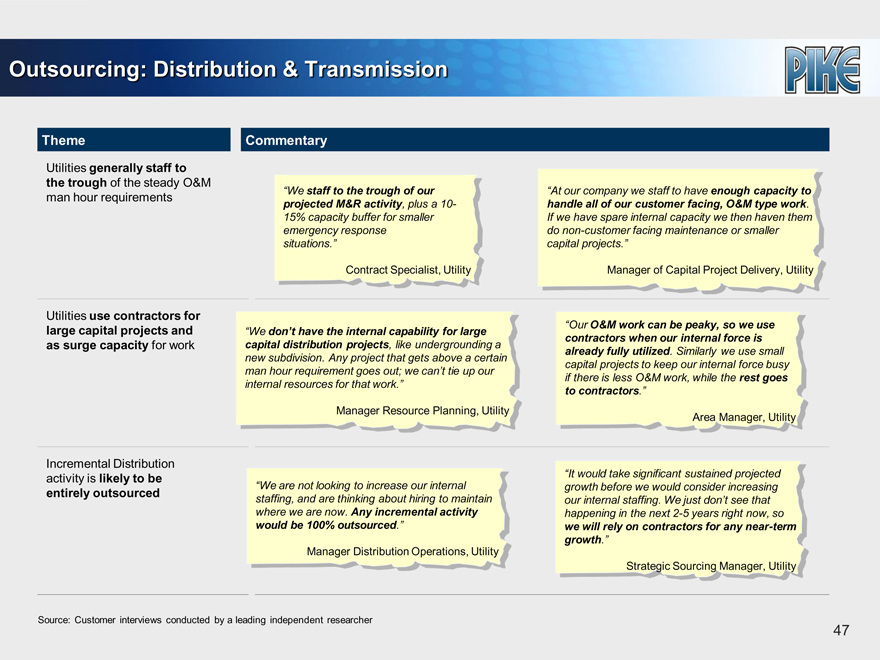
Outsourcing: Distribution & Transmission
Theme Commentary
Utilities generally staff to the trough of the steady O&M man hour requirements
Utilities use contractors for large capital projects and as surge capacity for work
Incremental Distribution activity is likely to be entirely outsourced
“We staff to the trough of our projected M&R activity, plus a 10-15% capacity buffer for smaller emergency response situations.”
Contract Specialist, Utility
“We don’t have the internal capability for large capital distribution projects, like undergrounding a new subdivision. Any project that gets above a certain man hour requirement goes out; we can’t tie up our internal resources for that work.”
Manager Resource Planning, Utility
“We are not looking to increase our internal staffing, and are thinking about hiring to maintain where we are now. Any incremental activity would be 100% outsourced.”
Manager Distribution Operations, Utility
“At our company we staff to have enough capacity to handle all of our customer facing, O&M type work. If we have spare internal capacity we then haven them do non-customer facing maintenance or smaller capital projects.”
Manager of Capital Project Delivery, Utility
“Our O&M work can be peaky, so we use contractors when our internal force is already fully utilized. Similarly we use small capital projects to keep our internal force busy if there is less O&M work, while the rest goes to contractors.”
Area Manager, Utility
“It would take significant sustained projected growth before we would consider increasing our internal staffing. We just don’t see that happening in the next 2-5 years right now, so we will rely on contractors for any near-term growth.”
Strategic Sourcing Manager, Utility
Source: Customer interviews conducted by a leading independent researcher
48
Additional Information and Where to Find It
In connection with the proposed Merger, the Company will file with the SEC and furnish to the Company’s shareholders a proxy statement and other relevant documents. This filing does not constitute a solicitation of any vote or approval. BEFORE MAKING ANY VOTING DECISION, THE COMPANY’S SHAREHOLDERS ARE URGED TO READ THE PROXY STATEMENT IN ITS ENTIRETY WHEN IT BECOMES AVAILABLE AND ANY OTHER DOCUMENTS TO BE FILED WITH THE SEC IN CONNECTION WITH THE PROPOSED MERGER OR INCORPORATED BY REFERENCE IN THE PROXY STATEMENT BECAUSE THEY WILL CONTAIN IMPORTANT INFORMATION ABOUT THE PROPOSED MERGER.
Investors will be able to obtain a free copy of the proxy statement, when available, and other relevant documents filed by the Company with the SEC at the SEC’s website athttp://www.sec.gov. In addition, investors may obtain a free copy of the proxy statement, when available, and other relevant documents from the Company’s website athttp://www.pike.com or by directing a request to: Pike Corporation, 100 Pike Way, PO Box 868, Mount Airy, North Carolina 27030, Attn: Investor Relations, (336) 719-4622.
Participants in the Solicitation
The Company and its directors, executive officers and certain other members of management and employees of the Company may be deemed to be “participants” in the solicitation of proxies from the shareholders of the Company in connection with the proposed Merger. Information regarding the interests of the persons who may, under the rules of the SEC, be considered participants in the solicitation of the shareholders of the Company in connection with the proposed Merger, which may be different than those of the Company’s shareholders generally, will be set forth in the proxy statement and the other relevant documents to be filed with the SEC. Shareholders can find information about the Company and its directors and executive officers and their ownership of the Company’s common stock in the Company’s definitive proxy statement for its most recent annual meeting of shareholders, which was filed with the SEC on September 17, 2013, and in Forms 4 of directors and executive officers filed with the SEC subsequent to that date.
Forward-Looking Statements
Any statements in this filing about prospective performance and plans for the Company, the expected timing of the completion of the proposed Merger and the ability to complete the proposed Merger, and other statements containing the words “estimates,” “believes,” “anticipates,” “plans,” “expects,” “will” and similar expressions, other than historical facts, constitute forward-looking statements within the meaning of the safe harbor provisions of the Private Securities Litigation Reform Act of 1995. Factors or risks that could cause the Company’s actual results to differ materially from the results the Company anticipates include, but are not limited to: (i) the occurrence of any event, change or other circumstance that could give rise to the termination of the Merger Agreement; (ii) the inability to complete the proposed Merger due to the failure to obtain the required shareholder approval for the proposed Merger or the failure to satisfy other conditions to completion of the proposed Merger, including that a governmental entity may prohibit, delay or refuse to grant approval for the consummation of the transaction; (iii) the failure of Parent to obtain the necessary financing arrangements as set forth in the debt and equity commitment letters delivered pursuant to the Merger Agreement, or the failure of the proposed Merger to close for any other reason; (iv) risks related to disruption of management’s attention from the Company’s ongoing business operations due to the transaction; (v) the outcome of any legal proceedings, regulatory proceedings or enforcement matters that have been or may be instituted against the Company and others relating to the Merger Agreement; (vi) the risk that the pendency of the proposed Merger disrupts current plans and operations and the potential difficulties in employee retention as a result of the pendency of the proposed Merger; (vii) the effect of the announcement of the proposed Merger on the Company’s relationships with its customers, operating results and business generally; and (viii) the amount of the costs, fees, expenses and charges related to the proposed Merger. Consider these factors carefully in evaluating the forward-looking statements. Additional factors that may cause actual results to differ materially from those described in the forward-looking statements are set forth in the Company’s Annual Report on Form 10–K for the fiscal year ended June 30, 2013, which was filed with the SEC on September 4, 2013, under the heading “Item 1A. Risk Factors,” and in subsequently filed Forms 10-Q and 8-K. The forward-looking statements represent the Company’s views as of the date on which such statements were made and, except to the extent required by applicable law or regulation, the Company undertakes no obligation to publicly update suchforward-looking statements.