Exhibit (c)(10)
|
Exhibit (c)(10)
Project Pioneer
Presentation
to the Special Committee
July 2014
Confidential
Court Square Capital Partners
|
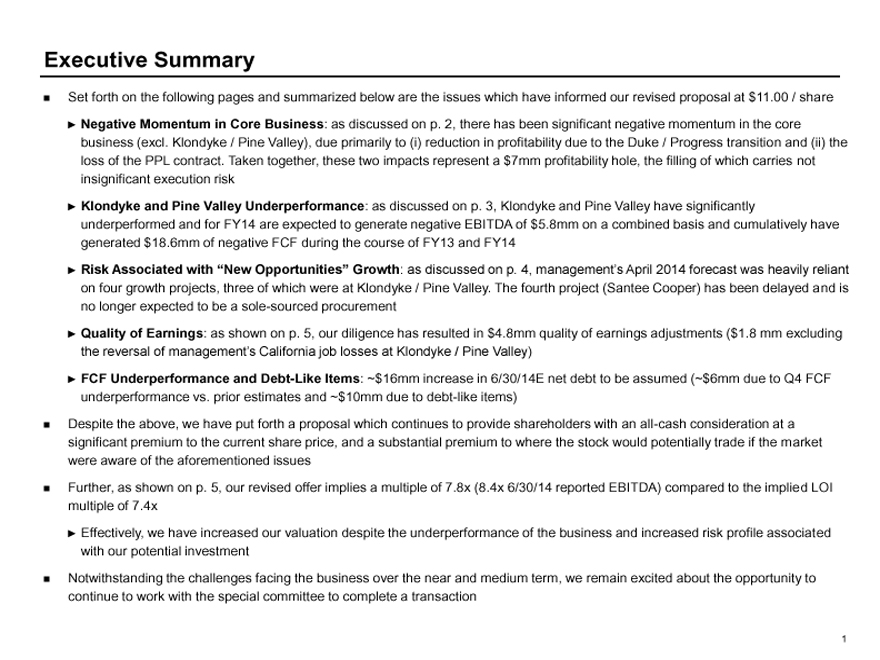
Executive Summary
Set forth on the following pages and summarized below are the issues which have informed our revised proposal at $11.00 / share
Negative Momentum in Core Business: as discussed on p. 2, there has been significant negative momentum in the core business (excl. Klondyke / Pine Valley), due primarily to (i) reduction in profitability due to the Duke / Progress transition and (ii) the loss of the PPL contract. Taken together, these two impacts represent a $7mm profitability hole, the filling of which carries not insignificant execution risk
Klondyke and Pine Valley Underperformance: as discussed on p. 3, Klondyke and Pine Valley have significantly underperformed and for FY14 are expected to generate negative EBITDA of $5.8mm on a combined basis and cumulatively have generated $18.6mm of negative FCF during the course of FY13 and FY14
Risk Associated with “New Opportunities” Growth: as discussed on p. 4, management’s April 2014 forecast was heavily reliant on four growth projects, three of which were at Klondyke / Pine Valley. The fourth project (Santee Cooper) has been delayed and is no longer expected to be a sole-sourced procurement
Quality of Earnings: as shown on p. 5, our diligence has resulted in $4.8mm quality of earnings adjustments ($1.8 mm excluding the reversal of management’s California job losses at Klondyke / Pine Valley)
FCF Underperformance and Debt-Like Items: ~$16mm increase in 6/30/14E net debt to be assumed (~$6mm due to Q4 FCF underperformance vs. prior estimates and ~$10mm due to debt-like items)
Despite the above, we have put forth a proposal which continues to provide shareholders with an all-cash consideration at a significant premium to the current share price, and a substantial premium to where the stock would potentially trade if the market were aware of the aforementioned issues
Further, as shown on p. 5, our revised offer implies a multiple of 7.8x (8.4x 6/30/14 reported EBITDA) compared to the implied LOI multiple of 7.4x
Effectively, we have increased our valuation despite the underperformance of the business and increased risk profile associated with our potential investment
Notwithstanding the challenges facing the business over the near and medium term, we remain excited about the opportunity to continue to work with the special committee to complete a transaction
1
|
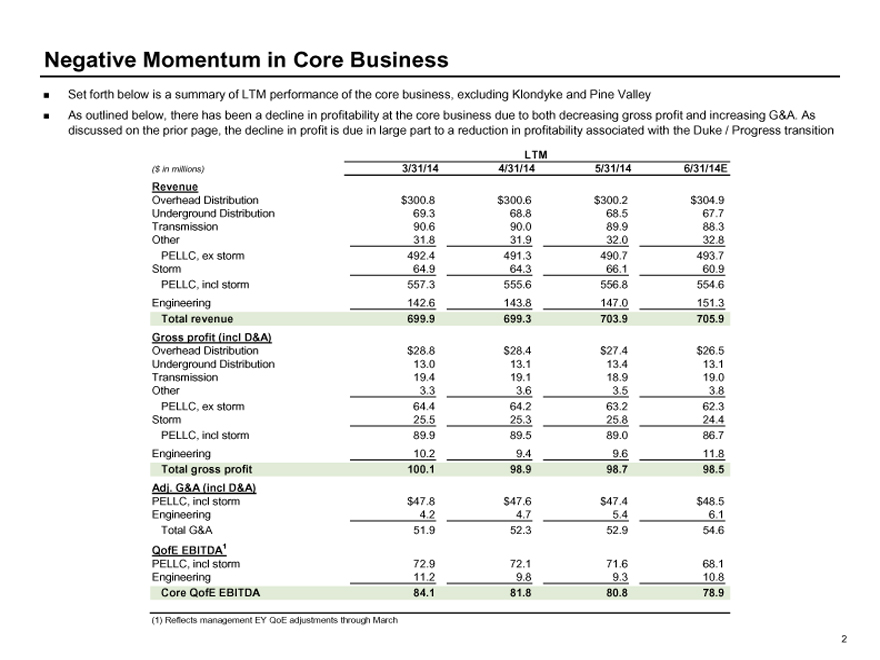
Negative Momentum in Core Business
Set forth below is a summary of LTM performance of the core business, excluding Klondyke and Pine Valley
As outlined below, there has been a decline in profitability at the core business due to both decreasing gross profit and increasing G&A. As discussed on the prior page, the decline in profit is due in large part to a reduction in profitability associated with the Duke / Progress transition
LTM
($ in millions) 3/31/14 4/31/14 5/31/14 6/31/14E
Revenue
Overhead Distribution $300.8 $300.6 $300.2 $304.9
Underground Distribution 69.3 68.8 68.5 67.7
Transmission 90.6 90.0 89.9 88.3
Other 31.8 31.9 32.0 32.8
PELLC, ex storm 492.4 491.3 490.7 493.7
Storm 64.9 64.3 66.1 60.9
PELLC, incl storm 557.3 555.6 556.8 554.6
Engineering 142.6 143.8 147.0 151.3
Total revenue 699.9 699.3 703.9 705.9
Gross profit (incl D&A)
Overhead Distribution $28.8 $28.4 $27.4 $26.5
Underground Distribution 13.0 13.1 13.4 13.1
Transmission 19.4 19.1 18.9 19.0
Other 3.3 3.6 3.5 3.8
PELLC, ex storm 64.4 64.2 63.2 62.3
Storm 25.5 25.3 25.8 24.4
PELLC, incl storm 89.9 89.5 89.0 86.7
Engineering 10.2 9.4 9.6 11.8
Total gross profit 100.1 98.9 98.7 98.5
Adj. G&A (incl D&A)
PELLC, incl storm $47.8 $47.6 $47.4 $48.5
Engineering 4.2 4.7 5.4 6.1
Total G&A 51.9 52.3 52.9 54.6
QofE EBITDA1
PELLC, incl storm 72.9 72.1 71.6 68.1
Engineering 11.2 9.8 9.3 10.8
Core QofE EBITDA 84.1 81.8 80.8 78.9
(1) Reflects management EY QoE adjustments through March
2
|
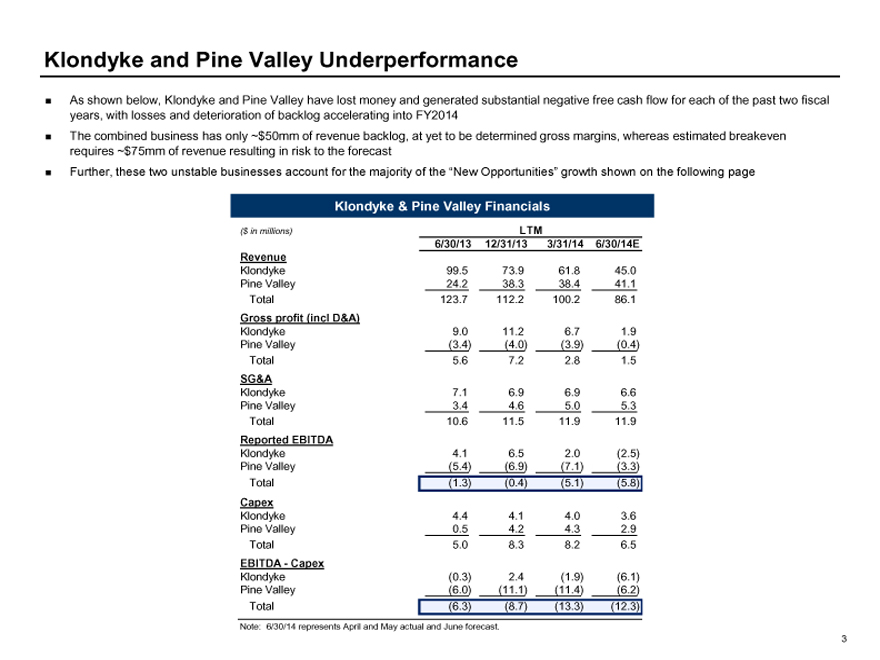
Klondyke and Pine Valley Underperformance
As shown below, Klondyke and Pine Valley have lost money and generated substantial negative free cash flow for each of the past two fiscal years, with losses and deterioration of backlog accelerating into FY2014 The combined business has only ~$50mm of revenue backlog, at yet to be determined gross margins, whereas estimated breakeven requires ~$75mm of revenue resulting in risk to the forecast
Further, these two unstable businesses account for the majority of the “New Opportunities” growth shown on the following page
Klondyke & Pine Valley Financials
($ in millions) LTM
6/30/13 12/31/13 3/31/14 6/30/14E
Revenue
Klondyke 99.5 73.9 61.8 45.0
Pine Valley 24.2 38.3 38.4 41.1
Total 123.7 112.2 100.2 86.1
Gross profit (incl D&A)
Klondyke 9.0 11.2 6.7 1.9
Pine Valley(3.4)(4.0)(3.9)(0.4)
Total 5.6 7.2 2.8 1.5
SG&A
Klondyke 7.1 6.9 6.9 6.6
Pine Valley 3.4 4.6 5.0 5.3
Total 10.6 11.5 11.9 11.9
Reported EBITDA
Klondyke 4.1 6.5 2.0(2.5)
Pine Valley(5.4)(6.9)(7.1)(3.3)
Total(1.3)(0.4)(5.1)(5.8)
Capex
Klondyke 4.4 4.1 4.0 3.6
Pine Valley 0.5 4.2 4.3 2.9
Total 5.0 8.3 8.2 6.5
EBITDA—Capex
Klondyke(0.3) 2.4(1.9)(6.1)
Pine Valley(6.0)(11.1)(11.4)(6.2)
Total(6.3)(8.7)(13.3)(12.3)
Note: 6/30/14 represents April and May actual and June forecast.
3
|
Management Forecast
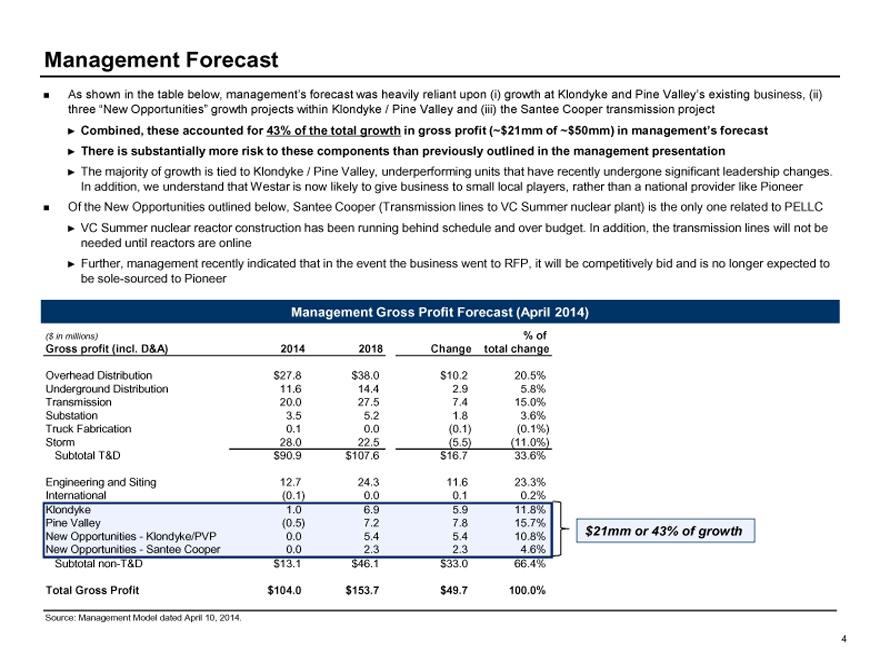
As shown in the table below, management’s forecast was heavily reliant upon (i) growth at Klondyke and Pine Valley’s existing business, (ii) three “New Opportunities” growth projects within Klondyke / Pine Valley and (iii) the Santee Cooper transmission project
Combined, these accounted for 43% of the total growth in gross profit (~$21mm of ~$50mm) in management’s forecast
There is substantially more risk to these components than previously outlined in the management presentation
The majority of growth is tied to Klondyke / Pine Valley, underperforming units that have recently undergone significant leadership changes. In addition, we understand that Westar is now likely to give business to small local players, rather than a national provider like Pioneer Of the New Opportunities outlined below, Santee Cooper (Transmission lines to VC Summer nuclear plant) is the only one related to PELLC
VC Summer nuclear reactor construction has been running behind schedule and over budget. In addition, the transmission lines will not be needed until reactors are online
Further, management recently indicated that in the event the business went to RFP, it will be competitively bid and is no longer expected to be sole-sourced to Pioneer
Management Gross Profit Forecast (April 2014)
($ in millions)% of
Gross profit (incl. D&A) 2014 2018 Change total change
Overhead Distribution $27.8 $38.0 $ 10.2 20.5%
Underground Distribution 11.6 14.4 2.9 5.8%
Transmission 20.0 27.5 7.4 15.0%
Substation 3.5 5.2 1.8 3.6%
Truck Fabrication 0.1 0.0(0.1)(0.1%)
Storm 28.0 22.5(5.5)(11.0%)
Subtotal T&D $90.9 $107.6 $ 16.7 33.6%
Engineering and Siting 12.7 24.3 11.6 23.3%
International(0.1) 0.0 0.1 0.2%
Klondyke 1.0 6.9 5.9 11.8%
Pine Valley(0.5) 7.2 7.8 15.7%
New Opportunities—Klondyke/PVP 0.0 5.4 5.4 10.8% $ 21mm or 43% of growth
New Opportunities—Santee Cooper 0.0 2.3 2.3 4.6%
Subtotal non-T&D $13.1 $46.1 $ 33.0 66.4%
Total Gross Profit $104.0 $153.7 $ 49.7 100.0%
Source: Management Model dated April 10, 2014.
4
|
Value Progression
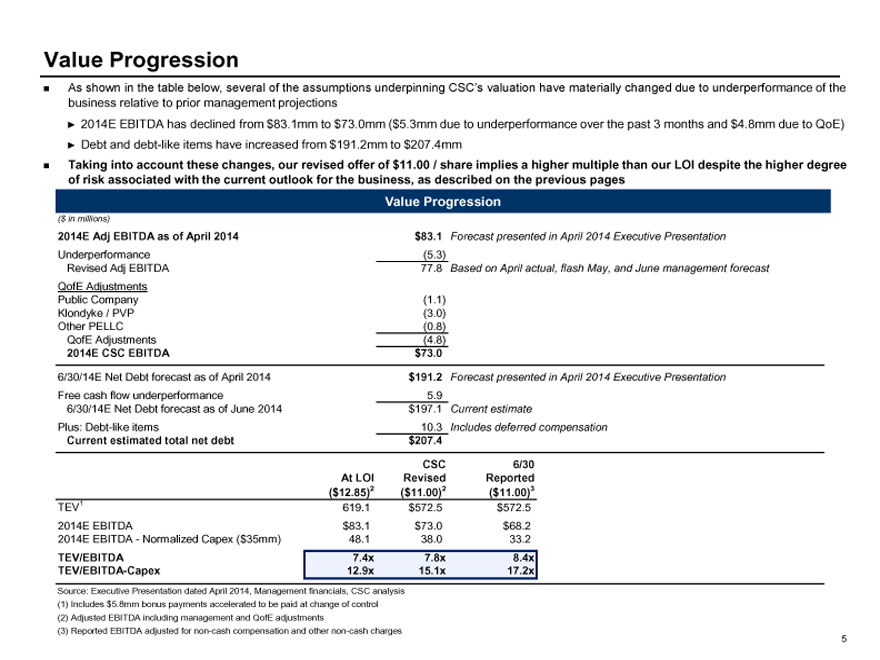
As shown in the table below, several of the assumptions underpinning CSC’s valuation have materially changed due to underperformance of the business relative to prior management projections
2014E EBITDA has declined from $83.1mm to $73.0mm ($5.3mm due to underperformance over the past 3 months and $4.8mm due to QoE)
Debt and debt-like items have increased from $191.2mm to $207.4mm
Taking into account these changes, our revised offer of $11.00 / share implies a higher multiple than our LOI despite the higher degree of risk associated with the current outlook for the business, as described on the previous pages
($ in millions)
2014E Adj EBITDA as of April 2014 $83.1 Forecast presented in April 2014 Executive Presentation
Underperformance(5.3)
Revised Adj EBITDA 77.8 Based on April actual, flash May, and June management forecast
QofE Adjustments
Public Company(1.1)
Klondyke / PVP(3.0)
Other PELLC(0.8)
QofE Adjustments(4.8)
2014E CSC EBITDA $73.0
6/30/14E Net Debt forecast as of April 2014 $191.2 Forecast presented in April 2014 Executive Presentation
Free cash flow underperformance 5.9
6/30/14E Net Debt forecast as of June 2014 $197.1 Current estimate
Plus: Debt-like items 10.3 Includes deferred compensation
Current estimated total net debt $207.4
CSC 6/30
At LOI Revised Reported
($12.85)2($11.00)2($11.00)3
TEV1 619.1 $572.5 $572.5
2014E EBITDA $83.1 $73.0 $68.2
2014E EBITDA—Normalized Capex ($35mm) 48.1 38.0 33.2
TEV/EBITDA 7.4x 7.8x 8.4x
TEV/EBITDA-Capex 12.9x 15.1x 17.2x
Source: Executive Presentation dated April 2014, Management financials, CSC analysis (1) Includes $5.8mm bonus payments accelerated to be paid at change of control (2) Adjusted EBITDA including management and QofE adjustments (3) Reported EBITDA adjusted for non-cash compensation and other non-cash charges
5