UNITED STATES
SECURITIES AND EXCHANGE COMMISSION
Washington, D.C. 20549
FORM N-CSR
CERTIFIED SHAREHOLDER REPORT OF REGISTERED MANAGEMENT INVESTMENT COMPANIES
Investment Company Act file number 811-21719
INVESTMENT MANAGERS SERIES TRUST
(Exact name of registrant as specified in charter)
235 W. Galena Street
Milwaukee, WI 53212
(Address of principal executive offices) (Zip code)
Diane J. Drake
Mutual Fund Administration, LLC
2220 E. Route 66, Suite 226
Glendora, CA 91740
(Name and address of agent for service)
(626) 385-5777
Registrant's telephone number, including area code
Date of fiscal year end: December 31
Date of reporting period: December 31, 2021
Item 1. Report to Stockholders.
| (a) | The registrant’s annual report transmitted to shareholders pursuant to Rule 30e-1 under the Investment Company Act of 1940, as amended (the “Investment Company Act”), is as follows: |

Aristotle/Saul Global Equity Fund
Class I Shares (ARSOX)
Aristotle International Equity Fund
Class I Shares (ARSFX)
Aristotle Strategic Credit Fund
Class I Shares (ARSSX)
Aristotle Value Equity Fund
Class I Shares (ARSQX)
Aristotle Small Cap Equity Fund
Class I Shares (ARSBX)
Aristotle Core Equity Fund
Class I Shares (ARSLX)
ANNUAL REPORT
December 31, 2021
Aristotle Funds
Each a series of Investment Managers Series Trust
Table of Contents
| Aristotle/Saul Global Equity Fund | |
| Shareholder Letter | 1 |
| Fund Performance | 10 |
| Schedule of Investments | 12 |
| Aristotle International Equity Fund | |
| Shareholder Letter | 16 |
| Fund Performance | 24 |
| Schedule of Investments | 25 |
| Aristotle Strategic Credit Fund | |
| Shareholder Letter | 29 |
| Fund Performance | 37 |
| Schedule of Investments | 39 |
| Aristotle Value Equity Fund | |
| Shareholder Letter | 46 |
| Fund Performance | 54 |
| Schedule of Investments | 55 |
| Aristotle Small Cap Equity Fund | |
| Shareholder Letter | 59 |
| Fund Performance | 67 |
| Schedule of Investments | 68 |
| Aristotle Core Equity Fund | |
| Shareholder Letter | 73 |
| Fund Performance | 82 |
| Schedule of Investments | 83 |
| Statements of Assets and Liabilities | 87 |
| Statements of Operations | 89 |
| Statements of Changes in Net Assets | 91 |
| Financial Highlights | 97 |
| Notes to Financial Statements | 103 |
| Report of Independent Registered Public Accounting Firm | 118 |
| Supplemental Information | 119 |
| Expense Examples | 131 |
This report and the financial statements contained herein are provided for the general information of the shareholders of the Aristotle Funds. This report is not authorized for distribution to prospective investors in the Funds unless preceded or accompanied by an effective prospectus.
www.aristotlefunds.com

Dear Fellow Shareholders,
Markets Review
In a year filled with uncertainty, global economies proved largely resilient. Even in the face of supply-chain disruptions and multiple variants of the COVID-19 virus, global recovery continued throughout the period. Themes from 2020, such as central bank policy decisions and vaccine distribution, persisted.
Overall, the MSCI ACWI Index (Net) had a full-year return of 18.54%, while the Bloomberg Global Aggregate Bond Index had a calendar-year return of -4.71%. In terms of style, value stocks outperformed their growth counterparts during the year, with the MSCI ACWI Value Index (Net) outperforming the MSCI ACWI Growth (Net) by 2.52%.
Throughout the year, investors focused on the progress of the global recovery. Although corporate revenues and earnings continued to rebound during the fourth quarter, the IMF announced a slight downward revision to its 2021 global real GDP growth projections due to continued supply disruptions and uncertain pandemic dynamics. These conditions have caused shortages of key inputs, lowered manufacturing activity and fueled inflation across the globe.
In addition to a global shipping crisis and semiconductor shortages, the energy sector also captured numerous headlines as robust demand outpaced supply, causing prices to surge. After a historic drop in energy consumption in 2020, the global economic recovery and a long and cold winter in the Northern Hemisphere have driven a strong rebound in demand, while the ongoing shift to renewables has impacted production and future investments in fossil fuels. Although OPEC and countries such as Russia have pledged to boost supply, the energy crunch has highlighted issues in long-term production. Furthermore, rising energy prices have contributed to an inflation loop as the prices of energy-intensive materials like nickel, steel and silicon have all risen.
Increased inflation, combined with an uncertain recovery, has created policy challenges for central banks. On one hand, the rhetoric on inflation being “transitory” softened as many central banks took a hawkish approach. During the quarter, the European Central Bank announced a gradual phaseout of its bond purchase program and the Federal Reserve started tapering its bond purchases, while countries like the U.K., Russia and Mexico raised interest rates. On the other hand, policy in Southeast Asia was largely unchanged, and China announced an easing of its monetary policy that will likely include further cuts to lending rates.
On the COVID front, the Omicron variant became the dominant strain in areas such as the U.K. and the U.S. The number of new daily cases reached as high as ~1,750,000, the highest reported figure during the pandemic, with Europe and the Americas reporting the greatest number of cases.
Performance data quoted here represents past performance. Past performance is no guarantee of future results. Investment return and principal value will fluctuate so that an investor’s shares, when redeemed, may be worth more or less than their original cost. Current performance may be lower or higher than the performance information quoted. To obtain performance information current to the most recent month-end, please call (844) 274-7868.

FOR MORE INFORMATION, PLEASE CONTACT:
Phone: (888) 661-6691 | Email: funds@aristotlecap.com | Web: www.aristotlefunds.com
| 1 |

Although we are happy to report another strong year, the constant twists, turns and pivots of this past year are a reminder of the fragility of the short term. Factors such as the possibility of new variants, the timing of a full recovery, fiscal and monetary policy decisions, and market sentiment are topics better left for reporters. We believe investment managers (and their clients) are best positioned to create lasting value by minimizing distractions and focusing on the long term.
Performance Review
The Aristotle/Saul Global Equity Fund posted a total return of 19.54% at NAV for the year ending December 31, 2021, while the MSCI ACWI Index (Net) returned 18.54% and the MSCI World Index (Net) returned 21.82% over the same period.
The Fund’s outperformance relative to the MSCI ACWI Index (Net) over the year can be attributed to security selection, while sector allocation detracted from relative performance. Security selection in Consumer Discretionary and Materials as well as an underweight in Communication Services contributed the most to relative performance. Conversely, security selection in Industrials, Communication Services and Information Technology detracted the most from relative performance.
Compared to the Index, the Fund remains underweight Emerging Markets and U.S. equities and overweight Japanese equities; this relative positioning is the result of bottom-up, fundamental analysis and not an expression of a top-down macro view. Security selection in Europe & Middle East and Japan as well as an underweight in Emerging Markets contributed the most to relative performance for the year, while security selection in Emerging Markets as well as an overweight to Japan and an underweight to U.S. equities detracted the most from relative performance.
2021 Top Contributors to Relative Fund Return | 2021 Top Detractors from Relative Fund Return | |
| Nemetschek | Samsung | |
| Martin Marietta Materials | ||
| Lennar | AIA Group | |
| Penske Automotive | PayPal | |
| Danaher | FANUC |
Aggregates producer Martin Marietta Materials was one of the top contributors for the year, as it delivered year-to-date records for revenues and gross profit. A unique combination of higher organic volumes and price increases was able to offset significantly higher energy-related costs. The company also completed its acquisition of Lehigh Hanson’s West Region business, the second-largest acquisition in its history, increasing the firm’s presence in California and Arizona. Past acquisitions, including Texas Industries and Bluegrass Materials, have been, in our opinion, successfully integrated and have positioned the company with a coast-to-coast footprint and meaningful presence in states with high population inflows and what we think are solid underlying economies (i.e., Texas, Colorado, California, North Carolina, Georgia and Florida). Consistent with its acquisition practices, the company is committed to lowering its debt within the next 18 months. We believe the firm’s prudent capital spending, value-enhancing acquisitions, FREE cash flow generation and “value over volume” pricing strategy position the company to continue to benefit from secular demand trends, including single-family housing and federal and state-level infrastructure investment, as well as non-residential construction (e.g., warehouse and data centers).
| 2 |
Lennar, one of the nation’s largest homebuilders, was a primary contributor for the year. Despite supply-chain challenges affecting everything from the ability to source garage doors, windows and paint, to labor shortages impacting numerous installations, Lennar was able to deliver nearly 60,000 homes during the year, a 13% year-over-year growth in deliveries, while also achieving gross and net margin improvements. Such results highlight management’s focus and ability to execute amidst challenging short-term conditions while continuing to deliver on its longer-term strategic plan. To that effect, the firm made progress toward its asset-light model, where currently it controls more than half of its land through the use of options (up from 39% in 2020). This has enhanced the company’s FREE cash flow generation, allowing for the retirement of $850 million of debt and the repurchase of nearly $1 billion in stock in the most recent quarter. Furthermore, as part of its long-time efforts to incorporate technology into its business, Lennar announced commitments with Veev, a vertically integrated end-to-end panelized building technology company, and ICON, a 3D printing construction technology company, to build new communities utilizing their innovative technologies.
Twitter, the digital news platform, was one of the largest detractors this year. Despite recording positive results, concerns regarding the company’s growth and execution weighed on Twitter’s share price. Furthermore, during the fourth quarter, Jack Dorsey, Chairman and CEO of Twitter announced his resignation from both roles. Mr. Dorsey is succeeded by Parag Agrawal as CEO and Bret Taylor (CEO of Salesforce) as Chairman. Mr. Agrawal has been with Twitter for more than a decade and has served as CTO since 2017. We look forward to meeting with Mr. Agrawal and learning more about his leadership style and vision for Twitter.
AIA Group, a pan-Asian life insurance company headquartered in Hong Kong, was one of the largest detractors for the year. Shares declined despite continued improvements in fundamentals and progress further establishing AIA Group’s direct presence in mainland China, a catalyst we previously identified. AIA Group has benefited from an increasingly technology-enabled and productive agency salesforce; we believe this has helped the company deftly navigate pandemic-related travel restrictions. In fact, the company’s VONB* advanced 15% in the first nine months of 2021, with all areas outside of Hong Kong exceeding pre-pandemic levels. In our opinion, the advances in mainland China are more notable than the interim results. With the recent approval from the China Banking and Insurance Regulatory Commission to begin operations in the Hubei province, AIA Group now has operations in eight provinces, providing what we consider to be a unique platform to further penetrate this increasingly large market.
| * | Value of New Business (VONB) is an insurance term for the present value of new business written during a period. |
| 3 |
Investment Activity
During the year, we made the following purchases and sales in the Fund.
| 2021 Fund Purchases | 2021 Fund Sales | |||
| GlaxoSmithKline | 1Q2021 | Pioneer Natural Resources | 1Q2021 | |
| Nemetschek | 1Q2021 | ORIX | 1Q2021 | |
| Rational | 2Q2021 | Toray | 1Q2021 | |
| Pan Pacific International | 2Q2021 | Hoshizaki | 2Q2021 | |
| Honeywell | 2Q2021 | Novartis | 2Q2021 | |
| FirstCash | 3Q2021 | Penske Automotive | 4Q2021 | |
| Rentokil Initial | 4Q2021 | |||
One of our objectives is to clearly articulate the thought process behind our investments to our fellow shareholders. Below is an example of a sale (Penske Automotive) and a purchase (Rentokil Initial) we made in the Fund this year. Those securities were the last sale and purchase for the year.
Sale
We first became owners in Penske, one of the world’s largest automotive dealership groups, during the second quarter of 2016. During our holding period, the company executed on many of the catalysts we initially identified, including benefiting from industry consolidation, as well as its high-margin parts and service business capitalizing on increased car complexity. Though we will continue to admire Penske’s growing global presence and efforts to enhance the customer experience at its predominately luxury-focused dealerships, we decided to exit our position to fund what we believe is a more optimal investment in Rentokil.
Purchase
Founded in 1925, Rentokil Initial is a U.K.-based global provider of pest control, commercial hygiene and property care services. The company primarily operates in Europe and North America and recorded over £2.8 billion ($3.8 billion) of revenue in 2020.
In 2008, when current CEO Andy Ransom joined Rentokil, the company began a significant transformation. Less-attractive segments were shed, and proceeds were focused into the higher-margin Pest Control business. Most recently, Rentokil announced a $6.7 billion acquisition of Terminix, a leading residential and commercial pest control services provider in the U.S. The merger is expected to close in the second half of 2022, and we believe the financial and strategic rationales to be sound. The proforma entity will be the largest pest control company in North America, the world’s largest pest control market, and establishes the company as the leading global pest control company.
| 4 |
As a result, Rentokil will derive the vast majority of revenue from its Pest Control (~75% of sales) and Hygiene (~20%) segments. Pest Control provides services that protect customers from pest infestations (e.g., bedbugs, roaches, mice, termites), while the Hygiene segment, through its Initial brand, is one of the largest providers of commercial bathroom products and services in the industry. These businesses provide critical services that protect the health and well-being of people, as well as the reputation of customers’ brands.
High-Quality Business
Some of the quality characteristics we have identified for Rentokil include:
| · | Global scale, with operations in more than 80 countries and well-recognized global (and local) brands. Rentokil is one of the largest companies in the pest control industry, with number one or two positions in many of the geographies where it competes; |
| · | Significant exposure to stable, consistent businesses that can provide high recurring revenues (e.g., ~85% retention rates); and |
| · | Strong profitability profile coupled with low capital intensity, which has resulted in a consistently high ROIC (return on invested capital). |
Attractive Valuation
Given the company’s stability, return profile and future opportunities, we believe Rentokil’s current stock price is offered at a discount to our estimate of the company’s intrinsic value. In addition, we believe Rentokil’s normalized operating margins are several hundred basis points higher than current levels, and that margins can be increased in part due to the catalysts noted below.
Compelling Catalysts
Catalysts we have identified for Rentokil, which we believe will cause its stock price to appreciate over our three- to five-year investment horizon, include:
| · | Margin improvements, particularly in the large and growing North American Pest Control business, as scale is increased, acquisitions such as that of Terminix are integrated, further in-market densification is achieved and cost-reducing technology is increasingly leveraged; |
| · | Share gains through organic efforts and opportunistic acquisitions as the pest control industry continues to consolidate; and |
| · | Continued paring of non-core businesses and increased focus on its core Pest Control and Hygiene businesses can result in a higher-returning and more optimal FREE cash flow-generating business model. |
This information is for illustrative purposes only and is not a recommendation to buy or sell a particular security. There is no guarantee that the securities discussed will prove to be profitable. Please refer to disclosures at the end of this document.
| 5 |
Outlook
As we turn the page on another year, we are reminded of the fleeting nature of headline news. Our focus is not on factors that will change in the coming months, but rather on the fundamentals of businesses that may persist for years.
Rather than attempting the impossible task of predicting the unpredictable, we remain steadfast in abiding by our investment philosophy and process that have been in place for nearly 25 years. By utilizing a long-term approach and identifying what we perceive to be high-quality businesses, trading at discounts to our estimates of their intrinsic value, that possess catalysts within management’s control, we believe we can withstand short-term swings and add lasting value for our clients.
 |  |  |
| Gregory Padilla, CFA | Alberto Jimenez Crespo, CFA | Howard Gleicher, CFA |
| Principal, Portfolio Manager | Principal, Portfolio Manager | CEO & Chief Investment Officer |
| Aristotle Capital Management, LLC |
| 6 |
Aristotle/Saul Global Equity Fund (Class I)
| Performance Update | December 31, 2021 | ||||||
| Total Return | 4Q21 | 1 Year | 3 Years | 5 Years | 7 Years | Annualized Since Inception (3/30/12) | Gross/Net Expense Ratio |
| ARSOX Class I | 6.34% | 19.54% | 21.17% | 13.16% | 10.93% | 8.99% | 1.07%/0.80% |
| MSCI ACWI Index (Net) | 6.68% | 18.54% | 20.38% | 14.40% | 10.90% | 10.88% | N/A |
| MSCI World Index (Net) | 7.77% | 21.82% | 21.70% | 15.03% | 11.53% | 11.77% | N/A |
Performance results for periods greater than one year have been annualized.
Performance data quoted here represents past performance. Past performance is no guarantee of future results. Investment return and principal value will fluctuate so that an investor’s shares, when redeemed, may be worth more or less than their original cost. Current performance may be lower or higher than the performance information quoted. To obtain performance information current to the most recent month-end, please call (844) 274-7868.
The Fund’s advisor has contractually agreed to waive certain fees and/or absorb expenses, through April 30, 2022, to the extent that the total annual operating expenses do not exceed 0.80% of average daily net assets of the Fund. The Fund’s advisor may seek reimbursement from the Fund for waived fees and/or expenses paid for three years from the date of the waiver or payment. Without these reductions, the Fund’s performance would have been lower. A redemption fee of 1.00% will be imposed on redemptions of shares within 30 days of purchase.
On May 1, 2020, the Fund’s name changed from Aristotle/Saul Global Opportunities Fund to Aristotle/Saul Global Equity Fund. Also, on May 1, 2020, the Fund’s Principal Investment Strategies changed and performance prior to May 1, 2020 represents a different fund strategy.
Important Information:
There can be no guarantee that any strategy (risk management or otherwise) will be successful. All investing involves risk, including potential loss of principal.
The views in this letter were as of December 31, 2021 and may not necessarily reflect the same views on the date this letter is first published or any time thereafter. These views are intended to help shareholders in understanding the Fund’s investment methodology and do not constitute investment advice.
Past performance is not indicative of future results. You should not assume that any of the securities transactions, sectors or holdings discussed in this report are or will be profitable, or that recommendations Aristotle Capital makes in the future will be profitable or equal the performance of the securities listed in this report. There is no assurance that any securities, sectors or industries discussed herein will be included in or excluded from the Fund. The opinions expressed are as of the date of publication and are subject to change due to changes in the market or economic conditions and may not necessarily come to pass. Aristotle Capital reserves the right to modify its current investment strategies and techniques based on changing market dynamics or client needs. This is not a recommendation to buy or sell a particular security. Holdings in the last 12 months are available upon request.
| 7 |
An investment in the Fund is subject to risks, and you could lose money on your investment in the Fund. The principal risks of investing in the Fund include, but are not limited to, market risk, equity risk, foreign investment risk, currency risk, emerging market risk, small-cap, mid-cap and large-cap company risk, exchange-traded funds (ETFs) risk, liquidity risk, management and strategy risk and cybersecurity risk. Market Turbulence Resulting from COVID-19 – The outbreak of COVID-19 has negatively affected the worldwide economy, individual countries, individual companies and the market in general. The future impact of COVID-19 is currently unknown, and it may exacerbate other risks that apply to the Fund. To learn more about the Principal Risks of Investing in the Fund, please reference the prospectus.
Foreign securities have additional risks, including currency rate changes, political and economic instability, lack of comprehensive company information, less market liquidity, less-efficient trading markets, and differing auditing controls and legal standards.
Investments in emerging markets involve even greater risks. The use of short sales and ETFs may cause the Fund to have higher expenses than those of other equity funds. Short sales are speculative transactions and involve special risks, including a greater reliance on the investment team’s ability to accurately anticipate the future value of a security. The Fund’s losses are potentially unlimited in a short sale transaction. The Fund’s use of short sales and futures contracts leverages the Fund’s portfolio. The Fund’s use of leverage can make the Fund more volatile and magnify the effect of any losses. There is no assurance that a leveraging strategy will be successful.
The Fund may invest in derivatives, which can be highly volatile, illiquid and difficult to value, and changes in the value of a derivative may not correlate with the underlying securities or other securities held directly by the Fund. Such risks include gains or losses that, as a result of leverage, can be substantially greater than the derivatives’ original cost. There is also a possibility that derivatives may not perform as intended, which can reduce opportunity for gain or result in losses by offsetting positive returns in other securities the Fund owns.
Definitions:
| · | The MSCI All Country World Index (ACWI) captures large and mid capitalization representation across 23 developed markets and 27 emerging markets countries. With over 3,000 constituents, the Index covers approximately 85% of the global investable equity opportunity set. |
| · | The MSCI ACWI Value Index captures large and mid cap securities exhibiting overall value style characteristics across 23 developed markets countries and 27 emerging markets countries. |
| · | The MSCI World Index is a free float-adjusted market capitalization-weighted index that is designed to measure the equity market performance in 23 developed market countries. The MSCI World Index includes the following countries: Australia, Austria, Belgium, Canada, Denmark, Finland, France, Germany, Hong Kong, Ireland, Israel, Italy, Japan, Netherlands, New Zealand, Norway, Portugal, Singapore, Spain, Sweden, Switzerland, the United Kingdom and the United States. |
| · | The MSCI ACWI Growth Index captures large and mid cap securities exhibiting overall growth style characteristics across 23 developed markets countries and 27 emerging markets countries. |
| · | The Bloomberg Global Aggregate Bond Index is a flagship measure of global investment grade debt from 24 local currency markets. This multi-currency benchmark includes treasury, government-related, corporate and securitized fixed-rate bonds from both developed and emerging markets issuers. |
| · | FREE cash flow is generally calculated as cash flow from operations less capital expenditures. |
| · | Return on invested capital (ROIC) is a ratio that seeks to measure the amount of money a company makes that is above the average cost it pays for its debt and equity capital. |
| 8 |
The volatility (beta) of the Fund may be greater or less than that of the benchmarks. An investor cannot invest directly in these indices.
Portfolio composition will change due to ongoing management of the Fund. References to specific securities or sectors should not be construed as recommendations by the Fund, its Advisor or Distributor.
The companies identified herein are examples of holdings and are subject to change without notice. The companies have been selected to help illustrate the investment process described herein. A complete list of holdings is available upon request. This information should not be considered a recommendation to purchase or sell any particular security. It should not be assumed that any of the holdings listed have been or will be profitable, or that investment decisions made in the future will be profitable. Aristotle Capital reserves the right to modify its current investment strategies and techniques based on changing market dynamics or client needs.
As of December 31, 2021, the 10 largest holdings in the Fund and their weights as a percent of total net assets were: Microsoft Corp., 4.46%; Martin Marietta Materials, Inc., 4.08%; Danaher Corp., 3.93%; Lennar Corp., 3.67%; Sony Group Corp., 3.35%; Microchip Technology, Inc., 3.35%; Adobe, Inc., 3.11%; Nemetschek, SE, 3.04%; Samsung Electronics, 2.92%; Qualcomm, Inc., 2.71%.
| 9 |
Aristotle/Saul Global Equity Fund
FUND PERFORMANCE at December 31, 2021 (Unaudited)
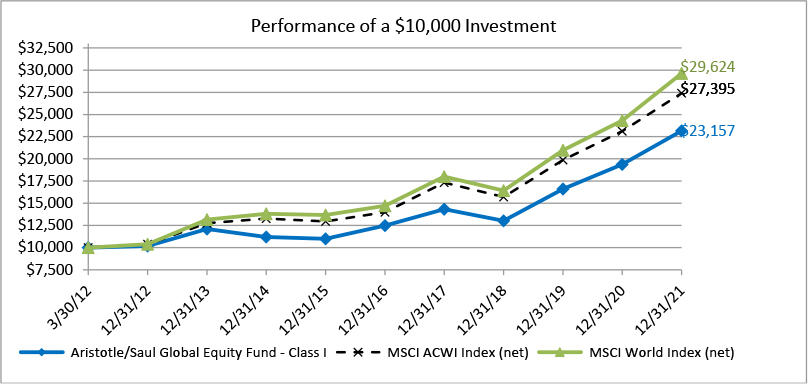
This graph compares a hypothetical $10,000 investment in the Fund’s Class I shares, made at its inception, with a similar investment in the MSCI All Country World Index (net) (MSCI ACWI Index (net)) and in the MSCI World Index (net). Results include the reinvestment of all dividends and capital gains.
The MSCI World Index captures large and mid cap representation across 23 Developed Markets (DM) countries. With 1,600 constituents, the index covers approximately 85% of the free float-adjusted market capitalization in each country. The MSCI All Country World Index (ACWI) captures large and mid capitalization representation across 23 developed markets and 24 emerging markets countries. With over 2,700 constituents, the Index covers approximately 85% of the global investable equity opportunity set. The index does not reflect expenses, fees, or sales charge, which would lower performance. This index is unmanaged and it is not available for investment.
| Average Annual Total Returns as of December 31, 2021 | 1 Year | 5 Years | Since Inception | Inception Date |
| Aristotle/Saul Global Equity Fund – Class I | 19.54% | 13.16% | 8.99% | 03/30/12 |
| MSCI ACWI Index (net) | 18.54% | 14.40% | 10.88% | 03/30/12 |
| MSCI World Index (net) | 21.82% | 15.03% | 11.77% | 03/30/12 |
The performance data quoted here represents past performance and past performance is not a guarantee of future results. Investment return and principal value will fluctuate so that an investor's shares, when redeemed, may be worth more or less than their original cost. Current performance may be lower or higher than the performance information quoted. The most recent month end performance may be obtained by calling (888) 661-6691.
Gross and net expense ratios for the Class I shares were 1.07% and 0.80%, respectively, which were the amounts stated in the current prospectus dated May 1, 2021. For the Fund’s current one year expense ratios, please refer to the Financial Highlights section of this report. The Fund’s Advisor has contractually agreed to waive its fees and/or pay for operating expenses of the Fund to ensure that total annual fund operating expenses do not exceed 0.80% of the Fund’s average daily net assets. This agreement is in effect until April 30, 2022, and it may be terminated before that date only by the Trust’s Board of Trustees. In the absence of such waivers, the Fund’s returns would be lower.
| 10 |
Aristotle/Saul Global Equity Fund
FUND PERFORMANCE at December 31, 2021 (Unaudited)
Returns reflect the reinvestment of distributions made by the Fund, if any. The graph and performance table above do not reflect the deduction of taxes that a shareholder would pay on Fund distributions or the redemption of the Fund shares. Shares redeemed within 30 days of purchase will be charged a 1.00% redemption fee.
| 11 |
Aristotle/Saul Global Equity Fund
SCHEDULE OF INVESTMENTS
As of December 31, 2021
Number | Value | |||||||
| COMMON STOCKS — 97.0% | ||||||||
| AUSTRIA — 1.2% | ||||||||
| 24,500 | Erste Group Bank A.G. | $ | 1,148,504 | |||||
| CANADA — 3.9% | ||||||||
| 71,300 | Cameco Corp. | 1,554,509 | ||||||
| 26,300 | Magna International, Inc. | 2,128,722 | ||||||
| 3,683,231 | ||||||||
| FRANCE — 6.2% | ||||||||
| 30,800 | Dassault Systemes S.E. | 1,834,185 | ||||||
| 2,400 | LVMH Moet Hennessy Louis Vuitton S.E. | 1,986,339 | ||||||
| 39,200 | TotalEnergies S.E. | 1,991,685 | ||||||
| 5,812,209 | ||||||||
| GERMANY — 6.8% | ||||||||
| 21,678 | Nemetschek S.E. | 2,771,677 | ||||||
| 1,670 | Rational A.G. | 1,707,918 | ||||||
| 12,900 | Symrise A.G. | 1,907,730 | ||||||
| 6,387,325 | ||||||||
| HONG KONG — 1.5% | ||||||||
| 144,000 | AIA Group Ltd. | 1,451,524 | ||||||
| IRELAND — 1.7% | ||||||||
| 15,150 | Medtronic PLC | 1,567,267 | ||||||
| JAPAN — 13.5% | ||||||||
| 7,000 | FANUC Corp. | 1,487,934 | ||||||
| 51,000 | KDDI Corp. | 1,491,430 | ||||||
| 79,700 | Kubota Corp. | 1,772,213 | ||||||
| 50,800 | Marui Group Co., Ltd. | 956,620 | ||||||
| 115,300 | Mitsubishi UFJ Financial Group, Inc. | 627,494 | ||||||
| 15,600 | Nidec Corp. | 1,845,393 | ||||||
| 20,600 | Otsuka Holdings Co., Ltd. | 749,447 | ||||||
| 53,000 | Pan Pacific International Holdings Corp. | 730,544 | ||||||
| 24,200 | Sony Corp. | 3,055,934 | ||||||
| 12,717,009 | ||||||||
| KOREA (REPUBLIC OF-SOUTH) — 2.8% | ||||||||
| 44,500 | Samsung Electronics Co., Ltd. | 2,660,462 | ||||||
| 12 |
Aristotle/Saul Global Equity Fund
SCHEDULE OF INVESTMENTS - Continued
As of December 31, 2021
Number | Value | |||||||
| COMMON STOCKS (Continued) | ||||||||
| NETHERLANDS — 1.4% | ||||||||
| 11,400 | Heineken N.V. | $ | 1,283,019 | |||||
| SINGAPORE — 2.0% | ||||||||
| 75,946 | DBS Group Holdings Ltd. | 1,840,603 | ||||||
| SWEDEN — 1.3% | ||||||||
| 40,800 | Assa Abloy A.B. - Class B | 1,243,624 | ||||||
| SWITZERLAND — 3.8% | ||||||||
| 22,400 | Alcon, Inc. | 1,975,799 | ||||||
| 8,000 | Chubb Ltd. | 1,546,480 | ||||||
| 3,522,279 | ||||||||
| UNITED KINGDOM — 4.2% | ||||||||
| 87,600 | GlaxoSmithKline PLC | 1,904,956 | ||||||
| 260,000 | Rentokil Initial PLC | 2,055,225 | ||||||
| 3,960,181 | ||||||||
| UNITED STATES — 46.7% | ||||||||
| 5,000 | Adobe, Inc.* | 2,835,300 | ||||||
| 7,800 | Amgen, Inc. | 1,754,766 | ||||||
| 31,400 | Axalta Coating Systems Ltd.* | 1,039,968 | ||||||
| 49,000 | Bank of America Corp. | 2,180,010 | ||||||
| 30,600 | Carnival PLC* | 573,067 | ||||||
| 27,900 | Coca-Cola Co. | 1,651,959 | ||||||
| 10,900 | Danaher Corp. | 3,586,209 | ||||||
| 20,900 | FirstCash, Inc. | 1,563,529 | ||||||
| 6,000 | General Dynamics Corp. | 1,250,820 | ||||||
| 7,400 | Honeywell International, Inc. | 1,542,974 | ||||||
| 28,800 | Lennar Corp. - Class A | 3,345,408 | ||||||
| 8,450 | Martin Marietta Materials, Inc. | 3,722,394 | ||||||
| 35,100 | Microchip Technology, Inc. | 3,055,806 | ||||||
| 12,100 | Microsoft Corp. | 4,069,472 | ||||||
| 19,100 | Oshkosh Corp. | 2,152,761 | ||||||
| 8,300 | PayPal Holdings, Inc.* | 1,565,214 | ||||||
| 9,600 | Procter & Gamble Co. | 1,570,368 | ||||||
| 13,500 | QUALCOMM, Inc. | 2,468,745 | ||||||
| 17,700 | RPM International, Inc. | 1,787,700 | ||||||
| 31,500 | Twitter, Inc.* | 1,361,430 | ||||||
| 13 |
Aristotle/Saul Global Equity Fund
SCHEDULE OF INVESTMENTS - Continued
As of December 31, 2021
Number | Value | |||||||
| COMMON STOCKS (Continued) | ||||||||
| UNITED STATES (Continued) | ||||||||
| 16,200 | Walgreens Boots Alliance, Inc. | $ | 844,992 | |||||
| 43,922,892 | ||||||||
| Total Common Stocks | ||||||||
| (Cost $59,824,047) | 91,200,129 | |||||||
Principal | ||||||||
| SHORT-TERM INVESTMENTS — 3.0% | ||||||||
| $ | 2,818,491 | UMB Bank demand deposit, 0.01%1 | 2,818,491 | |||||
| TOTAL SHORT-TERM INVESTMENTS | ||||||||
| (Cost $2,818,491) | 2,818,491 | |||||||
| TOTAL INVESTMENTS — 100.0% | ||||||||
| (Cost $62,642,538) | 94,018,620 | |||||||
| Other Assets in Excess of Liabilities — 0.0% | 10,016 | |||||||
| TOTAL NET ASSETS — 100.0% | $ | 94,028,636 | ||||||
PLC – Public Limited Company
| * | Non-income producing security. |
| 1 | The rate is the annualized seven-day yield at period end. |
See Accompanying Notes to Financial Statements.
| 14 |
Aristotle/Saul Global Equity Fund
SUMMARY OF INVESTMENTS
As of December 31, 2021
| Security Type/Sector | Percent of Total Net Assets | |||
| Common Stocks | ||||
| Technology | 27.8 | % | ||
| Industrials | 14.0 | % | ||
| Health Care | 12.3 | % | ||
| Financials | 11.0 | % | ||
| Consumer Discretionary | 9.6 | % | ||
| Materials | 9.0 | % | ||
| Consumer Staples | 6.5 | % | ||
| Energy | 3.8 | % | ||
| Communications | 3.0 | % | ||
| Total Common Stocks | 97.0 | % | ||
| Short-Term Investments | 3.0 | % | ||
| Total Investments | 100.0 | % | ||
| Other Assets in Excess of Liabilities | 0.0 | % | ||
| Total Net Assets | 100.0 | % | ||
See Accompanying Notes to Financial Statements.
| 15 |

Dear Fellow Shareholders,
Markets Review
In a year filled with uncertainty, global economies proved largely resilient. Even in the face of supply-chain disruptions and multiple variants of the COVID-19 virus, global recovery continued throughout the period. Themes from 2020, such as central bank policy decisions and vaccine distribution, persisted.
After declining in the third quarter of 2021, global equity markets rebounded during the fourth quarter. Overall, the MSCI ACWI Index (Net) finished with a full-year return of 18.54%. In terms of style, for the full year, the MSCI ACWI Value (Net) outperformed the MSCI ACWI Growth (Net) by 2.52%.
Throughout the year, investors focused on the progress of the global recovery. Although corporate revenues and earnings continued to rebound during the period, the IMF announced a slight downward revision to its 2021 global real GDP growth projections due to continued supply disruptions and uncertain pandemic dynamics. These conditions have caused shortages of key inputs, lowered manufacturing activity and fueled inflation across the globe.
In addition to a global shipping crisis and semiconductor shortages, the energy sector also captured numerous headlines as robust demand outpaced supply, causing prices to surge. After a historic drop in energy consumption in 2020, the global economic recovery and a long and cold winter in the Northern Hemisphere have driven a strong rebound in demand, while the ongoing shift to renewables has impacted production and future investments in fossil fuels. Although OPEC and countries such as Russia have pledged to boost supply, the energy crunch has highlighted issues in long-term production. Furthermore, rising energy prices have contributed to an inflation loop as the prices of energy-intensive materials like nickel, steel and silicon have all risen.
Increased inflation, combined with an uncertain recovery, has created policy challenges for central banks. On one hand, the rhetoric on inflation being “transitory” softened as many central banks took a hawkish approach. During the fourth quarter, the European Central Bank announced a gradual phaseout of its bond purchase program, while countries like the U.K., Russia and Mexico raised interest rates. On the other hand, policy in Southeast Asia was largely unchanged, and China announced an easing of its monetary policy that will likely include further cuts to lending rates.
On the COVID front, the Omicron variant became the dominant strain in areas such as the U.K. and the U.S. The number of new daily cases reached as high as ~1,750,000, the highest reported figure during the pandemic, with Europe and the Americas reporting the greatest number of cases.
Although we are happy to report another strong year, the constant twists, turns and pivots of this past year are a reminder of the fragility of the short term. Factors such as the possibility of new variants, the timing of a full recovery, fiscal and monetary policy decisions, and market sentiment are topics better left for reporters.
Performance data quoted here represents past performance. Past performance is no guarantee of future results. Investment return and principal value will fluctuate so that an investor’s shares, when redeemed, may be worth more or less than their original cost. Current performance may be lower or higher than the performance information quoted. To obtain performance information current to the most recent month-end, please call (844) 274-7868.

FOR MORE INFORMATION, PLEASE CONTACT:
Phone: (844) 274-7868 | Email: funds@aristotlecap.com | Web: www.aristotlefunds.com
| 16 |
We believe investment managers (and their clients) are best positioned to create lasting value by minimizing distractions and focusing on the long term.
Performance Review
For the year, the Aristotle International Equity Fund returned 15.79% at NAV, outperforming the 11.26% total return of the MSCI EAFE Index (Net).
The Fund’s outperformance for the year relative to the MSCI EAFE Index (Net) can be attributed to security selection. Relative sector weights, the by-product of our bottom-up stock selection decisions, also added to relative performance. Security selection in the Information Technology, Consumer Discretionary and Energy sectors positively impacted returns, while security selection in Financials, Consumer Staples and Materials detracted from relative performance.
Additionally, security selection in Europe & Middle East, as well as an overweight in Canada and an underweight in Asia contributed the most to relative performance. Security selection in Asia as well as an overweight to Emerging Markets and an underweight to Europe & Middle East detracted from relative performance.
2021 Top Contributors to Relative Fund Return | 2021 Top Detractors to Relative Fund Return | |
| Ashtead Group | Credicorp | |
| Accenture | Pan Pacific International | |
| Nemetschek | Samsung | |
| Brookfield Asset Management | FANUC | |
| Dassault Systèmes | Safran |
Ashtead Group, a U.K.-headquartered construction, industrial and general equipment rental company, was the top contributor for the year. As a result of the unprecedented conditions in 2020, management made what we consider to be the prudent decision of sourcing liquidity by pausing greenfield openings, bolt-on acquisitions and the company’s share buyback program. However, after weathering the uncertain market, Ashtead resumed all plans and launched a new share buyback program of $1.4 billion over the next two years during the first half of the year. Additionally, the company unveiled its Sunbelt 3.0 strategic plan that will further expand Ashtead’s location network, improve operational efficiency and solidify market share. Through this difficult period, we believe the company has demonstrated its resiliency, forward-looking and opportunistic mindset, and focus on continuously improving
| 17 |
Nemetschek, a European provider of software solutions for architectural and building construction projects, was a leading contributor for the year. The company reported strong results throughout the year, with both margins and revenue well above expectations. We believe margin improvement was due to its transition toward the more profitable licensing of its software, a catalyst we previously identified, in addition to COVID-related cost savings. Revenue growth was largely driven by its Design and Build segments as international cross-selling rose. Importantly, Bluebeam, its building collaboration software, achieved record levels of growth in new users. Nemetschek’s Build segment also benefited from the continued favorable environment for the construction sector. Furthermore, during its annual user event, the company announced new product features that it plans to release in the first half of 2022 that aim to increase office to field collaboration and connectivity – the fastest-growing area within construction software.
Pan Pacific International, the Japanese discount and general merchandise retailer, was one of the year’s largest detractors. Operating profits declined more than 30% year-over-year in the most recent quarter. This was in part due to lower foot traffic during a rainy season in Japan, coupled with a recently more difficult pandemic environment. Spending on technology investments, renovations and new store openings also compressed margins. However, we view these headwinds as temporary, and the investments, renovations and new openings as appropriate capital allocation, and continue to focus on the long-term strength of the business. Pan Pacific’s Don Quijote stores create a sense of treasure hunt that elicits high entertainment value—a unique business model that we believe will allow for organic market share gains in Japan, as well expansion overseas. With the company’s demonstrated ability to turn around competitors’ stores, in our opinion, it also stands to benefit from the ongoing conversion of its acquired UNY locations.
Safran, a France-based international aerospace propulsion and equipment supplier, was one of the main detractors for the year. Although the company continues to report recovering levels of sales and profitability, the uncertainty caused by the pandemic and supply chain issues continued to weigh on shares. Nevertheless, Safran has demonstrated its ability to efficiently manage costs, its supply chain, and inventories in this challenged environment. The company remains committed in investing for organic growth, actively managing its portfolio of products, keeping low leverage, and returning capital to its shareholders. We believe Safran remains well positioned to meet the evolving needs of the aerospace industry through its leadership positions and technological expertise.
| 18 |
Investment Activity
During the year, we made the following purchases and sales in the Fund.
| 2021 Fund Purchases | 2021 Fund Sales | |||
| GlaxoSmithKline | 1Q2021 | Compass Group | 1Q2021 | |
| Nemetschek | 1Q2021 | UBS Group | 1Q2021 | |
| Michelin | 1Q2021 | |||
| Pan Pacific International | 3Q2021 | |||
One of our objectives is to clearly articulate the thought process behind our investments to our fellow shareholders. Below is an example of a sale (Compass Group) and a purchase (GlaxoSmithKiline) we made in the Fund this year.
Sale
We first invested in Compass Group in the fourth quarter of 2012 in our International strategy. During our more than nine-year holding period, the company executed on a number of catalysts, including growing market share in North America and the Emerging Markets, restructuring its European operations, and continuing to consolidate the fragmented global market for contract catering via acquisitions. Like many companies, Compass Group’s operations have been significantly impacted by the COVID-19 pandemic. Although we believe management has taken the necessary (and correct) actions to position the company for long-term success, we have questions regarding the normalized earnings power over the next three to five years. While we decided to exit our position this quarter, we continue to closely monitor Compass Group.
Purchase
GlaxoSmithKline was formed in 2000 following the merger of British pharmaceutical companies Glaxo Wellcome and SmithKline Beecham. The company develops, manufactures and commercializes innovative medicines (~50% of revenue - HIV, respiratory, immune-inflammation, etc.), vaccines (~20% - shingles, meningitis, influenza, etc.), and consumer health products (~30% - oral health, pain, digestive health, etc.).
| 19 |
With origins dating as far back as 1715, U.K.-headquartered GlaxoSmithKline and its predecessors have been at the forefront of innovation, resulting in one of the strongest portfolios of commercialized products in the industry. The company currently operates in 150 countries and boasts an extensive network of manufacturing and research sites that spans over 36 countries, including major centers in the U.K., U.S., Spain, Belgium and China.
In early 2020, GlaxoSmithKline’s relatively new management team announced that the company will undergo a demerger, creating standalone biopharmaceutical and consumer healthcare companies in 2022. This ongoing strategic change is one we view positively.
High-Quality Business
Some of the quality characteristics we have identified for GlaxoSmithKline include:
| • | Global scale and a diverse product offering across various end markets and regions; |
| • | Leading market positions and a robust portfolio of recognizable brands (e.g., Advair, Triumeq, Shingrix, Bexsero, Advil, Sensodyne); and |
| • | Extensive history of developing innovative and relevant medicines (e.g., discovery of amoxicillin and Retrovir, the first treatment for HIV). |
Attractive Valuation
Given our estimates of normalized earnings, we believe GlaxoSmithKline’s current stock price is offered at a discount to our estimate of the company’s intrinsic value. We believe normalized earnings power is underappreciated given continued market share gains of commercialized products and the business’s improving FREE cash flow generation.
Compelling Catalysts
Catalysts we have identified for GlaxoSmithKline, which we believe will cause its stock price to appreciate over our three- to five-year investment horizon, include:
| • | Benefits from the upcoming separation of the biopharmaceutical and consumer health businesses, creating two standalone companies; |
| • | Continued market share advances by Shingrix, a leading vaccine for shingles (aka herpes zoster); and |
| • | Further market share gains for the oncology franchise, including Zejula, a treatment for ovarian cancer. |
This information is for illustrative purposes only and is not a recommendation to buy or sell a particular security. There is no guarantee that the securities discussed will prove to be profitable. Please refer to disclosures at the end of this document.
| 20 |
Outlook
As we turn the page on another year, we are reminded of the fleeting nature of headline news. Our focus is not on factors that will change in the coming months, but rather on the fundamentals of businesses that may persist for years.
Rather than attempting the impossible task of predicting the unpredictable, we remain steadfast in abiding by our investment philosophy and process that have been in place for nearly 25 years. By utilizing a long-term approach and identifying what we perceive to be high-quality businesses, trading at discounts to our estimates of their intrinsic value, that possess catalysts within management’s control, we believe we can withstand short-term swings and add lasting value for our clients.
 |  |  |
Sean Thorpe Principal, Portfolio Manager | Geoffrey Stewart, CFA Principal, Portfolio Manager | Howard Gleicher, CFA CEO & Chief Investment Officer Aristotle Capital Management, LLC |
| 21 |
Aristotle International Equity Fund (Class I)
| Performance Update | December 31, 2021 | |||||
| Total Return | 4Q21 | 1 Year | 3 Years | 5 Years | Annualized Since Inception (3/31/14) | Gross/Net Expense Ratio |
| ARSFX Class I | 5.64% | 15.79% | 16.59% | 11.86% | 6.27% | 1.05% / 0.80% |
| MSCI EAFE Index (Net) | 2.69% | 11.26% | 13.54% | 9.55% | 5.31% | N/A |
Performance results for periods greater than one year have been annualized.
Performance data quoted here represents past performance. Past performance is no guarantee of future results. Investment return and principal value will fluctuate so that an investor’s shares, when redeemed, may be worth more or less than their original cost. Current performance may be lower or higher than the performance information quoted. To obtain performance information current to the most recent month-end, please call (844) 274-7868.
The Fund’s advisor has contractually agreed to waive certain fees and/or absorb expenses, through April 30, 2022, to the extent that the total annual operating expenses do not exceed 0.80% of average daily net assets of the Fund. The Fund’s advisor may seek reimbursement from the Fund for waived fees and/or expenses paid for three years from the date of the waiver or payment. Without these reductions, the Fund’s performance would have been lower. A redemption fee of 1.00% will be imposed on redemptions of shares within 30 days of purchase.
Important Information:
There can be no guarantee that any strategy (risk management or otherwise) will be successful. All investing involves risk, including potential loss of principal.
The views in this letter were as of December 31, 2021 and may not necessarily reflect the same views on the date this letter is first published or any time thereafter. These views are intended to help shareholders in understanding the Fund’s investment methodology and do not constitute investment advice.
Past performance is not indicative of future results. You should not assume that any of the securities transactions, sectors or holdings discussed in this report are or will be profitable, or that recommendations Aristotle Capital makes in the future will be profitable or equal the performance of the securities listed in this report. There is no assurance that any securities, sectors or industries discussed herein will be included in or excluded from the Fund. The opinions expressed are as of the date of publication and are subject to change due to changes in the market or economic conditions and may not necessarily come to pass. Aristotle Capital reserves the right to modify its current investment strategies and techniques based on changing market dynamics or client needs. This is not a recommendation to buy or sell a particular security. Holdings are available within the last 12 months.
An investment in the Fund is subject to risks, and you could lose money on your investment in the Fund. The principal risks of investing in the Fund include, but are not limited to, investing in foreign securities, emerging markets, small-capitalization and mid-capitalization companies. Market Turbulence Resulting from COVID-19 – The outbreak of COVID-19 has negatively affected the worldwide economy, individual countries, individual companies and the market in general. The future impact of COVID-19 is currently unknown, and it may exacerbate other risks that apply to the Fund. To learn more about the Principal Risks of Investing in the Fund, please reference the prospectus.
| 22 |
Foreign securities have additional risks, including currency rate changes, political and economic instability, lack of comprehensive company information, less market liquidity, less-efficient trading markets, and differing auditing controls and legal standards. Investments in emerging markets involve even greater risks. The securities of small-capitalization and mid-capitalization companies may be subject to more abrupt or erratic market movements and may have lower trading volumes or more erratic trading than securities of larger, more established companies or market averages in general.
Definitions:
| · | The MSCI ACWI Index (All-Country World Index) captures large and mid cap representation across 23 developed market countries and 27 emerging markets countries. With approximately 3,000 constituents, the Index covers approximately 85% of the global investable equity opportunity set. |
| · | The MSCI EAFE Index (Europe, Australasia, Far East) is a free float-adjusted market capitalization-weighted index that is designed to measure the equity market performance of developed markets, excluding the United States and Canada. The MSCI EAFE Index consists of the following 21 developed market countries: Australia, Austria, Belgium, Denmark, Finland, France, Germany, Hong Kong, Ireland, Israel, Italy, Japan, the Netherlands, New Zealand, Norway, Portugal, Singapore, Spain, Sweden, Switzerland and the United Kingdom. |
| · | The MSCI ACWI Value Index captures large and mid cap securities exhibiting overall value style characteristics across 23 developed markets countries and 27 emerging markets countries. |
| · | The MSCI ACWI Growth Index captures large and mid cap securities exhibiting overall growth style characteristics across 23 developed markets countries and 27 emerging markets countries. |
| · | FREE cash flow is generally calculated as cash flow from operations less capital expenditures. |
The volatility (beta) of the Fund may be greater or less than its respective benchmarks. It is not possible to invest directly in these indices.
Portfolio composition will change due to ongoing management of the Fund. References to specific securities or sectors should not be construed as recommendations by the Fund, its Advisor or Distributor.
As of December 31, 2021, the 10 largest holdings in the Fund and their weights as a percent of total net assets were: Accenture plc, 5.62%; Sony Corp., 4.77%; Brookfield Asset Management, Inc., 4.46%; Nemetschek, SE, 4.26%; Dassault Systemes SE, 4.16%; Ashtead Group Plc., 4.05%; Magna International Inc., 2.99%; LVMH Moet Hennessy Louis Vuitton SE, 2.98%; Alcon, Inc., 2.88%; Cie Generale des Etablissements Michelin SCA, 2.87%.
| 23 |
Aristotle International Equity Fund
FUND PERFORMANCE at December 31, 2021 (Unaudited)

This graph compares a hypothetical $10,000 investment in the Fund’s Class I shares, made at its inception, with a similar investment in the MSCI Europe, Australia, Far East Index (net) (MSCI EAFE Index). Results include the reinvestment of all dividends and capital gains.
The MSCI EAFE Index is a free float-adjusted market capitalization index that is designed to measure the equity market performance of developed markets, excluding the US & Canada. The index does not reflect expenses, fees or sales charge, which would lower performance. This index is unmanaged and it is not available for investment.
| Average Annual Total Returns as of December 31, 2021 | 1 Year | 5 Years | Since Inception | Inception Date |
| Aristotle International Equity Fund – Class I | 15.79% | 11.86% | 6.27% | 03/31/14 |
| MSCI EAFE Index (net) | 11.26% | 9.55% | 5.31% | 03/31/14 |
The performance data quoted here represents past performance and past performance is not a guarantee of future results. Investment return and principal value will fluctuate so that an investor's shares, when redeemed, may be worth more or less than their original cost. Current performance may be lower or higher than the performance information quoted. The most recent month end performance may be obtained by calling (888) 661-6691.
Gross and net expense ratios for the Class I shares were 1.05% and 0.80%, respectively, which were the amounts stated in the current prospectus dated May 1, 2021. For the Fund’s current one year expense ratios, please refer to the Financial Highlights section of this report. The Fund’s Advisor has contractually agreed to waive its fees and/or pay for operating expenses of the Fund to ensure that total annual fund operating expenses do not exceed 0.80% of the Fund’s average daily net assets. This agreement is in effect until April 30, 2022, and it may be terminated before that date only by the Trust’s Board of Trustees. In the absence of such waivers, the Fund’s returns would be lower.
Returns reflect the reinvestment of distributions made by the Fund, if any. The graph and performance table above do not reflect the deduction of taxes that a shareholder would pay on Fund distributions or the redemption of the Fund shares. Shares redeemed within 30 days of purchase will be charged a 1.00% redemption fee.
| 24 |
Aristotle International Equity Fund
SCHEDULE OF INVESTMENTS
As of December 31, 2021
Number | Value | |||||||
| COMMON STOCKS — 97.1% | ||||||||
| AUSTRIA — 2.1% | ||||||||
| 174,900 | Erste Group Bank A.G. | $ | 8,198,915 | |||||
| CANADA — 8.8% | ||||||||
| 280,600 | Brookfield Asset Management, Inc. - Class A | 16,944,691 | ||||||
| 285,400 | Cameco Corp. | 6,222,397 | ||||||
| 140,500 | Magna International, Inc. | 11,367,727 | ||||||
| 34,534,815 | ||||||||
| FRANCE — 15.6% | ||||||||
| 98,700 | Amundi S.A.1 | 8,151,964 | ||||||
| 66,400 | Cie Generale des Etablissements Michelin SCA | 10,896,585 | ||||||
| 265,700 | Dassault Systemes S.E. | 15,822,822 | ||||||
| 13,700 | LVMH Moet Hennessy Louis Vuitton S.E. | 11,338,684 | ||||||
| 58,600 | Safran S.A. | 7,182,236 | ||||||
| 147,000 | TotalEnergies S.E. | 7,468,818 | ||||||
| 60,861,109 | ||||||||
| GERMANY — 6.5% | ||||||||
| 126,700 | Nemetschek S.E. | 16,199,440 | ||||||
| 63,000 | Symrise A.G. | 9,316,821 | ||||||
| 25,516,261 | ||||||||
| HONG KONG — 2.0% | ||||||||
| 758,600 | AIA Group Ltd. | 7,646,707 | ||||||
| IRELAND — 8.2% | ||||||||
| 51,500 | Accenture PLC - Class A | 21,349,325 | ||||||
| 216,900 | Experian PLC | 10,662,978 | ||||||
| 32,012,303 | ||||||||
| JAPAN — 18.4% | ||||||||
| 42,800 | FANUC Corp. | 9,097,653 | ||||||
| 271,500 | KDDI Corp. | 7,939,672 | ||||||
| 354,200 | Kubota Corp. | 7,876,010 | ||||||
| 329,000 | Marui Group Co., Ltd. | 6,195,432 | ||||||
| 84,700 | Nidec Corp. | 10,019,536 | ||||||
| 156,600 | Otsuka Holdings Co., Ltd. | 5,697,254 | ||||||
| 516,900 | Pan Pacific International Holdings Corp. | 7,124,869 | ||||||
| 143,600 | Sony Corp. | 18,133,558 | ||||||
| 72,083,984 | ||||||||
| 25 |
Aristotle International Equity Fund
SCHEDULE OF INVESTMENTS - Continued
As of December 31, 2021
Number | Value | |||||||
| COMMON STOCKS (Continued) | ||||||||
| KOREA (REPUBLIC OF-SOUTH) — 2.5% | ||||||||
| 148,600 | Samsung Electronics Co., Ltd. | $ | 9,759,301 | |||||
| NETHERLANDS — 5.0% | ||||||||
| 89,900 | Akzo Nobel N.V. | 9,876,309 | ||||||
| 85,900 | Heineken N.V. | 9,667,662 | ||||||
| 19,543,971 | ||||||||
| PERU — 1.9% | ||||||||
| 62,300 | Credicorp Ltd. | 7,604,961 | ||||||
| SINGAPORE — 2.3% | ||||||||
| 374,300 | DBS Group Holdings Ltd. | 9,071,414 | ||||||
| SWEDEN — 2.1% | ||||||||
| 265,400 | Assa Abloy A.B. - Class B | 8,089,651 | ||||||
| SWITZERLAND — 4.5% | ||||||||
| 124,000 | Alcon, Inc. | 10,937,461 | ||||||
| 77,900 | Novartis A.G. | 6,845,232 | ||||||
| 17,782,693 | ||||||||
| UNITED KINGDOM — 16.5% | ||||||||
| 191,500 | Ashtead Group PLC | 15,401,909 | ||||||
| 325,200 | Close Brothers Group PLC | 6,180,033 | ||||||
| 152,900 | Coca-Cola European Partners PLC | 8,551,697 | ||||||
| 480,700 | GlaxoSmithKline PLC | 10,453,338 | ||||||
| 75,800 | Reckitt Benckiser Group PLC | 6,506,816 | ||||||
| 1,283,800 | Rentokil Initial PLC | 10,148,067 | ||||||
| 138,600 | Unilever N.V. | 7,424,662 | ||||||
| 64,666,522 | ||||||||
| UNITED STATES — 0.7% | ||||||||
| 144,200 | Carnival PLC* | 2,700,530 | ||||||
| Total Common Stocks | ||||||||
| (Cost $306,080,922) | 380,073,137 | |||||||
| 26 |
Aristotle International Equity Fund
SCHEDULE OF INVESTMENTS - Continued
As of December 31, 2021
Principal | Value | |||||||
| SHORT-TERM INVESTMENTS — 2.4% | ||||||||
| $ | 9,478,383 | UMB Bank demand deposit, 0.01%2 | $ | 9,478,383 | ||||
| TOTAL SHORT-TERM INVESTMENTS | ||||||||
| (Cost $9,478,383) | 9,478,383 | |||||||
| TOTAL INVESTMENTS — 99.5% | ||||||||
| (Cost $315,559,305) | 389,551,520 | |||||||
| Other Assets in Excess of Liabilities — 0.5% | 1,924,983 | |||||||
| TOTAL NET ASSETS — 100.0% | $ | 391,476,503 | ||||||
PLC – Public Limited Company
| * | Non-income producing security. |
| 1 | Security exempt from registration under Rule 144A of the Securities Act of 1933. These securities are restricted and may be resold in transactions exempt from registration normally to qualified institutional buyers. The total value of these securities is $8,151,964, which represents 2.1% of total net assets of the Fund. |
| 2 | The rate is the annualized seven-day yield at period end. |
See Accompanying Notes to Financial Statements.
| 27 |
Aristotle International Equity Fund
SUMMARY OF INVESTMENTS
As of December 31, 2021
| Security Type/Sector | Percent of Total Net Assets | |||
| Common Stocks | ||||
| Technology | 26.0 | % | ||
| Financials | 16.3 | % | ||
| Industrials | 14.8 | % | ||
| Consumer Discretionary | 10.9 | % | ||
| Consumer Staples | 10.0 | % | ||
| Health Care | 8.7 | % | ||
| Materials | 6.5 | % | ||
| Communications | 2.0 | % | ||
| Energy | 1.9 | % | ||
| Total Common Stocks | 97.1 | % | ||
| Short-Term Investments | 2.4 | % | ||
| Total Investments | 99.5 | % | ||
| Other Assets in Excess of Liabilities | 0.5 | % | ||
| Total Net Assets | 100.0 | % | ||
See Accompanying Notes to Financial Statements.
| 28 |

Dear Fellow Shareholders,
Summary
U.S. corporate credit markets finished the year strong, led by high yield bonds and bank loans. For the calendar year, bank loans outperformed as the Credit Suisse Leveraged Loan Index gained 5.40%. High yield bonds also had a strong year, gaining 5.28% as measured by the Bloomberg U.S. Corporate High Yield Bond Index. Investment grade corporate bonds underperformed, falling 1.04% as measured by the Bloomberg U.S. Corporate Bond Index.
Risk markets performed well throughout 2021, led by the U.S. equity market. The S&P 500 Index gained 28.71% for the calendar year as the market continued to rebound from the pandemic-driven selloff in the first half of 2020. Despite the emergence of both the Delta and Omicron variants of COVID-19 during the year, strong consumer spending, robust corporate earnings, still accommodative monetary policy and additional fiscal stimulus all helped to underpin risk markets during the year. On the U.S. economic data front, the unemployment rate declined to 4.2% in November, its lowest level since February 2020, despite a smaller than expected increase in nonfarm payrolls. Meanwhile, inflation remained in focus as November Consumer Price Index (CPI) rose by 6.8% year-over-year, the fastest rate since 1982, and Core CPI rose by 4.9% year-over-year, the largest annual increase since June 1991. At its November meeting, the Federal Reserve (Fed) announced it would begin tapering asset purchases at a pace of $15 billion a month, as expected, then proceeded to double the pace at the December meeting while abandoning the term “transitory”. In line with the shift in policy, new projections based on the median forecast by Fed officials signaled the possibility of three interest rate increases in the new year.
Market Environment
U.S. Treasury yields climbed in 2021 as the yield curve flattened further through the end of the year. Short-term yields rose sharply with the yield on U.S. 2-Year and 5-Year notes climbing roughly 61 and 90 basis points, respectively. The yield on the U.S. 10-Year Treasury Note climbed roughly 60 basis points as well, while the long-end outperformed in the second half of 2021. Higher quality bonds underperformed as the Bloomberg U.S. Aggregate Bond Index returned -1.54% for the calendar year.
Corporate credit spreads continued tightening in 2021, falling to near the lowest levels in over 10 years. High yield bond spreads ended the year roughly 76 basis points tighter as measured by the Bloomberg U.S. Corporate High Yield Bond Index. Conversely, investment grade corporate bond spreads ended the year roughly unchanged, tightening 3 basis points as measured by the Bloomberg U.S. Corporate Bond Index.
Performance data quoted here represents past performance. Past performance is no guarantee of future results. Investment return and principal value will fluctuate so that an investor’s shares, when redeemed, may be worth more or less than their original cost. Current performance may be lower or higher than the performance information quoted. To obtain performance information current to the most recent month-end, please call (844) 274-7868.

FOR MORE INFORMATION, PLEASE CONTACT:
Phone: (844) 274-7868 | Email: funds@aristotlecap.com | Web: www.aristotlefunds.com
| 29 |
Total high yield bond issuance in 2021 topped $468 billion and surpassed 2020’s record annual supply. Investment grade corporate bond issuance totaled more than $1 trillion for the full year, falling short of 2020’s record. Driven by robust private equity buyout activity and record collateralized loan obligation (CLO) sales, leveraged loan supply topped $600 billion in 2021, the highest since at least 2013.
On the demand side, investors continued to favor investment grade corporate bond and bank loan funds in the fourth quarter. For the year, high yield bond funds experienced more than $13 billion in outflows while bank loan funds experienced inflows of around $45 billion.
Within the high yield universe, lower quality bonds outperformed for the calendar year as ‘CCC’s (+8.59%) outperformed ‘B’s (+4.85%) and ‘BB’s (+4.61%). From an industry perspective, cyclicals outperformed led by Energy (+13.50%), while Financial Institutions (-0.30%) trailed the broader high yield bond market. Additionally, default activity remained very benign as the U.S. high yield bond default rate declined to a record-low 0.29% at the end of the year.
Performance Review
The Aristotle Strategic Credit Fund, Class I (ARSSX), which primarily invests in high yield bonds, investment grade corporate bonds and bank loans, returned 2.56% at NAV for the calendar year, underperforming the 2.99% return of its blended benchmark of one-third Bloomberg U.S. High Yield Ba/B 2% Issuer Capped Bond Index, one-third Bloomberg U.S. Intermediate Corporate Bond Index and one-third Credit Suisse Leveraged Loan Index.
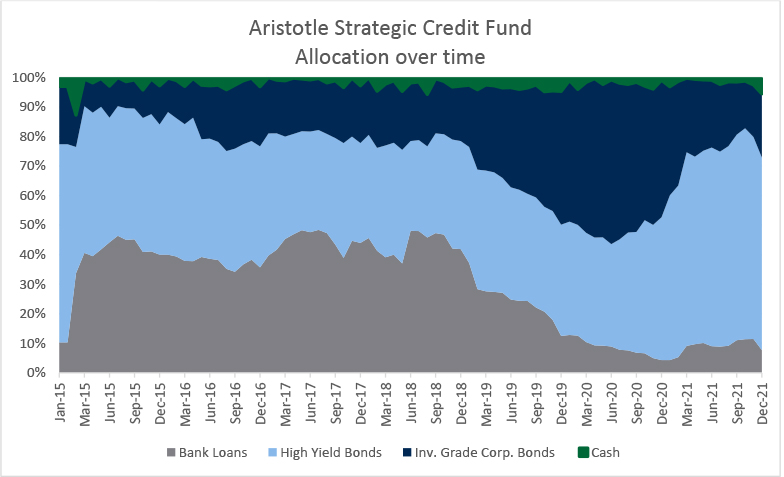
The Fund’s underperformance during the year was led by an underweight in bank loans and the allocation to cash. This was partially offset by the Fund’s overweight in high yield bonds and underweight in investment grade corporate bonds. Over the course of 2021, the Fund’s overweight in high yield bonds gradually increased while the allocation from investment grade corporate bonds was reduced from an overweight at the end of 2020 to an underweight by the end of the 2nd quarter of 2021. The Fund was underweight bank loans throughout the year.
Over the course of the first half of 2021, we reduced the Fund’s effective duration by over one year as we shifted out of investment grade corporate bonds into shorter duration high yield bonds. In our view, shorter duration high yield bonds were more attractive than bank loans from a quality perspective; nonetheless, significant inflows into bank loan funds and the strong performance of risk markets helped to underpin bank loan outperformance during the year. We believe the Fund’s allocation shift during the year from investment grade corporate bonds to high yield bonds highlights its flexible design.
| 30 |
The Aristotle Strategic Credit Fund, Class I (ARSSX) has an inception date of December 31, 2014.
Annual Attribution Summary
Security selection was the primary detractor from the Fund’s relative performance during the year, led by holdings in Energy and Pipelines & Distributors. This was partially offset by security selection in Banking and Media & Entertainment.
Sector rotation also detracted from relative performance as an underweight in bank loans was partially offset by an overweight in high yield bonds.
Industry allocation had a marginally positive effect on relative performance as overweights in Pipelines & Distributors and Finance Companies were largely offset by underweights in Industrials and Diversified Manufacturing & Construction Machinery.
| Top Five Contributors | Top Five Detractors |
| Quad/Graphics | CVS Health |
| RR Donnelley & Sons | Lumen Technologies |
| United Airlines | Meredith Corporation |
| MetLife | Presidio Holdings |
| American Airlines | CSC Holdings |
| 31 |
Outlook and Strategy
We believe corporate credit markets should remain strong in the first half of 2022, especially relative to higher quality fixed income market segments given expected interest rate pressures. In our opinion, solid fundamentals and the positive momentum in the global economy should overshadow the negative impact of a shift to tighter financial conditions.
While U.S. economic growth has moderated from the torrid pace seen in the middle of 2021, we believe 2022 should still see above-trend growth despite greater uncertainty on the monetary and fiscal policy fronts. The tides have turned as the Fed embarks on its well-telegraphed tapering process and is set to begin hiking rates soon, while additional fiscal stimulus meets resistance ahead of the mid-term elections in 2022. Despite these headwinds, we believe strong consumer spending, robust corporate earnings and solid balance sheets should be supportive of growth.
We believe U.S. Treasury yields should continue to push higher with the Fed backstop going from a tailwind to a headwind over the next several months. In our opinion, the lack of price-insensitive central bank demand in the bond market will have a significant impact on the yield curve, leading to higher rates across the curve and potential steepening. Furthermore, we expect real rates to move out of significantly negative territory, especially as global central banks begin following the Fed on the road to tighter monetary policy.
Following a record year for supply in the high yield market, we still expect above-average issuance in 2022. We believe companies will continue to take advantage of historically low rates to refinance, especially amidst the ongoing hunt for yield. Nonetheless, we expect to see a pickup in more aggressive issuance as companies fund share repurchases and mergers and acquisitions (M&A). We anticipate further growth in the loan market on the back of strong demand for floating-rate instruments ahead of the Fed hiking cycle.
With credit spreads entering 2022 within striking distance of the all-time lows, we believe the key to performance this year will come from carry. In our opinion, company balance sheets continue to improve and profitability remains strong. We acknowledge the outlook is more opaque than it has been for some time. In addition to the most apparent risks, we are monitoring additional risks including heightened geopolitical risk and broader, more persistent inflationary pressures that negatively impact consumers and corporate balance sheets.
In the Fund, from an overall perspective, we did not make any major changes to asset allocation during the second half of the year. We maintained an overweight in high yield bonds alongside underweights in investment grade corporate bonds and bank loans. The Fund also continues to hold a duration underweight relative to the blended benchmark.
With short-term interest rates in the U.S. already beginning to price in the Fed’s rate hikes this year, we are beginning to see better opportunities in the bank loan market and plan to gradually reduce the Fund’s underweight during the first quarter. Nonetheless, we still favor shorter duration high yield bonds relative to bank loans in the Fund, particularly from a quality perspective.
| 32 |
As of December 31, the Fund was composed of 65.3% high yield bonds, 21.5% investment grade corporate bonds and 7.7% bank loans. Roughly 5.5% was held in cash. At the end of the year, the Fund held overweights in Energy, Transportation and Lodging & Leisure alongside underweights in Technology, Industrials and Food, Beverage & Tobacco.
 |  |
Douglas Lopez, CFA Principal, Portfolio Manager | Terence Reidt, CFA Principal, Portfolio Manager |
| 33 |
Aristotle Strategic Credit Fund (Class I)
| Performance Update | December 31, 2021 |
| Total Return | 4Q21 | YTD | 1 Year | 3 Years | 5 Years | Since Inception (12/31/14) | Gross/Net Expense Ratio |
| ARSSX Class I | 0.13% | 2.56% | 2.56% | 7.11% | 4.77% | 4.57% | 3.22% / 0.62% |
| Blended Benchmark* | 0.31% | 2.99% | 2.99% | 6.67% | 4.91% | 4.73% | N/A |
| Bloomberg U.S. Aggregate Bond Index | 0.01% | -1.54% | -1.54% | 4.79% | 3.57% | 3.00% | N/A |
| Bloomberg U.S. High Yield Ba/B 2% Issuer Capped Bond Index | 0.75% | 4.65% | 4.65% | 9.07% | 6.36% | 6.07% | N/A |
Performance data quoted here represents past performance. Past performance is no guarantee of future results. There can be no guarantee that any strategy (risk management or otherwise) will be successful. All investing involves risk, including potential loss of principal. Returns over one year are annualized. Investment return and principal value will fluctuate so that an investor’s shares, when redeemed, may be worth more or less than their original cost. Current performance may be lower or higher than the performance information quoted. To obtain current performance information to the most recent month-end, please call (844) 274-7868.
The Fund’s advisor has contractually agreed to waive its fees and/or pay expenses, through April 30, 2022, to the extent that the total annual operating expenses do not exceed 0.62% of average daily net assets of the Fund. The Fund’s advisor may seek reimbursement from the Fund for waived fees and/or expenses paid for three years from the date of the waiver or payment. Without these reductions, the Fund’s performance would have been lower. A redemption fee of 1.00% will be imposed on redemptions of shares within 30 days of purchase.
| * | The blended benchmark represents a blend of 1/3 Bloomberg U.S. High Yield Ba/B 2% Issuer Capped Bond Index, 1/3 Bloomberg U.S. Intermediate Corporate Bond Index and 1/3 Credit Suisse Leveraged Loan Index. The Bloomberg Barclays U.S. High Yield Loans Index was retired on September 30, 2016 and was replaced with the Credit Suisse Leveraged Loan Index effective October 1, 2016. |
Important Information:
There can be no guarantee that any strategy (risk management or otherwise) will be successful. All investing involves risk, including potential loss of principal.
The views in this commentary were as of the date stated and may not necessarily reflect the same views on the date this letter is first published or any time thereafter. These views are intended to help shareholders in understanding the Fund’s investment methodology and do not constitute investment advice.
Past performance is not indicative of future results. You should not assume that any of the securities transactions, sectors or holdings discussed in this report are or will be profitable, or that recommendations Aristotle Credit makes in the future will be profitable or equal the performance of the securities listed in this report. There is no assurance that any securities, sectors or industries discussed herein will be included in or excluded from the Fund. Fund composition will change due to ongoing management of the Fund. References to specific securities or sectors should not be construed as recommendations by the Fund, its Advisor or Distributor. The opinions expressed are as of the date of publication and are subject to change due to changes in the market or economic conditions and may not necessarily come to pass. Aristotle Credit reserves the right to modify its current investment strategies and techniques based on changing market dynamics or client needs. This is not a recommendation to buy or sell a particular security. Holdings in the Fund for the last 12 months are available upon request.
| 34 |
An investment in the Fund is subject to risks and you could lose money on your investment in the Fund. The principal risks of investing in the Fund include, but are not limited to, investing in fixed income securities, high yield bonds, bank loans, foreign securities and emerging markets. Market Turbulence Resulting from COVID-19 – The outbreak of COVID-19 has negatively affected the worldwide economy, individual countries, individual companies and the market in general. The future impact of COVID-19 is currently unknown, and it may exacerbate other risks that apply to the Fund. To learn more about the Principal Risks of Investing in the Fund, please reference the prospectus.
The prices of fixed income securities respond to economic developments, particularly interest rate changes, as well as to changes in an issuer’s credit rating or market perceptions about the creditworthiness of an issuer. High yield bonds are debt securities rated below investment grade (often called “junk bonds”). Junk bonds are speculative, involve greater risks of default, downgrade, or price declines and are more volatile and tend to be less liquid than investment-grade securities. The Strategic Credit Fund’s investments in assignments of bank loans may create substantial risk. Although the Strategic Credit Fund expects it will invest in senior and secured bank loans, the Fund may invest in unsecured or subordinated loans. In addition, the Fund may invest in secured and unsecured participations in bank loans. These bank loans will generally be rated below investment grade. Foreign securities have additional risks including currency rate changes, political and economic instability, lack of comprehensive company information, less market liquidity, less efficient trading markets, and differing auditing controls and legal standards. Investments in emerging markets involve even greater risks.
Credit quality ratings are sourced from Standard & Poor's (the "S&P"), Moody's and Fitch's. Ratings values are based on the higher of either S&P, Moody's or Fitch's. If none of the rating agencies have assigned a rating the Fund will assign a rating of NR (non-rated security). The ratings represent their (S&P, Moody's, Fitch's) opinions as to the quality of the securities they rate. The ratings from AAA (S&P, Fitch's) or Aaa (Moody's) (extremely strong capacity to meet its financial commitment) to D (S&P, Fitch's) or C (Moody's) (in default). Ratings are relative and subjective and are not absolute standards of quality. The ratings provided relate to the underlying securities within the fund and not the fund itself.
Definitions:
| · | The Fund is benchmarked to a blend of three indices: 1/3 Bloomberg U.S. High Yield Ba/B 2% Issuer Capped Bond Index, 1/3 Bloomberg U.S. Intermediate Corporate Bond Index and 1/3 Credit Suisse Leveraged Loan Index. The Bloomberg Barclays U.S. High Yield Loans Index was retired on September 30, 2016 and was replaced with the Credit Suisse Leveraged Loan Index effective October 1, 2016. |
| · | The Bloomberg U.S. High Yield Ba/B 2% Issuer Capped Bond Index is an issuer-constrained version of the U.S. Corporate High Yield Bond Index that measures the market of U.S. dollar-denominated, non-investment grade, fixed-rate, taxable corporate bonds rated Ba/B. The Index limits the maximum exposure to any one issuer to 2%. |
| · | The Bloomberg U.S. Intermediate Corporate Bond Index is designed to measure the performance of U.S. corporate bonds that have a maturity of greater than or equal to one year and less than 10 years. The Index includes investment grade, fixed-rate, taxable, U.S. dollar-denominated debt with $250 million or more par amount outstanding, issued by U.S. and non-U.S. industrial, utility and financial institutions. |
| 35 |
| · | The Credit Suisse Leveraged Loan Index is a market-weighted index designed to track the performance of the investable universe of the U.S. dollar-denominated institutional leveraged loan market. |
| · | The Bloomberg U.S. Corporate Bond Index measures the investment grade, fixed-rate, taxable corporate bond market. It includes securities publicly issued by U.S. and non-U.S. industrial, utility and financial issuers that are all U.S. dollar denominated. The Bloomberg U.S. Corporate Bond Index is a component of the Bloomberg U.S. Credit Bond Index. |
| · | The Bloomberg U.S. Corporate High Yield Bond Index measures the U.S. dollar-denominated, high yield, fixed-rate corporate bond market. Securities are classified as high yield if the middle rating of Moody's, Fitch and S&P is Ba1/BB+/BB+ or below. Bonds from issuers with an emerging markets country of risk, based on Bloomberg EM country definition, are excluded. |
| · | The Bloomberg U.S. Aggregate Bond Index is a broad base, market capitalization-weighted bond market index representing intermediate term investment grade bonds traded in the United States. The Index is frequently used as a stand-in for measuring the performance of the U.S. bond market. In addition to investment grade corporate debt, the Index tracks government debt, mortgage-backed securities (MBS) and asset-backed securities (ABS) to simulate the universe of investable bonds that meet certain criteria. In order to be included in the Index, bonds must be of investment grade or higher, have an outstanding par value of at least $100 million and have at least one year until maturity. |
| · | The S&P 500® Index is the Standard & Poor's Composite Index and is widely regarded as a single gauge of large cap U.S. equities. It is market cap weighted and includes 500 leading companies, capturing approximately 80% coverage of available market capitalization. |
| · | Consumer Price Index is a measure of the average change over time in the prices paid by urban consumers for a market basket of consumer goods and services. |
| · | Basis points, otherwise known as bps, are a unit of measure to describe the percentage change in the value or rate of a financial instrument. One basis point is equivalent to 0.01% (1/100th of a percent) or 0.0001 in decimal form. |
| · | Duration is a measure of the sensitivity of the price of a bond or other debt instrument to a change in interest rates. |
The volatility (beta) of the Fund may be greater or less than the benchmarks. An investor cannot invest directly in these indices.
Fund composition will change due to ongoing management of the Fund. References to specific securities or sectors should not be construed as recommendations by the Fund, its Advisor or Distributor.
As of December 31, 2021, the 10 largest holdings in the Aristotle Strategic Credit Fund, Class I (ARSSX) and their weights as a percent of total net assets were: RR Donnelley & Sons Co, 2.63%; OneMain Finance Corp, 2.24%; United Airlines 2019-2 Class B Pass Through Trust, 2.23%; Dell Inc, 2.19%; AAdvantage Loyalty IP Ltd, 2.19%; United Airlines Holdings Inc, 2.10%; Quad/Graphics Inc, 2.07%; Murphy Oil Corp, 2.04%; CSC Holdings LLC, 1.77%; Goldman Sachs Group Inc, 1.77%.
Please consider the Fund’s investment objectives, risks, charges and expenses carefully before investing. The prospectus or summary prospectus that contains this and other information about the Fund is available by calling (844) 274-7868, or by visiting aristotlefunds.com and should be read carefully prior to investing.
The Aristotle Strategic Credit Fund is distributed by IMST Distributors, LLC.
| 36 |
Aristotle Strategic Credit Fund
FUND PERFORMANCE at December 31, 2021 (Unaudited)

This graph compares a hypothetical $10,000 investment in the Fund’s Class I shares, made at its inception, with a similar investment in the Bloomberg Barclays U.S. High Yield Ba/B 2% Issuer Cap Index and the Aristotle Blended Index. Results include the reinvestment of all dividends and capital gains.
The Bloomberg Barclays U.S. High Yield Ba/B 2% Issuer Cap Index is an issuer-constrained version of the U.S. Corporate High-Yield Index that measures the market of USD-denominated, non-investment grade, fixed-rate, taxable corporate bonds rated Ba/B. The index limits the maximum exposure to any one issuer to 2%. The Bloomberg Barclays Intermediate U.S. Corporate Bond Index is designed to measure the performance of U.S. corporate bonds that have a maturity of greater than or equal to 1 year and less than 10 years. The index includes investment grade, fixed-rate, taxable, U.S. dollar-denominated debt with $250 million or more par amount outstanding, issued by U.S. and non-U.S. industrial, utility, and financial institutions. The Credit Suisse Leveraged Loan Index is designed to mirror the investable universe of the U.S. dollar-denominated leveraged loan market. These indices do not reflect expenses, fees, or sales charge, which would lower performance. These indices are unmanaged and they are not available for investment.
| Average Annual Total Returns as of December 31, 2021 | 1 Year | 5 Years | Since Inception | Inception Date |
| Aristotle Strategic Credit Fund – Class I | 2.56% | 4.77% | 4.57% | 12/31/14 |
| Bloomberg Barclays U.S. High Yield Ba/B 2% Issuer Cap Index | 4.65% | 6.36% | 6.07% | 12/31/14 |
| Aristotle Blended Index* | 2.99% | 4.91% | 4.73% | 12/31/14 |
| * | Aristotle Blended Index is a blend of 1/3 Bloomberg Barclays U.S. High Yield Ba/B 2% Issuer Cap Index, 1/3 Bloomberg Barclays Intermediate U.S. Corporate Bond Index and 1/3 Credit Suisse Leveraged Loan Index. The Bloomberg Barclays U.S. High Yield Loans Index was retired on September 30, 2016 and was replaced with the Credit Suisse Leveraged Loan Index effective October 1, 2016. |
| 37 |
Aristotle Strategic Credit Fund
FUND PERFORMANCE at December 31, 2021 (Unaudited) - Continued
The performance data quoted here represents past performance and past performance is not a guarantee of future results. Investment return and principal value will fluctuate so that an investor's shares, when redeemed, may be worth more or less than their original cost. Current performance may be lower or higher than the performance information quoted. The most recent month end performance may be obtained by calling (888) 661-6691.
Gross and net expense ratios for the Fund’s Class I shares were 3.22% and 0.62%, respectively, which were the amounts stated in the current prospectus dated May 1, 2021. For the Fund’s current one year expense ratios, please refer to the Financial Highlights section of this report. The Fund’s Advisor has contractually agreed to waive its fees and/or pay for operating expenses of the Fund to ensure that total annual fund operating expenses do not exceed 0.62% of the Fund’s average daily net assets. This agreement is in effect until April 30, 2022, and it may be terminated before that date only by the Trust’s Board of Trustees. In the absence of such waivers, the Fund’s returns would be lower.
Returns reflect the reinvestment of distributions made by the Fund, if any. The graph and performance table above do not reflect the deduction of taxes that a shareholder would pay on Fund distributions or the redemption of the Fund shares. Shares redeemed within 30 days of purchase will be charged a 1.00% redemption fee.
| 38 |
Aristotle Strategic Credit Fund
SCHEDULE OF INVESTMENTS
As of December 31, 2021
| Principal Amount | Value | |||||||
| BANK LOANS — 7.1% | ||||||||
| COMMUNICATIONS — 1.5% | ||||||||
| $ | 135,831 | CSC Holdings LLC 2.610% (1-Month USD Libor+250 basis points), 4/15/20271,2,3 | $ | 134,302 | ||||
| CONSUMER DISCRETIONARY — 3.8% | ||||||||
| 160,000 | AAdvantage Loyalty IP Ltd. 5.500% (1-Month USD Libor+475 basis points), 4/20/20281,2,3 | 166,071 | ||||||
| 111,574 | Penn National Gaming, Inc. 2.000% (3-Month USD Libor+125 basis points), 10/19/20231,3 | 111,295 | ||||||
| 47,250 | WW International, Inc. 4.000% (1-Month USD Libor+350 basis points), 4/13/20281,2,3 | 46,859 | ||||||
| 324,225 | ||||||||
| HEALTH CARE — 1.5% | ||||||||
| 61,717 | Change Healthcare Holdings LLC 3.500% (1-Month USD Libor+250 basis points), 3/1/20241,2,3 | 61,726 | ||||||
| 65,000 | Mozart Borrower LP 3.750% (1-Month USD Libor+325 basis points), 10/23/20281,2,3 | 65,059 | ||||||
| 126,785 | ||||||||
| TECHNOLOGY — 0.3% | ||||||||
| 29,550 | Presidio Holdings, Inc. 3.628% (1-Month USD Libor+350 basis points), 1/22/20271,2,3 | 29,578 | ||||||
| TOTAL BANK LOANS | ||||||||
| (Cost $611,800) | 614,890 | |||||||
| CORPORATE BONDS — 78.8% | ||||||||
| COMMUNICATIONS — 6.9% | ||||||||
| 121,000 | AMC Networks, Inc. 4.250%, 2/15/20292 | 120,244 | ||||||
| 92,000 | DISH DBS Corp. 5.875%, 11/15/2024 | 94,423 | ||||||
| 88,000 | Hughes Satellite Systems Corp. 6.625%, 8/1/2026 | 98,494 | ||||||
| 80,000 | iHeartCommunications, Inc. 6.375%, 5/1/20262 | 83,000 | ||||||
| 111,000 | Lamar Media Corp. 4.875%, 1/15/20292 | 115,856 | ||||||
| 74,000 | Lumen Technologies, Inc. 7.650%, 3/15/2042 | 79,631 | ||||||
| 591,648 | ||||||||
| CONSUMER DISCRETIONARY — 27.2% | ||||||||
| 96,000 | Asbury Automotive Group, Inc. 4.750%, 3/1/20302 | 97,560 | ||||||
| 39 |
Aristotle Strategic Credit Fund
SCHEDULE OF INVESTMENTS - Continued
As of December 31, 2021
| Principal Amount | Value | |||||||
| CORPORATE BONDS (Continued) | ||||||||
| CONSUMER DISCRETIONARY (Continued) | ||||||||
| $ | 55,000 | Bath & Body Works, Inc. 6.694%, 1/15/2027 | $ | 63,250 | ||||
| 96,000 | Beazer Homes USA, Inc. 5.875%, 10/15/20272 | 100,440 | ||||||
| 91,000 | Brinker International, Inc. 3.875%, 5/15/2023 | 93,047 | ||||||
| 111,000 | Carnival Corp. 7.200%, 10/1/20234 | 119,230 | ||||||
| 57,000 | Dana, Inc. 5.625%, 6/15/20282 | 60,563 | ||||||
| 98,000 | Goodyear Tire & Rubber Co. 5.000%, 5/31/20262 | 100,572 | ||||||
| 97,000 | Griffon Corp. 5.750%, 3/1/20282 | 100,700 | ||||||
| 94,940 | JetBlue 2020-1 Class B Pass-Through Trust 7.750%, 5/15/2030 | 110,344 | ||||||
| 77,000 | KB Home 7.625%, 5/15/20232 | 80,946 | ||||||
| 112,000 | Macy's Retail Holdings LLC 3.625%, 6/1/20242 | 114,520 | ||||||
| 103,000 | Marriott Ownership Resorts, Inc. 4.750%, 1/15/20282 | 104,545 | ||||||
| 116,000 | MGM Resorts International 4.750%, 10/15/20282 | 119,480 | ||||||
| 155,000 | Quad/Graphics, Inc. 7.000%, 5/1/2022 | 156,937 | ||||||
| 58,000 | QVC, Inc. 4.850%, 4/1/2024 | 61,901 | ||||||
| 186,000 | RR Donnelley & Sons Co. 6.500%, 11/15/2023 | 199,485 | ||||||
| 40,000 | Sally Holdings LLC / Sally Capital, Inc. 5.625%, 12/1/20252 | 40,900 | ||||||
| 123,000 | Tenneco, Inc. 5.000%, 7/15/20262 | 118,234 | ||||||
| 65,000 | Travel + Leisure Co. 6.000%, 4/1/20272 | 70,640 | ||||||
| 91,000 | Tri Pointe Homes, Inc. 5.250%, 6/1/20272 | 97,711 | ||||||
| 170,458 | United Airlines 2019-2 Class B Pass-Through Trust 3.500%, 11/1/2029 | 168,829 | ||||||
| 155,000 | United Airlines Holdings, Inc. 4.875%, 1/15/2025 | 159,456 | ||||||
| 2,339,290 | ||||||||
| 40 |
Aristotle Strategic Credit Fund
SCHEDULE OF INVESTMENTS - Continued
As of December 31, 2021
| Principal Amount | Value | |||||||
| CORPORATE BONDS (Continued) | ||||||||
| ENERGY — 11.1% | ||||||||
| $ | 111,000 | Antero Resources Corp. 5.000%, 3/1/20252 | $ | 112,780 | ||||
| 75,000 | Baker Hughes Holdings LLC / Baker Hughes Co.-Obligor, Inc. 1.231%, 12/15/2023 | 75,350 | ||||||
| 59,000 | Buckeye Partners LP 4.125%, 12/1/20272 | 60,893 | ||||||
| 77,000 | Continental Resources, Inc. 4.500%, 4/15/20232 | 79,346 | ||||||
| 67,000 | Crestwood Midstream Partners LP / Crestwood Midstream Finance Corp. 5.750%, 4/1/20252 | 68,508 | ||||||
| 106,000 | EQM Midstream Partners LP 4.000%, 8/1/20242 | 110,107 | ||||||
| 48,000 | Hess Corp. 4.300%, 4/1/20272 | 52,306 | ||||||
| 117,000 | HollyFrontier Corp. 2.625%, 10/1/2023 | 119,220 | ||||||
| 93,000 | Murphy Oil Corp. 5.750%, 8/15/20252 | 95,558 | ||||||
| 58,000 | Murphy Oil Corp. 6.875%, 8/15/20242 | 59,195 | ||||||
| 28,000 | Southwestern Energy Co. 6.450%, 1/23/20252 | 30,772 | ||||||
| 86,000 | Sunoco LP / Sunoco Finance Corp. 5.875%, 3/15/20282 | 90,945 | ||||||
| 954,980 | ||||||||
| FINANCIALS — 21.7% | ||||||||
| 67,000 | Air Lease Corp. 4.125% (U.S. Treasury Yield Curve Rate T-Note Constant Maturity 5 Year+315 basis points)2,5,6 | 66,498 | ||||||
| 113,000 | Aircastle Ltd. 5.000%, 4/1/20234 | 117,961 | ||||||
| 56,000 | Ally Financial, Inc. 8.000%, 11/1/2031 | 79,352 | ||||||
| 84,000 | Bank of America Corp. 6.300% (3-Month USD Libor+455 basis points)2,5,6 | 94,500 | ||||||
| Citigroup, Inc. | ||||||||
| 37,000 | 5.900% (3-Month USD Libor+423 basis points)2,5,6 | 38,110 | ||||||
| 70,000 | 6.250% (3-Month USD Libor+452 basis points)2,5,6 | 78,946 | ||||||
| 128,000 | Goldman Sachs Group, Inc. 1.886% (3-Month USD Libor+175 basis points), 10/28/20272,3 | 133,967 | ||||||
| 98,000 | Icahn Enterprises LP / Icahn Enterprises Finance Corp. 4.750%, 9/15/20242 | 101,675 | ||||||
| 41 |
Aristotle Strategic Credit Fund
SCHEDULE OF INVESTMENTS - Continued
As of December 31, 2021
| Principal Amount | Value | |||||||
| CORPORATE BONDS (Continued) | ||||||||
| FINANCIALS (Continued) | ||||||||
| $ | 57,000 | JPMorgan Chase & Co. 6.750% (3-Month USD Libor+378 basis points)2,5,6 | $ | 61,781 | ||||
| 77,000 | MetLife, Inc. 10.750%, 8/1/20392 | 129,957 | ||||||
| 118,000 | Morgan Stanley 3.734% (3-Month USD Libor+361 basis points)2,5,6 | 118,060 | ||||||
| 90,000 | MPT Operating Partnership LP / MPT Finance Corp. 5.000%, 10/15/20272 | 94,162 | ||||||
| 93,000 | Navient Corp. 5.875%, 10/25/2024 | 99,161 | ||||||
| OneMain Finance Corp. | ||||||||
| 79,000 | 7.125%, 3/15/2026 | 90,060 | ||||||
| 81,000 | 4.000%, 9/15/20302 | 79,654 | ||||||
| 114,000 | Prudential Financial, Inc. 5.875% (3-Month USD Libor+418 basis points), 9/15/20422,6 | 116,513 | ||||||
| 45,000 | Radian Group, Inc. 6.625%, 3/15/20252 | 49,725 | ||||||
| 81,000 | RHP Hotel Properties LP / RHP Finance Corp. 4.750%, 10/15/20272 | 82,620 | ||||||
| 105,000 | Service Properties Trust 4.500%, 3/15/20252 | 102,375 | ||||||
| 127,000 | Starwood Property Trust, Inc. 4.750%, 3/15/20252 | 132,080 | ||||||
| 1,867,157 | ||||||||
| HEALTH CARE — 3.0% | ||||||||
| Encompass Health Corp. | ||||||||
| 72,000 | 4.500%, 2/1/20282 | 74,070 | ||||||
| 40,000 | 4.750%, 2/1/20302 | 41,200 | ||||||
| 58,000 | Tenet Healthcare Corp. 4.625%, 7/15/20242 | 58,725 | ||||||
| 82,000 | Teva Pharmaceutical Finance Netherlands III B.V. 2.800%, 7/21/20234 | 82,284 | ||||||
| 256,279 | ||||||||
| INDUSTRIALS — 1.9% | ||||||||
| 107,000 | Titan International, Inc. 7.000%, 4/30/20282 | 113,955 | ||||||
| 45,000 | United Rentals North America, Inc. 4.000%, 7/15/20302 | 46,238 | ||||||
| 160,193 | ||||||||
| 42 |
Aristotle Strategic Credit Fund
SCHEDULE OF INVESTMENTS - Continued
As of December 31, 2021
| Principal Amount | Value | |||||||
| CORPORATE BONDS (Continued) | ||||||||
| MATERIALS — 2.4% | ||||||||
| $ | 71,000 | Allegheny Technologies, Inc. 5.125%, 10/1/20312 | $ | 71,533 | ||||
| 111,000 | Mercer International, Inc. 5.500%, 1/15/20262 | 112,387 | ||||||
| 24,000 | Olin Corp. 5.500%, 8/15/2022 | 24,510 | ||||||
| 208,430 | ||||||||
| TECHNOLOGY — 2.5% | ||||||||
| 147,000 | Dell, Inc. 5.400%, 9/10/2040 | 166,294 | ||||||
| 53,000 | Jabil, Inc. 1.700%, 4/15/20262 | 52,880 | ||||||
| 219,174 | ||||||||
| UTILITIES — 2.1% | ||||||||
| 65,000 | AmeriGas Partners LP / AmeriGas Finance Corp. 5.625%, 5/20/20242 | 70,276 | ||||||
| 114,000 | Pacific Gas and Electric Co. 1.750%, 6/16/20222 | 114,000 | ||||||
| 184,276 | ||||||||
| TOTAL CORPORATE BONDS | ||||||||
| (Cost $6,729,160) | 6,781,427 | |||||||
| Number of Shares | ||||||||
| PREFERRED STOCKS — 1.0% | ||||||||
| FINANCIALS — 1.0% | ||||||||
| 60 | Wells Fargo & Co., 7.500%5,7 | 89,686 | ||||||
| TOTAL PREFERRED STOCKS | ||||||||
| (Cost $83,610) | 89,686 | |||||||
| 43 |
Aristotle Strategic Credit Fund
SCHEDULE OF INVESTMENTS - Continued
As of December 31, 2021
| Principal Amount | Value | |||||||
| SHORT-TERM INVESTMENTS — 5.1% | ||||||||
| $ | 440,524 | UMB Bank demand deposit, 0.01%8 | $ | 440,524 | ||||
| TOTAL SHORT-TERM INVESTMENTS | ||||||||
| (Cost $440,524) | 440,524 | |||||||
| TOTAL INVESTMENTS — 92.0% | ||||||||
| (Cost $7,865,094) | 7,926,527 | |||||||
| Other Assets in Excess of Liabilities — 8.0% | 685,611 | |||||||
| TOTAL NET ASSETS — 100.0% | $ | 8,612,138 | ||||||
LP – Limited Partnership
| 1 | Bank loans generally pay interest at rates which are periodically determined by reference to a base lending rate plus a premium. All loans carry a variable rate of interest. These base lending rates are generally (i) the Prime Rate offered by one or more major United States banks, (ii) the lending rate offered by one or more European banks such as the London Interbank Offered Rate ("LIBOR") or (iii) the Certificate of Deposit rate. Bank Loans, while exempt from registration, under the Securities Act of 1933, contain certain restrictions on resale and cannot be sold publicly. Floating rate bank loans often require prepayments from excess cash flow or permit the borrower to repay at its election. The degree to which borrowers repay, whether as a contractual requirement or at their election, cannot be predicted with accuracy. |
| 2 | Callable. |
| 3 | Floating rate security. |
| 4 | Foreign security denominated in U.S. dollars. |
| 5 | Perpetual security. Maturity date is not applicable. |
| 6 | Variable rate security. |
| 7 | Convertible security. |
| 8 | The rate is the annualized seven-day yield at period end. |
See Accompanying Notes to Financial Statements.
| 44 |
Aristotle Strategic Credit Fund
SUMMARY OF INVESTMENTS
As of December 31, 2021
| Security Type/Sector | Percent of Total Net Assets | |||
| Bank Loans | ||||
| Consumer Discretionary | 3.8 | % | ||
| Communications | 1.5 | % | ||
| Health Care | 1.5 | % | ||
| Technology | 0.3 | % | ||
| Total Bank Loans | 7.1 | % | ||
| Corporate Bonds | ||||
| Consumer Discretionary | 27.2 | % | ||
| Financials | 21.7 | % | ||
| Energy | 11.1 | % | ||
| Communications | 6.9 | % | ||
| Health Care | 3.0 | % | ||
| Technology | 2.5 | % | ||
| Materials | 2.4 | % | ||
| Utilities | 2.1 | % | ||
| Industrials | 1.9 | % | ||
| Total Corporate Bonds | 78.8 | % | ||
| Preferred Stocks | ||||
| Financials | 1.0 | % | ||
| Short-Term Investments | 5.1 | % | ||
| Total Investments | 92.0 | % | ||
| Other Assets in Excess of Liabilities | 8.0 | % | ||
| Total Net Assets | 100.0 | % | ||
See Accompanying Notes to Financial Statements.
| 45 |

Dear Fellow Shareholders,
Markets Review
In a year filled with uncertainty, the U.S. economy proved resilient. Even in the face of inflation, supply-chain disruptions, labor shortages and COVID-19 variants, many businesses reported strong earnings growth and stable, if not improving, margins. Themes from 2020, such as fiscal and monetary policy actions, vaccine (and now booster) developments, and economic recovery persisted.
The U.S. equity market finished the year strong, recording its seventh consecutive quarter of positive performance. The S&P 500 Index finished with a full-year return to 28.71%. Concurrently, the Bloomberg U.S. Aggregate Bond Index finished with a calendar-year return of -1.54%. In terms of style, the Russell 1000 Value Index ended 2021 with a full-year underperformance of 2.44% compared to its growth counterpart.
Meanwhile, fiscal policy also made headlines as the $1 trillion bipartisan infrastructure bill was signed into law. However, momentum for the now $1.7 trillion Build Back Better social spending and climate bill stalled, largely due to disagreements over the scope and size of the bill.
In terms of corporate earnings, labor shortages and supply-chain disruptions, specifically procurement issues and input price pressures, continued to impact businesses. Nevertheless, corporate earnings were robust, with year-over-year earnings per share (EPS) growth for S&P 500 constituents reaching nearly 40%, the third-highest figure since 2010, and 82% of S&P 500 companies beating EPS estimates. Additionally, nearly two out of three S&P 500 companies reported improving profitability since the start of the pandemic, citing pricing power and strong demand.
On the COVID front, the Omicron variant became the dominant strain in the U.S., with the number of new daily cases rising to upwards of 500,000, the highest reported figure during the pandemic.
Although we are happy to report another strong year, the constant twists, turns and pivots of this past year are a reminder of the fragility of the short term. Factors such as the possibility of new variants, the timing of a full recovery, fiscal and monetary policy decisions, and market sentiment are topics better left for reporters. We believe investment managers (and their clients) are best positioned to create lasting value by minimizing distractions and focusing on the long term.
Performance data quoted here represents past performance. Past performance is no guarantee of future results. Investment return and principal value will fluctuate so that an investor’s shares, when redeemed, may be worth more or less than their original cost. Current performance may be lower or higher than the performance information quoted. To obtain performance information current to the most recent month-end, please call (844) 274-7868.

FOR MORE INFORMATION, PLEASE CONTACT:
Phone: (888) 661-6691 | Email: funds@aristotlecap.com | Web: www.aristotlefunds.com
| 46 |
Performance Review
The Aristotle Value Equity Fund posted a total return of 24.90% at NAV for the year ending December 31, 2021, underperforming the Russell 1000 Value Index, which performed 25.16% over the same period.
The Fund’s underperformance relative to the Russell 1000 Value Index over the period resulted primarily from security selection. Security selection in Energy and Communication Services, as well as an overweight in Information Technology were the largest detractors from relative performance for the year. Conversely, security selection in Industrials and Financials, as well as an underweight to Communication Services were the primary contributors to relative performance. (Relative weights are the result of bottom-up security selection.).
2021 Top Contributors to Relative Fund Return | 2021 Top Detractors from Relative Fund Return | |
| Microsoft | PayPal | |
| Johnson Controls International | ||
| Lennar | Novartis | |
| Ameriprise Financial | Ansys | |
| Martin Marietta Materials | Elanco Animal Health |
PayPal Holdings, the online and mobile e-commerce payments company, was the top detractor this year as the threat of increased competition created concerns surrounding the company’s outlook. Nevertheless, PayPal recorded strong results throughout the year that included double-digit increases in total payment volume and revenue growth, and a total of 416 million active accounts on the platform. Over the past decade, we have studied PayPal’s ability to grow its extensive dual network (difficult to replicate, in our opinion) while navigating numerous competitors entering the industry. Although there may continue to be short-term headwinds and volatility in the share price, we remain focused on the fundamental advancements and long-term prospects of the business. The company has announced various positive initiatives such as Amazon enabling U.S. customers to pay with Venmo, United allowing PayPal QR codes as an inflight payment option, and Honey expanding shopping rewards with the introduction of cash back through PayPal. We feel these partnerships display the strength of the PayPal brand, demonstrate progress on catalysts like the monetization of Venmo and enhance the overall PayPal platform.
Twitter, the digital news platform, was one of the largest detractors this year. Despite recording positive results, concerns regarding the company’s growth and execution weighed on Twitter’s share price. Furthermore, during the fourth quarter, Jack Dorsey, Chairman and CEO of Twitter announced his resignation from both roles. Mr. Dorsey is succeeded by Parag Agrawal as CEO and Bret Taylor (CEO of Salesforce) as Chairman. Mr. Agrawal has been with Twitter for more than a decade and has served as CTO since 2017. We look forward to meeting with Mr. Agrawal and learning more about his leadership style and vision for Twitter.
| 47 |
Johnson Controls, a building solutions, technology and services provider, was a leading contributor for the year. Despite the challenging market environment, Johnson Controls delivered solid results demonstrating strong underlying demand and benefits from various cost-cutting initiatives. Furthermore, the company has continued to reinvest in the business and furthered strategic growth initiatives during the year. Due to Johnson Controls’ improving operating performance and the strength of its balance sheet, the board announced an increase in its quarterly dividend and maintained its plan to repurchase ~$1.4 billion in shares in 2022. Although the industry may continue to face short-term headwinds, we are encouraged by Johnson Controls’ resilient results and its successful execution of various operational objectives. We believe the company is well positioned to capitalize on these improvements and its investments as conditions normalize.
Aggregates producer Martin Marietta Materials was one of the top contributors for the year, as it delivered year-to-date records for revenues and gross profit. A unique combination of higher organic volumes and price increases was able to offset significantly higher energy-related costs. The company also completed its acquisition of Lehigh Hanson’s West Region business, the second-largest acquisition in its history, increasing the firm’s presence in California and Arizona. Past acquisitions, including Texas Industries and Bluegrass Materials, have been, in our opinion, successfully integrated and have positioned the company with a coast-to-coast footprint and meaningful presence in states with high population inflows and what we think are solid underlying economies (i.e., Texas, Colorado, California, North Carolina, Georgia and Florida). Consistent with its acquisition practices, the company is committed to lowering its debt within the next 18 months. We believe the firm’s prudent capital spending, value-enhancing acquisitions, FREE cash flow generation and “value over volume” pricing strategy position the company to continue to benefit from secular demand trends, including single-family housing and federal and state-level infrastructure investment, as well as non-residential construction (e.g., warehouse and data centers).
| 48 |
Investment Activity
During the year, we made the following purchases and sales in the Fund.
| 2021 Fund Purchases | 2021 Fund Sales | |||
| Crown Castle | 1Q2021 | BOK Financial | 1Q2021 | |
| Michelin | 1Q2021 | Oshkosh | 1Q2021 | |
| Honeywell | 3Q2021 | Pioneer Natural Resources | 1Q2021 | |
| Ecolab | 3Q2021 | Allegion | 3Q2021 | |
| Constellation Brands | 4Q2021 | JPMorgan Chase | 3Q2021 | |
| Novartis | 4Q2021 | |||
One of our objectives is to clearly articulate the thought process behind our investments to our fellow shareholders. Below is an example of a sale (Novartis) and a purchase (Constellation Brands) we made in the Fund this year. Those securities were the last sale and purchase for the year.
Sale
Our investment in Novartis dates back to the inception of the Aristotle Value Equity Fund. Novartis went through much change during our holding period. Vasant (“Vas”) Narasimhan was promoted to CEO in early 2018 and, we believe, has positively influenced the company’s culture. Vas also helped shift the business more toward innovative medicines. Examples include the sale of Novartis’s consumer (over-the-counter) joint venture with GlaxoSmithKline and the spinoff of Alcon, a global leader in the treatment of eye diseases and eye conditions. While we continue to believe Novartis possesses Q-V-C characteristics, we decided to exit our investment in favor of what we view to be a more optimal opportunity in Constellation Brands.
Purchase
Constellation Brands, Inc.
Founded in 1945 in upstate New York, Constellation Brands is a producer and marketer of beer, wine and spirits. The business grew to scale primarily as a purveyor of wine and spirits but, through M&A, has repositioned itself away from lower-end wine and spirit labels and toward premium beer. With more than $8 billion in annual revenue, Constellation is now the third-largest beer company by market share in the U.S.
Beer sales (~75% of revenue) are anchored by a set of premium Mexican trademarks, including Corona, Modelo and Pacifico. In 2013, Constellation acquired the exclusive and perpetual U.S. distribution rights for these Mexican brands from AB InBev, which had to divest due to antitrust mandates. Constellation’s Wine & Spirits segment (~25%) consists of brands such as Kim Crawford, Meiomi, The Prisoner and Svedka Vodka. It also owns a ~35% stake in Canopy Growth, a prominent Canadian provider of medicinal and recreational cannabis products.
| 49 |
High-Quality Business
Some of the quality characteristics we have identified for Constellation Brands include:
| · | Leading market share with more than 80% of the fast-growing Mexican imports segment of U.S. beer. Modelo is the best-selling imported beer in the U.S., and Pacifico is one of the quickest-rising imports; |
| · | Strong management team with a demonstrated ability to successfully market imports to mainstream U.S. populations, gain market share and ramp up distribution of new brands, forge deep relationships with distributors and retailers, and expand shelf space with innovations; and |
| · | The broad resonance of its top-tier brands and premium positioning supports more productive per-dollar promotional spending, affording it best-in-class operating margins among brewers of roughly 40%. |
Attractive Valuation
We believe Constellation Brands is attractively valued based on our estimates of higher normalized FREE cash flow due to increased market penetration of its beer labels and enhanced margins for its portfolio of wines.
Compelling Catalysts
Catalysts we have identified for Constellation Brands, which we believe will cause its stock price to appreciate over our three- to five-year investment horizon, include:
| · | Constellation’s near monopoly on Mexican beer distribution in the U.S., as well as its hard-to-replicate production capabilities in Mexico, uniquely position it to benefit from the growing Hispanic demographic and increasing popularity of Mexican beer in the U.S.; |
| · | Continued shelf-space gains, as well as further penetration in bars and restaurants for the Beer segment, as its brands have a small share of total distribution points but a relatively high percentage of sales per distribution point; and |
| · | Improved margins in Constellation’s Wine & Spirits segment following divestment of its less-profitable, lower-end wine brands. |
This information is for illustrative purposes only and is not a recommendation to buy or sell a particular security. There is no guarantee that the securities discussed will prove to be profitable. Please refer to disclosures at the end of this document.
| 50 |
Outlook
As we turn the page on another year, we are reminded of the fleeting nature of headline news. Our focus is not on factors that will change in the coming months, but rather on the fundamentals of businesses that may persist for years.
Rather than attempting the impossible task of predicting the unpredictable, we remain steadfast in abiding by our investment philosophy and process that have been in place for nearly 25 years. By utilizing a long-term approach and identifying what we perceive to be high-quality businesses, trading at discounts to our estimates of their intrinsic value, that possess catalysts within management’s control, we believe we can withstand short-term swings and add lasting value for our clients.
 |  |
Howard Gleicher, CFA CEO & Chief Investment Officer Aristotle Capital Management, LLC | Gregory Padilla, CFA Principal, Portfolio Manager |
| 51 |
Aristotle Value Equity Fund (Class I)
| Performance Update | December 31, 2021 | |||||
| Total Return | 4Q21 | 1 Year | 3 Years | 5 Years | Annualized Since Inception (8/31/16) | Gross/Net Expense Ratio |
| ARSQX Class I | 7.52% | 24.90% | 23.60% | 15.84% | 15.79% | 0.79%/0.69% |
| Russell 1000 Value Index | 7.77% | 25.16% | 17.64% | 11.16% | 11.73% | N/A |
| S&P 500 Index | 11.03% | 28.71% | 26.07% | 18.47% | 18.05% | N/A |
Performance results for periods greater than one year have been annualized.
Performance data quoted here represents past performance. Past performance is no guarantee of future results. Investment return and principal value will fluctuate so that an investor’s shares, when redeemed, may be worth more or less than their original cost. Current performance may be lower or higher than the performance information quoted. To obtain performance information current to the most recent month-end, please call (844) 274-7868.
The Fund’s advisor has contractually agreed to waive certain fees and/or absorb expenses, through April 30, 2022, to the extent that the total annual operating expenses do not exceed 0.69% of average daily net assets of the Fund. The Fund’s advisor may seek reimbursement from the Fund for waived fees and/or expenses paid for three years from the date of the waiver or payment. Without these reductions, the Fund’s performance would have been lower. A redemption fee of 1.00% will be imposed on redemptions of shares within 30 days of purchase.
Important Information:
There can be no guarantee that any strategy (risk management or otherwise) will be successful. All investing involves risk, including potential loss of principal.
The views in this letter were as of December 31, 2021 and may not necessarily reflect the same views on the date this letter is first published or any time thereafter. These views are intended to help shareholders in understanding the Fund’s investment methodology and do not constitute investment advice.
Past performance is not indicative of future results. You should not assume that any of the securities transactions, sectors or holdings discussed in this report are or will be profitable, or that recommendations Aristotle Capital makes in the future will be profitable or equal the performance of the securities listed in this report. There is no assurance that any securities, sectors or industries discussed herein will be included in or excluded from the Fund. The opinions expressed are as of the date of publication and are subject to change due to changes in the market or economic conditions and may not necessarily come to pass. Aristotle Capital reserves the right to modify its current investment strategies and techniques based on changing market dynamics or client needs. This is not a recommendation to buy or sell a particular security. Holdings are available within the last 12 months.
An investment in the Fund is subject to risks, and you could lose money on your investment in the Fund. The principal risks of investing in the Fund include, but are not limited to, investing in foreign securities, ETFs, small-capitalization, mid-capitalization and large-capitalization companies and value stocks. Market Turbulence Resulting from COVID-19 – The outbreak of COVID-19 has negatively affected the worldwide economy, individual countries, individual companies and the market in general. The future impact of COVID-19 is currently unknown, and it may exacerbate other risks that apply to the Fund. To learn more about the Principal Risks of Investing in the Fund, please reference the prospectus.
| 52 |
Foreign securities have additional risks, including currency rate changes, political and economic instability, lack of comprehensive company information, less market liquidity, less-efficient trading markets, and differing auditing controls and legal standards. The use of ETFs may cause the Fund to have higher expenses than those of other equity funds. Investments in emerging markets involve even greater risks. The securities of small-capitalization and mid-capitalization companies may be subject to more abrupt or erratic market movements and may have lower trading volumes or more erratic trading than securities of larger, more established companies or market averages in general. On the other hand, larger, more established companies may be unable to attain the high growth rates of successful, smaller companies during periods of economic expansion. Value stocks are those that are believed to be undervalued in comparison to their peers due to adverse business developments or other factors. Value investing is subject to the risk that the market will not recognize a security’s inherent value for a long time or at all, or that a stock judged to be undervalued may actually be appropriately priced or overvalued.
Definitions:
| · | The S&P 500® Index is the Standard & Poor’s Composite Index of 500 stocks and is a widely recognized, unmanaged index of common stock prices. |
| · | The Russell 1000® Value Index measures the performance of the large-cap value segment of the U.S. equity universe. It includes those Russell 1000 Index companies with lower price-to-book ratios and lower expected growth values. |
| · | The Bloomberg U.S. Aggregate Bond Index is an unmanaged index of domestic investment grade bonds, including corporate, government and mortgage-backed securities. |
| · | FREE cash flow is generally calculated as cash flow from operations less capital expenditures. |
The volatility (beta) of the Fund may be greater or less than its respective benchmarks. It is not possible to invest directly in these indices.
Portfolio composition will change due to ongoing management of the Fund. References to specific securities or sectors should not be construed as recommendations by the Fund, its Advisor or Distributor.
As of December 31, 2021, the 10 largest holdings in the Fund and their weights as a percent of total net assets were: Microsoft Corp., 4.70%; Danaher Corp., 4.47%; Adobe Inc., 3.70%; ANSYS, Inc., 3.39%; Sony Corp., 3.36%; QUALCOMM, Inc., 3.20%; Lennar Corp., 3.18%; Capital One Financial Corp., 3.01%; Microchip Technology, Inc., 2.96%; Johnson Controls International, plc, 2.89%.
| 53 |
Aristotle Value Equity Fund
FUND PERFORMANCE at December 31, 2021 (Unaudited)
This graph compares a hypothetical $10,000 investment in the Fund’s Class I shares, made at its inception, with a similar investment in the Russell 1000 Value Index and the S&P 500 Index. Results include the reinvestment of all dividends and capital gains.
The Russell 1000 Value Index measures the performance of the large-cap value segment of the U.S. equity universe. It includes those Russell 1000 Index companies with lower price-to-book ratios and lower expected growth values. The S&P 500 Index is the Standard & Poor’s Composite Index of 500 stocks and is a widely recognized, unmanaged index of common stock prices. These indices do not reflect expenses, fees, or sales charge, which would lower performance. These indices are unmanaged and they are not available for investment.
| Average Annual Total Returns as of December 31, 2021 | 1 Year | 5 Years | Since Inception | Inception Date |
| Aristotle Value Equity Fund – Class I | 24.90% | 15.84% | 15.79% | 08/31/16 |
| Russell 1000 Value Index | 25.16% | 11.16% | 11.73% | 08/31/16 |
| S&P 500 Index | 28.71% | 18.47% | 18.05% | 08/31/16 |
The performance data quoted here represents past performance and past performance is not a guarantee of future results. Investment return and principal value will fluctuate so that an investor's shares, when redeemed, may be worth more or less than their original cost. Current performance may be lower or higher than the performance information quoted. The most recent month end performance may be obtained by calling (888) 661-6691.
Gross and net expense ratios for the Fund’s Class I shares were 0.79% and 0.69%, respectively, which were the amounts stated in the current prospectus dated May 1, 2021. For the Fund’s current one year expense ratios, please refer to the Financial Highlights section of this report. The Fund’s Advisor has contractually agreed to waive its fees and/or pay for operating expenses of the Fund to ensure that total annual fund operating expenses do not exceed 0.69% of the Fund’s average daily net assets. This agreement is in effect until April 30, 2022, and it may be terminated before that date only by the Trust’s Board of Trustees. In the absence of such waivers, the Fund’s returns would be lower.
Returns reflect the reinvestment of distributions made by the Fund, if any. The graph and performance table above do not reflect the deduction of taxes that a shareholder would pay on Fund distributions or the redemption of the Fund shares. Shares redeemed within 30 days of purchase will be charged a 1.00% redemption fee.
| 54 |
Aristotle Value Equity Fund
SCHEDULE OF INVESTMENTS
As of December 31, 2021
| Number of Shares | Value | |||||||
| COMMON STOCKS — 97.0% | ||||||||
| COMMUNICATIONS — 1.6% | ||||||||
| 353,200 | Twitter, Inc.* | $ | 15,265,304 | |||||
| CONSUMER DISCRETIONARY — 7.8% | ||||||||
| 674,300 | Cie Generale des Etablissements Michelin SCA - ADR1 | 22,110,297 | ||||||
| 97,100 | Ecolab, Inc. | 22,778,689 | ||||||
| 251,700 | Lennar Corp. - Class A | 29,237,472 | ||||||
| 78 | Lennar Corp. - Class B | 7,458 | ||||||
| 74,133,916 | ||||||||
| CONSUMER STAPLES — 8.9% | ||||||||
| 341,500 | Coca-Cola Co. | 20,220,215 | ||||||
| 67,000 | Constellation Brands, Inc. - Class A | 16,814,990 | ||||||
| 131,400 | Procter & Gamble Co. | 21,494,412 | ||||||
| 180,000 | Tyson Foods, Inc. - Class A | 15,688,800 | ||||||
| 185,900 | Walgreens Boots Alliance, Inc. | 9,696,544 | ||||||
| 83,914,961 | ||||||||
| ENERGY — 2.9% | ||||||||
| 825,500 | Coterra Energy, Inc. | 15,684,500 | ||||||
| 169,600 | Phillips 66 | 12,289,216 | ||||||
| 27,973,716 | ||||||||
| FINANCIALS — 15.8% | ||||||||
| 78,300 | Ameriprise Financial, Inc. | 23,619,978 | ||||||
| 190,700 | Capital One Financial Corp. | 27,668,663 | ||||||
| 84,100 | Chubb Ltd.1 | 16,257,371 | ||||||
| 172,400 | Cincinnati Financial Corp. | 19,641,532 | ||||||
| 173,800 | Commerce Bancshares, Inc. | 11,947,012 | ||||||
| 128,200 | Cullen/Frost Bankers, Inc. | 16,162,174 | ||||||
| 19,053 | East West Bancorp, Inc. | 1,499,090 | ||||||
| 1,744,200 | Mitsubishi UFJ Financial Group, Inc. - ADR1 | 9,523,332 | ||||||
| 114,800 | PNC Financial Services Group, Inc. | 23,019,696 | ||||||
| 149,338,848 | ||||||||
| HEALTH CARE — 12.1% | ||||||||
| 238,600 | Alcon, Inc.1 | 20,786,832 | ||||||
| 88,400 | Amgen, Inc. | 19,887,348 | ||||||
| 124,900 | Danaher Corp. | 41,093,349 | ||||||
| 534,100 | Elanco Animal Health, Inc.* | 15,157,758 | ||||||
| 172,800 | Medtronic PLC1 | 17,876,160 | ||||||
| 114,801,447 | ||||||||
| 55 |
Aristotle Value Equity Fund
SCHEDULE OF INVESTMENTS - Continued
As of December 31, 2021
| Number of Shares | Value | |||||||
| COMMON STOCKS (Continued) | ||||||||
| INDUSTRIALS — 13.0% | ||||||||
| 79,700 | General Dynamics Corp. | $ | 16,615,059 | |||||
| 101,800 | Honeywell International, Inc. | 21,226,318 | ||||||
| 326,700 | Johnson Controls International PLC1 | 26,563,977 | ||||||
| 103,777 | Oshkosh Corp. | 11,696,706 | ||||||
| 77,300 | Parker-Hannifin Corp. | 24,590,676 | ||||||
| 188,100 | Xylem, Inc. | 22,556,952 | ||||||
| 123,249,688 | ||||||||
| MATERIALS — 7.5% | ||||||||
| 530,700 | Corteva, Inc. | 25,091,496 | ||||||
| 59,700 | Martin Marietta Materials, Inc. | 26,299,044 | ||||||
| 192,400 | RPM International, Inc. | 19,432,400 | ||||||
| 70,822,940 | ||||||||
| REAL ESTATE — 5.0% | ||||||||
| 120,900 | Crown Castle International Corp. - REIT | 25,236,666 | ||||||
| 126,100 | Equity LifeStyle Properties, Inc. - REIT | 11,053,926 | ||||||
| 53,100 | Sun Communities, Inc. - REIT | 11,149,407 | ||||||
| 47,439,999 | ||||||||
| TECHNOLOGY — 22.4% | ||||||||
| 60,000 | Adobe, Inc.* | 34,023,600 | ||||||
| 77,700 | ANSYS, Inc.* | 31,167,024 | ||||||
| 312,000 | Microchip Technology, Inc. | 27,162,720 | ||||||
| 128,300 | Microsoft Corp. | 43,149,856 | ||||||
| 86,800 | PayPal Holdings, Inc.* | 16,368,744 | ||||||
| 160,600 | QUALCOMM, Inc. | 29,368,922 | ||||||
| 244,200 | Sony Group Corp. - ADR1 | 30,866,880 | ||||||
| 212,107,746 | ||||||||
| Total Common Stocks | ||||||||
| (Cost $734,873,694) | 919,048,565 | |||||||
| 56 |
Aristotle Value Equity Fund
SCHEDULE OF INVESTMENTS - Continued
As of December 31, 2021
| Principal Amount | Value | |||||||
| SHORT-TERM INVESTMENTS — 2.9% | ||||||||
| $ | 27,133,734 | UMB Bank demand deposit, 0.01%2 | $ | 27,133,734 | ||||
| Total Short-Term Investments | ||||||||
| (Cost $27,133,734) | 27,133,734 | |||||||
| TOTAL INVESTMENTS — 99.9% | ||||||||
| (Cost $762,007,428) | 946,182,299 | |||||||
| Other Assets in Excess of Liabilities — 0.1% | 1,008,297 | |||||||
| TOTAL NET ASSETS — 100.0% | $ | 947,190,596 | ||||||
ADR – American Depository Receipt
PLC – Public Limited Company
REIT – Real Estate Investment Trusts
| * | Non-income producing security. |
| 1 | Foreign security denominated in U.S. dollars. |
| 2 | The rate is the annualized seven-day yield at period end. |
See Accompanying Notes to Financial Statements.
| 57 |
Aristotle Value Equity Fund
SUMMARY OF INVESTMENTS
As of December 31, 2021
| Security Type/Sector | Percent of Total Net Assets | |||
| Common Stocks | ||||
| Technology | 22.4 | % | ||
| Financials | 15.8 | % | ||
| Industrials | 13.0 | % | ||
| Health Care | 12.1 | % | ||
| Consumer Staples | 8.9 | % | ||
| Consumer Discretionary | 7.8 | % | ||
| Materials | 7.5 | % | ||
| Real Estate | 5.0 | % | ||
| Energy | 2.9 | % | ||
| Communications | 1.6 | % | ||
| Total Common Stocks | 97.0 | % | ||
| Short-Term Investments | 2.9 | % | ||
| Total Investments | 99.9 | % | ||
| Other Assets in Excess of Liabilities | 0.1 | % | ||
| Total Net Assets | 100.0 | % | ||
See Accompanying Notes to Financial Statements.
| 58 |

Dear Fellow Shareholders,
Markets Review
The small cap segment of the equity market, as measured by the Russell 2000 Index, appreciated 2.14% in the fourth quarter, capping a strong 2021 in which the asset class returned 14.82% for the full calendar year. Despite posting positive returns during the quarter, the period was not without volatility, as the emergence of the highly infectious Omicron variant captured headlines and led to a 13% intra-quarter decline in the Russell 2000 Index. Small caps quickly recovered into year-end however, as global data indicated the new variant may have a lower probability of hospitalization as compared to prior variants.
On the policy front, the U.S. Federal Reserve (Fed) took center stage, as the rapidly tightening labor market and persistent inflationary pressures pushed the Fed to adopt a more hawkish stance. The shift in Fed posturing appears to have been triggered by recent inflation and labor market data. In November, U.S. headline inflation posted a 39-year high, clocking in at 6.8% on a year-over-year basis, while the unemployment rate ticked down to just 4.2%. At the time of this writing, markets are currently pricing in three rate hikes in 2022; however, the situation remains fluid as a host of uncertainties could potentially alter the pace and direction of hikes throughout the year.
For the full year, the Russell 2000 Value turned in strong relative performance versus the Russell 2000 Growth, generating a total return of 28.27% compared to 2.83% and marking the first time in the last five calendar years where value has led the market. Fundamentally, companies with lower valuations, stronger profitability and higher return on equity generally outperformed, signaling a recent shift in sentiment towards more reasonably valued, higher quality companies within the small cap space.
At the sector level, ten of the eleven sectors within the Russell 2000 Index generated positive returns during the year, led by Energy (+67.62%), Real Estate (+28.50%) and Financials (+28.15%). Health Care (-16.97%) ended the year as the only sector to generate a negative return, while Utilities (+10.68%) and Communication Services lagged the benchmark despite generating a positive return for the year.
Performance data quoted here represents past performance. Past performance is no guarantee of future results. Investment return and principal value will fluctuate so that an investor’s shares, when redeemed, may be worth more or less than their original cost. Current performance may be lower or higher than the performance information quoted. To obtain performance information current to the most recent month-end, please call (844) 274-7868.

FOR MORE INFORMATION, PLEASE CONTACT:
Phone: (844) 274-7868 | Email: funds@aristotlecap.com | Web: www.aristotlefunds.com
| 59 |
Performance Review
For the calendar year, the Aristotle Small Cap Equity Fund (ARSBX) generated a total return of 18.87% at NAV, outperforming the 14.82% total return of the Russell 2000 Index and underperforming the 28.27% total return of the Russell 2000 Value Index.
Relative to the Russell 2000 Index, both security selection and sector allocation contributed positively to relative performance. Security selection within Health Care, Financials and Real Estate added the most value on a relative basis, while selection within Industrials, Consumer Staples and Information Technology detracted. From an allocation perspective, the Fund benefited from an underweight in Health Care and an overweight in Industrials; however, this was partially offset by underweights in Consumer Discretionary and Energy.
| 2021 Top Contributors to Fund Return | 2021 Top Detractors from Fund Return | |
| Customers Bancorp | Mercury Systems | |
| Cross Country Healthcare | Itron | |
| CAI International | Quidel | |
| Charles River Laboratories | Team | |
| Rogers | Haemonetics |
Customers Bancorp (CUBI), a Pennsylvania-based regional bank, benefited from strong fundamental performance driven by its role as a lender for the Paycheck Protection Program established as part of the CARES Act in response to the COVID pandemic. We believe investor sentiment has also been boosted in recent periods by the company’s blockchain payments deposit initiative.
Cross Country Healthcare (CCRN), a Florida-based provider of travel nurse staffing services to the healthcare industry appreciated on continued strong demand for their services combined with the benefits of company-specific self-help initiatives that are yielding tangible financial benefits for shareholders. The strong fundamental backdrop is partially attributable to increased pandemic-induced demand but is also due to a general structural shortage of nurses nationwide.
Mercury Systems (MRCY), a provider of secure sensor and safety-critical processing subsystems for the aerospace and defense markets, declined due to uncertainty surrounding the Department of Defense budget outlook under the new administration. We maintain a position, as we believe the company’s attractive secular growth outlook and history of consistent execution of the business model position it well to create potential value for shareholders over the next several years.
| 60 |
Itron (ITRI), a global manufacturer and distributor of electric, water and gas meters and advanced meter systems, declined due to supply chain constraints resulting in delays of product deliveries. We maintain a position, as we view these challenges as temporary and believe the company remains well-positioned to benefit from power grid modernization, which should continue to drive demand for the company’s smart metering and grid monitoring solutions.
Investment Activity
During the year, we made the following purchases and sales in the Fund.
| 2021 Fund Purchases/Acquisitions | 2021 Fund Sales/Liquidations | |||
| Flushing Financial | 1Q2021 | RPC | 1Q2021 | |
| eHealth | 1Q2021 | TCF Financial | 2Q2021 | |
| Box | 1Q2021 | MTS Systems | 2Q2021 | |
| Viad | 2Q2021 | John Wiley & Sons | 2Q2021 | |
| PetIQ | 2Q2021 | HMS Holdings | 2Q2021 | |
| KB Home | 2Q2021 | Gartner | 2Q2021 | |
| Huntington Bancshares | 2Q2021 | QTS Realty Trust | 3Q2021 | |
| International Seaways | 3Q2021 | Diamond S Shipping | 3Q2021 | |
| J&J Snack Foods | 3Q2021 | Team | 4Q2021 | |
| United Community Bank | 4Q2021 | CAI International | 4Q2021 | |
Purchases
United Community Banks (UCBI), is a bank holding company that provides business and consumer banking services in the southeast region of the U.S. In addition to shares being attractively valued, we believe the company’s exposure to markets growing faster than the national average, strong credit performance of their loan portfolio and balance sheet capacity to grow their loan portfolio should create value for shareholders going forward.
J & J Snack Foods (JJSF), a manufacturer, marketer and distributor of branded niche snack foods and frozen beverages, was added to the Fund. We believe the company’s diverse product mix, strong financial position and company-specific operating efficiency initiatives have the potential to create value for shareholders over the next several years. Furthermore, we believe the company will benefit from a cyclical recovery of key away-from-home venues, including restaurants, amusement parks and sports arenas.
| 61 |
International Seaways (INSW), an owner and operator of tanker ships providing energy transportation services for crude oil and petroleum products worldwide, was added to the Fund by virtue of its merger with existing Fund holding Diamond S Shipping. We decided to maintain a position in the newly merged company due to its attractive asset base, improving market fundamentals, opportunities for cost savings and what we believe to be an attractive valuation.
Huntington Bancshares (HBAN), a bank holding company based in Columbus, Ohio, was added to the Fund by virtue of its merger with existing Fund holding TCF Financial.
KB Home (KBH), one of the largest homebuilders in the U.S., was added to the Fund. We believe the company’s unique build-to-order model, which provides strong pricing power and margin potential, combined with the stock’s attractive valuation offer a compelling risk-reward opportunity over the next several years.
PetIQ (PETQ), a holding company which engages in the manufacturing, procurement, packaging and distribution of pet health and wellness, was added to the Fund. We believe the company is well-positioned to benefit from secular demand tailwinds for pet health products. Additionally, management’s focus on increased penetration for its wellness clinics has the potential to drive further upside and create value for shareholders.
Viad (VVI), a provider of high-quality, experience-based services for the hospitality and live events industries, was added to the Fund. We believe the company’s growing service offerings, expanded marketing platform, and cyclical recovery of its end markets provide ample opportunities for shareholder value creation over the next several years.
Box, Inc. (BOX), a technology company focused on cloud content management and file-sharing services for businesses, was added to the Fund. We believe Box’s leading cloud content management platform provides significant opportunity for the business to take share as more companies shift content management to the cloud and away from on-premises vendors.
eHealth, Inc. (EHTH), an online broker of Medicare, individual/family, small business and ancillary insurance products, was added to the Fund. We believe the company is well-positioned to benefit from expanding Medicare enrollment trends and its leading position as an omnichannel broker should allow the company to increase its market share as online enrollment and services continue to expand.
Flushing Financial Corporation (FFIC), a New York-based bank holding company that provides products and services to consumers, businesses and governmental units, was added to the Fund. We believe the company’s shares are attractively valued and that a recent acquisition, which provides scale benefits and extends the company’s geographical footprint and customer base, along with improving fundamentals should create value for shareholders going forward.
| 62 |
Sales
CAI International (CAI), a freight container leasing and management company, was removed from the Fund after being acquired by Mitsubishi HC Capital.
Team (TISI), a provider of specialty industrial services for the refining, petrochemical, power and pipeline industries, was removed from the Fund as a result of ongoing disappointing fundamental performance, along with a surprising negative legal development that called into question the ongoing viability of the business.
Diamond S Shipping (DSSI), an energy shipping company that owns and operates crude and product tankers, was removed from the Fund after merging with International Seaways.
QTS Realty Trust (QTS), a real estate investment trust that owns and operates data centers, was removed from the Fund after being acquired by Blackstone, Inc.
Gartner (IT), a leading provider of research and advisory services for the information technology industry, was sold from the Fund due to market capitalization considerations.
HMS Holdings (HMSY), a healthcare technology company that provides cost-containment services to government and private healthcare payers and sponsors, was removed from the Fund after being acquired by a private equity firm.
John Wiley & Sons (JW.A), a multinational publishing company focused on academic publishing and instructional materials, was removed from the Fund as the company’s valuation had approached a level where we felt the risk-reward opportunity no longer justified maintaining the position.
MTS Systems (MTSC), a global supplier of test systems and industrial position sensors, was removed from the Fund after being acquired by Amphenol Corporation.
TCF Financial (TCF), a Michigan-based bank holding company, was removed from the Fund after being acquired by Huntington Bancshares.
RPC, Inc. (RES), an oilfield services company primarily focused on the completion phase of well development in the United States, was removed from the Fund due to concerns that the company’s earnings power could be hampered by increasing competitive pressure in the industry.
This information is for illustrative purposes only and is not a recommendation to buy or sell a particular security. There is no guarantee that the securities discussed will prove to be profitable. Please refer to disclosures at the end of this document.
| 63 |
Outlook
Global equity markets, including U.S. small caps, posted healthy returns in 2021, although the year was not without its challenges. Inflationary pressures continue to linger, central banks are becoming more aggressive, supply chain issues remain and pandemic-related uncertainties persist. While each of these factors, along with a plethora of others, may contribute to uncertainty and affect investors’ risk appetites over the near term, we believe equity markets will continue to be driven by business fundamentals over the long term.
From a fundamental standpoint, we believe the economic backdrop in the U.S. remains supportive of small cap equities over the next multi-year horizon. While we are, by no means, market prognosticators, the company-specific insights that we have obtained through our bottom-up research lead us to believe that there is the opportunity for further appreciation, especially for companies with what we consider solid fundamentals and compelling valuations. Additionally, as the Fed continues its path towards interest rate normalization, and as company fundamentals and valuations become increasingly more important, we believe this development should be beneficial for fundamentally-oriented, active managers like ourselves.
Our current positioning is a function of our bottom-up security selection process and our ability to identify what we view as attractive investment candidates, regardless of economic sector definitions. Overweights in Industrials and Information Technology are broad-based with recent purchases across a variety of industries and end markets. Conversely, we continue to be underweight in Consumer Discretionary, as we have been unable to identify what we consider to be compelling opportunities that fit our discipline given the rising risk profiles as a result of structural headwinds for various brick and mortar businesses. We also continue to be underweight in Health Care due to our lack of exposure to early-stage biotechnology companies, which generally do not fit our discipline due to their elevated levels of binary risk. Given our focus on long-term business fundamentals, patient investment approach and low portfolio turnover, the Fund’s sector positioning generally does not change significantly from quarter to quarter; however, we may take advantage of periods of volatility by adding selectively to certain companies when appropriate. As always, our focus remains on identifying what we view as attractive, long-term investment opportunities that can create value for shareholders over the next three to five years, which we believe gives us the best opportunity to generate alpha for our clients.
 |  |
Dave Adams, CFA CEO, Portfolio Manager Aristotle Capital Boston, LLC | Jack McPherson, CFA President, Portfolio Manager Aristotle Capital Boston, LLC |
| 64 |
Aristotle Small Cap Equity Fund (Class I)
| Performance Update | December 31, 2021 | |||||
| Total Return | 4Q21 | 1 Year | 3 Years | 5 Years | Annualized Since Inception (10/30/15) | Gross/Net Expense Ratio |
| ARSBX Class I | 5.04% | 18.87% | 16.79% | 10.49% | 10.79% | 1.13%/0.90% |
| Russell 2000 Index | 2.14% | 14.82% | 20.00% | 12.02% | 12.76% | N/A |
| Russell 2000 Value Index | 4.36% | 28.27% | 17.97% | 9.06% | 11.71% | N/A |
Performance results for periods greater than one year have been annualized.
Performance data quoted here represents past performance. Past performance is no guarantee of future results. Returns over one year are annualized. Investment return and principal value will fluctuate so that an investor’s shares, when redeemed, may be worth more or less than their original cost. Current performance may be lower or higher than the performance information quoted. To obtain current performance information to the most recent month-end, please call (844) 274-7868.
The Fund’s advisor has contractually agreed to waive certain fees and/or absorb expenses, through April 30, 2022, to the extent that the total annual operating expenses do not exceed 0.90% of average daily net assets of the Fund. The Fund’s advisor may seek reimbursement from the Fund for waived fees and/or expenses paid for three years from the date of the waiver or payment. Without these reductions, the Fund’s performance would have been lower. A redemption fee of 1.00% will be imposed on redemptions of shares within 30 days of purchase.
Important Information:
There can be no guarantee that any strategy (risk management or otherwise) will be successful. All investing involves risk, including potential loss of principal.
The views in this letter were as of December 31, 2021 and may not necessarily reflect the same views on the date this letter is first published or any time thereafter. These views are intended to help shareholders in understanding the Fund’s investment methodology and do not constitute investment advice.
Past performance is not indicative of future results. You should not assume that any of the securities transactions, sectors or holdings discussed in this report are or will be profitable, or that recommendations Aristotle Boston makes in the future will be profitable or equal the performance of the securities listed in this report. There is no assurance that any securities, sectors or industries discussed herein will be included in or excluded from the Fund. The opinions expressed are as of the date of publication and are subject to change due to changes in the market or economic conditions and may not necessarily come to pass. Aristotle Boston reserves the right to modify its current investment strategies and techniques based on changing market dynamics or client needs. This is not a recommendation to buy or sell a particular security. Holdings are available within the last 12 months.
An investment in the Fund is subject to risks, and you could lose money on your investment in the Fund. The principal risks of investing in the Fund include, but are not limited to, investing in small-cap companies and ETFs.
| 65 |
The securities of small-capitalization companies may be subject to more abrupt or erratic market movements and may have lower trading volumes or more erratic trading than securities of larger, more established companies or market averages in general. In addition, such companies typically are more likely to be adversely affected than large capitalization companies by changes in earning results, business prospects, investor expectations or poor economic or market conditions. The use of ETFs may cause the Fund to have higher expenses than those of other equity funds.
Definitions:
| · | The Russell 2000® Index measures the performance of the small cap segment of the U.S. equity universe. The Russell 2000 Index is a subset of the Russell 3000® Index representing approximately 10% of the total market capitalization of that index. It includes approximately 2000 of the smallest securities based on a combination of their market cap and current index membership. |
| · | The Russell 2000® Value Index measures the performance of those Russell 2000 companies with lower price/book ratios and lower predicted and historical growth rates. |
| · | The Russell 2000® Growth Index measures the performance of those Russell 2000 companies with higher price/book ratios and higher predicted and historical growth rates. |
The volatility (beta) of the Fund may be greater or less than its respective benchmarks. It is not possible to invest directly in these indices.
Portfolio composition will change due to ongoing management of the Fund. References to specific securities or sectors should not be construed as recommendations by the Fund, its Advisor or Distributor.
As of December 31, 2021, the ten largest holdings in the Fund and their weights as a percent of total net assets were: Rogers, 2.12%; ASGN, 2.10%; Merit Medical Systems, 1.85%; ModivCare, 1.85%; Dycom Industries, 1.85%; Acadia Healthcare, 1.84%; MACOM Technology Solutions, 1.84%; Customers Bancorp, 1.72%; STAG Industrial, 1.67%; and Cross Country Healthcare, 1.64%.
| 66 |
Aristotle Small Cap Equity Fund
FUND PERFORMANCE at December 31, 2021 (Unaudited)

This graph compares a hypothetical $10,000 investment in the Fund’s Class I shares, made at its inception, with a similar investment in the Russell 2000 Index. Results include the reinvestment of all dividends and capital gains.
The Russell 2000 Index is a subset of the Russell 3000® Index representing approximately 10% of the total market capitalization of that index. It includes approximately 2000 of the smallest securities based on a combination of their market cap and current index membership. The index does not reflect expenses, fees, or sales charge, which would lower performance. This index is unmanaged and it is not available for investment.
| Average Annual Total Returns as of December 31, 2021 | 1 Year | 5 Years | Since Inception | Inception Date |
| Aristotle Small Cap Equity Fund – Class I | 18.87% | 10.49% | 10.79% | 10/30/15 |
| Russell 2000 Index | 14.82% | 12.02% | 12.76% | 10/30/15 |
The performance data quoted here represents past performance and past performance is not a guarantee of future results. Investment return and principal value will fluctuate so that an investor's shares, when redeemed, may be worth more or less than their original cost. Current performance may be lower or higher than the performance information quoted. The most recent month end performance may be obtained by calling (888) 661-6691.
Gross and net expense ratios for the Fund’s Class I shares were 1.13% and 0.90%, respectively, which were the amounts stated in the current prospectus dated May 1, 2021. For the Fund’s current one year expense ratios, please refer to the Financial Highlights section of this report. The Fund’s Advisor has contractually agreed to waive its fees and/or pay for operating expenses of the Fund to ensure that total annual fund operating expenses do not exceed 0.90% of the Fund’s average daily net assets. This agreement is in effect until April 30, 2022, and it may be terminated before that date only by the Trust’s Board of Trustees. In the absence of such waivers, the Fund’s returns would be lower.
Returns reflect the reinvestment of distributions made by the Fund, if any. The graph and performance table above do not reflect the deduction of taxes that a shareholder would pay on Fund distributions or the redemption of the Fund shares. Shares redeemed within 30 days of purchase will be charged a 1.00% redemption fee.
| 67 |
Aristotle Small Cap Equity Fund
SCHEDULE OF INVESTMENTS
As of December 31, 2021
| Number of Shares | Value | |||||||
| COMMON STOCKS — 94.2% | ||||||||
| COMMUNICATIONS — 1.2% | ||||||||
| 27,212 | ATN International, Inc. | $ | 1,087,119 | |||||
| 30,238 | World Wrestling Entertainment, Inc. - Class A | 1,491,943 | ||||||
| 2,579,062 | ||||||||
| CONSUMER DISCRETIONARY — 5.1% | ||||||||
| 79,489 | 1-800-Flowers.com, Inc. - Class A* | 1,857,658 | ||||||
| 31,637 | Carter's, Inc. | 3,202,297 | ||||||
| 97,690 | Designer Brands, Inc.* | 1,388,175 | ||||||
| 25,781 | KB Home | 1,153,184 | ||||||
| 44,990 | Liquidity Services, Inc.* | 993,379 | ||||||
| 40,810 | Monro, Inc. | 2,377,999 | ||||||
| 10,972,692 | ||||||||
| CONSUMER STAPLES — 3.7% | ||||||||
| 33,979 | Cal-Maine Foods, Inc. | 1,256,883 | ||||||
| 21,210 | Chefs' Warehouse, Inc.* | 706,293 | ||||||
| 47,561 | Herbalife Nutrition Ltd.*,1 | 1,946,672 | ||||||
| 2,683 | J & J Snack Foods Corp. | 423,807 | ||||||
| 42,079 | Nu Skin Enterprises, Inc. - Class A | 2,135,509 | ||||||
| 40,045 | TreeHouse Foods, Inc.* | 1,623,024 | ||||||
| 8,092,188 | ||||||||
| ENERGY — 0.9% | ||||||||
| 236,142 | NexTier Oilfield Solutions, Inc.* | 838,304 | ||||||
| 59,955 | Oceaneering International, Inc.* | 678,091 | ||||||
| 218,565 | Ring Energy, Inc.* | 498,328 | ||||||
| 2,014,723 | ||||||||
| FINANCIALS — 14.6% | ||||||||
| 23,747 | BankUnited, Inc. | 1,004,735 | ||||||
| 18,201 | Banner Corp. | 1,104,255 | ||||||
| 57,515 | Berkshire Hills Bancorp, Inc. | 1,635,151 | ||||||
| 50,716 | BRP Group, Inc. - Class A* | 1,831,355 | ||||||
| 96,910 | Byline Bancorp, Inc. | 2,650,488 | ||||||
| 54,850 | Customers Bancorp, Inc.* | 3,585,544 | ||||||
| 21,714 | eHealth, Inc.* | 553,707 | ||||||
| 10,768 | Evercore, Inc. - Class A | 1,462,833 | ||||||
| 56,263 | Flushing Financial Corp. | 1,367,191 | ||||||
| 99,254 | Huntington Bancshares, Inc. | 1,530,497 | ||||||
| 73,992 | National Bank Holdings Corp. - Class A | 3,251,208 | ||||||
| 47,853 | Pacific Premier Bancorp, Inc. | 1,915,556 | ||||||
| 30,447 | PacWest Bancorp | 1,375,291 | ||||||
| 68 |
Aristotle Small Cap Equity Fund
SCHEDULE OF INVESTMENTS - Continued
As of December 31, 2021
| Number of Shares | Value | |||||||
| COMMON STOCKS (Continued) | ||||||||
| FINANCIALS (Continued) | ||||||||
| 3,985 | Signature Bank | $ | 1,289,028 | |||||
| 27,667 | Texas Capital Bancshares, Inc.* | 1,666,937 | ||||||
| 32,157 | United Community Banks, Inc. | 1,155,723 | ||||||
| 64,167 | Veritex Holdings, Inc. | 2,552,563 | ||||||
| 22,544 | Voya Financial, Inc. | 1,494,893 | ||||||
| 31,426,955 | ||||||||
| HEALTH CARE — 15.8% | ||||||||
| 63,534 | Acadia Healthcare Co., Inc.* | 3,856,514 | ||||||
| 28,333 | Avid Bioservices, Inc.* | 826,757 | ||||||
| 8,182 | Charles River Laboratories International, Inc.* | 3,082,814 | ||||||
| 5,335 | Chemed Corp. | 2,822,428 | ||||||
| 100,328 | Coherus Biosciences, Inc.* | 1,601,235 | ||||||
| 123,715 | Cross Country Healthcare, Inc.* | 3,434,328 | ||||||
| 15,615 | Haemonetics Corp.* | 828,220 | ||||||
| 28,920 | HealthEquity, Inc.* | 1,279,421 | ||||||
| 39,493 | MEDNAX, Inc.* | 1,074,604 | ||||||
| 62,199 | Merit Medical Systems, Inc.* | 3,874,998 | ||||||
| 26,041 | ModivCare, Inc.* | 3,861,620 | ||||||
| 42,469 | PetIQ, Inc. - Class A* | 964,471 | ||||||
| 39,704 | Prestige Consumer Healthcare, Inc.* | 2,408,048 | ||||||
| 17,389 | Quidel Corp.* | 2,347,341 | ||||||
| 60,394 | Supernus Pharmaceuticals, Inc.* | 1,761,089 | ||||||
| 34,023,888 | ||||||||
| INDUSTRIALS — 28.8% | ||||||||
| 32,336 | Advanced Energy Industries, Inc. | 2,944,516 | ||||||
| 49,463 | AerCap Holdings NV*,1 | 3,235,870 | ||||||
| 32,612 | Albany International Corp. - Class A | 2,884,531 | ||||||
| 43,705 | Altra Industrial Motion Corp. | 2,253,867 | ||||||
| 261,143 | Ardmore Shipping Corp.*,1 | 882,663 | ||||||
| 35,573 | ASGN, Inc.* | 4,389,708 | ||||||
| 19,014 | AZZ, Inc. | 1,051,284 | ||||||
| 52,863 | Barnes Group, Inc. | 2,462,887 | ||||||
| 33,702 | Belden, Inc. | 2,215,233 | ||||||
| 32,653 | Capital Product Partners LP1 | 526,040 | ||||||
| 29,636 | Casella Waste Systems, Inc. - Class A* | 2,531,507 | ||||||
| 43,852 | Columbus McKinnon Corp. | 2,028,594 | ||||||
| 41,151 | Dycom Industries, Inc.* | 3,858,318 | ||||||
| 6,376 | FTI Consulting, Inc.* | 978,206 | ||||||
| 122,854 | Harsco Corp.* | 2,052,890 | ||||||
| 50,277 | Huron Consulting Group, Inc.* | 2,508,822 | ||||||
| 69 |
Aristotle Small Cap Equity Fund
SCHEDULE OF INVESTMENTS - Continued
As of December 31, 2021
| Number of Shares | Value | |||||||
| COMMON STOCKS (Continued) | ||||||||
| INDUSTRIALS (Continued) | ||||||||
| 25,678 | International Seaways, Inc.1 | $ | 376,953 | |||||
| 46,520 | Itron, Inc.* | 3,187,550 | ||||||
| 56,815 | KBR, Inc. | 2,705,530 | ||||||
| 54,636 | Matthews International Corp. - Class A | 2,003,502 | ||||||
| 40,045 | Mercury Systems, Inc.* | 2,204,878 | ||||||
| 14,363 | Novanta, Inc.*,1 | 2,532,628 | ||||||
| 68,347 | SP Plus Corp.* | 1,928,752 | ||||||
| 50,602 | Titan Machinery, Inc.* | 1,704,781 | ||||||
| 246,652 | U.S. Xpress Enterprises, Inc. - Class A* | 1,447,847 | ||||||
| 30,921 | Viad Corp.* | 1,323,110 | ||||||
| 80,547 | Wabash National Corp. | 1,572,278 | ||||||
| 23,065 | Westinghouse Air Brake Technologies Corp. | 2,124,517 | ||||||
| 55,547 | WillScot Mobile Mini Holdings Corp.* | 2,268,540 | ||||||
| 62,185,802 | ||||||||
| MATERIALS — 2.1% | ||||||||
| 93,327 | Alamos Gold, Inc. - Class A1 | 717,684 | ||||||
| 45,109 | Kraton Corp.* | 2,089,449 | ||||||
| 41,281 | Silgan Holdings, Inc. | 1,768,478 | ||||||
| 4,575,611 | ||||||||
| REAL ESTATE — 4.7% | ||||||||
| 97,170 | Armada Hoffler Properties, Inc. - REIT | 1,478,927 | ||||||
| 48,211 | Community Healthcare Trust, Inc. - REIT | 2,278,934 | ||||||
| 68,654 | iStar, Inc. - REIT | 1,773,333 | ||||||
| 38,647 | Omega Healthcare Investors, Inc. - REIT | 1,143,565 | ||||||
| 72,902 | STAG Industrial, Inc. - REIT | 3,496,380 | ||||||
| 10,171,139 | ||||||||
| TECHNOLOGY — 15.0% | ||||||||
| 80,124 | ACI Worldwide, Inc.* | 2,780,303 | ||||||
| 16,981 | Aspen Technology, Inc.* | 2,584,508 | ||||||
| 51,791 | Benchmark Electronics, Inc. | 1,403,536 | ||||||
| 59,629 | Bottomline Technologies DE, Inc.* | 3,367,250 | ||||||
| 73,456 | Box, Inc. - Class A* | 1,923,813 | ||||||
| 138,062 | CalAmp Corp.* | 974,718 | ||||||
| 17,175 | Euronet Worldwide, Inc.* | 2,046,745 | ||||||
| 87,931 | Infinera Corp.* | 843,258 | ||||||
| 19,746 | Insight Enterprises, Inc.* | 2,104,923 | ||||||
| 125,245 | Knowles Corp.* | 2,924,471 | ||||||
| 49,041 | MACOM Technology Solutions Holdings, Inc.* | 3,839,910 | ||||||
| 16,200 | Rogers Corp.* | 4,422,600 | ||||||
| 70 |
Aristotle Small Cap Equity Fund
SCHEDULE OF INVESTMENTS - Continued
As of December 31, 2021
| Number of Shares | Value | |||||||
| COMMON STOCKS (Continued) | ||||||||
| TECHNOLOGY (Continued) | ||||||||
| 78,302 | Sonos, Inc.* | $ | 2,333,399 | |||||
| 42,892 | Xperi Holding Corp. | 811,088 | ||||||
| 32,360,522 | ||||||||
| UTILITIES — 2.3% | ||||||||
| 40,908 | ALLETE, Inc. | 2,714,246 | ||||||
| 49,415 | Unitil Corp. | 2,272,596 | ||||||
| 4,986,842 | ||||||||
| Total Common Stocks | ||||||||
| (Cost $158,616,110) | 203,389,424 | |||||||
| EXCHANGE-TRADED FUNDS — 2.7% | ||||||||
| 12,964 | iShares Russell 2000 ETF | 2,883,842 | ||||||
| 16,770 | iShares Russell 2000 Value ETF | 2,784,659 | ||||||
| Total Exchange-Traded Funds | ||||||||
| (Cost $4,154,845) | 5,668,501 | |||||||
| Principal Amount | ||||||||
| SHORT-TERM INVESTMENTS — 3.2% | ||||||||
| $ | 6,952,721 | UMB Bank demand deposit, 0.01%2 | 6,952,721 | |||||
| Total Short-Term Investments | ||||||||
| (Cost $6,952,721) | 6,952,721 | |||||||
| TOTAL INVESTMENTS — 100.1% | ||||||||
| (Cost $169,723,676) | 216,010,646 | |||||||
| Liabilities in Excess of Other Assets — (0.1)% | (134,692 | ) | ||||||
| TOTAL NET ASSETS — 100.0% | $ | 215,875,954 | ||||||
LP – Limited Partnership
REIT – Real Estate Investment Trusts
| * | Non-income producing security. |
| 1 | Foreign security denominated in U.S. dollars. |
| 2 | The rate is the annualized seven-day yield at period end. |
See Accompanying Notes to Financial Statements.
| 71 |
Aristotle Small Cap Equity Fund
SUMMARY OF INVESTMENTS
As of December 31, 2021
| Security Type/Sector | Percent of Total Net Assets | |||
| Common Stocks | ||||
| Industrials | 28.8 | % | ||
| Health Care | 15.8 | % | ||
| Technology | 15.0 | % | ||
| Financials | 14.6 | % | ||
| Consumer Discretionary | 5.1 | % | ||
| Real Estate | 4.7 | % | ||
| Consumer Staples | 3.7 | % | ||
| Utilities | 2.3 | % | ||
| Materials | 2.1 | % | ||
| Communications | 1.2 | % | ||
| Energy | 0.9 | % | ||
| Total Common Stocks | 94.2 | % | ||
| Exchange-Traded Funds | 2.7 | % | ||
| Short-Term Investments | 3.2 | % | ||
| Total Investments | 100.1 | % | ||
| Liabilities in Excess of Other Assets | (0.1 | )% | ||
| Total Net Assets | 100.0 | % | ||
See Accompanying Notes to Financial Statements.
| 72 |

Dear Fellow Shareholders,
Markets Review
The U.S. equity market finished the year strong, recording its seventh consecutive quarter of positive performance. Overall, the S&P 500 Index gained 11.03% during the fourth quarter, which brings its full-year return to 28.71%. Concurrently, the Bloomberg U.S. Aggregate Bond Index finished flat for the quarter, which gives the Index a calendar-year return of -1.54%. In terms of style, the Russell 1000 Value Index underperformed its growth counterpart by 3.87% during the quarter, resulting in its full-year underperformance of 2.44%.
On a sector basis, all eleven sectors within the S&P 500 Index finished higher for the year, led by Energy, Real Estate and Financials. The worst performers were Utilities, Consumer Staples and Industrials.
Economic data points were mixed during the last quarter of the year. Although the unemployment rate fell to 4.2%, inching to levels not seen since 2019, the U.S. economy created fewer jobs than expected, as November nonfarm payrolls increased just 210,000. Nonetheless, inflation garnered the most attention as the CPI, driven by energy, food, and used car and truck prices, rose 6.8% on a year-over-year basis—the fastest rate since 1982. Correspondingly, the Federal Reserve (Fed) ceased the use of “transitory” in reference to inflation and subsequently accelerated the tapering of its asset purchase program. Furthermore, new projections based on the median forecast by Fed officials signaled the possibility of three interest rate increases in the new year.
Meanwhile, fiscal policy also made headlines as the $1 trillion bipartisan infrastructure bill was signed into law. However, momentum for the now $1.7 trillion Build Back Better social spending and climate bill stalled, largely due to disagreements over the scope and size of the bill.
In terms of corporate earnings, labor shortages and supply-chain disruptions, specifically procurement issues and input price pressures, continued to impact businesses. Nevertheless, corporate earnings were robust, with year-over-year earnings per share (EPS) growth for S&P 500 constituents reaching nearly 40%, the third-highest figure since 2010, and 82% of S&P 500 companies beating EPS estimates. Additionally, nearly two out of three S&P 500 companies reported improving profitability since the start of the pandemic, citing pricing power and strong demand.
On the COVID front, the Omicron variant became the dominant strain in the U.S., with the number of new daily cases rising to upwards of 500,000, the highest reported figure during the pandemic.
Performance data quoted here represents past performance. Past performance is no guarantee of future results. Investment return and principal value will fluctuate so that an investor’s shares, when redeemed, may be worth more or less than their original cost. Current performance may be lower or higher than the performance information quoted. To obtain performance information current to the most recent month-end, please call (844) 274-7868.

FOR MORE INFORMATION, PLEASE CONTACT:
Phone: (844) 274-7868 | Email: funds@aristotlecap.com | Web: www.aristotlefunds.com
| 73 |
In a year filled with uncertainty, the U.S. economy proved resilient. Even in the face of inflation, supply-chain disruptions, labor shortages and COVID-19 variants, many businesses reported strong earnings growth and stable, if not improving, margins. Themes from 2020, such as fiscal and monetary policy actions, vaccine (and now booster) developments, and economic recovery persisted.
Although we are happy to report another strong year, the constant twists, turns and pivots of this past year are a reminder of the fragility of the short term. Factors such as the possibility of new variants, the timing of a full recovery, fiscal and monetary policy decisions, and market sentiment are topics better left for reporters. We believe investment managers (and their clients) are best positioned to create lasting value by minimizing distractions and focusing on the long term.
Performance Review
The Aristotle Core Equity Fund posted a total return of 24.34% at NAV for the 1-year period ending December 31, 2021, underperforming the S&P 500 Index, which posted 28.71% over the same period.
Overall, security selection accounted for the majority of the Fund’s underperformance relative to the S&P 500 Index for the year, while allocation effects also detracted from relative performance. Security selection in Health Care and Energy detracted the most from relative performance. Conversely, security selection in Consumer Staples and Communication Services contributed to relative performance. Sector allocation also had a negative impact on relative performance. An underweight in Energy and an overweight in Health Care detracted from relative performance, while underweights in Consumer Staples and Communication Services added value.
| 2021 Top Contributors to Fund Relative Return | 2021 Top Detractors from Fund Relative Return | |
| Ameriprise Financial | Adaptive Biotechnologies | |
| Bio-Techne | Fidelity National Information | |
| Broadcom | Teleflex | |
| Alphabet | Guardant Health | |
| Microsoft | Comcast |
| 74 |
Ameriprise Financial was one of the top contributors in 2021. Shares outperformed as the company released financial results that consistently exceeded consensus expectations throughout the year. Results were primarily driven by the company’s two largest divisions – Advice & Wealth Management (AW&M) and Asset Management (AM). In AW&M, clients re-engaged with advisors during the post-COVID economic recovery, which drove higher transaction volumes, increased fund inflows and expanded product/service utilization. Advisor recruiting remained active, with the company increasing advisor count and average production, while indicating that it maintained a healthy recruiting pipeline headed into 2022. Results in AM were better-than-expected, driven by strong fund performance and rising equity markets that helped accelerate institutional and retail inflows. In our opinion, overall expenses at Ameriprise remained well-controlled despite continued investment in digitization and other growth initiatives, which helped drive margin growth during the year.
Bio-Techne was also one of the top contributors during the period. Shares rose in 2021 on the back of continued strength in bio/pharma spending trends and the need for advanced tools and reagents for emerging health care technologies such as cell and gene therapy. Bio-Techne has steadily increased organic revenue growth levels in the past several years, which has helped lead to multiple expansion for the stock. Bio-Techne is embarking on increasing production of specialized proteins in a new factory that is coming on-line currently, and we believe this should continue to drive momentum in their business.
Adaptive Biotechnologies was one of the top detractors for the year. Shares were weak despite the company reporting solid financial results throughout the year. The company continues to be affected by the uptick in COVID cases, as oncology patients visit their doctors less and the sales force is unable to schedule in-person visits to showcase clonoSEQ. On a positive note, the company obtained Medicare coverage for its T-Detect COVID test in immunocompromised patients. Lastly, high-valuation growth companies in health care continued to be pressured during the fourth quarter, as investors weighed the risk of inflation and rising Treasury yields.
Fidelity National Information detracted from performance in 2021 as investors were disappointed by weaker-than-expected earnings in the company’s Merchant business segment. Much of the perceived weakness was due to ongoing disruptions from COVID-19 variants and slower recoveries in the travel and restaurant industry, impacting the companies’ volumes and revenues relative to industry metrics provided by Visa and Mastercard. Weakness in the shares for 2021 also stemmed from concerns about the increased competitive environment from new Fintech entrants, many of which had initial public offerings (IPOs) throughout the year. We view Fidelity National as a legacy payment service provider and believe it will show improving volume and revenue trends in 2022 as cross-border travel metrics improve, and Small and Medium Businesses, including restaurants, recover from Covid restrictions.
| 75 |
Investment Activity
During the year, we made the following purchases and sales in the Fund.
| 2021 Fund Purchases | 2021 Fund Sales | |||
| Applied Materials | 4Q2021 | Skyworks Solutions | 3Q2021 | |
| Darling Ingredients | 3Q2021 | Roper Technologies | 1Q2021 | |
| General Motors | 1Q2021 | Alexion Pharmaceuticals | 1Q2021 | |
| Salesforce.com | 1Q2021 | |||
Purchases
Applied Materials is a global company with a broad set of capabilities in materials engineering that provides manufacturing equipment, services and software to the semiconductor, display, and related industries.
We believe that strong demand for semiconductors from end-market growth of data centers, artificial intelligence (AI) compute, 5G, electric vehicles and the Industrial Internet of Things (IIoT) will continue throughout the next two years. This demand growth will continue to support increasing capital expenditures by semiconductor (foundry/logic and memory) companies, driving increased wafer fabrication equipment (WFE). In 2021, WFE spend increased 40% to $85 billion, and we expect to see spending increase by 5% CAGR through 2023. We believe Applied Materials is well positioned to benefit from the broad-based increase in capital equipment spending, and we expect to see continued top-line growth from new orders translate into operating margin expansion from improving supply chains and attractive pricing. The company is also driving top-line growth and operating leverage through its services business, which has transitioned to a subscription model where customers pay a monthly fee to have Applied Materials monitor equipment and manufacturing processes and use AI to improve output and reduce downtime. Applied Materials currently trades at a P/E discount compared to its semi cap equipment peers, which we view as unwarranted based on its broad-based exposure to increasing semiconductor capacity expansion plans, continued share growth within the WFE sector, and further margin expansion, not only from operating leverage in the core WFE business but also continued growth in the services business, which we believe is underappreciated by investors.
Darling Ingredients is the largest publicly traded rendering operation in the U.S. The company collects and recycles animal processing by-products and used restaurant cooking oil. The company also provides grease trap collection services to restaurants. Darling processes these raw materials into finished products, such as tallow, meat and bone meal, and yellow grease for sale in the U.S. and overseas. In addition, Darling is a 50% owner of a joint venture with Valero Energy Corporation called Diamond Green Diesel (DGD), which produces renewable diesel. The joint venture is expected to generate approximately $1.6 billion in EBITDA next year.
| 76 |
We believe Darling is focused on reducing CO2. The strong demand and government tax credits for renewable diesel makes this industry attractive. We expect the Biden administration’s focus on green initiatives and the global focus on sustainability to further enhance DGD’s business. Darling’s large capital expenditures, such as its investment in DGD, should taper offering more free cash flow. The company expects to use this cash influx for mergers and acquisitions (M&A) and shareholder return. The company also is experiencing increased demand in its base businesses.
General Motors designs, builds and sells trucks, crossover vehicles, passenger cars and automobile parts worldwide and provides automotive financing products and services through General Motors Financial Company. In addition, the company is investing heavily in its growing autonomous and electric vehicle businesses. The company reports its results in four operating segments: GM North America (GMNA), GM International (GMI), Cruise and GM Financial. Cruise is the company’s global segment focused on the development and commercialization of autonomous vehicle technology.
General Motors has fully embraced vehicle electrification, as evidenced by $27 billion in planned investments in the coming years and a stated goal to introduce at least 30 electric models by 2025, including new models in 2021 from the Hummer and Cadillac brands. The company recently announced a program called BrightDrop in which General Motors will manufacture fully electric cargo vans for FedEx. In addition, the company plans to leverage its proprietary all-new Ultium modular platform and battery system to efficiently build and launch new electric vehicles.
The company has also invested heavily in autonomous vehicles through its majority-owned self-driving technology company Cruise. The company is currency testing driverless vehicles in multiple U.S. cities and recently benefited from a $2 billion investment by Microsoft. Due to General Motor’s planned shift to electric and autonomous vehicles, the company could see increased interest from ESG-focused investors.
Sales
We sold our position in Skyworks Solutions, as we think at these levels the stock already reflects the increased expectations around the upcoming release of the Apple iPhone 13. In addition, with continued capacity constraints, we believe the downside risk exceeds the upside risk.
We sold our position in Roper due to what we consider a historically high valuation and concerns about the company’s future acquisition opportunities. Acquisitions have been a significant driver of Roper’s growth over the past 10 years, but the company’s market capitalization has grown to nearly $44 billion; larger-sized deals would likely be needed to have a similar impact on future growth. In addition, large acquisitions can create additional integration risk, in our view.
We sold our position in Alexion following the announcement that AstraZeneca would acquire the company. At the time of the announcement, the offer price represented an approximate 40% premium to Alexion’s most recent closing price.
| 77 |
We sold our position in Salesforce.com and shifted the weighting into what we consider more economically sensitive holdings in Software, Industrials and Energy. We believed that Salesforce.com’s valuation could experience continued pressure, largely driven by rising interest rates.
This information is for illustrative purposes only and is not a recommendation to buy or sell a particular security. There is no guarantee that the securities discussed will prove to be profitable. Please refer to disclosures at the end of this document.
Outlook
The outlook for the U.S. large cap equity market in 2022 will likely be influenced by the tightening cycle by the Federal Reserve. We would agree with the consensus view that, in addition to tapering, we will most likely face two to three rate hikes by the Federal Reserve in 2022. Markets tend to rally at the start of Federal Reserve tightening cycles, and we would expect this to hold true in 2022. Price-to-earnings multiple compressions started this past year in anticipation of the tightening cycle. This will likely be less of an issue in 2022, as the market has already discounted multiple rate hikes. Inflation should start to peak, as many companies have commented on earnings calls that inflation and supply-chain issues have stabilized. We believe the opportunities within the equity market will be with companies that are able to price to offset inflationary pressures. As inflation abates, the companies that can maintain these price increases should have the added benefit of margin expansion. The risk for equities is a mistake by the Federal Reserve in when and how much to tighten. Also, as we have seen in the past two years, COVID variants can impact economic activity and the supply chain. With growing geopolitical issues across the globe, any one of them could result in a quick drop in equity prices if military escalation becomes an outcome. Our focus will continue to be at the company level, with an emphasis on companies with secular tailwinds or strong product-driven cycles.
 |  |  |
Owen Fitzpatrick, CFA Principal, Lead Portfolio Manager | Thomas Hynes, Jr., CFA Principal, Portfolio Manager | Brendan O’Neil, CFA Principal, Portfolio Manager |
| 78 |
Aristotle Core Equity Fund (Class I)
| Performance Update | December 31, 2021 | ||||
| Total Return | 4Q21 | 1 Year | 3 Years | Annualized Since Inception (3/31/2017) | Gross/Net Expense Ratio |
| ARSLX Class I | 9.94% | 24.34% | 28.33% | 19.00% | 0.96% / 0.65% |
| S&P 500 Index | 11.03% | 28.71% | 26.07% | 18.05% | N/A |
Performance results for periods greater than one year have been annualized.
Performance data quoted here represents past performance. Past performance is no guarantee of future results. Investment return and principal value will fluctuate so that an investor’s shares, when redeemed, may be worth more or less than their original cost. Current performance may be lower or higher than the performance information quoted. To obtain current performance information to the most recent month-end, please call (844) 274-7868.
The Fund’s Advisor has contractually agreed to waive certain fees and/or absorb expenses through April 30, 2022 to the extent that the total annual operating expenses do not exceed 0.65% of the Fund’s average daily net assets. The Fund’s Advisor may seek reimbursement from the Fund for waived fees and/or expenses paid for three years from the date of the waiver or payment. A redemption fee of 1.00% will be imposed on redemptions of shares within 30 days.
Important Information:
There can be no guarantee that any strategy (risk management or otherwise) will be successful. All investing involves risk, including potential loss of principal.
The views in this letter were as of December 31, 2021 and may not necessarily reflect the same views on the date this letter is first published or any time thereafter. These views are intended to help shareholders in understanding the Fund’s investment methodology and do not constitute investment advice.
Past performance is not indicative of future results. You should not assume that any of the securities transactions, sectors or holdings discussed in this report are or will be profitable, or that recommendations Aristotle Atlantic makes in the future will be profitable or equal the performance of the securities listed in this report. There is no assurance that any securities, sectors or industries discussed herein will be included in or excluded from the Fund. The opinions expressed are as of the date of publication and are subject to change due to changes in the market or economic conditions and may not necessarily come to pass. Aristotle Atlantic reserves the right to modify its current investment strategies and techniques based on changing market dynamics or client needs. This is not a recommendation to buy or sell a particular security. Holdings are available within the last 12 months.
An investment in the Fund is subject to risks, and you could lose money on your investment in the Fund. The principal risks of investing in the Fund include, but are not limited to, investing in market risk, equity risk, preferred stock risk, warrants and rights risk, REITs risk, small-cap, mid-cap and large-cap company risk, foreign investment risk and sector focus risk.
| 79 |
The market price of a security or instrument may decline, sometimes rapidly or unpredictably, due to general market conditions that are not specifically related to a particular company. The value of the equity securities held by the Fund may fall due to general market and economic conditions, perceptions regarding the industries in which the issuers of securities held by the Fund participate, or factors relating to specific companies in which the Fund invests. The market value of preferred stock is subject to company-specific and market risks applicable generally to equity securities and is also sensitive to changes in the company’s creditworthiness, the ability of the company to make payments on the preferred stock, and changes in interest rates, typically declining in value if interest rates rise. Warrants and rights may lack a liquid secondary market for resale. The prices of warrants and rights may fluctuate as a result of speculation or other factors. The Fund’s investment in REITs will subject the Fund to risks similar to those associated with direct ownership of real estate, including losses from casualty or condemnation, and changes in local and general economic, supply and demand, interest rates, zoning laws, regulatory limitations on rents, property taxes and operating expenses. The securities of small-capitalization and mid-capitalization companies may be subject to more abrupt or erratic market movements and may have lower trading volumes or more erratic trading than securities of larger, more established companies or market averages in general. Larger, more established companies may be unable to attain the high growth rates of successful, smaller companies during periods of economic expansion. The prices of foreign securities may be more volatile than the prices of securities of U.S. issuers because of economic and social conditions abroad, political developments, and changes in the regulatory environments of foreign countries. The Fund may invest a larger portion of its assets in one or more sectors than many other mutual funds, and thus will be more susceptible to negative events affecting those sectors.
Definitions:
| · | The S&P 500® Index is the Standard & Poor’s Composite Index of 500 stocks and is a widely recognized, unmanaged index of common stock prices. This index has been selected as the benchmark and is used for comparison purposes only. |
| · | The Russell 1000 Value® Index measures the performance of the large cap value segment of the U.S. equity universe. It includes those Russell 1000 Index companies with lower price-to-book ratios and lower expected growth values. |
| · | The Bloomberg U.S. Aggregate Index is an unmanaged index of domestic investment grade bonds, including corporate, government and mortgage-backed securities. The WTI Crude Oil Index is a major trading classification of sweet light crude oil that serves as a major benchmark price for oil consumed in the United States. |
| · | Earnings per share (EPS) is calculated as a company's profit divided by the outstanding shares of its common stock. |
| · | Consumer Price Index (CPI) is a measure of the average change over time in the prices paid by urban consumers for a market basket of consumer goods and services. |
| · | The price-to-earnings ratio (P/E ratio) is the ratio for valuing a company that measures its current share price relative to its earnings per share (EPS). |
| · | Earnings before interest, taxes, depreciation and amortization (EBITDA) is a metric that seeks to evaluate a company’s operating performance and is often used to compare companies with different investment, debt and tax profiles. |
The volatility (beta) of the Fund may be greater or less than its respective benchmarks. It is not possible to invest directly in these indices.
Portfolio composition will change due to ongoing management of the Fund. References to specific securities or sectors should not be construed as recommendations by the Fund, its Advisor or Distributor.
| 80 |
As of December 31, 2021, the 10 largest holdings in the Fund and their weights as a percent of total net assets were: Microsoft Corp., 7.90%; Apple Inc., 7.25%; Alphabet Inc., 5.77%; Amazon.com Inc., 4.39%; Ameriprise Financial, Inc., 3.01%; Broadcom Inc., 2.44%; JPMorgan Chase & Co., 3.12%; Norfolk Southern, Corp., 2.48%; Marriott International, Inc., 2.59%; Bank of America Corp., 2.58%.
| 81 |
Aristotle Core Equity Fund
FUND PERFORMANCE at December 31, 2021 (Unaudited)

This graph compares a hypothetical $10,000 investment in the Fund’s Class I shares, made at its inception, with a similar investment in the S&P 500 Index. Results include the reinvestment of all dividends and capital gains.
The S&P 500 Index is the Standard & Poor’s Composite Index of 500 stocks and is a widely recognized, unmanaged index of common stock prices. This index does not reflect expenses, fees, or sales charge, which would lower performance. This index is unmanaged and it is not available for investment.
| Average Annual Total Returns as of December 31, 2021 | 1 Year | 3 Years | Since Inception | Inception Date |
| Aristotle Core Equity Fund – Class I | 24.34% | 28.33% | 19.00% | 3/31/2017 |
| S&P 500 Index | 28.71% | 26.07% | 18.05% | 3/31/2017 |
The performance data quoted here represents past performance and past performance is not a guarantee of future results. Investment return and principal value will fluctuate so that an investor's shares, when redeemed, may be worth more or less than their original cost. Current performance may be lower or higher than the performance information quoted. The most recent month end performance may be obtained by calling (888) 661-6691.
Gross and net expense ratios for the Fund’s Class I shares were 0.96% and 0.65%, respectively, which were the amounts stated in the current prospectus dated May 1, 2021. For the Fund’s current one year expense ratios, please refer to the Financial Highlights section of this report. The Fund’s Advisor has contractually agreed to waive its fees and/or pay for operating expenses of the Fund to ensure that total annual fund operating expenses do not exceed 0.65% of the Fund’s average daily net assets. This agreement is in effect until April 30, 2022, and it may be terminated before that date only by the Trust’s Board of Trustees. In the absence of such waivers, the Fund’s returns would be lower.
Returns reflect the reinvestment of distributions made by the Fund, if any. The graph and performance table above do not reflect the deduction of taxes that a shareholder would pay on Fund distributions or the redemption of the Fund shares. Shares redeemed within 30 days of purchase will be charged a 1.00% redemption fee.
| 82 |
Aristotle Core Equity Fund
SCHEDULE OF INVESTMENTS
As of December 31, 2021
| Number of Shares | Value | |||||||
| COMMON STOCKS — 97.6% | ||||||||
| COMMUNICATIONS — 9.0% | ||||||||
| 3,472 | Alphabet, Inc. - Class A* | $ | 10,058,523 | |||||
| 67,973 | Comcast Corp. - Class A | 3,421,081 | ||||||
| 17,145 | Walt Disney Co.* | 2,655,589 | ||||||
| 16,135,193 | ||||||||
| CONSUMER DISCRETIONARY — 12.9% | ||||||||
| 2,292 | Amazon.com, Inc.* | 7,642,308 | ||||||
| 7,576 | Dollar General Corp. | 1,786,648 | ||||||
| 42,859 | General Motors Co.* | 2,512,823 | ||||||
| 10,219 | Home Depot, Inc. | 4,240,987 | ||||||
| 27,697 | Marriott International, Inc. - Class A* | 4,576,652 | ||||||
| 3,113 | O'Reilly Automotive, Inc.* | 2,198,494 | ||||||
| 22,957,912 | ||||||||
| CONSUMER STAPLES — 5.5% | ||||||||
| 6,003 | Costco Wholesale Corp. | 3,407,903 | ||||||
| 22,464 | Darling Ingredients, Inc.* | 1,556,531 | ||||||
| 6,832 | Estee Lauder Cos., Inc. - Class A | 2,529,206 | ||||||
| 13,058 | PepsiCo, Inc. | 2,268,305 | ||||||
| 9,761,945 | ||||||||
| ENERGY — 1.3% | ||||||||
| 32,494 | Phillips 66 | 2,354,515 | ||||||
| FINANCIALS — 11.7% | ||||||||
| 16,555 | Ameriprise Financial, Inc. | 4,993,981 | ||||||
| 96,184 | Bank of America Corp. | 4,279,226 | ||||||
| 16,991 | Chubb Ltd.1 | 3,284,530 | ||||||
| 25,884 | Intercontinental Exchange, Inc. | 3,540,155 | ||||||
| 30,126 | JPMorgan Chase & Co. | 4,770,452 | ||||||
| 20,868,344 | ||||||||
| HEALTH CARE — 13.6% | ||||||||
| 22,404 | Abbott Laboratories | 3,153,139 | ||||||
| 60,756 | Adaptive Biotechnologies Corp.* | 1,704,813 | ||||||
| 6,550 | Becton, Dickinson and Co. | 1,647,194 | ||||||
| 8,115 | Bio-Techne Corp. | 4,198,214 | ||||||
| 25,585 | Bristol-Myers Squibb Co. | 1,595,225 | ||||||
| 19,762 | Catalent, Inc.* | 2,530,129 | ||||||
| 12,536 | Cigna Corp. | 2,878,642 | ||||||
| 13,366 | Guardant Health, Inc.* | 1,336,867 | ||||||
| 83 |
Aristotle Core Equity Fund
SCHEDULE OF INVESTMENTS - Continued
As of December 31, 2021
| Number of Shares | Value | |||||||
| COMMON STOCKS (Continued) | ||||||||
| HEALTH CARE (Continued) | ||||||||
| 5,763 | Teleflex, Inc. | $ | 1,893,030 | |||||
| 5,028 | Thermo Fisher Scientific, Inc. | 3,354,883 | ||||||
| 24,292,136 | ||||||||
| INDUSTRIALS — 8.9% | ||||||||
| 27,484 | AMETEK, Inc. | 4,041,247 | ||||||
| 11,604 | Chart Industries, Inc.* | 1,850,722 | ||||||
| 12,365 | Honeywell International, Inc. | 2,578,226 | ||||||
| 15,905 | Norfolk Southern Corp. | 4,735,078 | ||||||
| 13,588 | Trane Technologies PLC | 2,745,184 | ||||||
| 15,950,457 | ||||||||
| MATERIALS — 2.6% | ||||||||
| 13,562 | Avery Dennison Corp. | 2,937,122 | ||||||
| 16,966 | Ball Corp. | 1,633,317 | ||||||
| 4,570,439 | ||||||||
| REAL ESTATE — 1.9% | ||||||||
| 8,055 | Alexandria Real Estate Equities, Inc. - REIT | 1,795,943 | ||||||
| 9,714 | Prologis, Inc. | 1,635,449 | ||||||
| 3,431,392 | ||||||||
| TECHNOLOGY — 28.3% | ||||||||
| 5,396 | Adobe, Inc.* | 3,059,856 | ||||||
| 71,112 | Apple, Inc. | 12,627,358 | ||||||
| 11,561 | Applied Materials, Inc. | 1,819,239 | ||||||
| 7,174 | Broadcom, Inc. | 4,773,651 | ||||||
| 21,139 | Fidelity National Information Services, Inc. | 2,307,322 | ||||||
| 43,782 | Microchip Technology, Inc. | 3,811,661 | ||||||
| 40,935 | Microsoft Corp. | 13,767,259 | ||||||
| 13,340 | NVIDIA Corp. | 3,923,427 | ||||||
| 9,500 | PayPal Holdings, Inc.* | 1,791,510 | ||||||
| 12,425 | Visa, Inc. - Class A | 2,692,622 | ||||||
| 50,573,905 | ||||||||
| UTILITIES — 1.9% | ||||||||
| 6,798 | American Water Works Co., Inc. | 1,283,871 | ||||||
| 21,959 | NextEra Energy, Inc. | 2,050,092 | ||||||
| 3,333,963 | ||||||||
| Total Common Stocks | ||||||||
| (Cost $126,383,517) | 174,230,201 | |||||||
| 84 |
Aristotle Core Equity Fund
SCHEDULE OF INVESTMENTS - Continued
As of December 31, 2021
| Principal Amount | Value | |||||||
| SHORT-TERM INVESTMENTS — 2.4% | ||||||||
| $ | 4,349,151 | UMB Bank demand deposit, 0.01%2 | $ | 4,349,151 | ||||
| Total Short-Term Investments | ||||||||
| (Cost $4,349,151) | 4,349,151 | |||||||
| TOTAL INVESTMENTS — 100.0% | ||||||||
| (Cost $130,732,668) | 178,579,352 | |||||||
| Liabilities in Excess of Other Assets — (0.0)% | (66,492 | ) | ||||||
| TOTAL NET ASSETS — 100.0% | $ | 178,512,860 | ||||||
PLC – Public Limited Company
REIT – Real Estate Investment Trusts
| * | Non-income producing security. |
| 1 | Foreign security denominated in U.S. dollars. |
| 2 | The rate is the annualized seven-day yield at period end. |
See Accompanying Notes to Financial Statements.
| 85 |
Aristotle Core Equity Fund
SUMMARY OF INVESTMENTS
As of December 31, 2021
| Security Type/Sector | Percent of Total Net Assets | |||
| Common Stocks | ||||
| Technology | 28.3 | % | ||
| Health Care | 13.6 | % | ||
| Consumer Discretionary | 12.9 | % | ||
| Financials | 11.7 | % | ||
| Communications | 9.0 | % | ||
| Industrials | 8.9 | % | ||
| Consumer Staples | 5.5 | % | ||
| Materials | 2.6 | % | ||
| Real Estate | 1.9 | % | ||
| Utilities | 1.9 | % | ||
| Energy | 1.3 | % | ||
| Total Common Stocks | 97.6 | % | ||
| Short-Term Investments | 2.4 | % | ||
| Total Investments | 100.0 | % | ||
| Liabilities in Excess of Other Assets | (0.0 | )% | ||
| Total Net Assets | 100.0 | % | ||
See Accompanying Notes to Financial Statements.
| 86 |
STATEMENTS OF ASSETS AND LIABILITIES
As of December 31, 2021
| Aristotle/Saul Global Equity Fund | Aristotle International Equity Fund | Aristotle Strategic Credit Fund | ||||||||||
| Assets: | ||||||||||||
| Investments, at cost | $ | 62,642,538 | $ | 315,559,305 | $ | 7,865,094 | ||||||
| Foreign currency, at cost | - | 1,598 | - | |||||||||
| Investments, at value | $ | 94,018,620 | $ | 389,551,520 | $ | 7,926,527 | ||||||
| Foreign currency, at value | - | 1,607 | - | |||||||||
| Cash | - | - | 67 | |||||||||
| Receivables: | ||||||||||||
| Investment securities sold | - | - | - | |||||||||
| Fund shares sold | 858 | 1,561,545 | 645,081 | |||||||||
| Dividends and interest | 139,238 | 619,125 | 92,143 | |||||||||
| Due from Advisor | - | - | 9,378 | |||||||||
| Prepaid expenses | 2,721 | 15,067 | 7,363 | |||||||||
| Total assets | 94,161,437 | 391,748,864 | 8,680,559 | |||||||||
| Liabilities: | ||||||||||||
| Payables: | ||||||||||||
| Investment securities purchased | - | - | - | |||||||||
| Fund shares redeemed | - | 16,433 | - | |||||||||
| Advisory fees | 45,835 | 164,021 | - | |||||||||
| Shareholder servicing fees (Note 7) | - | 4,366 | - | |||||||||
| Fund administration and accounting fees | 21,747 | 21,039 | 18,620 | |||||||||
| Transfer agent fees and expenses | 7,909 | 6,444 | 4,319 | |||||||||
| Custody fees | 5,164 | 17,101 | 2,825 | |||||||||
| Auditing fees | 21,000 | 20,972 | 24,000 | |||||||||
| Trustees' deferred compensation (Note 3) | 6,855 | 6,901 | 6,438 | |||||||||
| Chief Compliance Officer fees | 2,816 | 745 | 1,680 | |||||||||
| Trustees' fees and expenses | 2,419 | 556 | 1,431 | |||||||||
| Accrued other expenses | 19,056 | 13,783 | 9,108 | |||||||||
| Total liabilities | 132,801 | 272,361 | 68,421 | |||||||||
| Net Assets | $ | 94,028,636 | $ | 391,476,503 | $ | 8,612,138 | ||||||
| Components of Net Assets: | ||||||||||||
| Paid-in capital (par value of $0.01 per share with an unlimited number of shares authorized) | $ | 61,692,717 | $ | 318,533,990 | $ | 8,624,899 | ||||||
| Total distributable earnings (accumulated deficit) | 32,335,919 | 72,942,513 | (12,761 | ) | ||||||||
| Net Assets | $ | 94,028,636 | $ | 391,476,503 | $ | 8,612,138 | ||||||
| Class I: | ||||||||||||
| Shares of beneficial interest issued and outstanding | 5,689,862 | 26,882,825 | 828,404 | |||||||||
| Net asset value per share | $ | 16.53 | $ | 14.56 | $ | 10.40 | ||||||
See Accompanying Notes to Financial Statements.
| 87 |
STATEMENTS OF ASSETS AND LIABILITIES - Continued
As of December 31, 2021
| Aristotle Value Equity Fund | Aristotle Small Cap Equity Fund | Aristotle Core Equity Fund | ||||||||||
| Assets: | ||||||||||||
| Investments, at cost | $ | 762,007,428 | $ | 169,723,676 | $ | 130,732,668 | ||||||
| Foreign currency, at cost | - | - | - | |||||||||
| Investments, at value | $ | 946,182,299 | $ | 216,010,646 | $ | 178,579,352 | ||||||
| Foreign currency, at value | - | - | - | |||||||||
| Cash | - | - | - | |||||||||
| Receivables: | ||||||||||||
| Investment securities sold | 197,090 | - | - | |||||||||
| Fund shares sold | 1,263,379 | 10,588 | 21,084 | |||||||||
| Dividends and interest | 657,532 | 80,358 | 37,935 | |||||||||
| Due from Advisor | - | - | - | |||||||||
| Prepaid expenses | 27,613 | 11,138 | 5,581 | |||||||||
| Total assets | 948,327,913 | 216,112,730 | 178,643,952 | |||||||||
| Liabilities: | ||||||||||||
| Payables: | ||||||||||||
| Investment securities purchased | 339,052 | - | - | |||||||||
| Fund shares redeemed | 177,287 | - | - | |||||||||
| Advisory fees | 453,317 | 117,475 | 53,706 | |||||||||
| Shareholder servicing fees (Note 7) | - | 31,590 | 4,163 | |||||||||
| Fund administration and accounting fees | 87,294 | 33,956 | 22,253 | |||||||||
| Transfer agent fees and expenses | 12,452 | 8,592 | 5,431 | |||||||||
| Custody fees | 9,735 | 4,444 | 7,382 | |||||||||
| Auditing fees | 20,776 | 21,541 | 19,186 | |||||||||
| Trustees' deferred compensation (Note 3) | 7,339 | 6,795 | 6,590 | |||||||||
| Chief Compliance Officer fees | 400 | 876 | 998 | |||||||||
| Trustees' fees and expenses | 823 | 1,256 | 1,300 | |||||||||
| Accrued other expenses | 28,842 | 10,251 | 10,083 | |||||||||
| Total liabilities | 1,137,317 | 236,776 | 131,092 | |||||||||
| Net Assets | $ | 947,190,596 | $ | 215,875,954 | $ | 178,512,860 | ||||||
| Components of Net Assets: | ||||||||||||
| Paid-in capital (par value of $0.01 per share with an unlimited number of shares authorized) | $ | 759,641,397 | $ | 173,021,966 | $ | 130,268,515 | ||||||
| Total distributable earnings (accumulated deficit) | 187,549,199 | 42,853,988 | 48,244,345 | |||||||||
| Net Assets | $ | 947,190,596 | $ | 215,875,954 | $ | 178,512,860 | ||||||
| Class I: | ||||||||||||
| Shares of beneficial interest issued and outstanding | 46,084,915 | 13,500,440 | 8,160,780 | |||||||||
| Net asset value per share | $ | 20.55 | $ | 15.99 | $ | 21.87 | ||||||
See Accompanying Notes to Financial Statements.
| 88 |
STATEMENTS OF OPERATIONS
For the Year Ended December 31, 2021
| Aristotle/Saul Global Equity Fund | Aristotle International Equity Fund | Aristotle Strategic Credit Fund | ||||||||||
| Investment income: | ||||||||||||
| Dividends (net of foreign withholding taxes of $96,354, $452,074 and $0, respectively) | $ | 1,256,753 | $ | 5,527,608 | $ | 3,375 | ||||||
| Interest | 256 | 713 | 291,744 | |||||||||
| Total investment income | 1,257,009 | 5,528,321 | 295,119 | |||||||||
| Expenses: | ||||||||||||
| Advisory fees | 586,291 | 2,270,195 | 37,911 | |||||||||
| Shareholder servicing fees (Note 7) | - | 279,319 | - | |||||||||
| Fund administration and accounting fees | 89,155 | 218,869 | 75,214 | |||||||||
| Transfer agent fees and expenses | 21,703 | 27,033 | 16,344 | |||||||||
| Custody fees | 18,292 | 101,536 | 12,985 | |||||||||
| Auditing fees | 21,486 | 21,265 | 24,301 | |||||||||
| Registration fees | 18,052 | 35,109 | 22,155 | |||||||||
| Miscellaneous | 8,723 | 20,582 | 4,054 | |||||||||
| Trustees' fees and expenses | 8,421 | 7,992 | 5,201 | |||||||||
| Legal fees | 7,758 | 9,664 | 8,716 | |||||||||
| Chief Compliance Officer fees | 7,200 | 5,193 | 5,700 | |||||||||
| Shareholder reporting fees | 6,130 | 9,038 | 4,568 | |||||||||
| Insurance fees | 2,405 | 2,702 | 2,306 | |||||||||
| Total expenses | 795,616 | 3,008,497 | 219,455 | |||||||||
| Advisory fees waived | (125,157 | ) | (413,988 | ) | (37,911 | ) | ||||||
| Other expenses absorbed | - | - | (131,538 | ) | ||||||||
| Net expenses | 670,459 | 2,594,509 | 50,006 | |||||||||
| Net investment income (loss) | 586,550 | 2,933,812 | 245,113 | |||||||||
| Realized and Unrealized Gain (Loss): | ||||||||||||
| Net realized gain (loss) on: | ||||||||||||
| Investments | 2,691,901 | 4,822,806 | 297,949 | |||||||||
| Foreign currency transactions | (6,091 | ) | (27,017 | ) | - | |||||||
| Net realized gain | 2,685,810 | 4,795,789 | 297,949 | |||||||||
| Net change in unrealized appreciation/depreciation on: | ||||||||||||
| Investments | 10,990,507 | 38,026,478 | (332,411 | ) | ||||||||
| Foreign currency translations | (2,648 | ) | (12,651 | ) | - | |||||||
| Net change in unrealized appreciation/depreciation | 10,987,859 | 38,013,827 | (332,411 | ) | ||||||||
| Net realized and unrealized gain (loss) | 13,673,669 | 42,809,616 | (34,462 | ) | ||||||||
| Net Increase in Net Assets from Operations | $ | 14,260,219 | $ | 45,743,428 | $ | 210,651 | ||||||
See Accompanying Notes to Financial Statements.
| 89 |
STATEMENTS OF OPERATIONS - Continued
For the Year Ended December 31, 2021
| Aristotle Value Equity Fund | Aristotle Small Cap Equity Fund | Aristotle Core Equity Fund | ||||||||||
| Investment income: | ||||||||||||
| Dividends (net of foreign withholding taxes of $78,423, $1,344 and $0, respectively) | $ | 10,668,104 | $ | 1,681,972 | $ | 1,375,123 | ||||||
| Interest | 2,126 | 846 | 244 | |||||||||
| Total investment income | 10,670,230 | 1,682,818 | 1,375,367 | |||||||||
| Expenses: | ||||||||||||
| Advisory fees | 4,309,058 | 1,500,930 | 697,524 | |||||||||
| Shareholder servicing fees (Note 7) | - | 212,826 | 131,454 | |||||||||
| Fund administration and accounting fees | 479,084 | 161,540 | 112,353 | |||||||||
| Transfer agent fees and expenses | 49,643 | 24,474 | 22,561 | |||||||||
| Custody fees | 75,465 | 23,794 | 36,473 | |||||||||
| Auditing fees | 21,083 | 22,051 | 18,896 | |||||||||
| Registration fees | 70,691 | 22,093 | 42,048 | |||||||||
| Miscellaneous | 51,952 | 6,758 | 13,758 | |||||||||
| Trustees' fees and expenses | 10,257 | 7,844 | 7,997 | |||||||||
| Legal fees | 11,584 | 9,661 | 9,410 | |||||||||
| Chief Compliance Officer fees | 5,200 | 5,200 | 5,200 | |||||||||
| Shareholder reporting fees | 14,361 | 1,764 | 7,294 | |||||||||
| Insurance fees | 2,937 | 2,555 | 2,440 | |||||||||
| Total expenses | 5,101,315 | 2,001,490 | 1,107,408 | |||||||||
| Advisory fees waived | (145,899 | ) | (200,374 | ) | (200,627 | ) | ||||||
| Other expenses absorbed | - | - | - | |||||||||
| Net expenses | 4,955,416 | 1,801,116 | 906,781 | |||||||||
| Net investment income (loss) | 5,714,814 | (118,298 | ) | 468,586 | ||||||||
| Realized and Unrealized Gain (Loss): | ||||||||||||
| Net realized gain (loss) on: | ||||||||||||
| Investments | 18,198,323 | 9,495,141 | 2,438,640 | |||||||||
| Foreign currency transactions | - | - | - | |||||||||
| Net realized gain | 18,198,323 | 9,495,141 | 2,438,640 | |||||||||
| Net change in unrealized appreciation/depreciation on: | ||||||||||||
| Investments | 118,375,034 | 22,300,412 | 26,979,314 | |||||||||
| Foreign currency translations | - | - | - | |||||||||
| Net change in unrealized appreciation/depreciation | 118,375,034 | 22,300,412 | 26,979,314 | |||||||||
| Net realized and unrealized gain (loss) | 136,573,357 | 31,795,553 | 29,417,954 | |||||||||
| Net Increase in Net Assets from Operations | $ | 142,288,171 | $ | 31,677,255 | $ | 29,886,540 | ||||||
See Accompanying Notes to Financial Statements.
| 90 |
Aristotle/Saul Global Equity Fund
STATEMENTS OF CHANGES IN NET ASSETS
| For the Year Ended December 31, 2021 | For the Year Ended December 31, 2020 | |||||||
| Increase (Decrease) in Net Assets from: | ||||||||
| Operations: | ||||||||
| Net investment income | $ | 586,550 | $ | 559,571 | ||||
| Net realized gain on investments and foreign currency transactions | 2,685,810 | 2,851,288 | ||||||
| Net change in unrealized appreciation/depreciation on investments and foreign currency translations | 10,987,859 | 5,859,273 | ||||||
| Net increase in net assets resulting from operations | 14,260,219 | 9,270,132 | ||||||
| Distributions to Shareholders: | ||||||||
| Distributions | (2,292,553 | ) | (3,387,483 | ) | ||||
| Total distributions to shareholders | (2,292,553 | ) | (3,387,483 | ) | ||||
| Capital Transactions: | ||||||||
| Class I: | ||||||||
| Net proceeds from shares sold | 21,163,818 | 7,155,286 | ||||||
| Reinvestment of distributions | 1,093,209 | 1,743,224 | ||||||
| Cost of shares redeemed1 | (9,323,738 | ) | (15,893,690 | ) | ||||
Net increase (decrease) in net assets from capital transactions | 12,933,289 | (6,995,180 | ) | |||||
| Total increase (decrease) in net assets | 24,900,955 | (1,112,531 | ) | |||||
| Net Assets: | ||||||||
| Beginning of period | 69,127,681 | 70,240,212 | ||||||
| End of period | $ | 94,028,636 | $ | 69,127,681 | ||||
| Capital Share Transactions: | ||||||||
| Class I: | ||||||||
| Shares sold | 1,345,378 | 602,112 | ||||||
| Shares reinvested | 66,863 | 125,142 | ||||||
| Shares redeemed | (596,230 | ) | (1,345,234 | ) | ||||
| Net increase (decrease) in capital share transactions | 816,011 | (617,980 | ) | |||||
| 1 | Net of redemption fee proceeds of $150 and $106, respectively. |
See Accompanying Notes to Financial Statements.
| 91 |
Aristotle International Equity Fund
STATEMENTS OF CHANGES IN NET ASSETS
| For the Year Ended December 31, 2021 | For the Year Ended December 31, 2020 | |||||||
| Increase (Decrease) in Net Assets from: | ||||||||
| Operations: | ||||||||
| Net investment income | $ | 2,933,812 | $ | 1,228,201 | ||||
| Net realized gain (loss) on investments and foreign currency transactions | 4,795,789 | (1,786,141 | ) | |||||
| Net change in unrealized appreciation/depreciation on investments and foreign currency translations | 38,013,827 | 26,760,575 | ||||||
| Net increase in net assets resulting from operations | 45,743,428 | 26,202,635 | ||||||
| Distributions to Shareholders: | ||||||||
| Distributions | (6,634,924 | ) | (1,184,366 | ) | ||||
| From return of capital | (26,883 | ) | - | |||||
| Total distributions to shareholders | (6,661,807 | ) | (1,184,366 | ) | ||||
| Capital Transactions: | ||||||||
| Class I: | ||||||||
| Net proceeds from shares sold | 157,891,833 | 155,229,159 | ||||||
| Reinvestment of distributions | 6,440,879 | 1,150,354 | ||||||
| Cost of shares redeemed1 | (56,958,614 | ) | (27,601,524 | ) | ||||
| Net increase in net assets from capital transactions | 107,374,098 | 128,777,989 | ||||||
| Total increase in net assets | 146,455,719 | 153,796,258 | ||||||
| Net Assets: | ||||||||
| Beginning of period | 245,020,784 | 91,224,526 | ||||||
| End of period | $ | 391,476,503 | $ | 245,020,784 | ||||
| Capital Share Transactions: | ||||||||
| Class I: | ||||||||
| Shares sold | 11,473,476 | 13,949,030 | ||||||
| Shares reinvested | 454,543 | 91,735 | ||||||
| Shares redeemed | (4,182,655 | ) | (2,725,225 | ) | ||||
| Net increase in capital share transactions | 7,745,364 | 11,315,540 | ||||||
| 1 | Net of redemption fee proceeds of $4,204 and $1,012, respectively. |
See Accompanying Notes to Financial Statements.
| 92 |
Aristotle Strategic Credit Fund
STATEMENTS OF CHANGES IN NET ASSETS
| For the Year Ended December 31, 2021 | For the Year Ended December 31, 2020 | |||||||
| Increase (Decrease) in Net Assets from: | ||||||||
| Operations: | ||||||||
| Net investment income | $ | 245,113 | $ | 234,985 | ||||
| Net realized gain on investments | 297,949 | 103,058 | ||||||
| Net change in unrealized appreciation/depreciation on investments | (332,411 | ) | 199,870 | |||||
| Net increase in net assets resulting from operations | 210,651 | 537,913 | ||||||
| Distributions to Shareholders: | ||||||||
| Distributions | (247,330 | ) | (235,505 | ) | ||||
| Total distributions to shareholders | (247,330 | ) | (235,505 | ) | ||||
| Capital Transactions: | ||||||||
| Class I: | ||||||||
| Net proceeds from shares sold | 3,223,314 | 2,201,553 | ||||||
| Reinvestment of distributions | 223,785 | 213,592 | ||||||
| Cost of shares redeemed1 | (3,429,674 | ) | (58,395 | ) | ||||
| Net increase in net assets from capital transactions | 17,425 | 2,356,750 | ||||||
| Total increase (decrease) in net assets | (19,254 | ) | 2,659,158 | |||||
| Net Assets: | ||||||||
| Beginning of period | 8,631,392 | 5,972,234 | ||||||
| End of period | $ | 8,612,138 | $ | 8,631,392 | ||||
| Capital Share Transactions: | ||||||||
| Class I: | ||||||||
| Shares sold | 309,658 | 216,692 | ||||||
| Shares reinvested | 21,475 | 21,256 | ||||||
| Shares redeemed | (327,683 | ) | (5,815 | ) | ||||
| Net increase in capital share transactions | 3,450 | 232,133 | ||||||
| 1 | Net of redemption fee proceeds of $0 and $261, respectively. |
See Accompanying Notes to Financial Statements.
| 93 |
Aristotle Value Equity Fund
STATEMENTS OF CHANGES IN NET ASSETS
| For the Year Ended December 31, 2021 | For the Year Ended December 31, 2020 | |||||||
| Increase (Decrease) in Net Assets from: | ||||||||
| Operations: | ||||||||
| Net investment income | $ | 5,714,814 | $ | 1,822,811 | ||||
| Net realized gain on investments | 18,198,323 | 2,133,123 | ||||||
| Net change in unrealized appreciation/depreciation on investments | 118,375,034 | 52,354,663 | ||||||
| Net increase in net assets resulting from operations | 142,288,171 | 56,310,597 | ||||||
| Distributions to Shareholders: | ||||||||
| Distributions | (20,963,687 | ) | (1,825,277 | ) | ||||
| Total distributions to shareholders | (20,963,687 | ) | (1,825,277 | ) | ||||
| Capital Transactions: | ||||||||
| Class I: | ||||||||
| Net proceeds from shares sold | 563,921,536 | 293,563,991 | ||||||
| Reinvestment of distributions | 20,232,496 | 1,679,739 | ||||||
| Cost of shares redeemed1 | (155,079,458 | ) | (52,474,617 | ) | ||||
| Net increase in net assets from capital transactions | 429,074,574 | 242,769,113 | ||||||
| Total increase in net assets | 550,399,058 | 297,254,433 | ||||||
| Net Assets: | ||||||||
| Beginning of period | 396,791,538 | 99,537,105 | ||||||
| End of period | $ | 947,190,596 | $ | 396,791,538 | ||||
| Capital Share Transactions: | ||||||||
| Class I: | ||||||||
| Shares sold | 29,413,027 | 20,543,883 | ||||||
| Shares reinvested | 989,848 | 101,741 | ||||||
| Shares redeemed | (7,891,578 | ) | (3,799,806 | ) | ||||
| Net increase in capital share transactions | 22,511,297 | 16,845,818 | ||||||
| 1 | Net of redemption fee proceeds of $4,503 and $1,602, respectively. |
See Accompanying Notes to Financial Statements.
| 94 |
Aristotle Small Cap Equity Fund
STATEMENTS OF CHANGES IN NET ASSETS
| For the Year Ended December 31, 2021 | For the Year Ended December 31, 2020 | |||||||
| Increase (Decrease) in Net Assets from: | ||||||||
| Operations: | ||||||||
| Net investment income (loss) | $ | (118,298 | ) | $ | 73,788 | |||
| Net realized gain (loss) on investments | 9,495,141 | (1,208,423 | ) | |||||
| Net change in unrealized appreciation/depreciation on investments | 22,300,412 | 19,397,846 | ||||||
| Net increase in net assets resulting from operations | 31,677,255 | 18,263,211 | ||||||
| Distributions to Shareholders: | ||||||||
| Distributions | (6,802,780 | ) | (3,002,697 | ) | ||||
| Total distributions to shareholders | (6,802,780 | ) | (3,002,697 | ) | ||||
| Capital Transactions: | ||||||||
| Class I: | ||||||||
| Net proceeds from shares sold | 45,365,874 | 69,824,355 | ||||||
| Reinvestment of distributions | 6,796,183 | 3,000,502 | ||||||
| Cost of shares redeemed1 | (22,730,769 | ) | (43,770,259 | ) | ||||
| Net increase in net assets from capital transactions | 29,431,288 | 29,054,598 | ||||||
| Total increase in net assets | 54,305,763 | 44,315,112 | ||||||
| Net Assets: | ||||||||
| Beginning of period | 161,570,191 | 117,255,079 | ||||||
| End of period | $ | 215,875,954 | $ | 161,570,191 | ||||
| Capital Share Transactions: | ||||||||
| Class I: | ||||||||
| Shares sold | 2,890,648 | 6,525,517 | ||||||
| Shares reinvested | 437,616 | 219,656 | ||||||
| Shares redeemed | (1,454,320 | ) | (4,169,617 | ) | ||||
| Net increase in capital share transactions | 1,873,944 | 2,575,556 | ||||||
| 1 | Net of redemption fee proceeds of $991 and $1,146, respectively. |
See Accompanying Notes to Financial Statements.
| 95 |
Aristotle Core Equity Fund
STATEMENTS OF CHANGES IN NET ASSETS
| For the Year Ended December 31, 2021 | For the Year Ended December 31, 2020 | |||||||
| Increase (Decrease) in Net Assets from: | ||||||||
| Operations: | ||||||||
| Net investment income | $ | 468,586 | $ | 318,142 | ||||
| Net realized gain on investments | 2,438,640 | 692,133 | ||||||
| Net change in unrealized appreciation/depreciation on investments | 26,979,314 | 16,173,458 | ||||||
| Net increase in net assets resulting from operations | 29,886,540 | 17,183,733 | ||||||
| Distributions to Shareholders: | ||||||||
| Distributions | (2,659,333 | ) | (698,518 | ) | ||||
| Total distributions to shareholders | (2,659,333 | ) | (698,518 | ) | ||||
| Capital Transactions: | ||||||||
| Class I: | ||||||||
| Net proceeds from shares sold | 71,605,338 | 55,863,836 | ||||||
| Reinvestment of distributions | 2,605,321 | 664,183 | ||||||
| Cost of shares redeemed1 | (13,604,250 | ) | (9,602,668 | ) | ||||
| Net increase in net assets from capital transactions | 60,606,409 | 46,925,351 | ||||||
| Total increase in net assets | 87,833,616 | 63,410,566 | ||||||
| Net Assets: | ||||||||
| Beginning of period | 90,679,244 | 27,268,678 | ||||||
| End of period | $ | 178,512,860 | $ | 90,679,244 | ||||
| Capital Share Transactions: | ||||||||
| Class I: | ||||||||
| Shares sold | 3,643,249 | 3,797,835 | ||||||
| Shares reinvested | 120,449 | 37,997 | ||||||
| Shares redeemed | (679,279 | ) | (662,841 | ) | ||||
| Net increase in capital share transactions | 3,084,419 | 3,172,991 | ||||||
| 1 | Net of redemption fee proceeds of $2,413 and $2,720, respectively. |
See Accompanying Notes to Financial Statements.
| 96 |
Aristotle/Saul Global Equity Fund
FINANCIAL HIGHLIGHTS
Class I
Per share operating performance.
For a capital share outstanding throughout each period.
| For the Year Ended December 31, | ||||||||||||||||||||
| 2021 | 2020 | 2019 | 2018 | 2017 | ||||||||||||||||
| Net asset value, beginning of period | $ | 14.18 | $ | 12.79 | $ | 10.76 | $ | 13.29 | $ | 11.59 | ||||||||||
| Income from Investment Operations: | ||||||||||||||||||||
| Net investment income1 | 0.11 | 0.11 | 0.12 | 0.13 | 0.09 | |||||||||||||||
| Net realized and unrealized gain (loss) | 2.65 | 2.01 | 2.83 | (1.35 | ) | 1.68 | ||||||||||||||
| Total from investment operations | 2.76 | 2.12 | 2.95 | (1.22 | ) | 1.77 | ||||||||||||||
| Less Distributions: | ||||||||||||||||||||
| From net investment income | (0.11 | ) | (0.12 | ) | (0.17 | ) | (0.23 | ) | (0.07 | ) | ||||||||||
| From net realized gain | (0.30 | ) | (0.61 | ) | (0.75 | ) | (1.08 | ) | - | |||||||||||
| Total distributions | (0.41 | ) | (0.73 | ) | (0.92 | ) | (1.31 | ) | (0.07 | ) | ||||||||||
| Redemption fee proceeds1 | - | 2 | - | 2 | - | - | 2 | - | 2 | |||||||||||
| Net asset value, end of period | $ | 16.53 | $ | 14.18 | $ | 12.79 | $ | 10.76 | $ | 13.29 | ||||||||||
| Total return3 | 19.54 | % | 16.68 | % | 27.55 | % | (9.53 | )% | 15.29 | % | ||||||||||
| Ratios and Supplemental Data: | ||||||||||||||||||||
| Net assets, end of period (in thousands) | $ | 94,029 | $ | 69,128 | $ | 70,240 | $ | 64,844 | $ | 107,728 | ||||||||||
| Ratio of expenses to average net assets (including dividends on securities sold short and interest expense): | ||||||||||||||||||||
| Before fees waived and expenses absorbed | 0.95 | % | 1.07 | % | 1.02 | % | 1.20 | % | 1.25 | % | ||||||||||
| After fees waived and expenses absorbed | 0.80 | % | 0.80 | % | 0.80 | % | 0.93 | %4 | 0.98 | % | ||||||||||
| Ratio of net investment income to average net assets (including dividends on securities sold short and interest expense): | ||||||||||||||||||||
| Before fees waived and expenses absorbed | 0.55 | % | 0.63 | % | 0.75 | % | 0.71 | % | 0.46 | % | ||||||||||
| After fees waived and expenses absorbed | 0.70 | % | 0.90 | % | 0.97 | % | 0.98 | % | 0.73 | % | ||||||||||
| Portfolio turnover rate | 13 | % | 12 | % | 22 | % | 37 | % | 27 | % | ||||||||||
| 1 | Based on average shares outstanding for the period. |
| 2 | Amount represents less than $0.01 per share. |
| 3 | Total returns would have been lower had expenses not been waived or absorbed by the Advisor. Returns shown do not reflect the deduction of taxes that a shareholder would pay on Fund distributions or the redemption of Fund shares. |
| 4 | Effective September 1, 2018, the Fund's advisor had contractually agreed to waive its fees and/or absorb expenses of the Fund to ensure that total annual fund operating expenses (excluding taxes, leverage interest, brokerage commissions, dividend expenses on short sales, acquired fund fees and expenses as determined in accordance with SEC Form N-1A, expenses incurred in connection with any merger or reorganization, or extraordinary expenses such as litigation) do not exceed 0.80% of average daily net assets of the Fund. Prior to September 1, 2018, the annual operating expense limitation was 0.98%. |
See Accompanying Notes to Financial Statements.
| 97 |
Aristotle International Equity Fund
FINANCIAL HIGHLIGHTS
Class I
Per share operating performance.
For a capital share outstanding throughout each period.
| For the Year Ended December 31, | ||||||||||||||||||||
| 2021 | 2020 | 2019 | 2018 | 2017 | ||||||||||||||||
| Net asset value, beginning of period | $ | 12.80 | $ | 11.66 | $ | 9.54 | $ | 10.74 | $ | 8.89 | ||||||||||
| Income from Investment Operations: | ||||||||||||||||||||
| Net investment income1 | 0.13 | 0.10 | 0.18 | 0.16 | 0.15 | |||||||||||||||
| Net realized and unrealized gain (loss) | 1.88 | 1.11 | 2.11 | (1.22 | ) | 1.86 | ||||||||||||||
| Total from investment operations | 2.01 | 1.21 | 2.29 | (1.06 | ) | 2.01 | ||||||||||||||
| Less Distributions: | ||||||||||||||||||||
| From net investment income | (0.11 | ) | (0.07 | ) | (0.15 | ) | (0.14 | ) | (0.16 | ) | ||||||||||
| From net realized gain | (0.14 | ) | - | (0.02 | ) | - | - | |||||||||||||
| From return of capital | - | 2 | - | - | - | - | ||||||||||||||
| Total distributions | (0.25 | ) | (0.07 | ) | (0.17 | ) | (0.14 | ) | (0.16 | ) | ||||||||||
| Redemption fee proceeds1 | - | 2 | - | 2 | - | 2 | - | 2 | - | 2 | ||||||||||
| Net asset value, end of period | $ | 14.56 | $ | 12.80 | $ | 11.66 | $ | 9.54 | $ | 10.74 | ||||||||||
| Total return3 | 15.79 | % | 10.40 | % | 23.98 | % | (9.89 | )% | 22.64 | % | ||||||||||
| Ratios and Supplemental Data: | ||||||||||||||||||||
| Net assets, end of period (in thousands) | $ | 391,477 | $ | 245,021 | $ | 91,225 | $ | 45,636 | $ | 16,677 | ||||||||||
| Ratio of expenses to average net assets: | ||||||||||||||||||||
| Before fees waived and expenses absorbed | 0.93 | % | 1.04 | % | 1.17 | % | 1.42 | % | 2.38 | % | ||||||||||
| After fees waived and expenses absorbed | 0.80 | % | 0.80 | % | 0.80 | % | 0.88 | %4 | 0.93 | % | ||||||||||
| Ratio of net investment income to average net assets: | ||||||||||||||||||||
| Before fees waived and expenses absorbed | 0.78 | % | 0.72 | % | 1.26 | % | 0.90 | % | 0.09 | % | ||||||||||
| After fees waived and expenses absorbed | 0.91 | % | 0.96 | % | 1.63 | % | 1.44 | % | 1.54 | % | ||||||||||
| Portfolio turnover rate | 10 | % | 14 | % | 11 | % | 17 | % | 10 | % | ||||||||||
| 1 | Based on average shares outstanding for the period. |
| 2 | Amount represents less than $0.01 per share. |
| 3 | Total returns would have been lower had expenses not been waived or absorbed by the Advisor. Returns shown do not reflect the deduction of taxes that a shareholder would pay on Fund distributions or the redemption of Fund shares. |
| 4 | Effective September 1, 2018, the Fund's advisor had contractually agreed to waive its fees and/or absorb expenses of the Fund to ensure that total annual fund operating expenses (excluding taxes, leverage interest, brokerage commissions, dividend expenses on short sales, acquired fund fees and expenses as determined in accordance with SEC Form N-1A, expenses incurred in connection with any merger or reorganization, or extraordinary expenses such as litigation) do not exceed 0.80% of average daily net assets of the Fund. Prior to September 1, 2018, the annual operating expense limitation was 0.93%. |
See Accompanying Notes to Financial Statements.
| 98 |
Aristotle Strategic Credit Fund
FINANCIAL HIGHLIGHTS
Class I
Per share operating performance.
For a capital share outstanding throughout each period.
| For the Year Ended December 31, | ||||||||||||||||||||
| 2021 | 2020 | 2019 | 2018 | 2017 | ||||||||||||||||
| Net asset value, beginning of period | $ | 10.46 | $ | 10.07 | $ | 9.39 | $ | 9.96 | $ | 9.94 | ||||||||||
| Income from Investment Operations: | ||||||||||||||||||||
| Net investment income1 | 0.32 | 0.32 | 0.40 | 0.41 | 0.41 | |||||||||||||||
| Net realized and unrealized gain (loss) | (0.06 | ) | 0.39 | 0.68 | (0.56 | ) | 0.02 | |||||||||||||
| Total from investment operations | 0.26 | 0.71 | 1.08 | (0.15 | ) | 0.43 | ||||||||||||||
| Less Distributions: | ||||||||||||||||||||
| From net investment income | (0.32 | ) | (0.32 | ) | (0.40 | ) | (0.42 | ) | (0.41 | ) | ||||||||||
| From net realized gain | - | - | - | - | - | |||||||||||||||
| Total distributions | (0.32 | ) | (0.32 | ) | (0.40 | ) | (0.42 | ) | (0.41 | ) | ||||||||||
| Net asset value, end of period | $ | 10.40 | $ | 10.46 | $ | 10.07 | $ | 9.39 | $ | 9.96 | ||||||||||
| Total return2 | 2.56 | % | 7.26 | % | 11.71 | % | (1.58 | )% | 4.35 | % | ||||||||||
| Ratios and Supplemental Data: | ||||||||||||||||||||
| Net assets, end of period (in thousands) | $ | 8,612 | $ | 8,631 | $ | 5,972 | $ | 4,818 | $ | 7,251 | ||||||||||
| Ratio of expenses to average net assets: | ||||||||||||||||||||
| Before fees waived and expenses absorbed | 2.72 | % | 3.22 | % | 3.94 | % | 4.03 | % | 2.96 | % | ||||||||||
| After fees waived and expenses absorbed | 0.62 | % | 0.62 | % | 0.62 | % | 0.62 | % | 0.62 | % | ||||||||||
| Ratio of net investment income to average net assets: | ||||||||||||||||||||
| Before fees waived and expenses absorbed | 0.94 | % | 0.60 | % | 0.69 | % | 0.80 | % | 1.73 | % | ||||||||||
| After fees waived and expenses absorbed | 3.04 | % | 3.20 | % | 4.01 | % | 4.21 | % | 4.07 | % | ||||||||||
| Portfolio turnover rate | 104 | % | 46 | % | 54 | % | 89 | % | 69 | % | ||||||||||
| 1 | Based on average shares outstanding for the period. |
| 2 | Total returns would have been lower had expenses not been waived or absorbed by the Advisor. Returns shown do not reflect the deduction of taxes that a shareholder would pay on Fund distributions or the redemption of Fund shares. |
See Accompanying Notes to Financial Statements.
| 99 |
Aristotle Value Equity Fund
FINANCIAL HIGHLIGHTS
Class I
Per share operating performance.
For a capital share outstanding throughout each period.
| For the Year Ended December 31, | ||||||||||||||||||||
| 2021 | 2020 | 2019 | 2018 | 2017 | ||||||||||||||||
| Net asset value, beginning of period | $ | 16.83 | $ | 14.79 | $ | 11.29 | $ | 12.64 | $ | 10.45 | ||||||||||
| Income from Investment Operations: | ||||||||||||||||||||
| Net investment income1 | 0.16 | 0.13 | 0.13 | 0.13 | 0.11 | |||||||||||||||
| Net realized and unrealized gain (loss) | 4.03 | 2.00 | 3.50 | (1.33 | ) | 2.20 | ||||||||||||||
| Total from investment operations | 4.19 | 2.13 | 3.63 | (1.20 | ) | 2.31 | ||||||||||||||
| Less Distributions: | ||||||||||||||||||||
| From net investment income | (0.13 | ) | (0.09 | ) | (0.13 | ) | (0.07 | ) | (0.06 | ) | ||||||||||
| From net realized gain | (0.34 | ) | - | - | (0.08 | ) | (0.06 | ) | ||||||||||||
| Total distributions | (0.47 | ) | (0.09 | ) | (0.13 | ) | (0.15 | ) | (0.12 | ) | ||||||||||
| Redemption fee proceeds1 | - | 2 | - | 2 | - | 2 | - | 2 | - | |||||||||||
| Net asset value, end of period | $ | 20.55 | $ | 16.83 | $ | 14.79 | $ | 11.29 | $ | 12.64 | ||||||||||
| Total return3 | 24.90 | % | 14.38 | % | 32.18 | % | (9.53 | )% | 22.12 | % | ||||||||||
| Ratios and Supplemental Data: | ||||||||||||||||||||
| Net assets, end of period (in thousands) | $ | 947,191 | $ | 396,792 | $ | 99,537 | $ | 98,731 | $ | 9,170 | ||||||||||
| Ratio of expenses to average net assets: | ||||||||||||||||||||
| Before fees waived and expenses absorbed | 0.71 | % | 0.79 | % | 0.93 | % | 0.96 | % | 4.53 | % | ||||||||||
| After fees waived and expenses absorbed | 0.69 | % | 0.70 | %4 | 0.78 | % | 0.78 | % | 0.78 | % | ||||||||||
| Ratio of net investment income (loss) to average net assets: | ||||||||||||||||||||
| Before fees waived and expenses absorbed | 0.78 | % | 0.83 | % | 0.82 | % | 0.89 | % | (2.80 | )% | ||||||||||
| After fees waived and expenses absorbed | 0.80 | % | 0.92 | % | 0.97 | % | 1.07 | % | 0.95 | % | ||||||||||
| Portfolio turnover rate | 14 | % | 14 | % | 86 | % | 18 | % | 14 | % | ||||||||||
| 1 | Based on average shares outstanding for the period. |
| 2 | Amount represents less than $0.01 per share. |
| 3 | Total returns would have been lower had expenses not been waived or absorbed by the Advisor. Returns shown do not reflect the deduction of taxes that a shareholder would pay on Fund distributions or the redemption of Fund shares. |
| 4 | Effective March 1, 2020, the Fund's advisor had contractually agreed to waive its fees and/or absorb expenses of the Fund to ensure that total annual fund operating expenses (excluding any taxes, leverage interest, brokerage commissions, dividend and interest expenses on short sales, acquired fund fees and expenses (as determined in accordance with Form N-1A), expenses incurred in connection with any merger or reorganization, and extraordinary expenses such as litigation expenses) do not exceed 0.69% of average daily net assets of the Fund. Prior to March 1, 2020, the annual operating expense limitation was 0.78%. |
See Accompanying Notes to Financial Statements.
| 100 |
Aristotle Small Cap Equity Fund
FINANCIAL HIGHLIGHTS
Class I
Per share operating performance.
For a capital share outstanding throughout each period.
| For the Year Ended December 31, | ||||||||||||||||||||
| 2021 | 2020 | 2019 | 2018 | 2017 | ||||||||||||||||
| Net asset value, beginning of period | $ | 13.90 | $ | 12.96 | $ | 10.74 | $ | 12.83 | $ | 11.40 | ||||||||||
| Income from Investment Operations: | ||||||||||||||||||||
| Net investment income (loss)1 | (0.01 | ) | 0.01 | 0.01 | 0.01 | -2 | ||||||||||||||
| Net realized and unrealized gain (loss) | 2.61 | 1.19 | 2.41 | (1.56 | ) | 2.03 | ||||||||||||||
| Total from investment operations | 2.60 | 1.20 | 2.42 | (1.55 | ) | 2.03 | ||||||||||||||
| Less Distributions: | ||||||||||||||||||||
| From net investment income | - | 2 | - | 2 | - | 2 | (0.01 | ) | - | |||||||||||
| From net realized gain | (0.51 | ) | (0.26 | ) | (0.20 | ) | (0.53 | ) | (0.60 | ) | ||||||||||
| Total distributions | (0.51 | ) | (0.26 | ) | (0.20 | ) | (0.54 | ) | (0.60 | ) | ||||||||||
| Redemption fee proceeds1 | - | 2 | - | 2 | - | 2 | - | - | 2 | |||||||||||
| Net asset value, end of period | $ | 15.99 | $ | 13.90 | $ | 12.96 | $ | 10.74 | $ | 12.83 | ||||||||||
| Total return3 | 18.87 | % | 9.31 | % | 22.59 | % | (12.29 | )% | 17.87 | % | ||||||||||
| Ratios and Supplemental Data: | ||||||||||||||||||||
| Net assets, end of period (in thousands) | $ | 215,876 | $ | 161,570 | $ | 117,255 | $ | 40,902 | $ | 11,422 | ||||||||||
| Ratio of expenses to average net assets: | ||||||||||||||||||||
| Before fees waived and expenses absorbed | 1.00 | % | 1.13 | % | 1.16 | % | 1.44 | % | 4.96 | % | ||||||||||
| After fees waived and expenses absorbed | 0.90 | % | 0.90 | % | 0.90 | % | 0.90 | % | 1.04 | %4 | ||||||||||
| Ratio of net investment income (loss) to average net assets: | ||||||||||||||||||||
| Before fees waived and expenses absorbed | (0.16 | )% | (0.17 | )% | (0.21 | )% | (0.46 | )% | (3.90 | )% | ||||||||||
| After fees waived and expenses absorbed | (0.06 | )% | 0.06 | % | 0.05 | % | 0.08 | % | 0.02 | % | ||||||||||
| Portfolio turnover rate | 14 | % | 24 | % | 59 | % | 94 | % | 42 | % | ||||||||||
| 1 | Based on average shares outstanding for the period. |
| 2 | Amount represents less than $0.01 per share. |
| 3 | Total returns would have been lower had expenses not been waived or absorbed by the Advisor. Returns shown do not reflect the deduction of taxes that a shareholder would pay on Fund distributions or the redemption of Fund shares. |
| 4 | Effective September 1, 2017, the Advisor has contractually agreed to limit the operating expense to 0.90%. Prior to September 1, 2017, the Advisor had contractually agreed to limit the operating expenses to 1.15%. |
See Accompanying Notes to Financial Statements.
| 101 |
Aristotle Core Equity Fund
FINANCIAL HIGHLIGHTS
Class I
Per share operating performance.
For a capital share outstanding throughout each period.
| For the Year Ended December 31, | For the Period March 31, 2017* through December 31, | |||||||||||||||||||
| 2021 | 2020 | 2019 | 2018 | 2017 | ||||||||||||||||
| Net asset value, beginning of period | $ | 17.86 | $ | 14.33 | $ | 10.66 | $ | 11.42 | $ | 10.00 | ||||||||||
| Income from Investment Operations: | ||||||||||||||||||||
| Net investment income1 | 0.07 | 0.10 | 0.09 | 0.08 | 0.07 | |||||||||||||||
| Net realized and unrealized gain (loss) | 4.28 | 3.58 | 3.67 | (0.72 | ) | 1.39 | ||||||||||||||
| Total from investment operations | 4.35 | 3.68 | 3.76 | (0.64 | ) | 1.46 | ||||||||||||||
| Less Distributions: | ||||||||||||||||||||
| From net investment income | (0.06 | ) | (0.07 | ) | (0.07 | ) | (0.07 | ) | (0.04 | ) | ||||||||||
| From net realized gain | (0.28 | ) | (0.08 | ) | (0.02 | ) | (0.05 | ) | - | |||||||||||
| Total distributions | (0.34 | ) | (0.15 | ) | (0.09 | ) | (0.12 | ) | (0.04 | ) | ||||||||||
| Redemption fee proceeds1 | - | 2 | - | 2 | - | 2 | - | - | ||||||||||||
| Net asset value, end of period | $ | 21.87 | $ | 17.86 | $ | 14.33 | $ | 10.66 | $ | 11.42 | ||||||||||
| Total return3 | 24.34 | % | 25.69 | % | 35.24 | % | (5.66 | )% | 14.64 | %4 | ||||||||||
| Ratios and Supplemental Data: | ||||||||||||||||||||
| Net assets, end of period (in thousands) | $ | 178,513 | $ | 90,679 | $ | 27,269 | $ | 10,755 | $ | 6,880 | ||||||||||
| Ratio of expenses to average net assets: | ||||||||||||||||||||
| Before fees waived and expenses absorbed | 0.79 | % | 0.96 | % | 1.47 | % | 2.59 | % | 5.85 | %5 | ||||||||||
| After fees waived and expenses absorbed | 0.65 | % | 0.65 | % | 0.65 | % | 0.65 | % | 0.65 | %5 | ||||||||||
| Ratio of net investment income (loss) to average net assets: | ||||||||||||||||||||
| Before fees waived and expenses absorbed | 0.19 | % | 0.31 | % | (0.15 | )% | (1.28 | )% | (4.40 | )%5 | ||||||||||
| After fees waived and expenses absorbed | 0.33 | % | 0.62 | % | 0.67 | % | 0.66 | % | 0.80 | %5 | ||||||||||
| Portfolio turnover rate | 8 | % | 20 | % | 18 | % | 32 | % | 22 | %4 | ||||||||||
| * | Commencement of operations |
| 1 | Based on average shares outstanding for the period. |
| 2 | Amount represents less than $0.01 per share. |
| 3 | Total returns would have been lower had expenses not been waived or absorbed by the Advisor. Returns shown do not reflect the deduction of taxes that a shareholder would pay on Fund distributions or the redemption of Fund shares. |
| 4 | Not annualized. |
| 5 | Annualized. |
See Accompanying Notes to Financial Statements.
| 102 |
Aristotle Funds
NOTES TO FINANCIAL STATEMENTS
December 31, 2021
Note 1 – Organization
Aristotle/Saul Global Equity Fund (the ‘‘Global Equity Fund’’), Aristotle International Equity Fund (the “International Equity Fund”), Aristotle Strategic Credit Fund (the “Strategic Credit Fund”), Aristotle Value Equity Fund (the “Value Equity Fund”), Aristotle Small Cap Equity Fund (the “Small Cap Equity Fund) and Aristotle Core Equity Fund (the “Core Equity Fund”) (each a “Fund” and collectively the ‘‘Funds’’) are organized as a diversified series of Investment Managers Series Trust, a Delaware statutory trust (the “Trust”) which is registered as an open-end management investment company under the Investment Company Act of 1940, as amended (the “1940 Act”).
The Global Equity Fund’s primary investment objective is to maximize long-term capital appreciation and income. The Fund commenced investment operations on March 30, 2012.
The International Equity Fund’s primary investment objective is to seek long-term capital appreciation. The Fund commenced investment operations on March 31, 2014.
The Strategic Credit Fund’s primary investment objectives are to seek income and capital appreciation. The Fund commenced investment operations on December 31, 2014.
The Value Equity Fund’s primary investment objective is to maximize long-term capital appreciation. The Fund commenced investment operations on August 31, 2016.
The Small Cap Equity Fund’s primary investment objective is to seek long-term capital appreciation. The Fund commenced investment operations on October 30, 2015.
The Core Equity Fund’s primary investment objective is to seek long-term growth of capital. The Fund commenced investment operations on March 31, 2017.
Each Fund is an investment company and accordingly follows the investment company accounting and reporting guidance of the Financial Accounting Standards Board (FASB) Accounting Standard Codification Topic 946 “Financial Services—Investment Companies”.
Note 2 – Accounting Policies
The following is a summary of the significant accounting policies consistently followed by the Funds in the preparation of their financial statements. The preparation of financial statements in conformity with accounting principles generally accepted in the United States of America (“GAAP”) requires management to make estimates and assumptions that affect the reported amounts and disclosures in the financial statements. Actual results could differ from these estimates.
(a) Valuation of Investments
Each Fund values equity securities at the last reported sale price on the principal exchange or in the principal over the counter (“OTC”) market in which such securities are traded, as of the close of regular trading on the NYSE on the day the securities are being valued or, if the last-quoted sales price is not readily available, the securities will be valued at the last bid or the mean between the last available bid and ask price. Securities traded on the NASDAQ are valued at the NASDAQ Official Closing Price (“NOCP”). Investments in open-end investment companies are valued at the daily closing net asset value of the respective investment company. Debt securities are valued by utilizing a price supplied by independent pricing service providers. The independent pricing service providers may use various valuation methodologies including matrix pricing and other analytical pricing models as well as market transactions and dealer quotations. These models generally consider such factors as yields or prices of bonds of comparable quality, type of issue, coupon, maturity, ratings and general market conditions. If a price is not readily available for a portfolio security, the security will be valued at fair value (the amount which the Fund might reasonably expect to receive for the security upon its current sale) as determined in good faith by the Fund’s advisor, subject to review and approval by the Valuation Committee, pursuant to procedures adopted by the Board of Trustees. The actions of the Valuation Committee are subsequently reviewed by the Board at its next regularly scheduled board meeting. The Valuation Committee meets as needed. The Valuation Committee is comprised of all the Trustees, but action may be taken by any one of the Trustees.
| 103 |
Aristotle Funds
NOTES TO FINANCIAL STATEMENTS - Continued
December 31, 2021
(b) Exchange Traded Funds (“ETFs”)
ETFs typically trade on securities exchanges and their shares may, at times, trade at a premium or discount to their net asset values. In addition, an ETF may not replicate exactly the performance of the benchmark index it seeks to track for a number of reasons, including transaction costs incurred by the ETF, the temporary unavailability of certain index securities in the secondary market or discrepancies between the ETF and the index with respect to the weighting of securities or the number of securities held. Investing in ETFs, which are investment companies, may involve duplication of advisory fees and certain other expenses. As a result, Fund shareholders indirectly bear their proportionate share of these acquired expenses. Therefore, the cost of investing in the Fund will be higher than the cost of investing directly in ETFs and may be higher than other mutual funds that invest directly in securities. Each ETF in which each Fund invests is subject to specific risks, depending on the nature of the ETF. Each ETF is subject to the risks associated with direct ownership of the securities comprising the index on which the ETF is based. These risks could include liquidity risk, sector risk, and risks associated with fixed-income securities.
(c) Investment Transactions, Investment Income and Expenses
Investment transactions are accounted for on the trade date. Realized gains and losses on investments are determined on the identified cost basis. Dividend income is recorded net of applicable withholding taxes on the ex-dividend date and interest income is recorded on an accrual basis. Withholding taxes on foreign dividends, if applicable, are paid (a portion of which may be reclaimable) or provided for in accordance with the applicable country’s tax rules and rates and are disclosed in the Statement of Operations. Withholding tax reclaims are filed in certain countries to recover a portion of the amounts previously withheld. The Funds record a reclaim receivable based on a number of factors, including a jurisdiction’s legal obligation to pay reclaims as well as payment history and market convention. Discounts on debt securities are accreted or amortized to interest income over the lives of the respective securities using the effective interest method. Premiums for callable debt securities are amortized to the earliest call date, if the call price was less than the purchase price. If the call price was not at par and the security was not called, the security is amortized to the next call price and date. Expenses incurred by the Trust with respect to more than one fund are allocated in proportion to the net assets of each fund except where allocation of direct expenses to each Fund or an alternative allocation method can be more appropriately made.
(d) Foreign Currency Translation
The Funds’ records are maintained in U.S. dollars. The value of securities, currencies and other assets and liabilities denominated in currencies other than U.S. dollars are translated into U.S. dollars based upon foreign exchange rates prevailing at the end of the reporting period. The currencies are translated into U.S. dollars by using the exchange rates quoted at the close of the London Stock Exchange prior to when the Funds’ NAV is next determined. Purchases and sales of investment securities, income and expenses are translated on the respective dates of such transactions.
The Funds do not isolate that portion of their net realized and unrealized gains and losses on investments resulting from changes in foreign exchange rates from the impact arising from changes in market prices. Such fluctuations are included with net realized and unrealized gain or loss from investments and foreign currency.
Net realized foreign currency transaction gains and losses arise from sales of foreign currencies, currency gains or losses realized between the trade and settlement dates on securities transactions, and the differences between the amounts of dividends, interest, and foreign withholding taxes recorded on the Funds’ books and the U.S. dollar equivalent of the amounts actually received or paid. Net unrealized foreign currency translation gains and losses arise from changes in the value of assets and liabilities, other than investments in securities, resulting from changes in the exchange rates.
| 104 |
Aristotle Funds
NOTES TO FINANCIAL STATEMENTS - Continued
December 31, 2021
(e) Federal Income Taxes
The Funds intend to comply with the requirements of Subchapter M of the Internal Revenue Code applicable to regulated investment companies and to distribute substantially all of their net investment income and any net realized gains to their shareholders. Therefore, no provision is made for federal income or excise taxes. Due to the timing of dividend distributions and the differences in accounting for income and realized gains and losses for financial statement and federal income tax purposes, the fiscal year in which amounts are distributed may differ from the year in which the income and realized gains and losses are recorded by the Funds.
Accounting for Uncertainty in Income Taxes (the “Income Tax Statement”) requires an evaluation of tax positions taken (or expected to be taken) in the course of preparing a Fund’s tax returns to determine whether these positions meet a “more-likely-than-not” standard that, based on the technical merits, have a more than fifty percent likelihood of being sustained by a taxing authority upon examination. A tax position that meets the “more-likely-than-not” recognition threshold is measured to determine the amount of benefit to recognize in the financial statements. The Funds recognize interest and penalties, if any, related to unrecognized tax benefits as income tax expense in the Statement of Operations.
The Income Tax Statement requires management of the Funds to analyze tax positions taken in the prior three open tax years, if any, and tax positions expected to be taken in the Funds’ current tax year, as defined by the IRS statute of limitations for all major jurisdictions, including federal tax authorities and certain state tax authorities. As of and during the open tax periods ended December 31, 2018-2020, and as of and during the year ended December 31, 2021, the Funds did not have a liability for any unrecognized tax benefits. The Funds have no examination in progress and are not aware of any tax positions for which it is reasonably possible that the total amounts of unrecognized tax benefits will significantly change in the next twelve months.
(f) Distributions to Shareholders
The Global Equity Fund, International Equity Fund, Value Equity Fund, Small Cap Equity Fund and Core Equity Fund will make distributions of net investment income, if any, at least annually, typically in December. The Strategic Credit Fund will make distributions of net investment income monthly. Each Fund makes distributions of its net capital gains, if any, at least annually. Distributions to shareholders are recorded on the ex-dividend date. The amount and timing of distributions are determined in accordance with federal income tax regulations, which may differ from GAAP.
The character of distributions made during the year from net investment income or net realized gains may differ from the characterization for federal income tax purposes due to differences in the recognition of income, expense and gain (loss) items for financial statement and tax purposes.
(g) Illiquid Securities
Pursuant to Rule 22e-4 under the 1940 Act, the Funds have adopted a Liquidity Risk Management Program (“LRMP”) that requires, among other things, that the Funds limit their illiquid investments that are assets to no more than 15% of net assets. An illiquid investment is any security which may not reasonably be expected to be sold or disposed of in current market conditions in seven calendar days or less without the sale or disposition significantly changing the market value of the investment. If the Advisor, at any time, determines that the value of illiquid securities held by a Fund exceeds 15% of its net asset value, the Advisor will take such steps as it considers appropriate to reduce them as soon as reasonably practicable in accordance with the Funds’ written LRMP.
| 105 |
Aristotle Funds
NOTES TO FINANCIAL STATEMENTS - Continued
December 31, 2021
Note 3 – Investment Advisory and Other Agreements
The Trust, on behalf of the Funds, entered into Investment Advisory Agreements (the “Agreements”) with Aristotle Capital Management, LLC, Aristotle Credit Partners, LLC, Aristotle Capital Boston, LLC and Aristotle Atlantic Partners, LLC (the “Advisors”). Under the terms of the Agreement, the Funds pay a monthly investment advisory fee to the respective Advisor based on each Fund’s average daily net assets. The annual rates are listed in the table below:
| Investment Advisors | Investment Advisory Fees | |||||
| Global Equity Fund | Aristotle Capital Management, LLC | 0.70 | % | |||
| International Equity Fund | Aristotle Capital Management, LLC | 0.70 | % | |||
| Strategic Credit Fund | Aristotle Credit Partners, LLC | 0.47 | % | |||
| Value Equity Fund | Aristotle Capital Management, LLC | 0.60 | % | |||
| Small Cap Equity Fund | Aristotle Capital Boston, LLC | 0.75 | % | |||
| Core Equity Fund | Aristotle Atlantic Partners, LLC | 0.50 | % | |||
The respective Advisor for each fund has contractually agreed to waive its fees and, if necessary, to absorb other operating expenses in order to limit total annual operating expenses (excluding taxes, leverage interest, brokerage commissions, dividend and interest expenses on short sales, acquired fund fees and expenses as determined in accordance with Form N-1A, expenses incurred in connection with any merger or reorganization, or extraordinary expenses such as litigation). The agreements are effective until the dates listed below and may be terminated before those dates only by the Trust’s Board of Trustees. The table below contains the agreement expiration and expense cap by Fund:
| Agreement Expires | Total Limit on Annual Operating Expenses† | |||||
| Global Equity Fund | April 30, 2022 | 0.80 | % | |||
| International Equity Fund | April 30, 2022 | 0.80 | % | |||
| Strategic Credit Fund | April 30, 2022 | 0.62 | % | |||
| Value Equity Fund | April 30, 2022 | 0.69 | % | |||
| Small Cap Equity Fund | April 30, 2022 | 0.90 | % | |||
| Core Equity Fund | April 30, 2022 | 0.65 | % | |||
†The total limit on annual operating expenses is calculated based on each Fund’s average daily net assets.
| 106 |
Aristotle Funds
NOTES TO FINANCIAL STATEMENTS - Continued
December 31, 2021
For the year ended December 31, 2021, the respective Advisor waived its advisory fees and absorbed other expenses as follows:
| Advisory fees | Other expenses | Total | ||||||||||
| Global Equity Fund | $ | 125,157 | $ | - | $ | 125,157 | ||||||
| International Equity Fund | 413,988 | - | 413,988 | |||||||||
| Strategic Credit Fund | 37,911 | 131,538 | 169,449 | |||||||||
| Value Equity Fund | 145,899 | - | 145,899 | |||||||||
| Small Cap Equity Fund | 200,374 | - | 200,374 | |||||||||
| Core Equity Fund | 200,627 | - | 200,627 | |||||||||
The respective Advisor may recover from each Fund’s fees and/or expenses previously waived and/or absorbed if the Fund’s expense ratio, including the recovered expenses, falls below the expense limit at which they were waived. Each Fund’s advisor is permitted to seek reimbursement from the Fund, subject to certain limitations, of fees waived or payments made to the Fund for a period ending three full fiscal years after the date of the waiver or payment. This reimbursement may be requested from the Fund if the reimbursement will not cause the Fund’s annual expense ratio to exceed the lesser of (a) the expense limitation amount in effect at the time such fees were waived or payments made, or (b) the expense limitation amount in effect at the time of the reimbursement. Each Advisor may recapture all or a portion of these amounts no later than December 31, of the years stated below:
| Global Equity Fund | International Equity Fund | Strategic Credit Fund | Value Equity Fund | Small Cap Equity Fund | Core Equity Fund | |||||||||||||||||||
| 2022 | $ | 151,272 | $ | 251,277 | $ | 176,924 | $ | 123,495 | $ | 189,206 | $ | 160,016 | ||||||||||||
| 2023 | 166,116 | 310,272 | 190,652 | 185,067 | 291,617 | 159,869 | ||||||||||||||||||
| 2024 | 125,157 | 413,988 | 169,449 | 145,899 | 200,374 | 200,627 | ||||||||||||||||||
| Total | $ | 442,545 | $ | 975,537 | $ | 537,025 | $ | 454,461 | $ | 681,197 | $ | 520,512 | ||||||||||||
UMB Fund Services, Inc. (“UMBFS”) serves as the Funds’ fund accountant, transfer agent and co-administrator; and Mutual Fund Administration, LLC (“MFAC”) serves as the Funds’ other co-administrator. UMB Bank, n.a., an affiliate of UMBFS, serves as the Funds’ custodian. The Funds’ allocated fees incurred for fund accounting, fund administration, transfer agency and custody services for the year ended December 31, 2021 are reported on the Statements of Operations.
IMST Distributors, LLC serves as the Funds’ distributor (the “Distributor”). The Distributor does not receive compensation from the Funds for its distribution services; the Advisor pays the Distributor a fee for its distribution-related services.
Certain trustees and officers of the Trust are employees of UMBFS or MFAC. The Funds do not compensate trustees and officers affiliated with the Funds’ co-administrators. For the year ended December 31, 2021, the Funds’ allocated fees incurred to Trustees who are not affiliated with the Funds’ co-administrators are reported on the Statements of Operations.
The Funds’ Board of Trustees has adopted a Deferred Compensation Plan (the “Plan”) for the Independent Trustees that enables Trustees to elect to receive payment in cash or the option to select various fund(s) in the Trust in which their deferred accounts shall be deemed to be invested. If a trustee elects to defer payment, the Plan provides for the creation of a deferred payment account. The Funds’ liability for these amounts is adjusted for market value changes in the invested fund(s) and remains a liability to the Funds until distributed in accordance with the Plan. The Trustees’ Deferred compensation liability under the Plan constitutes a general unsecured obligation of each Fund and is disclosed in the Statements of Assets and Liabilities. Contributions made under the plan and the change in unrealized appreciation/depreciation and income are included in the Trustees’ fees and expenses in the Statements of Operations.
| 107 |
Aristotle Funds
NOTES TO FINANCIAL STATEMENTS - Continued
December 31, 2021
Dziura Compliance Consulting, LLC provides Chief Compliance Officer (“CCO”) services to the Trust. The Funds’ allocated fees incurred for CCO services for the year ended December 31, 2021, are reported on the Statements of Operations.
Note 4 – Federal Income Taxes
At December 31, 2021, the gross unrealized appreciation (depreciation) on investments owned by the Funds, based on cost for federal income tax purposes were as follows:
| Global Equity Fund | International Equity Fund | Strategic Credit Fund | ||||||||||
| Cost of investments | $ | 62,646,866 | $ | 316,580,844 | $ | 7,866,565 | ||||||
| Gross unrealized appreciation | $ | 33,908,625 | $ | 84,615,486 | $ | 94,002 | ||||||
| Gross unrealized depreciation | (2,536,871 | ) | (11,644,810 | ) | (34,040 | ) | ||||||
| Net unrealized appreciation on investments | $ | 31,371,754 | $ | 72,970,676 | $ | 59,962 | ||||||
| Value Equity Fund | Small Cap Equity Fund | Core Equity Fund | ||||||||||
| Cost of investments | $ | 763,368,070 | $ | 175,767,978 | $ | 130,921,755 | ||||||
| Gross unrealized appreciation | $ | 198,985,074 | $ | 55,947,493 | $ | 50,755,643 | ||||||
| Gross unrealized depreciation | (16,170,845 | ) | (15,704,825 | ) | (3,098,046 | ) | ||||||
| Net unrealized appreciation on investments | $ | 182,814,229 | $ | 40,242,668 | $ | 47,657,597 | ||||||
Any differences between cost amounts for financial statement and federal income tax purposes are due primarily to timing differences in recognizing certain gains and losses in security transactions.
| 108 |
Aristotle Funds
NOTES TO FINANCIAL STATEMENTS - Continued
December 31, 2021
GAAP requires that certain components of net assets be reclassified between financial and tax reporting. These reclassifications have no effect on net assets or net asset value per share. For the year ended December 31, 2021, permanent differences in book and tax accounting have been reclassified to paid-in capital and distributable earnings/(accumulated deficit) as follows:
| Paid-in Capital | Total Distributable Earnings/(Accumulated Deficit) | |||||||
| Global Equity Fund | $ | 340 | $ | (340 | ) | |||
| International Equity Fund | - | - | ||||||
| Strategic Credit Fund | - | - | ||||||
| Value Equity Fund | - | - | ||||||
| Small Cap Equity Fund | - | - | ||||||
| Core Equity Fund | - | - | ||||||
As of December 31, 2021, the components of accumulated earnings (deficit) on a tax basis were as follows:
| Global Equity Fund | International Equity Fund | Strategic Credit Fund | ||||||||||
| Undistributed ordinary income | $ | 8,191 | $ | - | $ | 690 | ||||||
| Undistributed long-term capital gains | 962,992 | - | -- | |||||||||
| Tax accumulated earnings | 971,183 | - | 690 | |||||||||
| Accumulated capital and other losses | - | (15,305 | ) | (66,975 | ) | |||||||
| Net unrealized appreciation on investments | 31,371,754 | 72,970,676 | 59,962 | |||||||||
| Net unrealized depreciation on foreign currency | (163 | ) | (5,957 | ) | - | |||||||
| Unrealized deferred compensation | (6,855 | ) | (6,901 | ) | (6,438 | ) | ||||||
| Total accumulated earnings (deficit) | $ | 32,335,919 | $ | 72,942,513 | $ | (12,761 | ) | |||||
| 109 |
Aristotle Funds
NOTES TO FINANCIAL STATEMENTS - Continued
December 31, 2021
| Value Equity Fund | Small Cap Equity Fund | Core Equity Fund | ||||||||||
| Undistributed ordinary income | $ | 94,842 | $ | 17,027 | $ | 2,562 | ||||||
| Undistributed long-term capital gains | 4,647,467 | 2,601,088 | 590,776 | |||||||||
| Tax accumulated earnings | 4,742,309 | 2,618,115 | 593,338 | |||||||||
| Accumulated capital and other losses | - | - | - | |||||||||
| Net unrealized appreciation on investments | 182,814,229 | 40,242,668 | 47,657,597 | |||||||||
| Net unrealized appreciation on foreign currency | - | - | - | |||||||||
| Unrealized deferred compensation | (7,339 | ) | (6,795 | ) | (6,590 | ) | ||||||
| Total accumulated earnings | $ | 187,549,199 | $ | 42,853,988 | $ | 48,244,345 | ||||||
The tax character of the distributions paid during the fiscal year ended December 31, 2021 and December 31, 2020 were as follows:
| Global Equity Fund | International Equity Fund | |||||||||||||||
| Distributions paid from: | 2021 | 2020 | 2021 | 2020 | ||||||||||||
| Ordinary income | $ | 615,067 | $ | 673,955 | $ | 2,924,031 | $ | 1,184,366 | ||||||||
| Net long-term capital gains | 1,677,486 | 2,713,528 | 3,710,893 | - | ||||||||||||
| Return of Capital | - | - | 26,883 | - | ||||||||||||
| Total distributions paid | $ | 2,292,553 | $ | 3,387,483 | $ | 6,661,807 | $ | 1,184,366 | ||||||||
| Strategic Credit Fund | Value Equity Fund | |||||||||||||||
| Distributions paid from: | 2021 | 2020 | 2021 | 2020 | ||||||||||||
| Ordinary income | $ | 247,330 | $ | 235,505 | $ | 10,075,362 | $ | 1,825,277 | ||||||||
| Net long-term capital gains | - | - | 10,888,325 | - | ||||||||||||
| Return of Capital | - | - | - | - | ||||||||||||
| Total distributions paid | $ | 247,330 | $ | 235,505 | $ | 20,963,687 | $ | 1,825,277 | ||||||||
| Small Cap Equity Fund | Core Equity Fund | |||||||||||||||
| Distributions paid from: | 2021 | 2020 | 2021 | 2020 | ||||||||||||
| Ordinary income | $ | 1,580,902 | $ | 276,873 | $ | 1,230,443 | $ | 323,886 | ||||||||
| Net long-term capital gains | 5,221,878 | 2,725,824 | 1,428,890 | 374,632 | ||||||||||||
| Return of Capital | - | - | - | - | ||||||||||||
| Total distributions paid | $ | 6,802,780 | $ | 3,002,697 | $ | 2,659,333 | $ | 698,518 | ||||||||
| 110 |
Aristotle Funds
NOTES TO FINANCIAL STATEMENTS - Continued
December 31, 2021
As of December 31, 2021, the International Equity Fund had qualified late-year ordinary losses of $15,305, which are deferred until fiscal year 2022 for tax purposes. Net late-year ordinary losses incurred after December 31 and within the taxable year, and net late-year specified losses incurred after October 31 and within the taxable year, are deemed to arise on the first day of the Fund’s next taxable year.
At December 31, 2021, the Funds had accumulated capital loss carryforwards as follows:
| Not Subject to Expiration | ||||||||||||
| Fund | Short-Term | Long-Term | Total | |||||||||
| Global Equity Fund | $ | - | $ | - | $ | - | ||||||
| International Equity Fund | - | - | - | |||||||||
| Strategic Credit Fund | 66,975 | - | 66,975 | |||||||||
| Value Equity Fund | - | - | - | |||||||||
| Small Cap Equity Fund | - | - | - | |||||||||
| Core Equity Fund | - | - | - | |||||||||
To the extent that a fund may realize future net capital gains, those gains will be offset by any of its unused capital loss carryforward. Future capital loss carryover utilization in any given year may be subject to Internal Revenue Code limitations.
During the fiscal year ended December 31, 2021, the International Equity Fund and Strategic Credit Fund utilized $1,923,116 and $298,388 of non-expiring capital loss carry forwards, respectively.
Note 5 – Redemption Fee
The Funds may impose a redemption fee of 1.00% of the total redemption amount on all shares redeemed within 30 days of purchase. For the years ended December 31, 2021 and 2020, redemption fees were as follows:
| December 31, 2021 | December 31, 2020 | |||||||
| Global Equity Fund | $ | 150 | $ | 106 | ||||
| International Equity Fund | 4,204 | 1,012 | ||||||
| Strategic Credit Fund | - | 261 | ||||||
| Value Equity Fund | 4,503 | 1,602 | ||||||
| Small Cap Equity Fund | 991 | 1,146 | ||||||
| Core Equity Fund | 2,413 | 2,720 | ||||||
| 111 |
Aristotle Funds
NOTES TO FINANCIAL STATEMENTS - Continued
December 31, 2021
Note 6 – Investment Transactions
For the year ended December 31, 2021, purchases and sales of investments, excluding short-term investments, were as follows:
| Purchases | Sales | |||||||
| Global Equity Fund | $ | 20,045,584 | $ | 10,129,501 | ||||
| International Equity Fund | 132,688,561 | 32,437,238 | ||||||
| Strategic Credit Fund | 8,165,987 | 9,070,948 | ||||||
| Value Equity Fund | 501,209,562 | 97,910,371 | ||||||
| Small Cap Equity Fund | 46,628,129 | 26,648,848 | ||||||
| Core Equity Fund | 66,911,508 | 11,533,074 | ||||||
Note 7 – Shareholder Servicing Plan
The Trust, on behalf of the International Equity Fund, the Small Cap Equity Fund and the Core Equity Fund, has adopted a Shareholder Servicing Plan to pay a fee at an annual rate of up to 0.15% of average daily net assets of shares serviced by shareholder servicing agents who provide administrative and support services to their customers.
For the year ended December 31, 2021, the International Equity Fund, the Small Cap Equity Fund and the Core Equity Fund shareholder servicing fees incurred are disclosed on the Statements of Operations.
Note 8 – Indemnifications
In the normal course of business, the Funds enter into contracts that contain a variety of representations which provide general indemnifications. The Funds’ maximum exposure under these arrangements is unknown, as this would involve future claims that may be made against the Funds that have not yet occurred. However, the Funds expect the risk of loss to be remote.
Note 9 – Fair Value Measurements and Disclosure
Fair Value Measurements and Disclosures defines fair value, establishes a framework for measuring fair value in accordance with GAAP, and expands disclosure about fair value measurements. It also provides guidance on determining when there has been a significant decrease in the volume and level of activity for an asset or a liability, when a transaction is not orderly, and how that information must be incorporated into a fair value measurement.
Under Fair Value Measurements and Disclosures, various inputs are used in determining the value of the Funds’ investments. These inputs are summarized into three broad Levels as described below:
| • | Level 1 – Unadjusted quoted prices in active markets for identical assets or liabilities that the Funds have the ability to access. |
| • | Level 2 – Observable inputs other than quoted prices included in Level 1 that are observable for the asset or liability, either directly or indirectly. These inputs may include quoted prices for the identical instrument on an inactive market, prices for similar instruments, interest rates, prepayment speeds, credit risk, yield curves, default rates and similar data. |
| • | Level 3 – Unobservable inputs for the asset or liability, to the extent relevant observable inputs are not available; representing the Funds’ own assumptions about the assumptions a market participant would use in valuing the asset or liability, and would be based on the best information available. |
| 112 |
Aristotle Funds
NOTES TO FINANCIAL STATEMENTS - Continued
December 31, 2021
The availability of observable inputs can vary from security to security and is affected by a wide variety of factors, including, for example, the type of security, whether the security is new and not yet established in the marketplace, the liquidity of markets, and other characteristics particular to the security. To the extent that valuation is based on models or inputs that are less observable or unobservable in the market, the determination of fair value requires more judgment. Accordingly, the degree of judgment exercised in determining fair value is greatest for instruments categorized in Level 3.
The inputs used to measure fair value may fall into different Levels of the fair value hierarchy. In such cases, for disclosure purposes, the Level in the fair value hierarchy within which the fair value measurement falls in its entirety, is determined based on the lowest Level input that is significant to the fair value measurement in its entirety.
The inputs or methodology used for valuing securities are not an indication of the risk associated with investing in those securities. The following is a summary of the inputs used, as of December 31, 2021, in valuing the Funds’ assets carried at fair value:
| Global Equity Fund | Level 1 | Level 2 | Level 3** | Total | ||||||||||||
| Investments | ||||||||||||||||
| Common Stocks | ||||||||||||||||
| Austria | $ | - | $ | 1,148,504 | $ | - | $ | 1,148,504 | ||||||||
| Canada | 3,683,231 | - | - | 3,683,231 | ||||||||||||
| France | 5,812,209 | - | - | 5,812,209 | ||||||||||||
| Germany | - | 6,387,325 | - | 6,387,325 | ||||||||||||
| Hong Kong | 1,451,524 | - | - | 1,451,524 | ||||||||||||
| Ireland | 1,567,267 | - | - | 1,567,267 | ||||||||||||
| Japan | - | 12,717,009 | - | 12,717,009 | ||||||||||||
| South Korea | - | 2,660,462 | - | 2,660,462 | ||||||||||||
| Netherlands | 1,283,019 | - | - | 1,283,019 | ||||||||||||
| Singapore | 1,840,603 | - | - | 1,840,603 | ||||||||||||
| Sweden | - | 1,243,624 | - | 1,243,624 | ||||||||||||
| Switzerland | 1,546,480 | 1,975,799 | - | 3,522,279 | ||||||||||||
| United Kingdom | 3,960,181 | - | - | 3,960,181 | ||||||||||||
| United States | 43,922,892 | - | - | 43,922,892 | ||||||||||||
| Short-Term Investments | 2,818,491 | - | - | 2,818,491 | ||||||||||||
| Total Investments | $ | 67,885,897 | $ | 26,132,723 | $ | - | $ | 94,018,620 | ||||||||
| 113 |
Aristotle Funds
NOTES TO FINANCIAL STATEMENTS - Continued
December 31, 2021
| International Equity Fund | Level 1 | Level 2 | Level 3** | Total | ||||||||||||
| Investments | ||||||||||||||||
| Common Stocks | ||||||||||||||||
| Austria | $ | - | $ | 8,198,915 | $ | - | $ | 8,198,915 | ||||||||
| Canada | 34,534,815 | - | - | 34,534,815 | ||||||||||||
| France | 60,861,109 | - | - | 60,861,109 | ||||||||||||
| Germany | - | 25,516,261 | - | 25,516,261 | ||||||||||||
| Hong Kong | 7,646,707 | - | - | 7,646,707 | ||||||||||||
| Ireland | 32,012,303 | - | - | 32,012,303 | ||||||||||||
| Japan | - | 72,083,984 | - | 72,083,984 | ||||||||||||
| South Korea | - | 9,759,301 | - | 9,759,301 | ||||||||||||
| Netherlands | 19,543,971 | - | - | 19,543,971 | ||||||||||||
| Peru | 7,604,961 | - | - | 7,604,961 | ||||||||||||
| Singapore | 9,071,414 | - | - | 9,071,414 | ||||||||||||
| Sweden | - | 8,089,651 | - | 8,089,651 | ||||||||||||
| Switzerland | - | 17,782,693 | - | 17,782,693 | ||||||||||||
| United Kingdom | 64,666,522 | - | - | 64,666,522 | ||||||||||||
| United States | 2,700,530 | - | - | 2,700,530 | ||||||||||||
| Short-Term Investments | 9,478,383 | - | - | 9,478,383 | ||||||||||||
| Total Investments | $ | 248,120,715 | $ | 141,430,805 | $ | - | $ | 389,551,520 | ||||||||
| Strategic Credit Fund | Level 1 | Level 2 | Level 3** | Total | ||||||||||||
| Investments | ||||||||||||||||
| Bank Loans2 | $ | - | $ | 614,890 | $ | - | $ | 614,890 | ||||||||
| Corporate Bonds2 | - | 6,781,427 | - | 6,781,427 | ||||||||||||
| Preferred Stocks | 89,686 | - | - | 89,686 | ||||||||||||
| Short-Term Investments | 440,524 | - | - | 440,524 | ||||||||||||
| Total Investments | $ | 530,210 | $ | 7,396,317 | $ | - | $ | 7,926,527 | ||||||||
| Value Equity Fund | Level 1 | Level 2* | Level 3** | Total | ||||||||||||
| Investments | ||||||||||||||||
| Common Stocks1 | $ | 919,048,565 | $ | - | $ | - | $ | 919,048,565 | ||||||||
| Short-Term Investments | 27,133,734 | - | - | 27,133,734 | ||||||||||||
| Total Investments | $ | 946,182,299 | $ | - | $ | - | $ | 946,182,299 | ||||||||
| Small Cap Equity Fund | Level 1 | Level 2* | Level 3** | Total | ||||||||||||
| Investments | ||||||||||||||||
| Common Stocks1 | $ | 203,389,424 | $ | - | $ | - | $ | 203,389,424 | ||||||||
| Exchange-Traded Funds | 5,668,501 | - | - | 5,668,501 | ||||||||||||
| Short-Term Investments | 6,952,721 | - | - | 6,952,721 | ||||||||||||
| Total Investments | $ | 216,010,646 | $ | - | $ | - | $ | 216,010,646 | ||||||||
| 114 |
Aristotle Funds
NOTES TO FINANCIAL STATEMENTS - Continued
December 31, 2021
| Core Equity Fund | Level 1 | Level 2* | Level 3** | Total | ||||||||||||
| Investments | ||||||||||||||||
| Common Stocks1 | $ | 174,230,201 | $ | - | $ | - | $ | 174,230,201 | ||||||||
| Short-Term Investments | 4,349,151 | - | - | 4,349,151 | ||||||||||||
| Total Investments | $ | 178,579,352 | $ | - | $ | - | $ | 178,579,352 | ||||||||
| 1 | All common stocks held in the Fund are Level 1 securities. For a detailed break-out of common stocks by country classification and major industry classification, please refer to the Schedule of Investments. |
| 2 | All corporate bonds and bank loans held in the Fund are Level 2 securities. For a detailed break-out of corporate bonds by major industry classification, please refer to the Schedule of Investments. |
| * | The Fund did not hold any Level 2 securities at period end. |
| ** | The Fund did not hold any Level 3 securities at period end. |
Note 10 – Unfunded Commitments
The Strategic Credit Fund may enter into unfunded loan commitments. Unfunded loan commitments may be partially or wholly unfunded. During the contractual period, the Fund is obliged to provide funding to the borrower upon demand. Unfunded loan commitments are fair valued in accordance with the valuation policy described in Note 2(a) and unrealized appreciation or depreciation, if any, is recorded on the Statements of Assets and Liabilities.
As of December 31, 2021, the Strategic Credit Fund had no unfunded loan commitments outstanding.
Note 11 – COVID-19 Risks
In early 2020, an outbreak of a novel strain of coronavirus (COVID-19) emerged globally. This coronavirus has resulted in closing international borders, enhanced health screenings, healthcare service preparation and delivery, quarantines, cancellations, disruptions to supply chains and customer activity, as well as general public concern and uncertainty. The impact of this outbreak has negatively affected the worldwide economy, as well as the economies of individual countries, the financial health of individual companies and the market in general in significant and unforeseen ways. The future impact of COVID-19 is currently unknown, and it may exacerbate other risks that apply to the Funds, including political, social and economic risks. Any such impact could adversely affect the Funds’ performance, the performance of the securities in which the Funds invests and may lead to losses on your investment in the Funds. The ultimate impact of COVID-19 on the financial performance of the Funds’ investments is not reasonably estimable at this time.
Note 12 – New Accounting Pronouncement
In October 2020, the SEC adopted new regulations governing the use of derivatives by registered investment companies (“Rule 18f-4”). Rule 18f-4 will impose limits on the amount of derivatives a Fund can enter into, eliminate the asset segregation framework currently used by funds to comply with Section 18 of the 1940 Act, and require funds whose use of derivatives is greater than a limited specified amount to establish and maintain a comprehensive derivatives risk management program and appoint a derivatives risk manager. Funds will be required to comply with Rule 18f-4 by August 19, 2022. It is not currently clear what impact, if any, Rule 18f-4 will have on the availability, liquidity or performance of derivatives. Management is currently evaluating the potential impact of Rule 18f-4 on the Fund(s). When fully implemented, Rule 18f-4 may require changes in how a Fund uses derivatives, adversely affect the Fund’s performance and increase costs related to the Fund’s use of derivatives.
In December 2020, the SEC adopted a new rule providing a framework for fund valuation practices (“Rule 2a-5”). Rule 2a-5 establishes requirements for determining fair value in good faith for purposes of the 1940 Act. Rule 2a-5 will permit fund boards to designate certain parties to perform fair value determinations, subject to board oversight and certain other conditions. Rule 2a-5 also defines when market quotations are “readily available” for purposes of the 1940 Act and the threshold for determining whether a fund must fair value a security. In connection with Rule 2a-5, the SEC also adopted related recordkeeping requirements and is rescinding previously issued guidance, including with respect to the role of a board in determining fair value and the accounting and auditing of fund investments. The Funds will be required to comply with the rules by September 8, 2022. Management is currently assessing the potential impact of the new rules on the Funds’ financial statements.
| 115 |
Aristotle Funds
NOTES TO FINANCIAL STATEMENTS - Continued
December 31, 2021
The SEC adopted new Rule 12d1-4, which will allow registered investment companies (including business development companies (“BDCs”), unit investment trusts (“UITs”), closed-end funds, exchange-traded funds (“ETFs”), and exchange-traded managed funds (“ETMFs”) (an “acquiring” fund), to invest in other investment companies (an “acquired fund”), including private funds under a specific exception, beyond the limits of Section 12(d)(1), subject to the conditions of the rule. Rule 12d1-4 became effective January 19, 2021. Funds electing to rely on Rule 12d1-4 will have to comply with the rules by January 19, 2022.
In March 2020, FASB issued ASU 2020-04, Reference Rate Reform: Facilitation of the Effects of Reference Rate Reform on Financial Reporting. The main objective of the new guidance is to provide relief to companies that will be impacted by the expected change in benchmark interest rates at the end of 2021, when participating banks will no longer be required to submit London Interbank Offered Rate (“LIBOR”) quotes by the UK Financial Conduct Authority. The new guidance allows companies to, provided the only change to existing contracts are a change to an approved benchmark interest rate, account for modifications as a continuance of the existing contract without additional analysis. In addition, derivative contracts that qualified for hedge accounting prior to modification, will be allowed to continue to receive such treatment, even if critical terms change due to a change in the benchmark interest rate. For new and existing contracts, the Funds may elect to apply the amendments as of March 12, 2020 through December 31, 2022. Management is currently assessing the impact of the ASU’s adoption to the Funds’ financial statements and various filings.
Note 13 – Events Subsequent to the Fiscal Period End
The Funds have adopted financial reporting rules regarding subsequent events which require an entity to recognize in the financial statements the effects of all subsequent events that provide additional evidence about conditions that existed at the date of the balance sheet. Management has evaluated the Funds’ related events and transactions that occurred through the date of issuance of the Funds’ financial statements. There were no events or transactions that occurred during this period that materially impacted the amounts or disclosures in the Funds’ financial statements.
| 116 |
REPORT OF INDEPENDENT REGISTERED PUBLIC ACCOUNTING FIRM
To the Board of Trustees of Investment Managers Series Trust and
Shareholders of Aristotle Funds
Opinion on the Financial Statements
We have audited the accompanying statements of assets and liabilities of the Aristotle/Saul Global Equity Fund, Aristotle International Equity Fund, Aristotle Strategic Credit Fund, Aristotle Value Equity Fund, Aristotle Small Cap Equity Fund, and Aristotle Core Equity Fund (the “Funds”), each a series of Investment Managers Series Trust (the “Trust”), including the schedules of investments, as of December 31, 2021, the related statements of operations, the statements of changes in net assets and the financial highlights for each of the periods indicated in the table below, and the related notes (collectively referred to as the “financial statements”). In our opinion, the financial statements and financial highlights referred to above present fairly, in all material respects, the financial position of the Aristotle/Saul Global Equity Fund, Aristotle International Equity Fund, Aristotle Strategic Credit Fund, Aristotle Value Equity Fund, Aristotle Small Cap Equity Fund, and Aristotle Core Equity Fund as of December 31, 2021, the results of their operations, the changes in their net assets and their financial highlights for each of the periods indicated in the table below, in conformity with accounting principles generally accepted in the United States of America.
| Individual Funds constituting Aristotle Funds | Statement of operations | Statements of changes in net assets | Financial highlights |
| Aristotle/Saul Global Equity Fund, Aristotle International Equity Fund, Aristotle Strategic Credit Fund, Aristotle Value Equity Fund, Aristotle Small Cap Equity Fund | For the year ended December 31, 2021 | For each of the two years in the period ended December 31, 2021 | For each of the five years in the period ended December 31, 2021 |
| Aristotle Core Equity Fund | For the year ended December 31, 2021 | For each of the two years in the period ended December 31, 2021 | For each of the four years in the period ended December 31, 2021 and the period from March 31, 2017 (commencement of operations) through December 31, 2017 |
Basis for Opinion
These financial statements are the responsibility of the Funds’ management. Our responsibility is to express an opinion on the Funds’ financial statements based on our audits. We are a public accounting firm registered with the Public Company Accounting Oversight Board (United States) (“PCAOB”) and are required to be independent with respect to the Funds in accordance with the U.S. federal securities laws and the applicable rules and regulations of the Securities and Exchange Commission and the PCAOB. We have served as the auditor of one or more of the funds in the Trust since 2007.
| 117 |
To the Board of Trustees of Investment Managers Series Trust and
Shareholders of Aristotle Funds
We conducted our audits in accordance with the standards of the PCAOB. Those standards require that we plan and perform the audits to obtain reasonable assurance about whether the financial statements are free of material misstatement, whether due to error or fraud. The Funds are not required to have, nor were we engaged to perform, an audit of the Funds’ internal control over financial reporting. As part of our audits we are required to obtain an understanding of internal control over financial reporting, but not for the purpose of expressing an opinion on the effectiveness of the Funds’ internal control over financial reporting. Accordingly, we express no such opinion.
Our audits included performing procedures to assess the risks of material misstatement of the financial statements, whether due to error or fraud, and performing procedures that respond to those risks. Such procedures included examining, on a test basis, evidence regarding the amounts and disclosures in the financial statements. Our audits also included evaluating the accounting principles used and significant estimates made by management, as well as evaluating the overall presentation of the financial statements. Our procedures included confirmation of securities owned as of December 31, 2021 by correspondence with the custodian, brokers and other agent banks; when replies were not received, we performed other auditing procedures. We believe that our audits provide a reasonable basis for our opinion.
 | |
| TAIT, WELLER & BAKER LLP | |
| Philadelphia, Pennsylvania | |
| March 1, 2022 |
| 118 |
Aristotle Funds
SUPPLEMENTAL INFORMATION (Unaudited)
Qualified Dividend Income
Pursuant to Section 854 of the Internal Revenue Code of 1986, the Saul Global Equity, International Equity, Value Equity, Small Cap Equity, Core Equity and Strategic Credit Funds designate income dividends of 100%, 100%, 100%, 100%, 100% and 1.36%, respectively, as qualified dividend income paid during the period ended December 31, 2021.
Corporate Dividends Received Deduction
For the period ended December 31, 2021, 77.20%, 81.79%, 100%, 92.91% and 1.36% of the dividends paid from net investment income qualifies for the dividends received deduction available to corporate shareholders of the Saul Global Equity, Value Equity, Small Cap Equity, Core Equity and Strategic Credit Funds, respectively.
Long-Term Capital Gains Designation
For the period ended December 31, 2021, the Saul Global Equity, International Equity, Value Equity, Small Cap Equity and Core Equity Funds designate $1,677,486, $3,710,893, $10,888,325, $5,221,878 and $1,428,890, respectively, as a 20% rate gain distribution for purposes of the dividends paid deduction.
Trustees and Officers Information
Additional information about the Trustees is included in the Funds’ Statement of Additional Information which is available, without charge, upon request by calling (888) 661-6691. The Trustees and officers of the Funds and their principal occupations during the past five years are as follows:
| Name, Address, Year of Birth and Position(s) held with Trust | Term of Officec and Length of Time Served | Principal Occupation During the Past Five Years and Other Affiliations | Number of Portfolios in the Fund Complex Overseen by Trusteed | Other Directorships Held During the Past Five Years by Trusteee |
| Independent Trustee: | ||||
Charles H. Miller a (born 1947) Trustee | Since November 2007 | Retired (2013 – present). Executive Vice President, Client Management and Development, Access Data, a Broadridge company, a provider of technology and services to asset management firms (1997-2012). | 6 | 361 Social Infrastructure Fund, a closed-end investment company. |
Ashley Toomey Rabun a (born 1952) Trustee and Chairperson of the Board | Since November 2007 | Retired (2016 – present). President and Founder, InvestorReach, Inc., a financial services consulting firm (1996 – 2015). | 6 | 361 Social Infrastructure Fund, a closed-end investment company, Select Sector SPDR Trust, a registered investment company (includes 11 portfolios). |
William H. Young a (born 1950) Trustee
| Since November 2007 | Retired (2014 - present). Independent financial services consultant (1996 – 2014). Interim CEO, Unified Fund Services Inc. (now Huntington Fund Services), a mutual fund service provider (2003 – 2006). Senior Vice President, Oppenheimer Management Company (1983 – 1996). Chairman, NICSA, an investment management trade association (1993 – 1996). | 6 | 361 Social Infrastructure Fund, a closed-end investment company.
|
| 119 |
Aristotle Funds
SUPPLEMENTAL INFORMATION (Unaudited) - Continued
| Name, Address, Year of Birth and Position(s) held with Trust | Term of Officec and Length of Time Served | Principal Occupation During the Past Five Years and Other Affiliations | Number of Portfolios in the Fund Complex Overseen by Trusteed | Other Directorships Held During the Past Five Years by Trusteee |
John P. Zader ᵃ (born 1961) Trustee | Since November 2007 | Retired (June 2014 - present). CEO, UMB Fund Services, Inc., a mutual fund and hedge fund service provider, and the transfer agent, fund accountant, and co-administrator for the Fund (December 2006 - June 2014). President, Investment Managers Series Trust (December 2007 - June 2014). | 6 | Investment Managers Series Trust II, a registered investment company (includes 26 portfolios); 361 Social Infrastructure Fund, a closed-end investment company. |
| Interested Trustees: | ||||
Eric M. Banhazl b† (born 1957) Trustee | Since January 2008 | Chairman, Foothill Capital Management, LLC, a registered investment advisor (2018 – present); Chairman (2016 – present), and President (2006 – 2015), Mutual Fund Administration, LLC, co-administrator for the Fund. | 6 | Investment Managers Series Trust II, a registered investment company (includes 26 portfolios); 361 Social Infrastructure Fund, a closed-end investment company. |
Maureen Quill ᵃ* (born 1963) Trustee and President | Since June 2019 | President, Investment Managers Series Trust (June 2014 – present); President, UMB Distribution Services (March 2013 – present); EVP/Executive Director Registered Funds (January 2018 – present), Chief Operating Officer (June 2014 – January 2018), and Executive Vice President (January 2007 – June 2014), UMB Fund Services, Inc.; Vice President, Investment Managers Series Trust (December 2013 – June 2014). | 6 | 361 Social Infrastructure Fund, a closed-end investment company. |
| Officer of the Trust: | ||||
Rita Dam b (born 1966) Treasurer and Assistant Secretary | Since December 2007 | Co-Chief Executive Officer (2016 – present), and Vice President (2006 – 2015), Mutual Fund Administration, LLC; Co-President, Foothill Capital Management, LLC, a registered investment advisor (2018 – present); Treasurer, 361 Social Infrastructure Fund (December 2019 – January 2022). | N/A | N/A |
| 120 |
Aristotle Funds
SUPPLEMENTAL INFORMATION (Unaudited) - Continued
| Officers of the Trust: | ||||
Joy Ausili b (born 1966) Vice President, Assistant Secretary and Assistant Treasurer | Since March 2016 | Co-Chief Executive Officer (2016 – present), and Vice President (2006 – 2015), Mutual Fund Administration, LLC; Co-President, Foothill Capital Management, LLC, a registered investment advisor (2018 – present); Vice President and Assistant Secretary, 361 Social Infrastructure Fund (December 2019 – January 2022); Secretary and Assistant Treasurer, Investment Managers Series Trust (December 2007 – March 2016). | N/A | N/A |
Diane Drakeb (born 1967) Secretary | Since March 2016 | Senior Counsel, Mutual Fund Administration, LLC (October 2015 – present); Secretary, 361 Social Infrastructure Fund (December 2019 – January 2022); Chief Compliance Officer, Foothill Capital Management, LLC, a registered investment advisor (2018 – 2019). | N/A | N/A |
Martin Dziura b (born 1959) Chief Compliance Officer | Since June 2014 | Principal, Dziura Compliance Consulting, LLC (October 2014 – present); Managing Director, Cipperman Compliance Services (2010 – September 2014); Chief Compliance Officer, Hanlon Investment Management (2009 – 2010); Vice President − Compliance, Morgan Stanley Investment Management (2000 − 2009). | N/A | N/A |
| a | Address for certain Trustees and certain officers: 235 West Galena Street, Milwaukee, Wisconsin 53212. |
| b | Address for Mr. Banhazl, Ms. Ausili, Ms. Dam and Ms. Drake: 2220 E. Route 66, Suite 226, Glendora, California 91740. Address for Mr. Dziura: 309 Woodridge Lane, Media, Pennsylvania 19063. |
| c | Trustees and officers serve until their successors have been duly elected. |
| d | The Trust is comprised of 53 series managed by unaffiliated investment advisors. The term “Fund Complex” applies only to the Funds managed by the same investment advisor. The Funds do not hold themselves out as related to any other series within the Trust, for purposes of investment and investor services, nor do they share the same investment advisor with any other series. |
| e | “Other Directorships Held” includes only directorships of companies required to register or file reports with the SEC under the Securities Exchange Act of 1934, as amended (that is, “public companies”) or other investment companies registered under the 1940 Act. |
| † | Mr. Banhazl is an “interested person” of the Trust by virtue of his position with Mutual Fund Administration, LLC. |
| * | Ms. Quill is an “interested person” of the Trust by virtue of her position with UMB Fund Services, Inc. |
| 121 |
Aristotle Funds
SUPPLEMENTAL INFORMATION (Unaudited) - Continued
Board Consideration of Investment Advisory Agreements
At an in-person meeting held on December 8-9, 2021, the Board of Trustees (the “Board”) of Investment Managers Series Trust (the “Trust”), including the trustees who are not “interested persons” of the Trust (the “Independent Trustees”) as defined in the Investment Company Act of 1940, as amended (the “1940 Act”), reviewed and unanimously approved the renewal of the investment advisory agreements (the “Advisory Agreements”), for an additional one-year term from when they otherwise would expire, between the Trust and each of:
| • | Aristotle Capital Management, LLC (“Aristotle Capital”) with respect to the Aristotle/Saul Global Equity Fund (the “Saul Global Equity Fund”), the Aristotle International Equity Fund (the “International Equity Fund”), and the Aristotle Value Equity Fund (the “Value Equity Fund” and together with the Saul Global Equity Fund and International Equity Fund, the “Aristotle Capital Funds”) series of the Trust; |
| • | Aristotle Atlantic Partners, LLC (“Aristotle Atlantic”) with respect to the Aristotle Core Equity Fund (the “Core Equity Fund”) series of the Trust; |
| • | Aristotle Credit Partners, LLC (“Aristotle Credit”) with respect to the Aristotle Strategic Credit Fund (the “Strategic Credit Fund”) series of the Trust; and |
| • | Aristotle Capital Boston, LLC (“Aristotle Boston”) with respect to the Aristotle Small Cap Equity Fund (the “Small Cap Equity Fund”) series of the Trust. |
In approving renewal of each Advisory Agreement, the Board, including the Independent Trustees, determined that such renewal was in the best interests of each Fund and its shareholders, as applicable. Each of Aristotle Capital, Aristotle Atlantic, Aristotle Credit, and Aristotle Boston may be referred to below as an “Investment Advisor.” Each of the Saul Global Equity Fund, International Equity Fund, Value Equity Fund, Core Equity Fund, Strategic Credit Fund, and Small Cap Equity Fund may be referred to below as a “Fund” and together as, the “Funds.”
Background
In advance of the meeting, the Board received information about each Fund and Advisory Agreement from the relevant Investment Advisor and from Mutual Fund Administration, LLC and UMB Fund Services, Inc., the Trust’s co-administrators, certain portions of which are discussed below. The materials, among other things, included information about each Investment Advisor’s organization and financial condition; information regarding the background, experience, and compensation structure of relevant personnel providing services to the Funds; information about each Investment Advisor’s compliance policies and procedures, disaster recovery and contingency planning, and policies with respect to portfolio execution and trading; information regarding the profitability of each Investment Advisor’s overall relationship with the relevant Funds; reports comparing the performance of each Fund with returns of its benchmark index and a group of comparable funds (each a “Peer Group”) selected by Broadridge Financial Solutions, Inc. (“Broadridge”) from Morningstar, Inc.’s relevant fund universe (each a “Fund Universe”) for various periods ended September 30, 2021; and reports comparing the investment advisory fee and total expenses of each Fund with those of its Peer Group and Fund Universe. The Board also received a memorandum from legal counsel to the Trust discussing the legal standards under the 1940 Act and other applicable law for their consideration of the proposed renewal of each Advisory Agreement. In addition, the Board considered information reviewed by the Board during the year at other Board and Board committee meetings. No representatives of the Investment Advisors were present during the Board’s consideration of the Advisory Agreements, and the Independent Trustees were represented by their legal counsel with respect to the matters considered.
In renewing each Advisory Agreement, the Board and the Independent Trustees considered a variety of factors, including those discussed below. In their deliberations, the Board and the Independent Trustees did not identify any particular factor that was controlling, and each Trustee may have attributed different weights to the various factors.
| 122 |
Aristotle Funds
SUPPLEMENTAL INFORMATION (Unaudited) - Continued
Aristotle/Saul Global Equity Fund, Aristotle International Equity Fund, and Aristotle Value Equity Fund
Aristotle Capital Management, LLC
Nature, Extent and Quality of Services
The Board considered information included in the meeting materials regarding the performance of each Aristotle Capital Fund. The materials they reviewed indicated the following:
| • | The Saul Global Equity Fund’s annualized total returns for the one- and three-year periods were above the Peer Group and World Large-Stock Blend Fund Universe median returns, the MSCI All Country World Index (net) returns, and the MSCI World Index (net) returns. The Fund’s annualized total return for the five-year period was above the Peer Group median return, but below the Fund Universe median return, the MSCI All Country World Index (net) return, and the MSCI World Index (net) return by 0.29%, 1.43%, and 1.97%, respectively. The Trustees considered Aristotle Capital’s explanation that the Fund’s underperformance over the five-year period was due mainly to the Fund’s general portfolio positioning, including specific security selection as well as sector and country allocation. |
| • | The International Equity Fund’s annualized total returns for the one- and five-year periods were above the Peer Group and Foreign Large Blend Fund Universe median returns and the MSCI EAFE Index (net) returns. The Fund’s annualized total return for the three-year period was above the MSCI EAFE Index (net) return and the Fund Universe median return, but slightly below the Peer Group median return by 0.02%. The Trustees noted Aristotle Capital’s belief that the Fund’s underperformance was due mainly to security selection and regional allocation differences relative to the funds in the Peer Group. |
| • | The Value Equity Fund’s annualized total return for the three-year period was above the Peer Group and Large Blend Fund Universe median returns and the Russell 1000 Value Index return, but below the S&P 500 Index return by 0.72%. For the one-year period, the Fund’s total return was above the Peer Group and Fund Universe median returns and the S&P 500 Index return, but below the Russell 1000 Value Index return by 1.15%. The Fund’s annualized total return for the five-year period was above the Peer Group median return and the Russell 1000 Value Index return, but below the Fund Universe median return and the S&P 500 Index return by 0.16% and 1.54%, respectively. The Trustees considered Aristotle Capital’s belief that Morningstar’s Large Value fund universe is more appropriate than the Fund’s current Fund Universe because the Fund employs a value-driven strategy. The Trustees also noted Aristotle Capital’s observation that the Fund’s underperformance relative to the S&P 500 Index was due primarily to the fact that the Index has a more pronounced growth tilt, and that growth stocks generally outperformed value stocks over the three- and five-year periods. |
The Board considered the overall quality of services provided by Aristotle Capital to the Aristotle Capital Funds. In doing so, the Board considered Aristotle Capital’s specific responsibilities in day-to-day management and oversight of the Funds, as well as the qualifications, experience, and responsibilities of the personnel involved in the activities of the Funds. The Board also considered the overall quality of the organization and operations of Aristotle Capital, as well as its compliance structure. The Board and the Independent Trustees concluded that based on the various factors they had reviewed, the nature, overall quality, and extent of the management and oversight services provided by Aristotle Capital to each Fund were satisfactory.
Advisory Fees and Expense Ratios
With respect to the advisory fees and expenses paid by the Aristotle Capital Funds, the meeting materials indicated the following:
| • | The Saul Global Equity Fund’s annual investment advisory fee (gross of fee waivers) was lower than the Peer Group median and the same as the World Large-Stock Blend Fund Universe median. The Trustees considered that the Fund’s advisory fee is the same as or higher than Aristotle Capital’s standard fee schedule to manage pension funds and institutional separate accounts using similar objectives and policies as the Fund. The Trustees observed, however, that management of mutual fund assets requires compliance with certain requirements under the 1940 Act that do not apply to the pension funds and institutional separate accounts that Aristotle Capital manages. The Trustees also noted Aristotle Capital’s assertion that relative to pension funds and institutional separate accounts, the Fund places higher demands on Aristotle Capital’s investment personnel and trading infrastructure because of the Fund’s daily cash inflows and outflows. The Trustees also noted that the Fund’s advisory fee was within the range of advisory fees paid by other series of the Trust managed by Aristotle Capital. |
| 123 |
Aristotle Funds
SUPPLEMENTAL INFORMATION (Unaudited) - Continued
The annual total expenses paid by the Fund (net of fee waivers) for the Fund’s most recent fiscal year were lower than the Peer Group and Fund Universe medians.
| • | The International Equity Fund���s annual investment advisory fee (gross of fee waivers) was lower than the Peer Group and Foreign Large Blend Fund Universe medians. The Trustees considered that the Fund’s advisory fee is the same as or higher than the standard fee that Aristotle Capital charges to manage pension funds and institutional separate accounts using the same strategy as the Fund. The Trustees observed, however, that management of mutual fund assets requires compliance with certain requirements under the 1940 Act that do not apply to the pension funds and institutional separate accounts that Aristotle Capital manages. The Trustees also noted Aristotle Capital’s assertion that relative to pension funds and institutional separate accounts, the Fund places higher demands on Aristotle Capital’s investment personnel and trading infrastructure because of the Fund’s daily cash inflows and outflows. The Trustees also considered that the Fund’s advisory fee was within the range of advisory fees paid by other series of the Trust managed by Aristotle Capital. |
The annual total expenses paid by the Fund (net of fee waivers) for the Fund’s most recent fiscal year were lower than the Peer Group and Fund Universe medians.
| • | The Value Equity Fund’s annual investment advisory fee (gross of fee waivers) was lower than the Peer Group median, but slightly higher than the Large Blend Fund Universe median by 0.0275%. The Trustees noted that the Fund’s advisory fee is lower than the standard fee that Aristotle Capital charges to manage pension funds and institutional separate accounts using the same strategy as the Fund up to the $25 million level, and greater than Aristotle Capital’s fee for those clients above that level. The Trustees observed, however, that management of mutual fund assets requires compliance with certain requirements under the 1940 Act that do not apply to the pension funds and institutional separate accounts that Aristotle Capital manages. The Trustees considered Aristotle Capital’s assertion that relative to pension funds and institutional separate accounts, the Fund places higher demands on Aristotle Capital’s investment personnel and trading infrastructure because of the Fund’s daily cash inflows and outflows. The Trustees also noted that the Fund’s advisory fee was lower than the advisory fees paid by other series of the Trust managed by Aristotle Capital. |
The annual total expenses paid by the Fund (net of fee waivers) for the Fund’s most recent fiscal year were lower than the Peer Group median, but slightly higher than the Fund Universe median by 0.01%. The Trustees noted, however, that the average net assets of the Fund were lower than the average net assets of corresponding classes of funds in the Fund Universe, and that certain of those other funds also had significant assets in other classes.
The Board and the Independent Trustees concluded that based on the factors they had reviewed, the compensation payable to Aristotle Capital under the Advisory Agreement was fair and reasonable in light of the nature and quality of the services Aristotle Capital provides to the Aristotle Capital Funds.
Profitability and Economies of Scale
The Board next considered information prepared by Aristotle Capital relating to its costs and profits with respect to each Aristotle Capital Fund for the year ended September 30, 2021, noting that Aristotle Capital had waived a significant portion of its advisory fee for the Saul Global Equity Fund, and had waived a portion of its advisory fee for each of the International Equity Fund and Value Equity Fund. Recognizing the difficulty in evaluating an investment advisor’s profitability with respect to the funds it manages in the context of an advisor with multiple lines of business, and noting that other profitability methodologies might also be reasonable, the Board and the Independent Trustees concluded that the profits of Aristotle Capital from its relationship with the Aristotle Capital Funds were reasonable.
| 124 |
Aristotle Funds
SUPPLEMENTAL INFORMATION (Unaudited) - Continued
The Board considered the benefits received by Aristotle Capital as a result of its relationship with the Aristotle Capital Funds, other than the receipt of its advisory fees, including the beneficial effects from the review by the Trust’s Chief Compliance Officer of Aristotle Capital’s compliance program, and the intangible benefits of Aristotle Capital’s association with the Funds generally and any favorable publicity arising in connection with the Funds’ performance. The Board also considered Aristotle Capital’s observation that its relationship with the Aristotle Capital Funds has resulted in improved investment processes and internal controls for operations, trading, and compliance; improved trade execution; and increased access to research and company management teams. The Board noted that although there were no advisory fee breakpoints, the asset levels of the Funds were not currently likely to lead to significant economies of scale, and that any such economies would be considered in the future as the Funds’ assets grow.
Conclusion
Based on these and other factors, the Board and the Independent Trustees concluded that renewal of the Advisory Agreement with Aristotle Capital was in the best interests of each Aristotle Capital Fund and its shareholders and, accordingly, approved the renewal of the Advisory Agreement with respect to each Fund.
Aristotle Core Equity Fund
Aristotle Atlantic Partners, LLC
Nature, Extent and Quality of Services
With respect to the performance results of the Core Equity Fund, the meeting materials indicated that the total return for the one-year period was above the Peer Group and Large Growth Fund Universe median returns, but below the S&P 500 Index return by 0.91%. The Fund’s annualized total return for the three-year period was above the S&P 500 Index return, but below the Peer Group and Fund Universe median returns by 0.83% and 3.00%, respectively. The Trustees considered Aristotle Atlantic’s belief that Morningstar’s Large Blend fund universe is more appropriate than the Fund’s current Fund Universe because the Fund’s strategy blends both value and growth components. The Trustees also noted Aristotle Atlantic’s assertion that the Fund’s underperformance relative to the Peer Group was due primarily to the Peer Group being composed of funds with growth portfolios, and that growth stocks generally outperformed value stocks over the three-year period, while the Fund’s investment style is more similar to that of core portfolios.
The Board considered the overall quality of services provided by Aristotle Atlantic to the Core Equity Fund. In doing so, the Board considered Aristotle Atlantic’s specific responsibilities in day-to-day management and oversight of the Core Equity Fund, as well as the qualifications, experience, and responsibilities of the personnel involved in the activities of the Fund. The Board also considered the overall quality of the organization and operations of Aristotle Atlantic, as well as its compliance structure. The Board and the Independent Trustees concluded that based on the various factors they had reviewed, the nature, overall quality, and extent of the management and oversight services provided by Aristotle Atlantic to the Core Equity Fund were satisfactory.
Advisory Fee and Expense Ratio
With respect to the advisory fee and expenses paid by the Core Equity Fund, the meeting materials indicated that the annual investment advisory fee (gross of fee waivers) was lower than the Peer Group and Fund Universe medians. The Trustees considered that the Fund’s advisory fee is lower than or the same as the fee that Aristotle Atlantic charges to manage institutional separate accounts using the same strategy as the Fund up to the $300 million level, and greater than Aristotle Atlantic’s fee for those clients above that level. The Trustees observed, however, that management of mutual fund assets requires compliance with certain requirements under the 1940 Act that do not apply to Aristotle Atlantic’s institutional clients. The annual total expenses paid by the Fund (net of fee waivers) for the Fund’s most recent fiscal year were lower than the Peer Group and Fund Universe medians.
The Board and the Independent Trustees concluded that based on the factors they had reviewed, the compensation payable to Aristotle Atlantic under the Advisory Agreement was fair and reasonable in light of the nature and quality of the services Aristotle Atlantic provides to the Core Equity Fund.
| 125 |
Aristotle Funds
SUPPLEMENTAL INFORMATION (Unaudited) - Continued
Profitability and Economies of Scale
The Board next considered information prepared by Aristotle Atlantic relating to its costs and profits with respect to the Core Equity Fund for the year ended September 30, 2021, noting that Aristotle Atlantic had waived a significant portion of its advisory fee for the Fund. Recognizing the difficulty in evaluating an investment advisor’s profitability with respect to the funds it manages in the context of an advisor with multiple lines of business, and noting that other profitability methodologies might also be reasonable, the Board and the Independent Trustees concluded that the profit of Aristotle Atlantic from its relationship with the Fund was reasonable.
The Board considered the benefits received by Aristotle Atlantic as a result of its relationship with the Core Equity Fund, other than the receipt of its advisory fee, including the beneficial effects from the review by the Trust’s Chief Compliance Officer of Aristotle Atlantic’s compliance program, and the intangible benefits of Aristotle Atlantic’s association with the Fund generally and any favorable publicity arising in connection with the Fund’s performance. The Board also considered Aristotle Atlantic’s observation that its relationship with the Core Equity Fund has resulted in improved investment processes and internal controls for operations, trading, and compliance; improved trade execution; and increased access to research and company management teams. The Board noted that although there were no advisory fee breakpoints, the asset level of the Core Equity Fund was not currently likely to lead to significant economies of scale, and that any such economies would be considered in the future as the assets of the Fund grow.
Conclusion
Based on these and other factors, the Board and the Independent Trustees concluded that renewal of the Advisory Agreement with Aristotle Atlantic was in the best interests of the Core Equity Fund and its shareholders and, accordingly, approved the renewal of the Advisory Agreement.
Aristotle Strategic Credit Fund
Aristotle Credit Partners, LLC
Nature, Extent and Quality of Services
With respect to the performance results of the Strategic Credit Fund, the meeting materials indicated that the annualized total return for the three-year period was above the return of a custom benchmark consisting of 1/3 Bloomberg Intermediate Corporate Index, 1/3 Bloomberg U.S. High Yield Ba/B 2% Issuer Cap Index, and 1/3 Credit Suisse Leveraged Loan Index (the “Blended Index”), but below the High Yield Bond Fund Universe and Peer Group median returns, and the Bloomberg U.S. High Yield Ba/B2% Issuer Cap Index return by 0.20%, 0.22%, and 1.47%, respectively. For the five-year period, the Fund’s annualized total return was the same as the Blended Index return, but was below the Fund Universe and Peer Group median returns and the Bloomberg U.S. High Yield Ba/B2% Issuer Cap Index return by 0.88%, 0.89%, and 1.48%, respectively. The Fund’s total return for the one-year period was below the Blended Index return by 0.94%, the Bloomberg U.S. High Yield Ba/B2% Issuer Cap Index return by 4.27%, the Fund Universe median return by 5.34%, and the Peer Group median return by 6.41%. The Trustees considered Aristotle Credit’s belief that the Fund’s underperformance relative to the Bloomberg U.S. High Yield Ba/B2% Issuer Cap Index, Peer Group, and Fund Universe over the applicable periods was due to the Fund’s allocation to investment grade corporate bonds and bank loans, which generally underperformed relative to high yield bonds during the periods.
The Board considered the overall quality of services provided by Aristotle Credit to the Strategic Credit Fund. In doing so, the Board considered Aristotle Credit’s specific responsibilities in day-to-day management and oversight of the Strategic Credit Fund, as well as the qualifications, experience, and responsibilities of the personnel involved in the activities of the Fund. The Board also considered the overall quality of the organization and operations of Aristotle Credit, as well as its compliance structure. The Board and the Independent Trustees concluded that based on the various factors they had reviewed, the nature, overall quality, and extent of the management and oversight services provided by Aristotle Credit to the Strategic Credit Fund were satisfactory.
Advisory Fee and Expense Ratio
With respect to the advisory fee and total expenses paid by the Strategic Credit Fund, the meeting materials indicated that the annual investment advisory fee (gross of fee waivers) was lower than the Peer Group and Fund Universe medians. The Trustees noted that the Fund’s advisory fee is lower than Aristotle Credit’s standard fee schedule for managing institutional accounts using the same strategy as the Fund. The annual total expenses paid by the Fund (net of fee waivers) for the Fund’s most recent fiscal year were below the Peer Group and Fund Universe medians.
| 126 |
Aristotle Funds
SUPPLEMENTAL INFORMATION (Unaudited) - Continued
The Board and the Independent Trustees concluded that based on the factors they had reviewed, the compensation payable to Aristotle Credit under the Advisory Agreement was fair and reasonable in light of the nature and quality of the services Aristotle Credit provides to the Strategic Credit Fund.
Profitability and Economies of Scale
The Board next considered information prepared by Aristotle Credit relating to its costs and profits with respect to the Strategic Credit Fund for the year ended September 30, 2021. The Board noted that Aristotle Credit had waived its entire advisory fee and subsidized certain of the operating expenses for the Strategic Credit Fund, and that Aristotle Credit had not realized a profit with respect to the Fund.
The Board considered the benefits received by Aristotle Credit as a result of its relationship with the Strategic Credit Fund, other than the receipt of its advisory fee, including the beneficial effects from the review by the Trust’s Chief Compliance Officer of Aristotle Credit’s compliance program, and the intangible benefits of Aristotle Credit’s association with the Strategic Credit Fund generally and any favorable publicity arising in connection with the Fund’s performance. The Board also considered Aristotle Credit’s observation that its relationship with the Strategic Credit Fund has resulted in improved investment processes and internal controls for operations, trading, and compliance; improved trade execution; and increased access to research and company management teams. The Board noted that although there were no advisory fee breakpoints, the asset level of the Strategic Credit Fund was not currently likely to lead to significant economies of scale, and that any such economies would be considered in the future as the assets of the Fund grow.
Conclusion
Based on these and other factors, the Board and the Independent Trustees concluded that renewal of the Advisory Agreement with Aristotle Credit was in the best interests of the Strategic Credit Fund and its shareholders and, accordingly, approved the renewal of the Advisory Agreement.
Aristotle Small Cap Equity Fund
Aristotle Capital Boston, LLC
Nature, Extent and Quality of Services
With respect to the performance results of the Small Cap Equity Fund, the meeting materials indicated that the annualized total return for the five-year period was below the Peer Group and Small Blend Fund Universe median returns and the Russell 2000 Index return by 0.28%, 0.76%, and 2.07%, respectively. For the one-year period, the Fund’s total return was below the Peer Group median return by 0.57%, the Russell 2000 Index return by 1.00%, and the Fund Universe median return by 2.81%. The Fund’s annualized total return for the three-year period was below the Peer Group and Fund Universe median returns and the Russell 2000 Index return by 3.27%, 3.35%, and 4.32%, respectively. The Trustees considered Aristotle Boston’s assertion that the Fund’s portfolio is a blend of both value and growth stocks, and that the Fund’s underperformance relative to the Peer Group was due in part to the fact that several of the funds in the Peer Group have a growth-oriented focus and growth stocks have generally outperformed value stocks over the three- and five-year periods. The Trustees also noted Aristotle Boston’s observation that the Fund’s underperformance relative to the Russell 2000 Index was primarily driven by security selection in the information technology and industrials sectors.
The Board considered the overall quality of services provided by Aristotle Boston to the Small Cap Equity Fund. In doing so, the Board considered Aristotle Boston’s specific responsibilities in day-to-day management and oversight of the Small Cap Equity Fund, as well as the qualifications, experience, and responsibilities of the personnel involved in the activities of the Fund. The Board also considered the overall quality of the organization and operations of Aristotle Boston, as well as its compliance structure. The Board and the Independent Trustees concluded that based on the various factors they had reviewed, the nature, overall quality, and extent of the management and oversight services provided by Aristotle Boston to the Small Cap Equity Fund were satisfactory.
| 127 |
Aristotle Funds
SUPPLEMENTAL INFORMATION (Unaudited) - Continued
Advisory Fee and Expense Ratio
With respect to the advisory fee and expenses paid by the Small Cap Equity Fund, the meeting materials indicated that the annual investment advisory fee (gross of fee waivers) was the same as the Peer Group and Fund Universe medians. The Trustees considered that the Fund’s advisory fee is lower than the standard fee that Aristotle Boston charges to manage pension funds and institutional separate accounts using the same strategy as the Fund up to the $100 million level, and potentially greater than Aristotle Boston’s fee for those clients above that level. The Trustees observed, however, that management of mutual fund assets requires compliance with certain requirements under the 1940 Act that do not apply to the pension funds and institutional separate accounts that Aristotle Boston manages. The annual total expenses paid by the Fund (net of fee waivers) for the Fund’s most recent fiscal year were lower than the Peer Group and Fund Universe medians.
The Board and the Independent Trustees concluded that based on the factors they had reviewed, the compensation payable to Aristotle Boston under the Advisory Agreement was fair and reasonable in light of the nature and quality of the services Aristotle Boston provides to the Small Cap Equity Fund.
Profitability and Economies of Scale
The Board next considered information prepared by Aristotle Boston relating to its costs and profits with respect to the Small Cap Equity Fund for the year ended September 30, 2021, noting that Aristotle Boston had waived a portion of its advisory fee for the Fund. Recognizing the difficulty in evaluating an investment advisor’s profitability with respect to the funds it manages in the context of an advisor with multiple lines of business, and noting that other profitability methodologies might also be reasonable, the Board and the Independent Trustees concluded that the profit of Aristotle Boston from its relationship with the Small Cap Equity Fund was reasonable.
The Board considered the benefits received by Aristotle Boston as a result of its relationship with the Small Cap Equity Fund, other than the receipt of its advisory fee, including the beneficial effects from the review by the Trust’s Chief Compliance Officer of Aristotle Boston’s compliance program, and the intangible benefits of Aristotle Boston’s association with the Fund generally and any favorable publicity arising in connection with the Fund’s performance. The Board also considered Aristotle Boston’s observation that its relationship with the Small Cap Equity Fund has resulted in improved investment processes and internal controls for operations, trading, and compliance; improved trade execution; and increased access to research and company management teams. The Board noted that although there were no advisory fee breakpoints, the asset level of the Small Cap Equity Fund was not currently likely to lead to significant economies of scale, and that any such economies would be considered in the future as the assets of the Fund grow.
Conclusion
Based on these and other factors, the Board and the Independent Trustees concluded that renewal of the Advisory Agreement with Aristotle Boston was in the best interests of the Small Cap Equity Fund and its shareholders and, accordingly, approved the renewal of the Advisory Agreement.
| 128 |
Aristotle Funds
SUPPLEMENTAL INFORMATION (Unaudited) - Continued
Statement Regarding Liquidity Risk Management Program
The Securities and Exchange Commission adopted Rule 22e-4 under the Investment Company Act of 1940, as amended (the “Liquidity Rule”), to promote effective liquidity risk management throughout the open-end investment company industry, thereby reducing the risk that funds will be unable to meet their redemption obligations and mitigating dilution of the interests of fund shareholders.
The Board of Trustees (the “Board”) of Investment Managers Series Trust (the “Trust”) met on December 8-9, 2021 (the “Meeting”), to review the liquidity risk management programs (each, a “Fund Program” and together, the “Fund Program”) applicable to the following series of the Trust (each, a “Fund” and together, the “Funds”) pursuant to the Liquidity Rule:
| Fund | Program Administrator |
| Aristotle International Equity Fund Aristotle/Saul Global Equity Fund Aristotle Value Equity Fund | Aristotle Capital Management, LLC |
| Aristotle Core Equity Fund | Aristotle Atlantic Partners, LLC |
| Aristotle Small Cap Equity Fund | Aristotle Capital Boston, LLC |
| Aristotle Strategic Credit Fund | Aristotle Credit Partners, LLC |
The Board has appointed the investment advisers to the Funds listed above, as the program administrators (“Program Administrators”) for each Fund Program. Under the Trust’s liquidity risk management program (the “Trust Program”), the Board has delegated oversight of the Trust Program to the Liquidity Oversight Committee (the “Oversight Committee”). At the Meeting, the Oversight Committee, on behalf of Program Administrators and the Funds, provided the Board with written reports (the “Report”) that addressed the operation, adequacy, and effectiveness of implementation of each Fund Program, and any material changes to it for the period from October 1, 2020 through September 30, 2021 (the “Program Reporting Period”).
In assessing the adequacy and effectiveness of implementation of the Fund Programs, the Report discussed the following, among other things:
| · | Each Fund Program’s liquidity classification methodology for categorizing each Fund’s investments; |
| · | An overview of market liquidity for each Fund during the Program Reporting Period; |
| · | Each Fund’s ability to meet redemption requests; |
| · | Each Fund’s cash management; |
| · | Each Fund’s borrowing activity, if any, in order to meet redemption requests; |
| · | Each Fund’s compliance with the 15% limit of illiquid investments; and |
| · | Each Fund’s status as a primarily highly liquid fund (“PHLF”), the effectiveness of the implementation of the PHLF standard, and whether it would be appropriate for each Fund to adopt a highly liquid investment minimum (“HLIM”). |
The Report stated that the Funds primarily hold assets that are defined under the Liquidity Rule as "highly liquid investments," and therefore each Fund is not required to establish an HLIM. Highly liquid investments are defined as cash and any investment reasonably expected to be convertible to cash in current market conditions in three business days or less without the conversion to cash significantly changing the market value of the investment. The Report also stated that there were no material changes made to the Fund Programs during the Program Reporting Period.
In the Report, each Program Administrator concluded that (i) the Fund Program, as adopted and implemented, remains reasonably designed to assess and manage each Fund’s liquidity risk; (ii) each Fund continues to qualify as a PHLF and therefore is not required to adopt an HLIM; (iii) during the Program Reporting Period, each Fund was able to meet redemption requests without significant dilution of remaining investors’ interests; and (iv) there were no weaknesses in the design or implementation of the Fund Program during the Program Reporting Period.
| 129 |
Aristotle Funds
SUPPLEMENTAL INFORMATION (Unaudited) - Continued
There can be no assurance that each Fund Program will achieve its objectives in the future. Please refer to the Funds’ prospectus for more information regarding each Fund’s exposure to liquidity risk and other principal risks to which an investment in the Funds may be subject.
| 130 |
Aristotle Funds
EXPENSE EXAMPLES
For the Six Months Ended December 31, 2021 (Unaudited)
Expense Examples
As a shareholder of the Funds, you incur two types of costs: (1) transaction costs, and (2) ongoing costs, including management fees and other Fund expenses. The examples below are intended to help you understand your ongoing costs (in dollars) of investing in the Funds and to compare these costs with the ongoing costs of investing in other mutual funds.
These examples are based on an investment of $1,000 invested at the beginning of the period and held for the entire period from July 1, 2021 to December 31, 2021.
Actual Expenses
The information in the row titled “Actual Performance” of the table below provides actual account values and actual expenses. You may use the information in these columns, together with the amount you invested, to estimate the expenses that you paid over the period. Simply divide your account value by $1,000 (for example, an $8,600 account value divided by $1,000 = 8.6), then multiply the result by the number in the appropriate row under the column titled “Expenses Paid During Period” to estimate the expenses you paid on your account during this period.
Hypothetical Example for Comparison Purposes
The information in the row titled “Hypothetical (5% annual return before expenses)” of the table below provides hypothetical account values and hypothetical expenses based on the Fund’s actual expense ratios and an assumed rate of return of 5% per year before expenses, which is not the Fund’s actual return. The hypothetical account values and expenses may not be used to estimate the actual ending account balance or expenses you paid for the period. You may use this information to compare the ongoing costs of investing in the Fund and other funds. To do so, compare these 5% hypothetical examples with the 5% hypothetical examples that appear in the shareholder reports of the other funds.
Please note that the expenses shown in the table are meant to highlight your ongoing costs only and do not reflect any transaction costs, such as sales charges (load) or contingent deferred sales charges. Therefore, the information in the row titled “Hypothetical (5% annual return before expenses)” is useful in comparing ongoing costs only, and will not help you determine the relative total costs of owning different funds. In addition, if these transactional costs were included, your costs would have been higher.
| Global Equity Fund | Beginning Account Value | Ending Account Value | Expenses Paid During Period* |
| 7/1/21 | 12/31/21 | 7/1/21 – 12/31/21 | |
| Actual Performance | $ 1,000.00 | $ 1,062.70 | $ 4.16 |
| Hypothetical (5% annual return before expenses) | 1,000.00 | 1,021.17 | 4.08 |
| * | Expenses are equal to the Fund’s annualized expense ratio of 0.80%, multiplied by the average account value over the period, multiplied by 184/365 (to reflect the six-month period). The expense ratios reflect an expense waiver. Assumes all dividends and distributions were reinvested. |
| 131 |
Aristotle Funds
EXPENSE EXAMPLES - Continued
For the Six Months Ended December 31, 2021 (Unaudited)
| International Equity Fund | Beginning Account Value | Ending Account Value | Expenses Paid During Period* |
| 7/1/21 | 12/31/21 | 7/1/21 – 12/31/21 | |
| Actual Performance | $ 1,000.00 | $ 1,059.40 | $ 4.15 |
| Hypothetical (5% annual return before expenses) | 1,000.00 | 1,021.17 | 4.08 |
| * | Expenses are equal to the Fund’s annualized expense ratio of 0.80%, multiplied by the average account value over the period, multiplied by 184/365 (to reflect the six-month period). The expense ratios reflect an expense waiver. Assumes all dividends and distributions were reinvested. |
| Strategic Credit Fund | Beginning Account Value | Ending Account Value | Expenses Paid During Period* |
| 7/1/21 | 12/31/21 | 7/1/21 – 12/31/21 | |
| Actual Performance | $ 1,000.00 | $ 1,009.20 | $ 3.14 |
| Hypothetical (5% annual return before expenses) | 1,000.00 | 1,022.08 | 3.16 |
| * | Expenses are equal to the Fund’s annualized expense ratio of 0.62%, multiplied by the average account value over the period, multiplied by 184/365 (to reflect the six-month period). The expense ratios reflect an expense waiver. Assumes all dividends and distributions were reinvested. |
| Value Equity Fund | Beginning Account Value | Ending Account Value | Expenses Paid During Period* |
| 7/1/21 | 12/31/21 | 7/1/21-12/31/21 | |
| Actual Performance | $ 1,000.00 | $ 1,070.80 | $ 3.60 |
| Hypothetical (5% annual return before expenses) | 1,000.00 | 1,021.73 | 3.52 |
| * | Expenses are equal to the Fund’s annualized expense ratio of 0.69%, multiplied by the average account value over the period, multiplied by 184/365 (to reflect the six-month period). The expense ratios reflect an expense waiver. Assumes all dividends and distributions were reinvested. |
| 132 |
Aristotle Funds
EXPENSE EXAMPLES - Continued
For the Six Months Ended December 31, 2021 (Unaudited)
| Small Cap Equity Fund | Beginning Account Value | Ending Account Value | Expenses Paid During Period* |
| 7/1/21 | 12/31/21 | 7/1/21 – 12/31/21 | |
| Actual Performance | $ 1,000.00 | $ 1,024.40 | $ 4.59 |
| Hypothetical (5% annual return before expenses) | 1,000.00 | 1,020.67 | 4.58 |
| * | Expenses are equal to the Fund’s annualized expense ratio of 0.90%, multiplied by the average account value over the period, multiplied by 184/365 (to reflect the six-month period). The expense ratios reflect an expense waiver. Assumes all dividends and distributions were reinvested. |
| Core Equity Fund | Beginning Account Value | Ending Account Value | Expenses Paid During Period* |
| 7/1/21 | 12/31/21 | 7/1/21 – 12/31/21 | |
| Actual Performance | $ 1,000.00 | $ 1,107.60 | $ 3.45 |
| Hypothetical (5% annual return before expenses) | 1,000.00 | 1,021.93 | 3.31 |
| * | Expenses are equal to the Fund’s annualized expense ratio of 0.65%, multiplied by the average account value over the period, multiplied by 184/365 (to reflect the six-month period). The expense ratios reflect an expense waiver. Assumes all dividends and distributions were reinvested. |
| 133 |
This page is intentionally left blank
This page is intentionally left blank
This page is intentionally left blank
Aristotle Funds
Each a series of Investment Managers Series Trust
Investment Advisors
Aristotle Capital Management, LLC
11100 Santa Monica Boulevard, Suite 1700
Los Angeles, California 90025
Aristotle Credit Partners, LLC
840 Newport Center Drive, Suite 600
Newport Beach, California 92660
Aristotle Capital Boston, LLC
One Federal Street, 36th Floor
Boston, Massachusetts 02110
Aristotle Atlantic Partners, LLC
489 5th Avenue, 10th Floor
New York, New York 10017
Independent Registered Public Accounting Firm
Tait, Weller & Baker LLP
Two Liberty Place
50 South 16th Street, Suite 2900
Philadelphia, Pennsylvania 19102
Custodian
UMB Bank, n.a.
928 Grand Boulevard, 5th Floor
Kansas City, Missouri 64106
Fund Co-Administrator
Mutual Fund Administration, LLC
2220 East Route 66, Suite 226
Glendora, California 91740
Fund Co-Administrator, Transfer Agent and Fund Accountant
UMB Fund Services, Inc.
235 West Galena Street
Milwaukee, Wisconsin 53212
Distributor
IMST Distributors, LLC
Three Canal Plaza, Suite 100
Portland, Maine 04101
www.foreside.com
FUND INFORMATION
| TICKER | CUSIP | |
| Aristotle/Saul Global Equity Fund – Class I | ARSOX | 461 418 287 |
| Aristotle International Equity Fund – Class I | ARSFX | 461 41P 297 |
| Aristotle Strategic Credit Fund – Class I | ARSSX | 461 41Q 824 |
| Aristotle Value Equity Fund – Class I | ARSQX | 461 41Q 634 |
| Aristotle Small Cap Equity Fund – Class I | ARSBX | 461 41Q 626 |
| Aristotle Core Equity Fund – Class I | ARSLX | 461 41Q 360 |
Privacy Principles of the Aristotle Funds for Shareholders
The Funds are committed to maintaining the privacy of their shareholders and to safeguarding their non-public personal information. The following information is provided to help you understand what personal information the Funds collect, how we protect that information and why, in certain cases, we may share information with select other parties.
Generally, the Funds do not receive any non-public personal information relating to their shareholders, although certain non-public personal information of their shareholders may become available to the Funds. The Funds do not disclose any non-public personal information about their shareholders or former shareholders to anyone, except as permitted by law or as is necessary in order to service shareholder accounts (for example, to a transfer agent or third party administrator).
This report is sent to shareholders of the Aristotle Funds for their information. It is not a Prospectus, circular or representation intended for use in the purchase or sale of shares of the Funds or of any securities mentioned in this report.
Proxy Voting Policies and Procedures
A description of the Funds’ proxy voting policies and procedures related to portfolio securities are available without charge, upon request, by calling the Funds at (888) 661-6691 or on the U.S. Securities and Exchange Commission’s (“SEC”) website at www.sec.gov.
Proxy Voting Record
Information regarding how the Funds voted proxies for portfolio securities, if applicable, during the most recent 12-month period ended June 30, is also available, without charge and upon request by calling (888) 661-6691 or by accessing the Funds’ Form N-PX on the SEC’s website at www.sec.gov.
Fund Portfolio Holdings
The Funds file their complete schedule of portfolio holdings with the SEC for the first and third quarters of each fiscal year on Form N-PORT within 60 days of the end of such fiscal quarter. Shareholders may obtain the Funds’ Form N-PORT on the SEC’s website at www.sec.gov.
Prior to their use of Form N-PORT, the Funds filed their complete schedule of portfolio holdings with the SEC on Form N-Q, which is available online at www.sec.gov.
Householding Mailings
The Funds will mail only one copy of shareholder documents, including prospectuses, and notice of annual and semi-annual reports availability and proxy statements, to shareholders with multiple accounts at the same address. This practice is commonly called “householding” and is intended to reduce expenses and eliminate duplicate mailings of shareholder documents. Mailings of your shareholder documents may be householded indefinitely unless you instruct us otherwise. If you do not want the mailing of these documents to be combined with those for other members of your household, please call the Funds at (888) 661-6691.
Aristotle Funds
P.O. Box 2175
Milwaukee, WI 53201
Toll Free: (888) 661-6691
Item 1. Report to Stockholders (Continued).
| (b) | Not Applicable |
Item 2. Code of Ethics.
The registrant has adopted a code of ethics that applies to the registrant's principal executive officer and principal financial officer. The registrant has not made any amendments to its code of ethics during the period covered by this report. The registrant has not granted any waivers from any provisions of the code of ethics during the period covered by this report.
The registrant undertakes to provide to any person without charge, upon request, a copy of its code of ethics by mail when they call the registrant at (888) 661-6691.
Item 3. Audit Committee Financial Expert.
The registrant’s board of trustees has determined that there is at least one audit committee financial expert serving on its audit committee. John P. Zader is the “audit committee financial expert” and is considered to be “independent” as each term is defined in Item 3 of Form N-CSR.
Item 4. Principal Accountant Fees and Services.
The registrant has engaged its principal accountant to perform audit services, audit-related services, tax services and other services during the past two fiscal years. "Audit services" refer to performing an audit of the registrant's annual financial statements or services that are normally provided by the accountant in connection with statutory and regulatory filings or engagements for those fiscal years. "Audit-related services" refer to the assurance and related services by the principal accountant that are reasonably related to the performance of the audit. "Tax services" refer to professional services rendered by the principal accountant for tax compliance, tax advice, and tax planning. There were no "other services" provided by the principal accountant. The following table details the aggregate fees billed or expected to be billed for each of the last two fiscal years for audit fees, audit-related fees, tax fees and other fees by the principal accountant.
| FYE 12/31/2021 | FYE 12/31/2020 | |
| Audit Fees | $109,000 | $107,500 |
| Audit-Related Fees | N/A | N/A |
| Tax Fees | $16,800 | $16,800 |
| All Other Fees | N/A | N/A |
The audit committee has adopted pre-approval policies and procedures that require the audit committee to pre-approve all audit and non-audit services of the registrant, including services provided to any entity affiliated with the registrant.
The percentage of fees billed by Tait, Weller, & Weller LLP applicable to non-audit services pursuant to waiver of pre-approval requirement were as follows:
| FYE 12/31/2021 | FYE 12/31/2020 | |
| Audit-Related Fees | 0% | 0% |
| Tax Fees | 0% | 0% |
| All Other Fees | 0% | 0% |
All of the principal accountant's hours spent on auditing the registrant's financial statements were attributed to work performed by full-time permanent employees of the principal accountant.
The following table indicates the non-audit fees billed or expected to be billed by the registrant's accountant for services to the registrant and to the registrant's investment adviser (and any other controlling entity, etc.—not sub-adviser) for the last two years. The audit committee of the Board of Trustees has considered whether the provision of non-audit services that were rendered to the registrant's investment adviser is compatible with maintaining the principal accountant's independence and has concluded that the provision of such non-audit services by the accountant has not compromised the accountant's independence.
| Non-Audit Related Fees | FYE 12/31/2021 | FYE 12/31/2020 |
| Registrant | N/A | N/A |
| Registrant’s Investment Advisor | N/A | N/A |
Item 5. Audit Committee of Listed Registrants.
(a) Not applicable to registrants who are not listed issuers (as defined in Rule 10A-3 under the Securities Exchange Act of 1934).
(b) Not applicable.
Item 6. Investments.
(a) Schedule of Investments is included as part of the report to shareholders filed under Item 1 of this Form.
(b) Not Applicable.
Item 7. Disclosure of Proxy Voting Policies and Procedures for Closed-End Management Investment Companies.
Not applicable to open-end investment companies.
Item 8. Portfolio Managers of Closed-End Management Investment Companies.
Not applicable to open-end investment companies.
Item 9. Purchases of Equity Securities by Closed-End Management Investment Company and Affiliated Purchasers.
Not applicable.
Item 10. Submission of Matters to a Vote of Security Holders.
The registrant has not made any material changes to the procedures by which shareholders may recommend nominees to the registrant’s Board of Trustees.
Item 11. Controls and Procedures.
| (a) | The Registrant’s President/Chief Executive Officer and Treasurer/Chief Financial Officer have reviewed the Registrant's disclosure controls and procedures (as defined in Rule 30a-3(c) under the Investment Company Act of 1940 (the “Act”)) as of a date within 90 days of the filing of this report, as required by Rule 30a-3(b) under the Act and Rules 13a-15(b) or 15d-15(b) under the Securities Exchange Act of 1934. Based on their review, such officers have concluded that the disclosure controls and procedures are effective in ensuring that information required to be disclosed in this report is appropriately recorded, processed, summarized and reported and made known to them by others within the Registrant and by the Registrant’s service provider. |
| (b) | There were no changes in the Registrant's internal control over financial reporting (as defined in Rule 30a-3(d) under the Act) that occurred during the period covered by this report that has materially affected, or is reasonably likely to materially affect, the Registrant's internal control over financial reporting. |
Item 12. Disclosure of Securities Lending Activities for Closed-End Management Investment Companies.
Not applicable to open-end investment companies.
Item 13. Exhibits.
(2) Certifications pursuant to Section 302 of the Sarbanes-Oxley Act of 2002. Filed herewith.
(3) Any written solicitation to purchase securities under Rule 23c-1 under the Act sent or given during the period covered by the report by or on behalf of the registrant to 10 or more persons. Not applicable to open-end investment companies.
(4) Change in the registrant’s independent public accountant. There was no change in the registrant’s independent public accountant for the period covered by this report.
| (b) | Certification pursuant to Section 906 of the Sarbanes-Oxley Act of 2002. Furnished herewith. |
SIGNATURES
Pursuant to the requirements of the Securities Exchange Act of 1934 and the Investment Company Act of 1940, the registrant has duly caused this report to be signed on its behalf by the undersigned, thereunto duly authorized.
| (Registrant) | Investment Managers Series Trust | ||
| By (Signature and Title) | /s/ Maureen Quill | ||
| Maureen Quill, President/Chief Executive Officer | |||
| Date | 3/11/2022 |
Pursuant to the requirements of the Securities Exchange Act of 1934 and the Investment Company Act of 1940, this report has been signed below by the following persons on behalf of the registrant and in the capacities and on the dates indicated.
| By (Signature and Title) | /s/ Maureen Quill | ||
| Maureen Quill, President/Chief Executive Officer | |||
| Date | 3/11/2022 | ||
| By (Signature and Title) | /s/ Rita Dam | ||
| Rita Dam, Treasurer/Chief Financial Officer | |||
| Date | 3/11/2022 |