Exhibit 99.2
1 ICR CONFERENCE January 2020
2 Cautionary Note about Forward - Looking Statements This presentation contains “forward - looking statements” within the meaning of the federal securities laws and is intended to qualify for the Safe Harbor from liability established by the Private Securities Litigation Reform Act of 1995, including statements regarding expected sales and future financial results and position, the outlook for Citi Trends’ markets and the demand for its products. These projections and statements are based on management’s estimates and assumptions with respect to future events and financial performance and are believed to be reasonable, though are inherently uncertain and difficult to predict. Actual results could differ materially from those projected as a result of certain factors. A discussion of factors that could cause results to vary is included in the section entitled “Risk Factors” in the Company’s most recent Annual Report on Form 10 - K filed with the Securities and Exchange Commission. Except as required by applicable law, the Company does not undertake to publicly update any forward - looking statements in this presentation.
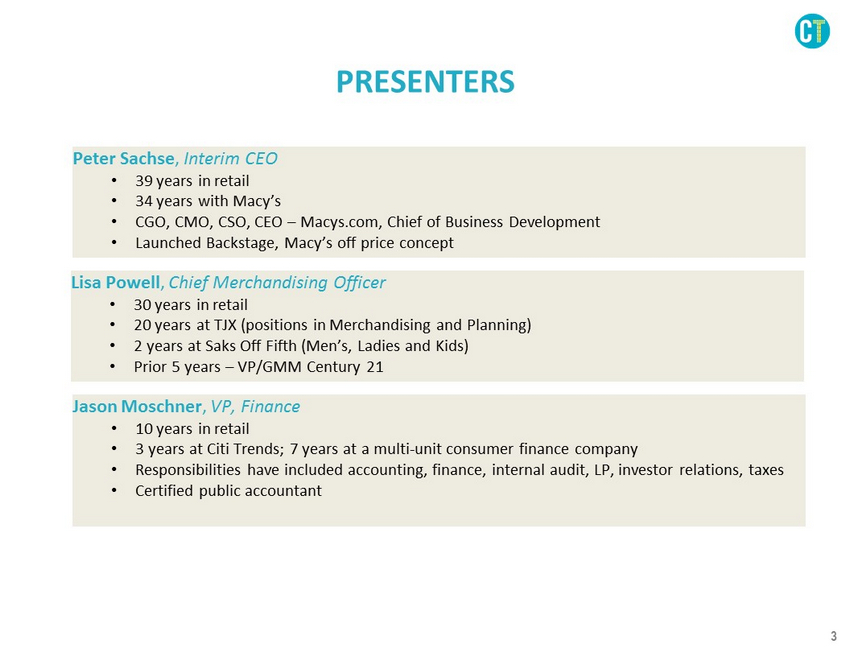
3 PRESENTERS Peter Sachse , Interim CEO • 39 years in retail • 34 years with Macy’s • CGO, CMO, CSO, CEO – Macys.com , Chief of Business Development • Launched Backstage, Macy’s off price concept Lisa Powell , Chief Merchandising Officer • 30 years in retail • 20 years at TJX (positions in Merchandising and Planning) • 2 years at Saks Off Fifth (Men’s, Ladies and Kids) • Prior 5 years – VP/GMM Century 21 Jason Moschner , VP, Finance • 10 years in retail • 3 years at Citi Trends; 7 years at a multi - unit consumer finance company • Responsibilities have included accounting, finance, internal audit, LP, investor relations, taxes • Certified public accountant
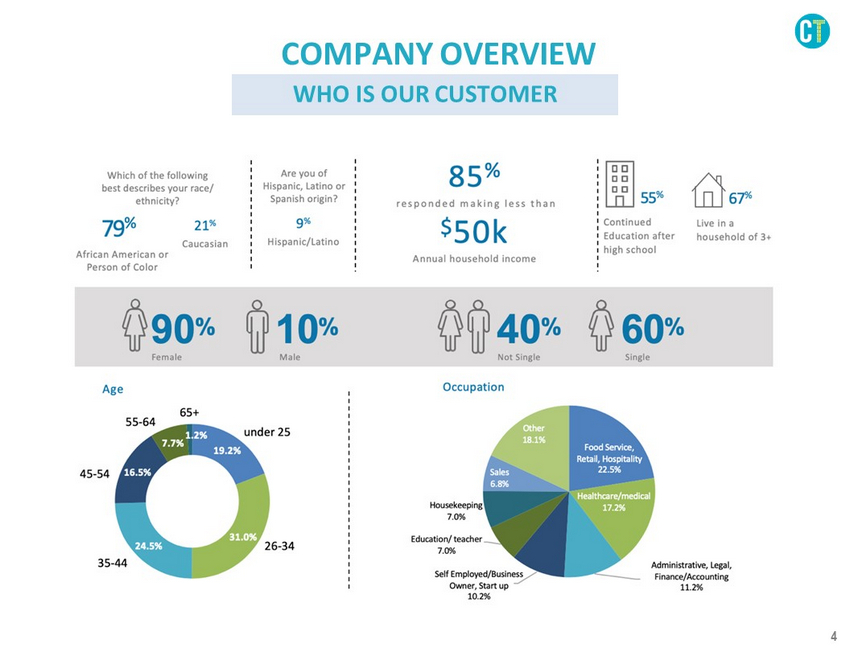
4 COMPANY OVERVIEW WHO IS OUR CUSTOMER
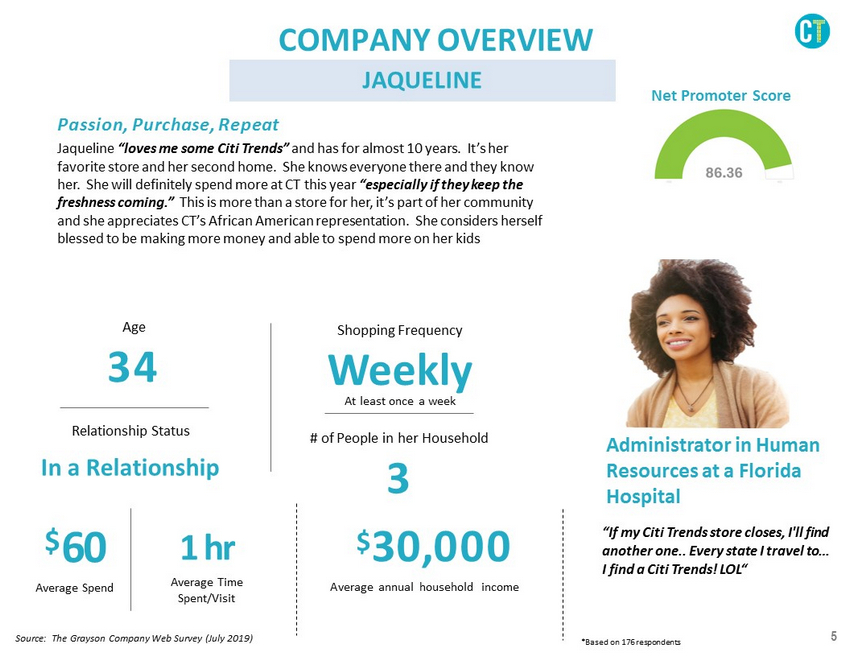
5 Passion, Purchase, Repeat Jaqueline “loves me some Citi Trends” and has for almost 10 years. It’s her favorite store and her second home. She knows everyone there and they know her. She will definitely spend more at CT this year “especially if they keep the freshness coming.” This is more than a store for her, it’s part of her community and she appreciates CT’s African American representation. She considers herself blessed to be making more money and able to spend more on her kids Jaqueline’s main complaints: Lack of loyalty program, inability to make online purchases, and the lack of brands in footwear $ 60 Average Spend $ 30 , 000 A verage annual household income “If my Citi Trends store closes, I'll find another one.. Every state I travel to… I find a Citi Trends! LOL“ Administrator in Human Resources at a Florida Hospital 1 hr Average Time Spent/Visit Age 34 Shopping Frequency Weekly At least once a week # of People in her Household 3 Relationship Status In a Relationship Net Promoter Score * Based on 176 respondents Source: The Grayson Company Web Survey (July 2019) COMPANY OVERVIEW JAQUELINE
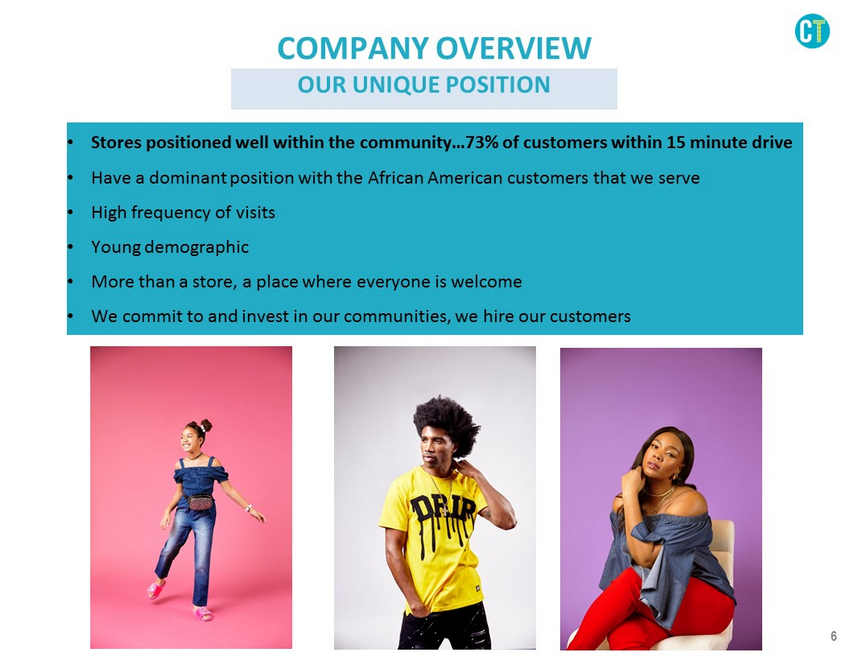
6 • Stores positioned well within the community…73% of customers within 15 minute drive • Have a dominant position with the African American customers that we serve • High frequency of visits • Young demographic • More than a store, a place where everyone is welcome • We commit to and invest in our communities, we hire our customers COMPANY OVERVIEW OUR UNIQUE POSITION
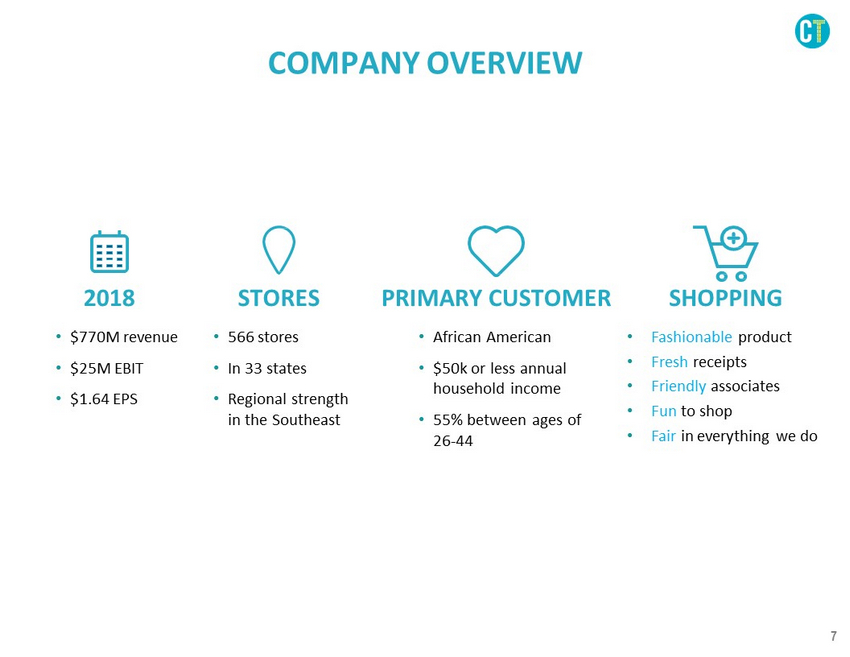
7 COMPANY OVERVIEW • 566 stores • In 33 states • Regional strength in the Southeast STORES • $770M revenue • $25M EBIT • $1.64 EPS 2018 • African American • $50k or less annual household income • 55% between ages of 26 - 44 PRIMARY CUSTOMER • Fashionable product • Fresh receipts • Friendly associates • Fun to shop • Fair in everything we do SHOPPING
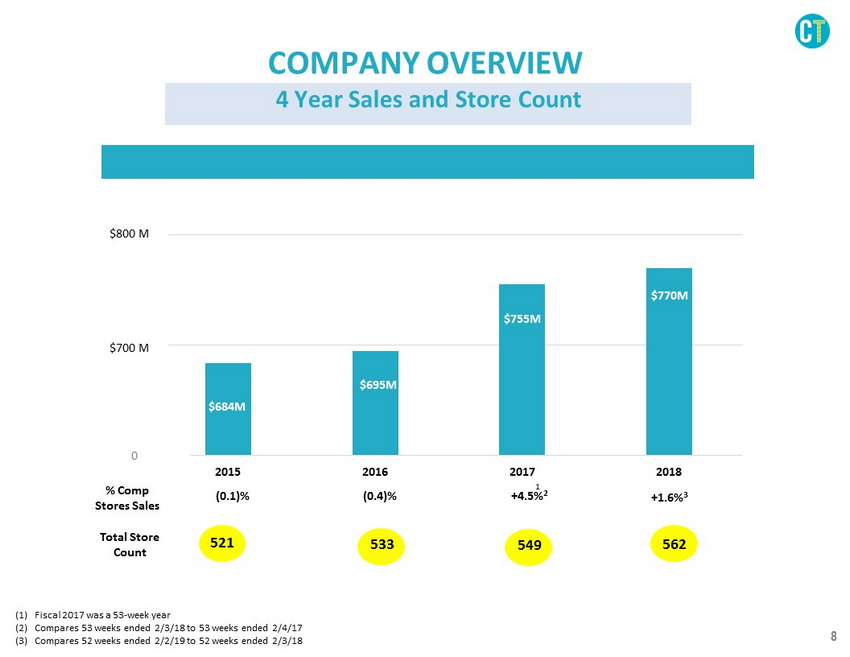
8 COMPANY OVERVIEW (1) Fiscal 2017 was a 53 - week year (2) Compares 53 weeks ended 2/3/18 to 53 weeks ended 2/4/17 (3) Compares 52 weeks ended 2/2/19 to 52 weeks ended 2/3/18 % Comp Stores Sales (0.1)% (0.4)% +4.5% 2 +1.6% 3 600 700 800 2015 2016 2017 2018 $800 M $700 M 0 Total Store Count 521 533 549 562 $684M $695M $755M $770M 4 Year Sales and Store Count 1
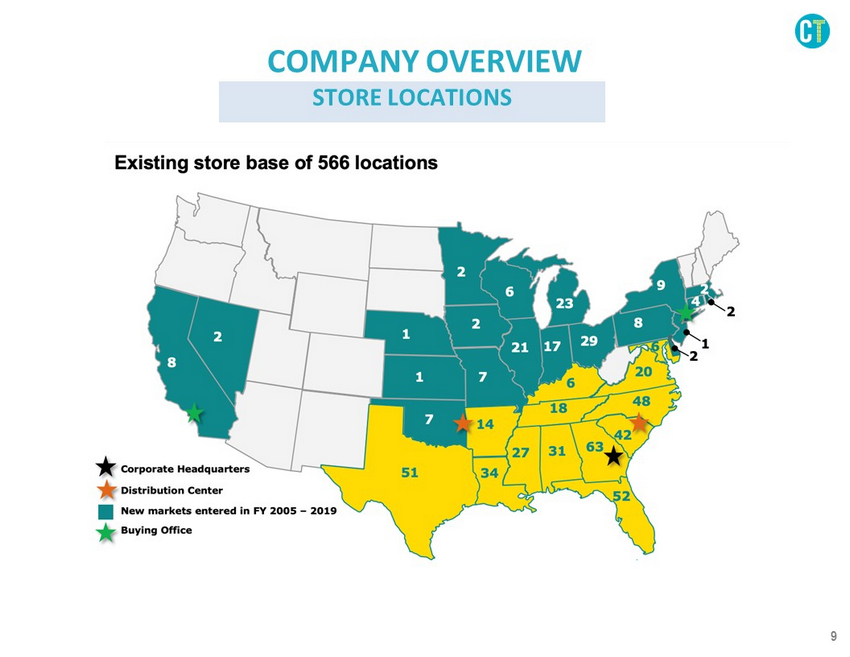
9 COMPANY OVERVIEW *Input map of stores* STORE LOCATIONS
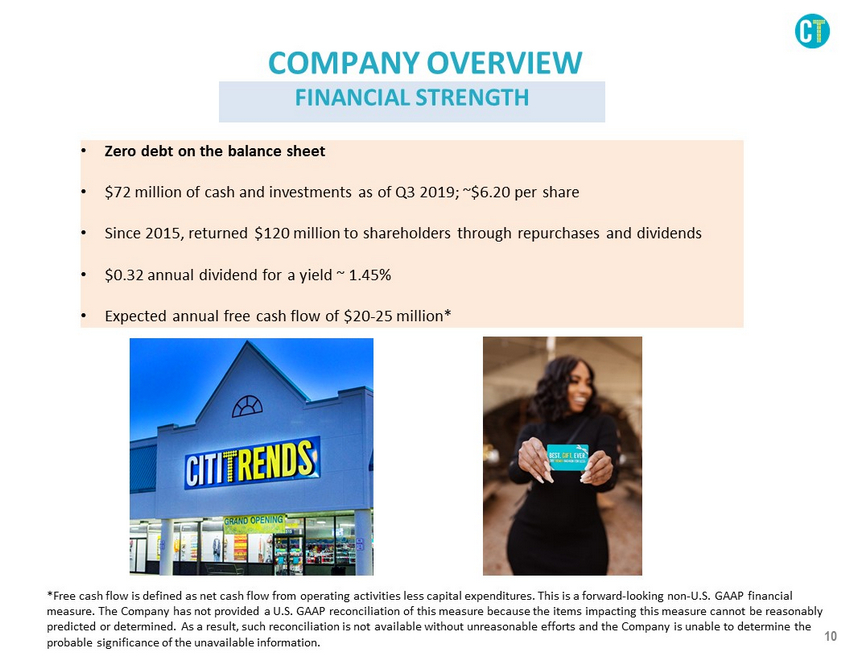
10 FINANCIAL STRENGTH • Zero debt on the balance sheet • $72 million of cash and investments as of Q3 2019; ~$6.20 per share • Since 2015, returned $120 million to shareholders through repurchases and dividends • $0.32 annual dividend for a yield ~ 1.45% • Expected annual free cash flow of $20 - 25 million* COMPANY OVERVIEW *Free cash flow is defined as net cash flow from operating activities less capital expenditures. This is a forward - looking non - U .S. GAAP financial measure. The Company has not provided a U.S. GAAP reconciliation of this measure because the items impacting this measure can not be reasonably predicted or determined. As a result, such reconciliation is not available without unreasonable efforts and the Company is un abl e to determine the probable significance of the unavailable information.
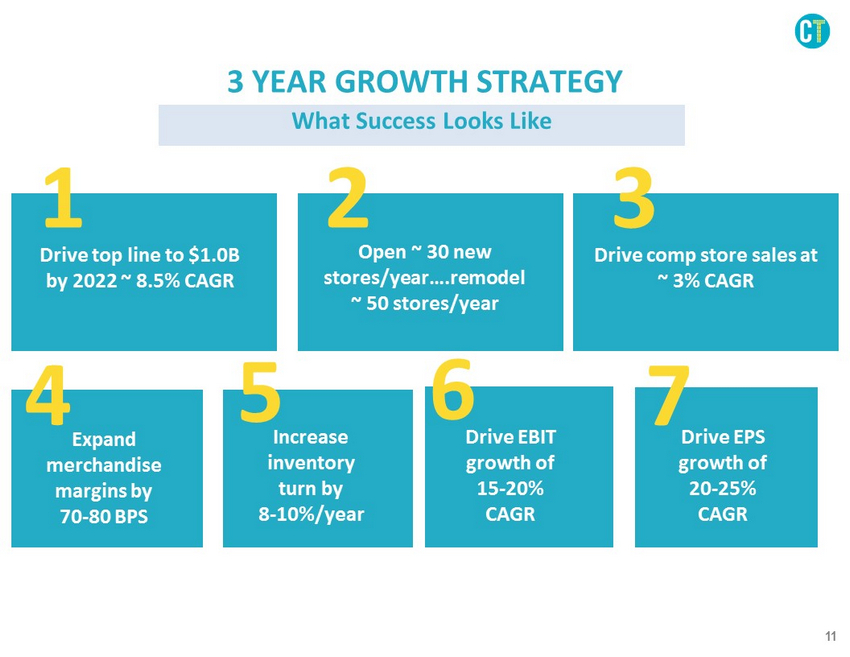
11 Drive top line to $1.0B by 2022 ~ 8.5% CAGR Open ~ 30 new stores/year….remodel ~ 50 stores/year Drive comp store sales at ~ 3% CAGR Expand merchandise margins by 70 - 80 BPS Increase inventory turn by 8 - 10%/year Drive EBIT growth of 15 - 20% CAGR 1 2 3 4 5 6 7 Drive EPS growth of 20 - 25% CAGR What Success Looks Like 3 YEAR GROWTH STRATEGY
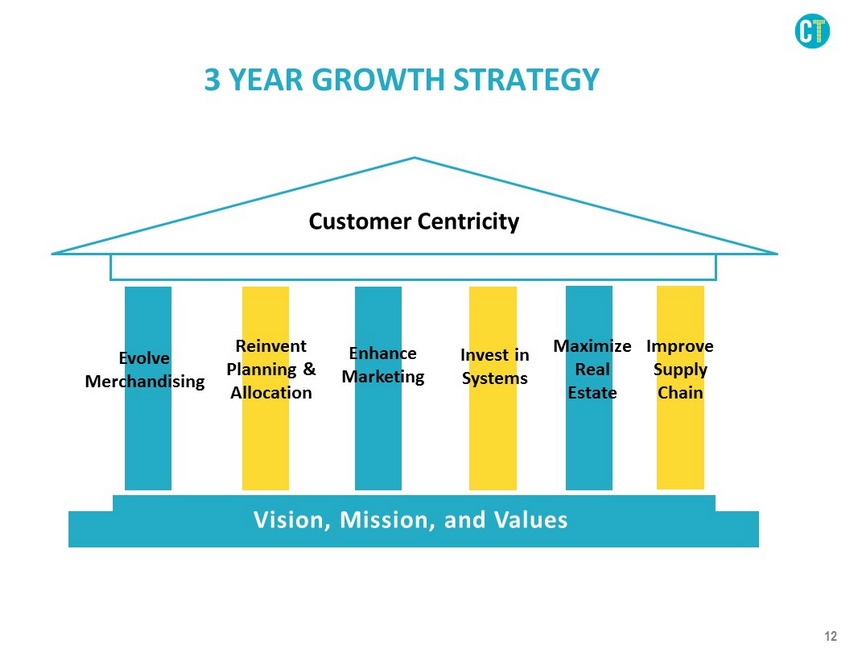
12 Customer Centricity Evolve Merchandising Reinvent Planning & Allocation Enhance Marketing Invest in Systems Maximize Real Estate Improve Supply Chain Customer Centricity Vision, Mission, and Values 3 YEAR GROWTH STRATEGY
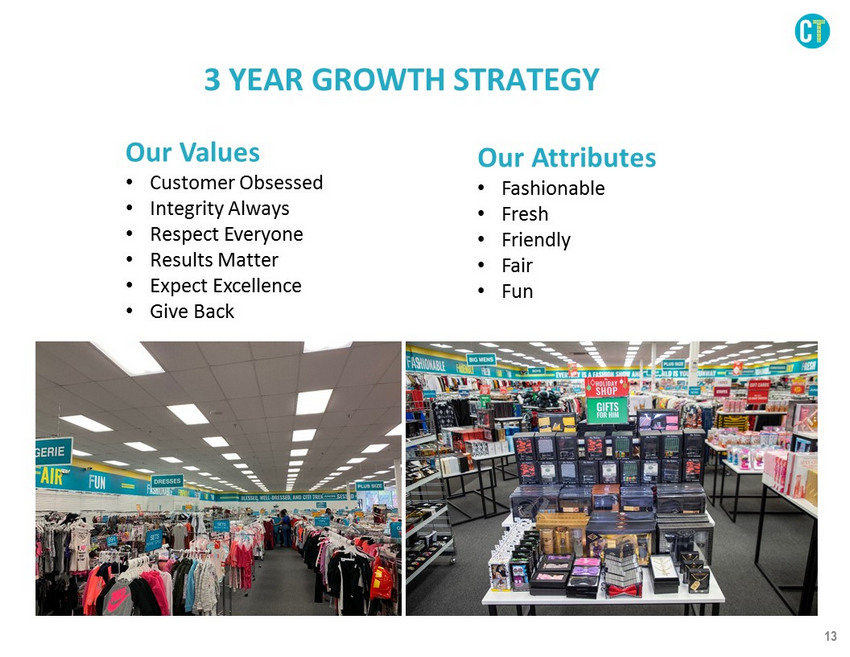
13 Our Values • Customer Obsessed • Integrity Always • Respect Everyone • Results Matter • Expect Excellence • Give Back Our Attributes • Fashionable • Fresh • Friendly • Fair • Fun 3 YEAR GROWTH STRATEGY
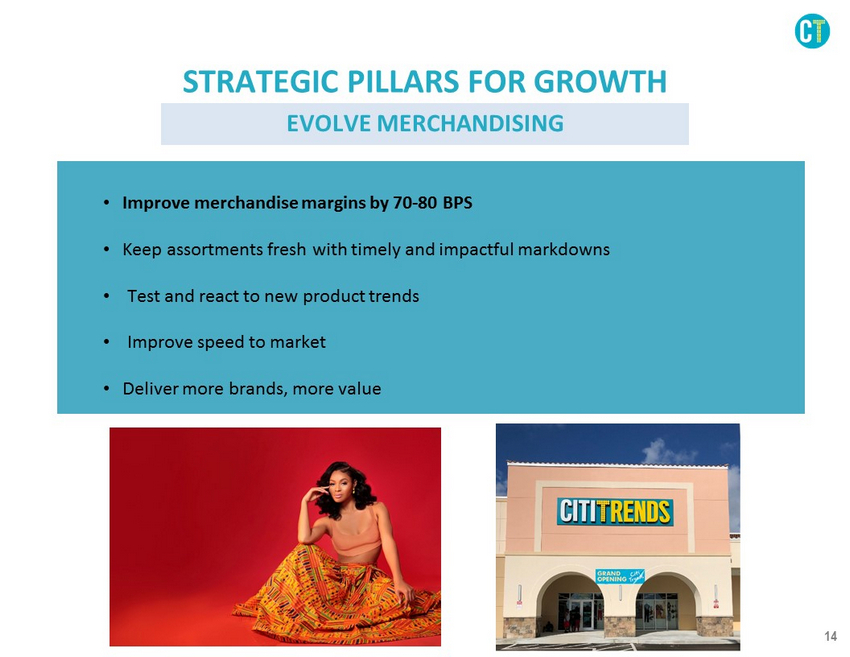
14 STRATEGIC PILLARS FOR GROWTH • Improve merchandise margins by 70 - 80 BPS • Keep assortments fresh with timely and impactful markdowns • Test and react to new product trends • Improve speed to market • Deliver more brands, more value EVOLVE MERCHANDISING

15 • Achieve a 8 - 10%/year improvement in inventory turn • Develop and invest in merchandising, planning and allocation systems • Become more data driven • Right product, right store, right quantity, right time • Implement a markdown optimization system STRATEGIC PILLARS FOR GROWTH REINVENT PLANNING AND ALLOCATION
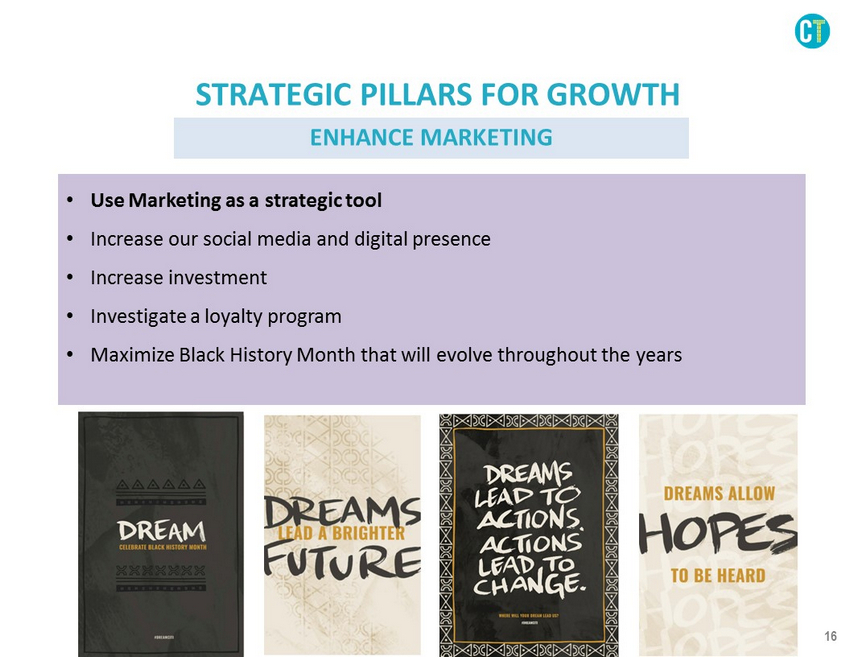
16 STRATEGIC PILLARS FOR GROWTH ENHANCE MARKETING • Use Marketing as a strategic tool • Increase our social media and digital presence • Increase investment • Investigate a loyalty program • Maximize Black History Month that will evolve throughout the years
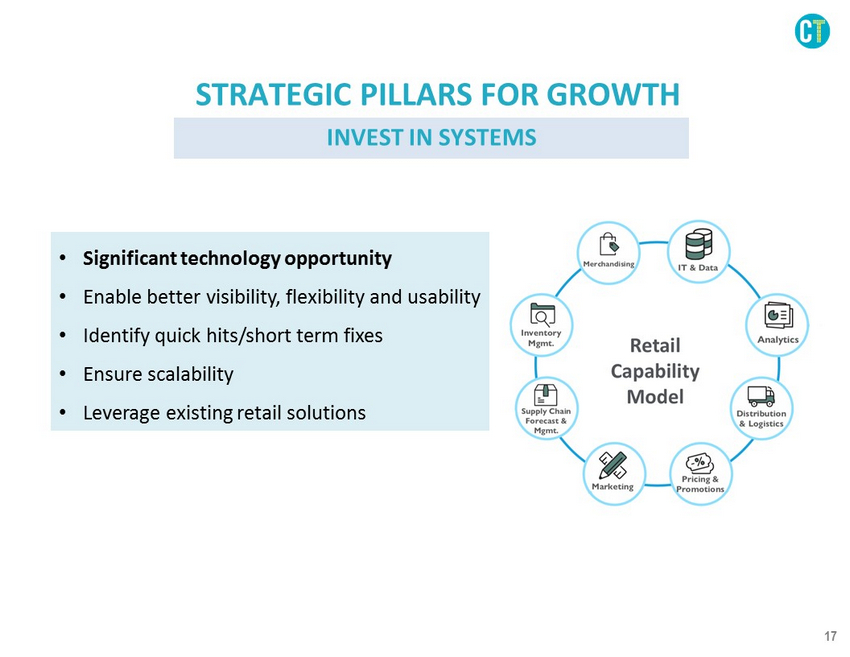
17 STRATEGIC PILLARS FOR GROWTH • Significant technology opportunity • Enable better visibility, flexibility and usability • Identify quick hits/short term fixes • Ensure scalability • Leverage existing retail solutions INVEST IN SYSTEMS
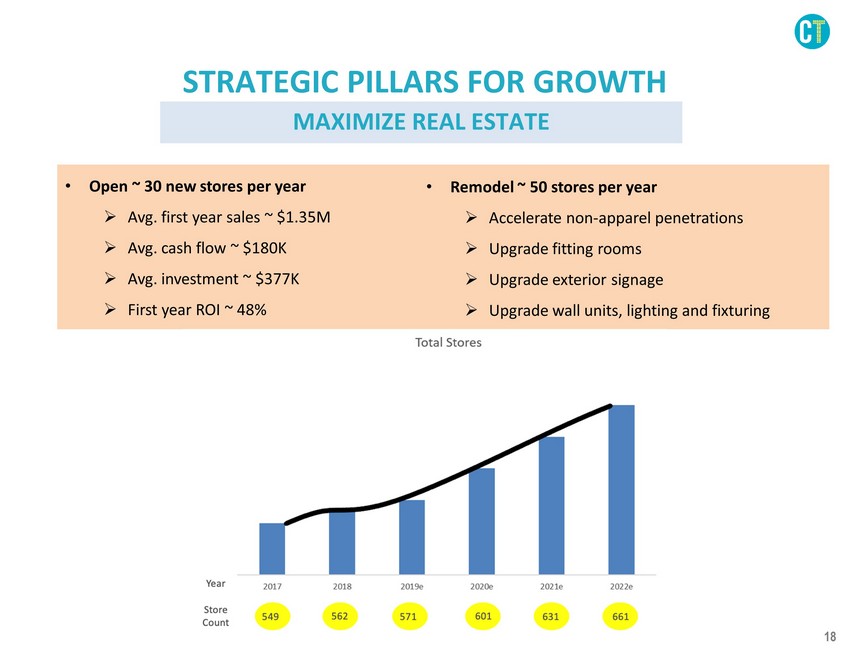
18 STRATEGIC PILLARS FOR GROWTH • Open ~ 30 new stores per year » Avg. first year sales ~ $1.35M » Avg. cash flow ~ $180K » Avg. investment ~ $337K » First year ROI ~ 48% MAXIMIZE REAL ESTATE • Remodel ~ 50 stores per year » Accelerate non - apparel penetrations » Upgrade fitting rooms » Upgrade exterior signage » Upgrade wall units, lighting and fixturing
19

20
21
22

23 STRATEGIC PILLARS FOR GROWTH IMPROVE SUPPLY CHAIN • Improve distribution center productivity • Improve speed of inbound and outbound shipments • Reduce transportation costs • Long - term roadmap…capacity, geography, quantity
24
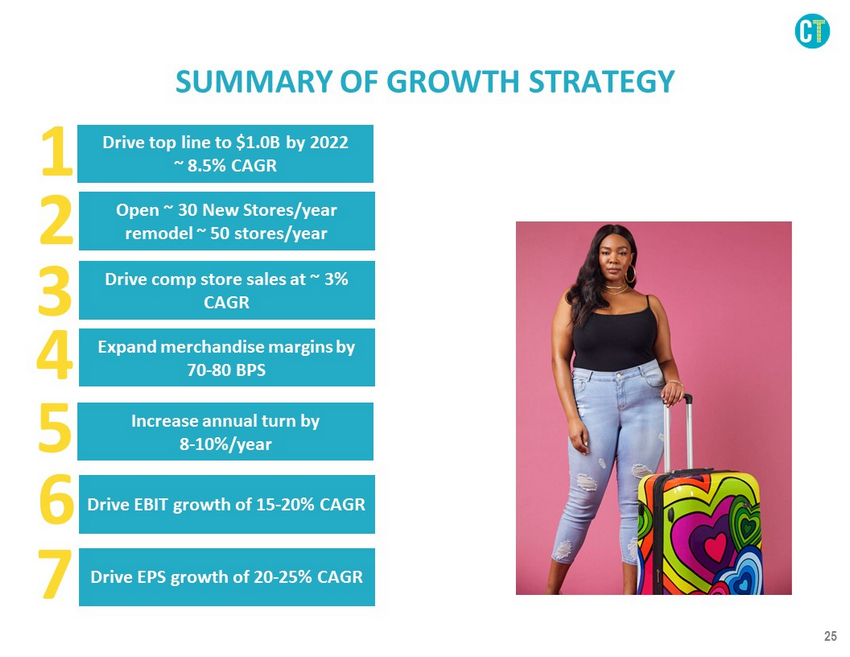
25 SUMMARY OF GROWTH STRATEGY Drive top line to $1.0B by 2022 ~ 8.5% CAGR Open ~ 30 New Stores/year remodel ~ 50 stores/year Drive comp store sales at ~ 3% CAGR Expand merchandise margins by 70 - 80 BPS Increase annual turn by 8 - 10%/year Drive EBIT growth of 15 - 20% CAGR Drive EPS growth of 20 - 25% CAGR 1 2 3 4 5 6 7
26