EXHIBIT 99.2
AMENDED NI 43-101 TECHNICAL REPORT
UPDATED MINERAL RESOURCE ESTIMATE
for the GOLD ROCK PROJECT
White Pine County, Nevada
Prepared for MIDWAY GOLD CORP.

Original Report Date: May 29, 2014
Effective Date: May 28, 2014
Amended Report Date: January 8, 2015
Prepared by:

Endorsed by QPs:
Terre A. Lane, MMSA-QP
Donald J. Baker, PhD, MMSA-QP
J.J. Brown, P.G., SME RM-QP
Deepak Malhotra, PhD, MMSA-QP
 | Table of Contents Amended NI 43-101 Technical Report |
TABLE OF CONTENTS
| Section | Title | Page |
| 1 | SUMMARY | 1 |
1.1 | Introduction | 1 |
1.2 | Property Description and Ownership | 1 |
1.3 | Geology and Mineralization | 1 |
1.4 | Status of Exploration | 2 |
1.5 | Mineral Resource Estimate | 3 |
1.6 | Conclusions and Recommendations | 3 |
| 2 | INTRODUCTION | 6 |
2.1 | Issuer and Terms of Reference | 6 |
2.2 | Sources of Information | 6 |
2.3 | Personal Inspection | 6 |
2.4 | Units of Measure | 7 |
2.5 | Amendments | 7 |
| 3 | RELIANCE ON OTHER EXPERTS | 9 |
| 4 | PROPERTY DESCRIPTION AND LOCATION | 10 |
4.1 | Location | 10 |
4.2 | Mineral Tenure and Agreements | 11 |
4.2.1 | Mineral Rights | 11 |
4.2.2 | Agreements | 12 |
4.3 | Environmental Liabilities and Permitting | 12 |
4.3.1 | Environmental Liabilities | 12 |
4.3.2 | Permitting | 12 |
| 5 | ACCESSIBILITY, CLIMATE, LOCAL RESOURCES, INFRASTRUCTURE AND PHYSIOGRAPHY | 16 |
5.1 | Accessibility | 16 |
5.2 | Topography, Elevation, Vegetation, and Climate | 16 |
5.3 | Infrastructure and Local Resources | 16 |
| 6 | HISTORY | 18 |
6.1 | Ownership and Exploration | 18 |
6.2 | Resource and Reserve Estimates | 18 |
| 7 | GEOLOGICAL SETTING AND MINERALIZATION | 21 |
7.1 | Regional Geology | 21 |
7.2 | Local Geology | 22 |
7.3 | Property Geology | 22 |
7.4 | Stratigraphy | 22 |
7.4.1 | Late Devonian Devil’s Gate Limestone (Dd) | 22 |
7.4.2 | Late Devonian to Early Mississippian Pilot Shale (MDp) | 27 |
7.4.3 | Mississippian Joana Limestone (Mj) | 27 |
7.4.4 | Mississippian Chainman Shale (Mc) | 27 |
7.4.5 | Mississippian Diamond Peak Formation (Md) | 27 |
 | i | January 8, 2015 |
| Table of Contents Amended NI 43-101 Technical Report |
7.4.6 | Tertiary Pinto Basin Tuff (Typb) | 28 |
7.4.7 | Quaternary-Tertiary Older Gravel (QTog) | 28 |
7.4.8 | Quaternary Alluvium and Colluvium (Qal and Qc) | 28 |
7.5 | Structural Geology | 28 |
7.5.1 | Fold and Thrust Deformation | 28 |
7.6 | Mineralization | 34 |
7.7 | Alteration | 34 |
7.8 | Geometry of Mineralization | 35 |
| 8 | DEPOSIT TYPES | 37 |
| 9 | EXPLORATION | 38 |
9.1 | Previous Operator’s Exploration Work | 38 |
9.2 | Historic Geochemical Sampling | 38 |
9.3 | Historical Geophysics | 38 |
9.4 | Historical Mapping | 38 |
9.5 | Historical Drilling | 38 |
9.6 | Midway Exploration Work | 39 |
9.6.1 | Surface Geochemistry | 39 |
9.6.2 | Geological Mapping | 40 |
9.6.3 | Geophysical Surveys | 40 |
9.6.4 | Drilling | 40 |
| 10 | DRILLING | 42 |
10.1 | Historic Drilling | 42 |
10.2 | Midway Drilling | 42 |
10.2.1 | 2011 Midway Drilling Results | 45 |
10.2.2 | 2011 Midway Twin Holes | 45 |
10.2.3 | 2012 Midway Drilling Campaign | 46 |
| 11 | SAMPLE PREPARATION, ANALYSES AND SECURITY | 55 |
11.1 | Historic Programs | 55 |
11.1.1 | Santa Fe Analytical Methods | 55 |
11.1.2 | Tenneco/Echo Bay Analytical Methods | 55 |
11.1.3 | Alta Bay Joint Venture Analytical Methods | 55 |
11.1.4 | Alta Bay Joint Venture Analytical Methods | 55 |
11.1.5 | Alta Gold Analytical Methods | 56 |
11.2 | Midway’s 2011 and 2012-2013 Programs | 56 |
11.2.1 | Midway Standard Sample Analyses | 57 |
11.2.2 | Midway Blank Sample Analyses | 59 |
11.2.3 | Midway Duplicate Sample Analyses | 60 |
11.2.4 | Summary and QP Opinion | 62 |
| 12 | DATA VERIFICATION | 64 |
12.1 | Historic Data Verification | 64 |
12.1.1 | Pre-Midway Historic Data | 64 |
12.1.2 | Midway Drilling in 2011 | 65 |
12.2 | Midway 2012 - 2013 Drilling Program | 65 |
12.2.1 | Drill Hole Locations | 65 |
| | ii | January 8, 2015 |
| Table of Contents Amended NI 43-101 Technical Report |
12.2.2 | Drill Core and Reverse Circulation Rejects | 65 |
12.2.3 | Assay Certificates and Assay Database | 66 |
12.2.4 | Check Assays | 66 |
12.2.5 | Twin Holes | 66 |
12.2.6 | Meridian Ridge Property | 66 |
12.3 | Opinion of the Qualified Person | 70 |
| 13 | MINERAL PROCESSING AND METALLURGICAL TESTING | 71 |
| 14 | MINERAL RESOURCE ESTIMATE | 76 |
14.1 | Data Used for Gold Grade Estimation | 77 |
14.2 | Density | 79 |
14.3 | Methodology | 80 |
14.4 | Estimation Domains | 80 |
14.4.1 | Formation Domains | 80 |
14.4.2 | Fold Domains | 81 |
14.4.3 | Carbon-Alteration Domain Results | 82 |
14.4.4 | Grade Capping | 82 |
14.4.5 | Compositing | 86 |
14.4.6 | Variography | 87 |
14.4.7 | Estimation Methodology | 88 |
14.4.8 | Estimation Validation | 88 |
14.5 | Mineral Resource Estimate | 88 |
14.5.1 | Mineral Resource Classification | 88 |
14.5.2 | Whittle Analysis | 93 |
14.5.3 | Cut Off Grade Calculation | 94 |
14.5.4 | Dilution | 95 |
14.5.5 | Recommendations for Future Work | 95 |
| 15 | ADJACENT PROPERTIES | 96 |
| 16 | OTHER RELEVANT DATA AND INFORMATION | 97 |
| 17 | INTERPRETATION AND CONCLUSIONS | 98 |
| 18 | RECOMMENDATIONS | 99 |
| 19 | REFERENCES | 100 |
Appendix A Drill Holes Used in the Gold Grade Estimation
| | iii | January 8, 2015 |
| Table of Contents Amended NI 43-101 Technical Report |
| LIST OF FIGURES |
| Figure | Page |
| Figure 4 1 Property Location Map | 10 |
| Figure 4 2 Mineral Claim Map | 11 |
| Figure 7 1 Regional Geology (Hose and Blake, 1987) | 21 |
| Figure 7 2 Simplified Stratigraphic Column, Gold Rock Project (Midway, 2014) | 23 |
| Figure 7 3 Geology and Alteration of the Gold Rock Project (Midway, 2014) | 24 |
| Figure 7 4 2014 Stratigraphic Section Measurement Traces, Gold Rock Project (Midway, 2014) | 25 |
| Figure 7 5 Stratigraphic Column, Gold Rock Project (Midway, 2014) | 26 |
| Figure 7 6 Thrust Faulting in the Vicinity of the Gold Rock Project Area | 29 |
| Figure 7 7 Cross Section Through the Easy Junior Pit, Gold Rock Project | 30 |
| Figure 7 8 Photos of the North and South High Walls of the Easy Jr. | 31 |
| Figure 7 9 Geometry of the Easy Junior Anticline as Defined by Drilling | 32 |
| Figure 7 10 Plan View Exposure of the Easy Junior Anticline on Meridian Ridge, Gold Rock Project | 33 |
| Figure 7 11 Cross Sections Through the Easy Junior Resource Area | 36 |
| Figure 10 1 Gold Rock Historic Drilling and Resource Estimate Boundary | 43 |
| Figure 10 2 Drill Hole Collar Eye Bolt & Tag – Gr11-23c | 44 |
| Figure 10 3 2012-2013 Drill Hole Locations, Easy Junior Area | 48 |
| Figure 10 4 2012-2013 Drill Hole Locations, Meridian Flats Area | 49 |
| Figure 10 5 Mineralization in the Vicinity of the Easy Junior Anticline | 52 |
| Figure 10 6 Mineralization Along the East Limb of the Easy Junior Anticline | 52 |
| Figure 10 7 Mineralization in the Meridian Flats Area, Section 1600 | 53 |
| Figure 10 8 Possible Cross Structure in the Meridian Flats Area | 54 |
| Figure 11 1 Standard Analytical Results – Oreas 6 Pc | 57 |
| Figure 11 2 Standard Analytical Results – Oreas 2 Pd | 58 |
| Figure 11 3 Standard Analytical Results – Oreas 15f | 58 |
| Figure 11 4 Blank Sample Analytical Results | 59 |
| Figure 11 5 Midway Drill Sample Duplicates (All Data – 166 Sample Pairs) | 60 |
| Figure 11 6 Midway Drill Sample Duplicates (Less One Higher Grade Sample – See Figure 11-5; 165 Sample Pairs) | 61 |
| Figure 11 7 Duplicate Pair Absolute Differences with Percent Difference Contours (165 Sample Pairs) | 61 |
| Figure 11 8 Midway-Oreas Average Standard Assay Comparison | 63 |
| Figure 12 1 Midway Core – Rc Twin Holes | 67 |
| Figure 12 2 Mgus Core Twin of Historic Ej-8 | 68 |
| Figure 12 3 Meridian Ridge Claim Block and Drill Hole Locations | 69 |
| Figure 13 1 Sample Preparation Test Protocol | 73 |
| Figure 14 1 Validated Drill Hole Collars Used in Gold Rock Estimation | 78 |
| Figure 14 2 3-D Lithology Model, Looking North-North-West | 80 |
| Figure 14 3 Carbon Alteration Domain Follows Lithology and Drilling Logged on Drill Holes | 83 |
| Figure 14 4 Detail of Carbon Alteration on Hole. Drill Hole | 84 |
| | iv | January 8, 2015 |
| Table of Contents Amended NI 43-101 Technical Report |
| Figure 14 5 Cumulative Frequency Plot for All Samples | 85 |
| Figure 14 6 Cumulative Frequency Plot for Highest Samples | 85 |
| Figure 14 7 Map Of Drill Holes Requiring Capping | 86 |
| Figure 14 8 Section 1400, Looking North | 90 |
| Figure 14 9 Section 6000, Looking North | 90 |
| Figure 14 10 Section 7400, Looking North | 91 |
| Figure 14 11 Quantile Plot Comparing Raw Data, Composites, Nearest Neighbor, Inverse Distance Cubed and Ordinary Kriging Results | 91 |
| Figure 14 12 Quantile Plot Comparing Raw Data, Composites, Nearest Neighbor, Inverse Distance Cubed and Ordinary Kriging Results for Measured Blocks | 92 |
| | v | January 8, 2015 |
| Table of Contents Amended NI 43-101 Technical Report |
| LIST OF TABLES |
| Table | Page |
| Table 1 1 Whittle Pit Shell Mineral Resource at $1,500 Per Ounce at Various Cutoffs | 3 |
| Table 4 1 Property Agreements | 12 |
| Table 4 2 Major Permits and Authorizations Required for Project Development | 13 |
| Table 6 1 Imc Geological Reserve (Geologic Inventory, No Economic Constraint) | 19 |
| Table 6 2 Proven and Probable Reserve | 19 |
| Table 6 3 Physical Pit Design Criteria | 20 |
| Table 6 4 Cut-Off Grade Check Calculations | 20 |
| Table 9 1 Historic Exploration and Delineation Drilling at The Gold Rock Property, 1980 To 1994 | 39 |
| Table 10 1 Midway 2011 Summary Drilling Results | 45 |
| Table 10 2 2012 – 2013 Drill Hole Summary, Gold Rock Project | 47 |
| Table 10 3 2012 - 2013 Significant Intercept Table (0.004 Opt Cut-Off) | 50 |
| Table 12 1 Twin Hole Assay & Thickness Comparison | 67 |
| Table 13 1 Head Analyses of Comosite Samples | 74 |
| Table 13 2 Bottle Roll Cyanidation Leach Results at P80 of 6 Mesh | 74 |
| Table 13 3 Bottle Roll Cyanidation Leach Results at P80 of 200 Mesh | 74 |
| Table 13 4 Carbon-In-Leach (Cil) Cyanidation Test Results at P80 of 200 Mesh | 75 |
| Table 13 5 Summary of Column Leach Test Results | 75 |
| Table 14 1 Sample Statistics | 77 |
| Table 14 2 Density Measurement Data | 79 |
| Table 14 3 Gold Rock Composite Statistics | 81 |
| Table 14 4 Final Domain Descriptive Statistics | 82 |
| Table 14 5 Coefficient of Variance for Capped vs. Uncapped Samples | 86 |
| Table 14 6 Composite Descriptive Statistics | 87 |
| Table 14 7 Variogram Results By Domain | 88 |
| Table 14 8 Inverse Distance Cubed Parameters | 89 |
| Table 14 9 Measured, Indicated, and Inferred Resource, No Grouping (Midway, 2014) | 92 |
| Table 14 10 Indicated and Inferred Resource (Gustavson, 2012) | 93 |
| Table 14 11 Whittle Pit Shells at Various Gold Prices at a 0.006 Cutoff | 93 |
| Table 14 12 Whittle Estimation Parameters | 94 |
| Table 14 13 Whittle Pit Shell Mineral Resource at $1,500 Per Ounce at Various Cutoffs | 94 |
| Table 14 14 Gold Rock Whittle Pit Cutoff Grades | 95 |
| Table 18 1 Estimated Budget For Verification Drilling Program and Data Compilation | 99 |
| | vi | January 8, 2015 |
| Table of Contents Amended NI 43-101 Technical Report |
| LIST OF ACRONYMS |
| AA | atomic absorption analysis |
| ALS | ALS Minerals |
| BLM | Bureau of Land Management |
| CFP | cumulative frequency plots |
| CIL | Carbon-in-Leach |
| CIM | Canadian Institute of Mining, Metallurgy and Petroleum |
| CN AA | cyanide atomic absorption analyses |
| CoV | coefficient of variance |
| Dd | Devils Gate Limestone |
| EIS | Environmental Impact Statement |
| Flt | fault zone |
| g/t | grams per ton |
| GIS | geographic information system |
| GRE | Global Resource Engineering Ltd. |
| ha | hectacres |
| IMC | Independent Mining Consultants, Inc. |
| Kg/t | kilograms per ton |
| Mc | Chainman Shale |
| Md | Diamond Peak Formation |
| MDBM | Mount Diablo Base and Meridian |
| MDp | Pilot ShaleMidway Midway Gold Corp. |
| Mj | Joana Limestone |
| MMSA | Mining & Metallurgical Society of America |
| NI 43-101 | Canadian National Instrument 43-101 |
| NSR | net smelter royalty |
| opt | ounces per ton |
| OREAS | Ore Research & Exploration Pty Ltd of Australia |
| PAH | Pincock Allen and Holt |
| PEA | Preliminary Economic Assessment |
| ppm | parts per million |
| QA/QC | quality control/quality assurance |
| Qal | Alluvium |
| Qm | Mine Material |
| QP | Qualified Person |
| RC | reverse circulation |
| RDI | Resource Development Inc. |
| ROD | Record of Decision |
| St. Dev. | standard deviation |
| Tvt | Bates Mountain Tuff |
| USGS | United States Geological Survey |
| | vii | January 8, 2015 |
| Summary Amended NI 43-101 Technical Report |
| 1 | SUMMARY |
1.1INTRODUCTION
Midway Gold Corp., through its wholly owned subsidiary, Midway Gold US Inc. (collectively Midway), has updated the mineral resource model for the Gold Rock Project in White Pine County, Nevada, based on the results of exploration and infill drilling completed in 2012 and 2013. Midway commissioned Global Resources Engineering Ltd. (GRE) to conduct an independent audit and validation of the updated resource model and mineral resource estimate and to prepare an associated technical report according to Canadian National Instrument 43-101 (NI-43-101) Standards of Disclosure for Mineral Projects (June 2011). The purpose of this report is to document the updated mineral resource estimate and to present the results of the independent review of geologic and technical data and validation of the geologically based block model developed by Midway. All interpretations and conclusions presented herein are based on data available prior to the effective date of this report, May 28, 2014.
This report was prepared in accordance with NI 43-101, and in compliance with the disclosure and reporting requirements set forth in Companion Policy 43-101CP and Form 43-101F1 (June 2011). Mineral resources are classified in accordance with Canadian Institute of Mining, Metallurgy and Petroleum (CIM) Definition Standards - For Mineral Resources and Mineral Reserves, prepared by the CIM Standing Committee on Reserve Definitions and adopted by CIM Council on May 10, 2014.
1.2PROPERTY DESCRIPTION AND OWNERSHIP
The Gold Rock Project is a Carlin-style, epithermal, disseminated, sediment hosted gold deposit in the Pancake Range of east-central Nevada. The Gold Rock property encompasses approximately 19 square miles (4,910 hectares) of the Battle Mountain-Eureka gold trend on the east flank of the Pancake Range. The Gold Rock Project site is located approximately 30 miles southeast of the town of Eureka in White Pine County. Access to the site is provided by Green Springs Road, an unpaved county road that intersects U.S. Highway 50 approximately 30 miles southeast of Eureka, Nevada. Distance via road from U.S. 50 to the Gold Rock property is approximately 16.5 miles.
The Gold Rock property has a long history of exploration and development, initiated in 1979 under Earth Resources, Inc. Earth Resources, Inc. was acquired by Houston Oil & Gas, which was in turn acquired by Tenneco in 1986. Echo Bay Mines acquired Tenneco in 1986 and discovered the Easy Junior gold deposit that same year. Alta Gold and Echo Bay formed the Alta Bay joint venture in 1988, with Alta Gold acting as the operator. Open pit mining at Easy Junior was initiated in 1989, but production was suspended in 1990 due to low gold prices. Alta Gold acquired the Echo Bay interest in the project in 1992 and initiated re-engineering of the project. Mining under Alta Gold re-started in June 1993 and was concluded in August 1994. Heap leach production continued into 1996. Alta Gold filed for bankruptcy in 1998. Midway acquired control of the project in 2007 through its acquisition of Pan-Nevada and additional property leases and claim staking.
1.3GEOLOGY AND MINERALIZATION
The Gold Rock property is located along an eastern spur of the Pancake Range. Devonian, Mississippian, and Pennsylvanian carbonate and clastic sedimentary rocks form the core of the range and are exposed
| | 1 | January 8, 2015 |
| Summary Amended NI 43-101 Technical Report |
in bedrock outcrops and within the Easy Junior pit in the area of the Gold Rock Project. The sedimentary package illustrates a history of marine shelf carbonate, marine basin shale, shallow sand and subaerial conglomerate depositional environments. These sedimentary rocks are complexly folded and faulted as a result of Mesozoic thrust deformation.
The Gold Rock deposit is a Carlin-style, sediment-hosted, disseminated gold deposit within Mississippian limestone and siltstone units, namely the Joana Limestone and the overlying Chainman Shale. Gold particles occur as micrometer to sub-micrometer size disseminations. Free, coarse gold is not common in these types of deposits and has not been observed at Gold Rock by Midway geologists.
Alteration at Gold Rock is typical of Carlin-type systems in Nevada. Alteration styles include silicification, argillization, decalcification and oxidation. Unlike at the Pan Project where carbon alteration is peripheral to mineralization, at Gold Rock, gold occurs within the carbon-altered, reduced zones and in the oxidized zones without carbon alteration. Gold is often associated with anomalous concentrations of arsenic, antimony, barium, iron, mercury, sulfur, and zinc at Gold Rock.
Mineralization at Gold Rock is localized in the apex and limbs of the slightly overturned, fault-bounded Easy Junior anticline. The primary host is the Joana Limestone, but significant mineralization is also hosted in the overlying Chainman Shale. Scattered, minor mineralization also occurs in the underlying Pilot Shale formation.
The currently identified resource occupies a N12W to N15W trend that extends from 1,000 feet north of the Easy Junior pit to the lower reaches of Meridian Ridge to the south, a strike length of over 11,000 feet. Altered bedrock and surface gold anomalies extend well beyond the mineralization envelope defined by drilling to the north and the south, extending nearly the entire 8-mile length of the property.
Gold occurs as disseminated, micrometer-scale grains hosted in sedimentary rock, usually impure calcareous siltstones and limestones. Mineralization is both structurally and stratigraphically controlled, occurring in vertical and sub-vertical feeder faults and cross faults, brecciated areas of folds, and parallel to bedding in favorable lithologic units.
1.4STATUS OF EXPLORATION
Since acquiring the Gold Rock Project in 2007, Midway has collected and analyzed 1,256 geochemical soil samples, 78 stream sediment samples, and 839 rock chip samples, and has conducted ground magnetic and gravity surveys over selected portions of the property. In 2008, Midway completed 11 reverse circulation (RC) holes in the Anchor Roc prospect at the southeast end of the property, and in 2011, completed a 31-hole drilling program in the vicinity of the Easy Junior open pit and Meridian Flats areas. The most recent drilling campaign was completed in February of 2013, and consisted of 37 RC holes (30,480 feet) and 9 diamond core holes (5,964.5 feet). The 2012-2013 drilling program was designed to increase known mineralization through infill and extension drilling to provide better definition in the area between the two centers of known mineralization (Easy Junior pit and Meridian Flats), and to test additional exploration targets. Core samples of all mineralization types were collected for metallurgical testing, which has since been carried out and is described in detail in Section 13 of this report.
| | 2 | January 8, 2015 |
| Summary Amended NI 43-101 Technical Report |
Midway created a three dimensional (3-D) block model for estimating the mineral resources at the Gold Rock Project from both historical drill data and data generated by Midway. Drill hole data including collar coordinates, down hole surveys, assays and geologic logs are stored in a secure Microsoft Access Database. Geological interpretations were provided by Midway geology and exploration staff.
The drill hole database used for the modeling and estimation of block gold grades at the Gold Rock Project contains 785 drill holes. All available drill hole and surface data was used when developing the geological interpretation. Constraints were applied to the drill hole database to obtain a subset of data for which location, assay, and geological information could be certified from actual records. GRE has conducted a detailed review or duplicated each step of the resource estimation process.
The Mineral Resource Estimation process began with developing mineral domains on paper cross-sections and transferring that information to computer wireframe solid models. The drill hole data was composited to 10-foot down-hole intervals and analyzed statistically and geostatistically for each mineral domain. Midway then estimated the grade of each block in the block model, by mineral domain, using parameters obtained from the geostatistical analysis. Midway used ordinary kriging, inverse distance cubed algorithms, and nearest neighbor methods. Midway then ran Whittle Pit Optimization on the block model to determine the portion of the mineralization that falls within pit shells at various gold prices. GRE has selected the $1,500 dollar pit shell and a cutoff grade of 0.006 ounces per ton (oz/ton) as the preferred case for the Mineral Resource Statement, which is shown below in Table 1-1.
Table 1-1 Whittle Pit Shell Mineral Resource at $1,500 per Ounce at Various Cutoffs
| Class | Cut Off (opt) | Mass Measured (Tons x1000) | Grade Indicated | Gold (Troy ounces) |
| Measured Mineral Resource | ||||
| 0.008 | 1,797 | 0.024 | 43,000 | |
| 0.006 | 1,972 | 0.022 | 44,000 | |
| 0.004 | 2,157 | 0.021 | 45,000 | |
| Indicated Mineral Resource | ||||
| 0.008 | 15,951 | 0.024 | 383,000 | |
| 0.006 | 18,505 | 0.022 | 401,000 | |
| 0.004 | 21,602 | 0.019 | 416,000 | |
| Total Measured and Indicated Mineral Resource | ||||
| 0.008 | 17,749 | 0.024 | 426,000 | |
| 0.006 | 20,477 | 0.022 | 445,000 | |
| 0.004 | 23,759 | 0.019 | 461,000 | |
| Inferred Mineral Resource | ||||
| 0.008 | 8,536 | 0.025 | 215,000 | |
| 0.006 | 10,275 | 0.022 | 227,000 | |
| 0.004 | 12,066 | 0.020 | 236,000 | |
| Internal Waste ( at a 0.004 Cut Off) | ||||
| 119,000 | At a 0.004 opt Cut Off | |||
1.6CONCLUSIONS AND RECOMMENDATIONS
The Gold Rock deposit, formerly known as Easy Junior, contains a substantial gold resource that warrants additional exploration and evaluation. The mineralization system is strong, with a known strike
| | 3 | January 8, 2015 |
| Summary Amended NI 43-101 Technical Report |
GRE has reviewed and audited the work completed by Midway and historic information. Cyanide atomic absorption analysis (CN AA) results were included in the database for assay intervals not also assayed by fire assay at the Robinson laboratory. The CN AA results, on average, understate gold values as compared with fire assay results, but are believed to represent a conservative component to the estimate of gold grade. GRE concludes that there is adequate drilling information to estimate Measured, Indicated, and Inferred mineral resource estimates reported herein. The inverse distance cubed estimate is considered by GRE to be most representative of the mineralization present at Gold Rock and recommends its use in the Mineral Resource Statement. GRE has reviewed and audited the estimation methodology and Whittle pit optimization used by Midway and finds the work done well, complete, and compliant with NI 43-101 standards.
GRE recommends the following:
● | Continued drilling at Gold Rock to validate historic drilling, especially in areas where CN AA and/or Ward FA analyses dominate certain areas (if any). |
● | Drilling at Meridian Ridge to validate the geology and mineralization. |
● | Add CN AA analyses to the next drilling programs to help decipher "ore types"; also, might add total sulphur/sulfide. These would enable distinction between carbon and sulfide types, and could build confidence in visual abilities to distinguish (log) different ore types. Based on the Alta Bay rumor that the south bench was not mined because of recovery issues, you may not want to take for granted anything visual until confirmed with the CN and sulfide analyses. |
● | Conduct multi-element ICP analyses on 50-foot composites, except in areas lacking nearby data or in new areas. |
● | At the end of the next drilling program, conduct a rigorous check assay program including core and reverse circulation samples, OREAS standards and blanks. Use a couple of labs in addition to ALS. This will ensure there are no (or identify potential) biases in the ALS work to date, and help to gain comfort in the OREAS standards that are currently providing assay results either side of the "tolerance levels" provided by OREAS. On this topic, it is suggested that you use the OREAS reported value to measure against, not the on-going average of the Midway results from Gold Rock. |
● | Additional metallurgical testing and column leach. |
● | Conduct a Preliminary Economic Assessment (PEA). |
| | 4 | January 8, 2015 |
| Summary Amended NI 43-101 Technical Report |
Estimated Budget for Verification Drilling Program and Data Compilation
| Program | Cost |
| RC Drilling | $2,000,000 |
| Diamond Core Drilling | $1,000,000 |
| Sample Assays RC | $200,000 |
| Sample Assays Core | $50,000 |
| Conduct PEA | $100,000 |
| Geotechnical Program | $200,000 |
| Road Building, Drill site construction and reclamation | $50,000 |
| Permitting and Bonding | $10,000 |
| Additional metallurgical testing/column leach | $100,000 |
| Initiate baseline environmental studies | $500,000 |
| Metallurgical Characterization | $300,000 |
| TOTAL | $4,510,000 |
| | 5 | January 8, 2015 |
| Introduction Amended NI 43-101 Technical Report |
| 2 | INTRODUCTION |
2.1ISSUER AND TERMS OF REFERENCE
Midway Gold Corp., through its wholly owned subsidiary, Midway Gold US Inc. (collectively Midway), commissioned Global Resource Engineering Ltd. (GRE) to conduct an independent audit and validation of the updated mineral resource estimate for the Gold Rock Project in White Pine County, Nevada, as estimated by Midway. The purpose of this report is to document the updated mineral resource estimate, based on the results of exploration and infill drilling completed in 2012 and 2013, according to Canadian National Instrument 43-101 (NI 43-101) Standards of Disclosure for Mineral Projects. This report also presents the results of the independent review of geologic and technical data and validation of the geologically based block model employed by Midway. All interpretations and conclusions presented herein are based on data available prior to the effective date of this report, May 28, 2014.
This report was prepared in compliance with the disclosure and reporting requirements set forth in NI 43-101, Companion Policy 43-101CP and Form 43-101F1 (June 2011). Mineral resources are classified according to Canadian Institute of Mining, Metallurgy and Petroleum (“CIM”) Definition Standards for Mineral Resources and Mineral Reserves, prepared by the CIM Standing Committee on Reserve Definitions and adopted by CIM Council in May 10, 2014.
2.2SOURCES OF INFORMATION
GRE sourced information from referenced documents as cited in the text and summarized in Section 19 of this report. Midway has previously filed two NI 43-101 Technical Reports on the Gold Rock Project:
Gustavson Associates (2011). NI 43-101 Technical Report on the Gold Rock Project, White Pine County, Nevada, March, 2011.
Gustavson Associates (2012). NI 43-101 Technical Report on Resources, Gold Rock Project, White Pine County, Nevada, April, 2012; updated November, 2012.
A portion of the background information and technical data for this study was obtained from the above reports. Additional information was requested from and provided by Midway. With respect to Sections 6 and 9 through 13 of this report, the authors have relied in part on historical information including exploration reports, technical papers, sample descriptions, assay results, computer data, maps and drill logs generated by previous operators and associated third party consultants. The authors cannot guarantee the quality, completeness, or accuracy of historical information, nor its preparation in accordance with NI 43-101 standards. Historical documents and data sources used during the preparation of this report are cited in Section 19.
2.3PERSONAL INSPECTION
The qualified persons responsible for this report are:
● | Terre A. Lane, Principal Mining Engineer, Global Resource Engineering Ltd. QP-MMSA |
● | Donald J. Baker, PhD, President, OGM Reserves, LLC, QP-MMSA |
● | Deepak Malhotra, PhD, President, RDi |
| | 6 | January 8, 2015 |
| Introduction Amended NI 43-101 Technical Report |
● | Jennifer J. Brown, P.G., Principal Geologist, J.J. Brown P.G. LLC, QP-SME RM |
Ms. Lane is specifically responsible for Sections 14 through 18 of this report. Dr. Donald Baker is responsible for Sections 7 through 12. Ms. Brown is responsible for Sections 1 through 6, 19, and overall content and organization of the report. Dr. Malhotra is responsible for Section 13.
Ms. Lane and Dr. Baker conducted an on-site inspection of the property during the period of May 6 through 8, 2014. The visit included a surface tour of the Gold Rock Project to inspect the distribution of the drill sites (now reclaimed) from the 2012 – 2013 drilling program, and an office review of drilling results, geology and geologic model, QA/QC data, Midway assay and drill hole database, the Midway block model, and other pertinent items.
Ms. Brown conducted an on-site inspection of the Gold Rock property on February 13, 2013. During the site visit, Ms. Brown observed ongoing drilling operations near the Easy Junior open pit, conducted general field reconnaissance of the bulk of the property while accompanied by Midway personnel, and reviewed sampling and protocols and procedures in place at that time.
Dr. Baker, on behalf of Gustavson Associates, conducted an on-site visit to the Gold Rock property on January 12 – 14, 2012, and reviewed available hard copy and electronic historic records and records of the 2011 Midway drilling program. The site visit included approximately one day in the field to verify the locations of historic survey control points, historic drill hole locations and locations of Midway drill holes from its 2011 drilling program. The project geology was also reviewed. One and one-half days were spent in the Midway office in Ely, Nevada, reviewing and verifying historic drill hole information and the Midway 2011 drilling program.
2.4UNITS OF MEASURE
Unless stated otherwise, all measurements reported here are in U.S. Commercial Imperial units, and currencies are expressed in constant 2012 U.S. dollars.
2.5AMENDMENTS
This Updated Mineral Resource Estimate has been amended from the “NI43-101 Technical Report, Updated Mineral Resource Estimate for the Gold Rock Project, White Pine County, Nevada” prepared for Midway Gold Corp. with an effective date of May 28, 2014. The amendments reflected in this Updated Mineral Resource Estimate include:
● | adding Deepak Malhotra’s name to the cover page. |
● | correcting the effective date of the original report in Sections 1.1 and 2.1 |
● | changing the date of the CIM Definitions Standards adoption in Sections 1.1 and 2.1. |
● | correcting the title of Table 1-1 |
● | adding boldface type to the Inferred resources with a 0.006 cutoff in Table 1-1 |
● | adding the definition of the acronym “CN AA” at its first occurrence in the text in Section 1.6 |
| | 7 | January 8, 2015 |
| Introduction Amended NI 43-101 Technical Report |
● | correcting the Section reference in the first and last lines of Section 2.2 |
● | correcting the highway number in Section 5.3 |
● | correcting the misspelling of the word “slightly” in Section 11.2.4 |
● | changing the acronym MDUS to “Midway” in the second bullet on page 65 |
● | replacing “Resource Development Inc.” with the acronym “RDi” in Section 14.2 |
● | deleted the reference to Appendix B in Section 14.4.6 |
● | correcting the spelling of a word in the title of Table 14-8 |
● | correcting the Measured Plus Indicated Resource quantities in Table 14-9 |
● | correcting the Measured, Indicated, and Inferred tonnages reported in Table 14-11 |
● | adding clarifying language regarding the title and date of the Technical Report in item 6 of Donald Baker’s Certificate of Author, item 7 of Terre Lane’s Certificate of Author, and item 9 of Jennifer Brown’s Certificate of Author |
● | changing “date of this certificate” to “effective date of the Technical Report” in item 11 of Donald Baker’s Certificate of Author |
● | updating the date of Donald Baker’s, Terre Lane’s, and Jennifer Brown’s Certificates of Author |
● | updating the business address on Terre Lane’s Certificate of Author |
● | adding a Certificate of Author for Dr. Deepak Malhotra. |
● | Modifying Table 14-9 to disclose separately the estimates of Indicated and Measured Resources. |
This amended Updated Resource Estimate has been prepared in accordance with the requirements of National Instrument 43-101.
| | 8 | January 8, 2015 |
| Reliance on Other Experts Amended NI 43-101 Technical Report |
3 RELIANCE ON OTHER EXPERTS
GRE fully relied upon and disclaims information provided by Midway relating to property ownership and tenure status for the Gold Rock Project. GRE has not reviewed the permitting requirements nor independently verified the permitting status or environmental liabilities of the Gold Rock Project and has fully relied upon and disclaims responsibility for that information derived from experts through the following documents:
● | Tom Williams, Vice President of Environmental Affairs, Midway Gold; email correspondence dated April 11, 2014 (regarding permitting and environmental liability) |
● | Bill Neal, Vice President of Geological Services, Midway Gold; email correspondence dated May 7, 2014 (regarding property ownership and mineral tenure) |
Information from the sources listed above is presented in Section 4 of this report.
| | 9 | January 8, 2015 |
| Property Description and Location Amended NI 43-101 Technical Report |
| 4 | PROPERTY DESCRIPTION AND LOCATION |
4.1LOCATION
The Gold Rock property encompasses approximately 19 square miles (4,910 hectares) of the Battle Mountain-Eureka gold trend on the eastern side of the Pancake Range in east-central Nevada. The Gold Rock Project site is located in White Pine County approximately 30 miles southeast of the town of Eureka (Figure 4-1).
The location of the Gold Rock property is found on the United States Geological Survey (USGS) Ely 1:100,000 scale topographic map and the USGS Pancake Summit SW and Black Point 1:24,000 scale, 7.5 minute series quadrangle maps. The geographic center of the property is located at 39°17’N latitude and 115°44’W longitude, and the primary zone of mineralization is located in Sections 9, 10, and 16, Township 15 North, Range 56 East, Mount Diablo Base and Meridian (MDBM). Access to the site is provided by Green Springs Road, an unpaved county road which originates at U.S. Highway 50.
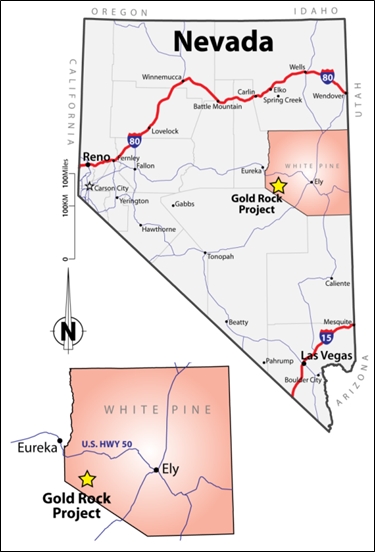
Figure 4-1 Property Location Map
| | 10 | January 8, 2015 |
| Property Description and Location Amended NI 43-101 Technical Report |
4.2MINERAL TENURE AND AGREEMENTS
4.2.1 Mineral Rights
Mining claims and mineral leases for the Gold Rock property encompass an area of approximately 19,512 acres (7,986 ha) (Figure 4-2). The Property consists of 995 contiguous, active, unpatented lode mining claims covering portions of Sections 2 through 10, 15 through 22, 27 through 29, and 32 through 34, Township 15 North, Range 56 East; and Sections 22 through 23, 25 through 29, and 31 through 35, Township 16 North, Range 56 East, MDBM. Unpatented mining claims are kept active through payment of a maintenance fee due on August 31st of each year. All unpatented claims are on land managed by the Bureau of Land Management (BLM). The unpatented mining claims were individually surveyed at time of location, and maps were filed with the BLM and White Pine County.
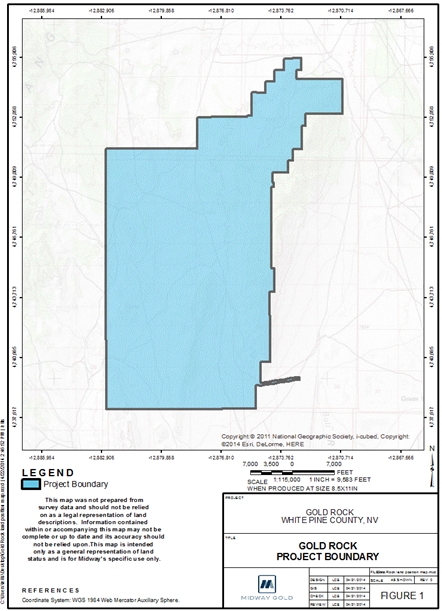
Figure 4-2 Mineral Claim Map
| | 11 | January 8, 2015 |
| Property Description and Location Amended NI 43-101 Technical Report |
4.2.2 Agreements
Property agreements associated with the Gold Rock Project are summarized in Table 4-1. Table 4-1 documents the nature of title, obligations to retain the property, royalties, payments, and expiration dates of the agreements. No back-in rights or other encumbrances exist.
Table 4-1 Property Agreements
| Ownership | Agreement Date | Expiry | Owner | Unpatented Claims | Gold Royalty | Approx. Acreage | Work Commitment | Payments |
| Leased | 1/15/2007, amended 1/26/2008 | 1/15/2017 | Anchor Minerals, Inc. | 80 | 3.5% Gross | 1,653 | $30,000/yr | $67,476/yr |
| Optioned | 1/24/2008 | 1/14/2023 | B. Peart | 13 | 2-6% NSR | 207 | - | $60,000/yr |
| Leased | 3/20/2006, amended 1/1/2009 | 3/20/2016 | Nevada Royalty Corp (formerly Newark Valley Mining) | 334 | 2.5-4% Gross | 6,000 | $75,000/yr | Annual payments: $143,000 est. for 2014 |
| Optioned | 2/13/2008 | 2/13/2023 | J. Pankow | 2 | 2-5% NSR | 41 | - | $9,250/yr |
| Owned | - | - | Midway | 549 | - | 11,342 | - | - |
| Optioned | 2/15/2004, assigned to Midway 2/13/2008 | - | R. W. Jordan | 13 | 2.5% NSR | 268 | - | $15,000/yr |
NSR – Net Smelter Royalty
yr – year
4.3ENVIRONMENTAL LIABILITIES AND PERMITTING
4.3.1 Environmental Liabilities
GRE knows of no existing environmental liabilities associated with the Gold Rock Project.
4.3.2 Permitting
Midway is currently completing a draft Environmental Impact Statement (EIS). The draft EIS is expected to be published in August 2014, with the final EIS and Record of Decision (ROD) projected for February 2015. State permitting efforts will being in January 2015, and should be complete in January 2016, ahead of spring construction.
In January of 2011, Midway submitted a Notice (N-89526) for 3.6 acres of disturbance, and in August amended the Notice to include another 1.4 acres for a total of 5 acres. A second amendment was submitted in November for the installation of a meteorological station.
Midway is presently conducting exploration activities conducted under the 2012 Gold Rock Exploration Project Plan of Operations Amendment (Case File Number NVN-09376), and Reclamation Permit Application Modification Permit No. 0326) (MGC Resources 2012) authorized by the Decision Record/Finding of No Significant Impact (DR/FONSI) dated November 15, 2012 (BLM 2012).
| | 12 | January 8, 2015 |
| Property Description and Location Amended NI 43-101 Technical Report |
The 2011 exploration plan and 2012 amendment area total approximately 267 acres of authorized surface disturbance. The authorized activities consist of:
| ● | using overland travel |
| ● | constructing drill roads |
| ● | constructing drill pads and sumps |
| ● | conducting geologic mapping |
| ● | performing surface hand sampling of rocks, growth media and/or vegetation |
| ● | excavating trenches for activities such as geotechnical testing, geochemical analyses, bulk samples, or metallurgical analyses |
| ● | drilling auger boreholes |
| ● | constructing groundwater monitoring wells and monitoring these wells |
| ● | installing a meteorological tower |
| ● | installing a mobile microwave tower for communications |
| ● | constructing one laydown area for temporary storage of drilling materials, equipment, and support facilities. |
Future advancement of the Gold Rock Project will require a number of permits and environmental studies. It is expected that these permits and studies will be similar in nature to those required at Midway’s Pan Project, which has advanced to the permitted development stage. We would expect the permits and studies to include those identified in Table 4-2.
Table 4-2 Major Permits and Authorizations Required for Project Development
| Permit/Approval | Granting Agency | Permit Purpose |
| Federal Permits Approvals and Registrations | ||
| Plan of Operations/EA Amendment | U.S. Bureau of Land Management | Prevent undue degradation in relation to exploration activities or expansion areas. |
| Plan of Operations/EIS | U.S. Bureau of Land Management | Prevent unnecessary or undue degradation associated with Plan of Operations, EIS to disclose environmental impacts and project alternatives. Requires financial assurance. Currently have Plan for exploration with EA in progress |
| Explosives Permit | U.S. Bureau of Alcohol, Tobacco & Firearms | Storage and use of explosives |
| EPA Hazardous Waste ID No. | U.S. Environmental Protection Agency | Registration as a small-quantity generator of wastes regulated as hazardous |
| Notification of Commencement of Operations | Mine Safety & Health Administration | Mine safety issues, training plan, mine registration |
| | 13 | January 8, 2015 |
| Property Description and Location Amended NI 43-101 Technical Report |
| Permit/Approval | Granting Agency | Permit Purpose |
| Federal Permits Approvals and Registrations | ||
| Nationwide Section 404 Permit | U.S. Army Corps of Engineers | Installation of any required culverts on the access road (not anticipated to be necessary |
| Endangered Species Act | U.S. Fish and Wildlife Service | Only if project affects species listed as threatened or endangered (not anticipated to be necessary) |
| Federal Communications Commission | FCC | Frequency registrations for radio/microwave communication facilities |
| State Permits | ||
| Air Quality Operating Permit | NV Division of Environmental Protection/Bureau of Air Pollution Control | Regulates project sources of air emissions. Will require compliance with the new |
| Mercury Operating Permit to Construct Air | NV Division of Environmental Protection/Bureau of Air Quality Planning/ Nevada Mercury Air Emissions Control Program | Requires use of NVMACT for all thermal units that have the potential to emit mercury |
| Reclamation Permit | NV Division of Environmental Protection/Bureau of Mining Regulation & Reclamation | Reclamation of surface disturbance due to mining and mineral processing includes financial assurance requirements. Site currently operates under Reclamation Permit No. 0228. |
| Water Pollution Control Permit | NV Division of Environmental Protection/Bureau of Mining Regulation & Reclamation | Prevent degradation of waters of the state from mining, establishes minimum facility design and containment requirements. Site currently operates under WPCP NEV70010. |
| Petroleum-Contaminated Soil Management Plan | NV Division of Environmental Protection/Bureau of Mining Regulation & Reclamation | On-site treatment and management of hydrocarbon-contaminated soils |
| Solid Waste Class III Landfill Waiver | NV Division of Environmental Protection/Bureau of Solid Waste | On-site disposal of non-mining, non-hazardous solid wastes |
| General Stormwater Discharge Permit | NV Division of Environmental Protection/Bureau of Water Pollution Control | Management of site stormwater |
| Permit to Appropriate Water | NV Division of Water Resources | Water appropriation |
| Permit to Construct Impoundments | NV Division of Water Resources | Design and construction of a tailings embankment or other structures with a crest height 20 feet or higher, as measured from the downstream toe to the crest, or that will impound 20 acre-feet or more |
| Industrial Artificial Pond Permit | NV Department of Wildlife | Ponds containing chemicals directly associated with the processing of ore. |
| Liquefied Petroleum Gas License | NV Board of the Regulation of Liquefied Petroleum Gas | Tank specification and installation, handling, and safety requirements |
| Potable Water System Permit | NV Bureau of Safe Drinking Water | Water system for drinking water and other domestic uses (e.g., lavatories) |
| | 14 | January 8, 2015 |
| Property Description and Location Amended NI 43-101 Technical Report |
| Permit/Approval | Granting Agency | Permit Purpose |
| Federal Permits Approvals and Registrations | ||
| Radioactive Materials License | NV Bureau of Safe Drinking Water | Nuclear flow and mass measurement devices if used in the mineral processing facilities |
Septic Treatment Permit Sewage Disposal System | NV Division of Environmental Protection/Bureau of Water Pollution Control | Design, operation, and monitoring of septic and sewage disposal systems |
| Hazardous Materials Storage Permit | Nevada Fire Marshall | Hazardous materials safety |
| Local Permits | ||
| Building Permits | White Pine County Building Planning Department | |
| Conditional Special Use Permit | White Pine County Building Planning Department | |
| County Road Use and Maintenance Permit | White Pine County Building Planning Department | Use and maintenance of county roads |
| | 15 | January 8, 2015 |
| Accessibility, Climate, Local Resources, Infrastructure and Physiography Amended NI 43-101 Technical Report |
| 5 | ACCESSIBILITY, CLIMATE, LOCAL RESOURCES, INFRASTRUCTURE AND PHYSIOGRAPHY |
5.1ACCESSIBILITY
Access to the Gold Rock Project site is provided by Green Springs Road, an unpaved county road that intersects U.S. Highway 50 approximately 30 miles southeast of Eureka, Nevada. It is approximately 16.5 miles, via road, from U.S. 50 to the Gold Rock property. The property is accessible year-round, but weather conditions occasionally make access and on-site travel difficult during the winter months.
5.2TOPOGRAPHY, ELEVATION, VEGETATION, AND CLIMATE
Local terrain at the Gold Rock Project site is gentle to moderate, with rolling hills and no major stream drainages. Elevation at the property ranges from 6,400 to 7,600 feet above sea level. Vegetation is typical of northern Nevada, including a mix of sparse Juniper and Pinion pine forest broken by areas of sagebrush and grass. No springs are known to exist on the Gold Rock property.
The local climate is typical for the high desert of east-central Nevada and the Basin and Range province. Climate data for nearby Eureka, Nevada, shows an average of 11.85 inches of precipitation per year and average temperatures ranging from 17°F in the winter to 86.4°F in the summer, with daytime temperatures commonly exceeding 90°F during the months of July and August (Western Regional Climate Center, 2008). Operations on the Gold Rock Project may be conducted year-round.
No perennial surface waters exist on or near the project site. The nearest surface water is Bull Creek, 8.8 miles to the southeast of the site and on the opposite side of the Pancake Range. The project site is located outside of the 100-year flood plain. The Easy Junior mine’s water supply well was drilled approximately 5 miles southeast of the mine area, and the water produced is of potable quality. The water table at the Gold Rock Project site (Easy Junior mine area) occurs at a depth of approximately 1,300 feet below ground surface (NDEP, 1995a).
5.3INFRASTRUCTURE AND LOCAL RESOURCES
The town nearest to the project site, Eureka, Nevada, hosts a population of 1,373, including the surrounding area, according to 2012 U.S. Census data. Greater Eureka County and White Pine County host area populations of 2,001 and 10,042, respectively (U.S. Census Bureau, 2012), though population is centered primarily in Eureka and Ely, Nevada. Elko, Nevada, population of 19,386, is the nearest city to the project site, and is located approximately 110 miles to the north by road.
Electrical power is available via a power line that runs adjacent to and 6 miles north of U.S. Highway 50, approximately 20 miles from the project site. Midway plans to construct a power line to its Pan Project site, approximately 10 miles to the NNW of the Gold Rock Project, and has included an extension of the power line to the Gold Rock Project site in the design for future permitting. Water for exploration, mine production, and process efforts will need to be identified and secured.
Logistical support is available in Eureka, Ely, and Elko, all of which currently support large open pit mining operations. Barrick Gold Corporation currently operates the Ruby Hill Mine near Eureka and the Bald Mountain Mine approximately 60 miles to the north. KGHM International operates the Robinson
| | 16 | January 8, 2015 |
| Accessibility, Climate, Local Resources, Infrastructure and Physiography Amended NI 43-101 Technical Report |
Mine near Ruth, and large scale mining by Barrick and Newmont Mining Corporation is ongoing near Elko and Carlin, Nevada to the north.
Mining history in the area of the Gold Rock Project dates back to 1876, when underground silver mining and smelting were based in Eureka. Mining personnel and resources for exploration and potential operations at Gold Rock are expected to be available from Eureka and Ely, as well as from outlying areas in White Pine and Elko Counties.
| | 17 | January 8, 2015 |
| History Amended NI 43-101 Technical Report |
| 6 | HISTORY |
6.1OWNERSHIP AND EXPLORATION
The following history of the Gold Rock property is presented from records of the Alta Gold Company and Alta Gold and Echo Bay including Carden (1988, 1991) and Alta Bay (1990, 1991):
● | The property was first staked in 1979 by Earth Resources, Inc. |
● | Earth Resources was purchased by Houston Oil & Gas in 1980 |
● | The property was sub-leased to various parties between 1981 and 1986, but was returned to Tenneco, who had acquired Houston Oil & Gas in 1986 |
● | Following a 1,200-sample soil sampling program in 1986, rock chip sampling results in the Easy Junior Ridge area included 32 samples that averaged 0.58 parts per million (ppm) gold |
● | In September of 1986, Echo Bay exploration acquired Tenneco and subsequent drilling at Easy Junior resulted in a discovery; 42 RC holes were drilled, and the best recorded intercept is 320-feet of 0.066 ounces per ton (opt) gold |
● | Echo Bay drilled a total of 229 holes in 1987 and 1988 in an effort to delineate the Easy Junior deposit |
● | The Alta Bay Joint Venture was formed between Echo Bay and Alta Gold in 1988 |
● | Mine development was initiated in 1989 under the Alta Bay Joint Venture, with Alta Gold as operator |
● | Mining was suspended in 1990 due to low gold prices |
● | Alta Gold purchased Echo Bay’s interest in 1992 and began detailed re-engineering studies |
● | Mining resumed at Easy Junior in June 1993 |
● | Mining was completed at Easy Junior in August 1994; total production for the life of the mine was 52,400 ounces gold |
● | Heap leach processing was completed in 1996 |
● | Alta Gold declared bankruptcy in 1998 |
There is no record of new drilling or significant exploration after 1994 until 2008, when Midway acquired the property and re-initiated exploration activity.
6.2RESOURCE AND RESERVE ESTIMATES
Records regarding historical resource and reserve estimates are fragmentary. For most of the life of the project, the operators relied on in-house estimates to determine the value of the property. Only two reports were produced by independent sources. The resource and reserve estimates described below were not completed according to present NI 43-101 standards and have not been verified by a Qualified Person. These estimates do not represent current mineral resources or reserves and are disclosed here for historical completeness only.
| | 18 | January 8, 2015 |
| History Amended NI 43-101 Technical Report |
In 1988, Echo Bay contracted with Independent Mining Consultants, Inc. (IMC) of Tucson, Arizona. IMC built a resource model using a kriged estimate from 20-foot drill hole composites and 25-foot by 25-foot blocks. IMC did not apply any economic constraints to the model, but reported tons and grade from a series of cut-offs. This model was created prior to any mining at Easy Junior and it must be assumed that significant portions were subsequently mined. The results are summarized in Table 6-1.
Table 6-1 IMC Geological Reserve (Geologic Inventory, No Economic Constraint)
| Cut-off Grade (oz/ton) | Tons | Grade (oz/ton) | Ounces |
| 0.050 | 758,000 | 0.064 | 48,512 |
| 0.030 | 3,552,000 | 0.043 | 152,736 |
| 0.025 | 4,953,000 | 0.039 | 193,167 |
| 0.020 | 6,963,000 | 0.034 | 236,742 |
| 0.015 | 9,934,000 | 0.029 | 288,086 |
| 0.010 | 12,641,000 | 0.025 | 316,025 |
oz – ounce oz/ton – ounces per ton | |||
In 1989, Alta Gold commissioned Pincock Allen and Holt (PAH) of Lakewood, Colorado, to conduct an audit and verification of the reserves at Easy Junior. Details are lacking, but the Alta Gold model was constructed using Inverse Distance Cubed estimation. The geologic inventory of mineralization at a cut-off of 0.008 opt was 15,400,000 tons at a grade of 0.028 opt for 400,000 ounces gold.
PAH estimated a Proven and Probable reserve after applying expected mining costs and recoveries, as shown in Table 6-2.
Table 6-2 Proven and Probable Reserve
Crushed Ore (0.013 opt cut-off) | Grade (opt) | Ounces | Run-of-Mine (0.009 opt cut-off) | Grade (opt) | Ounces | |
| 5,058,000 | 0.032 | 161,900 | 1,460,000 | 0.01 | 14,600 | |
| opt – ounces per ton | ||||||
Mining costs have changed significantly since the time of these estimations, and available information is not sufficient to determine which portions of the resource or reserve were mined as ore or waste.
The physical design criteria and cutoff grade calculations used by Alta Gold for development of the Easy Junior pit are presented in Table 6-3 and Table 6-4 (from PAH, 1989).
| | 19 | January 8, 2015 |
| History Amended NI 43-101 Technical Report |
Table 6-3 Physical Pit Design Criteria
| Alta Gold – Easy Junior Project | |
| Physical Pit Design Criteria | |
Maximum Slope Angle (°) | 53 |
| Bench Height (ft) | 15 |
| Catch Bench Interval (ft) | 45 |
| Catch Bench Width (ft) | 20 |
| Road Width (ft) | 55 |
| Road Grade (%) | 10 |
Tonnage Factor (ft3/ton) | 13 |
° - degrees ft – feet ft3/ton – cubic feet per ton | |
Table 6-4 Cut-off Grade Check Calculations
| Alta Gold – Easy Junior Project | ||
| Cutoff Grade Check Calculations | ||
| Internal Cut-off | ||
| Ore | ROM | |
| Mining Cost | N/A | N/A |
| Mine Equip. Replacement Cost | N/A | N/A |
| Processing Cost | 2.74 | 1.10 |
| G & A Cost | 1 | N/A (1) |
| Total Costs, $/ton | 3.34 | 1.10 |
| Gold Price, $/oz | 375.00 | 375.00 |
| Net Smelter Return, Percent | 99.5 | 99.5 |
| Recovery, Percent | 75 | 60 |
| Net Revenue, $/oz | 279.84 | 223.88 |
Cutoff, oz/ton (2) | 0.012 | 0.005 |
| Alta Gold Cut-off | 0.013 | 0.009 |
(1) Not including G&A costs is valid only if ROM heap leach is a secondary process. (2) Cut-off = Total costs/Net Revenue2 G&A – General and Administrative $/ton – dollars per ton $/oz – dollars per ounce oz/ton – ounces per ton | ||
| | 20 | January 8, 2015 |
| Geological Setting and Mineralization Amended NI 43-101 Technical Report |
7 GEOLOGICAL SETTING AND MINERALIZATION
7.1REGIONAL GEOLOGY
The Gold Rock property is located on the west flank of Nighthawk Ridge in the northern portion of the Pancake Range of east-central Nevada. The Pancake Range is part of the Basin and Range Province, a large physiographic region characterized by a series of normal faults expressed as a sequence of north-south trending, narrow mountain ranges separated by flat, arid valleys. The Pancake Range is approximately 85 miles long and 8 to 10 miles wide, and is primarily composed of folded and thrusted Paleozoic carbonate and clastic sedimentary rocks, Cretaceous igneous intrusives, and Tertiary volcanics. A regional geologic map which covers the Gold Rock Project area is presented as Figure 7-1.
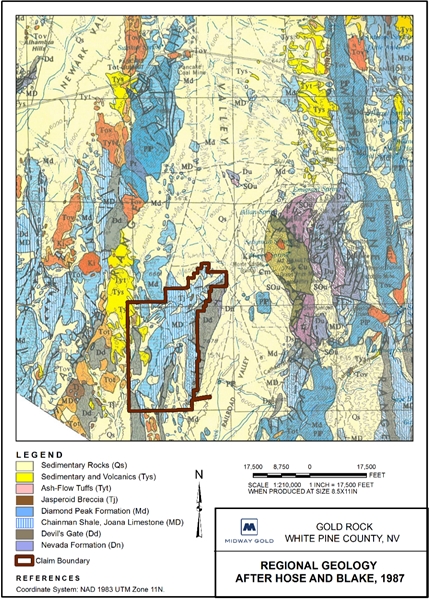
Figure 7-1 Regional Geology (Hose and Blake, 1987)
| | 21 | January 8, 2015 |
| Geological Setting and Mineralization Amended NI 43-101 Technical Report |
The Gold Rock property is located along an eastern spur of the Pancake Range. Devonian, Mississippian and Pennsylvanian carbonate and clastic sedimentary rocks form the core of the range, and are exposed in bedrock outcrops and within the Easy Junior pit in the area of the Gold Rock Project. The sedimentary package illustrates a history of marine shelf carbonate, marine basin shale, shallow sand and subaerial conglomerate depositional environments. These sedimentary rocks are complexly folded and faulted as a result of Mesozoic thrust deformation. A simplified stratigraphic column for the Gold Rock Project area is presented in Figure 7-2.
The Pancake stock, a Cretaceous-aged quartz monzonite intrusive, is located to the north and west of the property, and a prominent sill is noted in associated regional mapping. These intrusives appear to be age equivalents of the Mount Hamilton stock, which occurs in the White Pine Range to the northeast. No intrusive rocks have been mapped on the Gold Rock property.
Younger volcanics, probably equivalent to the Oligocene Pinto Basin Tuff, are present in scattered outcrops in and around the project area, likely representing the erosional remnants of a once much larger mantle of volcanic deposition. Crystal tuffs and andesite flows of similar age are present in the area (notably at the Pan Project to the north), but have not been observed on the Gold Rock property. Tertiary and Quaternary gravels and alluvium cover the topographically lower regions of the project area.
7.3PROPERTY GEOLOGY
During the summer and fall of 2013, Midway re-mapped the entire Gold Rock property utilizing tablet computers and geographic information system (GIS) software. The resulting detailed geologic map is presented as Figure 7-3. The geology of the Gold Rock property is dominated by Devonian through Mississippian limestone, shale, and sandstone. These rock types are exposed in a series of north-trending ridges that represent stacked, easterly-directed thrust blocks and low amplitude, open to tight folds. Mineralization is interpreted to postdate thrusting and folding. Bedrock geology is partially obscured by alluvial and colluvial gravels.
7.4STRATIGRAPHY
Prior to the re-mapping effort, Midway geologists re-measured the individual lithologic units in order to better define the property stratigraphy. Measurement locations were selected based on the quality of the exposure of the target unit. Measurements were collected using a Jacob Staff and Brunton compass and were recorded on tablet computers. Measurement locations specific to each lithologic unit are shown in Figure 7-4, and the generalized stratigraphic section compiled from the measurements is presented as Figure 7-5.
7.4.1 Late Devonian Devil’s Gate Limestone (Dd)
The lowermost lithologic unit in the Gold Rock Project area is the Devil’s Gate Limestone. The base of the unit is not exposed on the property, but a 1,500-foot thickness was measured on the eastern face of the Nighthawk Ridge hogback, directly east of the project area. The lower 400 feet are composed of
| | 22 | January 8, 2015 |
| Geological Setting and Mineralization Amended NI 43-101 Technical Report |
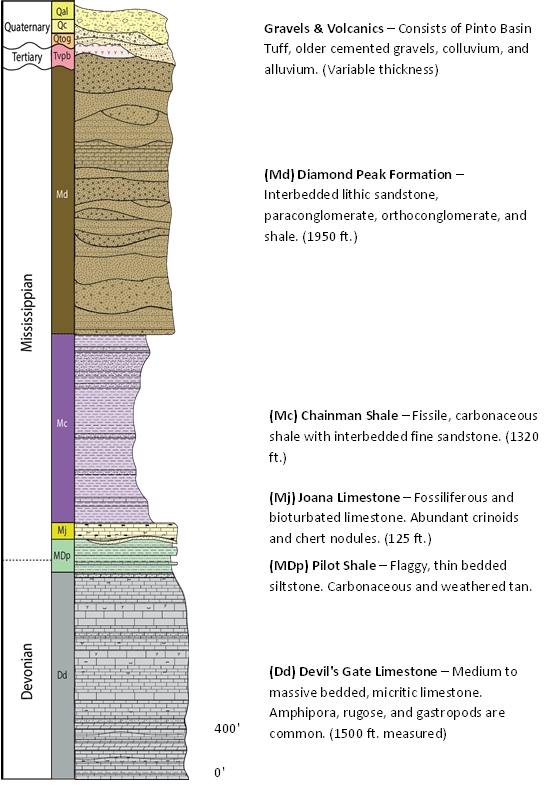
Figure 7-2 Simplified Stratigraphic Column, Gold Rock Project (Midway, 2014)
| | 23 | January 8, 2015 |
| Geological Setting and Mineralization Amended NI 43-101 Technical Report |
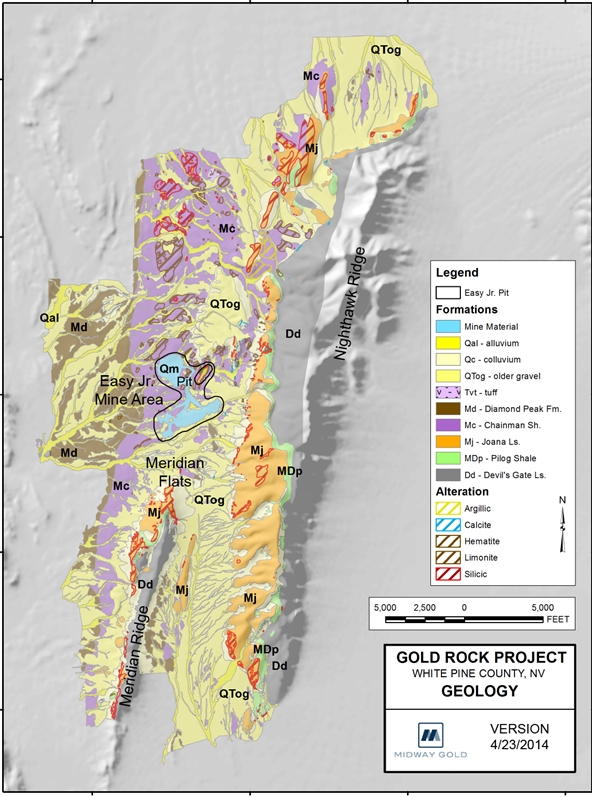
Figure 7-3 Geology and Alteration of the Gold Rock Project (Midway, 2014)
| | 24 | January 8, 2015 |
| Geological Setting and Mineralization Amended NI 43-101 Technical Report |
-
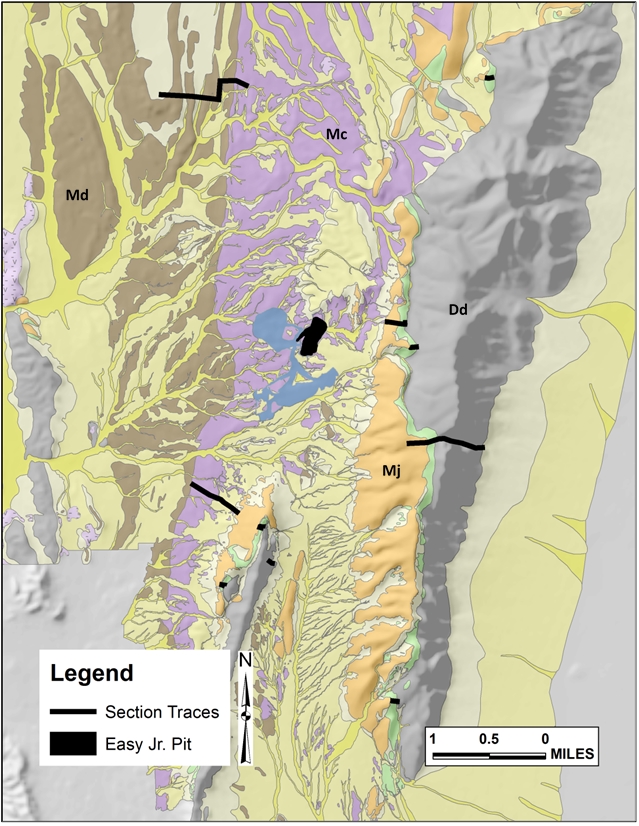
Figure 7-4 2014 Stratigraphic Section Measurement Traces, Gold Rock Project (Midway, 2014)
| | 25 | January 8, 2015 |
| Geological Setting and Mineralization Amended NI 43-101 Technical Report |
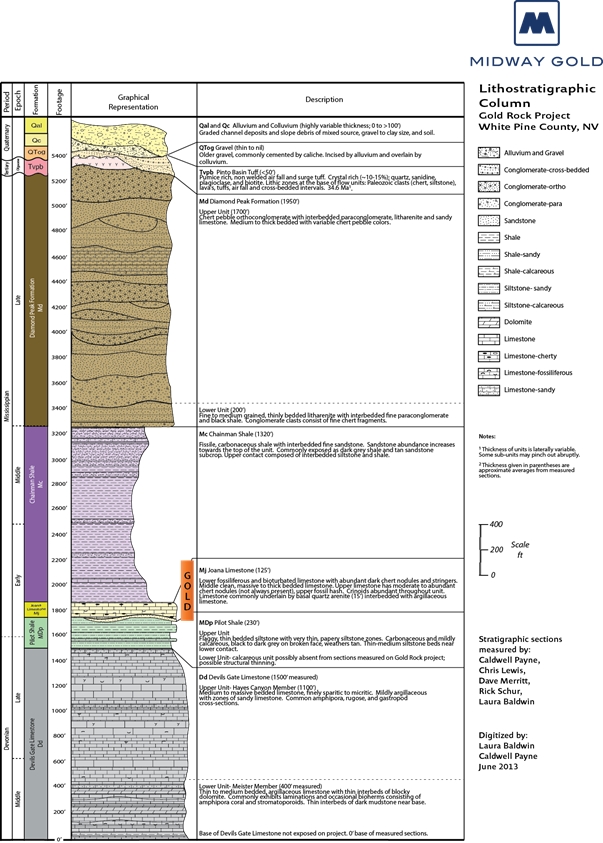
Figure 7-5 Stratigraphic Column, Gold Rock Project (Midway, 2014)
| | 26 | January 8, 2015 |
| Geological Setting and Mineralization Amended NI 43-101 Technical Report |
medium to thinly bedded argillaceous limestone with interbeds of blocky dolomite, which likely represent the Meister Member of the Devil’s Gate Limestone as described by Nolan and others (1974). The upper 1,100 feet is massive to medium bedded, finely sparitic to micritic limestone with zones of weakly argillaceous to sandy limestone. This portion of the unit is interpreted as part of the Hayes Canyon Member as described by Nolan and others (1974). The fossil assemblage of this unit consists of gastropods and amphipora and rugose coral.
7.4.2 Late Devonian to Early Mississippian Pilot Shale (MDp)
The Pilot Shale occurs on the Gold Rock property as weathered tan, flaggy siltstone, with zones of very thin, papery siltstone. It is locally carbonaceous and mildly calcareous, and is black to dark grey on fresh broken faces. Thin to medium siltstone beds occur near the base of the unit. The measured section of Pilot Shale at the Gold Rock property is approximately 230 feet thick. At the nearby Pan Project, the Pilot Shale measures 670 feet and includes a lower unit with limestone and calc-shale beds. This lower unit was not observed in sections measured at Gold Rock. At Pan, the lower Pilot Shale is the primary host for gold mineralization. At Gold Rock, the only significant mineralization in the Pilot Shale identified to date occurs at the southern end of Nighthawk Ridge.
7.4.3 Mississippian Joana Limestone (Mj)
The Joana Limestone measures 125 feet thick on the Gold Rock property, and consists of three zones: a lower fossiliferous and bioturbated limestone with abundant dark chert nodules and stringers; a middle clean, massive to thick bedded limestone; and an upper limestone with moderate to abundant chert nodules (not always present) and fossil hash. The limestone zones are commonly underlain by basal quartz arenite (0-15 feet) interbedded with argillaceous limestone. Crinoid fossils are abundant throughout the unit. This unit is commonly silica altered (mapped as jasperoid) throughout the project area, including beyond zones of currently known mineralization. The Joana Limestone is the primary host to known mineralization and historic resources and reserves at the Gold Rock property.
7.4.4 Mississippian Chainman Shale (Mc)
The Chainman Shale is dark gray to black, fissile, carbonaceous shale with interbedded fine sandstone. Sandstone abundance increases toward the top of the unit. Surface exposures are dark grey or olive shale with beds of tan sandstone. The upper contact is a gradational change from interbedded siltstone and shale to interbedded sandstones and siltstones. The unit is 1,320 feet thick at the Gold Rock Project. A significant amount of the mineralization mined from the Easy Junior pit was from the lower portions of the Chainman Shale adjacent to the mineralized Joana Limestone.
7.4.5 Mississippian Diamond Peak Formation (Md)
The Diamond Peak Formation has two distinct zones: an upper zone of chert pebble orthoconglomerate and a lower zone dominated by lithic sandstone. The upper zone is approximately 1,700 feet thick at Gold Rock, and contains variably thick beds of orthoconglomerate with interbedded paraconglomerate, litharenite, and sandy limestone. The lower zone consists of fine to medium grained, thinly bedded litharenite with interbedded fine paraconglomerate and black shale. Conglomerate clasts consist of fine chert fragments. The lower zone is approximately 200 feet thick at Gold Rock, giving the Diamond Peak Formation a maximum local thickness of about 1,900 feet.
| | 27 | January 8, 2015 |
| Geological Setting and Mineralization Amended NI 43-101 Technical Report |
7.4.6 Tertiary Pinto Basin Tuff (Typb)
The Pinto Basin Tuff is exposed as pockets of pumice rich, non-welded air fall and surge tuff deposited in apparent paleotopographic lows. It is crystal rich (~10-15%) with quartz, sanidine, plagioclase, and biotite crystals. Lithic zones at the base of flow units include Paleozoic clasts (chert, siltstone), lavas, tuffs, air falls and cross-bedded intervals. The unit is generally less than 50 feet thick at Gold Rock and pinches out abruptly or occurs in sporadic and usually thin outcrops.
7.4.7 Quaternary-Tertiary Older Gravel (QTog)
The bedrock units at Gold Rock are mantled in places by an identifiable and mappable older gravel deposit, which consists of heterolithic (mixed shale, limestones, and jasperoid) caliche-cemented gravel. Clasts range in size from relatively large cobbles to fine sand, and the unit can be variably matrix-supported or clast-supported. The caliche-cemented portions, exposed in steep slopes or during construction of roads and drill sites, can be three to five feet thick, creating significant boulders of consolidated gravel. This unit is exposed on the middle and lower slope of Nighthawk Ridge. Lenses of this gravel are usually relatively thin (tens of feet), but at least one occurrence north of the Easy Junior pit has an estimated mapped thickness about 100 feet.
7.4.8 Quaternary Alluvium and Colluvium (Qal and Qc)
Variable size deposits of colluvium and alluvium occur throughout the Gold Rock property. Colluvium (Qc) is the eroded remnants of local bedrock and usually consist of relatively coarse cobble to sand-sized angular fragments. Colluvial deposits occur in the upper reaches of the terrain, often along steep slopes or at breaks in gradient. Alluvium (Qal) is stream carried sediment, deposited as coarse alluvial fans at the base of steep drainages, or as sand and silt deposits adjacent to (or forming channels within) bedrock.
7.5STRUCTURAL GEOLOGY
7.5.1 Fold and Thrust Deformation
The Gold Rock property is characterized by a relatively subdued topography of valleys and ridges composed of shale and limestone and partially covered by a thin veneer of gravel. The subdued character masks a complexly thrust-faulted and folded terrain. The principal structural fabric is dominated by an imbricate thrust-fault system and associated complex folding. These faults and folds transect the length of the property and generally strike about 15° east of north (N15E). This trend is cross cut by a system of NE-SW oriented cross faults, and less commonly NW- SE oriented cross faults. Figure 7-6 shows the location and plan view orientation of faults in the Gold Rock resource area.
Cross cutting, high-angle faults offset the main north-south structures along the length of the property. These structures trend N60E to N75E (Figure 7-6). These structures are identified by lithologic offsets on the surface, and can be also identified by lithologic offsets in drill holes near the Easy Junior pit area. Offsets appear to be either dip-slip or oblique-slip and generally have apparent offsets of perhaps hundreds of feet or less. Offset is quite variable along the length of these faults, and
| | 28 | January 8, 2015 |
| Geological Setting and Mineralization Amended NI 43-101 Technical Report |
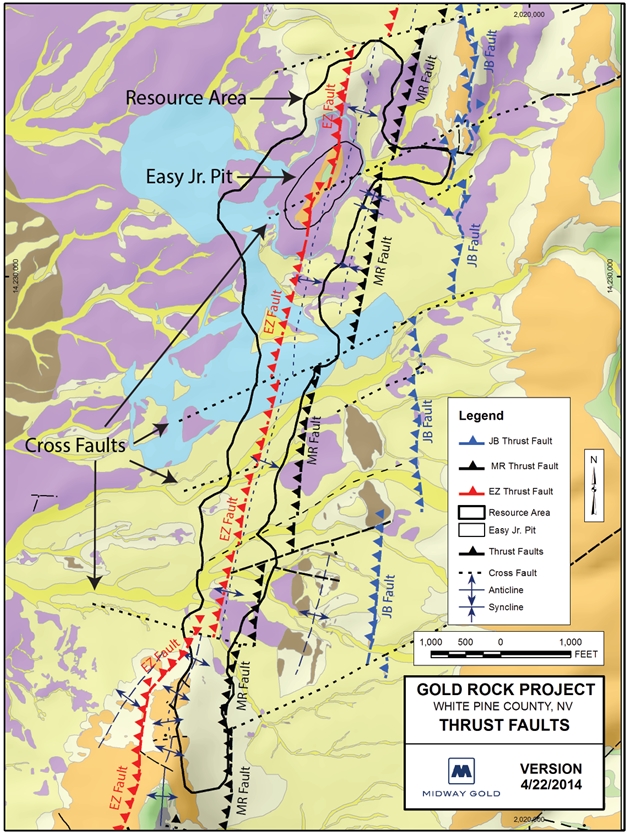
Figure 7-6 Thrust Faulting in the Vicinity of the Gold Rock Project Area
| | 29 | January 8, 2015 |
| Geological Setting and Mineralization Amended NI 43-101 Technical Report |
A cross section across the Gold Rock property through the Easy Junior pit is presented as Figure 7-7. The imbricate thrust system at Gold Rock is characterized by a system of three thrust faults: the EZ fault, the MR fault, and the JB fault. These faults are relatively steep where observed in outcrop (>50o), commonly have highly variable apparent offsets, and can be followed for significant distances along strike.
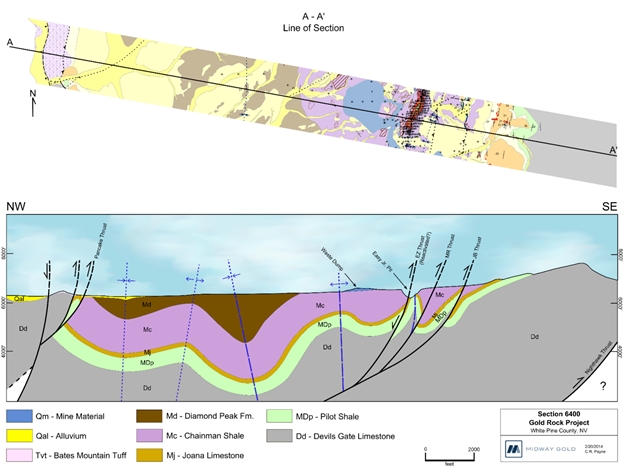
Figure 7-7 Cross Section through the Easy Junior Pit, Gold Rock Project
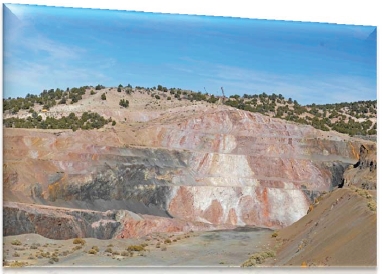
Within the imbricate thrust zone, the rock units are tightly folded in response to the same compression responsible for the thrust faulting. Most notable is the Easy Junior anticline situated between the EZ and MR faults. This anticline is clearly exposed in the Easy Junior pit (Figure 7-8) and has been defined by drilling to both the north and the south. In the north high wall of the pit, the fold is largely characterized by the altered and mineralized Joana Limestone. The limestone is folded back on itself in a tight isoclinal fold. On the south high wall, the EZ fault entrains a block of oxidized limestone.
| | 30 | January 8, 2015 |
| Geological Setting and Mineralization Amended NI 43-101 Technical Report |
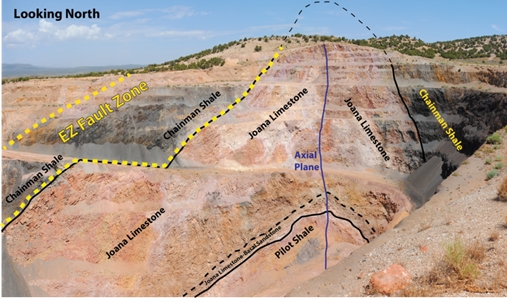
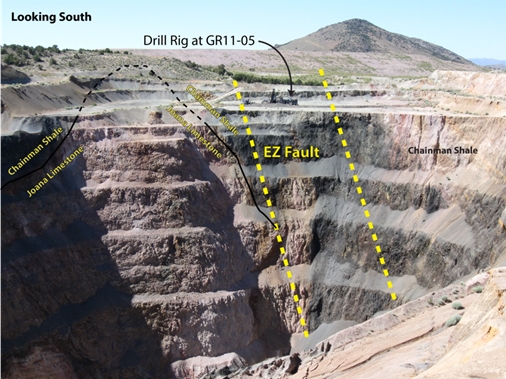
Figure 7-8 Photos of the North and South High Walls of the Easy Jr.
North and south of the existing pit, drilling has defined the morphology of the Easy Junior anticline. Two cross sections are presented in Figure 7-9, one just south of the Easy Junior pit (Section 5400N) and one from the Meridian Flats area (Section 2200N, Figure 7-4). In these locations the fold is much more open, though some thickening is noted adjacent to the EZ fault. Drilling also confirms that the fold is slightly recumbent to the east.
| | 31 | January 8, 2015 |
| Geological Setting and Mineralization Amended NI 43-101 Technical Report |
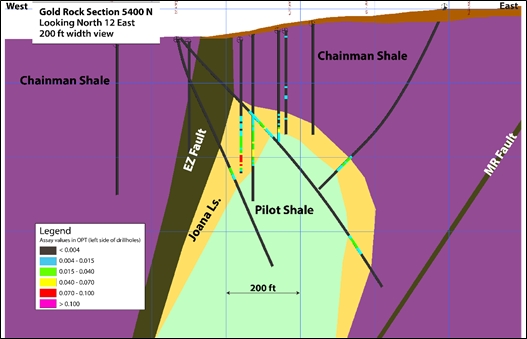
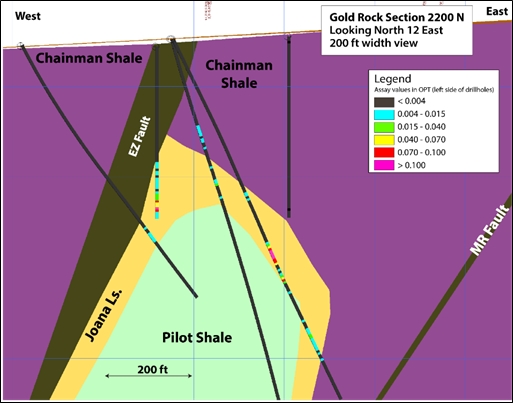
Figure 7-9 Geometry of the Easy Junior Anticline as Defined by Drilling
The nature of the fold is also seen in outcrop near the top of the Meridian Ridge about 2 miles south of the Easy Junior pit (Figure 7-10).
| | 32 | January 8, 2015 |
| Geological Setting and Mineralization Amended NI 43-101 Technical Report |
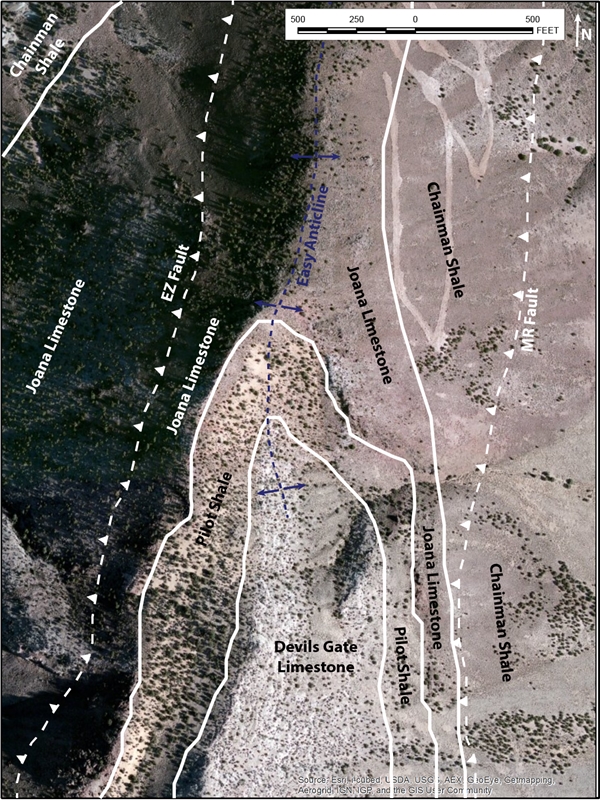
Figure 7-10 Plan View Exposure of the Easy Junior Anticline on Meridian Ridge,
Gold Rock Project
| | 33 | January 8, 2015 |
| Geological Setting and Mineralization Amended NI 43-101 Technical Report |
Gold mineralization at Gold Rock is typical of Carlin-style, sediment-hosted deposits:
● | Disseminated, micron sized gold |
● | Hosted in sedimentary rock, usually impure calcareous rocks |
● | Near a vertical or sub-vertical deep seated feeder fault and associated folds |
● | Characteristic alteration assemblage associated with strongly oxidizing fluids. |
Mineralization at Gold Rock is localized in the apex and limbs of the slightly overturned, fault-bounded, Easy Junior anticline. The primary host is the Joana Limestone, but significant mineralization is also hosted in the overlying Chainman Shale. Scattered, minor, inconsistent mineralization also occurs in the underlying Pilot Shale formation.
The currently identified resource occupies a N12E to N15E trend that extends from 1,000 feet north of the Easy Junior pit to the lower reaches of Meridian Ridge to the south, a strike length of over 11,000 feet (Figure 7-6). Altered bedrock and surface gold anomalies extend well beyond the resource area defined by drilling to the north and the south, extending nearly the entire 8-mile length of the property.
Gold occurs as disseminated, micrometer-scale grains hosted in sedimentary rock, usually impure calcareous siltstones and limestones. Mineralization is both structurally and stratigraphically controlled, occurring in vertical and sub-vertical feeder faults and cross faults, brecciated areas of folds, and parallel to bedding in favorable lithologic units.
The Joana Limestone is extensively brecciated along the apex of the Easy Junior anticline. The breccia preserves several generations of brecciation events, showing very angular, largely clast-supported, breccias with chaotic textures. Along the EZ fault, fault breccia textures are mixed with hydrothermal and solution breccias. Individual clasts within the breccias are highly variable in size.
7.7ALTERATION
The alteration associated with the mineralization is much more widespread than the mineralization itself. Silicification and the formation of jasperoid are not always associated with anomalous gold or trace element values, for example. The strongest silica alteration and jasperoid occurrence falls largely along the trend of the Easy Junior anticline.
Silicification occurs as zones of moderate to strong silica flooding along bedding and structures. Breccia that is strongly silicified or with complete replacement by silica is commonly referred to as jasperoid. Silica alteration is found primarily in the Joana Limestone, with only minor zones identified in shale units. In the Easy Junior pit area, jasperoid of the Joana Limestone carries significant amounts of gold. In surface outcrops, Joana-hosted jasperoid occurs along strike both north and south of the deposit and is often found in association with anomalous gold values.
Argillic or clay alteration is generally associated with hydrothermal alteration of minerals. Clay along faults and bedding is common. Within limestones and calcareous shales, argillization is often accompanied by decalcification of the host rock.
| | 34 | January 8, 2015 |
| Geological Setting and Mineralization Amended NI 43-101 Technical Report |
Oxidation is prevalent throughout the deposit, resulting in the formation of iron oxides (predominantly hematite and limonite). Liesegang banding has formed in association with oxidation and is prevalent in and around gold mineralization. Red to maroon hematite is very common in the altered areas. The Joana Limestone tends to be oxidized, while the Chainman Shale often shows carbon alteration and pyrite in drill core and chips.
7.8GEOMETRY OF MINERALIZATION
Figure 7-11 illustrates the cross-sectional geometry of mineralization of the Gold Rock Deposit as interpreted from drilling. At the apex of the Easy Junior anticline, the mineralization is largely restricted to Joana Limestone and the base of the overlying Chainman Shale. In both the east and west limbs, mineralization extends downward, largely in the Joana Limestone.
Mineralization was exposed at the pre-mining surface of the Easy Junior open pit. Along strike, the mineralized lower Chainman Shale and upper Joana Limestone are covered by 300 to 500 feet of poorly exposed Chainman Shale. Mining at Easy Junior extracted a small portion of the near surface resource. Historic drill intercepts indicate that significant mineralization still exists below the Easy Junior open pit and along strike to the north and south.
The mineralization along the anticline extends along strike to the south of the Easy Junior Mine over 6,000 feet through the Meridian Flats prospect area. To the north of Easy Junior, the mineralization along the apex of the anticline was followed over 1,000 feet, but post-mineral faulting drops the Joana Limestone below the extent of the drilling and therefore remains untested.
Historic drilling at Meridian Flats, nearly a mile south of the Easy Junior open pit, intersected significant mineralization within the same faulted anticline geometry, as shown in Figure 7-4.
| | 35 | January 8, 2015 |
| Geological Setting and Mineralization Amended NI 43-101 Technical Report |
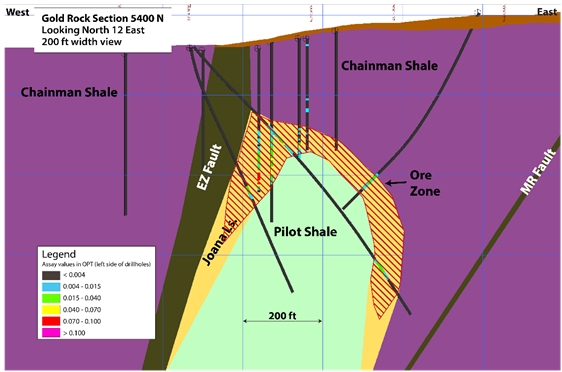
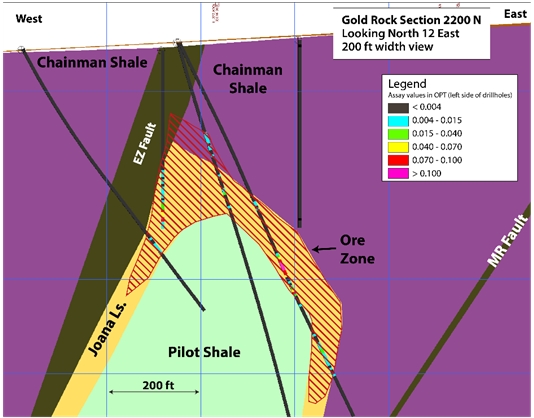
Figure 7-11 Cross Sections through the Easy Junior Resource Area
| | 36 | January 8, 2015 |
| Deposit Types Amended NI 43-101 Technical Report |
| 8 | DEPOSIT TYPES |
Gold Rock is a Carlin-style, sediment-hosted, disseminated gold deposit within Mississippian limestone and siltstone units, namely the Joana Limestone and, to a lesser extent, the overlying Chainman Shale and underlying Pilot Shale. Gold particles occur as micrometer to sub-micrometer size disseminations. Free, coarse gold is not common in these types of deposits and has not been observed at Gold Rock by Midway geologists.
Alteration at Gold Rock is typical of Carlin-type systems in Nevada. Alteration styles include silicification, argillization, decalcification and oxidation. Unlike at the Pan Project where carbon alteration is peripheral to mineralization, at Gold Rock, gold occurs within the carbon-altered, reduced zones and in the oxidized zones without carbon alteration. Gold is often associated with anomalous concentrations of arsenic, antimony, barium, iron, mercury, sulfur, and zinc at Gold Rock.
Similar deposits in the surrounding area include Midway Gold’s Pan Project, located approximately 8 miles to the northwest, Green Springs, approximately 10 miles southeast of Gold Rock, and Griffon, Illipah, Alligator Ridge, and others.
Midway has not completed independent work on the timing or source of mineralization, but current regional models (including Muntean et al., 2011) conceptualize crustal and sub-crustal melting associated with the steepening of the subducting slab in the Mid-Cenozoic to transfer heat and metal-laden fluids to the upper crust, where deeply seated structures provide a pathway to the reactive rocks near the surface 32 to 33 Ma.
The primary feeder structure at Gold Rock is postulated to be a steeply-dipping reverse fault reactivated with extensional dip-slip (Carden, 1989). This fault is adjacent to and parallel with the axial surface of the Easy Junior anticline. It is presumed that the EZ fault acted as the conduit for gold-bearing fluids to ascend through the rock column. When these fluids intercepted rock with the favorable geochemistry and porosity (in this case the Joana Limestone and Chainman Shale), the fluids reacted with the rocks causing first the formation of solution breccia and then more violent hydrothermal breccia as the reactions progressed. Gold would have precipitated as part of this fluid-rock reaction. It is likely that the complex faulting and folding on the property provided fluid pathways and traps which accentuated the mineralization in specific areas.
| | 37 | January 8, 2015 |
| Exploration Amended NI 43-101 Technical Report |
| 9 | EXPLORATION |
9.1PREVIOUS OPERATOR’S EXPLORATION WORK
The central part of the Gold Rock property includes the historically mined Easy Junior area. Past activity by the historic operators generated a significant amount of data covering all aspects of exploration and mining. Midway has compiled a significant amount of the historic data for use in assessing the potential resource and exploration targets. Historic operators include Nevada Resources, Houston Oil and Minerals, Tenneco, Echo Bay, Santa Fe, Amselco, and Alta Gold. Available data include:
| ● | Geological mapping |
| ● | Drilling logs and assays |
| ● | Geochemical sampling maps and assays |
| ● | Geophysical survey results |
9.2HISTORIC GEOCHEMICAL SAMPLING
From 1985 to 1993, Tenneco, Echo Bay, and Alta Gold collected 2,800 soil samples over a 6.5 square mile area. Most of these samples were analyzed for gold, barium, antimony, and mercury. Historic data was also compiled from 970 rock chip samples, many of which were analyzed for gold, mercury, arsenic, antimony, barium, and zinc.
9.3HISTORICAL GEOPHYSICS
Limited geophysical study was conducted at Gold Rock as part of the historic Easy Junior exploration. In 1986, Tenneco conducted Very Low Frequency Electromagnetics (VLF-EM) over selected lines attempting to define structural complexities. In 1989, Alta Gold gathered induced polarization and resistivity data, again in an attempt to define structural complexities. No significant property-wide surveys were conducted.
9.4HISTORICAL MAPPING
A detailed geologic map was generated by Tenneco in 1986. This map covers a portion of the Gold Rock property. This is the most detailed historic map of the region. Postlethwaite (2005) compiled a regional map that included the Gold Rock property in an effort to describe the relationship of fold and thrust faulting relative to gold mineralization.
Midway continues to compile these sources of data, in addition to data from several smaller maps of individual prospect areas, in order to create and upgrade a property-wide geologic map. New geologic mapping continues on the project lands and will provide more detailed information with regard to structure and alteration.
9.5HISTORICAL DRILLING
The long history of exploration and production at the Easy Junior deposit includes 14 years of drilling, from 1980 to 1994, and periodic mine production from 1989 to 1994. The compiled database now contains records from 673 historic drill holes, as identified in Table 9-1. Most of this drilling was
| | 38 | January 8, 2015 |
| Exploration Amended NI 43-101 Technical Report |
completed between 1986 and 1988 by Echo Bay, and later, the Alta Bay JV (1988 to 1992). The results of this drilling have provided the basis of the understanding of the distribution and magnitude of the remaining gold mineralization at the Gold Rock property developed by Midway since acquisition of the property in 2007.
Table 9-1 Historic Exploration and Delineation Drilling at the Gold Rock Property,
1980 to 1994
| Company | No. of holes | Drilling Method | Years | Notes |
| Houston Oil & Gas | 16 | ? | 1980-1983 | |
| Nevada Resources | 64 | 1981 | FOG Claims | |
| Amselco | 6 | 1983 | Monte Claims | |
| Santa Fe | 19 | RC | 1984-1985 | |
| Tenneco/Echo Bay | 241 | RC* | 1886-88 | *includes 12 core holes for metallurgy |
| Alta Bay | 284 | RC | 1988-1992 | Exploration/Delineation |
| Alta Gold | 47 | RC | 1993-1994 | |
| TOTAL | 673 | |||
| RC – reverse circulation | ||||
Substantial portions of this historic data, particularly that provided by the results of the 673 historic drill holes, have been combined with the exploration program results developed by Midway since 2007 to generate an estimation of potentially available new and remaining resources.
Additionally, and not included in the above tabulation, Mobile Oil drilled a series of 160-foot-deep seismic exploration holes in two parallel lines across the north end of the Gold Rock property in 1987. Although some distance from any current gold resource, this data may prove useful in future exploration work on the Gold Rock Project.
9.6MIDWAY EXPLORATION WORK
Midway has been active in all phases of exploration work on the Gold Rock property since acquiring the project in 2007. Exploration programs have included soil and rock chip geochemistry, geologic mapping, geophysical surveys, and drilling.
9.6.1 Surface Geochemistry
Since 2010, Midway has analyzed 1,256 soil samples as part of a geochemistry survey intended to complement the historic soil grid. To date, Midway has also collected a total of 839 rock samples and 78 stream sediment samples for geochemical analysis.
Soil samples were collected from the site to extend the existing grid to the east over the trend of the Easy Junior anticline north of the current resource area. East-west grid lines were sampled on approximately 200-foot spacing with each line separated by approximately 400 feet. The samples were delivered to ALS Chemex of Reno and Winnemucca, Nevada. The samples were sieved, collecting the fraction between -35 mesh and -80 mesh. That fraction was pulverized and tested utilizing a low-level ICP gold analysis. All samples were also analyzed for a 35-element suite using an aqua regia digestion and analysis by inductively coupled plasma atomic emission spectroscopy (ICP-AES). QA/QC included the addition of standards and blanks into the samples sent to the lab.
| | 39 | January 8, 2015 |
| Exploration Amended NI 43-101 Technical Report |
During 2013 and especially during the 2013 mapping project, rock samples were collected over several parts of the property in rocks illustrating the characteristic Carlin-type deposit alteration styles. Sample locations were chosen by the geologist depending upon outcrop and presence of mineralization characteristics, although in several cases rocks were collected in lines or panels to help delineate the distribution of gold over major outcrops, especially jasperoid.
The samples were delivered to ALS Chemex of Reno and Winnemucca, Nevada. Sample preparation was consistent, with full samples as received by ALS fine crushed to 70% <2 millimeters (mm), and a riffle split of the fine crushed material pulverized to 85% <75 microns (µm). Samples were fire assayed of a 30-gram sample with an AA finish. All samples were also analyzed for a 35-element suite using an aqua regia digestion and analysis by ICP-AES. QA/QC included the systematic inclusion of blanks and standards into the sample flow.
The rock sampling program had some success in outlining areas of anomalous gold, and Midway is currently analyzing these results to determine if additional sampling is required to outline new drilling targets on the property.
A relatively small number (78) of sediment samples were also collected in dry drainages from the property. These samples were largely taken to determine if a larger scale program might be useful in outlining areas with anomalous gold. Much of this sampling remains incomplete at this time.
9.6.2 Geological Mapping
In 2013, Midway re-mapped the entirety of the Gold Rock property using GPS-capable tablet field computers and GIS software and produced detailed geology and alteration maps. As part of the 2013 mapping program, Midway geologists also measured each of the individual lithologic units in order to better define the property stratigraphy.
9.6.3 Geophysical Surveys
In 2008, Midway conducted reconnaissance-level ground magnetic and gravity surveys over portions of the Gold Rock property, and, in 2010, conducted an additional reconnaissance ground magnetic program, testing for buried intrusives in several parts of the property. The utility of the program was questionable and no follow-up was ever conducted.
9.6.4 Drilling
In 2008, Midway completed 11 reverse circulation holes in the Anchor Roc prospect at the southeast end of the property, and, in 2011, completed a 31-hole drilling program in the vicinity of the Easy Junior open pit and Meridian Flats areas. The most recent drilling campaign was completed in February of 2013, and consisted of 37 reverse circulation holes (30,475 feet) and 10 diamond core holes (5,534 feet). The 2012-2013 drilling program was designed to increase known mineralization through infill and extension drilling, to provide better definition in the area between the two centers of known mineralization (Easy Junior pit and Meridian Flats), and to test additional exploration targets. Core
| | 40 | January 8, 2015 |
| Exploration Amended NI 43-101 Technical Report |
drilling was also conducted to 1) test geology of particularly important areas or domains and 2) provide twin comparisons of reverse circulation drill results. The results of drilling exploration are discussed in detail in Section 10 of this report.
| | 41 | January 8, 2015 |
| Drilling Amended NI 43-101 Technical Report |
| 10 | DRILLING |
A total of 762 drill holes have been completed on or in the immediate vicinity of the current Gold Rock property; 673 of which are considered historic, and the remaining 89 were completed by Midway from 2008 to 2013. Of this total, approximately 548 lie within an area modeled (“resource area”) in this Report to assess geology and mineral resources (Figure 10-1). Of the 548 drill holes within the resource area, 78 were excluded from the resource analysis due to non-verified collar coordinates and surface locations or issues with assay type (specifically neutron activation analyses for gold). The drilling program was mixed; reverse circulation (37 holes totaling 30,475 feet) and core (10 holes totaling 5,534 feet) drilling.
10.1HISTORIC DRILLING
Historic drilling on the Gold Rock property was overwhelmingly completed by reverse circulation techniques, although detailed documentation on a drill hole by drill hole basis is not available in the database. Carden (1991) documented the following (see Table 9-1):
● | Santa Fe drilling of 19 holes in 1984 and 1985 was by reverse circulation methods. |
● | Of the 241 holes completed by Echo Bay prior to consummation of the Alta Bay Joint Venture, only 12 were completed as diamond drill holes for metallurgical purposes. The remaining 229 holes were all completed by reverse circulation methods. |
● | After formation of the Joint Venture, the partners grid-drilled the known deposit on a 50-foot x 100-foot grid (50-foot spacing of holes on approximately east-west lines; with lines spaced 100 feet) using two reverse circulation drill rigs. |
Protocols practiced by drilling contractors and mining company personnel at drill sites are not known, although, based on results posted in the assay database, all drill hole sampling was completed on 5-foot intervals. Nearly all drilling was in vertical holes of undocumented diameter (typically 4.5 inches or more in diameter, by standard industry practices at the time). Collar coordinates and elevation were determined by theodolite surveys, employing the Nevada State Plane East, NAD 27 projection, and are well-documented in the database. There were no down-hole surveys completed or documented. Based on observations from the Midway drilling in 2011, all of the historic holes, except for two deeper holes, were likely completed above the water table (except for possible local perched water tables or water-bearing structures).
10.2MIDWAY DRILLING
Midway completed 11 reverse circulation drill holes in 2008 at the Anchor Roc prospect southeast of the resource area. Because this drilling is outside the resource area, drilling methods will not be discussed further.
In 2011, Midway completed six diamond drill core holes totaling 5,260 feet and 25 reverse circulation drill holes totaling 21,000 feet; all within the resource area. The program was designed to confirm the geology and mineralization defined by the historic drilling and to continue to explore for mineralization
| | 42 | January 8, 2015 |
| Drilling Amended NI 43-101 Technical Report |
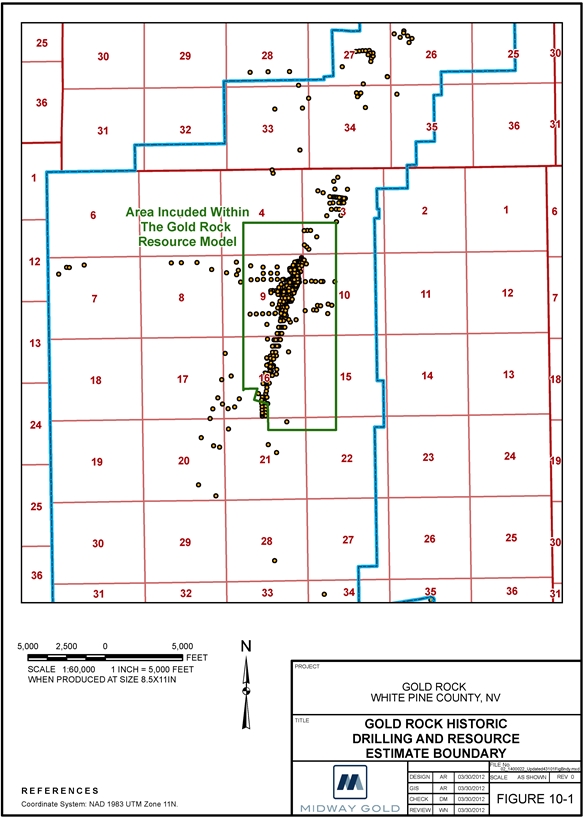
Figure 10-1 Gold Rock Historic Drilling and Resource Estimate Boundary
| | 43 | January 8, 2015 |
| Drilling Amended NI 43-101 Technical Report |
in areas with more limited, but successful, historic drilling results (Figure 10-1). The drilling was completed at the time of the site visit, so operations were not observed in the field.
Core drilling in 2011 through 2013 was completed by KB Drilling of Mound House, Nevada, using a track-mounted Versa KMB 1.4 drill rig, and using HQ3 tools to allow for use of split tube. Oriented core was collected using a Reflex ACTII down-hole tool. A Midway geologist was on-site for core drilling, documenting core recovery, collecting geotechnical information, and boxing core. The boxed core was transported to a secure Midway facility in Ely, Nevada, by Midway personnel. The drill core was logged for rock type, geologic unit, alteration, mineralization, structural details, and specific gravity. Sample intervals were marked by the geologist, nominally at 5-foot intervals, with changes for lithology or alteration. (Midway Gold 2012, Sampling Protocol).
Reverse circulation drilling was completed by National Drilling of Elko, Nevada, using a truck-mounted Schramm T685T, track-mounted Schramm T450GT, and track-mounted T685 drill rigs. All rigs employed 4.75 - 5.75-inch hammer bits or tricone bits of the same diameter. Drilling was largely above the water table. A Midway geologist was on-site during drilling activities, collecting drill cuttings samples and assay samples on routine 5-foot sample intervals. Assay sample duplicates of pre-determined intervals were generated at the drill site using a Gilson splitter. All cuttings samples were transported to the secure Midway facility in Ely, Nevada, by Midway personnel. The cuttings were logged for geology, alteration, and mineralization. The assay samples were deposited in bins and transported to ALS Minerals assaying labs in Elko, Reno, or Winnemucca, Nevada by ALS personnel. Drilling methods employed from 2011-2013 were also employed in the 2008 drilling program at Anchor Rock.
All 2011-2013 drill hole collars were initially located with handheld global positioning system (GPS) units and surveyed afterward by Trimble GPS using UTM NAD 83, Zone 11 projection. Down-hole surveys for each hole were completed by International Directional Services of Elko, Nevada, using a Surface Recording Gyroscope, model DG-69. Upon completion of drilling and down-hole surveying, the holes were abandoned according to Nevada State regulations, including a cement plug at the surface that secures an eye-bolt with a metal tag for identification (Figure 10-2). The eye-bolt enables post-reclamation location of the drill hole through the use of a metal detector.
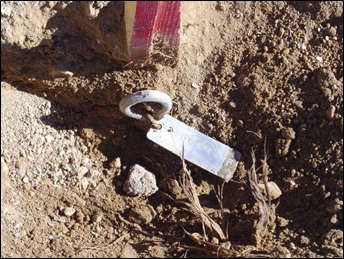
Figure 10-2 Drill Hole Collar Eye Bolt & Tag – GR11-23c
| | 44 | January 8, 2015 |
| Drilling Amended NI 43-101 Technical Report |
Significant drill intercepts resulting from the 2011 Midway program are summarized in Table 10-1, employing a 0.004 opt gold cut-off grade.
Table 10-1 Midway 2011 Summary Drilling Results
| Drill Hole # | Average Gold Grade opt | Thickness & Starting Depth | Drill Hole # | Average Gold Grade opt | Thickness & Starting Depth |
| GR11-01 | 0.013 | 125 ft from 375 ft | GR11-16 | 0.068 | 75 ft from 475 ft |
| GR11-02 | minor thin, low grade intercepts | GR11-17 | 0.009 | 30 ft from 210 ft | |
| GR11-03 | 0.024 | 60 ft from 280 ft | GR11-18 | 0.007 | 75 ft from 350 ft |
| GR11-04 | 0.025 | 40 ft from 455 ft | 0.017 | 75 ft from 435 ft | |
| 0.022 | 35 ft from 535 ft | GR11-19 | 0.019 | 25 ft from 375 ft | |
| GR11-05 | 0.007 | 30 ft from 95 ft | GR11-20 | 0.008 | 15 ft from 295 ft |
| 0.060 | 110 ft from 205 ft | 0.027 | 45 ft from 350 ft | ||
| GR11-06 | 0.017 | 60 ft from 205 ft | GR11-21 | 0.007 | 45 ft from 650 ft |
| 0.017 | 40 ft from 290 ft | GR11-22 | No significant intercepts | ||
| GR11-07 | 0.031 | 140 ft from 575 ft | GR11-23C | 0.043 | 153.5 ft from175 ft |
| GR11-08 | 0.013 | 95 ft from 220 ft | 0.018 | 40 ft from 615 | |
| 0.012 | 55 ft from 325 ft | GR11-24C | No significant intercepts | ||
| GR11-09 | 0.005 | 25 ft from 410 ft | GR11-25C | 0.007 | 30 ft from 390 ft |
| 0.004 | 15 ft from 455 ft | 0.021 | 99 ft from 430 ft | ||
| 0.020 | 50 ft from 485 ft | GR11-26 | 0.016 | 55 ft from 320 ft | |
| GR11-10 | 0.005 | 35 ft from 590 ft | 0.026 | 90 ft from 400 ft | |
| GR11-11 | 0.028 | 145 ft from 170 ft | GR11-27 | 0.006 | 30 ft from 590 ft |
| GR11-12 | No significant intercepts | GR11-28 | 0.018 | 200 ft from 610 ft | |
| GR11-13C | No significant intercepts | GR11-29 | 0.046 | 80 ft from 630 ft | |
| GR11-14C | 0.012 | 40 ft from 85 ft | GR11-30 | No significant intercepts | |
| 0.048 | 132 ft from 209 ft | GR11-31 | 0.008 | 15 ft from 0 ft | |
| GR11-15C | 0.033 | 16 ft from 719 ft | |||
| 0.018 | 10 ft from 745 ft | ||||
0.004 opt Au cutoff grade; not all thin and/or low grade intercepts tabulated C in drill hole number = core hole; otherwise reverse circulation hole ft – feet | |||||
10.2.2 2011 Midway Twin Holes
Of the 31 holes completed by Midway in 2011, there were six sets of twin reverse circulation – diamond drill core holes completed. One pair, GR11-12 and GR11-24c, was unsuccessful in that there was substantial down-hole directional deviation between the two holes rendering a comparison of results meaningless. The other twin holes enable a comparison of geology and assay information as derived from the two drilling techniques. The twin hole program is further discussed in Section 12 of this report.
| | 45 | January 8, 2015 |
| Drilling Amended NI 43-101 Technical Report |
10.2.3 2012 Midway Drilling Campaign
The most recent drilling program conducted by Midway began in September 2012 and ended in February 2013. During that time, Midway completed 37 reverse circulation drill holes for a total of 30,475 feet, and 10 diamond core holes for another 5,534 feet. Drill hole information from the 2012 campaign is summarized in Table 10-2.
Three discrete areas were drilled in order to try to better define the existing mineral resource and to explore previously established target areas:
| ● | North of the existing pit in the area of the Easy Junior anticline |
| ● | South of the existing pit in the area of the Easy Junior anticline |
| ● | Outward from the high grade mineralization previously encountered in the Meridian Flats area, both north and south along the Easy Junior anticline |
The 2012 drill hole collar locations are shown on Figure 10-3 and Figure 10-4, and significant intercepts are compiled in Table 10-3. Overall grades and mineralized material types of the 2012 drill intercepts are consistent with those recorded during historic drilling.
A total of 9 reverse circulation holes (8,070 feet) and 2 diamond core holes (1,876 feet) were drilled in the north Easy Junior pit area. Drilling encountered expected formations (Chainman, Joana, and Pilot), lithologies (shale, limestone, solution and hydrothermal breccia) and alteration (argillization, silicification, and carbon flooding). A possible cross-structure which offsets the main mineralized structure, the Easy Junior anticline, was also encountered during drilling. Additional work is required to determine the offset, location, and trend of mineralization. Drilling results indicate that mineralization extends deeper and with greater intensity than expected, particularly along the east limb of the Easy Junior anticline.
Section 8200N (Figure 10-5) shows mineralization carrying across the Easy Junior anticline, east of the fault zone, and down along the overturned east limb. Mineralization does not appear to extend into Chainman Shale. The 2012 drilling results helped to better define the geometry of the anticline and to enhance previous interpretations of the structural geology.
A total of 10 reverse circulation holes (7,670 feet) and six diamond core holes (2,599 feet) were drilled in the south Easy Junior pit area, also encountering expected formations, lithologies, and alteration types. Mineralization was encountered in altered portions of the Chainman Shale and Joana Limestone and extended south to the edge of the heap leach pad area.
Section 5400N (Figure 10-6) illustrates the mineralization across the Easy Junior anticline and down along the east limb, as well as the shallow depth and irregular spacing of the historic drilling. Additional drilling is required to determine if mineralization extends to the south, beneath the heap leach pad.
In the Meridian Flats area, 17 RC holes (13,590 feet) and two core holes (1,460 feet) were drilled, revealing alteration (brecciation and silicification) and mineralization continuing into portions of the Pilot shale, along section 1600N (Figure 10-7).
| | 46 | January 8, 2015 |
| Drilling Amended NI 43-101 Technical Report |
Table 10-2 2012 – 2013 Drill hole Summary, Gold Rock Project
| Hole ID | Site ID | Area | Purpose | Northing (ft) | Easting (ft) | Elev (ft) | Azimuth | Dip | T.D. | Type | Start Date | Comp. Date | Plug Date |
| GR12-04 | DS1200N-B1 | Meridian Flats | Resource | 14225876 | 2015890 | 6490 | 236 | -89 | 1155 | RC | 9/9/2012 | 9/13/2012 | 9/13/2012 |
| GR12-06 | DS1200N-A | Meridian Flats | Resource | 14226007 | 2015489 | 6474 | 104 | -66 | 555 | RC | 9/18/2012 | 9/19/2012 | 9/19/2012 |
| GR12-07 | DS1600N-B | Meridian Flats | Resource | 14226283 | 2015912 | 6499 | 106 | -82 | 785 | RC | 9/19/2012 | 9/23/2012 | 9/23/2012 |
| GR12-08 | DS1200N-B2 | Meridian Flats | Resource | 14225877 | 2015884 | 6491 | 103 | -76 | 1095 | RC | 9/24/2012 | 9/27/2012 | 9/27/2012 |
| GR12-09 | DS1200N-C | Meridian Flats | Resource | 14225866 | 2016188 | 6513 | 99 | -69 | 835 | RC | 10/2/2012 | 10/3/2012 | 10/3/2012 |
| GR12-10 | DS1600N-C | Meridian Flats | Resource | 14226186 | 2016123 | 6512 | 99 | -84 | 1095 | RC | 10/4/2012 | 10/10/2012 | 10/11/2012 |
| GR12-11 | DS1600N-A | Meridian Flats | Resource | 14226428 | 2015614 | 6493 | 105 | -80 | 765 | RC | 10/16/2012 | 10/17/2012 | 10/17/2012 |
| GR12-13 | DS8400N-A | N EZ-PIT | Resource | 14232833 | 2017396 | 6711 | 95 | -71 | 945 | RC | 10/18/2012 | 10/19/2012 | 10/19/2012 |
| GR12-14 | DS8600N-A1 | N EZ-PIT | Resource | 14233056 | 2017518 | 6731 | 104 | -69 | 735 | RC | 10/20/2012 | 10/22/2012 | 10/22/2012 |
| GR12-15 | DS8600N-D | N EZ-PIT | Resource | 12433192 | 2017294 | 6693 | 103 | -65 | 950 | RC | 10/23/2012 | 10/30/2012 | 10/30/2012 |
| GR12-16 | DS8600N-B | N EZ-PIT | Resource | 14233119 | 2017775 | 6723 | 101 | -72 | 1105 | RC | 10/30/2012 | 11/2/2012 | 11/2/2012 |
| GR12-17 | EZ-17 (GR11-02) | S EZ-PIT | Resource | 14230306 | 2016721 | 6534 | 113 | -55 | 765 | RC | 11/2/2012 | 11/3/2012 | 11/3/2012 |
| GR12-18 | DS8800N-A | N EZ-PIT | Resource | 14233425 | 2017398 | 6665 | 104 | -45 | 905 | RC | 11/4/2012 | 11/6/2012 | 11/6/2012 |
| GR12-19 | DS8800N-A2 | N EZ-PIT | Resource | 14233427 | 2017392 | 6665 | 104 | -61 | 745 | RC | 11/7/2012 | 11/8/2012 | 11/13/2012 |
| GR12-20 | DS8600N-B2 | N EZ-PIT | Resource | 14233118 | 2017777 | 2047 | 104 | -82 | 785 | RC | 11/13/2012 | 11/15/2012 | 11/15/2012 |
| GR12-21 | DS8200N-A | N EZ-PIT | Resource | 14232729 | 2017313 | 6709 | 101 | -71 | 1000 | RC | 11/16/2012 | 11/19/2012 | 11/20/2012 |
| GR12-24 | DS5400N-B2 | S EZ-PIT | Resource | 14230045 | 2016501 | 6519 | 103 | -50 | 865 | RC | 11/27/2012 | 11/28/2012 | 11/28/2012 |
| GR12-26 | DS5400N-B1 | S EZ-PIT | Resource | 14230045 | 2016493 | 6518 | 100 | -79 | 665 | RC | 11/28/2012 | 11/30/2012 | 11/30/2012 |
| GR12-27 | DS9200N-A | Jenny Rd | Exploration | 14233392 | 2018515 | 6746 | 77 | -75 | 1145 | RC | 11/30/2012 | 12/4/2012 | 12/4/2012 |
| GR12-29 | DS5600N-B | S EZ-PIT | Resource | 14230130 | 2016983 | 6594 | 282 | -84 | 445 | RC | 12/4/2012 | 12/5/2012 | 12/5/2012 |
| GR12-30 | DS5400N-A1 | S EZ-PIT | Resource | 14233392 | 2017211 | 6607 | 269 | -65 | 605 | RC | 12/5/2012 | 12/6/2012 | 12/6/2012 |
| GR12-31 | DS2200N-B1 | Meridian Flats | Resource | 14229955 | 2015905 | 6504 | 104 | -75 | 1045 | RC | 12/11/2012 | 12/13/2012 | 12/15/2012 |
| GR12-32 | DS2200N-B2 | Meridian Flats | Resource | 14226888 | 2015908 | 6504 | 101 | -64 | 880 | RC | 12/15/2012 | 12/18/2013 | 12/19/2013 |
| GR12-33 | DS2200N-A | Meridian Flats | Resource | 14226886 | 2015574 | 6489 | 88 | -61 | 685 | RC | 12/19/2012 | 1/8/2013 | 1/9/2013 |
| GR13-01 | DS400N-D | Meridian Flats | Resource | 14226918 | 2015667 | 6483 | 97 | -84 | 505 | RC | 1/9/2013 | 1/10/2013 | 1/10/2013 |
| GR13-02 | DS400N-D2 | Meridian Flats | Resource | 14225056 | 2015655 | 6479 | 104 | -67 | 405 | RC | 1/11/2013 | 1/13/2013 | 1/14/2013 |
| GR13-03 | DS400N-E1 | Meridian Flats | Resource | 14225059 | 2015864 | 6484 | 353 | -90 | 745 | RC | 1/14/2013 | 1/16/2013 | 1/16/2013 |
| GR13-04 | DS5000-A | S EZ-PIT | Resource | 14229462 | 2017109 | 6597 | 282 | -55 | 625 | RC | 1/17/2013 | 1/23/2013 | 1/23/2013 |
| GR13-05 | DS4400N-B | S EZ-PIT | Resource | 14229190 | 2016533 | 6521 | 65 | -81 | 625 | RC | 1/23/2013 | 1/24/2013 | 1/24/2013 |
| GR13-06 | DS4400N-C | S EZ-PIT | Resource | 14229188 | 2016614 | 6525 | 89 | -74 | 845 | RC | 1/24/2013 | 1/26/2013 | 1/26/2013 |
| GR13-07 | DS2600N-B | Meridian Flats | Resource | 14227388 | 2015913 | 6512 | 103 | -80 | 705 | RC | 1/26/2013 | 1/28/2013 | 1/29/2013 |
| GR13-08 | DS2600N-C1 | Meridian Flats | Resource | 14227301 | 2015996 | 6504 | 100 | -64 | 845 | RC | 1/29/2013 | 1/31/2013 | 1/31/2013 |
| GR13-09 | Easy 16(GR11-30) | S EZ-PIT | Exploration | 14230891 | 2015797 | 6540 | 103 | -84 | 1540 | RC | 2/5/2013 | 2/9/2013 | 2/9/2013 |
| GR13-10 | DS4800-A | S EZ-PIT | Resource | 14229268 | 2016982 | 6573 | 298 | -69 | 690 | RC | 2/10/2013 | 2/11/2013 | 2/11/2013 |
| GR13-11 | DS7400N-D | N EZ-PIT | Resource | 14232057 | 2016847 | 6562 | 101 | -50 | 900 | RC | 2/11/2013 | 2/13/2013 | 2/14/2013 |
| GR13-12 | GR11-22/DS1800 | Meridian Flats | Resource | 14226667 | 2015545 | 6484 | 101 | -55 | 625 | RC | 2/14/2013 | 2/20/2013 | 2/20/2013 |
| GR13-13 | DS1600N-A3 | Meridian Flats | Resource | 14226461 | 2015618 | 6493 | 108 | -54 | 865 | RC | 2/20/2013 | 2/23/2013 | 2/23/2013 |
| | 47 | January 8, 2015 |
| Drilling Amended NI 43-101 Technical Report |
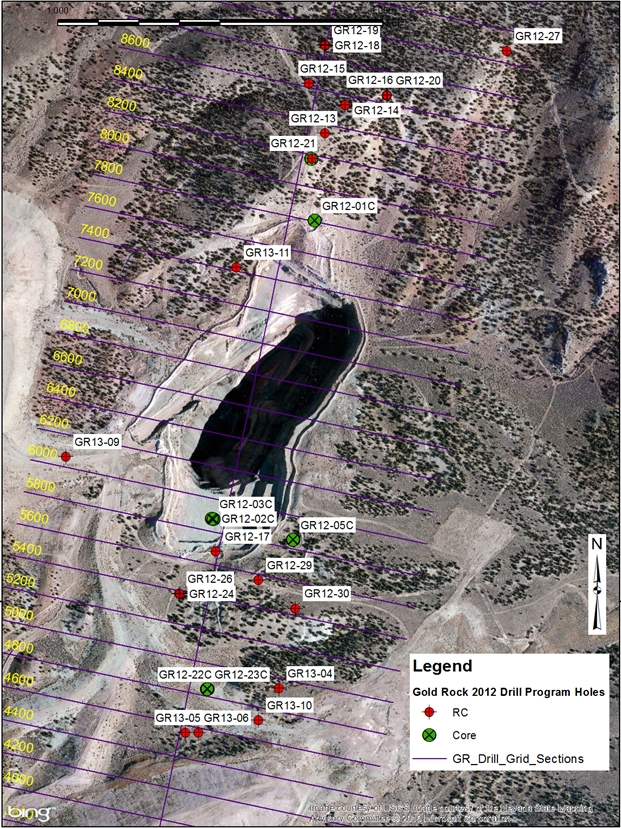
Figure 10-3 2012-2013 Drill hole Locations, Easy Junior Area
| | 48 | January 8, 2015 |
| Drilling Amended NI 43-101 Technical Report |
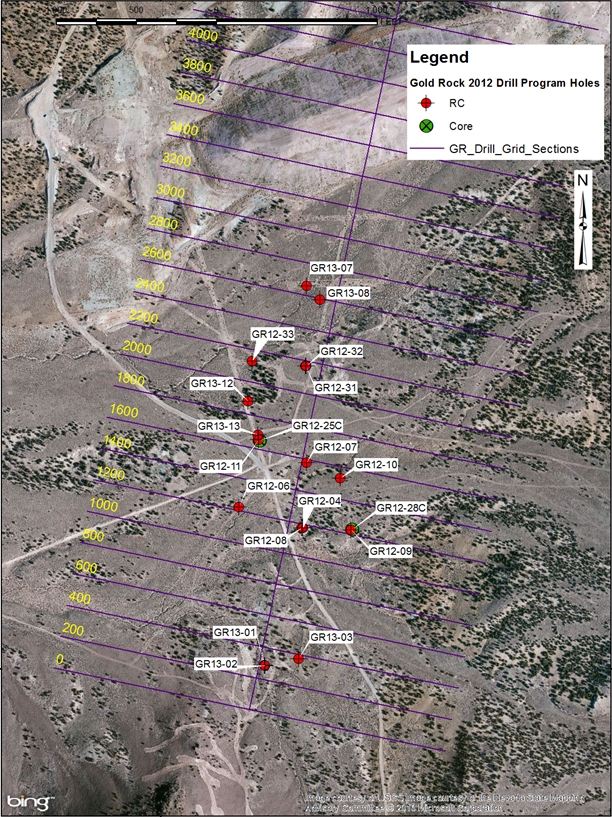
Figure 10-4 2012-2013 Drill hole Locations, Meridian Flats Area
| | 49 | January 8, 2015 |
| Drilling Amended NI 43-101 Technical Report |
| Hole ID | Area | Type | From (feet) | To (feet) | Interval (feet) | True Thickness (feet) | Grade (opt) |
| GR12-01C | North Easy Junior | Core | 152 | 171 | 19 | 10 | 0.007 |
| 198 | 229 | 31 | 15 | 0.008 | |||
| 443.8 | 717 | 273.2 | 50 | 0.026 | |||
| Including | 579 | 583 | 4 | 4 | 0.103 | ||
| Including | 654 | 659 | 5 | 5 | 0.149 | ||
| GR12-02C | South Easy Junior | Core | 65 | 95 | 30 | 30 | 0.095 |
| Including | 75 | 85 | 10 | 10 | 0.266 | ||
| 135 | 215 | 80 | 80 | 0.007 | |||
| GR12-03C | South Easy Junior | Core | 10 | 25 | 15 | 15 | 0.004 |
| 70 | 135 | 65 | 55 | 0.012 | |||
| 170 | 544 | 374 | 55 | 0.017 | |||
| GR12-04 | Meridian Flats | RC | 285 | 320 | 35 | 35 | 0.030 |
| GR12-05C/05C-NQ | South Easy Junior | Core | No Significant Intercepts | ||||
| GR12-06 | Meridian Flats | RC | 345 | 395 | 50 | 50 | 0.014 |
| GR12-07 | Meridian Flats | RC | 340 | 375 | 35 | 35 | 0.014 |
| 450 | 535 | 85 | 85 | 0.020 | |||
| 630 | 655 | 25 | 35 | 0.006 | |||
| GR12-08 | Meridian Flats | RC | 355 | 405 | 50 | 50 | 0.027 |
| 425 | 440 | 15 | 5 | 0.004 | |||
| 555 | 595 | 40 | 35 | 0.013 | |||
| GR12-09 | Meridian Flats | RC | No Significant Intercepts | ||||
| GR12-10 | Meridian Flats | RC | No Significant Intercepts | ||||
| GR12-11 | Meridian Flats | RC | 615 | 675 | 60 | 45 | 0.013 |
| GR12-12C | North Easy Junior | Core | 350 | 365 | 15 | 10 | 0.004 |
| 464 | 721 | 257 | 120 | 0.017 | |||
| 979 | 1016 | 37 | 35 | 0.011 | |||
| GR12-13 | North Easy Junior | RC | 575 | 680 | 105 | 60 | 0.027 |
| Including | 640 | 645 | 5 | 5 | 0.130 | ||
| GR12-14 | North Easy Junior | RC | 585 | 680 | 95 | 95 | 0.007 |
| GR12-15 | North Easy Junior | RC | 810 | 850 | 40 | 60 | 0.013 |
| GR12-16 | North Easy Junior | RC | No Significant Intercepts | ||||
| GR12-17 | South Easy Junior | RC | 250 | 600 | 350 | 60 | 0.036 |
| Including | 360 | 365 | 5 | 5 | 0.143 | ||
| Including | 445 | 450 | 5 | 5 | 0.217 | ||
| Including | 500 | 510 | 10 | 10 | 0.110 | ||
| 615 | 680 | 65 | 60 | 0.016 | |||
| GR12-18 | North Easy Junior | RC | No Significant Intercepts | ||||
| GR12-19 | North Easy Junior | RC | No Significant Intercepts | ||||
| GR12-20 | North Easy Junior | RC | 610 | 690 | 80 | 70 | 0.019 |
| GR12-21 | North Easy Junior | RC | 615 | 670 | 55 | 50 | 0.022 |
| GR12-22C | South Easy Junior | Core | No Significant Intercepts | ||||
| GR12-23C | South Easy Junior | Core | 150 | 200 | 50 | 50 | 0.008 |
| 250 | 385 | 135 | 125 | 0.018 | |||
| | 50 | January 8, 2015 |
| Drilling Amended NI 43-101 Technical Report |
| Hole ID | Area | Type | From (feet) | To (feet) | Interval (feet) | True Thickness (feet) | Grade (opt) |
| GR12-24 | South Easy Junior | RC | 270 | 365 | 95 | 80 | 0.013 |
| 700 | 760 | 60 | 55 | 0.016 | |||
| GR12-25C | Meridian Flats | Core | 595 | 653 | 58 | 40 | 0.012 |
| GR12-26 | South Easy Junior | RC | 375 | 410 | 35 | 25 | 0.012 |
| GR12-27 | Jenny Rd | RC | No Significant Intercepts | ||||
| GR12-28C | Meridian Flats | Core | No Significant Intercepts | ||||
| GR12-29 | South Easy Junior | RC | 340 | 385 | 45 | 35 | 0.011 |
| GR12-30 | South Easy Junior | RC | 480 | 535 | 55 | 55 | 0.015 |
| GR12-31 | Meridian Flats | RC | 200 | 255 | 55 | 40 | 0.006 |
| 325 | 340 | 15 | 12 | 0.011 | |||
| GR12-32 | Meridian Flats | RC | 375 | 395 | 20 | 15 | 0.007 |
| 495 | 595 | 100 | 25 | 0.055 | |||
| Including | 515 | 535 | 20 | 10 | 0.123 | ||
| 685 | 785 | 100 | 50 | 0.007 | |||
| GR12-33 | Meridian Flats | RC | 490 | 530 | 40 | 35 | 0.005 |
| GR13-01 | Meridian Flats | RC | 180 | 200 | 20 | 15 | 0.007 |
| GR13-02 | Meridian Flats | RC | 235 | 275 | 40 | 15 | 0.005 |
| GR13-03 | Meridian Flats | RC | 315 | 325 | 10 | 5 | 0.004 |
| 435 | 465 | 30 | 45 | 0.011 | |||
| 520 | 545 | 25 | 25 | 0.012 | |||
| GR13-04 | South Easy Junior | RC | 390 | 515 | 125 | 125 | 0.020 |
| GR13-05 | South Easy Junior | RC | 255 | 400 | 145 | 145 | 0.019 |
| GR13-06 | South Easy Junior | RC | 250 | 310 | 60 | 45 | 0.015 |
| 705 | 725 | 20 | 15 | 0.021 | |||
| GR13-07 | Meridian Flats | RC | 425 | 435 | 10 | 10 | 0.004 |
| 460 | 475 | 15 | 15 | 0.007 | |||
| GR13-08 | Meridian Flats | RC | 305 | 350 | 45 | 40 | 0.004 |
| 400 | 430 | 30 | 20 | 0.012 | |||
| 450 | 470 | 20 | 15 | 0.009 | |||
| GR13-09 | South Easy Junior | RC | No Significant Intercepts | ||||
| GR13-10 | South Easy Junior | RC | 360 | 455 | 95 | 95 | 0.012 |
| GR13-11 | North Easy Junior | RC | 575 | 605 | 30 | 25 | 0.010 |
| GR13-12 | Meridian Flats | RC | 445 | 505 | 60 | 50 | 0.015 |
| GR13-13 | Meridian Flats | RC | 450 | 460 | 10 | 5 | 0.013 |
| 595 | 785 | 190 | 150 | 0.033 | |||
| Including | 660 | 675 | 15 | 15 | 0.168 | ||
opt – ounces per ton RC – reverse circulation | |||||||
| | 51 | January 8, 2015 |
| Drilling Amended NI 43-101 Technical Report |
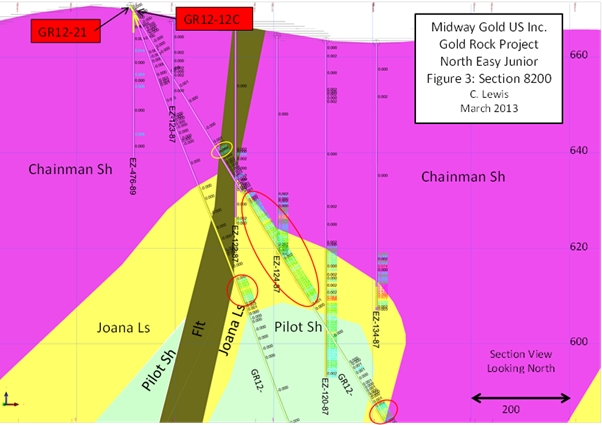
Figure 10-5 Mineralization in the Vicinity of the Easy Junior Anticline
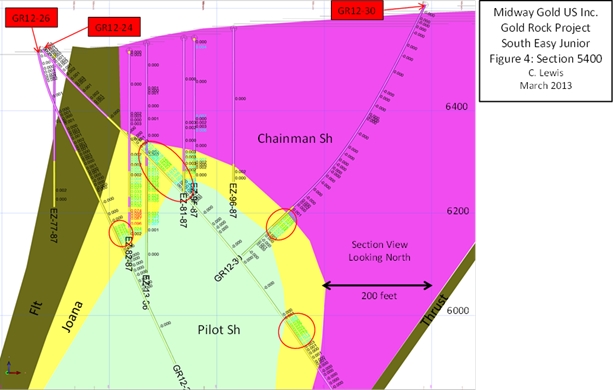
Figure 10-6 Mineralization Along the East Limb of the Easy Junior Anticline
| | 52 | January 8, 2015 |
| Drilling Amended NI 43-101 Technical Report |
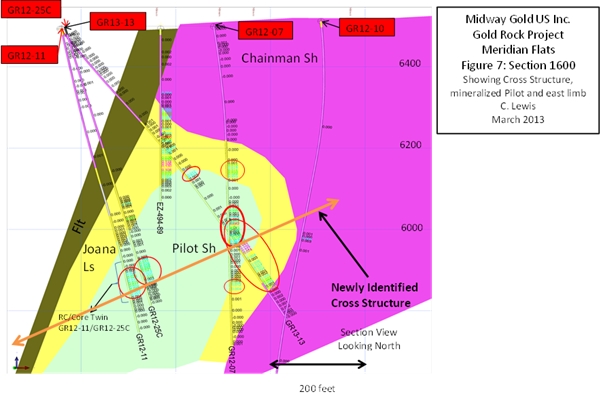
Figure 10-7 Mineralization in the Meridian Flats Area, Section 1600
Drilling encountered mineralization across the nose of the anticline and along the east limb of the Easy Junior anticline. Based on the drilling results, mineralization is primarily concentrated in the altered Joana Limestone with minor mineralization carrying into the Chainman Shale along the nose of the anticline. Additional work is required to delineate the boundaries of the mineralized area. Along Section 1600N (Figure 10-7), new high grade mineralization in altered (silicified with variable brecciation) Pilot shale was identified. The mineralization occurs along a northeast-southwest trending possible cross structure with enhanced receptivity, which may have acted as a feeder for mineralization. Additional drilling is warranted to determine the nature and extent of this structure. Figure 10-8 shows the cross structure in plan view.
The confirmation of high grade mineralization along the over-turned east limb of the anticline, in all tested project areas, is significant. Future drill planning should evaluate whether additional deep drilling in the previously shallowly tested upper east limb is warranted.
In some cases, relatively high grade mineralization has been encountered along section on a 400-foot spacing. Infill drilling to achieve 200-foot spacing will improve confidence in both the known occurrence of mineralization and in the mineral resource estimate.
| | 53 | January 8, 2015 |
| Drilling Amended NI 43-101 Technical Report |
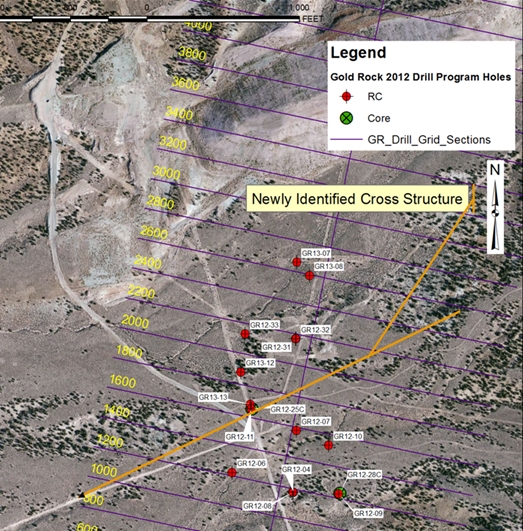
Figure 10-8 Possible Cross Structure in the Meridian Flats Area
| | 54 | January 8, 2015 |
| Sample Preparation, Analyses and Security Amended NI 43-101 Technical Report |
11 SAMPLE PREPARATION, ANALYSES AND SECURITY
11.1HISTORIC PROGRAMS
Other than the documentation provided in the drill hole assay database and accompanying assay certificates indicating drill hole sampling on 5-foot intervals, there is little documentation of the details of sample preparation and security for the historic drill sampling programs within the resource area. Assays were completed using a variety of laboratories and assay methods as outlined briefly below. Apart from limited repeat analyses, there is no evidence or documentation of quality control/quality assurance programs (QA/QC) employed by any of the companies submitting samples or the labs conducting the analyses. A few check assay programs, twin-hole analyses and more routine fire assay follow-ups to anomalous (CN AA) are documented and are discussed in Section 12 of this report.
11.1.1 Santa Fe Analytical Methods
In 1984 and 1985, Santa Fe completed 16 reverse circulation drill holes (EJ-1 to EJ-16) in the southern portion of the resource area (Table 9-1). Gold values in drill samples were reported by Chemex Labs in Reno, Nevada using neutron activation analysis. This assay technique was discussed with a number of individuals with varying recollections of the accuracy and precision of the technique, resulting in recommendations by current and past reviewers that these drill results not be included in the resource assessment.
11.1.2 Tenneco/Echo Bay Analytical Methods
Tenneco/Echo Bay employed Bondar-Clegg in Reno, Nevada, for all of its assay work for drill holes EZ1 through EZ241 (1986 – 1988, Table 9-1). Scattered, but consistent documentation indicates the Bondar-Clegg analytical method was fire assay with an atomic absorption analysis (AA), largely of one assay ton pulp samples. It is not entirely clear whether all results were AA finishes or with gravimetric finishes. Results are reported variably as “Au opt” or “Au 30g ppb”.
11.1.3 Alta Bay Joint Venture Analytical Methods
Following formation of the Alta Bay Joint Venture in early 1988, assaying of drill samples from drill holes EZ242 through EZ445 was conducted at the Illipah Mine laboratory of Alta Bay and at the Ward and Robinson assay labs of Silver King Mines. These facilities were operated by Alta Gold (Illipah lab) or its former parent company, Silver King Mines (Robinson and Ward labs). The analyses at the Illipah lab were cold cyanide extractions of gold from pulps followed by an analysis by atomic absorption (CN AA). Follow-up fire assay analyses were conducted at Ward or Robinson, based on intervals selected as anomalous based on geology/alteration and/or anomalous CN AA results, generally above 0.007 ounces per ton gold in the CN AA assay certificates.
11.1.4 Alta Bay Joint Venture Analytical Methods
Production from the Easy Junior mine was initiated in 1989. Assay of drill holes EZ446 through EZ521 was completed by CN AA at either the Illipah mine or the Easy Junior mine, with follow-up fire assay analysis at either the Ward or Robinson labs.
| | 55 | January 8, 2015 |
| Sample Preparation, Analyses and Security Amended NI 43-101 Technical Report |
11.1.5 Alta Gold Analytical Methods
Following its acquisition of Echo Bay’s interest in the Alta Bay Joint Venture in 1992, Alta Gold resumed exploration and development drilling, completing drill holes EZ522 through EZ546. Documentation for drill holes EZ522 through EZ527 was not found; these holes are believed to have been drilled outside the resource area. Analytical work on drill samples from drill holes EZ528 through EZ546 was completed by fire assay at American Assay in Reno, Nevada.
11.2 MIDWAY’S 2011 AND 2012-2013 PROGRAMS
Diamond drill core and reverse circulation drill cuttings were transported from the project site to Midway’s secure office facilities in Ely, Nevada, by Midway personnel on a daily basis. Prior to sampling, whole diamond drill core was logged and handled as outlined in Section 10 above. Once sample intervals were determined by the geologists, the core was split in half, with half sent to the assay lab and the other retained for future uses and reference. Competent core was cut with a diamond saw; intact but softer core was split with a hydraulic splitter; and rubbly/gravely zones were split using a riffle splitter. Samples were bagged in labeled plastic bags and included a paper sample number tag.
Reverse circulation samples were collected in micro-pore bags at the drill site, having been split during the drilling operation by rotating splitter and/or Jones splitter to generate an approximate 15 pound sample. Sample bags were pre-labeled for sample number for specific drill footages, which were reconciled routinely during the collection process. Drilling and sampling protocols were implemented to minimize the potential for contamination: drillers cleared the hole at each 5-foot interval by continuing circulation until no additional sample was collected, and the Midway geologist washed splitting apparatus between samples.
Once prepared for shipment, all drilling samples remained secure in Midway’s facilities until loaded on a truck operated by ALS for shipment to the lab. Assay results were reported by ALS Minerals/ALS USA Inc., 4977 Energy Way, Reno, Nevada 89502; phone 775-356-5395. ALS had an arm’s length, third party relationship with Midway.
Split diamond drill core and reverse circulation cuttings samples collected by Midway in its 2011 and 2012-2013 programs from drill holes GR11-01 through GR11-31, GR12-01C through GR12-33 and GR13-01 through GR13-13 were submitted to ALS Minerals in Reno or Winnemucca, Nevada, for sample preparation and fire assay analysis of a 30-gram sample with an AA finish (ALS code: Au – AA23). All samples were also analyzed for a 35-element suite using an aqua regia digestion and analysis by inductively coupled plasma atomic emission spectroscopy (ICP-AES) (ALS code: ME-ICP41). Sample preparation was consistent, with full samples as received by ALS fine crushed to 70% <2 millimeters (mm), and a riffle split of the fine crushed material pulverized to 85% <75 microns (µm).
Midway conducted a consistent QA/QC program, inserting standard, duplicate, and blank samples into the sample numbering sequence with each submitted order at a combined rate of approximately 10% (drill holes GR11-01 through GR11-10 did not include duplicate samples). Midway’s QA/QC protocol required re-analysis of specific samples, sample number ranges or entire sample submittals when QA/QC sample results exceeded the failure criteria.
| | 56 | January 8, 2015 |
| Sample Preparation, Analyses and Security Amended NI 43-101 Technical Report |
11.2.1 Midway Standard Sample Analyses
Midway submitted commercial standards as pulps inserted within the sample numbering scheme at the rate of approximately 4%. Three certified standards were employed, all provided by Ore Research & Exploration Pty Ltd of Australia (OREAS). Assay results on standards in the following plots are referenced against the certified OREAS mean and the Midway failure threshold established using the two standard deviation range determined by the statistics developed from the analyses of standards submitted with the Gold Rock Project drilling samples (Figure 11-1, Figure 11-2, and Figure 11-3). The OREAS tolerance limits are shown as dashed lines.
The standards were received from OREAS as pre-packaged pulps, and therefore were useful in determining the accuracy and precision of the ALS assaying procedure, but could not be used to assess potential contamination in the sample preparation process involving crushing and pulverization.
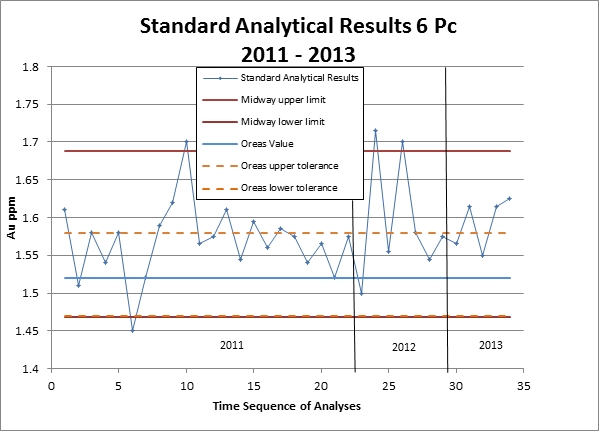
Figure 11-1 Standard Analytical Results – OREAS 6 Pc
| | 57 | January 8, 2015 |
| Sample Preparation, Analyses and Security Amended NI 43-101 Technical Report |
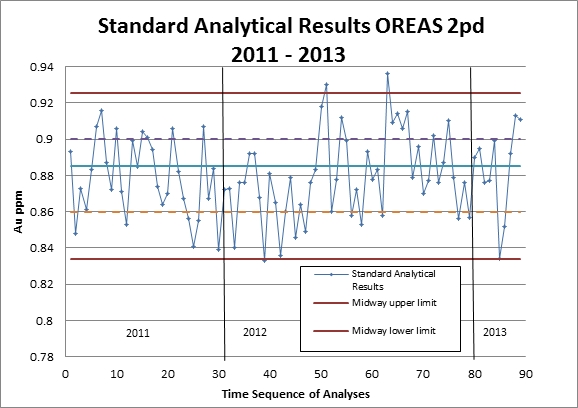
Figure 11-2 Standard Analytical Results – OREAS 2 Pd
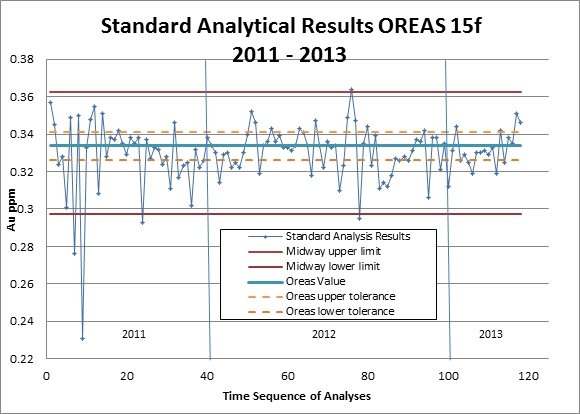
Figure 11-3 Standard Analytical Results – OREAS 15f
| | 58 | January 8, 2015 |
| Sample Preparation, Analyses and Security Amended NI 43-101 Technical Report |
11.2.2 Midway Blank Sample Analyses
Midway submitted crushed marble as blank material for analysis, inserted at the rate of approximately 3%. The marble occurs as approximately 1- to 2-inch diameter pieces which are inserted into the sample numbering sequence in a given sample batch. Analytical results are displayed graphically in Figure 11-4. The blank material was of sufficient size that it was processed through the full sample preparation procedure at ALS, thereby serving as a gauge of potential contamination in the crushing and pulverizing stages of sample preparation. Blank sample analytical failures were considered in the contexts mentioned above. Three blanks lay at the failure threshold of 15 parts per billion (ppb), but corrective actions within the sample batches were not considered necessary. Overall, the blank sample analysis was well within industry standards. Failures on blank analytical results were reviewed within the context of protocols established by Midway, with reruns of samples, sample intervals, or entire sample submittals as necessary.
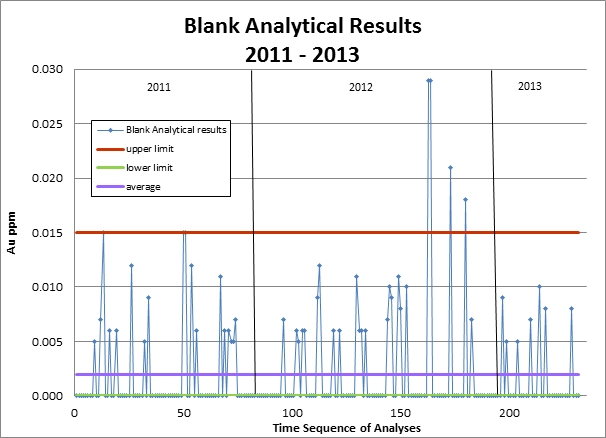
Figure 11-4 Blank Sample Analytical Results
| | 59 | January 8, 2015 |
| Sample Preparation, Analyses and Security Amended NI 43-101 Technical Report |
Midway inserted duplicate samples of unknowns into the numbering sequence of sample batches at the rate of approximately 3% (duplicate samples were not generated for reverse circulation drill holes GR11-01 through GR11-09). Duplicate samples for reverse circulation drill holes were generated on-site at the drill rig by splitting samples using a riffle splitter and bagging each split as a separate sample in number sequence. These samples provide an overall check on the entire sampling, sample preparation, and analytical process while also being subject to sample heterogeneity, if any. Diamond drill core samples were submitted to ALS with directions for the lab to split specific samples and prepare separate pulps for each split to generate sample duplicates. The core sample duplicates thereby tested the lab sample splitting, pulverization, and analytical processes.
Analytical results on duplicate samples, including both reverse circulation and diamond drill core samples, are presented in Figure 11-5, Figure 11-6, and Figure 11-7 (166 duplicate pairs). Figure 11-5 is a conventional scatter plot showing the least squares regression line indicating a 16% positive bias in gold grade in the duplicate analyses and with a corresponding R2 of 97.6%. The slope and correlation of data are influenced by the lone duplicate pair with higher, but disparate, gold grades (2.78 and 3.66 ppm). Figure 11-6 presents a similar scatter plot without the higher grade assay pair, resulting in a nearly unbiased regression line (1% positive bias in gold grade in the original assays) and an R2 of 99.0%.
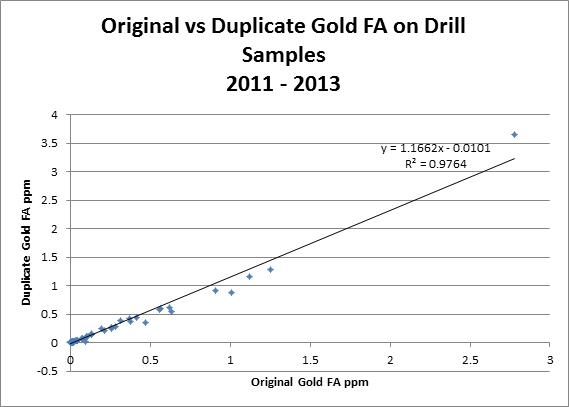
Figure 11-5 Midway Drill Sample Duplicates (all data – 166 sample pairs)
| | 60 | January 8, 2015 |
| Sample Preparation, Analyses and Security Amended NI 43-101 Technical Report |
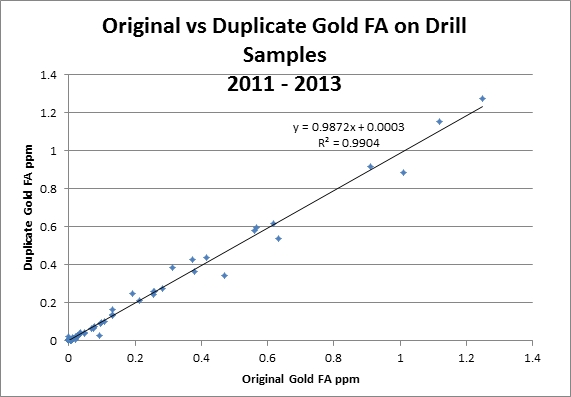
Figure 11-6 Midway Drill Sample Duplicates
(less one higher grade sample – see Figure 11-5; 165 sample pairs)
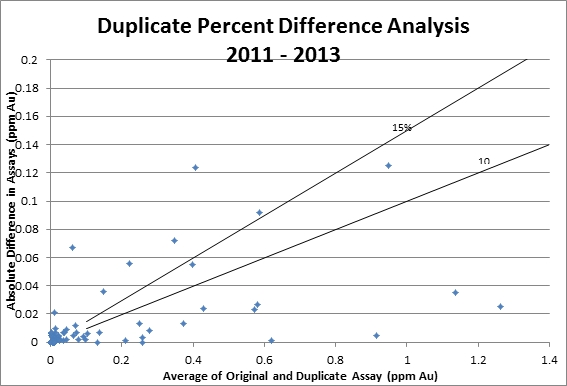
Figure 11-7 Duplicate Pair Absolute Differences with Percent Difference Contours
(165 sample pairs)
| | 61 | January 8, 2015 |
| Sample Preparation, Analyses and Security Amended NI 43-101 Technical Report |
11.2.4 Summary and QP Opinion
The historic drilling results present analytical and geology results that continue to be validated by Midway drill results. There are no indications that the database developed using the historic data is of questionable quality, subject to the continued exclusion of the samples analyzed by neutron activation methods and those fired assayed by the Ward laboratory. Assays completed by CN AA are not considered accurate indications of total gold content of samples as in fire assays; but understate the fire assay values. These data remain in the database and are included in the resource estimate – resulting in a conservative estimate of gold grade in areas more strongly influenced by drill holes containing only CN AA data. The historic data appears reliable and can be confidently included in the project database.
The drilling, sampling, and analytical procedures and protocols enlisted by Midway and required of its contractors meet or exceed expectations of industry practices at this stage of the project. Midway has developed and documented protocols for these activities, which are well-communicated to its employees and contractors. The chain-of-custody of samples rests solely with Midway personnel from the time of generation of drill core and drill cuttings at the drill site, to the handoff of bagged samples in Ely, Nevada, to ALS representatives who truck samples to the lab. Collectively, these activities appear to generate drill hole samples that are reasonably representative of the geology and mineralization being tested, with samples being securely maintained at all steps by Midway.
The QA/QC program is well planned and documented; and data appears to be analyzed timely upon receipt of assay results. Analytical results on OREAS standards display greater deviation than would be expected from the published OREAS tolerance limits (Figure 11-1, Figure 11-2, and Figure 11-3), although the variations are not systematic. Averages of the Midway results on each standard, compared to the OREAS published gold grade, were in reasonable agreement (Figure 11-8), although the numbers of samples were limited, especially in standard OREAS 6Pc. Assay results on this standard are largely biased to values above the reported value of the standard, varying from within the tolerance limit reported by OREAS, to values above the upper tolerance limit (Figure 11-1). Combined, the results on the three standards suggest a slight bias in the ALS assay results, with assays slightly below the OREAS value in the lower grade standard (OREAS 15f – Figures 11-3 and 11-8), to slightly higher in the higher grade standard (OREAS 6Pc – Figure 11-1 and Figure 11-8). This bias, if confirmed in a check assay program utilizing other commercial laboratories, would not be expected to significantly impact the resource estimate since only a limited number of assay results in drill hole samples are at gold grades exceeding 1.0 ppm.
Midway’s established failure thresholds on each standard utilized statistics generated on its results of assays of the standards. While this approach seems equally capable of identifying results requiring greater scrutiny, it does enable sample intervals containing assay results on a standard to pass the
| | 62 | January 8, 2015 |
| Sample Preparation, Analyses and Security Amended NI 43-101 Technical Report |
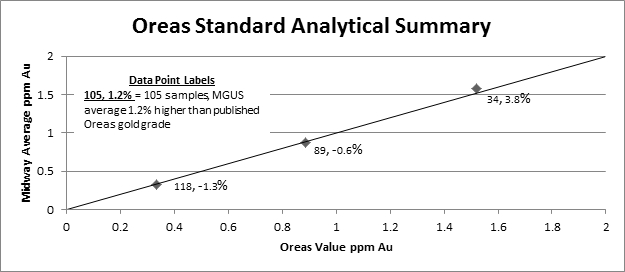
Figure 11-8 Midway-OREAS Average Standard Assay Comparison
Midway threshold, but exceed (high or low) the OREAS tolerance limits. While the QA/QC results were satisfactory overall, additional scrutiny by Midway is recommended to determine whether there are any correlations between the analytical results on standards that are outside the OREAS tolerance limits and higher disparity between duplicates (Figure 11-6) and/or elevated values on blanks (Figure 11-4). In the longer term, it is recommended that Midway conduct an assay check program utilizing several commercial labs as a further component of its QA/QC program. The overall integrity and accuracy of the assay results is not in question; the data can reasonably be incorporated into the resource and reserve estimates compiled in this Report.
| | 63 | January 8, 2015 |
| Data Verification Amended NI 43-101 Technical Report |
| 12 | DATA VERIFICATION |
Verification of historic drill hole data and the 2011 Midway drilling program was completed by Donald J. Baker, working with Gustavson Associates and as reported by Gustavson (NI 43-101 Technical Report on Resources, Gold Rock Project, White Pine County, Nevada, April 10, 2012, with an effective date of February 29, 2012). Dr. Baker is a principal of OGM Reserves, LLC, is a QP (MMSA #01088QP), and is responsible for the data verification in this Report.
Dr. Baker conducted an on-site visit to the Gold Rock property during the period January 12 – 14, 2012, and reviewed available hard copy and electronic historic records and the records of the Midway 2011 drilling program. The site visit included approximately one day in the field at the project site to verify geology, confirm the location of historic drill sites and survey points, and confirm the existence and location of drill holes completed by Midway in 2011. One and a half days were spent in the Midway office in Ely, Nevada, reviewing hard copy files, reports, and maps and cross sections. Copies of certain assay certificates and other documents and files were obtained for continuing review and analysis of the project data following the site visit.
12.1 HISTORIC DATA VERIFICATION
12.1.1 Pre-Midway Historic Data
Pre-Midway historic data verification was reported by Gustavson Associates (Gustavson, 2012). The following points summarize the Gustavson verification of the large volume of historic information:
| ● | Survey control points were located in the field and verified as relevant to the historic data by GPS readings compared to those reported by historic operators of the project. |
| ● | Historic drill holes located in the field conformed to locations plotted on historic maps and listed in database files. Plots of historic drill hole collar coordinates on an orthophoto showed excellent correlation between the drill hole collar point and reclaimed roads and drill sites. |
| ● | Historic drill holes were not surveyed down-hole. All holes were vertical and were assumed to remain vertical, subject to verification by Midway in its drilling programs. |
| ● | Historic assay certificates and drill logs with hand-entered assay results were compared to the Midway assay database for both values entered and type of assay (fire assay, CN AA, or neutron activation analysis). One hundred drill holes containing approximately 6,000 assays on 5-foot intervals were checked, resulting in an error rate of less than 0.1%. |
| ● | Neutron activation assays, used by Santa Fe for all its drilling, were determined not reliable, and were omitted from the database for purposes of generating a resource estimate. Fire assays completed at the Ward laboratory were consistently biased to higher gold values, and were omitted from the database for purposes of generating a resource estimate. Mineralized intervals for which there were only CN AA results were included in the database for purposes of generating a resource estimate. The CN AA results were shown, as expected, to understate the values in intervals also analyzed by fire assays. Incorporation of the CN AA results would create a conservative estimate in some portions of the resource volume, a result considered acceptable as long as use of the CN AA results was disclosed. |
| | 64 | January 8, 2015 |
| Data Verification Amended NI 43-101 Technical Report |
| ● | Historic twin hole programs were only partially successful in confirming assay results and geology. Without down-hole surveys and with moderately to steeply inclined mineralization and geology in portions of the deposit, any down-hole variation in azimuth and inclination could lead to different results in the twin holes. While this was noted as a potential issue, the historic drilling was conducted at 50-foot intervals east-west along line separated by 100 feet north-south. It was concluded that this drill hole density, and resulting relatively consistent picture of the subsurface geology and mineralization, greatly diminished the risk of a significant problem. |
| ● | A comparison of geology and mineralization in Midway angle holes with nearby historic drill holes showed reasonable agreement, with no biases in the tenor of mineralized zones. |
12.1.2 Midway Drilling in 2011
The Gustavson Associates report (Gustavson, 2012) documented verification of the Midway 2011 drilling program in the resource area. This included review and analysis of the following:
Drill hole locations were confirmed in the field.
Assay certificates from ALS Minerals were reviewed and confirmed as accurately input into the Midway database.
The Midway QA/QC program was reviewed and determined satisfactory.
Midway twin holes, comparing a Midway core hole with an adjacent Midway reverse circulation hole, generated comparable results, thereby verifying confidence in reverse circulation drilling results and further verifying the quality of the pre-Midway historic drilling results, which were largely completed using reverse circulation equipment.
OGM, for purposes of this Report, agrees with the verification outcomes and recommendations of the Gustavson Associates report (Gustavson, 2012). The historic database is of sufficient quality for use in the generation of a mineral resource estimate, subject to the elimination of certain drill hole data that could not be verified as of high quality.
12.2 MIDWAY 2012 - 2013 DRILLING PROGRAM
OGM conducted a site visit to Midway’s office in Ely, Nevada and to the Gold Rock Project site over approximately one and one half days during the period May 6 – 8, 2014.
12.2.1 Drill Hole Locations
Drilling activities were completed in January, 2013 so there were no active drilling operations at the time of the site visit. All drill sites from the 2012 – 2013 program had been reclaimed and drill hole collar pins and tags buried. GPS readings on a number of the sites agreed with the locations documented in the drill hole database, and as depicted on plan maps.
12.2.2 Drill Core and Reverse Circulation Rejects
The remaining half of split drill core, bagged rejects from reverse circulation drilling and boxed pulps returned from ALS Minerals were stored orderly in a secure facility in Ely, Nevada.
| | 65 | January 8, 2015 |
| Data Verification Amended NI 43-101 Technical Report |
A complete set of electronic assay certificates from ALS Minerals was provided by Midway. These include QA/QC results on standards, duplicates, and blanks incorporated by Midway as well as the lab internal QA/QC results. Assay results were compared with the entries into the Midway drill hole database. Approximately one-third of the assays for the 2012 – 2013 program were checked, without identifying an entry error.
12.2.4 Check Assays
Midway did not conduct a check assay program in the period since the last NI 43-101 report (April 2012).
12.2.5 Twin Holes
Midway drilled two twin hole comparisons: twinned diamond drill core and reverse circulation holes, both of which were drilled in 2012 (GR12-11 and GR12-25C); and a Midway core hole drilled to twin a historic drill hole with interesting mineralization somewhat outside the eastern edge of the known mineralization (GR12-28C and historic reverse circulation hole EJ-8).
Twin holes GR12-11 and GR12-25C showed excellent agreement, intercepting comparable geology and mineralization (Figure 12-1). The mineralized intercepts are nearly identical in gold grade and thickness (Table 12-1).
GR12-28C was drilled to twin historic Santa Fe hole EJ-8 that contained significant mineralization east of the known trend of the main mineralized zone (Figure 12-2). EJ-8 contained permissive geology based on the drill log, but GR12-28C failed to encounter either similar geology or mineralized ground. The collar post for EJ-8 remained as evidence of the drill site, so either the hole was drilled as an angle hole to the west (to intercept correct geology), or it deviated substantially to the west from planned orientation. The Santa Fe holes were analyzed by neutron activation and were eliminated from the database for resource calculation purposes, so the lack of verification of the geology and mineralization logged in EJ-8 does not impact the quality of the database used for the mineral resource estimation.
12.2.6 Meridian Ridge Property
On January 14, 2013, Midway acquired claims overlying Meridian Ridge to the south and west of the Easy Junior pit and Meridian Flats. This area was previously drilled by the Alta Bay joint venture in 1989, using reverse circulation drilling methods. The assay certificates were verified by OGM. Drill hole locations were plotted on an orthophoto of the Meridian Ridge area (Figure 12-2). Drill holes in the northeast corner of the Meridian Ridge property contain gold mineralization. The drill hole locations in this portion of Meridian Ridge show excellent correlation with the drill pads and drill roads that were developed at the time, and have subsequently been reclaimed (Figure 12-3). There is currently no Midway drilling in this area to confirm historic hole locations, mineralization, or subsurface geology. Until a confirmation program is completed, OGM recommends that any mineralization outlined by the historic drill holes be incorporated into the mineral resource estimate as Inferred resources.
| | 66 | January 8, 2015 |
| Data Verification Amended NI 43-101 Technical Report |
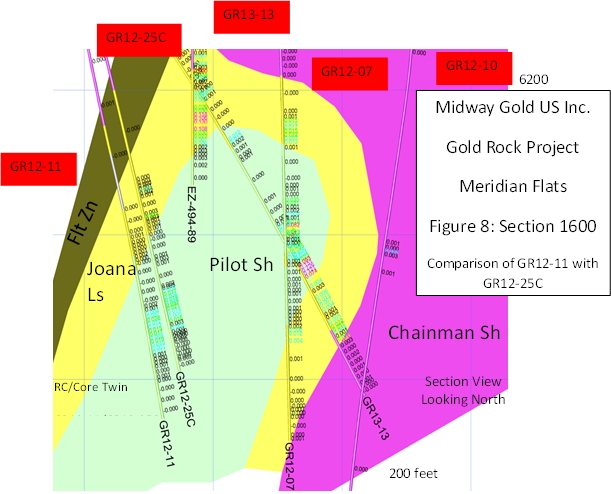
Figure 12-1 Midway Core – RC Twin Holes
Table 12-1 Twin Hole Assay & Thickness Comparison
| Drill Hole | Average Grade (opt) | Thickness (ft) | Down-hole Depth |
| GR12-11 | 0.0126 | 60 | 615 - 675 |
| GR12-25C | 0.0125 | 58 | 595 - 653 |
opt – ounces per ton ft – feet | |||
| | 67 | January 8, 2015 |
| Data Verification Amended NI 43-101 Technical Report |
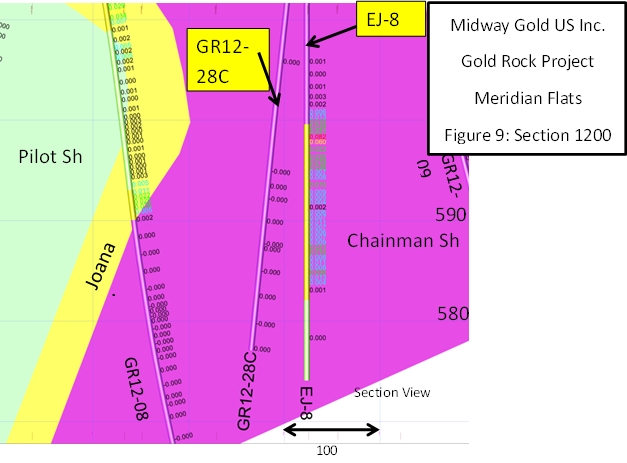
Figure 12-2 MGUS Core Twin of Historic EJ-8
| | 68 | January 8, 2015 |
| Data Verification Amended NI 43-101 Technical Report |
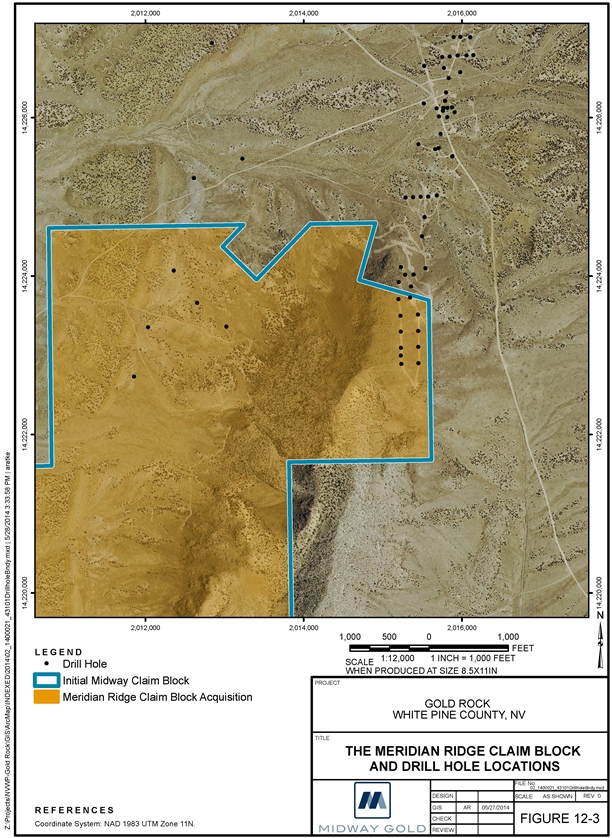
Figure 12-3 Meridian Ridge Claim Block and Drill Hole Locations
| | 69 | January 8, 2015 |
| Data Verification Amended NI 43-101 Technical Report |
12.3OPINION OF THE QUALIFIED PERSON
In the opinion of OGM, and subject to the noted exclusion of certain historic drill hole assay information, the historic and Midway drill hole assay data and geologic model are of sufficiently high quality to incorporate into the mineral resource estimate reported in Section 14 of this Report.
| | 70 | January 8, 2015 |
| Mineral Processing and Metallurgical Testing Amended NI 43-101 Technical Report |
| 13 | MINERAL PROCESSING AND METALLURGICAL TESTING |
Resource Development Inc. (RDi) completed a scoping level metallurgical testing of Midway Gold rock samples in December 6, 2012 (RDi report dated December 6, 2012). The objective of the test program was to identify the process parameters and associated reagent consumptions for the heap leach process.
● | RDi received six composite samples for the study. The composites were prepared based on feed grade and ore type. The testwork consisted of sample preparation and characterization, abrasion index determination, bottle roll leach tests, static bucket tests and column leach tests. The test protocol is given in The gold extraction for all composites at 0.5 inch crush size averaged 71.4% in 60 days of leach time. |
● | The pregnant solution analyses indicated that there should be no problems in carbon loading. |
Based on the scoping level test program, it is reasonable to conclude that the ore is amenable to heap leach process.
| | 71 | January 8, 2015 |
| Mineral Processing and Metallurgical Testing Amended NI 43-101 Technical Report |
● | The composite samples assayed 0.176 g/t to 1.89 g/t Au, 0.2 g/t to 8.4 g/t Ag, 0.24% to 1.13% STotal and 0.07% to 0.97% COrganic (Table 13-1). |
● | The major host rock in the samples is quartz (> 80%) except for composite D which had calcite as major host rock mineral. |
● | Abrasion index was determination for composite E indicated that the ore is abrasive. |
● | The metallic assays did not indicate presence of coarse gold. |
● | Bottle roll leach tests at coarse size of P80 of 6 mesh indicated gold extractions varied from 34.5% to 83.6% (Table 13-2). |
● | Gold extractions were similar at P80 of 200 mesh to those at P80 of 6 mesh. However, gold extractions improved to 72.8% to 93.3%.in the CIL tests. Hence, the ore exhibits preg-robbing properties (Table 13-3 and Table 13-4). |
● | The gold extraction of over 80% was obtained for all composites except for composite B and C which had ± 50% at a crush size of 0.5 inch in the column leach tests (Table 13-5). |
● | The gold extraction for all composites at 0.5 inch crush size averaged 71.4% in 60 days of leach time. |
● | The pregnant solution analyses indicated that there should be no problems in carbon loading. |
Based on the scoping level test program, it is reasonable to conclude that the ore is amenable to heap leach process.
| | 72 | January 8, 2015 |
| Mineral Processing and Metallurgical Testing Amended NI 43-101 Technical Report |
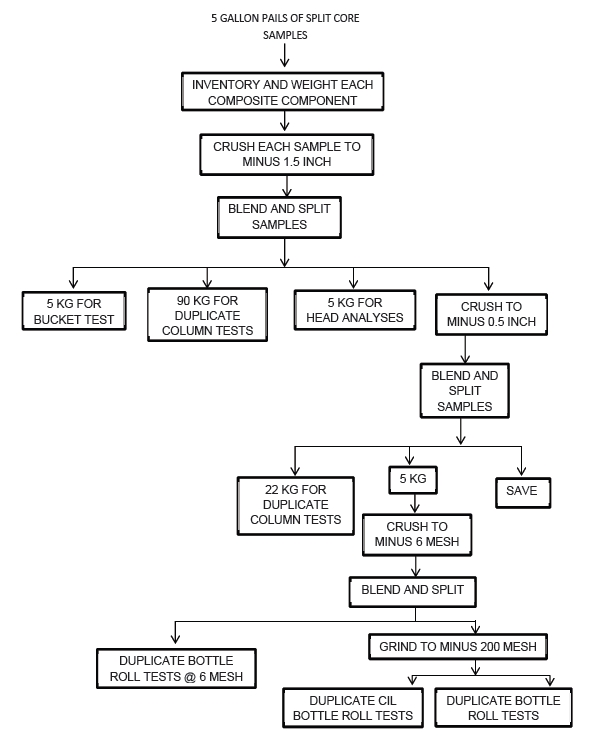
Figure 13-1 Sample Preparation Test Protocol
| | 73 | January 8, 2015 |
| Mineral Processing and Metallurgical Testing Amended NI 43-101 Technical Report |
Table 13-1 Head Analyses of Comosite Samples
| Element | Composite | |||||
| A | B | C | D | E | F | |
| Au, g/t | ||||||
| Assay #1 | 0.192 | 0.710 | 1.903 | 3.048 | 1.639 | 0.535 |
| Assay #2 | 0.16 | 0.59 | 1.61 | 0.73 | 0.67 | 0.47 |
| Average | 0.176 | 0.65 | 1.76 | 1.89 | 1.15 | 0.50 |
| Ag, g/t | 0.2 | 0.2 | 8.4 | 1.6 | 0.6 | 1.0 |
CTotal,% | 0.21 | 0.16 | 0.10 | 6.50 | 0.47 | 0.51 |
Corganic,% | 0.16 | 0.14 | 0.07 | 0.97 | 0.44 | 0.13 |
Cinorganic,,% | 0.05 | 0.02 | 0.02 | 5.53 | 0.03 | 0.38 |
STotal, % | 0.25 | 0.24 | 0.44 | 1.13 | 0.97 | 0.29 |
SSulfide, % | 0.04 | 0.08 | 0.20 | 0.43 | 0.73 | 0.03 |
SSulfate, % | 0.21 | 0.16 | 0.24 | 0.70 | 0.24 | 0.26 |
Table 13-2 Bottle Roll Cyanidation Leach Results at P80 of 6 Mesh
| Parameters | Composite | |||||
A (T-1) | B (T-2) | C (T-3) | D (T-4) | E (T-5) | F (T-6) | |
| Extraction % Au | ||||||
| 6 hrs. | 84.5 | 46.2 | 52.9 | 28.7 | 52.6 | 80.3 |
| 24 hrs. | 85.9 | 54.4 | 66.4 | 33.9 | 66.1 | 93.1 |
| 48 hrs. | 87.3 | 56.7 | 68.2 | 34.4 | 67.1 | 94.8 |
| 72 hrs. | 88.7 | 57.6 | 70.7 | 34.0 | 67.3 | 93.3 |
| 96 hrs. | 80.6 | 58.6 | 71.1 | 34.5 | 67.5 | 86.3 |
| Residue, g/t Au | 0.03 | 0.42 | 0.62 | 1.93 | 0.54 | 0.07 |
| Cal. Feed, g/t Au | 0.16 | 1.01 | 2.14 | 2.94 | 1.67 | 0.53 |
| Reagent Consumption, kg/t | ||||||
| NaCN | 0.119 | 0.174 | 02.93 | 2.033 | 1.355 | 0.175 |
| Lime | 5.442 | 5.262 | 4.319 | 11.886 | 21.931 | 4.555 |
NOTE: Test performed at 40% solids with 1 g/L NaCN maintained in the test. | ||||||
Table 13-3 Bottle Roll Cyanidation Leach Results at P80 of 200 Mesh
| Parameters | Composite | |||||
A (T-7) | B (T-9) | C (T-11) | D (T-13) | E (T-15) | F (T-17) | |
| Extraction % Au | ||||||
| 6 hrs. | 95.7 | 68.7 | 88.5 | 27.7 | 83.4 | 85.5 |
| 24 hrs. | 97.2 | 68.3 | 90.0 | 35.2 | 80.9 | 86.8 |
| 48 hrs. | 98.8 | 67.9 | 91.6 | 37.9 | 78.4 | 88.2 |
| 72 hrs. | 90.8 | 69.0 | 90.1 | 36.9 | 77.8 | 86.9 |
| 96 hrs. | 82.7 | 68.6 | 90.0 | 36.9 | 76.1 | 85.5 |
| Residue, g/t Au | 0.03 | 0.31 | 0.20 | 1.83 | 0.38 | 0.08 |
| Cal. Feed, g/t Au | 0.16 | 0.97 | 1.98 | 2.90 | 1.60 | 0.54 |
| Reagent Consumption, kg/t | ||||||
| NaCN | 0.234 | 0.232 | 0.240 | 2.490 | 0.763 | 0.945 |
| Lime | 6.677 | 8.141 | 7.291 | 7.064 | 13.122 | 6.093 |
| | 74 | January 8, 2015 |
| Mineral Processing and Metallurgical Testing Amended NI 43-101 Technical Report |
Table 13-4 Carbon-in-Leach (CIL) Cyanidation Test Results at P80 of 200 Mesh
| Parameters | Composite | |||||
A (T-8) | B (T-10) | C (T-12) | D (T-14) | E (T-16) | F (T-18) | |
Extraction % Au (96 Hrs.) | 92.3 | 76.1 | 92.1 | 72.8 | 93.3 | 92.7 |
| Carbon, g/t Au | 5.53 | 26.27 | 65.93 | 71.46 | 52.99 | 1720 |
| Residue, g/t Au | 0.01 | 0.25 | 0.17 | 0.84 | 0.12 | 0.04 |
| Cal. Feed, g/t Au | 0.18 | 1.04 | 2.13 | 3.09 | 1.75 | 0.56 |
| Reagent Consumption, kg/t | ||||||
| NaCN | 0.774 | 0.830 | 0.833 | 3.101 | 1.067 | 1.306 |
| Lime | 6.132 | 8.212 | 7.320 | 7.079 | 13.101 | 6.078 |
Table 13-5 Summary of Column Leach Test Results
| No. | Composite | Crush Size, P80, ins | Leach Time day’s | Extraction % Au | Residue g/t Au | Cal. Head g/t Au | NaCN Consumption Kg/t |
| 1 | A | 0.5 | 43 | 95.3 | 0.016 | 0.332 | 3.632 |
| 2 | B | 0.5 | 67 | 24.4 | 0.984 | 1.301 | 2.387 |
| 3 | B | 0.5 | 67 | 43.8 | 0.593 | 1.054 | 2.259 |
| 4 | C | 0.5 | 69 | 51.5 | 0.723 | 1.489 | 6.156 |
| 5 | D | 0.5 | 43 | 83.4 | 0.105 | 0.628 | 1.153 |
| 6 | D | 0.5 | 43 | 73.9 | 0.147 | 0.562 | 1.073 |
| 7 | E | 0.5 | 67 | 80.2 | 0.309 | 1.559 | 3.377 |
| 8 | E | 0.5 | 67 | 84.2 | 0.189 | 1.194 | 3.575 |
| 9 | F | 0.5 | 69 | 87.5 | 0.075 | 0.600 | 2.481 |
| 10 | F | 0.5 | 67 | 90.1 | 0.062 | 0.628 | 2.527 |
| 11 | E | 1.5 | 101 | 81.4 | 0.245 | 1.320 | 4.187 |
| 12 | F | 1.5 | 100 | 78.9 | 0.130 | 0.615 | 2.670 |
| Average | 0.5 | 60 | 71.4 | 0.320 | 0.93 | 2.862 | |
| | 75 | January 8, 2015 |
| Mineral Resource Estimate Amended NI 43-101 Technical Report |
| 14 | MINERAL RESOURCE ESTIMATE |
The mineral resource estimate for the Gold Rock Project, as of February 11, 2014, was completed by Laura A. Baldwin, MSc., under the supervision of Eric LeLacheur, MSc., CPG., and David Mosch, QP., all of Midway. GRE has conducted a thorough review of the work done, duplicating and confirming each step of the resource estimation process.
Mineral resources stated for the Gold Rock project conform to the definitions adopted by the CIM, November 27, 2010, and meet criteria of those definitions, where:
A Mineral Resource is a concentration or occurrence of diamonds, natural solid inorganic material, or natural solid fossilized organic material including base and precious metals, coal, and industrial minerals in or on the Earth’s crust in such form and quantity and of such a grade or quality that it has reasonable prospects for economic extraction. The location, quantity, grade, geological characteristics and continuity of a Mineral Resource are known, estimated or interpreted from specific geological evidence and knowledge.
A “Measured Mineral Resource” is that part of a Mineral Resource for which quantity, grade or quality, densities, shape, and physical characteristics are so well established that they can be estimated with confidence sufficient to allow the appropriate application of technical and economic parameters, to support production planning and evaluation of the economic viability of the deposit. The estimate is based on detailed and reliable exploration, sampling and testing information gathered through appropriate techniques from locations such as outcrops, trenches, pits, workings and drill holes that are spaced closely enough to confirm both geological and grade continuity.
An “Indicated Mineral Resource” is that part of a Mineral Resource for which quantity, grade or quality, densities, shape and physical characteristics can be estimated with a level of confidence sufficient to allow the appropriate application of technical and economic parameters, to support mine planning and evaluation of the economic viability of the deposit. The estimate is based on detailed and reliable exploration and testing information gathered through appropriate techniques from locations such as outcrops, trenches, pits, workings and drill holes that are spaced closely enough for geological and grade continuity to be reasonably assumed.
An “Inferred Mineral Resource” is that part of a Mineral Resource for which quantity and grade or quality can be estimated on the basis of geological evidence and limited sampling and reasonably assumed, but not verified, geological and grade continuity. The estimate is based on limited information and sampling gathered through appropriate techniques from locations such as outcrops, trenches, pits, workings and drill holes.
| | 76 | January 8, 2015 |
| Mineral Resource Estimate Amended NI 43-101 Technical Report |
Midway created a three-dimensional (3-D) block model for estimating the mineral resources at the Gold Rock Project from both historical drill data and data generated by Midway. Drill hole data including collar coordinates, down hole surveys, assays, and geologic logs are stored in a secure Microsoft Access Database. Geological interpretations were provided by Midway geology and exploration staff.
The drill hole database used for the modeling and estimation of block gold grades at the Gold Rock Project contains 785 drill holes. All available drill hole and surface data was used when developing the geological interpretation. Constraints were applied to the drill hole database to obtain a subset of data for which location, assay, and geological information could be certified from actual records. This verified subset of drill holes used in the resource estimation contains 483 drill holes: 78 Midway drill holes from 2011 to 2013 and 405 historical drill holes. CN AA assays were used where fire assays were not available. These assay values were lower than fire assays would have been, potentially understating the resource. GRE included these assays to better constrain the estimation of grade in the deposit.
Since the 2012 database validation, the database was restructured to be more compatible with GEOVIA Surpac™ (Surpac), the modeling program used in the estimation. During this process, the database was audited again using the Surpac software, and several minor errors were corrected.
The validated subset of the Gold Rock drill hole database used for estimating the mineral resource presented herein contains gold assay analytical information on 43,271 sample intervals, with fire assay and cyanide digestion results stored separately. Table 14-1 summarizes the distribution of data. The drill holes used in the estimation are shown on the map in Figure 14-1, and are listed in Appendix A.
Since the last modeling effort in 2012, 47 additional holes have been drilled on the Gold Rock property, totaling 37,000 feet and including 9 core holes (nearly 6,800 feet), and resulting in an additional 7,244 samples.
Table 14-1 Sample Statistics
| Description | Number of Samples |
| Fire Assay Only | 27,941 |
| Cyanide Assay Only | 15,142 |
| Paired Fire and Cyanide Assays | 3,888 |
| Total Fire Assays | 31,829 |
| Total Cyanide Assays | 15,142 |
| Un-assayed Intervals | 341 |
| Total Samples | 47,312 |
| | 77 | January 8, 2015 |
| Mineral Resource Estimate Amended NI 43-101 Technical Report |
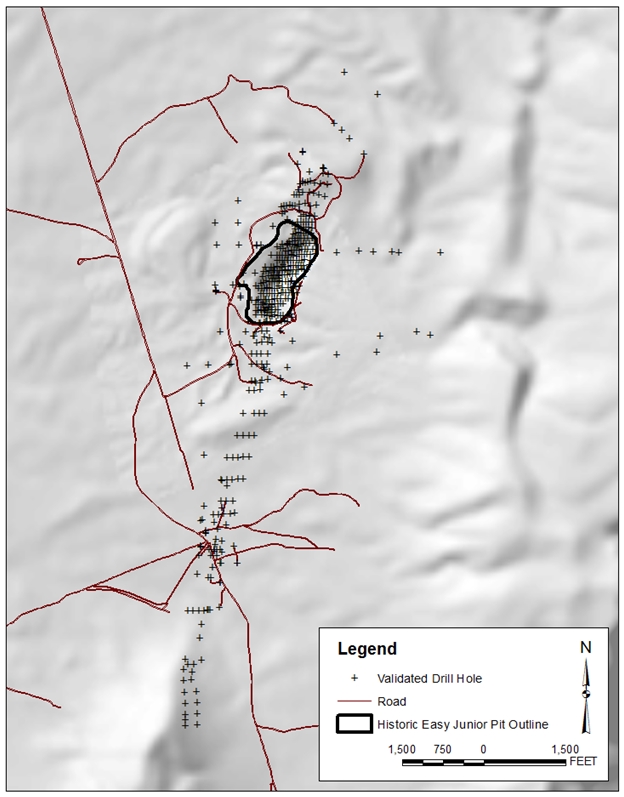
Figure 14-1 Validated Drill Hole Collars used in Gold Rock Estimation
| | 78 | January 8, 2015 |
| Mineral Resource Estimate Amended NI 43-101 Technical Report |
14.2DENSITY
Midway performed specific gravity tests on 197 diamond core samples from the Easy Junior pit and Meridian Flats areas. Samples with greater porosity were dipped in paraffin wax prior to measurement to aid in obtaining an accurate specific gravity measurement; less porous samples were not wax-coated. The samples were weighed dry, and then weighed in water on a Denver Instrument SI-602 analytical balance, and the weights were compared to calculate the specific gravity. The specific gravities for the Gold Rock Project are summarized in Table 14-2 .
Table 14-2 Density Measurement Data
| Ore/Waste Type | Inverted Tonnage Factor (1/TF) | Absolute Difference | Percent Difference | |
| Pan | Gold Rock | |||
| (measured by RDi) | (measured by Midway) | |||
| Argillic Fault Gouge | NA | 16.667 | NA | NA |
| Argillic Limestone | 14.085 | 12.658 | 1.426 | 10.1 |
| Argillic Shale | 16.129 | 14.085 | 2.045 | 12.7 |
| Argillic Solution Breccia | 14.085 | 14.085 | 0.000 | 0.0 |
| Carbon Altered Limestone | NA | 12.346 | NA | NA |
| Carbon Altered Shale | NA | 12.821 | NA | NA |
| Carbon Altered Solution Breccia | NA | 12.821 | NA | NA |
| Carbon Fault Breccia | NA | 12.821 | NA | NA |
| Siliceous Fault Gouge | NA | 12.821 | NA | NA |
| Siliceous Limestone | NA | 12.821 | NA | NA |
| Siliceous Shale | 13.889 | 13.333 | 0.556 | 4.0 |
| Silicified Solution Breccia | 12.987 | 12.821 | 0.167 | 1.3 |
| Note: The inverted tonnage factor has units of short tons per cubic foot of rock. | ||||
The specific gravity of many samples from the Pan project was also measured by this procedure. These samples were classified per the mineralized material and waste rock types as well as formation types. Initial inspection of the density results indicated a probable bias introduced by the measurement method. Consequently, a selection of samples was sent to an outside laboratory, RDi, for testing as a check on the accuracy of Midway’s method. The specific gravity of samples measured by RDi showed a difference of less than 3% compared to those measured by Midway. The method developed by RDi included drying the samples to drive off moisture and waxing all samples for consistency.
In the future, sample density at both Pan and Gold Rock will be measured according to the procedure developed by RDi. Specific gravity measurement protocols are described in and internal report completed by Midway (Verification of Specific Gravities Report, Midway 2014). The results are summarized in Table 14-2. The difference in densities between rocks from Pan and rocks from Gold Rock may be partly due to variation in alteration intensity, primary lithology, or sampling method.
In the Gold Rock block model, blocks in Joana Limestone were assigned an inverted tonnage factor value of 0.078 short tons/cubic foot, blocks in Chainman Shale were assigned a value of 0.074, blocks in Pilot shale were assigned a value of 0.072, and fault zone blocks were assigned a value of 0.076.
| | 79 | January 8, 2015 |
| Mineral Resource Estimate Amended NI 43-101 Technical Report |
14.3METHODOLOGY
Based upon the results of Midway’s recent drilling and mapping programs, a new geologic model was created. The geologic formations were sketched on 200-foot sections on paper, then digitized onto 200-foot sections in Surpac, and then triangulated into solid shapes. These shapes were used to code the blocks into an attribute for formation. Figure 14-2 shows the 3-D lithology model. Based on this model, a 3-D structural and lithologic model was created to use for coding the block model.
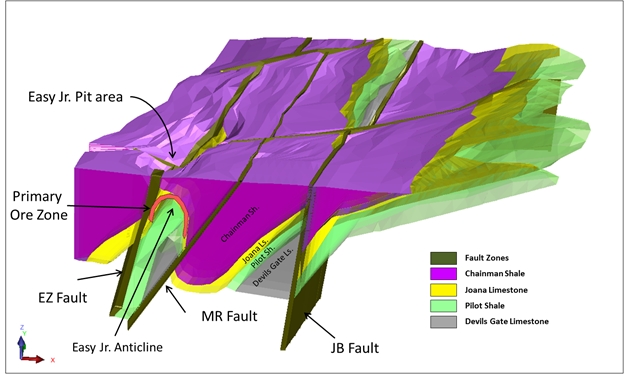
Figure 14-2 3-D Lithology model, Looking North-North-West
14.4ESTIMATION DOMAINS
14.4.1 Formation Domains
Midway modeled the Chainman Shale (Mc), Joana Limestone (Mj), and a fault zone (Flt). Pilot shale (MDP) and Devils Gate Limestone (Dd) were not modeled due to very few samples and lack of mineralization. Alluvium was not modeled, and mined-out material was removed later by clipping against topography. Figure 14-2 illustrates a cross section of the geological domains as interpreted from surface geology and drilling. The EZ fault cuts the western limb of the Easy Junior anticline. The anticline is slightly recumbent to the east. The current model postulates that mineralizing fluids traveled up the EZ fault and encountered the favorable horizons of the Joana Limestone and lower Chainman Shale. The fluids reacted with the calcareous rocks and deposited gold and other trace elements. The Easy Junior anticline may have provided a fluid trap that gave the fluids a significant time to react with the suitable formations. An eastern fault, termed the JB fault, cuts off the lower portion of the eastern limb of the anticline and may also act as a fluid conduit for the eastern limb.
| | 80 | January 8, 2015 |
| Mineral Resource Estimate Amended NI 43-101 Technical Report |
Due to the orientation and morphology of the anticline fold, three domains were used to cut the lithologies that comprise the fold, thus creating domains by lithology and morphology. Within each of the fold domains, the bedding of the rock units is approximately parallel. The fold domains were created so that favorable lithologic sub-units within the major formations could be modeled with more continuity. Overall, the data in the domains are geologically and statistically similar, which allows for a more accurate estimation based on geological interpretations.
Polygons and solids representing the domains were used to assign rock codes to the block model and composites. The individual blocks and composites were assigned integer codes representing the formation in which they occurred. Each block was graphically checked against the drilling data to ensure that it was assigned a reasonable code for formation by the solids. Minor errors were manually corrected.
Statistics were initially run on each of the domains created by the lithology and fold parts, for both the fire assays and cyanide assays. The data show that there are good correlations in most of the domains. The statistics for each domain are listed in Table 14-3.
Table 14-3 Gold Rock Composite Statistics
| Gold Rock Domain Fire Assay Descriptive Statistics (Au ≥ 0.001 opt) | |||||||
| Lithology Domain | Fold Domain | Count | Max | Mean | Median | St. Dev. | CoV |
| Fault Zone | Apex | 6 | 0.008 | 0.003 | 0.002 | 0.002 | 0.750 |
| Fault Zone | East | 5 | 0.016 | 0.007 | 0.002 | 0.006 | 0.968 |
| Fault Zone | West | 1536 | 0.260 | 0.018 | 0.010 | 0.023 | 1.309 |
| Chainman Shale | Apex | 713 | 0.191 | 0.013 | 0.006 | 0.020 | 1.522 |
| Chainman Shale | East | 83 | 0.046 | 0.006 | 0.004 | 0.008 | 1.284 |
| Chainman Shale | West | 2028 | 0.188 | 0.016 | 0.008 | 0.023 | 1.452 |
| Joana Limestone | Apex | 931 | 0.216 | 0.022 | 0.013 | 0.026 | 1.194 |
| Joana Limestone | East | 155 | 0.177 | 0.018 | 0.008 | 0.026 | 1.470 |
| Joana Limestone | West | 1291 | 0.175 | 0.020 | 0.010 | 0.025 | 1.247 |
| Pilot Shale | Apex | 123 | 0.066 | 0.008 | 0.004 | 0.012 | 1.385 |
| Pilot Shale | East | 32 | 0.039 | 0.004 | 0.002 | 0.007 | 1.904 |
| Pilot Shale | West | 56 | 0.062 | 0.008 | 0.002 | 0.013 | 1.602 |
| Gold Rock Domain Cyanide Assay Descriptive Statistics (Au ≥ 0.001 opt) | |||||||
| Lithology Domain | Fold Domain | Count | Max | Mean | Median | St. Dev. | CoV |
| Fault Zone | Apex | 2 | 0.001 | 0.001 | 0.001 | 0.000 | 0.000 |
| Fault Zone | East | 0 | 0.000 | 0.000 | 0.000 | 0.000 | 0.000 |
| Fault Zone | West | 90 | 0.030 | 0.003 | 0.002 | 0.004 | 1.152 |
| Chainman Shale | Apex | 344 | 0.018 | 0.003 | 0.002 | 0.002 | 0.704 |
| Chainman Shale | East | 12 | 0.006 | 0.003 | 0.003 | 0.002 | 0.523 |
| Chainman Shale | West | 290 | 0.132 | 0.004 | 0.002 | 0.008 | 2.331 |
| Joana Limestone | Apex | 151 | 0.021 | 0.003 | 0.003 | 0.003 | 0.726 |
| Joana Limestone | East | 23 | 0.010 | 0.003 | 0.002 | 0.002 | 0.762 |
| Joana Limestone | West | 100 | 0.038 | 0.005 | 0.003 | 0.006 | 1.179 |
| Pilot Shale | Apex | 42 | 0.007 | 0.002 | 0.002 | 0.001 | 0.618 |
| Pilot Shale | East | 5 | 0.002 | 0.002 | 0.002 | 0.000 | 0.306 |
| Pilot Shale | West | 6 | 0.006 | 0.002 | 0.002 | 0.002 | 0.728 |
| | 81 | January 8, 2015 |
| Mineral Resource Estimate Amended NI 43-101 Technical Report |
The domains were grouped for simplicity when they showed similar characteristics based on the variography and geometry. The final domains used for estimation are presented in Table 14-4.
Table 14-4 Final Domain Descriptive Statistics
| Domain | Count | Max | Mean | Median | St. Dev. | C o V |
| Joana - Limbs | 1501 | 0.177 | 0.020 | 0.010 | 0.02 | 1.26 |
| Joana - Apex | 999 | 0.216 | 0.023 | 0.014 | 0.03 | 1.20 |
| Joana - Meridian Ridge | 83 | 0.082 | 0.006 | 0.002 | 0.01 | 1.75 |
| Chainman | 2757 | 0.188 | 0.014 | 0.006 | 0.02 | 1.52 |
| Fault Zones | 1648 | 0.260 | 0.018 | 0.010 | 0.02 | 1.31 |
St. Dev. – standard deviation C o V – coefficient of variance | ||||||
14.4.3 Carbon-Alteration Domain Results
An attribute was created to distinguish carbon-altered zones from non-carbon-altered zones. The carbon alteration at Gold rock is closely correlated with reduced material, as defined by the presence of pyrite. Although pyrite is occasionally seen without carbon alteration, when there is no carbon alteration, the iron minerals are typically oxidized and present as assemblages of hematite and limonite minerals. Carbon alteration is also recognized by dark or black colored rock.
The “carbon_alt_flag” attribute was coded using solids. The solids were built from digitized shapes encompassing the carbon-altered areas as defined by recent (2011-2013) drilling on 200-foot sections and by the redox code from historical drilling. These domains will be used to differentiate mineralized material and waste rock types for metallurgical and waste characterization purposes. Figure 14-3 shows how the carbon attribute corresponds with the formation attribute and drilling. Figure 14-4 shows how closely the carbon attribute matches the drilling.
14.4.4 Grade Capping
Cumulative frequency plots (CFP) for gold values within all domains were created and used to cap gold values. The plots suggest that a slight capping of values is appropriate. There exists a significant slope change at 0.260 ounces per ton. Above this threshold, the top 15 samples show an erratic trend differing from the main sample population. A cap of 0.260 is consistent with the capping value used in the Gold Rock Project 2012 NI 43-101 Technical Report. Fifteen samples, approximately .054% of the data, are affected by a cap set at 0.260 ounces per ton. The combined CFP for all domains is shown in Figure 14-5, and a detailed CFP showing the 200 highest samples is shown in Figure 14-6.
Observing the coefficient of variation (CoV) for the samples with or without capping is a way to ascertain whether the capping value is improving the variance of the dataset. While the mean is nearly the same between the capped and uncapped data, the standard deviation drops markedly with the cap set to 0.26. Although the CoV is still quite high (0-1 generally considered good, 1-2 considered acceptable, >2 considered poor), it can be seen that even capping just .037% of the data greatly improves the CoV. Figure 14-5 shows the coefficients of variation for the capped and uncapped datasets.
| | 82 | January 8, 2015 |
| Mineral Resource Estimate Amended NI 43-101 Technical Report |
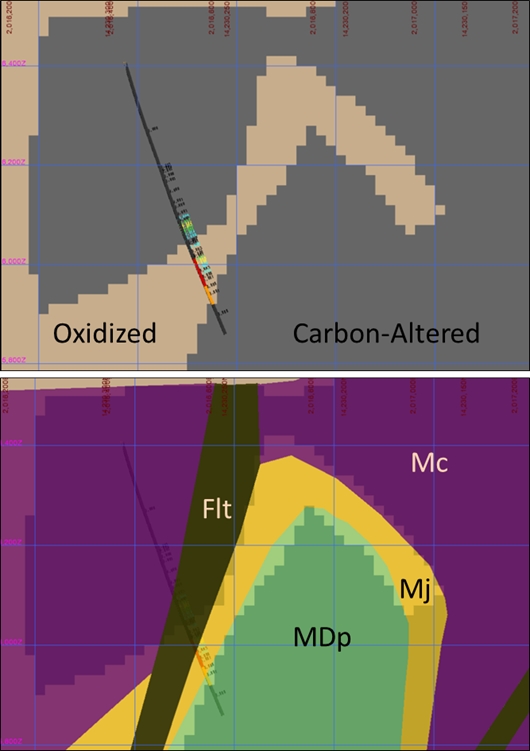
Figure 14-3 Carbon Alteration Domain Follows Lithology and Drilling
Logged on Drill Holes
| | 83 | January 8, 2015 |
| Mineral Resource Estimate Amended NI 43-101 Technical Report |
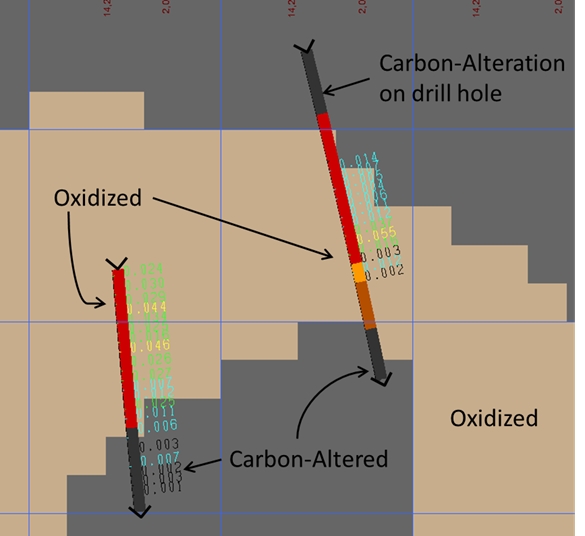
Figure 14-4 Detail of Carbon Alteration on hole. Drill Hole
(drill holes shown are piercing in and out of the 20-foot section view)
| | 84 | January 8, 2015 |
| Mineral Resource Estimate Amended NI 43-101 Technical Report |
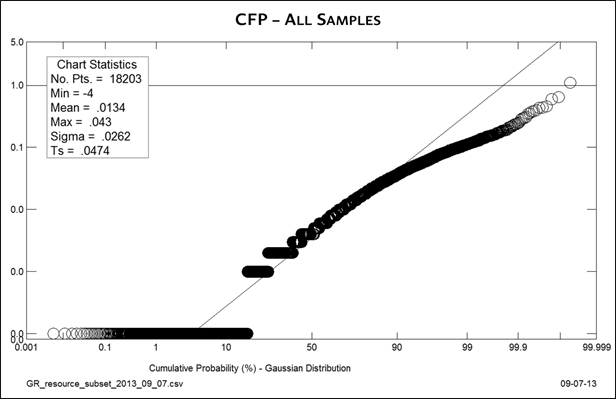
Figure 14-5 Cumulative Frequency Plot for All Samples
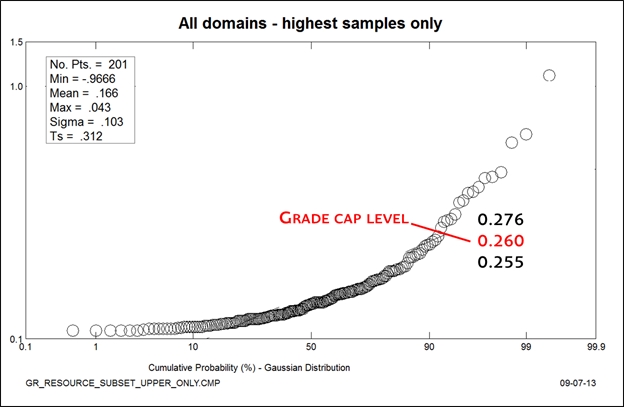
Figure 14-6 Cumulative Frequency Plot for Highest Samples
| | 85 | January 8, 2015 |
| Mineral Resource Estimate Amended NI 43-101 Technical Report |
| Standard Deviation | Mean | Coefficient of Variation | |
| No Capping | 0.0183 | 0.0057 | 3.2130 |
| Capped at 0.260 | 0.0165 | 0.0056 | 2.9365 |
Fourteen of the 15 capped samples are within the Chainman Shale, but the highest grade sample at the Gold Rock Project is within the Joana Limestone. The drill holes are plotted on the map presented as Figure 14-7. The distribution shows that there is not a high-grade pod that needs to be modeled differently, but rather that the samples fall in the known area of mineralization and are in the areas of the most closely spaced drilling. About half of these samples are removed by historical mining (shown as a red X) and half are still in the ground or influence blocks still in the ground (shown as a green +).
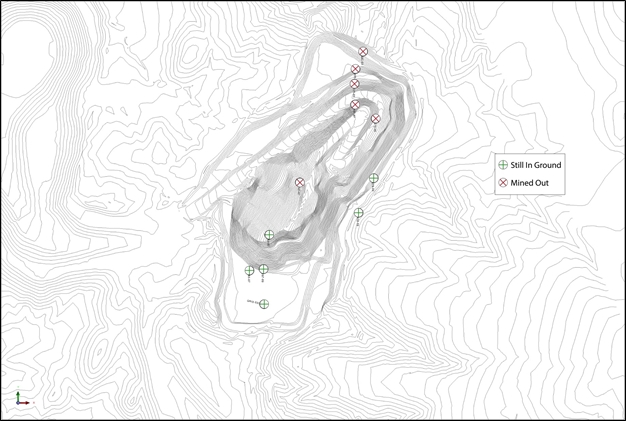
Figure 14-7 Map of Drill Holes Requiring Capping
14.4.5 Compositing
Raw, capped samples from the Gold Rock data base were composited in multiple ways to determine the optimum composite length. The average sample length in the Gold Rock database is 5.012 feet, and 98.89% of the samples are exactly 5 feet. Global composites were run, and the parameters and statistical results for each are shown in Table 14-6.
| | 86 | January 8, 2015 |
| Mineral Resource Estimate Amended NI 43-101 Technical Report |
Table 14-6 Composite Descriptive Statistics
| Composite Type | Mean grade | St. Dev. In Grade | CoV |
| 5-foot down-hole | 0.0056 | 0.0165 | 2.9463 |
| 10-foot down-hole | 0.0056 | 0.0153 | 2.7407 |
| 20-foot down-hole | 0.0056 | 0.0141 | 2.5261 |
| 30-foot down-hole | 0.0056 | 0.0133 | 2.3903 |
| 10-foot bench | 0.0057 | 0.0141 | 2.4829 |
| 20-foot bench | 0.0057 | 0.0141 | 2.4780 |
| 30-foot bench | 0.0058 | 0.0143 | 2.4843 |
Overall, the bench composites show a slightly higher grade than do the down-hole composites, suggesting that the bench compositing method is over-smoothing. The 5-foot down-hole composites do not distribute the grade enough, but the 20 or 30-foot composites may suggest the samples have more continuity than they actually have. Therefore, the 10-foot down-hole composites appear most appropriate. The 10-foot composites are a multiple of the average sample length and a divisor of 20 feet, the most commonly used bench height in smaller Nevada open pit mines.
Although this was a global analysis performed using the entire validated dataset, composites used in the estimation are within each domain listed above, using 10-foot down-hole composites. Final composite statistics for each domain are shown in Table 14-6.
14.4.6 Variography
Variography analysis was completed for each of the domains to establish the spatial variability of the mineralization. The variograms for Gold Rock were created using composites of fire assays only.
Data sets were created based on rock type and fold domain. Because there are so few assay samples in the MDp and Dd, it was not possible to use realistic searches or to produce reliable geostatistics. Therefore, the MDp and Dd units were only used as indicators for geological interpretation, not as mineral domains.
Variograms were calculated for the following domains:
| ● | Joana – Apex domain |
| ● | Joana – Limbs domain (includes west and east limbs of the fold domain) |
| ● | Chainman domain |
| ● | Fault zones |
Directional and omnidirectional variograms were constructed using a “Pairwise Relative” method of organizing the variance pairs. The variogram structures were modeled using a spherical model type. The search ellipsoid axis orientations were based on the results of that analysis. The sill value for each domain was also taken from the directional variograms. The nugget value was determined from the down-hole variogram of each domain. The directional variograms were explicitly modeled with the nugget determined from down-hole variograms. Variogram results are shown in Table 14-7.
| | 87 | January 8, 2015 |
| Mineral Resource Estimate Amended NI 43-101 Technical Report |
| Doman | Nugget | Sill | Range |
| Joana Limbs | 0.20 | 0.25 | 173.7 |
| Joana Apex | 0.20 | 0.34 | 133.5 |
| Chainman | 0.31 | 0.32 | 52.9 |
| Fault Zones | 0.49 | 0.52 | 85.9 |
14.4.7 Estimation Methodology
A 3-D block model was created for the Gold Rock deposit using blocks that were 20 square feet. Each block was assigned attributes to classify its domain (both lithology and fold domain), gold confidence classification, rock density, and gold grade. Using the attributes, each block was assigned density and domain parameters to aide in grade estimation.
The estimation parameters for each of the domains are given in Table 14-9. Gold content estimates for blocks of all domains were estimated by ordinary kriging, inverse distance cubed, and nearest neighbor methods.
14.4.8 Estimation Validation
The model was validated by first examining the blocks against the actual drill hole assay data to determine whether the estimated blocks fit the geological parameters of the various domains in the model. Gold grade values in the blocks were compared to the assay results to determine whether the model was predictive and actually estimated grades close to the assay point data.
The following three figures show blocks on sections at Meridian Flats (Figure 14-8), at the south end of Easy Junior pit (Figure 14-9), and at the north end of the Easy Junior pit (Figure 14-10). The blocks in these figures are colored the same as the grade in drill holes for direct comparison.
Figure 14-11 shows a quantile plot of the block results from each estimation method. The ordinary kriging model smoothes the data by enhancing the lowest grades and diluting the highest grades. This effect is minimized for the inverse distance cubed method, and is even less for the nearest neighbor estimate, which most closely approximates the original assay data, but does not incorporate the search parameters. The validity of the three models is quite high as evidenced by where the estimates cross one another, which is near to the 50th quantile (Figure 14-11). Figure 14-12 shows a quantile plot for the various estimation methods, but only for blocks with a “Measured” classification. The skewness from the raw data is even more pronounced in the Measured category because of the relatively higher grades of these samples. GRE has picked the inverse distance cubed model as being most representative of the grade that might be obtained during open pit mining and has used the that model in the Mineral Resource Statement.
14.5MINERAL RESOURCE ESTIMATE
14.5.1 Mineral Resource Classification
The Gold Rock mineral resource estimate is classified into Inferred, Indicated, and Measured categories according to CIM classification standards, with each successive classification requiring more
| | 88 | January 8, 2015 |
| Mineral Resource Estimate Amended NI 43-101 Technical Report |
conservative estimation parameters. A mineral reserve has not been estimated for Gold Rock at this time. Table 14-8 shows the parameters used to classify each block as Measured, Indicated, or Inferred.
Table 14-8 Inverse Distance Cubed Parameters
| Domain Name | Mj Limbs | Mj Apex | Mj Meridian Ridge | ||||||
| Resource Classification | Measured | Indicated | Inferred | Measured | Indicated | Inferred | Measured | Indicated | Inferred |
| Resource Classification Code | 1 | 2 | 3 | 1 | 2 | 3 | 1 | 2 | 3 |
| Composite file | joana_limbs.str | fa_19_apex.str | fa_19_meridian_ridge | ||||||
| Minimum Number samples | 5 | 3 | 3 | 5 | 3 | 3 | 5 | 3 | 3 |
| Maximum Number samples | 13 | 13 | 13 | 13 | 13 | 13 | 13 | 13 | 13 |
| Maximum Samples per hole | 3 | 2 | 3 | 3 | 2 | 3 | 3 | 2 | 3 |
| Maximum Search Radius | 75 | 150 | 250 | 75 | 150 | 250 | 30 | 60 | 120 |
| Maximum Vertical search Radius | 75 | 150 | 250 | 75 | 150 | 250 | 30 | 60 | 120 |
| Ellipsoid Orientation- Bearing | 12 | 15 | 12 | ||||||
| Ellipsoid Orientation- Plunge | 0.2 | -15 | 0 | ||||||
| Ellipsoid Orientation- Dip | 78.8 | 0 | 0 | ||||||
| Anisotropy Ratio - Major: Semi-Major | 1.752 | 1.1 | 2.6 | ||||||
| Anisotropy Ratio - Major: Minor | 2.741 | 2.4 | 3.5 | ||||||
| Variogram | joana_limbs_vgm.vgm | joana_apex_vgm.vgm | joana_apex_vgm.vgm | ||||||
| Nugget (co) | 0.22 | 0.2 | 0.313 | ||||||
| Sill (c1) | 0.24 | 0.339 | 0.339 | ||||||
| Range (a1) | 173 | 133 | 60 | ||||||
| Domain Name | Mc | Flt | |||||||
| Resource Classification | Measured | Indicated | Inferred | Measured | Indicated | Inferred | |||
| Resource Classification Code | 1 | 2 | 3 | 1 | 2 | 3 | |||
| Composite file | fire_18.str | fire_13.str | |||||||
| Minimum Number samples | 5 | 3 | 3 | 5 | 3 | 3 | |||
| Maximum Number samples | 13 | 13 | 13 | 13 | 13 | 13 | |||
| Maximum Samples per hole | 3 | 2 | 3 | 3 | 2 | 3 | |||
| Maximum Search Radius | 45 | 85 | 175 | 75 | 150 | 250 | |||
| Maximum Vertical search Radius | 45 | 85 | 175 | 75 | 150 | 250 | |||
| Ellipsoid Orientation- Bearing | 12 | 15 | |||||||
| Ellipsoid Orientation- Plunge | 0 | -15 | |||||||
| Ellipsoid Orientation- Dip | 78 | 0 | |||||||
| Anisotropy Ratio - Major: Semi-Major | 1.752 | 1.1 | |||||||
| Anisotropy Ratio - Major: Minor | 2.741 | 2.4 | |||||||
| Variogram | chainman_allfire.vgm | joana_apex_vgm.vgm | |||||||
| Nugget (co) | 0.489 | 0.2 | |||||||
| Sill (c1) | 0.699 | 0.509 | |||||||
| Range (a1) | 86 | 133 | |||||||
| | 89 | January 8, 2015 |
| Mineral Resource Estimate Amended NI 43-101 Technical Report |
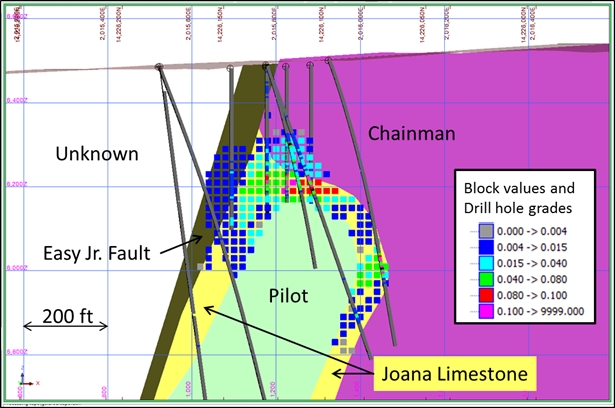
Figure 14-8 Section 1400, Looking North
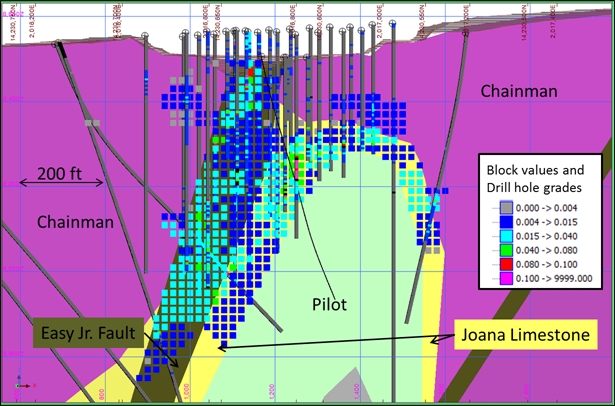
Figure 14-9 Section 6000, Looking North
| | 90 | January 8, 2015 |
| Mineral Resource Estimate Amended NI 43-101 Technical Report |
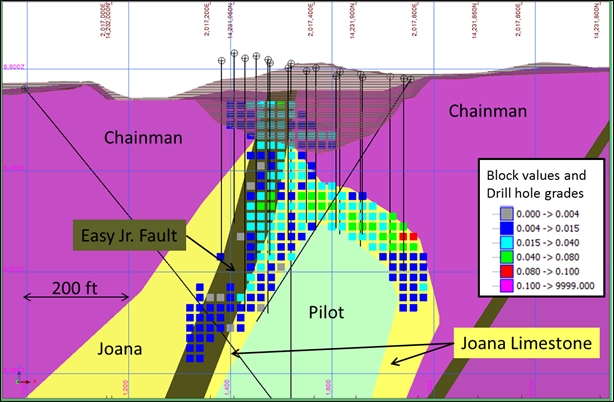
Figure 14-10 Section 7400, Looking North
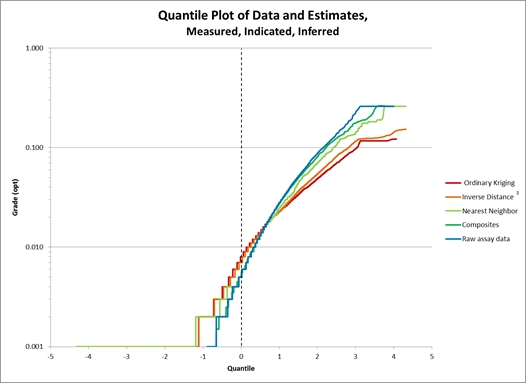
Figure 14-11 Quantile Plot Comparing Raw Data, Composites, Nearest Neighbor, Inverse Distance Cubed and Ordinary Kriging Results
| | 91 | January 8, 2015 |
| Mineral Resource Estimate Amended NI 43-101 Technical Report |
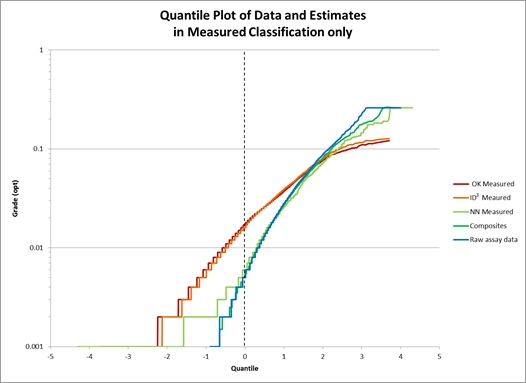
Figure 14-12 Quantile Plot Comparing Raw Data, Composites, Nearest Neighbor, Inverse Distance Cubed and Ordinary Kriging Results for Measured Blocks
For blocks to receive a Measured resource classification requires mineralization at a distance of less than one-half the range at the sill. The Indicated resource requires mineralization within a distance equal to the range at the sill, and for Inferred mineralization, the search distance is be increased to twice the range at the sill.
The Gold Rock mineral resource estimate is summarized in Table 14-9. This mineral resource estimate includes all validated drill data from fire assays. Table 14-9 presents the Gold Rock mineral resource at three different cut-off grades, with the base case cut-off of 0.006 ounces per ton highlighted.
Table 14-9 and Table 14-10 compare the Gustavson (2012) resource estimate to the Midway Gold (2014) estimate. In the Measured and Indicated categories, the grade is nearly constant, but the tons and ounces are more than doubled. In the Inferred category, the grade is slightly improved, and the tons and ounces are nearly doubled. The 2014 estimate is 82% higher than the previous estimate, which is largely attributed to improved estimation domains that more closely fit the geology of the deposit and additional drilling.
Table 14-9 Measured, Indicated, and Inferred Resource, No grouping (Midway, 2014)
| Category | Cutoff (opt) | ||
| 0.004 | 0.006 | 0.008 | |
| Measured | |||
| Tons (x1000) | 2,351 | 2,116 | 1,907 |
| Grade (opt) | 0.02 | 0.021 | 0.023 |
| Gold Ounces | 46,000 | 45,000 | 44,000 |
| | 92 | January 8, 2015 |
| Mineral Resource Estimate Amended NI 43-101 Technical Report |
| Category | Cutoff (opt) | ||
| 0.004 | 0.006 | 0.008 | |
| Indicated | |||
| Tons (x1000) | 28,836 | 24,125 | 20,376 |
| Grade (opt) | 0.018 | 0.021 | 0.023 |
| Gold Ounces | 518,000 | 495,000 | 469,000 |
| Measured + Indicated | |||
| Tons (x1000) | 31,187 | 26,241 | 22,283 |
| Grade (opt) | 0.018 | 0.021 | 0.023 |
| Gold Ounces | 564,000 | 540,000 | 513,000 |
| Inferred | |||
| Tons (x1000) | 48,176 | 35,416 | 26,790 |
| Grade (opt) | 0.014 | 0.017 | 0.02 |
| Gold Ounces | 660,000 | 596,000 | 536,000 |
Table 14-10 Indicated and Inferred Resource (Gustavson, 2012)
| Cutoff (opt) | Indicated Resource | Inferred Resource | ||||
| Tons (x1000) | Grade (opt) | Gold Ounces | Tons (x1000) | Grade (opt) | Gold Ounces | |
| 0.004 | 19,852 | 0.017 | 343,000 | 33,576 | 0.012 | 409,000 |
| 0.008 | 14,294 | 0.022 | 310,000 | 19,724 | 0.017 | 331,000 |
| 0.012 | 10,574 | 0.026 | 273,000 | 11,967 | 0.021 | 255,000 |
| 0.015 | 8,620 | 0.029 | 247,000 | 8,670 | 0.024 | 210,000 |
14.5.2 Whittle Analysis
The Gold Rock Global resource estimate was subjected to a Whittle pit optimization to determine the portion of the resource might potentially be mined by the open pit mining method. This optimization was carried out with the use of Geovia’s Whittle optimization software. This software uses a Lerchs-Grossman algorithm to determine an optimal open pit minable shape (shell) utilizing economic, geotechnical, metallurgical, and limited scheduling data. The pit optimization utilized measured, indicated, and inferred mineral classes.
Pit shells were generated at gold prices from $1,100 to $1,900 per troy ounce in $200 increments, shown below in Table 14-11. The $1,500 pit shell was selected for the Mineral Resource Statement as $1,500 is slightly less than the 3-year average gold price of $1,543.83.
A 45°pit slope angle was use for all pit slopes since no geo-mechanical studies have yet been completed. This angle is also supported with the historic Easy Junior Pit, which has an inter-ramp angle of 45° and has held up well over time.
Table 14-11 Whittle Pit Shells at Various Gold Prices at a 0.006 Cutoff
| 0.006 Cut-off | |||||||||
| Pit | Measured | Indicated | Inferred | ||||||
Tons (x1000) | Grade (opt) | Contained (x1000 Oz) | Tons (x1000) | Grade (opt) | Contained (x1000 Oz) | Tons (x1000) | Grade (opt) | Contained (x1000 Oz) | |
| $1,100 | 1,534 | 0.022 | 33 | 11,215 | 0.022 | 246 | 3,719 | 0.017 | 63 |
| $1,300 | 1,905 | 0.023 | 43 | 17,367 | 0.022 | 380 | 8,930 | 0.023 | 203 |
| $1,500 | 1,972 | 0.022 | 44 | 18,505 | 0.022 | 400 | 10,276 | 0.022 | 228 |
| $1,700 | 1,996 | 0.022 | 44 | 19,159 | 0.021 | 411 | 11,091 | 0.022 | 239 |
| $1,900 | 2,012 | 0.022 | 44 | 19,868 | 0.021 | 422 | 12,601 | 0.021 | 261 |
| | 93 | January 8, 2015 |
| Mineral Resource Estimate Amended NI 43-101 Technical Report |
The results of the Whittle pit optimization at a $1,500 gold price are shown in Table 14-13.
Table 14-12 Whittle Estimation Parameters
| Item | Cost/Rate | Units |
| Ore and Waste Cost | $1.50 | $ per Ton |
| Processing Cost | $2.58 | $ per Ton Ore |
| G&A | $0.37 | $ per Ton Ore |
| Heap Leach Recovery | 70% | |
| Royalties | 2% | |
| Gold Marketing Cost | $1.00 | $ per Troy Ounce |
Table 14-13 Whittle Pit Shell Mineral Resource at $1,500 per Ounce at Various Cutoffs
| Class | Cut Off (opt) | Mass Measured (Tons x1000) | Grade Indicated | Gold (Troy ounces) |
| Measured Mineral Resource | ||||
| 0.008 | 1,797 | 0.024 | 43,000 | |
| 0.006 | 1,972 | 0.022 | 44,000 | |
| 0.004 | 2,157 | 0.021 | 45,000 | |
| Indicated Mineral Resource | ||||
| 0.008 | 15,951 | 0.024 | 383,000 | |
| 0.006 | 18,505 | 0.022 | 401,000 | |
| 0.004 | 21,602 | 0.019 | 416,000 | |
| Total Measured and Indicated Mineral Resource | ||||
| 0.008 | 17,749 | 0.024 | 426,000 | |
| 0.006 | 20,477 | 0.022 | 445,000 | |
| 0.004 | 23,759 | 0.019 | 461,000 | |
| Inferred Mineral Resource | ||||
| 0.008 | 8,536 | 0.025 | 215,000 | |
| 0.006 | 10,275 | 0.022 | 227,000 | |
| 0.004 | 12,066 | 0.020 | 236,000 | |
| Internal Waste ( at a 0.004 Cut Off) | ||||
| 119,000 | At a 0.004 opt Cut Off | |||
14.5.3 Cut Off Grade Calculation
The cut-off grades for each of the Whittle pits is calculated for each appropriate gold price and for each pit is presented in Table 14-14. The following example formula shows the calculation for the $1,500 pit that is used for the resource estimate.
Cost Item Cost
Mining $1.50/ton
Process $2.58/ton
| | 94 | January 8, 2015 |
| Mineral Resource Estimate Amended NI 43-101 Technical Report |
G&A 0.37/ton
Total $4.45/ton
With 70% recovery, the cost is $4.45/(0.7) = $6.36/ton contained, and with a metal price of $1,500/ounce (oz), the calculated cutoff grade is 
Table 14-14 Gold Rock Whittle Pit Cutoff Grades
| Gold Price ($/oz) | Cut-Off Grade (opt) |
| $1,100 | 0.006 |
| $1,300 | 0.005 |
| $1,500 | 0.004 |
| $1,700 | 0.004 |
| $1,900 | 0.003 |
14.5.4 Dilution
Dilution within this Whittle analysis was not considered. The estimation method inherently provides diluted characteristics for this level of analysis.
14.5.5 Recommendations for Future Work
Additional core drilling is required for metallurgical and geotechnical studies. This can be partly accomplished by sampling available core on hand for metallurgical testing and working with the geotechnical data that has already been collected. Additional Acid Base Accounting (ABA) studies are also warranted on this project, largely due to the presence of pyrite and little unaltered limestone available for buffering. Further work should be completed to investigate the preg-robbing and recovery issues in the carbon altered zones. Additional density testing is also recommended.
| | 95 | January 8, 2015 |
| Adjacent Properties Amended NI 43-101 Technical Report |
| 15 | ADJACENT PROPERTIES |
There are no known activities on adjacent properties that affect the current exploration program on the Gold Rock Project.
Similar deposits in the surrounding area include Midway Gold’s Pan Project, approximately 8 miles to the northwest, Green Springs, approximately 10 miles southeast of Gold Rock, and Griffon, Illipah, Alligator Ridge, and others.
| | 96 | January 8, 2015 |
| Other Relevant Data and Information Amended NI 43-101 Technical Report |
| 16 | OTHER RELEVANT DATA AND INFORMATION |
GRE knows of no other relevant data or information that is not already contained in this report which might materially affect the Gold Rock Project.
| | 97 | January 8, 2015 |
| Interpretation and Conclusions Amended NI 43-101 Technical Report |
| 17 | INTERPRETATION AND CONCLUSIONS |
The Gold Rock deposit, formally known as Easy Junior, contains a substantial gold resource that warrants additional exploration and evaluation. The mineralization system is strong, with a known strike length of over 8,000 feet. The lithology, alteration, and mineralization of the Gold Rock deposit are similar to other sediment-hosted Carlin-type systems such as Alligator Ridge, Bald Mountain, Rain, and Midway Pan Project. A portion of the Gold Rock deposit has been explored and mined, but drilling outside that area is very widely spaced, shallow and locally intercepts anomalous gold mineralization. Historic exploration has not cut off mineralization in any direction.
GRE has reviewed and audited the work completed by Midway and historic information. CN AA analysis results were included in the database for assay intervals not also assayed by fire assay at the Robinson laboratory. The CN AA results, on average, understate gold values as compared with fire assay results, but are believed to represent a conservative component to the estimate of gold grade. GRE concludes that there is adequate drilling information to estimate Measured, Indicated, and Inferred mineral resource estimates reported herein. The inverse distance cubed estimate is considered by GRE to be most representative of the mineralization present at Gold Rock and recommends its use in the Mineral Resource Statement. GRE has reviewed and audited the estimation methodology and Whittle pit optimization used by Midway and finds the work done well, complete, and compliant with NI 43-101 standards.
| | 98 | January 8, 2015 |
| Recommendations Amended NI 43-101 Technical Report |
| 18 | RECOMMENDATIONS |
GRE recommends the following:
● | Continued drilling at Gold Rock to validate historic drilling, especially in areas where CN AA and/or Ward FA analyses dominate certain areas (if any). |
● | Drilling at Meridian Ridge to validate the geology and mineralization. |
● | Add CN AA analyses to the next drilling programs to help decipher "ore types"; also, might add total sulphur/sulfide. These would enable distinction between carbon and sulfide types, and could build confidence in visual abilities to distinguish (log) different ore types. Based on the Alta Bay rumor that the south bench was not mined because of recovery issues, you may not want to take for granted anything visual until confirmed with the CN and sulfide analyses. |
● | Conduct multi-element ICP analyses on 50-foot composites, except in areas lacking nearby data or in new areas. |
● | At the end of the next drilling program, conduct a rigorous check assay program including core and reverse circulation samples, OREAS standards and blanks. Use a couple of labs in addition to ALS. This will ensure there are no (or identify potential) biases in the ALS work to date, and help to gain comfort in the OREAS standards that are currently providing assay results either side of the "tolerance levels" provided by OREAS. On this topic, it is suggested that you use the OREAS reported value to measure against, not the on-going average of the Midway results from Gold Rock. |
● | A geotechnical drilling program should be initiated to allow the appropriate data to be collected to establish slope stability characteristics for pit slopes. |
● | Additional metallurgical testing and column leach. |
● | Conduct a Preliminary Economic Assessment (PEA). |
Table 18-1 Estimated Budget for Verification Drilling Program and Data Compilation
| Program | Cost |
| RC Drilling | $2,000,000 |
| Diamond Core Drilling | $1,000,000 |
| Sample Assays RC | $200,000 |
| Sample Assays Core | $50,000 |
| Conduct PEA | $100,000 |
| Geotechnical Program | $200,000 |
| Road Building, Drill site construction and reclamation | $50,000 |
| Permitting and Bonding | $10,000 |
| Additional metallurgical testing/column leach | $100,000 |
| Initiate baseline environmental studies | $500,000 |
| Metallurgical Characterization | $300,000 |
| TOTAL | $4,510,000 |
| | 99 | January 8, 2015 |
| References Amended NI 43-101 Technical Report |
| 19 | REFERENCES |
Alta Bay JV, 1992, Alta Bay 1992 Projects Summary report. Internal document for Alta Gold Company and Echo Bay Mines
Basham, A., and Rorem, E.J., 1988, Cover letter and report from Bondar-Clegg, Inc., Reno, Nevada, to J. Carden, Echo Bay Exploration, concerning a round-robin assay program using Easy Junior composite samples; January 25, 1988
Carden, J.R., 1988, Summary Report Nighthawk Ridge deposit Easy Junior Project White Pine County, Nevada, Echo Bay Exploration Internal report
Carden J.R., 1991, The discovery and Geology of the Nighthawk Ridge Deposit at Easy Junior, White Pine County, Nevada. Geology and Ore Deposit of the Great Basin, Geological Society of Nevada Symposium Proceedings, pp. 665-667
Gustavson, 2012. NI 43-101 Technical Report on Resources, Gold Rock Project, White Pine County, Nevada, April 10, 2012, with an effective date of February 29, 2012
Independent Ming Consultants, Inc, 1988, Ore Body Model and Floating Cone Reserves for Nighthawk Ridge prepared for Echo Bay Mines. Independent Mining Consultants, Inc. Tucson, Arizona
Midway Gold, 2014, Verification of Specific Gravities Report, Internal document
Neal, W.A., 2014, Personal correspondence via email regarding property ownership and mineral tenure, dated May 7, 2014
Pincock, Allen, and Holt, 1989, Audit and verification of reserves easy Junior Deposit, White Pine County Nevada, report prepared for Alta Gold Company, Pincock Allen and Holt, Lakewood, Colorado
Postlethwaite, C., 2005, Regional Structural Setting of the Nighthawk Ridge Deposit, White Pine County, Nevada. Presented at poster session for Symposium 2005, Window to the World, Geologic Society of Nevada, May 14-18, 2005
Smith, R. M., 1976, Geology and Mineral Resources of White Pine County, Nevada, Nevada Bureau of Mines and Geology Bulletin 85.pp 105 with plates
Hose, R.K., Blake, M.C., and Smith, R.M., 1976, Geology and mineral resources of White Pine County, Nevada: Nevada Bureau of Mines and Geology, Bulletin 85
Williams, T., 2014, Personal correspondence via email regarding permitting requirements and environmental liabilities, dated April 11, 2014
| | 100 | January 8, 2015 |
| Certificate of Author Forms Amended NI 43-101 Technical Report |
Associate Principal Geologist
Gustavson Associates, LLC
274 Union Boulevard, Suite 450
Lakewood, Colorado 80228
Telephone: 720-407-4062 Facsimile: 720-407-4067
Email: dbaker@gustavson.com
CERTIFICATE of AUTHOR
I, Donald J. Baker, do hereby certify that:
| 1. | I am currently employed as Associate Principal Geologist by Gustavson Associates, LLC at: |
274 Union Boulevard
Suite 450
Lakewood, Colorado 80228
| 2. | I am a graduate of The Ohio State University with a MSc in Geology (1974), a PhD. in Geology from the University of Georgia (1980), and a M.B.A. from the University of Colorado at Denver (1991) and have practiced my profession continuously since 1978. |
| 3. | I am a member in good standing of the Mining and Metallurgical Society of America, member #01088QP. |
| 4. | I have worked as a geologist for a total of 38 years since my graduation from university; as a graduate student, as an employee of a major mining company, a major engineering company, and as a consulting geologist. |
| 5. | I have read the definition of “qualified person” set out in NI 43-101 (“NI 43-101”) and certify that by reason of my education, affiliation with a professional association (as defined in NI 43-101) and past relevant work experience, I fulfill the requirements to be a “qualified person” for the purposes of NI 43-101. |
| 6. | I am responsible for Sections 7 through 12 of the Technical Report titled “Amended NI 43-101 Technical Report, Updated Mineral Resource Estimate for the Gold Rock Project, White Pine County, Nevada” dated January 8, 2015, with an effective date of May 28, 2014 (the “Technical Report”). I visited the property that is the subject of this Technical Report on May 6 – 8, 2014. |
| 7. | I have had prior involvement with the Gold Rock Project that is the subject of this Technical Report. |
| 8. | I am independent of the issuer applying all the tests in Section 1.5 of National Instrument 43-101. |
| 9. | I have read National Instrument 43-101 and Form 43-101, and the Technical Report has been prepared in compliance with that instrument and form. |
| | 101 | January 8, 2015 |
| Certificate of Author Forms Amended NI 43-101 Technical Report |
| 10. | I consent to the filing of the Technical Report with any stock exchange and other regulatory authority and any publication by them for regulatory purposes, including electronic publication in the public company files on their websites accessible by the public, of the Technical Report. |
| 11. | As of the effective date of the Technical Report, to the best of my knowledge, information and belief, the Technical Report contains all scientific and technical information that is required to be disclosed to make the Technical Report not misleading. |
Dated this 8th day of January, 2015
/s/Donald J. Baker (Signature)
Signature of Qualified Person
Donald J. Baker
Print name of Qualified Person
| | 102 | January 8, 2015 |
| Certificate of Author Forms Amended NI 43-101 Technical Report |
TERRE A. LANE
Principal
Global Resource Engineering Ltd.
600 Grant St., Suite 975
Denver, Colorado 80203
Telephone: 720-397-5911
Email: tlane@global-resource-eng.com
CERTIFICATE of AUTHOR
I, Terre A. Lane, do hereby certify that:
| 1. | I am currently employed as Principal by Global Resource Engineering Ltd. at: |
600 Grant Street
Suite 975
Denver, Colorado 80203
| 1. | I am a MMSA Qualified Person in Resources and Mining, #01407QP. |
| 2. | I hold a degree of Bachelor of Science (1982) in Mining Engineering from Michigan Technological University. |
| 3. | I have practiced my profession since 1982 in capacities from mining engineer to senior management positions for engineering, mine development, exploration, and mining companies. I have been involved in the estimation of resources and mine design for several hundred projects at locations in North America, Central America, South America, Africa, Australian/New Zealand, India, China, Russia and Europe. My relevant experience for the purpose of this Technical Report is as the resource estimator. |
| 4. | I am a Member of the Society for Mining, Metallurgy, and Exploration. |
| 5. | I have read the definition of “Qualified Person” set out in National Instrument 43-101 and certify that by reason of my education, affiliation with a professional organization (as defined in National Instrument 43-101) and past relevant work experience, I fulfill the requirements to be a “Qualified Person” for the purposes of National Instrument 43-101. |
| 6. | I most recently visited the Gold Rock property in May 2014 for two days and have reviewed previous geological data, geochemical results, metallurgical and technical reports on the subject property. |
| 7. | I am responsible for Sections 14 through 18 of the technical report titled “Amended NI 43-101 Technical Report, Updated Mineral Resource Estimate for the Gold Rock Project, White Pine County, Nevada” dated January 8, 2015, with an effective date of May 28, 2014 (the “Technical Report”). |
| 8. | I am independent of Midway Gold Corp. as described in Section 1.5 by National Instrument 43-101. |
| | 103 | January 8, 2015 |
| Certificate of Author Forms Amended NI 43-101 Technical Report |
| 9. | I have had no prior involvement with the Gold Rock project. |
| 10. | I have read National Instrument 43-101 and Form 43-101F1. The Technical Report has been prepared in compliance with the National Instrument 43-101 and Form 43-101F1. |
| 11. | As of the effective date of the Technical Report, to the best of my knowledge, information and belief, the Technical Report contains all scientific and technical information that is required to be disclosed to make the Technical Report not misleading. |
Dated this 8th day of January, 2015.
/s/Terre A. Lane (Signature)
Signature of Qualified Person
Terre A. Lane
Print name of Qualified Person
| | 104 | January 8, 2015 |
| Certificate of Author Forms Amended NI 43-101 Technical Report |
Jennifer J. BROWN, P.G.
Principal Geologist
J.J. Brown P.G. LLC
348 Del Street
Lander, Wyoming 82520
Telephone: 307-349-3470
Email: jjbrown@jjbrownpgllc.com
CERTIFICATE of AUTHOR
I, Jennifer J. Brown, do hereby certify that:
| 1. | I am currently employed as Principal Geologist by J.J. Brown P.G. LLC at: |
348 Del Street
Lander, Wyoming 82520
| 2. | I am a Qualified Person in Geology, SME-RM #4186244. |
| 3. | I am a graduate of the University of Montana with a Bachelor of Arts in Geology (1996), and I have practiced my profession continuously since 1997. |
| 4. | I am a licensed Professional Geologist in the States of Wyoming (PG-3719) and Idaho (PGL-1414), and am a Registered Member in good standing of the Society of Mining, Metallurgy, and Exploration (#4168244RM) with recognized special expertise in geology and mineral resources. I am also a member of the American Institute of Professional Geologists (MEM-0174). |
| 5. | I have worked as a geologist for a total of 17 years since graduation from the University of Montana, as an employee of four separate engineering and geologic consulting firms and the U.S.D.A Forest Service. I have ten collective years of experience directly related to mining and or economic and saleable minerals exploration and resource development, including geotechnical exploration, geologic analysis and interpretation, resource evaluation, and technical reporting. |
| 6. | I am a Registered Member of the Society for Mining, Metallurgy, and Exploration. |
| 7. | I have read the definition of “Qualified Person” set out in National Instrument 43-101 and certify that by reason of my education, affiliation with a professional organization (as defined in National Instrument 43-101) and past relevant work experience, I fulfill the requirements to be a “Qualified Person” for the purposes of National Instrument 43-101. |
| 8. | I most recently visited the Gold Rock property in February 2013 for one day and have reviewed previous geological data, geochemical results, metallurgical and technical reports on the subject property. |
| 9. | I am responsible for Sections 1 through 6, and 19 of the technical report titled “Amended NI |
| | 105 | January 8, 2015 |
| Certificate of Author Forms Amended NI 43-101 Technical Report |
| 43-101 Technical Report, Updated Mineral Resource Estimate for the Gold Rock Project, White Pine County, Nevada”, dated January 8, 2015, with an effective date of May 28, 2014 (the “Technical Report”), and am responsible for overall content and organization of the report. |
| 10. | I am independent of Midway Gold Corp. as described in Section 1.5 by National Instrument 43-101. |
| 11. | I have had no prior involvement with the Gold Rock project. |
| 12. | I have read National Instrument 43-101 and Form 43-101F1. The Technical Report has been prepared in compliance with the National Instrument 43-101 and Form 43-101F1. |
| 13. | As of the effective date of the Technical Report, to the best of my knowledge, information and belief, the Technical Report contains all scientific and technical information that is required to be disclosed to make the Technical Report not misleading. |
Dated this 8th day of January, 2015.
/s/Jennifer J. Brown (Signature)
Signature of Qualified Person
Jennifer J. Brown
Print name of Qualified Person
| | 106 | January 8, 2015 |
| Certificate of Author Forms Amended NI 43-101 Technical Report |
Deepak Malhotra, PhD
President
Resource Development Inc.
11475 W. I-70 Frontage Road
North Wheat Ridge, CO 80333
Telephone: 303-422-1176
Email: deepak@rdiminerals.com
CERTIFICATE of AUTHOR
I, Deepak Malhotra, do hereby certify that:
| 1. | I am currently employed as the President of Resource Development Inc. (RDi): |
11475 W. I-70 Frontage Road
North Wheat Ridge, CO 80333
| 2. | I hold a Master’s degree (1977) in Metallurgical Engineering from the Colorado School of Mines. |
| 3. | I have practiced my profession for over 40 years in capacities of metallurgical engineer and mineral economist. |
| 4. | I have read the definition of “Qualified Person” set out in National Instrument 43-101 and certify that by reason of my education, affiliation with a professional organization (as defined in National Instrument 43-101) and past relevant work experience, I fulfill the requirements to be a “Qualified Person” for the purposes of National Instrument 43-101. |
| 5. | I am a Registered Member of the Society for Mining, Metallurgy, and Exploration (SME) and the Canadian Institute of Mining, Metallurgy and Petroleum (CMI) in good standing. |
| 6. | I have reviewed previous geological data, geochemical results, metallurgical, and technical reports on the subject property. |
| 7. | I am responsible for Section 13 of the technical report titled “Amended NI 43-101 Technical Report, Updated Mineral Resource Estimate for the Gold Rock Project, White Pine County, Nevada”, dated January 8, 2015, with an effective date of May 28, 2014 (the “Technical Report”). |
| 8. | I have had no prior involvement with the Gold Rock project. |
| 9. | I am independent of Midway Gold as described in section 1.5 by National Instrument 43-101. |
| 10. | I have read National Instrument 43-101 and Form 43-101F1. The Technical Report has been prepared in compliance with the National Instrument 43-101 and Form 43-101F1. |
| 11. | As of the effective date of the Technical Report, to the best of my knowledge, information |
| | 107 | January 8, 2015 |
| Certificate of Author Forms Amended NI 43-101 Technical Report |
| and belief, the Technical Report contains all scientific and technical information that is required to be disclosed to make the Technical Report not misleading. |
Dated this 8th day of January, 2015.
/s/Deepak Malhotra (Signature)
Signature of Qualified Person
Deepak Malhotra
Print name of Qualified Person
| | 108 | January 8, 2015 |
| Amended NI 43-101 Technical Report |
Appendix A
Drill Holes Used in the Gold Grade Estimation
| | 109 | January 8, 2015 |
| Amended NI 43-101 Technical Report |
| hole_id | x | y | z | max_depth | year_drilled | drillhole_type | company |
| EZ-108-87 | 2018151.841 | 14234885.13 | 6692.127 | 320 | 1987 | RC | Echo Bay Co |
| EZ-109-87 | 2017775.547 | 14233129.52 | 6705.587 | 300 | 1987 | RC | Alta Bay JV |
| EZ-112-87 | 2017021.89 | 14230931.75 | 6578 | 260 | 1987 | RC | Echo Bay Co |
| EZ-113-87 | 2016546.414 | 14230706.32 | 6553 | 560 | 1987 | RC | Echo Bay Co |
| EZ-114-87 | 2017415.746 | 14232284.9 | 6628 | 360 | 1987 | RC | Alta Bay JV |
| EZ-115-87 | 2017518.111 | 14232261.5 | 6608 | 520 | 1987 | RC | Alta Bay JV |
| EZ-116-87 | 2017608.323 | 14232247.91 | 6601 | 400 | 1987 | RC | Alta Bay JV |
| EZ-117-87 | 2017536.31 | 14232440.78 | 6622 | 530 | 1987 | RC | Alta Bay JV |
| EZ-11-86 | 2016695.845 | 14230294.66 | 6524 | 270 | 1986 | RC | unknown |
| EZ-118-87 | 2017444.786 | 14232474.35 | 6635 | 395 | 1987 | RC | Alta Bay JV |
| EZ-119-87 | 2017329.939 | 14232464.56 | 6658 | 220 | 1987 | RC | Alta Bay JV |
| EZ-120-87 | 2017697.207 | 14232639.3 | 6635 | 705 | 1987 | RC | Alta Bay JV |
| EZ-122-87 | 2017520 | 14232684.49 | 6670 | 420 | 1987 | RC | Alta Bay JV |
| EZ-123-87 | 2017389.518 | 14232683.49 | 6675 | 175 | 1987 | RC | Alta Bay JV |
| EZ-124-87 | 2017600.872 | 14232660.79 | 6646 | 460 | 1987 | RC | Alta Bay JV |
| EZ-125-87 | 2017539.418 | 14232881.83 | 6700 | 440 | 1987 | RC | Alta Bay JV |
| EZ-126-87 | 2017649.188 | 14232448.55 | 6615 | 525 | 1987 | RC | Alta Bay JV |
| EZ-127-87 | 2017608.917 | 14232849.92 | 6685 | 440 | 1987 | RC | Alta Bay JV |
| EZ-12-86 | 2016904.668 | 14230305.92 | 6539 | 400 | 1986 | RC | unknown |
| EZ-128-87 | 2017761.129 | 14233028.3 | 6729.824 | 500 | 1987 | RC | Alta Bay JV |
| EZ-129-87 | 2017727.169 | 14232833.77 | 6726.047 | 540 | 1987 | RC | Alta Bay JV |
| EZ-130-87 | 2017841.25 | 14232828.55 | 6695.324 | 645 | 1987 | RC | Alta Bay JV |
| EZ-131-87 | 2017209.594 | 14232102.68 | 6622 | 310 | 1987 | RC | Alta Bay JV |
| EZ-132-87 | 2017214.437 | 14231920.76 | 6618 | 400 | 1987 | RC | Alta Bay JV |
| EZ-133-87 | 2017308.335 | 14231735.22 | 6589 | 240 | 1987 | RC | Alta Bay JV |
| EZ-134-87 | 2017796.636 | 14232611.85 | 6652.834 | 560 | 1987 | RC | Alta Bay JV |
| EZ-135-87 | 2017857.308 | 14233016.8 | 6720 | 550 | 1987 | RC | Alta Bay JV |
| EZ-137-87 | 2016879.128 | 14230724.52 | 6566 | 340 | 1987 | RC | Echo Bay Co |
| EZ-13-86 | 2016696.969 | 14230030.68 | 6532 | 450 | 1986 | RC | unknown |
| EZ-138-87 | 2016774.217 | 14230718.88 | 6564 | 520 | 1987 | RC | Echo Bay Co |
| EZ-139-87 | 2016675.304 | 14230713.34 | 6561 | 400 | 1987 | RC | Echo Bay Co |
| EZ-140-87 | 2016876.051 | 14231241.47 | 6554 | 300 | 1987 | RC | Alta Bay JV |
| EZ-141-87 | 2016925.008 | 14231244.24 | 6558 | 670 | 1987 | RC | Alta Bay JV |
| EZ-142-87 | 2017176.836 | 14231255.17 | 6556 | 225 | 1987 | RC | Alta Bay JV |
| EZ-143-87 | 2017124.849 | 14231254.36 | 6560 | 220 | 1987 | RC | Alta Bay JV |
| EZ-144-87 | 2017225.793 | 14231257.93 | 6558 | 225 | 1987 | RC | Alta Bay JV |
| EZ-145-87 | 2017130.128 | 14230724.44 | 6576 | 360 | 1987 | RC | Echo Bay Co |
| EZ-146-87 | 2017272.516 | 14231339.66 | 6557 | 225 | 1987 | RC | Alta Bay JV |
| EZ-147-87 | 2017212.999 | 14231180.73 | 6562 | 240 | 1987 | RC | Alta Bay JV |
| EZ-14-86 | 2015788.83 | 14226209.18 | 6503.668 | 360 | 1986 | RC | unknown |
| EZ-148-87 | 2017365.446 | 14231344.12 | 6561 | 305 | 1987 | RC | Alta Bay JV |
| EZ-149-87 | 2017112.165 | 14231170.16 | 6564 | 220 | 1987 | RC | Alta Bay JV |
| EZ-150-87 | 2016970.981 | 14231245.95 | 6562 | 575 | 1987 | RC | Alta Bay JV |
| EZ-151-87 | 2017022.921 | 14231249.77 | 6567 | 405 | 1987 | RC | Alta Bay JV |
| EZ-152-87 | 2017074.83 | 14231255.58 | 6565 | 305 | 1987 | RC | Alta Bay JV |
| EZ-153-87 | 2017169.588 | 14231335.06 | 6554 | 245 | 1987 | RC | Alta Bay JV |
| EZ-154-87 | 2017013.22 | 14231166.61 | 6571 | 295 | 1987 | RC | Alta Bay JV |
| EZ-155-87 | 2017067.723 | 14231326.47 | 6565 | 325 | 1987 | RC | Alta Bay JV |
| EZ-157-87 | 2017326.971 | 14231438.52 | 6562 | 245 | 1987 | RC | Alta Bay JV |
| EZ-15-86 | 2015835.186 | 14226496.22 | 6506.619 | 420 | 1986 | RC | unknown |
| EZ-158-87 | 2017123.084 | 14231047.33 | 6571 | 180 | 1987 | RC | Echo Bay Co |
| | 110 | January 8, 2015 |
| Amended NI 43-101 Technical Report |
| hole_id | x | y | z | max_depth | year_drilled | drillhole_type | company |
| EZ-159-87 | 2017374.959 | 14231439.26 | 6563 | 325 | 1987 | RC | Alta Bay JV |
| EZ-160-87 | 2017022.077 | 14231047.75 | 6569 | 260 | 1987 | RC | Echo Bay Co |
| EZ-161-87 | 2017277.03 | 14231434.73 | 6558 | 225 | 1987 | RC | Alta Bay JV |
| EZ-162-87 | 2016971.856 | 14231061.97 | 6564 | 295 | 1987 | RC | Echo Bay Co |
| EZ-163-87 | 2017222.075 | 14231431.88 | 6555 | 225 | 1987 | RC | Alta Bay JV |
| EZ-164-87 | 2016918.119 | 14231045.13 | 6557 | 350 | 1987 | RC | Echo Bay Co |
| EZ-165-87 | 2017172.087 | 14231431.1 | 6553 | 245 | 1987 | RC | Alta Bay JV |
| EZ-166-87 | 2016872.083 | 14231047.41 | 6550 | 480 | 1987 | RC | Echo Bay Co |
| EZ-167-87 | 2017117.07 | 14231432.24 | 6551 | 215 | 1987 | RC | Alta Bay JV |
| EZ-168-87 | 2016777.029 | 14231050.92 | 6546 | 665 | 1987 | RC | Echo Bay Co |
| EZ-169-87 | 2017072.081 | 14231431.53 | 6549 | 345 | 1987 | RC | Alta Bay JV |
| EZ-170-87 | 2016790.916 | 14230930.14 | 6550 | 620 | 1987 | RC | Echo Bay Co |
| EZ-171-87 | 2017025.124 | 14231428.8 | 6548 | 405 | 1987 | RC | Alta Bay JV |
| EZ-172-87 | 2016693.143 | 14230915.61 | 6544 | 560 | 1987 | RC | Echo Bay Co |
| EZ-173-87 | 2017478.308 | 14231544.88 | 6568 | 340 | 1987 | RC | Alta Bay JV |
| EZ-174-87 | 2017291.089 | 14231622.95 | 6568 | 220 | 1987 | RC | Alta Bay JV |
| EZ-175-87 | 2017379.411 | 14231538.33 | 6563 | 260 | 1987 | RC | Alta Bay JV |
| EZ-176-87 | 2017184.35 | 14231542.29 | 6564 | 260 | 1987 | RC | Alta Bay JV |
| EZ-177-87 | 2017286.747 | 14231516.89 | 6558 | 220 | 1987 | RC | Alta Bay JV |
| EZ-178-87 | 2017078.611 | 14231525.64 | 6558 | 560 | 1987 | RC | Alta Bay JV |
| EZ-179-87 | 2017334.032 | 14231626.63 | 6566 | 240 | 1987 | RC | Alta Bay JV |
| EZ-180-87 | 2017197.175 | 14231617.49 | 6588 | 320 | 1987 | RC | Alta Bay JV |
| EZ-181-87 | 2016826.079 | 14231047.69 | 6548 | 700 | 1987 | RC | Echo Bay Co |
| EZ-182-87 | 2017135.315 | 14231608.52 | 6587 | 500 | 1987 | RC | Alta Bay JV |
| EZ-183-87 | 2017077.267 | 14231611.61 | 6586 | 600 | 1987 | RC | Alta Bay JV |
| EZ-184-87 | 2016880.003 | 14230924.53 | 6563 | 360 | 1987 | RC | Echo Bay Co |
| EZ-185-87 | 2017234.135 | 14231620.06 | 6581 | 240 | 1987 | RC | Alta Bay JV |
| EZ-1-86 | 2017037.261 | 14231355.99 | 6565 | 395 | 1986 | RC | Alta Bay JV |
| EZ-186-87 | 2016882.502 | 14230828.57 | 6561 | 320 | 1987 | RC | Echo Bay Co |
| EZ-187-87 | 2016833.515 | 14230827.81 | 6552 | 420 | 1987 | RC | Echo Bay Co |
| EZ-18-86 | 2015574.851 | 14227862.15 | 6485 | 300 | 1986 | RC | unknown |
| EZ-188-87 | 2016786.573 | 14230824.07 | 6550 | 580 | 1987 | RC | Echo Bay Co |
| EZ-189-87 | 2016975.121 | 14231429.02 | 6561 | 620 | 1987 | RC | Alta Bay JV |
| EZ-190-87 | 2016734.524 | 14230827.26 | 6546 | 600 | 1987 | RC | Echo Bay Co |
| EZ-191-87 | 2016867.975 | 14231310.35 | 6557 | 690 | 1987 | RC | Alta Bay JV |
| EZ-192-87 | 2016680.615 | 14230629.42 | 6567 | 380 | 1987 | RC | Echo Bay Co |
| EZ-193-87 | 2016851.026 | 14231243.08 | 6551 | 500 | 1987 | RC | Alta Bay JV |
| EZ-194-87 | 2016737.585 | 14230631.31 | 6569 | 440 | 1987 | RC | Echo Bay Co |
| EZ-195-87 | 2017424.884 | 14231444.04 | 6565 | 320 | 1987 | RC | Alta Bay JV |
| EZ-196-87 | 2017157.372 | 14231732.87 | 6607 | 300 | 1987 | RC | Alta Bay JV |
| EZ-197-87 | 2017259.644 | 14231715.46 | 6595 | 280 | 1987 | RC | Alta Bay JV |
| EZ-19-86 | 2015536.036 | 14228810.55 | 6489 | 300 | 1986 | RC | unknown |
| EZ-198-87 | 2016723.839 | 14231063.09 | 6539 | 510 | 1987 | RC | Echo Bay Co |
| EZ-199-87 | 2016787.573 | 14230632.09 | 6571 | 370 | 1987 | RC | Echo Bay Co |
| EZ-200-87 | 2016679.306 | 14231035.16 | 6538 | 545 | 1987 | RC | Echo Bay Co |
| EZ-201-87 | 2016633.705 | 14230623.69 | 6566 | 300 | 1987 | RC | Echo Bay Co |
| EZ-202-87 | 2017360.291 | 14231738.04 | 6582 | 260 | 1987 | RC | Alta Bay JV |
| EZ-203-87 | 2017433.96 | 14231631.19 | 6567 | 280 | 1987 | RC | Alta Bay JV |
| EZ-204-87 | 2017457.236 | 14231741.55 | 6574 | 300 | 1987 | RC | Alta Bay JV |
| EZ-205-87 | 2016933.552 | 14230633.37 | 6576 | 280 | 1987 | RC | Echo Bay Co |
| EZ-206-87 | 2017263.299 | 14231929.52 | 6622 | 500 | 1987 | RC | Alta Bay JV |
| | 111 | January 8, 2015 |
| Amended NI 43-101 Technical Report |
| hole_id | x | y | z | max_depth | year_drilled | drillhole_type | company |
| EZ-207-87 | 2016779 | 14230525 | 6558 | 480 | 1987 | RC | Alta Bay JV |
| EZ-20-86 | 2016864.094 | 14231162.6 | 6554 | 520 | 1986 | RC | Alta Bay JV |
| EZ-208-87 | 2017358.135 | 14231940 | 6612 | 700 | 1987 | RC | Alta Bay JV |
| EZ-209-87 | 2016736.74 | 14230423.6 | 6537 | 320 | 1987 | RC | Echo Bay Co |
| EZ-210-87 | 2017456.173 | 14231937.53 | 6595 | 320 | 1987 | RC | Alta Bay JV |
| EZ-211-87 | 2016687.691 | 14230432.53 | 6533 | 380 | 1987 | RC | Echo Bay Co |
| EZ-212-88 | 2017358.042 | 14232138 | 6627 | 500 | 1988 | RC | Alta Bay JV |
| EZ-213-87 | 2016637.735 | 14230429.75 | 6532 | 460 | 1987 | RC | Echo Bay Co |
| EZ-214-87 | 2017463.109 | 14232133.64 | 6609 | 360 | 1988 | RC | Alta Bay JV |
| EZ-215-87 | 2016682.224 | 14230526.44 | 6553 | 400 | 1987 | RC | Echo Bay Co |
| EZ-216-87 | 2017427.681 | 14231841.09 | 6587 | 300 | 1988 | RC | Alta Bay JV |
| EZ-217-87 | 2016574.329 | 14230519.76 | 6559 | 480 | 1987 | RC | Echo Bay Co |
| EZ-21-86 | 2016763.392 | 14231155.71 | 6546 | 460 | 1986 | RC | Alta Bay JV |
| EZ-218-88 | 2016820.101 | 14231250.48 | 6551 | 560 | 1988 | RC | Alta Bay JV |
| EZ-219-88 | 2017368.664 | 14231842.17 | 6597 | 300 | 1988 | RC | Alta Bay JV |
| EZ-220-88 | 2017180.023 | 14231051.22 | 6575 | 160 | 1988 | RC | Echo Bay Co |
| EZ-221-88 | 2017330.736 | 14231837.57 | 6603 | 340 | 1988 | RC | Alta Bay JV |
| EZ-222-88 | 2017308.632 | 14232036.23 | 6627 | 400 | 1988 | RC | Alta Bay JV |
| EZ-223-88 | 2017257.691 | 14231840.43 | 6613 | 375 | 1988 | RC | Alta Bay JV |
| EZ-224-88 | 2017360.697 | 14232032.04 | 6620 | 420 | 1988 | RC | Alta Bay JV |
| EZ-225-88 | 2017360.463 | 14232239.04 | 6632 | 300 | 1988 | RC | Alta Bay JV |
| EZ-226-88 | 2017460.422 | 14232241.6 | 6617 | 480 | 1988 | RC | Alta Bay JV |
| EZ-227-88 | 2016940.519 | 14230827.48 | 6568 | 280 | 1988 | RC | Echo Bay Co |
| EZ-22-86 | 2017062.193 | 14231168.38 | 6571 | 300 | 1986 | RC | Alta Bay JV |
| EZ-228-88 | 2017403.546 | 14232041.71 | 6612 | 280 | 1988 | RC | Alta Bay JV |
| EZ-229-88 | 2017512.441 | 14232240.41 | 6608 | 380 | 1988 | RC | Alta Bay JV |
| EZ-230-88 | 2015847.495 | 14226769.66 | 6502.928 | 400 | 1988 | RC | Echo Bay Co |
| EZ-231-88 | 2015981.757 | 14227017.86 | 6500.53 | 380 | 1988 | RC | Echo Bay Co |
| EZ-232-88 | 2016058.975 | 14226782.43 | 6514.042 | 380 | 1988 | RC | Echo Bay Co |
| EZ-233-88 | 2016148.118 | 14226786 | 6519.386 | 400 | 1988 | RC | Echo Bay Co |
| EZ-234-88 | 2015751.367 | 14226761.24 | 6497.945 | 460 | 1988 | RC | Echo Bay Co |
| EZ-235-88 | 2015898.689 | 14227013.29 | 6500 | 380 | 1988 | RC | Echo Bay Co |
| EZ-236-88 | 2016107.227 | 14227012.09 | 6509.457 | 385 | 1988 | RC | Echo Bay Co |
| EZ-237-88 | 2015578.513 | 14225002.15 | 6481.402 | 240 | 1988 | RC | Echo Bay Co |
| EZ-23-86 | 2017162.012 | 14231179.94 | 6561 | 240 | 1986 | RC | Alta Bay JV |
| EZ-238-88 | 2015684.089 | 14225015.2 | 6480 | 260 | 1988 | RC | Echo Bay Co |
| EZ-239-88 | 2015480.955 | 14224999.55 | 6484.828 | 320 | 1988 | RC | Echo Bay Co |
| EZ-240-88 | 2015384.805 | 14224993.12 | 6481.738 | 420 | 1988 | RC | Echo Bay Co |
| EZ-241-88 | 2015290.842 | 14224990.2 | 6476.636 | 505 | 1988 | RC | Echo Bay Co |
| EZ-24-86 | 2017267 | 14231182 | 6565 | 340 | 1986 | RC | Alta Bay JV |
| EZ-25-86 | 2017110.586 | 14230311.14 | 6581 | 400 | 1986 | RC | unknown |
| EZ-264-88 | 2016215.975 | 14231720.82 | 6518 | 405 | 1988 | RC | Echo Bay Co |
| EZ-265-88 | 2016622.121 | 14231722.21 | 6545 | 405 | 1988 | RC | Echo Bay Co |
| EZ-266-88 | 2016210.635 | 14232114.43 | 6574 | 405 | 1988 | RC | Echo Bay Co |
| EZ-267-88 | 2015812.687 | 14231718.28 | 6556 | 405 | 1988 | RC | Echo Bay Co |
| EZ-26-86 | 2016623.893 | 14229715.54 | 6514 | 290 | 1986 | RC | unknown |
| EZ-270-88 | 2016102.561 | 14227410.67 | 6511.052 | 420 | 1988 | RC | Echo Bay Co |
| EZ-271-88 | 2016004.087 | 14227406.45 | 6504.657 | 400 | 1988 | RC | Echo Bay Co |
| EZ-272-88 | 2015901.565 | 14227400.25 | 6500 | 420 | 1988 | RC | Echo Bay Co |
| EZ-273-88 | 2016304.89 | 14227417.05 | 6522.649 | 440 | 1988 | RC | Echo Bay Co |
| EZ-274-88 | 2016198.629 | 14227413.34 | 6517.287 | 400 | 1988 | RC | Echo Bay Co |
| | 112 | January 8, 2015 |
| Amended NI 43-101 Technical Report |
| hole_id | x | y | z | max_depth | year_drilled | drillhole_type | company |
| EZ-275-88 | 2016205.202 | 14227814.53 | 6515 | 420 | 1988 | RC | Echo Bay Co |
| EZ-276-88 | 2016302.931 | 14227828.64 | 6517 | 420 | 1988 | RC | Echo Bay Co |
| EZ-277-88 | 2016410.62 | 14227823.54 | 6521 | 400 | 1988 | RC | Echo Bay Co |
| EZ-278-88 | 2016004.248 | 14227810.35 | 6509 | 420 | 1988 | RC | Echo Bay Co |
| EZ-279-88 | 2016106.194 | 14227813.81 | 6514 | 420 | 1988 | RC | Echo Bay Co |
| EZ-282-88 | 2016200.297 | 14232520.71 | 6570 | 405 | 1988 | RC | Echo Bay Co |
| EZ-283-88 | 2017024.224 | 14231737.27 | 6573 | 285 | 1988 | RC | Echo Bay Co |
| EZ-284-88 | 2017111.544 | 14231734.03 | 6599 | 225 | 1988 | RC | Echo Bay Co |
| EZ-2-86 | 2017129.52 | 14231531.43 | 6566 | 290 | 1986 | RC | Alta Bay JV |
| EZ-286-88 | 2016302.153 | 14228626.79 | 6530 | 345 | 1988 | RC | Echo Bay Co |
| EZ-287-88 | 2016500.21 | 14228623.09 | 6540 | 405 | 1988 | RC | Echo Bay Co |
| EZ-288-88 | 2016595.648 | 14228622.56 | 6546 | 405 | 1988 | RC | Echo Bay Co |
| EZ-289-88 | 2016720.072 | 14231226.76 | 6547 | 545 | 1988 | RC | Echo Bay Co |
| EZ-290-88 | 2016919.672 | 14231529.4 | 6545 | 445 | 1988 | RC | Echo Bay Co |
| EZ-291-88 | 2016821.839 | 14231527.06 | 6543 | 405 | 1988 | RC | Echo Bay Co |
| EZ-292-88 | 2015784.465 | 14232129.29 | 6548 | 405 | 1988 | RC | Echo Bay Co |
| EZ-300-88 | 2016402.183 | 14228221.54 | 6526 | 420 | 1988 | RC | Echo Bay Co |
| EZ-301-88 | 2016667.138 | 14231131.63 | 6543 | 720 | 1988 | RC | Echo Bay Co |
| EZ-302-88 | 2016707.219 | 14231306.29 | 6545 | 580 | 1988 | RC | Echo Bay Co |
| EZ-303-88 | 2016314.163 | 14230995.09 | 6523 | 750 | 1988 | RC | Echo Bay Co |
| EZ-304-88 | 2016112.963 | 14230984.29 | 6520 | 420 | 1988 | RC | Alta Bay JV |
| EZ-306-88 | 2016535.312 | 14230621.33 | 6562 | 560 | 1988 | RC | Echo Bay Co |
| EZ-307-88 | 2016455.618 | 14230705.42 | 6555 | 560 | 1988 | RC | Echo Bay Co |
| EZ-308-88 | 2019493.44 | 14230126.11 | 6737.602 | 150 | 1988 | RC | Alta Bay JV |
| EZ-309-88 | 2016453.224 | 14229714.22 | 6502 | 600 | 1988 | RC | Echo Bay Co |
| EZ-310-88 | 2017009.698 | 14230305.92 | 6553 | 340 | 1988 | RC | Echo Bay Co |
| EZ-311-88 | 2016511.57 | 14231203.93 | 6540 | 405 | 1988 | RC | Echo Bay Co |
| EZ-312-88 | 2016306.848 | 14231200.9 | 6533 | 405 | 1988 | RC | Echo Bay Co |
| EZ-314-88 | 2015781.475 | 14230985.52 | 6500 | 405 | 1988 | RC | Echo Bay Co |
| EZ-315-88 | 2016051.574 | 14229517.86 | 6481 | 405 | 1988 | RC | Echo Bay Co |
| EZ-316-88 | 2016695.791 | 14228623.57 | 6549 | 405 | 1988 | RC | Echo Bay Co |
| EZ-317-88 | 2016300.859 | 14228219.26 | 6530 | 365 | 1988 | RC | Echo Bay Co |
| EZ-318-88 | 2016501.92 | 14228219.13 | 6535 | 405 | 1988 | RC | Echo Bay Co |
| EZ-319-88 | 2016342.966 | 14230120.56 | 6504 | 405 | 1988 | RC | Echo Bay Co |
| EZ-320-88 | 2015881.422 | 14230122.26 | 6488 | 405 | 1988 | RC | Echo Bay Co |
| EZ-321-88 | 2018809.864 | 14230040.68 | 6693 | 350 | 1988 | RC | Alta Bay JV |
| EZ-322-88 | 2018011.054 | 14229706.17 | 6642 | 405 | 1988 | RC | Echo Bay Co |
| EZ-323-88 | 2017424.847 | 14229109.53 | 6598 | 405 | 1988 | RC | Echo Bay Co |
| EZ-324-88 | 2017047.447 | 14228966.84 | 6576 | 405 | 1988 | RC | Echo Bay Co |
| EZ-325-88 | 2016194.725 | 14228218.88 | 6516 | 390 | 1988 | RC | Echo Bay Co |
| EZ-326-88 | 2015659.59 | 14229506.67 | 6469 | 405 | 1988 | RC | Echo Bay Co |
| EZ-327-88 | 2015266.749 | 14229498.6 | 6446 | 405 | 1988 | RC | Echo Bay Co |
| EZ-330-88 | 2019736.624 | 14230052.16 | 6767.456 | 1000 | 1988 | RC | Alta Bay JV |
| EZ-331-88 | 2016633.406 | 14231019.8 | 6536 | 500 | 1988 | RC | Echo Bay Co |
| EZ-332-88 | 2016827.424 | 14230399.65 | 6540 | 320 | 1988 | RC | Echo Bay Co |
| EZ-333-88 | 2016876.504 | 14230435.49 | 6543 | 300 | 1988 | RC | Echo Bay Co |
| EZ-334-88 | 2016528.293 | 14230434.99 | 6525 | 500 | 1988 | RC | Echo Bay Co |
| EZ-335-88 | 2016939.244 | 14230418.16 | 6543 | 280 | 1988 | RC | Echo Bay Co |
| EZ-336-88 | 2016989.171 | 14230419.02 | 6545 | 300 | 1988 | RC | Echo Bay Co |
| EZ-337-88 | 2016681.866 | 14230829.69 | 6546 | 685 | 1988 | RC | Echo Bay Co |
| EZ-338-88 | 2017062.502 | 14230318.44 | 6554 | 460 | 1988 | RC | Echo Bay Co |
| | 113 | January 8, 2015 |
| Amended NI 43-101 Technical Report |
| hole_id | x | y | z | max_depth | year_drilled | drillhole_type | company |
| EZ-339-88 | 2018424.486 | 14231612.71 | 6623.941 | 360 | 1988 | RC | Alta Bay JV |
| EZ-340-88 | 2018020.345 | 14231573.16 | 6594 | 480 | 1988 | RC | Alta Bay JV |
| EZ-341-88 | 2017631.32 | 14231554.37 | 6576 | 400 | 1988 | RC | Alta Bay JV |
| EZ-342-88 | 2016923.313 | 14231428.91 | 6546 | 600 | 1989 | RC | Echo Bay Co |
| EZ-343-88 | 2017036.907 | 14231646.2 | 6586 | 600 | 1988 | RC | Echo Bay Co |
| EZ-344-88 | 2017213.673 | 14231842.26 | 6616 | 600 | 1989 | RC | Echo Bay Co |
| EZ-345-88 | 2016632.021 | 14230827.46 | 6545 | 500 | 1988 | RC | Echo Bay Co |
| EZ-351-88 | 2017122.56 | 14230934.26 | 6585 | 360 | 1988 | RC | Echo Bay Co |
| EZ-352-88 | 2017172.056 | 14230940.26 | 6587 | 300 | 1988 | RC | Echo Bay Co |
| EZ-353-88 | 2017227.288 | 14230946.53 | 6591 | 365 | 1988 | RC | Echo Bay Co |
| EZ-354-88 | 2017275.512 | 14230951.4 | 6593 | 400 | 1988 | RC | Echo Bay Co |
| EZ-355-88 | 2017326.989 | 14230961.15 | 6596 | 460 | 1988 | RC | Echo Bay Co |
| EZ-356-88 | 2016995.667 | 14230836.57 | 6573 | 300 | 1988 | RC | Echo Bay Co |
| EZ-357-88 | 2017041.426 | 14230836.63 | 6575 | 340 | 1988 | RC | Echo Bay Co |
| EZ-358-88 | 2017087.828 | 14230840.31 | 6575 | 340 | 1988 | RC | Echo Bay Co |
| EZ-359-88 | 2017140.084 | 14230841.21 | 6576 | 360 | 1988 | RC | Echo Bay Co |
| EZ-360-88 | 2017190.889 | 14230838.29 | 6578 | 380 | 1988 | RC | Echo Bay Co |
| EZ-362-88 | 2017290.208 | 14230834.51 | 6583 | 460 | 1988 | RC | Echo Bay Co |
| EZ-363-88 | 2016952.274 | 14231104.31 | 6565 | 400 | 1988 | RC | Echo Bay Co |
| EZ-364-89 | 2016739.278 | 14230920.45 | 6548 | 620 | 1988 | RC | Echo Bay Co |
| EZ-366-88 | 2016845.501 | 14231103.91 | 6550 | 700 | 1988 | RC | Alta Bay Co |
| EZ-367-88 | 2016900.215 | 14231101.06 | 6557 | 460 | 1988 | RC | Alta Bay Co |
| EZ-368-88 | 2016881.893 | 14231250.32 | 6555 | 600 | 1988 | RC | Echo Bay Co |
| EZ-369-88 | 2016987.568 | 14230636.15 | 6581 | 305 | 1988 | RC | Echo Bay Co |
| EZ-371-88 | 2016785.754 | 14231251.54 | 6550 | 605 | 1988 | RC | Alta Bay Co |
| EZ-372-88 | 2017487.102 | 14231635.53 | 6570 | 345 | 1988 | RC | Alta Bay JV |
| EZ-373-88 | 2017385.18 | 14231630.59 | 6566 | 285 | 1988 | RC | Alta Bay JV |
| EZ-374-88 | 2017480.897 | 14231841.32 | 6584 | 310 | 1988 | RC | Alta Bay JV |
| EZ-375-88 | 2017463.134 | 14232045.63 | 6604 | 365 | 1988 | RC | Alta Bay JV |
| EZ-376-88 | 2017124.699 | 14231437.44 | 6552 | 300 | 1988 | RC | Alta Bay Co |
| EZ-377-88 | 2017282.202 | 14231266.26 | 6561 | 265 | 1988 | RC | Alta Bay Co |
| EZ-378-88 | 2017323.349 | 14231269.69 | 6563 | 300 | 1988 | RC | Alta Bay JV |
| EZ-379-88 | 2017373.275 | 14231270.57 | 6566 | 385 | 1988 | RC | Alta Bay JV |
| EZ-380-88 | 2016784.519 | 14230416.63 | 6539 | 325 | 1988 | RC | Echo Bay Co |
| EZ-381-88 | 2017039.889 | 14230415.29 | 6547 | 385 | 1988 | RC | Echo Bay Co |
| EZ-382-89 | 2017110.062 | 14230413.76 | 6557 | 225 | 1989 | RC | Alta Bay Co |
| EZ-383-89 | 2016981.3 | 14230726.33 | 6574 | 285 | 1989 | RC | Alta Bay Co |
| EZ-384-89 | 2017083.475 | 14230731.68 | 6581 | 360 | 1989 | RC | Alta Bay Co |
| EZ-385-89 | 2016929.733 | 14231681.68 | 6554 | 545 | 1989 | RC | Alta Bay Co |
| EZ-3-86 | 2017245.538 | 14231786.24 | 6610 | 360 | 1986 | RC | Alta Bay JV |
| EZ-386-89 | 2017564.564 | 14231842.78 | 6582 | 380 | 1989 | RC | Alta Bay JV |
| EZ-387-88 | 2016537.453 | 14230970.1 | 6533 | 580 | 1988 | RC | Alta Bay Co |
| EZ-388-88 | 2016586.289 | 14230622.13 | 6566 | 605 | 1988 | RC | Echo Bay Co |
| EZ-389-88 | 2016657.963 | 14230628.26 | 6568 | 365 | 1988 | RC | Echo Bay Co |
| EZ-390-88 | 2016630.373 | 14230522.03 | 6555 | 365 | 1988 | RC | Alta Bay Co |
| EZ-391-88 | 2016893.25 | 14230530.47 | 6566 | 345 | 1988 | RC | Echo Bay Co |
| EZ-392-89 | 2017035.877 | 14230637.51 | 6584 | 1050 | 1989 | RC | Alta Bay Co |
| EZ-393-89 | 2016669.813 | 14231225.43 | 6546 | 600 | 1989 | RC | Alta Bay Co |
| EZ-394-89 | 2016811.795 | 14231158.06 | 6550 | 590 | 1989 | RC | Alta Bay Co |
| EZ-395-89 | 2016587.538 | 14230923.67 | 6538 | 600 | 1989 | RC | Alta Bay Co |
| EZ-396-89 | 2016884.896 | 14230634.42 | 6576 | 340 | 1989 | RC | Echo Bay Co |
| | 114 | January 8, 2015 |
| Amended NI 43-101 Technical Report |
| hole_id | x | y | z | max_depth | year_drilled | drillhole_type | company |
| EZ-397-89 | 2016706.256 | 14230719.57 | 6564 | 600 | 1989 | RC | Alta Bay Co |
| EZ-39-86 | 2016926.939 | 14231168.65 | 6560 | 400 | 1986 | RC | Alta Bay JV |
| EZ-398-89 | 2016584.401 | 14230712.28 | 6557 | 600 | 1989 | RC | Alta Bay Co |
| EZ-399-89 | 2016976.589 | 14231523.24 | 6550 | 585 | 1989 | RC | Alta Bay Co |
| EZ-400-89 | 2017082.393 | 14231044.81 | 6573 | 300 | 1989 | RC | Alta Bay Co |
| EZ-401-89 | 2017189.335 | 14231051.74 | 6577 | 210 | 1989 | RC | Alta Bay Co |
| EZ-402-89 | 2017281.476 | 14231060.59 | 6581 | 365 | 1989 | RC | Alta Bay JV |
| EZ-403-89 | 2017471.876 | 14231260.85 | 6571 | 500 | 1989 | RC | Alta Bay JV |
| EZ-404-89 | 2017197.517 | 14231052.18 | 6577 | 275 | 1989 | RC | Alta Bay Co |
| EZ-405-89 | 2017506.864 | 14232045.01 | 6598 | 385 | 1989 | RC | Alta Bay JV |
| EZ-406-89 | 2017564.817 | 14232133.12 | 6598 | 385 | 1989 | RC | Alta Bay JV |
| EZ-407-89 | 2017296.252 | 14231847.44 | 6613 | 380 | 1989 | RC | Alta Bay JV |
| EZ-408-89 | 2017106.81 | 14231721.55 | 6599 | 265 | 1989 | RC | Alta Bay Co |
| EZ-409-89 | 2017564.536 | 14232032.08 | 6591 | 405 | 1989 | RC | Alta Bay JV |
| EZ-410-89 | 2017555.659 | 14231933.29 | 6586 | 375 | 1989 | RC | Alta Bay JV |
| EZ-411-89 | 2017578.852 | 14231842.89 | 6581 | 605 | 1989 | RC | Alta Bay JV |
| EZ-412-89 | 2017409.154 | 14231136.82 | 6573 | 465 | 1989 | RC | Alta Bay JV |
| EZ-413-89 | 2017528.384 | 14231439.56 | 6570 | 500 | 1989 | RC | Alta Bay JV |
| EZ-414-89 | 2016658.446 | 14230652.41 | 6567 | 600 | 1989 | RC | Alta Bay Co |
| EZ-415-89 | 2017609.973 | 14231749.39 | 6577 | 425 | 1989 | RC | Alta Bay JV |
| EZ-416-89 | 2017587.091 | 14231638.78 | 6574 | 445 | 1989 | RC | Alta Bay JV |
| EZ-417-89 | 2016561.078 | 14230510.84 | 6559 | 605 | 1989 | RC | Alta Bay Co |
| EZ-41-86 | 2016448.716 | 14229214.8 | 6505 | 340 | 1986 | RC | unknown |
| EZ-418-89 | 2017422.287 | 14231262.76 | 6569 | 500 | 1989 | RC | Alta Bay JV |
| EZ-419-89 | 2017514.404 | 14231349.94 | 6568 | 510 | 1989 | RC | Alta Bay JV |
| EZ-420-89 | 2016981.908 | 14231648.74 | 6573 | 400 | 1989 | RC | Alta Bay Co |
| EZ-422-89 | 2017117.605 | 14231751.89 | 6600 | 565 | 1989 | RC | Alta Bay Co |
| EZ-42-86 | 2015946.738 | 14226780.96 | 6508.007 | 400 | 1986 | RC | unknown |
| EZ-43-87 | 2016920 | 14231319 | 6554 | 420 | 1987 | RC | Alta Bay JV |
| EZ-443-89 | 2018250.801 | 14233674.43 | 6701.276 | 500 | 1989 | RC | Alta Bay JV |
| EZ-444-89 | 2018114.146 | 14233820 | 6700 | 500 | 1989 | RC | Alta Bay JV |
| EZ-445-89 | 2017964.298 | 14233951.73 | 6680.926 | 500 | 1989 | RC | Alta Bay JV |
| EZ-446-89 | 2018762.709 | 14234479.45 | 6720 | 500 | 1989 | RC | Alta Bay JV |
| EZ-44-87 | 2017120.631 | 14231332.29 | 6560 | 275 | 1987 | RC | Alta Bay JV |
| EZ-456-89 | 2018753.803 | 14229740.63 | 6677 | 1640 | 1989 | RC | Alta Bay JV |
| EZ-45-87 | 2016997.959 | 14231311.38 | 6563 | 400 | 1987 | RC | Alta Bay JV |
| EZ-458-89 | 2017118.117 | 14232186.99 | 6594 | 420 | 1989 | RC | Alta Bay JV |
| EZ-459-89 | 2017022.668 | 14232300.24 | 6602 | 420 | 1989 | RC | Alta Bay JV |
| EZ-460-89 | 2015348.476 | 14223726.56 | 6691.678 | 300 | 1989 | RC | Alta Bay JV |
| EZ-461-89 | 2015360.76 | 14223867.21 | 6659.603 | 185 | 1989 | RC | Alta Bay JV |
| EZ-462-89 | 2015391.871 | 14224016.31 | 6621.355 | 220 | 1989 | RC | Alta Bay JV |
| EZ-464-89 | 2015496.289 | 14224500.48 | 6526.996 | 270 | 1989 | RC | Alta Bay JV |
| EZ-465-89 | 2015531.022 | 14224741.65 | 6499.566 | 230 | 1989 | RC | Alta Bay JV |
| EZ-466-89 | 2017251.449 | 14232439 | 6659 | 300 | 1989 | RC | Alta Bay JV |
| EZ-467-89 | 2017199.536 | 14232439.81 | 6658 | 300 | 1989 | RC | Alta Bay JV |
| EZ-46-87 | 2016963.342 | 14231158.84 | 6565 | 400 | 1987 | RC | Alta Bay JV |
| EZ-468-89 | 2017152.063 | 14232442.62 | 6656 | 300 | 1989 | RC | Alta Bay JV |
| EZ-469-89 | 2017103.341 | 14232440.16 | 6654 | 300 | 1989 | RC | Alta Bay JV |
| EZ-470-89 | 2017053.03 | 14232433.2 | 6653 | 300 | 1989 | RC | Alta Bay JV |
| EZ-471-89 | 2017007.783 | 14232422.15 | 6653 | 300 | 1989 | RC | Alta Bay JV |
| EZ-472-89 | 2017335.051 | 14232637.88 | 6678 | 300 | 1989 | RC | Alta Bay JV |
| | 115 | January 8, 2015 |
| Amended NI 43-101 Technical Report |
| hole_id | x | y | z | max_depth | year_drilled | drillhole_type | company |
| EZ-473-89 | 2017484.52 | 14232875.95 | 6700 | 300 | 1989 | RC | Alta Bay JV |
| EZ-474-89 | 2017439.798 | 14232863.33 | 6702 | 300 | 1989 | RC | Alta Bay JV |
| EZ-475-89 | 2017391.567 | 14232851.24 | 6698 | 280 | 1989 | RC | Alta Bay JV |
| EZ-476-89 | 2017341.7 | 14232842.07 | 6701 | 310 | 1989 | RC | Alta Bay JV |
| EZ-477-89 | 2017283.266 | 14232636.31 | 6690 | 240 | 1989 | RC | Alta Bay JV |
| EZ-47-87 | 2017220.575 | 14231335.85 | 6556 | 230 | 1987 | RC | Alta Bay JV |
| EZ-478-89 | 2017232.553 | 14232640.32 | 6701 | 300 | 1989 | RC | Alta Bay JV |
| EZ-479-89 | 2019931.712 | 14231578.19 | 6788.13 | 200 | 1989 | RC | Alta Bay JV |
| EZ-480-89 | 2019163.616 | 14231581.82 | 6675.138 | 50 | 1989 | RC | Alta Bay JV |
| EZ-481-89 | 2019034.15 | 14231583.49 | 6683.282 | 400 | 1989 | RC | Alta Bay JV |
| EZ-482-89 | 2018691.438 | 14231586.28 | 6638.39 | 275 | 1989 | RC | Alta Bay JV |
| EZ-483-89 | 2015284.289 | 14224015.2 | 6655.535 | 200 | 1989 | RC | Alta Bay JV |
| EZ-484-89 | 2015232.825 | 14224111.52 | 6642.276 | 200 | 1989 | RC | Alta Bay JV |
| EZ-485-89 | 2015202.587 | 14223921.88 | 6705.272 | 130 | 1989 | RC | Alta Bay JV |
| EZ-4-86 | 2017258.571 | 14232011.97 | 6632 | 335 | 1986 | RC | Alta Bay JV |
| EZ-486-89 | 2015447.609 | 14223513.16 | 6704.412 | 220 | 1989 | RC | Alta Bay JV |
| EZ-487-89 | 2015450.991 | 14223305.54 | 6731.157 | 240 | 1989 | RC | Alta Bay JV |
| EZ-48-87 | 2017322.488 | 14231341.45 | 6560 | 220 | 1987 | RC | Alta Bay JV |
| EZ-488-89 | 2015451.15 | 14223104.55 | 6752.709 | 300 | 1989 | RC | Alta Bay JV |
| EZ-489-89 | 2015451.596 | 14222896.01 | 6772.406 | 280 | 1989 | RC | Alta Bay JV |
| EZ-490-89 | 2016759.017 | 14230475.64 | 6505 | 345 | 1989 | RC | Alta Bay JV |
| EZ-491-89 | 2016809.005 | 14230476.43 | 6505 | 365 | 1989 | RC | Alta Bay JV |
| EZ-492-89 | 2016767.453 | 14230575.78 | 6505 | 150 | 1989 | RC | Alta Bay JV |
| EZ-492A-89 | 2016762.454 | 14230575.7 | 6505 | 365 | 1989 | RC | Alta Bay JV |
| EZ-493-89 | 2016817.44 | 14230576.56 | 6505 | 245 | 1989 | RC | Alta Bay JV |
| EZ-494-89 | 2015803.357 | 14226313.74 | 6505.352 | 425 | 1989 | RC | Alta Bay JV |
| EZ-495-89 | 2015768.54 | 14226118.24 | 6500 | 305 | 1989 | RC | Alta Bay JV |
| EZ-496-89 | 2015733.097 | 14225791.32 | 6488.796 | 175 | 1989 | RC | Alta Bay JV |
| EZ-497-89 | 2015706.772 | 14225613.02 | 6480 | 265 | 1989 | RC | Alta Bay JV |
| EZ-49-87 | 2017416.417 | 14231345.91 | 6563 | 330 | 1987 | RC | Alta Bay JV |
| EZ-498-89 | 2015238.039 | 14222889.53 | 6859.651 | 120 | 1989 | RC | Alta Bay JV |
| EZ-499-89 | 2015230.959 | 14222995.17 | 6848.822 | 190 | 1989 | RC | Alta Bay JV |
| EZ-500-89 | 2015231.657 | 14223091.99 | 6841.705 | 200 | 1989 | RC | Alta Bay JV |
| EZ-501-89 | 2015230.144 | 14223297.74 | 6813.448 | 110 | 1989 | RC | Alta Bay JV |
| EZ-502-89 | 2015223.857 | 14223497.34 | 6780.62 | 200 | 1989 | RC | Alta Bay JV |
| EZ-503-89 | 2015199.602 | 14223707.71 | 6745.532 | 120 | 1989 | RC | Alta Bay JV |
| EZ-504-89 | 2015542.21 | 14224095.73 | 6574.955 | 260 | 1989 | RC | Alta Bay JV |
| EZ-50-87 | 2016828.016 | 14230923.72 | 6556 | 420 | 1987 | RC | Echo Bay Co |
| EZ-517-89 | 2015817.742 | 14226119.39 | 6501.866 | 325 | 1989 | RC | Alta Bay JV |
| EZ-51-87 | 2017223.497 | 14231532.9 | 6557 | 220 | 1987 | RC | Alta Bay JV |
| EZ-518-89 | 2015681.966 | 14226114.72 | 6496.865 | 385 | 1989 | RC | Alta Bay JV |
| EZ-519-89 | 2015711.288 | 14226011.46 | 6494.249 | 325 | 1989 | RC | Alta Bay JV |
| EZ-520-89 | 2015816.428 | 14226005.03 | 6499.744 | 325 | 1989 | RC | Alta Bay JV |
| EZ-521-89 | 2015878.174 | 14226126.95 | 6504.562 | 330 | 1989 | RC | Alta Bay JV |
| EZ-52-87 | 2017329.408 | 14231538.55 | 6561 | 240 | 1987 | RC | Alta Bay JV |
| EZ-53-87 | 2017427.337 | 14231543.08 | 6566 | 290 | 1987 | RC | Alta Bay JV |
| EZ-54-87 | 2017025.671 | 14231521.81 | 6555 | 400 | 1987 | RC | Alta Bay JV |
| EZ-55-87 | 2017531.264 | 14231547.71 | 6571 | 375 | 1987 | RC | Alta Bay JV |
| EZ-56-87 | 2016828.156 | 14230722.72 | 6564 | 390 | 1987 | RC | Echo Bay Co |
| EZ-57-87 | 2016729.259 | 14230716.18 | 6563 | 300 | 1987 | RC | Echo Bay Co |
| EZ-5-86 | 2017149.578 | 14231783.74 | 6608 | 320 | 1986 | RC | Alta Bay JV |
| | 116 | January 8, 2015 |
| Amended NI 43-101 Technical Report |
| hold_id | x | y | z | max_depth | year_drilled | drillhole_type | company |
| EZ-58-87 | 2016818.894 | 14231315.58 | 6547 | 500 | 1987 | RC | Alta Bay JV |
| EZ-59-87 | 2017209.422 | 14231729.68 | 6605 | 570 | 1987 | RC | Alta Bay JV |
| EZ-60-87 | 2017403.187 | 14231744.71 | 6576 | 270 | 1987 | RC | Alta Bay JV |
| EZ-61-87 | 2017312.1 | 14231942.28 | 6619 | 500 | 1987 | RC | Alta Bay JV |
| EZ-62-87 | 2017405.077 | 14232135.73 | 6621 | 400 | 1987 | RC | Alta Bay JV |
| EZ-63-87 | 2017407.186 | 14231936.77 | 6603 | 320 | 1987 | RC | Alta Bay JV |
| EZ-64-87 | 2017512.16 | 14231746.41 | 6574 | 320 | 1987 | RC | Alta Bay JV |
| EZ-65-87 | 2016931.084 | 14230727.33 | 6569 | 260 | 1987 | RC | Echo Bay Co |
| EZ-66-87 | 2017498.147 | 14232131.19 | 6601 | 340 | 1987 | RC | Alta Bay JV |
| EZ-67-87 | 2017499.038 | 14231946.2 | 6591 | 340 | 1987 | RC | Alta Bay JV |
| EZ-6-86 | 2017305.867 | 14231701.19 | 6585 | 375 | 1986 | RC | Alta Bay JV |
| EZ-68-87 | 2016622 | 14230711 | 6559 | 400 | 1987 | RC | Echo Bay Co |
| EZ-69-87 | 2016740.96 | 14230927.36 | 6548 | 400 | 1987 | RC | Echo Bay Co |
| EZ-70-87 | 2016923.086 | 14230919.21 | 6570 | 320 | 1987 | RC | Echo Bay Co |
| EZ-71-87 | 2017306.07 | 14232136.19 | 6635 | 310 | 1987 | RC | Alta Bay JV |
| EZ-72-87 | 2016834.217 | 14230526.82 | 6563 | 350 | 1987 | RC | Echo Bay Co |
| EZ-73-87 | 2016735.273 | 14230523.27 | 6556 | 360 | 1987 | RC | Echo Bay Co |
| EZ-74-87 | 2016632.345 | 14230518.67 | 6552 | 340 | 1987 | RC | Echo Bay Co |
| EZ-75-87 | 2016637.079 | 14230919.74 | 6539 | 500 | 1987 | RC | Echo Bay Co |
| EZ-76-87 | 2016637.299 | 14230137.36 | 6521 | 360 | 1987 | RC | Echo Bay Co |
| EZ-77-87 | 2016539.633 | 14230116.22 | 6512 | 300 | 1987 | RC | Echo Bay Co |
| EZ-7-86 | 2016963.335 | 14231164.42 | 6566 | 183 | 1986 | RC | unknown |
| EZ-78-87 | 2016731.383 | 14230132.21 | 6537 | 320 | 1987 | RC | Echo Bay Co |
| EZ-79-87 | 2016532.37 | 14230517.1 | 6561 | 400 | 1987 | RC | Echo Bay Co |
| EZ-80-87 | 2016542.648 | 14229923.27 | 6507 | 280 | 1987 | RC | Echo Bay Co |
| EZ-81-87 | 2016747.472 | 14229934.46 | 6542 | 300 | 1987 | RC | Echo Bay Co |
| EZ-82-87 | 2016643.482 | 14229933.84 | 6517 | 360 | 1987 | RC | Echo Bay Co |
| EZ-83-87 | 2016543.944 | 14229712.29 | 6508 | 400 | 1987 | RC | Echo Bay Co |
| EZ-84-87 | 2016543.897 | 14229523.29 | 6507 | 360 | 1987 | RC | Echo Bay Co |
| EZ-85-87 | 2016647.886 | 14229523.91 | 6512 | 280 | 1987 | RC | Echo Bay Co |
| EZ-86-87 | 2016453.919 | 14229521.88 | 6502 | 340 | 1987 | RC | Echo Bay Co |
| EZ-87-87 | 2016740.77 | 14229531.36 | 6522 | 300 | 1987 | RC | Echo Bay Co |
| EZ-8-86 | 2016955.375 | 14230964.71 | 6568 | 375 | 1986 | RC | unknown |
| EZ-88-87 | 2016525.822 | 14229208 | 6510 | 400 | 1987 | RC | Echo Bay Co |
| EZ-89-87 | 2016651.416 | 14229233.97 | 6519 | 260 | 1987 | RC | Echo Bay Co |
| EZ-90-87 | 2016749.157 | 14229250.49 | 6529 | 320 | 1987 | RC | Echo Bay Co |
| EZ-91-87 | 2016509.341 | 14229046.75 | 6528 | 380 | 1987 | RC | Echo Bay Co |
| EZ-92-87 | 2016606.255 | 14229052.26 | 6536 | 300 | 1987 | RC | Echo Bay Co |
| EZ-93-87 | 2016411.413 | 14229042.22 | 6520 | 400 | 1987 | RC | Echo Bay Co |
| EZ-94-87 | 2016750.908 | 14229714.52 | 6523 | 280 | 1987 | RC | Echo Bay Co |
| EZ-95-87 | 2016784.229 | 14230014.04 | 6542 | 280 | 1987 | RC | Echo Bay Co |
| EZ-96-87 | 2016838.715 | 14229918.89 | 6561 | 300 | 1987 | RC | Echo Bay Co |
| EZ-97-87 | 2016602.118 | 14230277.19 | 6517 | 400 | 1987 | RC | Echo Bay Co |
| EZ-9-86 | 2016833.686 | 14230624.81 | 6573 | 340 | 1986 | RC | unknown |
| EZ-98-87 | 2016801.709 | 14230303.31 | 6530 | 240 | 1987 | RC | Echo Bay Co |
| EZ-99-87 | 2016938.207 | 14230527.44 | 6568 | 285 | 1987 | RC | Echo Bay Co |
| GR11-01 | 2017171.111 | 14230442.95 | 6563 | 700 | 2011 | RC | Midway |
| GR11-02 | 2016729.978 | 14230308.8 | 6529 | 650 | 2011 | RC | Midway |
| GR11-03 | 2016605.859 | 14230270.35 | 6522 | 600 | 2011 | RC | Midway |
| GR11-04 | 2016387.689 | 14230306.77 | 6517 | 700 | 2011 | RC | Midway |
| GR11-05 | 2016703.976 | 14230555.46 | 6507 | 600 | 2011 | RC | Midway |
| | 117 | January 8, 2015 |
| Amended NI 43-101 Technical Report |
| hole_id | x | y | z | max_depth | year_drilled | drillhole_type | company |
| GR11-06 | 2016781.519 | 14229393.3 | 6557 | 650 | 2011 | RC | Midway |
| GR11-07 | 2016255.09 | 14230779.3 | 6536 | 950 | 2011 | RC | Midway |
| GR11-08 | 2016686.25 | 14229440.89 | 6554 | 600 | 2011 | RC | Midway |
| GR11-09 | 2016242.188 | 14229879.82 | 6533 | 800 | 2011 | RC | Midway |
| GR11-10 | 2016088.555 | 14229531.07 | 6514 | 700 | 2011 | RC | Midway |
| GR11-11 | 2015761.297 | 14226084.18 | 6499.129 | 500 | 2011 | RC | Midway |
| GR11-12 | 2015519.668 | 14226176.44 | 6490.103 | 950 | 2011 | RC | Midway |
| GR11-13C | 2016544.176 | 14231716.97 | 6545 | 1100 | 2011 | Core | Midway |
| GR11-14C | 2016713.181 | 14230517.24 | 6511 | 600 | 2011 | Core | Midway |
| GR11-15C | 2016255.518 | 14230744.87 | 6539 | 1015 | 2011 | Core | Midway |
| GR11-16 | 2015909.498 | 14226067.85 | 6504.096 | 700 | 2011 | RC | Midway |
| GR11-17 | 2015665.874 | 14225599.81 | 6480 | 720 | 2011 | RC | Midway |
| GR11-18 | 2015880.886 | 14225507.13 | 6490.887 | 600 | 2011 | RC | Midway |
| GR11-19 | 2015453.472 | 14225662.36 | 6470.305 | 700 | 2011 | RC | Midway |
| GR11-20 | 2015775.913 | 14226623.45 | 6500.621 | 580 | 2011 | RC | Midway |
| GR11-21 | 2015979.889 | 14226572.49 | 6513.754 | 840 | 2011 | RC | Midway |
| GR11-22 | 2015526.018 | 14226648.55 | 6484.412 | 950 | 2011 | RC | Midway |
| GR11-23C | 2015761.356 | 14226084.06 | 6499.129 | 745 | 2011 | Core | Midway |
| GR11-24C | 2015523.065 | 14226173.36 | 6490.251 | 1100 | 2011 | Core | Midway |
| GR11-25C | 2015882.241 | 14225510.94 | 6490.736 | 700 | 2011 | Core | Midway |
| GR11-26 | 2017333.439 | 14232355.54 | 6647 | 790 | 2011 | RC | Midway |
| GR11-27 | 2017060.635 | 14232324.78 | 6622 | 950 | 2011 | RC | Midway |
| GR11-28 | 2016242.24 | 14230942.13 | 6532 | 1500 | 2011 | RC | Midway |
| GR11-29 | 2016543.159 | 14231699.7 | 6544 | 1500 | 2011 | RC | Midway |
| GR11-30 | 2015793.879 | 14230865.63 | 6541 | 1230 | 2011 | RC | Midway |
| GR11-31 | 2015799.367 | 14230861.25 | 6541 | 1500 | 2011 | RC | Midway |
| GR12-01C | 2017330.27 | 14232348.48 | 6646 | 821 | 2012 | Core | MGUSI |
| GR12-02C | 2016708.75 | 14230506.77 | 6510 | 220 | 2012 | Core | MGUSI |
| GR12-03C | 2016697.56 | 14230509.76 | 6512 | 544 | 2012 | Core | MGUSI |
| GR12-04 | 2015889.816 | 14225876.19 | 6502.02 | 1155 | 2012 | RC | MGUSI |
| GR12-05C | 2017196.57 | 14230380.41 | 6566 | 821 | 2012 | Core | MGUSI |
| GR12-05C-NQ | 2017196.57 | 14230380.41 | 6566 | 1353 | 2012 | Core | MGUSI |
| GR12-06 | 2015488.78 | 14226007.01 | 6485.387 | 555 | 2012 | Core | MGUSI |
| GR12-07 | 2015911.93 | 14226283.38 | 6510.428 | 785 | 2012 | RC | MGUSI |
| GR12-08 | 2015884.27 | 14225876.67 | 6501.705 | 1095 | 2012 | RC | MGUSI |
| GR12-09 | 2016188.25 | 14225865.64 | 6518.6 | 835 | 2012 | RC | MGUSI |
| GR12-10 | 2016122.62 | 14226185.96 | 6517.176 | 1095 | 2012 | RC | MGUSI |
| GR12-11 | 2015613.89 | 14226427.66 | 6495.621 | 765 | 2012 | RC | MGUSI |
| GR12-12C | 2017309.64 | 14232725.89 | 6709 | 1055 | 2012 | Core | MGUSI |
| GR12-13 | 2017395.77 | 14232882.79 | 6711 | 945 | 2012 | RC | MGUSI |
| GR12-14 | 2017518.15 | 14233056.34 | 6731 | 740 | 2012 | RC | MGUSI |
| GR12-15 | 2017293.95 | 14233192.24 | 6693 | 950 | 2012 | RC | MGUSI |
| GR12-16 | 2017775.42 | 14233118.95 | 6707.932 | 1105 | 2012 | RC | MGUSI |
| GR12-17 | 2016721.22 | 14230305.6 | 6534 | 765 | 2012 | RC | MGUSI |
| GR12-18 | 2017398 | 14233425 | 6656.805 | 905 | 2012 | RC | MGUSI |
| GR12-19 | 2017392 | 14233427 | 6657.263 | 745 | 2012 | RC | MGUSI |
| GR12-20 | 2017777.146 | 14233117.75 | 6708.221 | 785 | 2012 | RC | MGUSI |
| GR12-21 | 2017312.636 | 14232728.89 | 6709 | 1000 | 2012 | RC | MGUSI |
| GR12-22C | 2016671.705 | 14229458.37 | 6555 | 92.5 | 2012 | Core | MGUSI |
| GR12-23C | 2016667.33 | 14229459.41 | 6555 | 419 | 2012 | Core | MGUSI |
| GR12-24 | 2016501.192 | 14230044.63 | 6519 | 865 | 2012 | RC | MGUSI |
| | 118 | January 8, 2015 |
| Amended NI 43-101 Technical Report |
| hole_id | x | y | z | max_depth | year_drilled | drillhole_type | company |
| GR12-25C | 2015619.969 | 14226422.39 | 6496.052 | 710 | 2012 | Core | MGUSI |
| GR12-26 | 2016493.006 | 14230045.22 | 6518 | 665 | 2012 | RC | MGUSI |
| GR12-27 | 2018514.68 | 14233391.56 | 6746.622 | 1145 | 2012 | RC | MGUSI |
| GR12-28C | 2016198.054 | 14225868.69 | 6519.612 | 750 | 2012 | Core | MGUSI |
| GR12-29 | 2016983 | 14230130 | 6594 | 445 | 2012 | RC | MGUSI |
| GR12-30 | 2017211 | 14229955 | 6607 | 605 | 2012 | RC | MGUSI |
| GR12-31 | 2015905.432 | 14226887.74 | 6502.488 | 1045 | 2012 | RC | MGUSI |
| GR12-32 | 2015908 | 14226886 | 6502.702 | 880 | 2012 | RC | MGUSI |
| GR12-33 | 2015574.295 | 14226917.83 | 6485.509 | 685 | 2012 | RC | MGUSI |
| GR13-01 | 2015649.482 | 14225019.15 | 6480 | 505 | 2013 | RC | MGUSI |
| GR13-02 | 2015655 | 14225016 | 6480 | 405 | 2013 | RC | MGUSI |
| GR13-03 | 2015864 | 14225059 | 6490.57 | 745 | 2013 | RC | MGUSI |
| GR13-04 | 2017109 | 14229462 | 6597 | 625 | 2013 | RC | MGUSI |
| GR13-05 | 2016533 | 14229190 | 6521 | 625 | 2013 | RC | MGUSI |
| GR13-06 | 2016614 | 14229188 | 6525 | 845 | 2013 | RC | MGUSI |
| GR13-07 | 2015913 | 14227388 | 6500 | 705 | 2013 | RC | MGUSI |
| GR13-08 | 2015996 | 14227301 | 6503.832 | 845 | 2013 | RC | MGUSI |
| GR13-09 | 2015797 | 14230891 | 6540 | 1540 | 2013 | RC | MGUSI |
| GR13-10 | 2016982 | 14229268 | 6573 | 690 | 2013 | RC | MGUSI |
| GR13-11 | 2016847 | 14232057 | 6562 | 900 | 2013 | RC | MGUSI |
| GR13-12 | 2015545 | 14226667 | 6485.33 | 625 | 2013 | RC | MGUSI |
| GR13-13 | 2015618 | 14226461 | 6494.03 | 865 | 2013 | RC | MGUSI |
| | 119 | January 8, 2015 |