NI 43-101 TECHNICAL REPORT ON RESOURCES
GOLD ROCK PROJECT
Prepared for MIDWAY GOLD CORP.

Report Date: April 10, 2012
Effective Date: February 29, 2012
Endorsed by QP’s:
William J. Crowl, R.G., MMSA-QP
Donald E. Hulse, P.E., SME-RM
Donald J. Baker, PhD, MMSA-QP

| Midway Gold Corp. | Table of Contents |
| Gold Rock Project | NI 43-101 Technical Report on Resources |
TABLE OF CONTENTS
| Section | | Title | | Page No. |
| | | | | | |
| 1. | SUMMARY | | 1 |
| | | | |
| | 1.1 | | Introduction | | 1 |
| | 1.2 | | Property Description, Location and History | | 1 |
| | 1.3 | | Geology and Mineralization | | 2 |
| | 1.4 | | Status of Exploration | | 3 |
| | 1.5 | | Mineral Resource Estimate | | 3 |
| | 1.6 | | Conclusions and Recommendations | | 4 |
| | | | | | |
| 2. | INTRODUCTION | | 6 |
| | | | |
| | 2.1 | | Terms of Reference and Purpose of the Report | | 6 |
| | 2.2 | | Qualified Persons | | 6 |
| | 2.3 | | Personal Inspection | | 6 |
| | 2.4 | | Sources of Information | | 7 |
| | 2.5 | | Units of Measure | | 7 |
| | | | | | |
| 3. | RELIANCE ON OTHER EXPERTS | | 8 |
| | | | | | |
| 4. | PROPERTY DESCRIPTION AND LOCATION | | 9 |
| | | | |
| | 4.1 | | Location | | 9 |
| | 4.2 | | Mineral Tenure and Agreements | | 10 |
| | 4.2.1 | | Mineral Rights | | 10 |
| | 4.2.2 | | Newark Valley Mining Corp. Agreement | | 11 |
| | 4.2.3 | | Anchor Minerals, Inc. Agreement | | 11 |
| | 4.2.4 | | Peart Agreement | | 12 |
| | 4.2.5 | | Pankow Agreement | | 12 |
| | 4.2.6 | | Jordan Agreement | | 13 |
| | 4.2.7 | | Additional Claims | | 13 |
| | 4.3 | | Environmental Liabilities and Permitting | | 13 |
| | 4.3.1 | | Environmental Liabilities | | 13 |
| | 4.3.2 | | Permitting | | 14 |
| | | | | | |
| 5. | ACCESSIBILITY, CLIMATE, LOCAL RESOURCES, INFRASTRUCTURE AND PHYSIOGRAPHY | | 17 |
| | | | |
| | 5.1 | | Accessibility | | 17 |
| | 5.2 | | Topography, Elevation, Vegetation, and Climate | | 17 |
| | 5.3 | | Infrastructure and Local Resources | | 17 |
| | | | | | |
| 6. | HISTORY | | 19 |
| | | | |
| | 6.1 | | Exploration History | | 19 |
| | 6.2 | | Resource and Reserve Estimates | | 19 |
| | | | | | |
| 7. | GEOLOGICAL SETTING AND MINERALIZATION | | 22 |
| | | | |
| | 7.1 | | Regional Geology | | 22 |
| | 7.2 | | Local Geology | | 24 |
| | 7.3 | | Property Geology | | 25 |
| | 7.3.1 | | Late Devonian Devil’s Gate Limestone (Dd) | | 26 |
| | 7.3.2 | | Late Devonian to Early Mississippian Pilot Shale (MDp) | | 26 |
| | 7.3.3 | | Mississippian Joana Limestone (Mj) | | 26 |
| | 7.3.4 | | Mississippian Chainman Shale (Mc) | | 26 |
| | 7.3.5 | | Mississippian Diamond Peak Formation (Md) | | 26 |
| April 10, 2012 | i |  |
| Midway Gold Corp. | Table of Contents |
| Gold Rock Project | NI 43-101 Technical Report on Resources |
| | 7.4 | | Structural Geology | | 28 |
| | 7.5 | | Mineralization | | 29 |
| | 7.6 | | Alteration | | 29 |
| | 7.7 | | Geometry of Mineralization | | 30 |
| | | | | | |
| 8. | DEPOSIT TYPES | | 32 |
| | | | | | |
| 9. | EXPLORATION | | 33 |
| | | | |
| | 9.1 | | Previous Operator’s Exploration Work | | 33 |
| | 9.2 | | Historic Geochemical sampling | | 33 |
| | 9.3 | | Historical Geophysics | | 33 |
| | 9.4 | | Historical Mapping | | 33 |
| | 9.5 | | Historical Drilling | | 34 |
| | 9.6 | | MGUS Exploration Work | | 34 |
| | 9.6.1 | | Surface Geochemistry | | 35 |
| | 9.6.2 | | Geological Mapping | | 35 |
| | 9.6.3 | | Geophysical Surveys | | 35 |
| | 9.6.4 | | Drilling | | 35 |
| | | | | | |
| 10. | DRILLING | | 36 |
| | | | |
| | 10.1 | | Historic Drilling | | 38 |
| | 10.2 | | MGUS Drilling | | 38 |
| | 10.2.1 | | 2011 MGUS Drilling Results | | 40 |
| | 10.2.2 | | 2011 MGUS Twin Holes | | 41 |
| | | | | | |
| 11. | SAMPLE PREPARATION, ANALYSES AND SECURITY | | 42 |
| | | | |
| | 11.1 | | Historic Programs | | 42 |
| | 11.1.1 | | Santa Fe Analytical Methods | | 42 |
| | 11.1.2 | | Tenneco/Echo Bay Analytical Methods | | 42 |
| | 11.1.3 | | Alta Bay Joint Venture Analytical Methods | | 42 |
| | 11.1.4 | | Alta Bay Joint Venture Analytical Methods | | 43 |
| | 11.1.5 | | Alta Gold Analytical Methods | | 43 |
| | 11.2 | | MGUS 2011 Program | | 43 |
| | 11.2.1 | | MGUS Standard Sample Analyses | | 43 |
| | 11.2.2 | | MGUS Blank Sample Analyses | | 45 |
| | 11.2.3 | | MGUS Duplicate Sample Analyses | | 46 |
| | | | | | |
| 12. | DATA VERIFICATION | | 49 |
| | | | |
| | 12.1 | | Historic Data Verification | | 49 |
| | 12.1.1 | | Drill Hole Locations | | 49 |
| | 12.1.2 | | Assay Database | | 52 |
| | 12.1.2.1 Check Assay Programs | | 54 |
| | 12.1.2.2 Twin Hole Programs | | 57 |
| | 12.2 | | MGUS Data Verification | | 61 |
| | 12.2.1 | | Drill Hole Locations | | 61 |
| | 12.2.2 | | Assay Database | | 61 |
| | 12.2.3 | | Check Assay Programs | | 61 |
| | 12.2.4 | | Twin Hole Programs | | 61 |
| | 12.2.4.1 MGUS – Historic Drill Hole Confirmation Program | | 61 |
| | 12.2.4.2 MGUS – Core-Reverse Circulation Twin Hole Program | | 64 |
| | | | | | |
| 13. | MINERAL PROCESSING AND METALLURGICAL TESTING | | 66 |
| | | | | | |
| 14. | MINERAL RESOURCE ESTIMATE | | 67 |
| | | | |
| | 14.1 | | Data Used for Gold Grade Estimation | | 67 |
| April 10, 2012 | ii | |
| Midway Gold Corp. | Table of Contents |
| Gold Rock Project | NI 43-101 Technical Report on Resources |
| | 14.2 | | Estimation Domains | | 67 |
| | 14.3 | | Grade Capping | | 69 |
| | 14.4 | | Compositing | | 70 |
| | 14.5 | | Variography | | 71 |
| | 14.6 | | Estimation Methodology | | 73 |
| | 14.6.1 | | Estimate Validation | | 74 |
| | 14.7 | | Density Rock and Alluvium | | 74 |
| | 14.8 | | Resource Classification | | 74 |
| | 14.9 | | Mineral Resource Estimate | | 75 |
| | | | | | |
| 15. | MINERAL RESERVE ESTIMATES | | 76 |
| | | | |
| 16. | MINING METHODS | | 77 |
| | | | |
| 17. | RECOVERY METHODS | | 78 |
| | | | |
| 18. | PROJECT INFRASTRUCTURE | | 79 |
| | | | |
| 19. | MARKET STUDIES AND CONTRACTS | | 80 |
| | | | |
| 20. | ENVIRONMENTAL STUDIES, PERMITTING AND SOCIAL OR COMMUNITY IMPACT | | 81 |
| | | | |
| 21. | CAPITAL AND OPERATING COSTS | | 82 |
| | | | |
| 22. | ECONOMIC ANALYSIS | | 83 |
| | | | |
| 23. | ADJACENT PROPERTIES | | 84 |
| | | | |
| 24. | OTHER RELEVANT DATA AND INFORMATION | | 85 |
| | | | |
| 25. | INTERPRETATION AND CONCLUSIONS | | 86 |
| | | | |
| 26. | RECOMMENDATIONS | | 87 |
| | | | |
| 27. | REFERENCES | | 89 |
| | | | |
| 28. | Certificate of Author Forms | | 90 |
| April 10, 2012 | iii | |
| Midway Gold Corp. | Table of Contents |
| Gold Rock Project | NI 43-101 Technical Report on Resources |
LIST OF FIGURES
| FIGURE | | PAGE |
| | | |
| Figure 4-1 Property Location Map | | 9 |
| Figure 4-2 Mineral Claim Map | | 10 |
| Figure 7-1 Regional Geology (Hose and Blake, 1987) | | 23 |
| Figure 7-2 Stratigraphic Column Pancake Range (Smith, 1976, Harris, 2007) | | 25 |
| Figure 7-3 Local Geology | | 27 |
| Figure 7-4 Pre-mining Cross Section of the Easy Junior Deposit (Alta Bay, 1991) | | 29 |
| Figure 7-5 North Facing View of the Easy Junior Pit | | 30 |
| Figure 10-1 Gold Rock Historic Drillikng and Resource Estimate Boundary | | 37 |
| Figure 10-2 Drill Hole Collar Eye Bolt & Tag – GR11-23c | | 40 |
| Figure 11-1 Standard Analytical Results – Oreas 6 Pc | | 44 |
| Figure 11-2 Standard Analytical Results – Oreas 2 Pd | | 44 |
| Figure 11-3 Standard Analytical Results – Oreas 15f | | 45 |
| Figure 11-4 Blank Sample Analytical Results | | 46 |
| Figure 11-5 MGUS Drill Sample Duplicates | | 47 |
| Figure 11-6 Duplicate Sample Analysis | | 48 |
| Figure 12-1 Historic Survey Point “Juan” | | 51 |
| Figure 12-2 Drill Cuttings and Labeled Post – Drill Hole EZ14-86 | | 51 |
| Figure 12-3 Fire Assay vs Cyanide Assay | | 53 |
| Figure 12-4 Robinson – Bondar-Clegg Check Assays | | 55 |
| Figure 12-5 Ward – Bondar-Clegg Check Assays | | 55 |
| Figure 12-6 Chemex – Bondar-Clegg Check Assays | | 56 |
| Figure 12-7 American Assay – Bondar-Clegg Check Assays | | 57 |
| Figure 12-8 Twin Hole Comparison EZ74-87 and EZ390-88 | | 58 |
| Figure 12-9 Twin Hole Comparison EZ69-87 and EZ364-89 | | 59 |
| Figure 12-10 Twin Hole Comparison EZ140-87 and EZ368-88 | | 59 |
| Figure 12-11 Twin Hole Comparison EZ167-87 and EZ376-88 | | 60 |
| Figure 12-12 Gold Intercept Grade Comparisons MGUS vs. Historic Drill Holes | | 62 |
| Figure 12-13 Gold Intercept Grade Comparisons MGUS vs. Historic Drill Holes | | 63 |
| Figure 12-14 MGUS Twin Holes – RC GR11-05 and Core GR11-14c | | 64 |
| Figure 12-15 MGUS Twin Holes – RC GR11-11 & Core GR11-23c | | 65 |
| Figure 12-16 MGUS Twin Holes – RC GR11-18 & Core GR11-25c | | 65 |
| Figure 14-1 Gold Rock Cross Section Geology and Estimation Domains | | 68 |
| Figure 14-2 Cumulative Frequency Plot | | 70 |
| Figure 14-3 Gold Rock Joanna Limestone Variograms | | 72 |
| Figure 14-4 East-West Section 14,230,500 North, (Looking North) | | 72 |
| April 10, 2012 | iv | |
| Midway Gold Corp. | Table of Contents |
| Gold Rock Project | NI 43-101 Technical Report on Resources |
LIST OF TABLES
| TABLE | | PAGE |
| | | |
| Table 1-1 The Gold Rock Mineral Resource | | 4 |
| Table 4-1 NVMC Royalty Schedule (Source: MGUS) | | 11 |
| Table 4-2 Peart Advance Minimum Royalty Schedule (Source: MGUS) | | 12 |
| Table 4-3 Peart Royalty Schedule (Source: MGUS) | | 12 |
| Table 4-4 Pankow Advance Minimum Royalty Schedule (Source: MGUS) | | 13 |
| Table 4-5 Pankow Royalty Schedule (Source: MGUS) | | 13 |
| Table 4-6 Major Permits and Authorizations Required for Project Development | | 14 |
| Table 6-1 IMC geological reserve (geologic inventory, no economic constraint) | | 20 |
| Table 6-2 Proven and Probable Reserve | | 20 |
| Table 6-3 Physical Pit Design Criteria | | 21 |
| Table 6-4 Cutoff grade check calculations | | 21 |
| Table 9-1 Historic Exploration and Delineation Drilling at the Gold Rock property, 1980 to 1994 | | 34 |
| Table 10-1 MGUS 2011 Summary Drilling Results | | 41 |
| Table 12-1 Assay Results – 1989 (opt gold) | | 54 |
| Table 14-1 Gold Rock Drill Hole Sample Statistics | | 69 |
| Table 14-2 Gold Rock Composite Statistics | | 71 |
| Table 14-3 Gold Rock Variogram Parameters | | 72 |
| Table 14-4 Gold Rock Estimation Parameters | | 73 |
| Table 14-5 The Gold Rock Mineral Resource | | 75 |
| Table 26-1 Estimated Budget for Verification Drilling Program and Data Compilation | | 88 |
| April 10, 2012 | v | |
| Midway Gold Corp. | Summary |
| Gold Rock Project | NI 43-101 Technical Report on Resources |
Midway Gold Corp., through its wholly owned subsidiary, Midway Gold US Inc. (collectively MGUS) retained Gustavson Associates, LLC (Gustavson) to prepare a Mineral Resource estimate for the Gold Rock Project in White Pine County, Nevada in compliance with Canadian National Instrument 43-101 (NI 43-101) Standards of Disclosure for Mineral Projects and Canadian Institute of Mining, Metallurgy and Petroleum “Best Practices and Reporting Guidelines”.
| 1.2 | Property Description, Location and History |
Midway Gold US Inc. (MGUS), a wholly-owned subsidiary of Midway Gold Corp. has conducted exploration drilling, sampling, mapping, and geophysics since acquiring the project in 2007.
The Gold Rock gold deposit (formerly known as Easy Junior) is a bulk tonnage epithermal gold deposit found in Devonian-Mississippian limestone, shale, and sandstone. These rock types are exposed in a series of north-trending ridges that represent stacked, easterly-directed thrust sheets and low amplitude, open to tight folds.
The Gold Rock property encompasses approximately 19 square miles (4,910 hectares) of the Battle Mountain-Eureka gold trend on the eastern side of the Pancake Range in east-central Nevada. The Gold Rock Project site is located approximately 30 miles southeast of the town of Eureka in White Pine County. Access to the Gold Rock Project site is provided by Green Springs road, an unpaved county road that intersects US Highway 50 approximately 30 miles southeast of Eureka, Nevada. It is approximately 16.5 miles, via road, from US 50 to the Gold Rock property.
The Gold Rock property has a long history of exploration and development, initiated in 1979 under Earth Resources, Inc. Earth Resources, Inc. was acquired by Houston Oil & Gas, which was in turn acquired by Tenneco in 1986. Echo Bay Mines acquired Tenneco in 1986 and thereafter discovered the Easy Junior gold deposit the same year. Alta Gold and Echo Bay formed the Alta Bay joint venture in 1988, with Alta Gold the operator. Open pit mining at Easy Junior was initiated in 1989, with production suspended in 1990 due to low gold prices. Alta Gold acquired the Echo Bay interest in the project in 1992 and initiated re-engineering of the project. Mining under Alta Gold re-started in June 1993 and was concluded in August 1994. Heap leach production continued into 1996. Alta Gold filed for bankruptcy in 1998. MGUS, through its acquisition of Pan-Nevada in 2007, and through additional property leases and claim staking, acquired control of the project in 2007.
| April 10, 2012 | 1 | |
| Midway Gold Corp. | Summary |
| Gold Rock Project | NI 43-101 Technical Report on Resources |
| 1.3 | Geology and Mineralization |
The Gold Rock property is located on the east flank of the northern portion of the Pancake Range in east-central Nevada. This lobe of the Pancake Range is underlain by Devonian and Carboniferous carbonate and clastic sedimentary rocks which form the core of the range, and are exposed in bedrock outcrop in the area of the Gold Rock Project site. Although intrusive rocks are present regionally, no intrusive rocks have been mapped on the Gold Rock property. Devonian – Mississippian sedimentary bedrock geology in the vicinity of the Gold Rock Project area is locally nonconformably capped by post-mineral Tertiary volcanic rocks.
The Devonian through Mississippian limestone, shale, and sandstone units are exposed in a series of north-trending ridges that represent stacked, easterly-directed thrust sheets and low amplitude, open to tight folds. Gold mineralization is interpreted to postdate thrusting and folding. Bedrock geology is partially obscured by alluvial and colluvial gravels. Gold mineralization is preferentially hosted in the Mississippian upper Joana Limestone and lower Chainman Shale, especially in areas of tight anticlinal folding (Easy Junior Mine). Jasperoid with anomalous trace elements and locally anomalous gold occur throughout the Gold Rock Property at approximately this same stratigraphic level.
On the Gold Rock property, the primary gold feeder structure is presumed to be a steeply-dipping reverse fault reactivated with extensional dip-slip. This fault is present along the axial surface of the anticline that extends from Meridian Flats through the Easy Junior pit. Mineralization is focused where the steep feeder structure intercepts the Joana Limestone in the core of this anticline, and appears restricted to the Joana Limestone and the base of the overlying Chainman shale.
The Easy Junior deposit on the Gold Rock property is a Carlin-style, sediment-hosted, disseminated gold deposit hosted within the previously discussed Mississippian sedimentary units. Gold particles occur as micron size to sub-micron size disseminations. Free, coarse gold is not common in these types of deposits, and has not been observed at Gold Rock. Source and age of mineralization are uncertain at this time.
Alteration at Gold Rock is typical of Carlin systems in Nevada. Alteration styles include silicification, argillization, decalcification, and oxidation. Silicification occurs as zones of moderate to strong silica flooding along bedding and structures. Strong or complete replacement is commonly referred to as jasperoid by field workers. Silica alteration is found primarily in the Joana Limestone, with only minor small zones identified in shale units. Within the Gold Rock deposit, jasperoid within the Joana Limestone carries significant amounts of gold. In surface outcrops, Joana-hosted jasperoid occurs along strike both north and south of the deposit and is often found in association with anomalous gold values.
| April 10, 2012 | 2 | |
| Midway Gold Corp. | Summary |
| Gold Rock Project | NI 43-101 Technical Report on Resources |
Clay alteration is generally associated with hydrothermal alteration of minerals. Clay along faults and bedding is common. Within limestones and calcareous shales, argillization is often accompanied by decalcification of the host rock. Black carbonaceous accumulations occur locally along the margins of gold mineralization zones. Oxidation is prevalent throughout the deposit, resulting in the formation of iron oxides (hematite and limonite).
The mineralization along the anticline that hosts the mineralization at Gold Rock extends along strike to the south of the open pit of the Easy Junior Mine over 6,000 feet through the Meridian Flats prospect area. To the north of the Easy Junior open pit, the mineralization along the apex of the anticline was followed over 1,000 feet, but post-mineral faulting drops the Joana Limestone below the extent of the drilling, and therefore remains untested.
MGUS has secured and compiled historic project drilling results for 673 drill holes – primarily shallow, vertical reverse circulation holes, as well as 1,790 blast holes within the Easy Junior open pit. Historic soil grid and rock chip results are also compiled.
Since acquiring the Gold Rock Project in 2007, MGUS has completed additional geochemistry on 750 additional soil samples collected which add to the scope and magnitude of the regional sampling grid, and has collected and analyzed an additional 141 rock chip samples. Ground magnetic and gravity surveys have also been conducted over portions of the Property. In 2008, MGUS completed 11 reverse circulation holes in the Anchor Roc prospect at the southeast end of the property. Historic drilling in this area by Nevada Resources yielded a reported intercept of 120 feet of 0.014 opt gold. The best intercept encountered by MGUS was 85 feet at 0.014 opt gold. Results of this exploration by MGUS have not been reviewed and documented in detail by Gustavson, since this report is dedicated toward reviewing the historic data developed at and in the vicinity of the Easy Junior open pit for purposes of evaluating mineral resources. In 2011, MGUS completed a 31 drill hole program in the vicinity of the Easy Junior open pit and Meridian Flats areas, consisting of 25 reverse circulation holes (21,000 feet) and 6 diamond drill core holes (5,260 feet). This program was designed to confirm the geology and mineralization defined by historic drilling as well as to expand mineralization in areas with known historic intercepts.
| 1.5 | Mineral Resource Estimate |
A review of the assay and geologic drill hole data and MGUS database was conducted during the process of preparing this report. The review shows that the data is traceable to the original assay certificates of Echo Bay,Tenneco, Santa Fe Minerals, Inc. and Houston Oil and Gas. Assay certificatesissued to Alta Gold, the operator of the Easy Junior mine and the Alta Bay joint venture with Echo Bay, were generated by the various mine laboratories that they operated (Illipah, Easy Junior, Ward and Robinson labs).
| April 10, 2012 | 3 | |
| Midway Gold Corp. | Summary |
| Gold Rock Project | NI 43-101 Technical Report on Resources |
The Gold Rock mineral resource estimate is summarized below in Table 1-1. The resource estimate includes all drill data obtained and verified as of February, 2012. The summary below presents the Gold Rock resource at FOUR different cutoff grades.
Table 1-1 The Gold Rock Mineral Resource
Cutoff
(opt) | Indicated Resource | Inferred Resource |
| Tons | Grade
(opt) | Gold
Ounces | Tons | Grade
(opt) | Gold
Ounces |
| 0.015 | 8,620,000 | 0.029 | 247,000 | 8,670,000 | 0.024 | 210,000 |
| 0.012 | 10,574,000 | 0.026 | 273,000 | 11,967,000 | 0.021 | 255,000 |
| 0.008 | 14,294,000 | 0.022 | 310,000 | 19,724,000 | 0.017 | 331,000 |
| 0.004 | 19,852,000 | 0.017 | 343,000 | 33,576,000 | 0.012 | 409,000 |
| 1.6 | Conclusions and Recommendations |
The Gold Rock deposit, formally known as Easy Junior, contains a substantial gold resource that warrants additional exploration and evaluation. The mineralization system is strong, with a known strike length of over 8,000 feet. The lithology, alteration, and mineralization of the Gold Rock deposit are similar to other sediment-hosted Carlin-type systems such as Alligator Ridge, Bald Mountain, Rain, and MGUS’ Pan Project. A portion of the Gold Rock deposit has been explored and mined, but drilling outside that area is very widely spaced, shallow and locally intercepts anomalous gold mineralization. Historic exploration has not cut off mineralization in any direction.
Gustavson has reviewed the historic information on the project and has verified drill hole locations, down-hole geology as compiled in geologic logs, and gold assays based on original assay certificates. Cross validation of the historic drill assay results was accomplished using a partially documented historic check assay program, twin drill holes and comparison with the geologic and assay results of recent drilling by MGUS in 2011. Certain assay types, specifically neutron activation analyses, were not considered comparable to the historic fire assays and have been excluded from the database for purposes of generation of the resource estimate contained in this report. Fire assay results from the Ward laboratory were determined as biased toward higher gold values and were also excluded from the database for the purposes of this report. CN AA analysis results were included in the database for assay intervals not also assayed by fire assay at the Robinson laboratory. The CN AA results, on average, understate gold values as compared with fire assay results, but are believed to represent a conservative component to the estimate of gold grade. It is the opinion of Gustavson that the historic and MGUS assay data used in the database are of sufficient high quality to support the generation of indicated and inferred mineral resource estimates reported herein.
| April 10, 2012 | 4 | |
| Midway Gold Corp. | Summary |
| Gold Rock Project | NI 43-101 Technical Report on Resources |
Gustavson recommends the following:
| · | That MGUS continue a program of validation and verification of the historic drill hole assay database through an ongoing twin hole program primarily targeting historic drill holes assayed by the Robinson and Ward laboratories. This will enable MGUS to assess potential zones of additional gold mineralization that were previously only analyzed by CN AA. |
| · | A detailed 3-dimensional alteration model should be created to aide in the delineation of the mineralization in shale units in contact with the fault zone and/or Joana Limestone. |
| · | Continued drilling is recommended on an in-fill basis and to expand knowledge of potential mineralization beyond the limits of current drill patterns to potentially enable conversion of inferred resources to higher confidence categories, and to build the global inventory of gold resources. |
| · | A sufficient amount of specific gravity measurements should be collected on the individual lithologies and alteration types identified on the property. |
| · | A metallurgical program should be designed and implemented, targeting the well-known lithologic and alteration types, to characterize the potential range in ore types and to assess process type and metallurgical recoveries. |
| · | Baseline environmental studies should be initiated on a timeline compatible with MGUS corporate objectives and planning. |
| · | There is a significant amount of information in the files including historical metallurgy, geotechnical data, hydrology, and other environmental information. This data should be reviewed as a tool for planning the future needs of a new mining program. |
| · | The surface geology and alteration mapping should be completed and all the historical and modern data compiled as a tool for locating additional drill targets on the property. |
Gustavson considers the estimated budget of $3,200,000 to be sufficient for the designed program of continued historic data verification and in-fill, resource conversion to higher confidence levels, and initial metallurgical and environmental work to position the project for advancement to the pre-feasibility/feasibility level. Drilling is recommended to focus on a continued twin hole program with historic holes assayed by CN AA methods, in-fill drilling to move resources to a higher confidence level, and step-out drilling to potentially expand resources. The program should target the Resource Area outlined in this report; specifically the north and south extensions of the anticlinal trend from the Easy Junior open pit, the Meridian Flats area, and the down-dip projections of the limbs of the anticline and adjacent parallel structures. Holes should also be drilled to obtain samples for metallurgical testing to establish the potential process type and metallurgical recoveries of gold.
| April 10, 2012 | 5 | |
| Midway Gold Corp. | Introduction |
| Gold Rock Project | NI 43-101 Technical Report on Resources |
| 2.1 | Terms of Reference and Purpose of the Report |
Midway Gold Corp., through its wholly owned subsidiary, Midway Gold US Inc. (collectively MGUS) retained Gustavson Associates, LLC (Gustavson) to prepare a Mineral Resource estimate for the Gold Rock Project in White Pine County, Nevada. This report presents mineral resource estimate for the Gold Rock Project.
The Gold Rock gold deposit is a bulk tonnage epithermal gold deposit hosted by Devonian-Mississippian limestone, shale, and sandstone. These rock types are exposed in a series of north-trending ridges that represent stacked, easterly-directed thrust sheets and low amplitude, open to tight folds. MGUS has conducted exploration drilling, sampling, mapping, and geophysics since acquiring the project in 2007.
This report was prepared according to Canadian National Instrument 43-101 (NI 43-101) Standards of Disclosure for Mineral Projects and guidelines for technical reporting Canadian Institute of Mining, Metallurgy and Petroleum (CIM) “Best Practices and Reporting Guidelines” for disclosing mineral exploration. The mineral resource estimate and interpretations and conclusions reported here are based on technical data available prior to the effective date of this report,
The qualified persons responsible for this report are:
| · | William J. Crowl, R.G., Vice President, Mining Sector, Gustavson Associates |
| · | Donald E. Hulse, PE, Principal Mining Engineer, Gustavson Associates |
| · | Donald J. Baker, PhD, QP Member MMSA, Associate Principal Geologist, Gustavson Associates |
Dr. Donald Baker is responsible for Sections 7 through 15. William Crowl is responsible for Sections 1 through 6, 17, 18 and 23 through 26. Mr. Donald Hulse is responsible for Sections 1, 17, and 20. Mr. William Crowl reviewed the entire document.
Donald Baker conducted an on-site visit to the Gold Rock property on January 12 – 14, 2012, and reviewed available hard copy and electronic historic records and records of the 2011 MGUS drilling program. The site visit included approximately one day in the field to verify the locations of historic survey control points, historic drill hole locations and locations of MGUS drill holes from its 2011 drilling program. The project geology was also reviewed. One and one-half days were spent in the MGUS office in Ely, Nevada, reviewing and verifying historic drill hole information and the MGUS 2011 drilling program. Electronic files were copied and further reviewed by Gustavson following the site visit.
| April 10, 2012 | 6 | |
| Midway Gold Corp. | Introduction |
| Gold Rock Project | NI 43-101 Technical Report on Resources |
| 2.4 | Sources of Information |
The information presented, opinions, conclusions, and estimates made are based on the following:
| · | Information and technical data provided by MGUS; |
| · | Assumptions, conditions, and qualifications as set forth in the report; and |
| · | Data, reports, and opinions from other consulting organizations and previous property owners. |
During preparation of this report, Gustavson relied in good faith on information provided by MGUS regarding technical data, property ownership, and mineral tenure. Gustavson has not independently verified the status of the property ownership or mineral tenure, and is unaware of any material technical data other than that presented by MGUS.
Additional sources of information are presented in Section 27 – References.
Unless stated otherwise, all measurements reported here are in US Commercial Imperial units, and currencies are expressed in constant 2012 US dollars.
| April 10, 2012 | 7 | |
| Midway Gold Corp. | Reliance on Other Experts |
| Gold Rock Project | NI 43-101 Technical Report on Resources |
| 3. | RELIANCE ON OTHER EXPERTS |
The information, conclusions, and recommendations contained in this report are based upon review and analysis of digital and hard copy data and information supplied to Gustavson by MGUS. Information was also obtained during discussions with MGUS personnel. This study also relies on information provided by Mr. R.J. Smith, a Registered Landman with MGUS, regarding land agreements, options, claims of accuracy of title, and royalty information, and is presented in Section 4.2.
| April 10, 2012 | 8 | |
| Midway Gold Corp. | Property Description and Location |
| Gold Rock Project | NI 43-101 Technical Report on Resources |
| 4. | PROPERTY DESCRIPTION AND LOCATION |
The Gold Rock property encompasses approximately 19 square miles (4,910 hectares) of the Battle Mountain-Eureka gold trend on the eastern side of the Pancake Range in east-central Nevada. The Gold Rock Project site is located approximately 30 miles southeast of the town of Eureka in White Pine County (Figure 4-1).
The location of the Gold Rock property can be found on the USGS Ely 1:100,000 scale topographic map and the USGS Pancake Summit SW and Black Point 1:24,000 scale, 7.5 minute series quadrangle maps. The geographic center of the property is located at 39°17’N latitude and 115°44’W longitude, and the primary zone of mineralization is located in Sections 9, 10 and 16, Township 15 North, Range 56 East, Mount Diablo Base and Meridian (MDBM). Access to the site is provided by Green Springs Road, an unpaved county road which originates at US Highway 50.
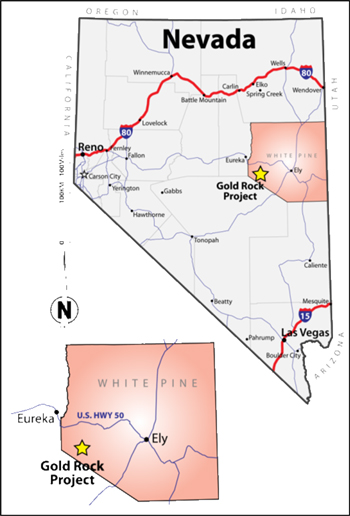
Figure 4-1 Property Location Map
| April 10, 2012 | 9 | |
| Midway Gold Corp. | Property Description and Location |
| Gold Rock Project | NI 43-101 Technical Report on Resources |
| 4.2 | Mineral Tenure and Agreements |
The Gold Rock Property mining claims and mineral lease encompass an area of approximately 12,133 acres (4,910 ha) (Figure 4-2). The Property consists of 664 contiguous, active unpatented lode and placer mining claims covering portions of Sections 2-10, 15-22, 27-29, 32-34, Township 15 North, Range 56 East; and Sections 22-23, 25-29, 31-35, Township 16 North, Range 56 East, M.D.B.&M. Unpatented mining claims are kept active through payment of a maintenance fee due on 31 August of each year. A complete listing of all claims on file with the Nevada Bureau of Land Management (BLM) and White Pine County is available and will be provided upon request.
The Property is located in surveyed Townships. The unpatented mining claims were individually surveyed at time of location and maps were filed with the BLM and White Pine County.

Figure 4-2 Mineral Claim Map
| April 10, 2012 | 10 | |
| Midway Gold Corp. | Property Description and Location |
| Gold Rock Project | NI 43-101 Technical Report on Resources |
| 4.2.2 | Newark Valley Mining Corp. Agreement |
Pursuant to the acquisition of Pan-Nevada Gold Corporation effective April 16, 2007, MGUS acquired a 100 percent interest in the March 20, 2006 mineral lease agreement by and between Pan-Nevada Gold Corporation, formerly Castleworth Ventures, Inc. (PNV) and Newark Valley Mining Corp. (NVMC) (derivative successor in interest to The Lyle F. Campbell Trust). PNV is a wholly owned subsidiary of MGUS. On or before January 5 of each year, PNV must pay an advance minimum royalty of the greater of US$60,000 or the US dollar equivalent of 108.05 ounces of gold valued by the average of the London afternoon fixing for the third calendar quarter preceding January 1 of the year in which the payment is due. All minimum advance royalties will be creditable against a sliding scale gross production royalty of between 2.5 percent and 4 percent (see Table 4-1 below).
If the total amount of gross production royalty due NVMC in any calendar year exceeds the advance minimum royalty due within that year, PNV can credit all un-credited advance minimum royalties paid in previous years against 50 percent of the gross production royalty due NVMC within that calendar year.
PNV must incur a minimum of US$75,000 per year work expenditures, including claim maintenance fees, during the term of the mining lease.
Table 4-1 NVMC Royalty Schedule (Source: MGUS)
| Price of Gold | Gross Percentage |
| To and including $340.00/oz | 2.5 percent |
| From $340.00/oz to $450.00/oz | 3.0 percent |
| $450.00/oz and greater | 4.0 percent |
The original lease encompassed 104 unpatented lode mining claims and established a 1-mile area of interest, within which all new claims located by PNV or an affiliate are subject to the lease agreement. PNV (or its predecessors) expanded the claim holdings within the area of interest to a total of 334 unpatented lode mining claims.
| 4.2.3 | Anchor Minerals, Inc. Agreement |
Effective January 15, 2007, MGUS, executed a lease agreement with Anchor Minerals, Inc. (AMI) for 63 unpatented lode mining claims known as the Anchor Roc target. On or before January 15 of each year, MGUS must pay an advance minimum royalty in the amount of US$67,249. All minimum advance royalties will be creditable against a fixed gross production royalty of 3.5%.
| April 10, 2012 | 11 | |
| Midway Gold Corp. | Property Description and Location |
| Gold Rock Project | NI 43-101 Technical Report on Resources |
MGUS must incur a minimum of US$30,000 per year work expenditures, including claim maintenance fees, during the term of the mining lease.
The lease encompassed 63 claims and established a 3,000 foot perimeter, within which all new claims located by MGUS or an affiliate are subject to the lease agreement. MGUS expended the claim holdings within the area of interest to a total of 80 unpatented lode claims.
Effective January 24, 2008, MGUS executed a lease agreement with a private party for 13 unpatented lode and placer mining claims covering portions of the previously mined open pit. On or before January 24 of each year, MGUS must pay an advance minimum royalty (see Table 4-2 below). All minimum advance royalties will be creditable against a sliding scale net smelter returns royalty of between 2 and 6 percent (see Table 4-3 below) and a buyout option in the amount of US$5 million. No area of interest applies.
Table 4-2 Peart Advance Minimum Royalty Schedule (Source: MGUS)
| Annual Date | US$ |
| January 24, 2013 | 50,000 |
| January 24, 2014 through January 24, 2018 | 60,000 |
| January 24, 2019 and thereafter | 75,000 |
Table 4-3 Peart Royalty Schedule (Source: MGUS)
| Price of Gold | NSR Percentage |
| To $300/oz | 2.0 percent |
| From $300/oz to $550/oz | 3.0 percent |
| From $551/oz to $800/oz | 4.0 percent |
| From $801/oz to $1,050/oz | 5.0 percent |
| $1,051/oz and greater | 6.0 percent |
Effective February 13, 2008, MGUS executed a lease agreement with a private party for 2 unpatented lode mining claims covering portions of the previously mined open pit and waste dumps. On or before February 13 of each year, MGUS must pay an advance minimum royalty (see Table 4-4 below). All minimum advance royalties will be creditable against a sliding scale net smelter returns royalty of between 2 and 5 percent (see Table 4-5 below) and a buyout option in the amount of US$775,000. No area of interest applies.
| April 10, 2012 | 12 | |
| Midway Gold Corp. | Property Description and Location |
| Gold Rock Project | NI 43-101 Technical Report on Resources |
Table 4-4 Pankow Advance Minimum Royalty Schedule (Source: MGUS)
| Annual Date | US$ |
| February 13, 2013 | 7,750 |
| February 13, 2014 through February 13, 2018 | 9,250 |
| February 13, 2019 and thereafter | 11,500 |
Table 4-5 Pankow Royalty Schedule (Source: MGUS)
| Price of Gold | NSR Percentage |
| To $550/oz | 2.0 percent |
| From $551/oz to $800 | 3.0 percent |
| From $801/oz to $1,050/oz | 4.0 percent |
| $1,051/oz and greater | 5.0 percent |
Subject to a February 13, 2008 assignment from a third party, MGUS acquired a February 15, 2004 lease agreement with a private party for 10 unpatented lode mining claims known as the Meridian Flats target. The assignor reserved a fixed net smelter returns royalty of 0.5%. On or before February 15 of each year, MGUS must pay an advance minimum royalty in the amount of US$15,000. All minimum advance royalties will be creditable against a fixed net smelter returns royalty of 2.5% and a buyout option in the amount of US$2.5 million. The total royalty burden for these claims is a net smelter returns royalty of 3%.
The lease encompassed 10 claims and established a 2,400 foot area of interest, within which all new claims located by MGUS or an affiliate are subject to the lease agreement. MGUS expended the claim holdings within the area of interest to a total of 17 unpatented lode claims.
Over the years, MGUS has staked 198 additional unpatented lode claims (MT, GR series) within and adjacent to the Gold Rock property. These additional claims are without royalty burden and are not subject to any outside interest.
| 4.3 | Environmental Liabilities and Permitting |
| 4.3.1 | Environmental Liabilities |
No known environmental liabilities exist currently at the site.
| April 10, 2012 | 13 | |
| Midway Gold Corp. | Property Description and Location |
| Gold Rock Project | NI 43-101 Technical Report on Resources |
MGUS exploration activities are permitted under the NOI process approved by the BLM in 2008 and 2011, allowing for up to 45 reverse circulation holes and 5 diamond core holes from 40 drill sites. Currently MGUS is bonded at $24,870, which allows for drilling disturbance on approximately 5.45 acres at the project site. The disturbance is updated annually and the bonding level is updated every three years, as required by the BLM.
An exploration Plan of Operations (PoO) was submitted in October of 2011. An Environmental Assessment (EA) is in progress for this PoO. An amendment to this PoO may be required to allow drilling to continue until an Environmental Impact Statement (EIS) can be completed on the mine PoO. If required, an expedited EA would be prepared and would not likely impact the project schedule.
The Gold Rock project will require a number of permits and environmental studies. It is expected that these permits and studies will be similar in nature to those required at MGUS Gold’s Pan Project. We would expect the permits and studies to include:
Table 4-6 Major Permits and Authorizations Required for Project Development
| Permit/Approval; | Granting Agency | Permit Purpose |
| Federal Permits Approvals and Registrations |
| Plan of Operations/EA Amendment | US Bureau of Land Management | Prevent undue degradation in relation to exploration activities or expansion areas. |
| Plan of Operations/EIS | U.S. Bureau of Land Management | Prevent unnecessary or undue degradation associated with Plan of Operations, EIS to disclose environmental impacts and project alternatives. Requires financial assurance. Currently have Plan for exploration with EA in progress |
| Explosives Permit | U.S. Bureau of Alcohol, Tobacco & Firearms | Storage and use of explosives |
| EPA Hazardous Waste ID No. | U.S. Environmental Protection Agency | Registration as a small-quantity generator of wastes regulated as hazardous |
| April 10, 2012 | 14 | |
| Midway Gold Corp. | Property Description and Location |
| Gold Rock Project | NI 43-101 Technical Report on Resources |
| Permit/Approval; | Granting Agency | Permit Purpose |
| Notification of Commencement of Operations | Mine Safety & Health Administration | Mine safety issues, training plan, mine registration |
| Nationwide Section 404 Permit | U.S. Army Corps of Engineers | Installation of any required culverts on the access road (not anticipated to be necessary |
| Endangered Species Act | U.S. Fish and Wildlife Service | Only if project affects species listed as threatened or endangered (not anticipated to be necessary) |
| Federal Communications Commission | FCC | Frequency registrations for radio/microwave communication facilities |
| State Permits |
| Air Quality Operating Permit | NV Division of Environmental Protection/Bureau of Air Pollution Control | Regulates project sources of air emissions. Will require compliance with the new |
| Mercury Operating Permit to Construct Air | NV Division of Environmental Protection/Bureau of Air Quality Planning/ Nevada Mercury Air Emissions Control Program | Requires use of NVMACT for all thermal units that have the potential to emit mercury |
| Reclamation Permit | NV Division of Environmental Protection/Bureau of Mining Regulation & Reclamation | Reclamation of surface disturbance due to mining and mineral processing includes financial assurance requirements. Site currently operates under Reclamation Permit No. 0228. |
| Water Pollution Control Permit | NV Division of Environmental Protection/Bureau of Mining Regulation & Reclamation | Prevent degradation of waters of the state from mining, establishes minimum facility design and containment requirements. Site currently operates under WPCP NEV70010. |
| Petroleum-Contaminated Soil Management Plan | NV Division of Environmental Protection/Bureau of Mining Regulation & Reclamation | On-site treatment and management of hydrocarbon-contaminated soils |
| Solid Waste Class III Landfill Waiver | NV Division of Environmental Protection/Bureau of Solid Waste | On-site disposal of non-mining, non-hazardous solid wastes |
| General Stormwater Discharge Permit | NV Division of Environmental Protection/Bureau of Water Pollution Control | Management of site stormwater |
| April 10, 2012 | 15 | |
| Midway Gold Corp. | Property Description and Location |
| Gold Rock Project | NI 43-101 Technical Report on Resources |
| Permit/Approval; | Granting Agency | Permit Purpose |
| Permit to Appropriate Water | NV Division of Water Resources | Water appropriation |
| | | |
| Permit to Construct Impoundments | NV Division of Water Resources | Design and construction of a tailings embankment or other structures with a crest height 20 feet or higher, as measured from the downstream toe to the crest, or that will impound 20 acre-feet or more |
| | | |
| Industrial Artificial Pond Permit | NV Department of Wildlife | Ponds containing chemicals directly associated with the processing of ore. |
| | | |
| Liquefied Petroleum Gas License | NV Board of the Regulation of Liquefied Petroleum Gas | Tank specification and installation, handling, and safety requirements |
| | | |
| Potable Water System Permit | NV Bureau of Safe Drinking Water | Water system for drinking water and other domestic uses (e.g., lavatories) |
| | | |
| Radioactive Materials License | NV Bureau of Safe Drinking Water | Nuclear flow and mass measurement devices if used in the mineral processing facilities |
| | | |
Septic Treatment Permit Sewage Disposal System | NV Division of Environmental Protection/Bureau of Water Pollution Control | Design, operation, and monitoring of septic and sewage disposal systems |
| | | |
| Hazardous Materials Storage Permit | Nevada Fire Marshall | Hazardous materials safety |
| | | |
| Local Permits |
| Building Permits | White Pine County Building Planning Department | |
| | | |
| Conditional Special Use Permit | White Pine County Building Planning Department | |
| | | |
| County Road Use and Maintenance Permit | White Pine County Building Planning Department | Use and maintenance of county roads |
| | | |
| April 10, 2012 | 16 | |
| Midway Gold Corp. | Accessibility Climate Resources Infrastructure & Physiography |
| Gold Rock Project | NI 43-101 Technical Report on Resources |
| 5. | ACCESSIBILITY, CLIMATE, LOCAL RESOURCES, INFRASTRUCTURE AND PHYSIOGRAPHY |
Access to the Gold Rock Project site is provided by Green Springs road, an unpaved county road that intersects US Highway 50 approximately 30 miles southeast of Eureka, Nevada. It is approximately 16.5 miles, via road, from US 50 to the Gold Rock property. The property is accessible year-round, but weather conditions occasionally make access and on-site travel difficult during the winter months.
| 5.2 | Topography, Elevation, Vegetation, and Climate |
Local terrain at the Gold Rock project site is gentle to moderate with rolling hills and no major stream drainages. Elevation at the property ranges from 6,400 to 7,600 feet above sea level. Vegetation is typical of northern Nevada, including a mix of sparse Juniper and Pinion pine forest broken by areas of sagebrush and grass. No springs are known to exist on the Gold Rock property.
The local climate is typical for the high desert of east-central Nevada and the Basin and Range province. Climate data for nearby Eureka, Nevada shows an average of 11.85 inches of precipitation per year and average temperatures ranging from 17°F in the winter to 86.4° F in the summer, with daytime temperatures commonly exceeding 90°F during the months of July and August (Western Regional Climate Center, 2008). Operating season can be year-round.
No perennial surface waters exist on or near the project site. The nearest surface water is Bull Creek, 8.8 miles to the southeast of the site and on the opposite side of the Pancake Range. The project site is located outside of the 100-year flood plain. The Easy Junior mine’s water supply well was drilled approximately 5 miles southeast of the mine area, and the water produced is of potable quality. The water table at the Gold Rock project site (Easy Junior mine area) occurs at a depth of approximately 1,300 feet below surface (NDEP, 1995a).
| 5.3 | Infrastructure and Local Resources |
The Gold Rock Project is a bulk tonnage disseminated gold deposit amenable to the open pit heap leach technology and mining methods common to Nevada. The Gold Rock Project is wholly located on MGUS land holdings.
The town nearest to the project site, Eureka, Nevada, hosts a population of 610 according to 2010 US Census data. Greater Eureka County and White Pine County host area populations of 1,987 and 10,030 respectively (US Census Bureau, 2008), though population is centered primarily in Eureka and Ely, Nevada. Elko, Nevada, population of 18,297, is the nearest city to the project site, and is located approximately 110 miles to the north by road.
| April 10, 2012 | 17 | |
| Midway Gold Corp. | Accessibility Climate Resources Infrastructure & Physiography |
| Gold Rock Project | NI 43-101 Technical Report on Resources |
Electrical power is available via a power line which runs adjacent to and 6 miles north of highway US 50, approximately 20 miles from the project site. MGUS is currently permitting a power line to its Pan Project site, approximately 10 miles to the NNW, and has included an extension of the power line to the Gold Rock Project site in the design for future permitting. Water for exploration, mine production and process efforts will need to be identified and secured.
Logistical support is available in Eureka, Ely, and Elko, all of which currently support large open pit mining operations. Barrick Gold Corporation currently operates the Ruby Hill Mine near Eureka and the Bald Mountain Mine approximately 60 miles to the north. QuadraFNX Mining Ltd. operates the Ruth Copper pit near Ely, and large scale mining by Barrick and Newmont Mining Corporation is ongoing near Elko and Carlin, Nevada to the north.
Mining history in the area of the Gold Rock Project dates back to 1876, when underground silver mining and smelting were based in Eureka. Mining personnel and resources for exploration and potential operations at Gold Rock are expected to be available from Eureka and Ely, as well as from outlying areas in White Pine and Elko Counties.
| April 10, 2012 | 18 | |
| Midway Gold Corp. | History |
| Gold Rock Project | NI 43-101 Technical Report on Resources |
The following history of the Gold Rock property is presented from records of the Alta Gold Company and Alta Gold and Echo Bay including Carden (1988, 1991) and Alta Bay (1990, 1991):
| · | The property was first staked in 1979 by Earth Resources, Inc. |
| · | Earth Resources was purchased by Houston Oil & Gas in 1980 |
| · | The property was sub-leased to various parties between 1981 and 1986, but was returned to Tenneco, who had acquired Houston Oil & Gas in 1986 |
| · | Following a 1,200-sample soil sampling program in 1986, rock chip sampling results in the Easy Junior Ridge area included 32 samples that averaged 0.58 ppm gold |
| · | In September of 1986, Echo Bay exploration acquired Tenneco and subsequent drilling at Easy Junior resulted in a discovery; 42 RC holes were drilled, and the best intercept recorded intercept is 320’ of 0.066 opt gold |
| · | Echo Bay drilled a total of 229 holes in 1987 and 1988 in an effort to delineate the Easy Junior deposit |
| · | The Alta Bay Joint Venture was formed between Echo Bay and Alta Gold in 1988 |
| · | Mine development was initiated in 1989 under the Alta Bay Joint Venture, with Alta Gold as operator |
| · | Mining was suspended in 1990 due to low gold prices |
| · | Alta gold purchased Echo Bay’s interest in 1992 and began detailed re-engineering studies |
| · | Mining resumed at Easy Junior in June 1993 |
| · | Mining was completed at Easy Junior in August 1994; total production for the life of the mine was 52,400 ounces gold |
| · | Heap leach processing was completed in 1996 |
| · | Alta Gold declared bankruptcy in 1998 |
There is no record of new drilling or significant exploration after 1994, until 2008, following MGUS’s acquisition of the property and re-initiation of exploration efforts.
| 6.2 | Resource and Reserve Estimates |
Records regarding historical resource and reserve estimates are fragmentary. For most of the life of the project, the operators relied on in-house estimates to determine the value of the property. Only two reports were produced by independent sources. The resource and reserve estimates described below were not necessarily completed according to present NI 43-101 standards and have not been verified by a qualified person. These estimates do not represent current mineral resources or reserves, and are disclosed here for historical completeness only.
| April 10, 2012 | 19 | |
| Midway Gold Corp. | History |
| Gold Rock Project | NI 43-101 Technical Report on Resources |
In 1988, Echo Bay contracted with Independent Mining Consultants, Inc. (IMC) of Tucson, Arizona. IMC built a resource model using a kriged estimate from 20 foot drillhole composites and 25- by 25-foot blocks. IMC did not apply any economic constraints to the model, but reported tons and grade from a series of cut-offs. This model was created prior to any mining at Easy Junior and it must be assumed that significant portions were subsequently mined.
Table 6-1 IMC geological reserve (geologic inventory, no economic constraint)
| | | | |
| 0.050 | 758,000 | 0.064 | 48,512 |
| 0.030 | 3,552,000 | 0.043 | 152,736 |
| 0.025 | 4,953,000 | 0.039 | 193,167 |
| 0.020 | 6,963,000 | 0.034 | 236,742 |
| 0.015 | 9,934,000 | 0.029 | 288,086 |
| 0.010 | 12,641,000 | 0.025 | 316,025 |
In 1989, Alta Gold commissioned Pincock Allen and Holt (“PAH”) of Lakewood, Colorado to conduct an audit and verification of the reserves at Easy Junior. Details are lacking, but the Alta Gold model was constructed using Inverse Distance Cubed estimation. The geologic inventory of mineralization at a cut-off of 0.008 opt was 15,400,000 tons at a grade of 0.028 opt for 400,000 ounces gold.
PAH estimated a Proven and Probable reserve after applying expected mining costs and recoveries, as shown in Table 6-2.
Table 6-2 Proven and Probable Reserve
| | | | | | | |
| 5,058,000 | 0.032 | 161,900 | | 1,460,000 | 0.01 | 14,600 |
Mining costs have changed significantly since the time of these estimations, and available information is not sufficient to determine which portions of the resource or reserve were mined as ore or waste.
| April 10, 2012 | 20 | |
| Midway Gold Corp. | History |
| Gold Rock Project | NI 43-101 Technical Report on Resources |
The physical design criteria and cutoff grade calculations used by Alta Gold for development of the Easy Junior Pit are presented in Tables 6-3 and 6-4 (from PAH 1989):
Table 6-3 Physical Pit Design Criteria
| |
| |
| Maximum Slope Angle (deg) | 53 |
| Bench Height (ft) | 15 |
| Catch Bench Interval (ft) | 45 |
| Catch Bench Width (ft) | 20 |
| Road Width (ft) | 55 |
| Road Grade (%) | 10 |
| Tonnage Factor (ft3/ton) | 13 |
Table 6-4 Cutoff grade check calculations
| |
| |
| | Internal Cutoff |
| | Ore | ROM |
| Mining Cost | N/A | N/A |
| Mine Equip. Repl. Cost | N/A | N/A |
| Processing Cost | 2.74 | 1.10 |
| G & A Cost | 1 | N/A(1) |
| Total Costs, $/ton | 3.34 | 1.10 |
| | | |
| Gold Price, $/oz | 375.00 | 375.00 |
| | | |
| Net Smelter Return, Percent | 99.5 | 99.5 |
| Recovery, Percent | 75 | 60 |
| Net Revenue, $/oz | 279.84 | 223.88 |
| Cutoff, oz/ton(2) | 0.012 | 0.005 |
| Alta Gold Cutoff | 0.013 | 0.009 |
Notes:
(1) Not including G&A costs is only valid so long as ROM heap leach is a secondary process.
(2) Cutoff = Total costs/Net Revenue
| April 10, 2012 | 21 | |
| Midway Gold Corp. | Geological Setting and Mineralization |
| Gold Rock Project | NI 43-101 Technical Report on Resources |
| 7. | GEOLOGICAL SETTING AND MINERALIZATION |
The Gold Rock property is located on the east flank of the northern portion of the Pancake Range in east-central Nevada. The Pancake Range is part of the Basin and Range Province, a large physiographic region characterized by a series of normal faults expressed as a sequence of north-south trending narrow mountain ranges separated by flat, arid valleys. The Pancake Range is approximately 85 miles long and 8 to 10 miles wide, and is primarily composed of Paleozoic carbonate and clastic sedimentary rocks, Cretaceous igneous intrusives, and Tertiary volcanics. A regional geologic map of the northern Pancake Range is presented as Figure 7-1.
| April 10, 2012 | 22 | |
| Midway Gold Corp. | Geological Setting and Mineralization |
| Gold Rock Project | NI 43-101 Technical Report on Resources |

Figure 7-1 Regional Geology (Hose and Blake, 1987)
| April 10, 2012 | 23 | |
| Midway Gold Corp. | Geological Setting and Mineralization |
| Gold Rock Project | NI 43-101 Technical Report on Resources |
The Gold Rock property is located in an eastern lobe of the Pancake Range. Devonian and Carboniferous carbonate and clastic sedimentary rocks form the core of the range, and are exposed in bedrock outcrops and within the Easy Junior pit in the area of the Gold Rock Project. A stratigraphic section representative of the Pancake Range is presented as Figure 7-2. The Pancake stock, a Cretaceous-aged quartz monzonite intrusive, is located to the north and west of the property, and a prominent sill is noted in associated regional mapping. These intrusives appear to be age equivalents of the Mount Hamilton stock, which lies in the White Pine Range to the east. No intrusive rocks have been mapped on the Gold Rock property. The local geology has been capped in places by post mineral Tertiary aged gravels and alluvium. No intrusive rocks have been mapped on the Gold Rock property.
| April 10, 2012 | 24 | |
| Midway Gold Corp. | Geological Setting and Mineralization |
| Gold Rock Project | NI 43-101 Technical Report on Resources |
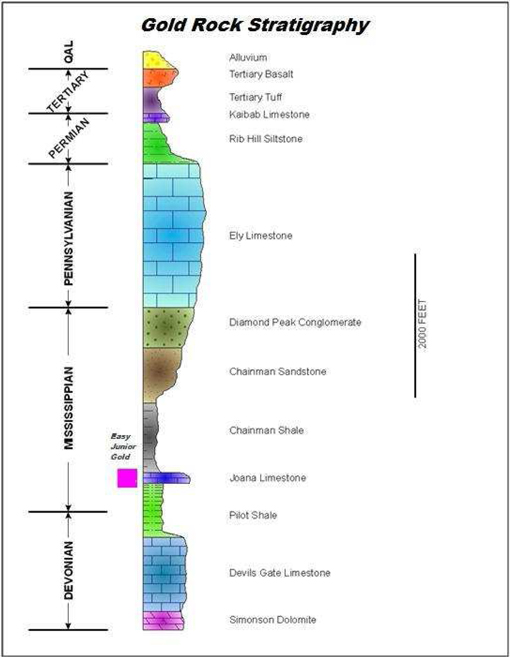
Figure 7-2 Stratigraphic Column Pancake Range (Smith, 1976, Harris, 2007)
A detailed geologic map of the Gold Rock property is presented in Figure 7-3. The geology of the Gold Rock property is dominated by Devonian through Mississippian limestone, shale, and sandstone. These rock types are exposed in a series of north-trending ridges that represent stacked, easterly-directed thrust sheets and low amplitude, open to tight folds. Mineralization is interpreted to postdate thrusting and folding. Bedrock geology is partially obscured by alluvial and colluvial gravels. Individual lithologic units identified at the project site are described below, from oldest to youngest:
| April 10, 2012 | 25 | |
| Midway Gold Corp. | Geological Setting and Mineralization |
| Gold Rock Project | NI 43-101 Technical Report on Resources |
| 7.3.1 | Late Devonian Devil’s Gate Limestone (Dd) |
The oldest lithologic unit exposed in the northern Pancake Range is the Late Devonian Devil’s Gate Limestone. This unit is a massive to thinly bedded, medium to dark gray, fine to coarse grained limestone. Thickness of the unit ranges from about 1000 ft to 2500 ft locally.
| 7.3.2 | Late Devonian to Early Mississippian Pilot Shale (MDp) |
The Pilot Shale can be divided into an upper series of thinly interbedded dolomitic and calcareous siltstone and silty shale, and a lower section of more thickly bedded calcareous siltstone with local limestone beds.
| 7.3.3 | Mississippian Joana Limestone (Mj) |
The Joana Limestone is a gray, medium grained, unevenly bedded limestone with abundant fossil fragments and detrital limestone interbeds. Fossil types include echinoderm, bryozoans, foraminifera, algae, and crinoids. Locally, light brown calcareous sandstone is present at the base of the unit. Thickness of the Joana Limestone reportedly ranges from 90 to 500 ft throughout the county (Smith, 1976). The Joana Limestone is the primary host to known mineralization and historic resources and reserves at the Gold Rock property. This unit is commonly silica altered (mapped as jasperoid) throughout the project area, including beyond zones of currently known mineralization.
| 7.3.4 | Mississippian Chainman Shale (Mc) |
The Chainman Shale consist of dark gray to black shale with thin interbeds of olive gray silty shale and siltstone. Thickness of the unit ranges from 1000 to 2000 ft (Smith, 1976) and is generally at the lower end of that range at the Gold Rock property. Mineralization occurs in the lower portions of the Chainman Shale at Gold Rock, particularly where it lies adjacent to mineralized Joana Limestone.
| 7.3.5 | Mississippian Diamond Peak Formation (Md) |
The Diamond Peak Formation consists of medium beds of coarse grained, quartz-rich sandstone and olive gray siltstone overlain by thick to massive conglomerate. Thickness of the Formation ranges from less than 1,000 to 3,700 ft. This unit outcrops just west of the Gold Rock claim block.
| April 10, 2012 | 26 | |
| Midway Gold Corp. | Geological Setting and Mineralization |
| Gold Rock Project | NI 43-101 Technical Report on Resources |
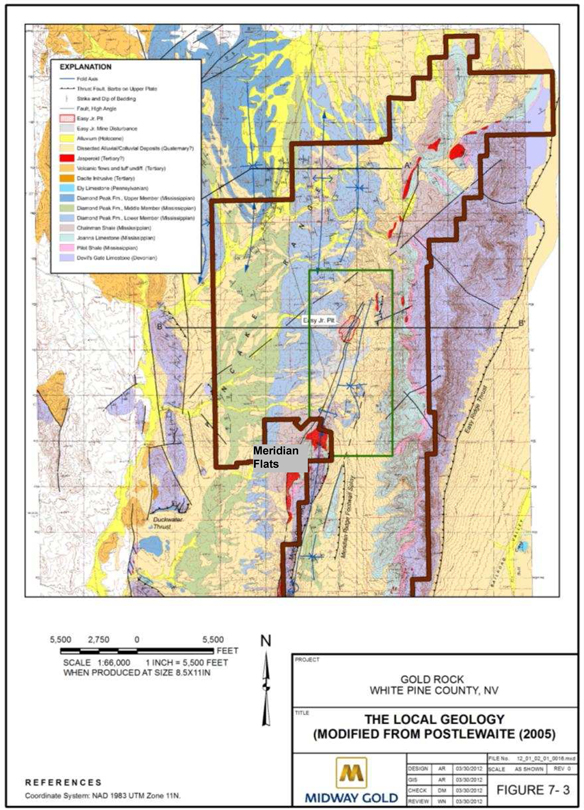
Figure 7-3 Local Geology
| April 10, 2012 | 27 | |
| Midway Gold Corp. | Geological Setting and Mineralization |
| Gold Rock Project | NI 43-101 Technical Report on Resources |
The Gold Rock property is characterized by a relatively subdued topography of shale and limestone partially covered by a thin veneer of gravel. The subdued character masks a complexly thrust-faulted and folded terrain. Several thrust faults, reverse faults, and associated folds transect the property, generally striking about 15 degrees (N15E). A very tight fold of altered and mineralized Mississippian Joana Limestone is clearly exposed in the Easy Junior open pit. The structural style is typical of the east-west directed compressional orogenic activity common in the Mesozoic era in this part of North America, possibly during the Antler orogeny.
Later Basin and Range extension likely reactivated the steep reverse faults created during the Antler orogeny, creating deep-seated high-angle fractures that were exploited as flow pathways by gold-rich hydrothermal fluids (Carden, 1988, 1991). Gold was deposited where the steep feeder structures intercepted rock types that are strongly reactive to the hydrothermal fluids.
On the Gold Rock property, the primary gold feeder structure is presumed to be a steeply-dipping reverse fault reactivated with extensional dip-slip. This fault is present near and within the axial surface of the anticline that extends from Meridian Flats through the Easy Junior open pit (Figure 7-4). Mineralization is found where the steep feeder structure intercepts the Joana Limestone at the crest of this anticline, and appears restricted to the Joana Limestone and the base of the overlying Chainman shale, at least to the extent drilled to depth to date.
Mineralization may have been enhanced where offset of this primary feeder structure caused deformation and increased porosity and permeability over a larger volume. The main feeder structure appears to be offset by post-mineral high-angle faults. Most of these observed post-mineral structures trend 60 to 75 degrees (N60 to N75E).
| April 10, 2012 | 28 | |
| Midway Gold Corp. | Geological Setting and Mineralization |
| Gold Rock Project | NI 43-101 Technical Report on Resources |

Figure 7-4 Pre-mining Cross Section of the Easy Junior Deposit (Alta Bay, 1991)
Gold mineralization at Gold Rock is typical of Carlin-style, sediment hosted deposits:
| · | Disseminated, micron sized gold |
| · | Hosted in sedimentary rock, usually impure calcareous rocks |
| · | Near a vertical or sub-vertical deep seated feeder fault and associated folds |
| · | Characteristic alteration assemblage associated with strongly oxidizing fluids |
Alteration at Gold Rock is typical of Carlin systems in Nevada. Alteration styles include silicification, argillization, decalcification, and oxidation.
Silicification occurs as zones of moderate to strong silica flooding along bedding and structures. Strong or complete replacement is commonly referred to as jasperoid by field workers. Silica alteration is found primarily in the Joana Limestone, with only minor small zones identified in shale units. Within the Easy Junior deposit, jasperoid within the Joana Limestone carries significant amounts of gold. In surface outcrops, Joana-hosted jasperoid occurs along strike both north and south of the deposit and is often found in association with anomalous gold values.
| April 10, 2012 | 29 | |
| Midway Gold Corp. | Geological Setting and Mineralization |
| Gold Rock Project | NI 43-101 Technical Report on Resources |
Clay alteration is generally associated with hydrothermal alteration of minerals. Clay along faults and bedding is common. Within limestones and calcareous shales, argillization is often accompanied by decalcification of the host rock. Black carbonaceous accumulations occur locally along the margins of gold mineralization zones.
Oxidation is prevalent throughout the deposit, resulting in the formation of iron oxides (hematite and limonite). Liesegang banding has formed in association with oxidation, and is prevalent in and around gold mineralization. The mineralization is strongly oxidized, and reference to sulfide minerals in drill logs is very rare.
| 7.7 | Geometry of Mineralization |
Figure 7-4 illustrates the cross-sectional geometry of mineralization of the Easy Junior deposit as interpreted from drilling. A steep west-dipping fault cuts the west side of a north-trending anticline. Mineralizing fluids deposited gold both within the fault zone and in the Joana Limestone and surrounding rocks at the apex of the Easy Junior Anticline. A view looking at the pit after mining shows the fold with the fault structure cutting the hinge area of the fold (Figure 7-5).
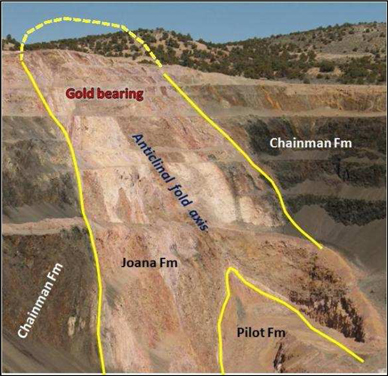
Figure 7-5 North Facing View of the Easy Junior Pit
| April 10, 2012 | 30 | |
| Midway Gold Corp. | Geological Setting and Mineralization |
| Gold Rock Project | NI 43-101 Technical Report on Resources |
The mineralization along the anticline extends along strike to the south of the Easy Junior Mine over 6,000 feet through the Meridian Flats prospect area. To the north of Easy Junior, the mineralization along the apex of the anticline was followed over 1,000 feet, but post-mineral faulting drops the Joana Limestone below the extent of the drilling, and therefore remains untested.
Mineralization was exposed at the pre-mining surface of the Easy Junior open pit. Along strike, the mineralized lower Chainman Shale and upper Joana Limestone are covered by 300 to 500 feet of poorly exposed Chainman shale. Mining at Easy Junior extracted a small portion of the near surface resource. Historic drill intercepts indicate that significant mineralization still exists below the Easy Junior open pit and along strike to the north and south.
Historic drilling at Meridian Flats, nearly a mile south of the Easy Junior open pit, intersected significant mineralization along trend within the same faulted anticline geometry, as shown in Figure 7-4.
| April 10, 2012 | 31 | |
| Midway Gold Corp. | Deposit Types |
| Gold Rock Project | NI 43-101 Technical Report on Resources |
The Easy Junior deposit on the Gold Rock property is a Carlin-style, sediment-hosted, disseminated gold deposit within Mississippian sedimentary units, largely in the Joana Limestone and in the lower portions of the overlying Chainman shale. Gold particles occur as micron size to sub-micron size disseminations. Free, coarse gold is not common in these types of deposits, and has not been observed at Gold Rock. The source and age of mineralization is uncertain at this time.
Gold is often associated with anomalous concentrations of arsenic, antimony, and mercury. Other elements of note include barium, zinc, and tungsten. Similar gold deposits in the surrounding area include the Pan deposit 10 miles to the north; Maverick Springs, approximately 70 miles north of Gold Rock; and Emigrant Springs.
| April 10, 2012 | 32 | |
| Midway Gold Corp. | Exploration |
| Gold Rock Project | NI 43-101 Technical Report on Resources |
| 9.1 | Previous Operator’s Exploration Work |
The central part of the Gold Rock property includes the historically mined Easy Junior area. Past activity by the historic operators generated a significant amount of data covering all aspects of exploration and mining. MGUS has compiled a significant amount of the historic data for use in assessing the potential resource and exploration targets. Historic operators include Nevada Resources, Houston Oil and Minerals, Tenneco, Echo Bay, Santa Fe, Amselco, and Alta Gold. Available data include:
| · | Drilling logs and assays |
| · | Geochemical sampling maps and assays |
| · | Geophysical survey results |
| 9.2 | Historic Geochemical sampling |
From 1985 to 1993, Tenneco, Echo Bay, and Alta Gold collected 2,800 soil samples over a 6.5 square mile area. Most of these samples were analyzed for gold, barium, antimony and mercury. Historic data was also compiled from 970 rock chip samples, many of which were analyzed for gold, mercury, arsenic, antimony, barium and zinc.
Limited geophysical study was conducted at Gold Rock as part of the historic Easy Junior exploration. In 1986, Tenneco conducted VLF-EM over selected lines attempting to define structural complexities. In 1989 Alta Gold gathered induced polarization and resistivity data, again in an attempt to define structural complexities. No significant property-wide surveys were conducted.
A detailed geologic map was generated by Tenneco in 1986, which covers a portion of the Gold Rock property. This is the most detailed historic map of the region. Postlethwaite (2005) compiled a regional map that included the Gold Rock property in an effort to describe the relationship of fold and thrust faulting relative to gold mineralization (Postlethwaite (2005) is the source of the mapping provided in Figure 7-3.
MGUS continues to compile these sources of data, in addition to data from several smaller maps of individual prospect areas, in order to create and upgrade a property-wide geologic map. New geologic mapping continues on the project lands, and will provide more detailed information with regard to structure and alteration.
| April 10, 2012 | 33 | |
| Midway Gold Corp. | Exploration |
| Gold Rock Project | NI 43-101 Technical Report on Resources |
The long history of exploration and production at the Easy Junior deposit includes 14 years of drilling, from 1980 to 1994, and periodic mine production from 1989 to 1994. The compiled database now contains records from 673 historic drill holes. Most of this drilling was completed between 1986 and 1988 by Echo Bay, and later, the Alta Bay JV (1988 to 1992). The results of this drilling have provided the basis of the understanding of the distribution and magnitude of the remaining gold mineralization at the Gold Rock property developed by MGUS since acquisition of the property in 2007.
Table 9-1 Historic Exploration and Delineation Drilling at the Gold Rock property, 1980 to 1994
| Company | No. of holes | Drilling Method | Years | Notes |
| Houston Oil & Gas | 16 | ? | 1980-1983 | |
| Nevada Resources | 64 | | 1981 | FOG Claims |
| Amselco | 6 | | 1983 | Monte Claims |
| Sante Fe | 19 | RC | 1984-1985 | |
| Tenneco/Echo Bay | 241 | RC* | 1886-88 | *includes 12 core holes for metallurgy |
| Alta Bay | 284 | RC | 1988-1992 | Exploration/Delineation |
| Alta Gold | 47 | RC | 1993-1994 | |
| TOTAL | 673 | | | |
Substantial portions of this historic data, particularly that provided by the results of the 673 historic drill holes, have been combined with the exploration program results developed by MGUS since 2007 to generate an estimation of potentially available new and remaining resources.
Additionally, and not included in the above tabulation, Mobile Oil drilled a series of 160-foot deep seismic exploration holes in two parallel lines across the north end of the Gold Rock property in 1987. Although some distance from any current gold resource, this data may prove useful in future exploration work on the Gold Rock Project.
MGUS has been active in all phases of exploration work on the Gold Rock property since acquiring the project in 2007. Exploration programs have included soil and rock chip geochemistry, geologic mapping, geophysics and drilling. The most relevant of these programs for purposes of this Report, is the drilling conducted in 2011, which focused on verification and expansion of the knowledge of the geology and mineralization as defined by the historic drilling. A brief summary of the MGUS efforts is provided below, with more detailed discussion of the MGUS 2011 drilling program in Sections 10, 11 and 12.
| April 10, 2012 | 34 | |
| Midway Gold Corp. | Exploration |
| Gold Rock Project | NI 43-101 Technical Report on Resources |
| 9.6.1 | Surface Geochemistry |
During 2010, MGUS completed a soil geochemistry survey to complement the historic soil grid. An additional 750 soil samples were collected in an area generally east of the historic soil grid. The grid was designed to target new structural and alteration targets outside of the previously known mineralization.
In conjunction with the soil sampling program, 141 rock samples were collected from the Gold Rock property in 2010. These samples have been added to the Gold Rock Database and will be used to assess potential for additional targets outside the trend of known mineralization.
MGUS mapped the geology of the central portion of the Gold Rock property in 2010 in order to better define the distribution of alteration and generate future drill targets. Correlating alteration near known gold mineralization with the distribution of alteration throughout the property may provide a useful tool in identifying additional gold occurrences and, potentially, resources.
In 2008, MGUS conducted reconnaissance level ground magnetic and gravity surveys over portions of the Gold Rock Property, and, in 2010, conducted an additional reconnaissance ground magnetic program, testing for buried intrusives in several parts of the property.
During the 2008 field season, MGUS drilled 11 RC holes near the south end of the Gold Rock property at the Anchor Roc prospect. Drilling in that area by Nevada Resources in 1981 included an intercept of 120 feet of 0.014 opt gold. MGUS’s best intercept was 85 feet of 0.014 opt gold. The program was prematurely curtailed when a series of large voids in the bedrock prevented the drill from reaching target depths. MGUS plans to drill the remaining targets in this area with a different drill that can get past the voids. The Anchor Roc prospect does not currently host a defined resource.
Drilling conducted during the 2011 program, completing 31 holes, is discussed in detail in the following sections.
Sampling methods and quality are further discussed in Section 11.
| April 10, 2012 | 35 | |
| Midway Gold Corp. | Drilling |
| Gold Rock Project | NI 43-101 Technical Report on Resources |
A total of 715 drill holes have been completed on or in the immediate vicinity of the current Gold Rock property; 673 of which are considered historic, and 42 having been more recently completed by MGUS. Of this total, approximately 548 lie within an area modeled (“Resource Area”) in this Report to assess geology and mineral resources (Figure 10-1). Of the 548 drill holes within the Resource Area, 78 are excluded from the resource analysis owing to non-verified collar coordinates and surface locations, or issues with assay type (specifically neutron activation analyses for gold).
| April 10, 2012 | 36 | |
| Midway Gold Corp. | Drilling |
| Gold Rock Project | NI 43-101 Technical Report on Resources |
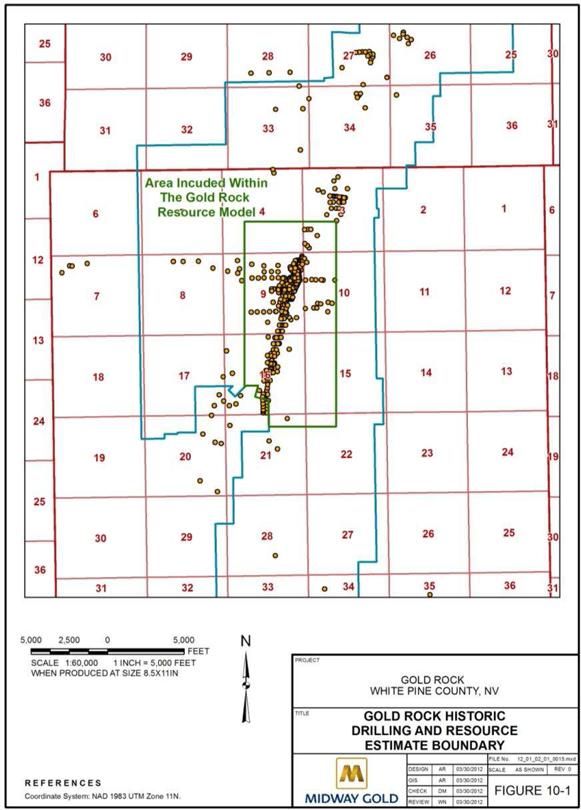
Figure 10-1 Gold Rock Historic Drillikng and Resource Estimate Boundary
| April 10, 2012 | 37 | |
| Midway Gold Corp. | Drilling |
| Gold Rock Project | NI 43-101 Technical Report on Resources |
Historic drilling in the Resource Area was overwhelmingly completed by reverse circulation techniques, although detailed documentation on a drill hole by drill hole basis is not available in the database. Carden (1991) documented the following (see Table 9-1):
| · | Santa Fe drilling of 19 holes in 1984 and 1985 was by reverse circulation methods; |
| · | Of the 241 holes completed by Echo Bay prior to consummation of the Alta Bay Joint Venture, only 12 were completed as diamond drill holes for metallurgical purposes. The remaining 229 holes were all completed by reverse circulation methods; and, |
| · | After formation of the Joint Venture, the partners grid-drilled the known deposit on a 50 x 100 foot grid (50 foot spacing of holes on approximately east-west lines; with lines spaced 100 feet) using two reverse circulation drill rigs. |
Protocols practiced by drilling contractors and mining company personnel at drill sites are not known, although all drill hole sampling was completed on 5-foot intervals based on results posted in the assay database. Nearly all drilling was in vertical holes of undocumented diameter (typically 4.5 inches or more in diameter, by standard industry practices at the time). Collar coordinates and elevation were determined by theodolite surveys, employing the Nevada State Plane East, NAD 27 projection, and are well-documented in the database. There were no down-hole surveys completed or documented. Based on observations from the MGUS drilling in 2011, all of the historic holes, except for two deeper holes, were likely completed above the water table (except for possible local perched water tables or water-bearing structures).
MGUS completed 11 reverse circulation drill holes in 2008 at the Anchor Roc prospect southeast of the Resource Area. As this drilling is outside the Resource Area, drilling methods will not be discussed further.
In 2011, MGUS completed 6 diamond drill core holes totaling 5,260 feet, and 25 reverse circulation drill holes totaling 21,000 feet; all within the Resource Area. The program was designed to confirm the geology and mineralization defined by the historic drilling and to continue to explore for mineralization in areas with more limited, but successful, historic drilling results (Figure 10-1). The drilling was completed at the time of the site visit, so operations were not observed in the field.
| April 10, 2012 | 38 | |
| Midway Gold Corp. | Drilling |
| Gold Rock Project | NI 43-101 Technical Report on Resources |
Diamond drilling in 2011 was completed by KB Drilling of Moundhouse, Nevada using a rubber track-mounted Versa KMB 1.4 drill rig, and using HQ3 tools to allow for use of split tubes. Oriented core was collected using a Reflex ACTII down-hole tool. A MGUS geologist was on-site for the core drilling, documenting core recovery, collecting geotechnical information (RQD) and boxing core. The boxed core was transported to the secure MGUS facilities in Ely, Nevada by MGUS personnel. The drill core is logged for geology, alteration, mineralization and structure, with the geologist marking sample intervals. Sample intervals are typically 5 feet in length, with breaks made for lithology changes. Following logging and marking of sample intervals, the core is photographed and then split (see Section 11 for sampling methods). Assay samples are bagged and placed in bins until ALS collects and transports submitted batches to its sample preparation and analytical facilities in Reno or Winnemucca, Nevada.
Reverse circulation drilling, for holes less than 1,000 feet in depth, was completed by O’Keefe Drilling of Butte, Montana using a buggy-mounted Prospector 750 reverse circulation drill rig. Holes deeper than 1,000 feet were completed by National Drilling of Elko, Nevada using a truck-mounted Schramm 685 rig. Both rigs employed 5.5 to 5.75 inch hammer bits. Drilling was largely above the water table. A MGUS geologist was on-site during drilling activities, collecting the geologic cuttings samples and assay samples on routine 5-foot sample intervals. Assay sample duplicates of pre-determined intervals were generated at the drill site using a Jones splitter. All cuttings samples were transported to the secure MGUS facility in Ely, Nevada by MGUS personnel. The geology cuttings samples were logged for geology, alteration and mineralization. The assay samples were deposited in bins within a secure area, and were subsequently picked up by ALS for transport to either Reno or Winnemucca, Nevada for sample preparation and analysis. Drilling methods employed in the 2011 reverse circulation drilling program were also employed in the 2008 drilling program at Anchor Roc.
All 2011drill hole collars were initially located by GPS and surveyed afterward by theodolite employing a UTM NAD 83, Zone 11 projection. Down-hole surveys for each hole were completed by International Directional Services of Elko, Nevada, using a Surface Recording Gyroscope, model DG-69. Upon completion of drilling and down-hole surveying, the holes were abandoned according to regulations, including a cement plug at the surface that secures an eye-bolt with a metal tag identifying the drill hole. The eye-bolt enables post-reclamation location of the drill hole collar through use of a metal detector.
| April 10, 2012 | 39 | |
| Midway Gold Corp. | Drilling |
| Gold Rock Project | NI 43-101 Technical Report on Resources |
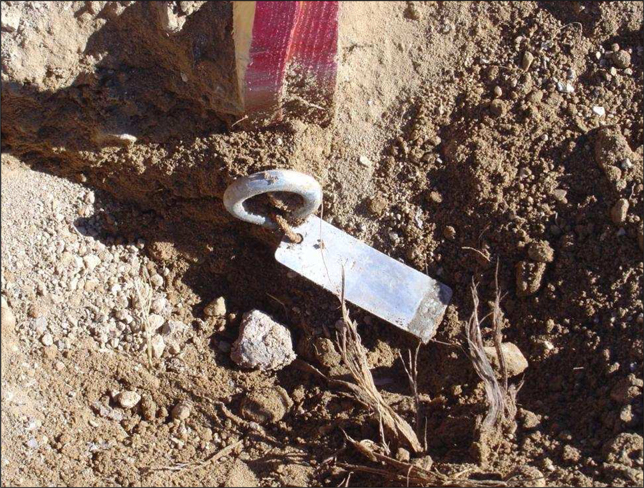
Figure 10-2 Drill Hole Collar Eye Bolt & Tag – GR11-23c
| 10.2.1 | 2011 MGUS Drilling Results |
Significant drill intercepts resulting from the 2011 MGUS program are summarized in Table 10-1, employing a 0.004 opt gold cutoff grade
| April 10, 2012 | 40 | |
| Midway Gold Corp. | Drilling |
| Gold Rock Project | NI 43-101 Technical Report on Resources |
Table 10-1 MGUS 2011 Summary Drilling Results
| MGUS 2011 - SUMMARY GOLD INTERCEPTS |
| | Average | | | Average | |
Drill Hole
# | Gold Grade
opt | Thickness & Starting Depth | Drill
Hole # | Gold Grade
opt | Thickness & Starting
Depth |
| GR11-01 | 0.013 | 125' from 375' | GR11-16 | 0.068 | 75' from 475' |
| GR11-02 | | minor thin, low grade intercepts | GR11-17 | 0.009 | 30' from 210' |
| GR11-03 | 0.024 | 60' from 280' | GR11-18 | 0.007 | 75' from 350' |
| GR11-04 | 0.025 | 40' from 455' | GR11-18 | 0.017 | 75' from 435' |
| and | 0.022 | 35' from 535' | GR11-19 | 0.019 | 25' from 375' |
| GR11-05 | 0.007 | 30' from 95' | GR11-20 | 0.008 | 15' from 295' |
| and | 0.060 | 110' from 205' | and | 0.027 | 45' from 350' |
| GR11-06 | 0.017 | 60' from 205' | GR11-21 | 0.007 | 45' from 650' |
| and | 0.017 | 40' from 290' | GR11-22 | | No significant intercepts |
| GR11-07 | 0.031 | 140' from 575' | GR11-23C | 0.043 | 153.5' from175' |
| GR11-08 | 0.013 | 95' from 220' | and | 0.018 | 40' from 615 |
| and | 0.012 | 55' from 325' | GR11-24C | | No significant intercepts |
| GR11-09 | 0.005 | 25' from 410' | GR11-25C | 0.007 | 30' from 390' |
| and | 0.004 | 15' from 455' | and | 0.021 | 99' from 430' |
| and | 0.020 | 50' from 485' | GR11-26 | 0.016 | 55' from 320' |
| GR11-10 | 0.005 | 35' from 590' | and | 0.026 | 90' from 400' |
| GR11-11 | 0.028 | 145' from 170' | GR11-27 | 0.006 | 30' from 590' |
| GR11-12 | | No significant intercepts | GR11-28 | 0.018 | 200' from 610' |
| GR11-13C | | No significant intercepts | GR11-29 | 0.046 | 80' from 630' |
| GR11-14C | 0.012 | 40' from 85' | GR11-30 | | No significant intercepts |
| and | 0.048 | 132' from 209' | GR11-31 | 0.008 | 15' from 0' |
| GR11-15C | 0.033 | 16' from 719' | | | |
| and | 0.018 | 10' from 745' | | | |
| 0.004 opt Au cutoff grade; not all thin and/or low grade intercepts tabulated, C in drill hole number = core hole; otherwise reverse circulation hole |
| 10.2.2 | 2011 MGUS Twin Holes |
Of the 31 holes completed by MGUS in 2011, there were 6 sets of twin reverse circulation – diamond drill core holes completed. One pair, GR11-12 and GR11-24c, was unsuccessful in that there was substantial down-hole directional deviation between the two holes rendering a comparison of results meaningless. The other twin holes enable a comparison of geology and assay information as derived from the two drilling techniques. The twin hole program is further discussed in Verification Section 12.
| April 10, 2012 | 41 | |
| Midway Gold Corp. | Sample Preparation Analyses and Security |
| Gold Rock Project | NI 43-101 Technical Report on Resources |
| 11. | SAMPLE PREPARATION, ANALYSES AND SECURITY |
Other than the documentation provided in the drill hole assay database and accompanying assay certificates indicating drill hole sampling on 5-foot intervals, there is little documentation of the details of sample preparation and security of samples for the historic drill sampling programs within the Resource Area. Assays were completed using a variety of laboratories and assay methods as outlined briefly below. Apart from limited repeat analyses, there is no evidence or documentation of quality control/quality assurance programs (“QA/QC”) employed by any of the companies submitting samples or the labs conducting the analyses. A few check assay programs, twin hole analyses and more routine fire assay follow-ups to anomalous cold cyanide atomic absorption analyses (“CN AA”) are documented and are discussed in Section 12: Data Verification.
| 11.1.1 | Santa Fe Analytical Methods |
In 1984 and 1985, Santa Fe completed 16 reverse circulation drill holes (EJ-1 to EJ-16) in the southern portion of the Resource Area (Table 9-1). Gold values in drill samples were reported by Chemex Labs in Reno, Nevada using neutron activation analysis. Gustavson discussed the assay technique with a number of individuals with varying recollections of the accuracy and precision of the technique – resulting in Gustavson recommending that these drill results not be included in the resource assessment.
| 11.1.2 | Tenneco/Echo Bay Analytical Methods |
Tenneco/Echo Bay employed Bondar-Clegg in Reno, Nevada for all of its assay work for drill holes EZ1 through EZ241 (1986 – 1988, Table 9-1). Scattered, but consistent documentation indicates the Bondar-Clegg analytical method was fire assay with an atomic absorption analysis (“AA”), largely of one assay ton pulp samples. It is not entirely clear whether all results were AA finishes or with gravimetric finishes. Results are reported variably as “Au opt” or “Au 30g ppb”.
| 11.1.3 | Alta Bay Joint Venture Analytical Methods |
Following formation of the Alta Bay Joint Venture in early 1988, assaying of drill samples from drill holes EZ242 through EZ445 was conducted at the Illipah Mine laboratory of Alta Bay and at the Ward and Robinson assay labs of Silver King Mines. These facilities were operated by Alta Gold (Illipah lab) or its former parent company, Silver King Mines (Robinson and Ward labs). The analyses at the Illipah lab were cold cyanide extractions of gold from pulps followed by an analysis by atomic absorption (CN AA). Follow-up fire assay analyses were conducted at Ward or Robinson, based on intervals selected as anomalous based on geology/alteration and/or anomalous CN AA results, generally above 0.007 ounces per ton gold in the CN AA assay certificates.
| April 10, 2012 | 42 | |
| Midway Gold Corp. | Sample Preparation Analyses and Security |
| Gold Rock Project | NI 43-101 Technical Report on Resources |
| 11.1.4 | Alta Bay Joint Venture Analytical Methods |
Production from the Easy Junior mine was initiated in 1989. Assay of drill holes EZ446 through EZ521 was completed by CN AA at either the Illipah mine or the Easy Junior mine, with follow-up fire assay analysis at either the Ward or Robinson labs.
| 11.1.5 | Alta Gold Analytical Methods |
Following its acquisition of Echo Bay’s interest in the Alta Bay Joint Venture in 1992, Alta Gold resumed exploration and development drilling, completing drill holes EZ522 through EZ546. Documentation for drill holes EZ522 through EZ527 was not found – these holes are believed to have been drilled outside the Resource Area. Analytical work on drill samples from drill holes EZ528 through EZ546 was completed by fire assay at American Assay in Reno, Nevada.
Split diamond drill core and reverse circulation cuttings samples collected by MGUS in its 2011 program in the Resource Area from drill holes GR11-01 through GR11-31 were submitted to ALS Minerals in Reno or Winnemucca, Nevada for sample preparation and fire assay analysis of a 30g sample with an AA finish (ALS code: Au – AA23). All samples were also analyzed for a 35 element suite using an aqua regia digestion and analysis by ICP-AES (ALS code: ME-ICP41). Sample preparation was consistent, with full samples as received by ALS fine crushed to 70% <2mm, and a split of the fine crushed material pulverized to 85% <75 um.
MGUS conducted a relatively consistent QA/QC program; inserting standard, duplicate and blank samples into the sample numbering sequence with each submitted order at a combined rate of approximately 10% (drill holes GR11-01 through GR11-10 did not include duplicate samples). MGUS’ QA/QC protocol required re-analysis of specific samples, sample number ranges or entire sample submittals that exceeded the failure criteria.
| 11.2.1 | MGUS Standard Sample Analyses |
MGUS submitted commercial standards as pulps inserted within the sample numbering scheme at the rate of approximately 4%. Three certified standards were employed, all provided by Ore Research & Exploration Pty Ltd of Australia (OREAS). These same standards had been used in MGUS’ recent drilling program at the nearby Pan project, with samples also being submitted for analysis by ALS. Assay results on standards in the following plots are referenced against the certified mean and the failure threshold established using the two standard deviation range determined by the statistics developed from the analyses during the Pan project drilling (Figures 11-1, 11-2, 11-3). The standards are received from OREAS as pre-packaged pulps, and therefore are useful in determining the accuracy and precision of the ALS assaying procedure, but cannot be used to assess potential contamination in the sample preparation process involving crushing and pulverization.
| April 10, 2012 | 43 | |
| Midway Gold Corp. | Sample Preparation Analyses and Security |
| Gold Rock Project | NI 43-101 Technical Report on Resources |
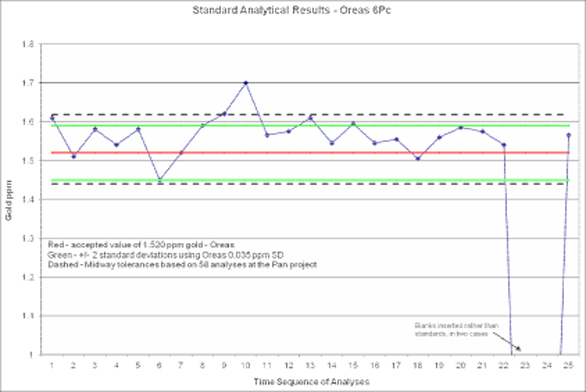
Figure 11-1 Standard Analytical Results – Oreas 6 Pc

Figure 11-2 Standard Analytical Results – Oreas 2 Pd
| April 10, 2012 | 44 | |
| Midway Gold Corp. | Sample Preparation Analyses and Security |
| Gold Rock Project | NI 43-101 Technical Report on Resources |
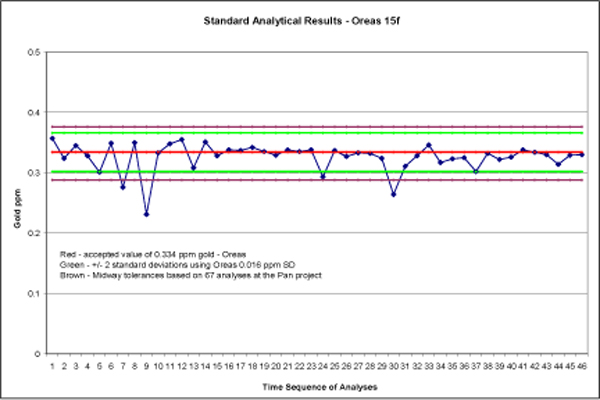
Figure 11-3 Standard Analytical Results – Oreas 15f
As indicated previously, standard failures are reviewed in context with the analytical results on unknowns within the sample batch (potential mineralization of interest, or non-mineralized), with the analytical results on other standards and blanks inserted into the same sample batch, and with the analytical results on the internal ALS QA/QC program. The results of the reviews are considered in context with the protocols established by MGUS, and corrective/reanalysis actions are taken as necessary.
| 11.2.2 | MGUS Blank Sample Analyses |
MGUS submitted crushed marble as blank material for analysis, inserted at the rate of approximately 3%. The marble occurs as approximately 1 to 2 inch diameter pieces which are inserted into the sample numbering sequence in a given sample batch. Analytical results are displayed graphically in Figure 11-4. The blank material is of sufficient size that it is processed through the full sample preparation procedure at ALS, thereby serving as a gauge of potential contamination in the crushing and pulverizing stages of sample preparation. Blank sample analytical failures are considered in the contexts mentioned above. Three blanks lie at the failure threshold of 15 parts per billion, but corrective actions within the sample batches were not considered necessary. Overall the blank sample analysis was well within industry standards.
| April 10, 2012 | 45 | |
| Midway Gold Corp. | Sample Preparation Analyses and Security |
| Gold Rock Project | NI 43-101 Technical Report on Resources |
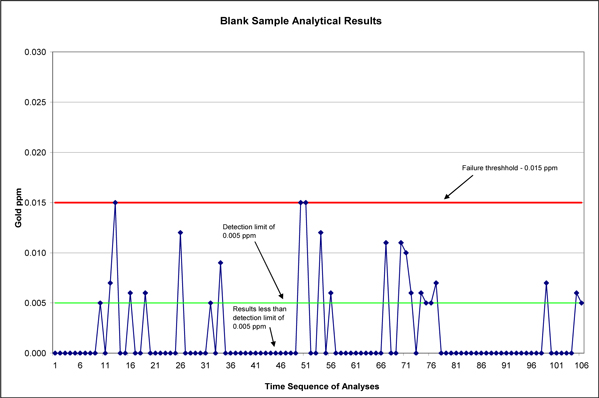
Figure 11-4 Blank Sample Analytical Results
| 11.2.3 | MGUS Duplicate Sample Analyses |
MGUS inserted duplicate samples of unknowns into the numbering sequence of sample batches at the rate of approximately 3% (duplicate samples were not generated for reverse circulation drill holes GR11-01 through GR11-09). Duplicate samples for reverse circulation drill holes were generated on-site at the drill rig by splitting samples using a Jones splitter and bagging each split as a separate sample in number sequence. These samples provide an overall check on the entire sampling, sample preparation and analytical process while also being subject to sample heterogeneity, if any. Diamond drill core samples were submitted to ALS with directions for the lab to split specific samples and prepare separate pulps for each split to generate sample duplicates. The core sample duplicates thereby test the lab sample splitting, pulverization and analytical processes.
Analytical results on duplicate samples, including both reverse circulation and diamond drill core samples, are presented in Figures 11-5 and 11-6. Figure 11-5 is a conventional scatter plot showing the least squares regression line and corresponding R2of 95.4% - the slope and correlation of data are strongly influenced by the limited number of analyses with better average gold grades. Figure 11-6 compares the difference in gold grade for the pair of duplicate analyses from the mean of the two assays. Reference lines of 10% and 15% difference demonstrate that except for one data point, duplicate samples above 0.1 ppm produce reasonable results. Below 0.1 ppm, and as the detection limit is approached at 5 parts per billion, sample comparisons remain in reasonable agreement, but are of practical lesser importance. MGUS has taken corrective action relative to the poor comparison on the one sample pair.
| April 10, 2012 | 46 | |
| Midway Gold Corp. | Sample Preparation Analyses and Security |
| Gold Rock Project | NI 43-101 Technical Report on Resources |

Figure 11-5 MGUS Drill Sample Duplicates
| April 10, 2012 | 47 | |
| Midway Gold Corp. | Sample Preparation Analyses and Security |
| Gold Rock Project | NI 43-101 Technical Report on Resources |

Figure 11-6 Duplicate Sample Analysis
Gustavson cannot comment on the adequacy of sample preparation and security for the historic reverse circulation drilling programs as there is insufficient documentation upon which to base an opinion. Neutron activation and CN AA analyses are not considered of sufficient quality for resource estimates for Gold Rock and are not included in the database used in generating the resource estimate in this report (see Verification Section 12). Fire assays conducted by Bondar-Clegg, and the Robinson and Ward laboratories are appropriate assay techniques. Limited documentation indicates the Bondar-Clegg programs were conducted by fire assay of 1 assay ton samples which was the higher end standard at the time. There is insufficient documentation of the sample size for the samples assayed at the Robinson and Ward laboratories. Limited inter-laboratory analyses of the same samples indicate overall favorable comparisons of results, except that the fire assay results from the Ward laboratory appear biased to higher gold values (see Verification Section 12).
Gustavson concludes that the MGUS sample preparation, QA/QC, analytical approaches and sample security are all of high quality and adequate to enable use of the analytical results in the resource estimate conducted for this report.
| April 10, 2012 | 48 | |
| Midway Gold Corp. | Data Verification |
| Gold Rock Project | NI 43-101 Technical Report on Resources |
Gustavson conducted an on-site visit to the Gold Rock property during the period January 12 – 14, 2012 (Donald J. Baker), and reviewed available hard copy and electronic historic records and the records of the MGUS 2011 drilling program. The site visit included approximately one day in the field at the project site to verify geology, confirm the location of historic drill sites and survey points, and to confirm the existence and location of drill holes completed by MGUS in 2011. One and a half days were spent in the MGUS office in Ely, Nevada, reviewing hard copy files, reports and maps and cross sections. Copies of certain assay certificates and other documents and files were obtained for continuing review and analysis of the project data following the site visit.
| 12.1 | Historic Data Verification |
A large volume of historic information was developed by the previous operators of the Easy Junior property, which included Santa Fe Minerals, Tenneco/Echo Bay, the Alta Bay Joint Venture and Alta Gold. The information includes a large drill hole database as well as blast hole information developed during the operation of the Easy Junior mine. Verification of the various aspects of the historic database was considered critical to the ongoing evaluation of the project and was considered requisite to enable MGUS to include the historic results in the estimate of resources compiled in this report.
| 12.1.1 | Drill Hole Locations |
Drill hole collar coordinates for historic holes were compiled by MGUS and compared among several sources of information including drill hole geologic logs, surveyor notes, project maps and drill hole location tables. These locations were cross validated with a nearly comprehensive historic computer printout of drill hole information. Drill holes for which the cross validation resulted in imprecise locations or for which there was conflicting information from two or more sources were eliminated from the database for purposes of the resource estimates generated in this report.
A number of original, dated surveyor notebooks document the location of some drill holes and consistently utilize a number of survey control points located in various positions across the project area. Several of the control points were located in the field, and were used to establish that the original survey projection of the historic drill holes was Nevada State Plane East, NAD27. The drill hole collar database was transformed into the presently used NAD 1983 UTM, Zone 11 North, and plotted on detailed aerial imagery. Historic drill collar locations were found to match disturbances remaining from past drill roads and drill pads. During its field visit, Gustavson verified the location of three primary survey control points (Figure 12-1) and visited a number of historic drill sites located on the aerial imagery. The plotted drill collars coincided with relict traces of drill roads and drill sites, and were further evidenced by piles of reverse circulation drill cuttings (Figure 12-2). GPS readings taken during the surface tour were transformed to Nevada State Plane East, NAD27, and were essentially identical to those posted for the survey control points in the historic, dated surveyor notebooks.
| April 10, 2012 | 49 | |
| Midway Gold Corp. | Data Verification |
| Gold Rock Project | NI 43-101 Technical Report on Resources |
��
Drill hole collar elevations of the transformed drill hole data file were compared against topographic maps where mining disturbances (open pit, waste piles and heap leach pad) have not changed the original ground surface. Outside the mine area, the topographic maps available use the 7 ½ minute quadrangle topography established and published by the U.S. Geological Survey. Collar elevations of five drill holes in an area north of the Easy Junior open pit do not conform to the topographic surface, with collars in the database (original survey data) consistently above the ground surface as indicated on the topographic map (11.7 to 33.4 feet). Follow up ground GPS checks by MGUS, using a sub-meter unit continue to indicate a differential between the collar elevations and elevations on the topographic maps with drill hole collars at even greater elevation above the topographic map (19.0 to 41.1 feet). While only a few drill holes are involved, these remain in the database since the topographic map accuracy is in question. This issue is summarized again in the Conclusions and Interpretations section (Section 25), and is targeted in the recommendations section (Section 26).
Drill hole collar elevations in disturbed areas appear to define a reasonable pre-mining, pre-disturbance topography.
Gustavson concludes that the historic drill hole locations are known quite accurately, and, in concert with the assay verification below, can be included in the database utilized in this report to estimate mineral resources.
| April 10, 2012 | 50 | |
| Midway Gold Corp. | Data Verification |
| Gold Rock Project | NI 43-101 Technical Report on Resources |

Figure 12-1 Historic Survey Point “Juan”

Figure 12-2 Drill Cuttings and Labeled Post – Drill Hole EZ14-86
| April 10, 2012 | 51 | |
| Midway Gold Corp. | Data Verification |
| Gold Rock Project | NI 43-101 Technical Report on Resources |
Hard copies of historic data, stored in MGUS’ Ely office, are compiled by drill hole number in a large number of three-ring binders labeled by drill hole number range. The binders contain geologic logs and assay certificates from the various laboratories used through the long life of the project (Section 11.1).
| · | Gustavson verified the following (see Section 11.1 for companies corresponding with the drill hole listings): |
| · | Assay certificates for drill holes EJ-1 through EJ-3; EJ-6 through EJ-13; and EJ-15 and EJ-16; |
| · | Assay certificates for drill holes EZ1-86 through EZ521-89; and EZ528-89 through EZ546-89; and, |
| · | Geologic logs with hand entered assays for all of the above drill holes. |
Gustavson also compiled the assay methods and laboratories used for the drill holes above, and verified that the MGUS electronic database presents an accurate compilation of the assay record by assay type and laboratory. Gustavson randomly selected 100 drill holes and compared assays on assay certificates with entries in the MGUS database. This included comparison of all assay types completed for the holes selected. This review totaled approximately 6,000 5-foot intervals, many with multiple assay types. There were 8 entry errors noted, that were corrected by MGUS – an error rate of less than 0.1% when all assay types are considered.
As mentioned in Section 11.1.1, Santa Fe drill hole samples were assayed for gold using neutron activation analysis through Chemex Labs. Uncertainties as to the reliability of these assays led Gustavson to conclude that the Santa Fe drill holes (EJ series) should not be included in the database used for generation of the resource estimates contained in this report.
Drill holes EZ242-88 through EZ521-89 were routinely assayed by atomic absorption analysis of cold cyanide extractions (CN AA), with select intervals submitted for fire assay. Gustavson compared the CN AA results with the fire assays completed at the Robinson and/or Ward laboratories and concludes that the CN AA results are statistically lower than comparable fire assay results; and that the CN AA results have wide variability (Figure 12-3). In the gold grade range analyzed, the mean of the fire assay results is 0.027 opt gold, and the CN AA mean is 0.021 opt gold; or 11.9% difference from the mean of the two data sets (CN AA 21.3% less than corresponding fire assay results).
| April 10, 2012 | 52 | |
| Midway Gold Corp. | Data Verification |
| Gold Rock Project | NI 43-101 Technical Report on Resources |
Gustavson concludes that the drill hole intervals with samples for which only CN AA results are available should be included in the database for purposes of generating the resource estimate contained in this report, and will, in general, understate gold values and result in a conservative lower average gold grade, and will underestimate tonnage above cutoff grade. Fire assay results from the Robinson laboratory were used for sample intervals where both CN AA and fire assay results were available. The Ward laboratory fire assays were biased to higher gold values compared to fire assays from other laboratories (see Check Assay Programs, Section 12.1.2.1, below), and were excluded from the database for purposes of generating the resource estimates in this report.
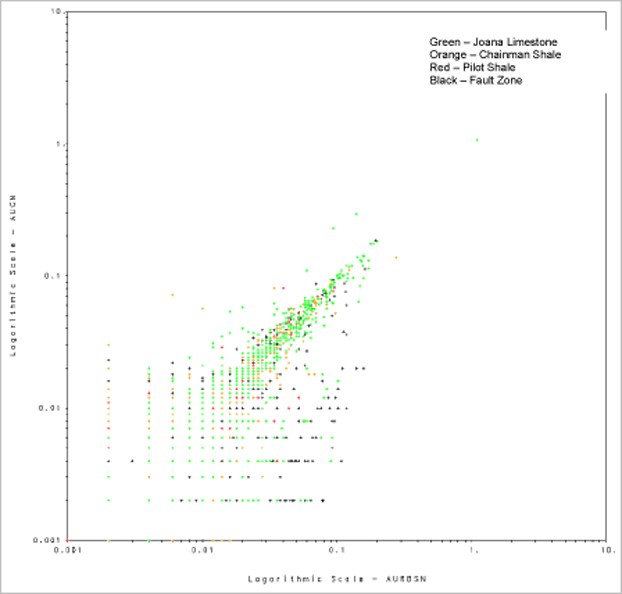
Figure 12-3 Fire Assay vs Cyanide Assay
| April 10, 2012 | 53 | |
| Midway Gold Corp. | Data Verification |
| Gold Rock Project | NI 43-101 Technical Report on Resources |
| 12.1.2.1 | Check Assay Programs |
Several check assay programs were conducted in the late 1980’s and early 1990’s. Bondar-Clegg (January 25, 1988) reported a bias in gold fire assay results on 167 sample intervals that were also assayed by Chemex Labs. The least squares regression fit to the data indicated a slope of 0.973, with Chemex assays reporting slightly higher gold values, on average, than Bondar-Clegg. In response to this study, Bondar-Clegg initiated a round-robin analysis program on 16 composite samples generated from pulps from Easy Junior. Splits were provided to Hunter Labs in Reno, Nevada, Skyline Labs in Denver, Colorado, and Rocky Mountain Geochemical in Salt Lake City, Utah for analysis of 1 assay ton samples by fire assay. Bondar-Clegg assayed the same composites by fire assay, using gravimetric and atomic absorption finishes on separate splits. Least squares regression analysis of the Bondar-Clegg results as compared with average assays for the three other labs indicated the Bondar-Clegg results, by either assay method, were in excellent agreement with the other labs.
Hard copy tabulations in the historic files document a check assay program comparing fire assay results among the Robinson, Ward, Bondar-Clegg and Chemex labs on 193 sample intervals from drill holes EZ407-89 and EZ414-89. There were no assay certificates in the files documenting the reports from the labs used in the study and therefore this check assay program is not fully verified. Furthermore, there is no documentation of the sample preparation protocols for the study. Nonetheless, the results are compiled and discussed herein since the study demonstrates the possible assay confidence as compared across the labs used over time at Easy Junior.
The program results are summarized in Table 12-1, and in the following three figures (Figures 12-4, 12-5 and 12-6) in which results from each of the Robinson, Ward and Chemex labs are compared to the Bondar-Clegg results.
Table 12-1 Assay Results – 1989 (opt gold)
| | Robinson | Ward | Bondar-Clegg | Chemex | Mean of 4 labs |
| All samples* | 0.011 | 0.013 | 0.012 | 0.011 | 0.012 |
| ** | -6.0% | 8.2% | 3.3% | -5.5% | |
| >=0.006 opt | 0.016 | 0.018 | 0.018 | 0.016 | 0.017 |
| ** | -4.8% | 3.8% | 4.9% | -3.8% | |
* Samples below detection limit of 0.002 opt assigned a value of 0.001 opt for all labs
** % difference from mean
| April 10, 2012 | 54 | |
| Midway Gold Corp. | Data Verification |
| Gold Rock Project | NI 43-101 Technical Report on Resources |
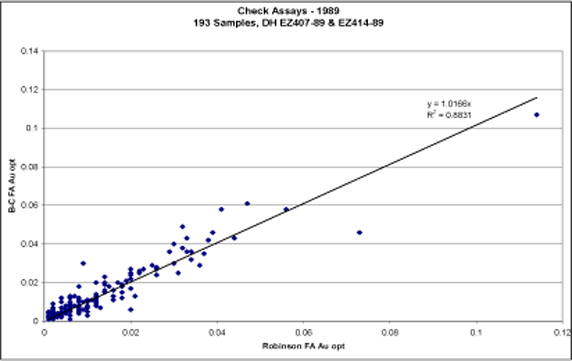
Figure 12-4 Robinson – Bondar-Clegg Check Assays

Figure 12-5 Ward – Bondar-Clegg Check Assays
| April 10, 2012 | 55 | |
| Midway Gold Corp. | Data Verification |
| Gold Rock Project | NI 43-101 Technical Report on Resources |
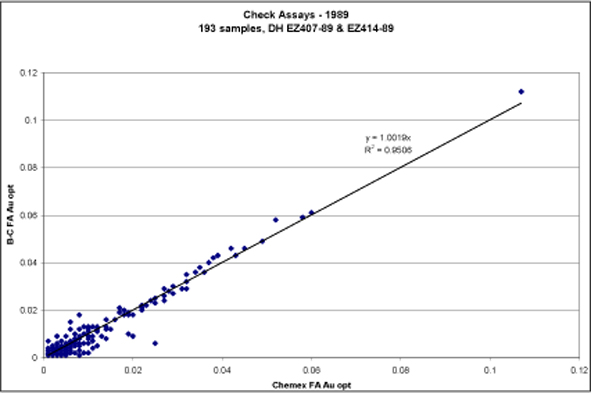
Figure 12-6 Chemex – Bondar-Clegg Check Assays
The tabulated results (Table 12-1), especially for all samples equal to or greater than 0.006 opt gold, indicate all labs are within +/-5% of the mean of the four labs, a reasonable check assay outcome. The plotted comparisons among the labs suggest that there is more variability in the fire assays derived from the Robinson and Ward labs (lower R2, as compared to Chemex and assuming Bondar-Clegg as a common comparison for all). The Robinson and Chemex results appear largely unbiased as compared to Bondar-Clegg, but the Ward lab data appear somewhat biased to higher gold assays as compared to Bondar-Clegg. So as not to bias the resource estimate with the Ward laboratory assays, the Ward fire assays were excluded from the database for purposes of generating the resource estimates in this report. CN AA results for the intervals covered by the Ward fire assay results were used in the resource model, thereby biasing the database toward lower, more conservative assay results. Gustavson is of the opinion that the assay database is of adequate quality for use in generating indicated and inferred resources. Further comments on these results are provided in the conclusions and recommendations sections (Sections 25 and 26).
An additional check assay program was documented in the hard copy files, dated April 20, 1994, compiling results of a comparison between American Assay labs (1994) and Bondar-Clegg (1987) on a small number of samples (28) from drill holes EZ43-87 and EZ54-87. The original assay values from the Bondar-Clegg work are verified from the assay certificates in the files. There were no assay certificates for the American Assay labs analyses. Also, there is no documentation of the samples or sample preparation used to generate the pulps used in the American Assay labs re-assay program. This check assay program is not fully verified.
| April 10, 2012 | 56 | |
| Midway Gold Corp. | Data Verification |
| Gold Rock Project | NI 43-101 Technical Report on Resources |
The comparison of the results from American Assay as compared with the original Bondar-Clegg assays is presented in Figure 12-7. Within the limits of a small database, and especially in consideration of the small number of samples with gold values in excess of 100 ppb, the results are unbiased, but there is significant variability between the results from the two labs. Without documentation regarding the samples used (same pulps, for instance), the data cannot be relied upon for wide-reaching conclusions.
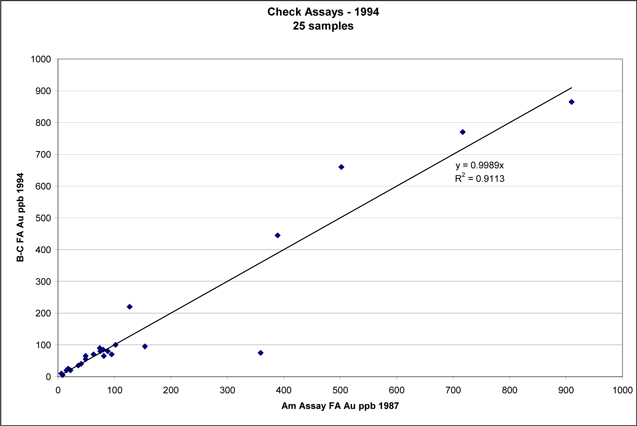
Figure 12-7 American Assay – Bondar-Clegg Check Assays
| 12.1.2.2 | Twin Hole Programs |
A twin hole program was documented in the historic files in the MGUS Ely office. The results were hand tabulated, but utilized drill holes for which there are assay certificates. The four pairs of drill holes contrast earlier drill holes assayed by fire assay by Bondar-Clegg, with later drill holes assayed by fire assay by the Robinson lab. A portion of drill hole EZ390-88 was assayed only by CN AA methods – these values were not included in the plot (Figure 12-8). All holes were vertical and were drilled by reverse circulation methods. The spacings between holes in each pair were as follows:
| April 10, 2012 | 57 | |
| Midway Gold Corp. | Data Verification |
| Gold Rock Project | NI 43-101 Technical Report on Resources |
| · | EZ74-87 and EZ390-88 | 4.7 feet |
| · | EZ69-87 and EZ 364-88 | 7.1 feet |
| · | EZ140-87 and EZ368-88 | 10.6 feet |
| · | EZ167-87 and EZ376-88 | 9.3 feet |
Assay versus depth-in-hole plots are provided in Figures 12-8 through 12-11. Assays are plotted as moving average gold values using three 5-foot assay intervals. Assays in the older holes (black data points and lines) were fire assays completed by Bondar-Clegg; and in the more recent historical holes (red data points and lines) were fire assays completed at the Robinson laboratory.
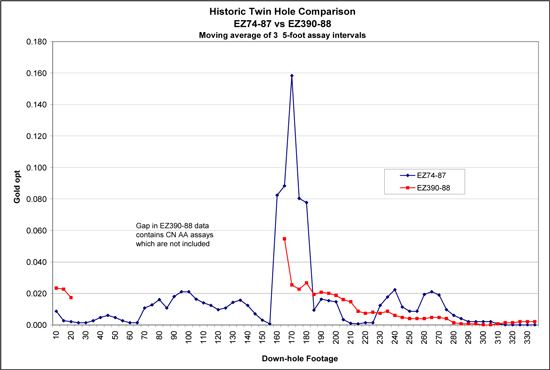
Figure 12-8 Twin Hole Comparison EZ74-87 and EZ390-88
| April 10, 2012 | 58 | |
| Midway Gold Corp. | Data Verification |
| Gold Rock Project | NI 43-101 Technical Report on Resources |
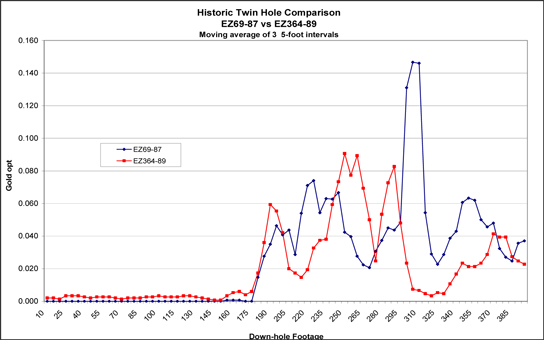
Figure 12-9 Twin Hole Comparison EZ69-87 and EZ364-89
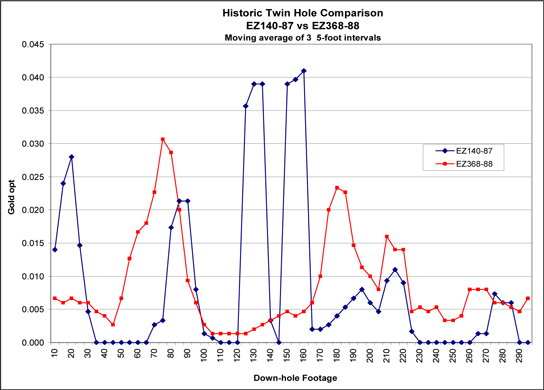
Figure 12-10 Twin Hole Comparison EZ140-87 and EZ368-88
| April 10, 2012 | 59 | |
| Midway Gold Corp. | Data Verification |
| Gold Rock Project | NI 43-101 Technical Report on Resources |
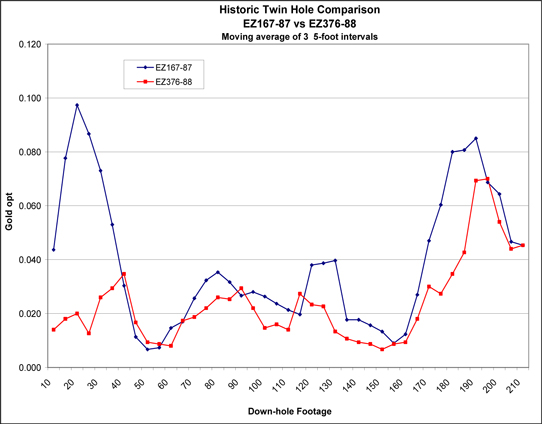
Figure 12-11 Twin Hole Comparison EZ167-87 and EZ376-88
There is considerable variation in the twin hole comparisons, with patterns of gold distribution locally comparing well (Figures 12-8, 12-9, and 12-11) and not comparable in some portions of mineralized zones or some pairs of holes (Figure 12-10). While not perfect comparisons, the general patterns of overall gold distribution are similar. Separation between the drill hole intercepts at depth are not known as none of the historic drill holes were surveyed down-hole. Minor variations in spacing at depth can lead to substantially different thicknesses and grade of mineralized intervals, depending on where in the anticlinal structure the penetrations are completed.
Gustavson is of the opinion that the historic drill hole location data and associated geologic and assay database, except for the assays conducted by neutron activation and fire assays from the Ward laboratory, are of sufficient quality for inclusion in the estimate of indicated and inferred mineral resources contained in this report.
| April 10, 2012 | 60 | |
| Midway Gold Corp. | Data Verification |
| Gold Rock Project | NI 43-101 Technical Report on Resources |
| 12.2 | MGUS Data Verification |
| 12.2.1 | Drill Hole Locations |
Drill hole collar locations for the 2011 MGUS drilling program were verified in the field tour. Most drill sites are reclaimed, so exact locations on the drill pad could not always be discerned. Collars with a cemented eye bolt and metal tag labeled with the drill hole number were observed at approximately one-third of the sites. MGUS located collar sites initially with a GPS system. Upon conclusion of drilling the collar coordinates are determined by theodolite. Both surveys are documented in the drill hole logs in both hard copy and electronic formats.
Assay certificates for the 2011 drilling program were reviewed by Gustavson and compared to entries in the MGUS database. There were no errors encountered.
| 12.2.3 | Check Assay Programs |
MGUS did not conduct formal check assay programs using additional laboratories for samples generated in the 2011 drilling program.
None of the drill holes completed by MGUS in its 2011 program were designed as true twins of historic drill holes. The MGUS program was, however, designed as a series of angle holes drilled within areas which were grid-drilled in vertical holes by previous operators. In its angle hole program, MGUS drilled several twinned reverse circulation and diamond drill core holes.
| 12.2.4.1 | MGUS – Historic Drill Hole Confirmation Program |
Using geologic cross sections and drill hole plan maps, Gustavson selected historic drill holes in close proximity to mineralized intercepts in MGUS reverse circulation holes for comparison of assay results. Historic holes were selected such that the geologic positions relative to the MGUS intercepts were similar. For instance, historic intercepts on the east limb of the anticline were not used in comparison with MGUS intercepts on the west limb of the anticline. Also, since the historic and MGUS holes were drilled at different angles, the lengths of intercepts were considered not directly comparable, but that the tenor of mineralization could be compared. Two sets of comparisons were made: one comparing MGUS drill intercepts with those historic holes assayed by Bondar-Clegg (Figure 12-12); the other comparing MGUS drill intercepts with historic drill holes for which assaying was completed by the Robinson or Ward laboratories (Figure 12-13). The compiled mineralized intervals were calculated using a 0.004 opt gold cutoff grade, with internal waste of no more than one assay interval in length. For some drill holes there were two mineralized intervals that correlated between holes that were separately compared. Fire assays completed by the Robinson or Ward laboratories were follow-ups on mineralized intervals defined by CN AA analyses and/or geologic positions determined by geologic logging. The fire assays are therefore potentially incomplete within the overall mineralized interval since many samples with CN AA results below 0.007 opt gold were not submitted for fire assay. Gustavson’s analysis indicates that the CN AA results, on average, understate and show considerable variation compared to duplicate fire assay values for any given interval – suggesting that lower grade portions of mineralized intervals as determined by CN AA analysis (<0.007 opt ) were not submitted for follow-up fire assay.
| April 10, 2012 | 61 | |
| Midway Gold Corp. | Data Verification |
| Gold Rock Project | NI 43-101 Technical Report on Resources |
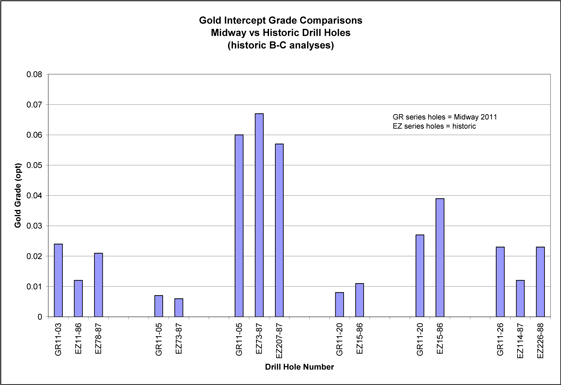
Figure 12-12 Gold Intercept Grade Comparisons MGUS vs. Historic Drill Holes
| April 10, 2012 | 62 | |
| Midway Gold Corp. | Data Verification |
| Gold Rock Project | NI 43-101 Technical Report on Resources |
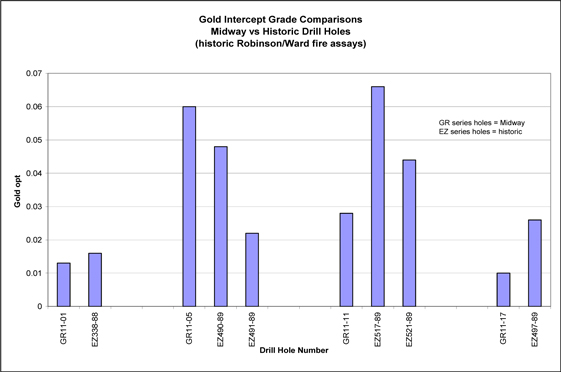
Figure 12-13 Gold Intercept Grade Comparisons MGUS vs. Historic Drill Holes
The gold mineralized intercepts in the MGUS drill holes compare well, in general terms, with the tenor of mineralization in nearby historic drill holes with gold determinations made by Bondar-Clegg (Figure 12-12), which were completed over the entire length of the historic drill holes. Note that drill hole EZ73-87 was terminated in mineralization.
The comparisons in Figure 12-13 are less compelling, perhaps due to the CN AA – fire assay issue discussed above, whereby portions of mineralized intervals were in the historic holes were not submitted for analysis by fire assay. Note that drill hole EZ521-89 was terminated in mineralization.
The data plotted in Figures 12-12 and 12-13 also demonstrate the variability in gold tenor in historic drill holes in close proximity to one another as indicated in the cases where the MGUS gold intercept average grade is compared against two nearby historic intercepts. From this viewpoint, the tenor of the MGUS intercepts does not stand out as notably high or low compared to the historic results. Gustavson is of the opinion that the results of this analysis provide further support to the verification of the historic drill hole database, having confirmed the subsurface geology as defined by the historic drilling, and the tenor of gold mineralization reported in the historic assay database.
| April 10, 2012 | 63 | |
| Midway Gold Corp. | Data Verification |
| Gold Rock Project | NI 43-101 Technical Report on Resources |
| 12.2.4.2 | MGUS – Core-Reverse Circulation Twin Hole Program |
Assay intervals and gold grades correspond reasonably well in paired reverse circulation – diamond drill holes where the holes remained in close proximity at depth, through the mineralized zones. In Figures 12-14, 12-15 and 12-16, the centers of the main mineralized zone intercepted in each hole were spaced at approximately 38 feet, 35 feet and 30 feet, respectively; and intercepted comparable geology and gold grade.
Gustavson believes the twin hole comparison between reverse circulation and diamond drill holes is reasonable for those holes that maintained close proximity in mineralized intercepts at depth. The MGUS drilling results also verified the subsurface geology and structure defined by the historic drilling and the tenor of gold mineralization encountered historically.
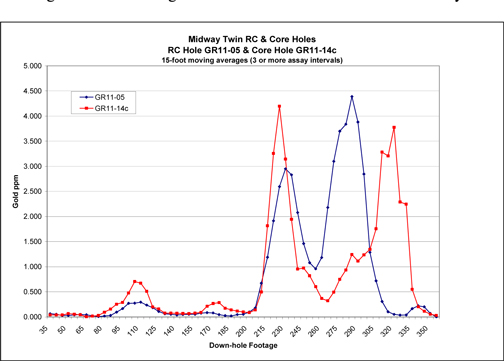
Figure 12-14 MGUS Twin Holes – RC GR11-05 and Core GR11-14c
| April 10, 2012 | 64 | |
| Midway Gold Corp. | Data Verification |
| Gold Rock Project | NI 43-101 Technical Report on Resources |
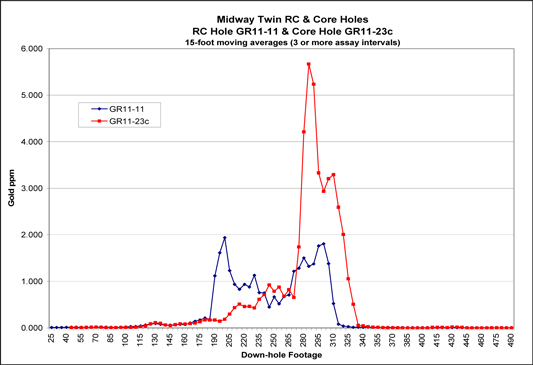
Figure 12-15 MGUS Twin Holes – RC GR11-11 & Core GR11-23c
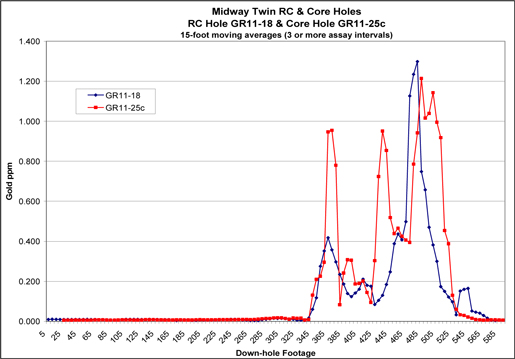
Figure 12-16 MGUS Twin Holes – RC GR11-18 & Core GR11-25c
| April 10, 2012 | 65 | |
| Midway Gold Corp. | Mineral Processing and Metallurgical Testing |
| Gold Rock Project | NI 43-101 Technical Report on Resources |
| 13. | MINERAL PROCESSING AND METALLURGICAL TESTING |
No mineral processing or metallurgical testing has been conducted in association with historic data from the Gold Rock Project. Metallurgical testing of MGUS drilled core is currently underway.
| April 10, 2012 | 66 | |
| Midway Gold Corp. | Mineral Resource Estimate |
| Gold Rock Project | NI 43-101 Technical Report on Resources |
| 14. | MINERAL RESOURCE ESTIMATE |
The mineral resource estimate reported for the Gold Rock project, as of, February 29, 2012, was completed by Zachary J. Black, E.I.T., Gustavson Staff Geological Engineer, under the supervision of Donald E. Hulse, P.E., Vice President. This mineral resource estimate is compliant with NI 43-101 and CIM Definition Standards.
| 14.1 | Data Used for Gold Grade Estimation |
Gustavson Associates created a 3 dimensional block model for estimating mineral resources at the Gold Rock Project from data provided by MGUS. Drill hole data including collar coordinates, MGUS surveys, sample assay intervals, and geologic logs were provided in a secure Microsoft Access database. Geology surface maps and cross-sections detailing lithology and structures were also provided in electronic format.
The drill hole database used for the modeling and estimation of block gold grades at the Gold Rock Project contains 483 drill holes. A portion of this drill hole data lies outside of the Gold Rock Property boundary, but was used to model the geology and influence the interpolation of block gold grades. The portion of the block model within the property boundary contains 466 drill holes; 31 MGUS drill holes, and 435 historic drill holes.
The Gold Rock drill hole database contains gold assay analytical information on 38,662 sample intervals, with assay results by fire assay and cyanide digestion stored separately. As a subset of this total database, 25,089 samples contain fire assay data, and 16,731 contain cyanide assay data. Of the cyanide assay data, 3,158 are paired with fire assay results, providing an indication of associated gold recovery, though at a very fine grind. Cyanide assay data only is available for another 13,573 samples.
Gustavson modeled the Chainman shale, Joana limestone, Pilot shale, and a fault zone using the information provided by MGUS. Figure 14-1 illustrates the cross-sectional geometry of the geology as interpreted from drilling. A steep west-dipping fault cuts the west side of a north-trending anticline. Mineralizing fluids deposited gold both within the fault zone and in the Joana Limestone and surrounding rocks at the apex of the Easy Junior Anticline.
The geological model was divided into 6 domains; the Fault Zone, Joana Limestone, Chainman Shale, Pilot Shale, Alluvium, and the Mined Out Volume. The domains were constrained to an individual formation to prevent the fire assay samples in the Joana limestone unit from influencing the lower grade cyanide assays found in the shales down the extension of the anticlinal limbs.
| April 10, 2012 | 67 | |
| Midway Gold Corp. | Mineral Resource Estimate |
| Gold Rock Project | NI 43-101 Technical Report on Resources |
Solids representing the domains were used to assign rock codes to the block model and drill holes. The individual blocks and drill hole intercepts were assigned integer codes according to whether they occur within the Chainman Shale, Joana Limestone, Pilot Shale, Fault Zone, Alluvium, or the Mined Out Volume. The codes were assigned based on the percentage of the block or sample within the solid. Table 14-1 identifies the estimation domains, the integer code, and the descriptive statistics of the samples with the associated code.
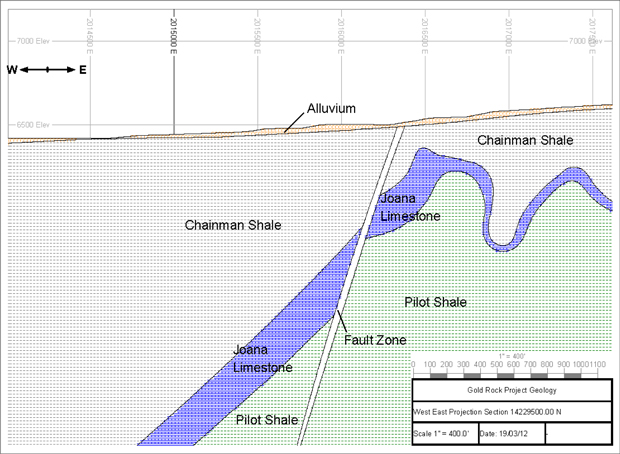
Figure 14-1 Gold Rock Cross Section Geology and Estimation Domains
| April 10, 2012 | 68 | |
| Midway Gold Corp. | Mineral Resource Estimate |
| Gold Rock Project | NI 43-101 Technical Report on Resources |
Table 14-1 Gold Rock Drill Hole Sample Statistics
| Gold Rock Domain Fire Assay Statistics (Au ≥ 0.001 opt) |
| Domain | Code | Number | Max | Mean | Std. Dev. | COV |
| Mined Out | 0 | 2853 | 0.647 | 0.021 | 0.034 | 1.58 |
| Alluvium | 5 | 34 | 0.021 | 0.004 | 0.004 | 1.04 |
| Joana Limestone | 10-11 | 3349 | 1.104 | 0.024 | 0.034 | 1.43 |
| Chainman Shale | 20-21 | 2704 | 0.276 | 0.013 | 0.021 | 1.67 |
| Pilot Shale | 30-31 | 507 | 0.140 | 0.012 | 0.019 | 1.53 |
| Fault Zone | 99 | 1484 | 0.439 | 0.020 | 0.029 | 1.47 |
| ALL | — | 10931 | 1.104 | 0.019 | 0.030 | 1.57 |
| | | | | | | |
| Gold Rock Domain Cyanide Assay Statistics (Au ≥ 0.001 opt) |
| Domain | Code | Number | Max | Mean | Std. Dev. | COV |
| Mined Out | 0 | 570 | 0.440 | 0.019 | 0.037 | 1.92 |
| Alluvium | 5 | 61 | 0.022 | 0.003 | 0.003 | 1.13 |
| Joana Limestone | 10-11 | 1384 | 1.072 | 0.017 | 0.038 | 2.22 |
| Chainman Shale | 20-21 | 1781 | 0.600 | 0.008 | 0.018 | 2.41 |
| Pilot Shale | 30-31 | 350 | 0.097 | 0.006 | 0.013 | 1.94 |
| Fault Zone | 99 | 527 | 0.186 | 0.013 | 0.019 | 1.48 |
| ALL | — | 4673 | 1.072 | 0.012 | 0.028 | 2.30 |
Cumulative Frequency Plots (CFPs) of each of the domains were created and used to cap gold values. Each CFP was evaluated to identify the grade of the samples at which point there was no longer any support for the individual sample grades. A cap of 0.26 opt was applied to all domains (Figure 14-2).
| April 10, 2012 | 69 | |
| Midway Gold Corp. | Mineral Resource Estimate |
| Gold Rock Project | NI 43-101 Technical Report on Resources |
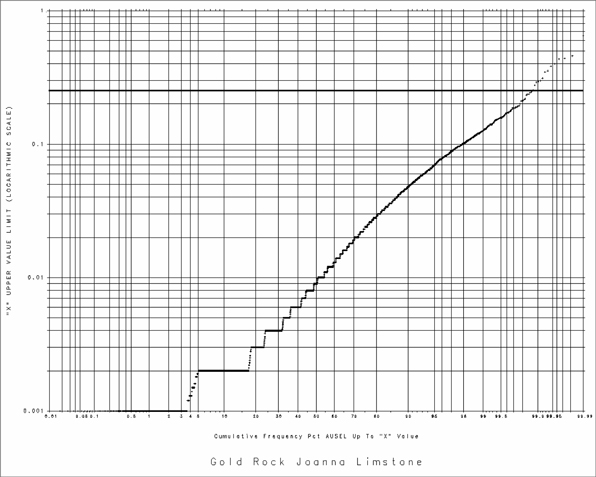
Figure 14-2 Cumulative Frequency Plot
Samples from the Gold Rock data base were composited in 20 foot intervals within each of the domains. These composites were used for both domain and variogram analysis. Table 14-2 provides statistics for these composites.
| April 10, 2012 | 70 | |
| Midway Gold Corp. | Mineral Resource Estimate |
| Gold Rock Project | NI 43-101 Technical Report on Resources |
Table 14-2 Gold Rock Composite Statistics
| Gold Rock Domain Fire Assay Statistics (Au ≥ 0.001 opt) |
| Domain | Code | Number | Max | Mean | Std. Dev. | COV |
| Mined Out | 0 | 875 | 0.291 | 0.019 | 0.025 | 1.32 |
| Alluvium | 5 | 12 | 0.011 | 0.004 | 0.003 | 0.71 |
| Joana Limestone | 10-11 | 961 | 0.301 | 0.022 | 0.025 | 1.15 |
| Chainman Shale | 20-21 | 924 | 0.276 | 0.011 | 0.017 | 1.61 |
| Pilot Shale | 30-31 | 140 | 0.093 | 0.012 | 0.016 | 1.32 |
| Fault Zone | 99 | 409 | 0.183 | 0.019 | 0.022 | 1.16 |
| ALL | — | 3321 | 0.301 | 0.017 | 0.023 | 1.33 |
| | | | | | | |
| Gold Rock Domain Cyanide Assay Statistics (Au ≥ 0.001 opt) |
| Domain | Code | Number | Max | Mean | Std. Dev. | COV |
| Mined Out | 0 | 164 | 0.227 | 0.018 | 0.027 | 1.54 |
| Alluvium | 5 | 17 | 0.008 | 0.003 | 0.002 | 0.69 |
| Joana Limestone | 10-11 | 358 | 0.289 | 0.016 | 0.025 | 1.52 |
| Chainman Shale | 20-21 | 469 | 0.156 | 0.007 | 0.011 | 1.57 |
| Pilot Shale | 30-31 | 92 | 0.056 | 0.006 | 0.011 | 1.71 |
| Fault Zone | 99 | 154 | 0.064 | 0.011 | 0.013 | 1.20 |
| ALL | — | 1254 | 0.289 | 0.012 | 0.019 | 1.67 |
Variography analysis was completed for four of the estimation domains to establish the spatial variability of mineralization within each domain. Variograms were not calculated for the alluvium or the mined out volume. Variography establishes the appropriate contribution that any specific composite should have when estimating a block volume value within a model. This is performed by comparing the orientation and distance used in the estimation to the variability of other samples of similar relative direction and distance. An example of a spherical variogram constructed from the Joana limestone domain using a “Pairwise Relative” method of organizing the variance pairs is shown in Figure 14-3.
| April 10, 2012 | 71 | |
| Midway Gold Corp. | Mineral Resource Estimate |
| Gold Rock Project | NI 43-101 Technical Report on Resources |
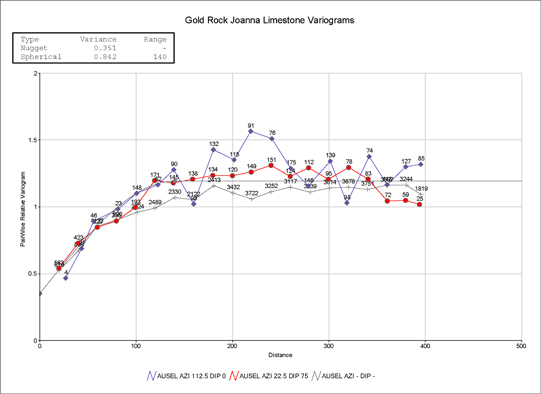
Figure 14-3 Gold Rock Joanna Limestone Variograms
Variograms were created for both horizontal and vertical orientations within each domain. Search ellipsoid axis orientations were based on the results of that analysis. The sill and nugget values for each domain were taken from the omni-directional variograms. The resultant variogram parameters are shown in Table 14-3.
Table 14-3 Gold Rock Variogram Parameters
| Primary Axis |
| | Joana
Limestone | Chainman
Shale | Pilot Shale | Fault Zone |
| Strike | 112.5 | Omni-
Directional | Omni-
Directional | Omni-
Directional |
| Plunge | 0 |
| Secondary Axis |
Dip
Direction | 22.5 | Omni-
Directional | Omni-
Directional | Omni-
Directional |
| Dip | 75 |
Model
Type | Spherical | Spherical | Spherical | Spherical |
| C0 | 0.294 | 0.279 | 0.365 | 0.228 |
| C1 | 0.706 | 0.039 | 0.635 | 0.772 |
| C2 | — | 0.682 | — | — |
| Range1 | 140 | 41 | 65 | 77 |
| Range2 | — | 120 | — | — |
| April 10, 2012 | 72 | |
| Midway Gold Corp. | Mineral Resource Estimate |
| Gold Rock Project | NI 43-101 Technical Report on Resources |
| 14.6 | Estimation Methodology |
A block model was created for the Gold Rock deposit using blocks that are 20 feet wide, 40 feet long and 20 feet high. Each block was assigned attributes of gold grade, search distance classification, rock density, and domain classification. The blocks were then assigned densities and domain assignments, as appropriate, to assist in estimation.
Dynamic search directions were used to estimate the block gold grades along the direction of the anticline. Dynamic search directions allow for a more accurate estimation by utilizing a unique search direction for each individual block. Instead of using a set axis rotation, each block has a uniquely oriented search ellipse best suited for following the mineralization in the immediate vicinity. The orientation of the search ellipses are based on the interpretation of the anticline and the fault zone. The shape of the Joana limestone and the fault zone models were used to estimate the dip and dip direction of the mineralization in each block. This allows the search ellipses to rotate with the interpreted trend of the mineralization, thus giving better continuity to the final estimation.
All of the domains were estimated in 2 passes and each block was assigned a classification of indicated or inferred based on the parameters in Table 14-4. The resource classification of each block was based on a factor of the average sample distance in an anisotropic direction as established (Table 14-3) from the variogram model for the domain being estimated. Indicated was set at a full variogram search distance and inferred was set at 2 times the variogram distance. As an additional requirement, Gustavson limited the indicated estimation data to include only the fire assay intervals. The inferred resource was estimated using all available assay data.
Gold content estimates for blocks of all domains were estimated by the Ordinary Kriging method. The estimation parameters for each of the domains are given in Table 14-4.
Table 14-4 Gold Rock Estimation Parameters
| Domain | Joana Limestone | Chainman Shale | Pilot Shale | Fault Zone |
| Classification | Indicated | Inferred | Indicated | Inferred | Indicated | Inferred | Indicated | Inferred |
| | 1st Pass | 2nd Pass | 3rd Pass | 1st Pass | 2nd Pass | 3rd Pass | 1st Pass | 2nd Pass | 3rd Pass | 1st Pass | 2nd Pass | 3rd Pass |
| Min | 5 | 3 | 2 | 5 | 3 | 2 | 5 | 3 | 2 | 5 | 3 | 2 |
| Max | 13 | 13 | 13 | 13 | 13 | 13 | 13 | 13 | 13 | 13 | 13 | 13 |
| Max per Hole | 3 | 3 | 3 | 3 | 3 | 3 | 3 | 3 | 3 | 3 | 3 | 3 |
| Search Ellipsoid Distance |
| Primary | 140 | 140 | 280 | 120 | 120 | 240 | 65 | 65 | 130 | 77 | 77 | 154 |
| Secondary | 140 | 140 | 280 | 120 | 120 | 240 | 65 | 65 | 130 | 77 | 77 | 154 |
| Tertiary | 35 | 35 | 70 | 30 | 30 | 60 | 16.25 | 16.25 | 32.5 | 38.5 | 38.5 | 77 |
| April 10, 2012 | 73 | |
| Midway Gold Corp. | Mineral Resource Estimate |
| Gold Rock Project | NI 43-101 Technical Report on Resources |
| 14.6.1 | Estimate Validation |
The model was validated by first examining the blocks with actual drill hole assay data to determine if the estimated blocks fit the geologic parameters of the various domains of the deposit. An estimate was then completed using the Nearest Neighbor method. This estimate was within 2.0% of the Ordinary Kriged estimate for contained ounces of gold.
Block model grade distribution is shown in Figure 14-4.
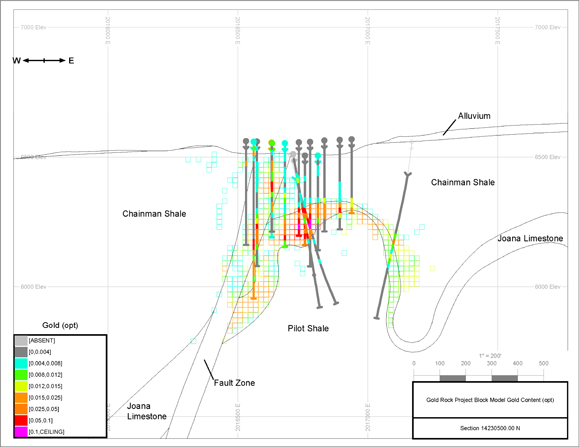
Figure 14-4 East-West Section 14,230,500 North, (Looking North)
| 14.7 | Density Rock and Alluvium |
Bedrock density data was not included in the Gold Rock database. For the resource estimate, all domains were assigned an average tonnage factor 13.0 ft3/tons.
| 14.8 | Resource Classification |
The Gold Rock resource is classified as indicated or inferred material
| April 10, 2012 | 74 | |
| Midway Gold Corp. | Mineral Resource Estimate |
| Gold Rock Project | NI 43-101 Technical Report on Resources |
| 14.9 | Mineral Resource Estimate |
The Gold Rock mineral resource estimate is summarized in Table 14-5. This resource estimate includes all drill data obtained as of February 29, 2012. This summary provides Gold Rock resource at four different cutoff grades. The economic cutoff (0.008 opt) reported in Table 14-5 was calculated assuming a 65 percent recovery and a mining cost of $6.5/ton with a three-year trailing average gold price of $1,255 per ounce.
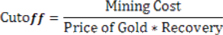
Table 14-5 The Gold Rock Mineral Resource
Cutoff
(opt) | Indicated Resource | Inferred Resource |
| Tons | Grade
(opt) | Gold
Ounces | Tons | Grade
(opt) | Gold
Ounces |
| 0.015 | 8,620,000 | 0.029 | 247,000 | 8,670,000 | 0.024 | 210,000 |
| 0.012 | 10,574,000 | 0.026 | 273,000 | 11,967,000 | 0.021 | 255,000 |
| 0.008 | 14,294,000 | 0.022 | 310,000 | 19,724,000 | 0.017 | 331,000 |
| 0.004 | 19,852,000 | 0.017 | 343,000 | 33,576,000 | 0.012 | 409,000 |
| April 10, 2012 | 75 | |
| Midway Gold Corp. | Mineral Reserve Estimates |
| Gold Rock Project | NI 43-101 Technical Report on Resources |
| 15. | MINERAL RESERVE ESTIMATES |
This Item is not required under NI 43-101, and therefore not included, as this report is a Technical Report on Resources only.
| April 10, 2012 | 76 | |
| Midway Gold Corp. | Mining Methods |
| Gold Rock Project | NI 43-101 Technical Report on Resources |
This Item is not required under NI 43-101, and therefore not included, as this report is a Technical Report on Resources only.
| April 10, 2012 | 77 | |
| Midway Gold Corp. | Recovery Methods |
| Gold Rock Project | NI 43-101 Technical Report on Resources |
This Item is not required under NI 43-101, and therefore not included, as this report is a Technical Report on Resources only.
| April 10, 2012 | 78 | |
| Midway Gold Corp. | Project Infrastructure |
| Gold Rock Project | NI 43-101 Technical Report on Resources |
| 18. | PROJECT INFRASTRUCTURE |
This Item is not required under NI 43-101, and therefore not included, as this report is a Technical Report on Resources only.
| April 10, 2012 | 79 | |
| Midway Gold Corp. | Market Studies and Contracts |
| Gold Rock Project | NI 43-101 Technical Report on Resources |
| 19. | MARKET STUDIES AND CONTRACTS |
This Item is not required under NI 43-101, and therefore not included, as this report is a Technical Report on Resources only.
| April 10, 2012 | 80 | |
| Midway Gold Corp. | Environmental Studies Permitting & Social Impact |
| Gold Rock Project | NI 43-101 Technical Report on Resources |
| 20. | ENVIRONMENTAL STUDIES, PERMITTING AND SOCIAL OR COMMUNITY IMPACT |
This Item is not required under NI 43-101, and therefore not included, as this report is a Technical Report on Resources only.
| April 10, 2012 | 81 | |
| Midway Gold Corp. | Capital and Operating Costs |
| Gold Rock Project | NI 43-101 Technical Report on Resources |
| 21. | CAPITAL AND OPERATING COSTS |
This Item is not required under NI 43-101, and therefore not included, as this report is a Technical Report on Resources only.
| April 10, 2012 | 82 | |
| Midway Gold Corp. | Economic Analysis |
| Gold Rock Project | NI 43-101 Technical Report on Resources |
This Item is not required under NI 43-101, and therefore not included, as this report is a Technical Report on Resources only.
| April 10, 2012 | 83 | |
| Midway Gold Corp. | Adjacent Properties |
| Gold Rock Project | NI 43-101 Technical Report on Resources |
There are no known activities on adjacent properties that affect the current exploration program on the Gold Rock Project.
MGUS also controls the Pan Property, which is approximately 10 miles to the northwest.
| April 10, 2012 | 84 | |
| Midway Gold Corp. | Other Relevant Data and Information |
| Gold Rock Project | NI 43-101 Technical Report on Resources |
| 24. | OTHER RELEVANT DATA AND INFORMATION |
Gustavson knows of no other relevant data or information pertaining to the Gold Rock Project that is not already contained in this Technical Report.
| April 10, 2012 | 85 | |
| Midway Gold Corp. | Interpretation and Conclusions |
| Gold Rock Project | NI 43-101 Technical Report on Resources |
| 25. | INTERPRETATION AND CONCLUSIONS |
The Gold Rock deposit, formally known as Easy Junior, contains a substantial gold resource that warrants additional exploration and evaluation. The mineralization system is strong, with a known strike length of over 8,000 feet. The lithology, alteration, and mineralization of the Gold Rock deposit are similar to other sediment-hosted Carlin-type systems such as Alligator Ridge, Bald Mountain, Rain, and MGUS’ Pan Project. A portion of the Gold Rock deposit has been explored and mined, but drilling outside that area is very widely spaced, shallow and locally intercepts anomalous gold mineralization. Historic exploration has not cut off mineralization in any direction.
Gustavson has reviewed the historic information on the project and has verified drill hole locations, down-hole geology as compiled in geologic logs, and gold assays based on original assay certificates. Cross validation of the historic drill assay results was accomplished using a partially documented historic check assay program, twin drill holes and comparison with the geologic and assay results of recent drilling by MGUS in 2011. Certain assay types, specifically neutron activation analyses, were not considered comparable to the historic fire assays and have been excluded from the database for purposes of generation of the resource estimate contained in this report. Fire assay results from the Ward laboratory were determined as biased toward higher gold values and were also excluded from the database for the purposes of this report. CN AA analysis results were included in the database for assay intervals not also assayed by fire assay at the Robinson laboratory. The CN AA results, on average, understate gold values as compared with fire assay results, but are believed to represent a conservative component to the estimate of gold grade. It is the opinion of Gustavson that the historic and MGUS assay data used in the database are of sufficient high quality to support the generation of the indicated and inferred mineral resource estimates reported herein.
| April 10, 2012 | 86 | |
| Midway Gold Corp. | Recommendations |
| Gold Rock Project | NI 43-101 Technical Report on Resources |
Gustavson recommends the following:
| · | That MGUS continue a program of validation and verification of the historic drill hole assay database through an ongoing twin hole program primarily targeting historic drill holes assayed by the Robinson and Ward laboratories. This will enable MGUS to assess potential zones of additional gold mineralization that were previously only analyzed by CN AA. |
| · | A detailed 3-dimensional alteration model should be created to aide in the delineation of the mineralization in shale units in contact with the fault zone and/or Joana Limestone. |
| · | Continued drilling is recommended on an in-fill basis and to expand knowledge of potential mineralization beyond the limits of current drill patterns to potentially enable conversion of inferred resources to higher confidence categories, and to build the global inventory of gold resources. |
| · | A sufficient amount of specific gravity measurements should be collected on the individual lithologies and alteration types identified on the property. |
| · | A metallurgical program should be designed and implemented, targeting the well-known lithologic and alteration types, to characterize the potential range in ore types and to assess process type and metallurgical recoveries. |
| · | Baseline environmental studies should be initiated on a timeline compatible with MGUS corporate objectives and planning. |
| · | There is a significant amount of information in the files including historical metallurgy, geotechnical data, hydrology, and other environmental information. This data should be reviewed as a tool for planning the future needs of a new mining program. |
| · | The surface geology and alteration mapping should be completed and all the historical and modern data compiled as a tool for locating additional drill targets on the property. |
Gustavson considers the estimated budget of $3,200,000 shown in Table 26-1 to be sufficient for the designed program of continued historic data verification and in-fill, resource conversion to higher confidence levels, and initial metallurgical and environmental work to position the project for advancement to the pre-feasibility/feasibility level. Drilling is recommended to focus on a continued twin hole program with historic holes assayed by CN AA methods, in-fill drilling to move resources to a higher confidence level, and step-out drilling to potentially expand resources. The program should target the Resource Area outlined in this report; specifically the north and south extensions of the anticlinal trend from the Easy Junior open pit, the Meridian Flats area, and the down-dip projections of the limbs of the anticline and adjacent parallel structures. Holes should also be drilled to obtain samples for metallurgical testing to establish the potential process type and metallurgical recoveries of gold.
| April 10, 2012 | 87 | |
| Midway Gold Corp. | Recommendations |
| Gold Rock Project | NI 43-101 Technical Report on Resources |
Table 26-1 Estimated Budget for Verification Drilling Program and Data Compilation
| Program | Cost |
| RC drilling 42,500 feet (50 holes @ 850 feet) | $1,500,000 |
| Diamond Core Drilling 6,000 feet (10 holes @ 600 feet) | $600,000 |
| Sample Assays RC (9,400 samples @ $20) | $ 190,000 |
| Sample Assays Core (1,700 samples @ $20) | $34,000 |
| Road Building, Drill site construction and reclamation | $26,000 |
| Permitting and Bonding | $10,000 |
| Compilation of existing metallurgical data | $20,000 |
| Compilation of historical hydrology data | $20,000 |
| Initiate baseline environmental studies | $500,000 |
| Metallurgical Characterization | $300,000 |
| TOTAL | $3,200,000 |
| April 10, 2012 | 88 | |
| Midway Gold Corp. | References |
| Gold Rock Project | NI 43-101 Technical Report on Resources |
Alta Bay JV, 1992, Alta Bay 1992 Projects Summary report. Internal document for Alta Gold Company and Echo Bay Mines.
Basham, A., and Rorem, E.J., 1988, Cover letter and report from Bondar-Clegg, Inc., Reno, Nevada, to J. Carden, Echo Bay Exploration, concerning a round-robin assay program using Easy Junior composite samples; January 25, 1988
Carden, J.R., 1988, Summary Report Nighthawk Ridge deposit Easy Junior Project White Pine County, Nevada, Echo Bay Exploration Internal report
Carden J.R. 1991, The discovery and Geology of the Nighthawk Ridge Deposit at Easy Junior, White Pine County, Nevada. Geology and Ore Deposit of the Great Basin, Geological Society of Nevada Symposium Proceedings, pp. 665-667
Independent Ming Consultants, Inc, 1988, Ore Body Model and Floating Cone Reserves for Nighthawk Ridge prepared for Echo Bay Mines. Independent Mining Consultants, Inc. Tucson, Arizona
Pincock, Allen, and Holt, 1989, Audit and verification of reserves easy Junior Deposit, White Pine County Nevada, report prepared for Alta Gold Company, Pincock Allen and Holt, Lakewood Colorado.
Postlethwaite, C., 2005, Regional Structural Setting of the Nighthawk Ridge Deposit, White Pine County, Nevada. Presented at poster session for Symposium 2005, Window to the World, Geologic Society of Nevada, May 14-18, 2005.
Smith, R. M. 1976, Geology and Mineral Resources of White Pine County Nevada, Nevada Bureau of Mines and Geology Bulletin 85.pp 105 with plates
Hose, R.K.,Blake, M.C., and Smith, R.M., 1976, Geology and mineral resources of White Pine County, Nevada: Nevada Bureau of Mines and Geology, Bulletin 85.
| April 10, 2012 | 89 | |
| Midway Gold Corp. | Certificate of Author Forms |
| Gold Rock Project | NI 43-101 Technical Report on Resources |
| 28. | Certificate of Author Forms |
WILLIAM J. CROWL
Vice President, Mining
Gustavson Associates, LLC
274 Union Boulevard, Suite 450
Lakewood, Colorado 80228
Telephone: 720-407-4062 Facsimile: 720-407-4067
Email:wcrowl@gustavson.com
CERTIFICATE of AUTHOR
I, William J. Crowl do hereby certify that:
| 1. | I am currently employed as Vice President, Mining by Gustavson Associates, LLC at: |
274 Union Boulevard
Suite 450
Lakewood, Colorado 80228
| 2. | I am a graduate of the University of Southern California with a Bachelor of Arts in Earth Science (1968), and an MSc. In Economic Geology from the University of Arizona in 1979, and have practiced my profession continuously since 1973. |
| 3. | I am a registered Professional Geologist in the State of Oregon (G573) and am a member in good standing of the Society of Economic Geologists I am a Qualified Professional according to the Mining and Metallurgical Society of America (01412QP). |
| 4. | I have worked as a geologist for a total of 39 years since my graduation from university; as a graduate student, as an employee of a major mining company, a major engineering company, and as a consulting geologist. I was involved in the start-up of the DeLamar Silver Mine as Ore Control Manager and Chief Geologist; I managed the Mineral Evaluation group at Homestake Mining Co., and have worked as a geological consultant for Fluor Daniel, SRK Consulting and Gustavson Associates, evaluating over 40 gold projects including both surface and underground. |
| 5. | I have read the definition of “qualified person” set out in National Instrument 43-101 (“NI 43-101”) and certify that by reason of my education, affiliation with a professional association (as defined in NI 43-101) and past relevant work experience, I fulfill the requirements to be a “qualified person” for the purposes of NI 43-101. |
| 6. | I am responsible for the preparation of the technical report titled “NI 43-101 Technical Report on Resources, Gold Rock Project, White Pine County, Nevada” dated April 10, 2012, with and effective date of February 29, 2012, (the “Technical Report”). I have not visited the property that is the subject of this Technical Report. |
| 7. | I have had prior involvement with the Gold Rock Project that is the subject of this Technical Report. |
| April 10, 2012 | 90 | |
| Midway Gold Corp. | Certificate of Author Forms |
| Gold Rock Project | NI 43-101 Technical Report on Resources |
| 8. | I am independent of the issuer applying all the tests in section 1.5 of National Instrument 43-101. |
| 9. | I have read National Instrument 43-101 and Form 43-101, and the Technical Report has been prepared in compliance with that instrument and form. |
| 10. | I consent to the filing of the Technical Report with any stock exchange and other regulatory authority and any publication by them for regulatory purposes, including electronic publication in the public company files on their websites accessible by the public, of the Technical Report. |
| 11. | As of the date of this certificate, to the best of my knowledge, information and belief, the Technical Report contains all scientific and technical information that is required to be disclosed to make the Technical Report not misleading. |
Dated this 10th day of April, 2012
| /s/William J. Crowl(Signature) | |
| Signature of Qualified Person | |
| | |
| William J. Crowl | |
| Print name of Qualified Person | |
| April 10, 2012 | 91 | |
| Midway Gold Corp. | Certificate of Author Forms |
| Gold Rock Project | NI 43-101 Technical Report on Resources |
DONALD E. HULSE
Principal Mining Engineer
Gustavson Associates, LLC
274 Union Boulevard, Suite 450
Lakewood, Colorado 80228
Telephone: 720-407-4062 Facsimile: 720-407-4067
Email:dhulse@gustavson.com
CERTIFICATE of AUTHOR
I, Donald E. Hulse do hereby certify that:
| 1. | I am currently employed as Principal Mining Engineer by Gustavson Associates, LLC at: |
274 Union Boulevard
Suite 450
Lakewood, Colorado 80228
| 2. | I am a graduate of the Colorado School of Mines with a Bachelor of Science in Mining Engineering (1982), and have practiced my profession continuously since 1983. |
| 3. | I am a registered Professional Engineer in the State of Colorado (35269) as well as a Registered Member of the Society of Mining Metallurgy and Exploration (1533190RM). |
| 4. | I have worked as a mining engineer for a total of 29 years since my graduation from university; as an employee of a major mining company, a major engineering company and as a consulting engineer. I have performed resource estimation and mine planning on over 30 gold deposits for over 10 mining companies in three countries working as a consultant as well as an engineer or engineering manager for the projects. |
| 5. | I have read the definition of “qualified person” set out in National Instrument 43-101 (“NI 43-101”) and certify that by reason of my education, affiliation with a professional association (as defined in NI 43-101) and past relevant work experience, I fulfill the requirements to be a “qualified person” for the purposes of NI 43-101. |
| 6. | I am responsible for Sections 1, 17 and 20of the technical report titled “NI 43-101 Technical Report on Resources, Gold Rock Project, White Pine County, Nevada” dated April 10, 2012, with and effective date of February 29, 2012, (the “Technical Report”). I have not visited the property that is the subject of this Technical Report. |
| 7. | I have had prior involvement with the Gold Rock Project that is the subject of this Technical Report. |
| 8. | I am independent of the issuer applying all the tests in section 1.5 of National Instrument 43-101. |
| April 10, 2012 | 92 | |
| Midway Gold Corp. | Certificate of Author Forms |
| Gold Rock Project | NI 43-101 Technical Report on Resources |
| 9. | I have read National Instrument 43-101 and Form 43-101, and the Technical Report has been prepared in compliance with that instrument and form. |
| 10. | I consent to the filing of the Technical Report with any stock exchange and other regulatory authority and any publication by them for regulatory purposes, including electronic publication in the public company files on their websites accessible by the public, of the Technical Report. |
| 11. | As of the date of this certificate, to the best of my knowledge, information and belief, the Technical Report contains all scientific and technical information that is required to be disclosed to make the Technical Report not misleading. |
Dated this 10th day of April, 2012
| /s/Donald E. Hulse (Signature) | |
| Signature of Qualified Person | |
| | |
| Donald E. Hulse | |
| Print name of Qualified Person | |
| April 10, 2012 | 93 | |
| Midway Gold Corp. | Certificate of Author Forms |
| Gold Rock Project | NI 43-101 Technical Report on Resources |
DONALD J. BAKER
Associate Principal Geologist
Gustavson Associates, LLC
274 Union Boulevard, Suite 450
Lakewood, Colorado 80228
Telephone: 720-407-4062 Facsimile: 720-407-4067
Email:dbaker@gustavson.com
CERTIFICATE of AUTHOR
I, Donald J. Baker do hereby certify that:
| 1. | I am currently employed as Associate Principal Geologist by Gustavson Associates, LLC at: |
274 Union Boulevard
Suite 450
Lakewood, Colorado 80228
| 2. | I am a graduate of The Ohio State University with an MSc in Geology (1974), a PhD. in Geology from the University of Georgia (1980), and an M.B.A. from the University of Colorado at Denver (1991) and have practiced my profession continuously since 1978. |
| 3. | I am a member in good standing of the Mining and Metallurgical Society of America, member #01088QP. |
| 4. | I have worked as a geologist for a total of 38 years since my graduation from university; as a graduate student, as an employee of a major mining company, a major engineering company, and as a consulting geologist. |
| 5. | I have read the definition of “qualified person” set out in NI 43-101 (“NI 43-101”) and certify that by reason of my education, affiliation with a professional association (as defined in NI 43-101) and past relevant work experience, I fulfill the requirements to be a “qualified person” for the purposes of NI 43-101. |
| 6. | I am responsible for Sections 7 through 12 of the technical report titled “NI 43-101 Technical Report on Resources, Gold Rock Project, White Pine County, Nevada” dated April 10, 2012, with and effective date of February 29, 2012, (the “Technical Report”). I visited the property that is the subject of this Technical Report on January 12 – 14, 2012. |
| 7. | I have had prior involvement with the Gold Rock Project that is the subject of this Technical Report. |
| 8. | I am independent of the issuer applying all the tests in section 1.5 of National Instrument 43-101. |
| April 10, 2012 | 94 | |
| Midway Gold Corp. | Certificate of Author Forms |
| Gold Rock Project | NI 43-101 Technical Report on Resources |
| 9. | I have read National Instrument 43-101 and Form 43-101, and the Technical Report has been prepared in compliance with that instrument and form. |
| 10. | I consent to the filing of the Technical Report with any stock exchange and other regulatory authority and any publication by them for regulatory purposes, including electronic publication in the public company files on their websites accessible by the public, of the Technical Report. |
| 11. | As of the date of this certificate, to the best of my knowledge, information and belief, the Technical Report contains all scientific and technical information that is required to be disclosed to make the Technical Report not misleading. |
Dated this 10th day of April, 2012
| /s/Donald J. Baker (Signature) | |
| Signature of Qualified Person | |
| | |
| Donald J. Baker | |
| Print name of Qualified Person | |
| April 10, 2012 | 95 | |