UNITED STATES
SECURITIES AND EXCHANGE COMMISSION
Washington, D.C. 20549
FORM N-CSR
CERTIFIED SHAREHOLDER REPORT OF REGISTERED MANAGEMENT INVESTMENT COMPANIES
Investment Company Act File Number 811-21726
360 Funds
(Exact name of registrant as specified in charter)
| 4520 Main Street, Suite 1425 Kansas City, MO | 64111 |
| (Address of principal executive offices) | (Zip code) |
The Corporation Trust Company
Corporation Trust Center
1209 Orange St.
Wilmington, DE 19801
(Name and address of agent for service)
With Copies To:
John H. Lively
Practus, LLP
11300 Tomahawk Creek Parkway, Suite 310
Leawood, KS 66211
Registrant's telephone number, including area code: 877-244-6235
Date of fiscal year end: 11/30/2018
Date of reporting period: 05/31/2018
| ITEM 1. | REPORTS TO SHAREHOLDERS |
The Semi-Annual report to Shareholders of the HedgeRow Income and Opportunity Fund (the "Fund"), a series of the 360 Funds, for the period ended May 31, 2018 pursuant to Rule 30e-1 under the Investment Company Act of 1940, as amended (the “1940 Act”) (17 CFR 270.30e-1) is filed herewith.

HedgeRow Income and Opportunity Fund Class A Shares (Ticker Symbol: HROAX) Institutional Class Shares (Ticker Symbol: HIOIX) A Series of the 360 Funds |
SEMI-ANNUAL REPORT
May 31, 2018
Investment Adviser:
Willard Mills Advisory, LLC
P.O. Box 2549
Brentwood, TN 37024-2549
TABLE OF CONTENTS
| HedgeRow Income and Opportunity Fund | SEMI-ANNUAL REPORT |
INVESTMENT HIGHLIGHTS
May 31, 2018 (Unaudited)
The investment objective of the HedgeRow Income and Opportunity Fund (the “Fund”) is total return. The Fund seeks to meet its investment objective by investing in domestic equity securities. The Fund will seek income through dividends paid on such securities. The Fund will also seek to produce income (e.g., premium income on the sale of an option) and total return through an options strategy.
Willard Mills Advisory, LLC (the “Adviser”) will primarily invest in securities of large capitalization issuers stocks with a history of strong earnings and dividend growth. The Fund invests in large capitalization issuers to have at time of purchase a market capitalization with the capitalization range of the S&P 500 Index. The Fund looks for stocks with attributes which suggest they will thrive in good markets and survive potential economic setbacks. The Fund employs detailed quantitative assessments to construct its equity portfolio. Portfolio parameters include, but are not limited to, steady growing earnings, dividend yield with a tendency to raise such yield and availability at reasonable price-earnings ratios. The Fund seeks to invest in stocks that are undervalued by the market, but with strong business models, which provides for lower levels of market volatility or non-correlated volatility, higher dividend returns and are generally less expensive to purchase.
The Fund also seeks to generate income for shareholders by selling options against the risk taken by owning common stocks. This income is designed to, over time, add to portfolio stability and improve returns. The Fund uses an option strategy in an effort to limit market exposure and volatility. The extent of option selling will depend upon market conditions and the Adviser’s judgment of the advantages of selling call options on the Fund’s equity investments.
The Fund may be appropriate for investors with long-term time horizons who are not sensitive to short-term losses and want to participate in the long-term growth of the financial markets.
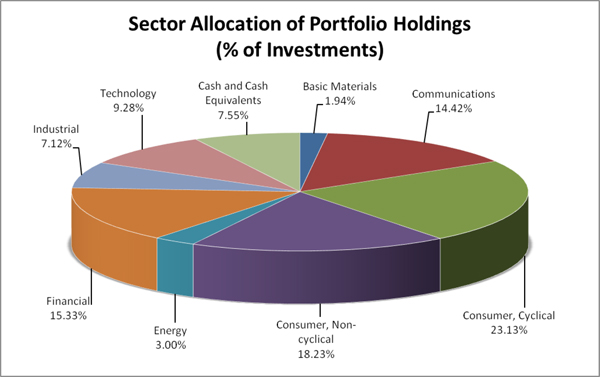
The percentages in the above graph are based on the portfolio holdings of the Fund as of May 31, 2018 and are subject to change. For a detailed break-out of holdings by industry and investment type, please refer to the Schedule of Investments, Schedule of Purchased Options and Schedule of Written Options.
| HEDGEROW INCOME AND OPPORTUNITY FUND | |
| SCHEDULE OF INVESTMENTS | |
| May 31, 2018 (Unaudited) | SEMI-ANNUAL REPORT |
| | | | | | | |
| COMMON STOCK - 85.56% | | Shares | | | Fair Value | |
| | | | | | | |
| Airlines - 4.76% | | | | | | | | |
| Delta Air Lines, Inc. (b) | | | 3,500 | | | $ | 189,175 | |
| JetBlue Airways Corp. (a) (b) | | | 6,200 | | | | 117,118 | |
| | | | | | | | 306,293 | |
| Auto Manufacturers - 3.32% | | | | | | | | |
| General Motors Co. | | | 5,000 | | | | 213,500 | |
| | | | | | | | | |
| Banks - 11.58% | | | | | | | | |
| Bank of New York Mellon Corp. (b) | | | 4,300 | | | | 235,425 | |
| BankUnited, Inc. (b) | | | 1,500 | | | | 63,255 | |
| The Goldman Sachs Group, Inc. | | | 800 | | | | 180,704 | |
| KeyCorp | | | 4,200 | | | | 81,648 | |
| US Bancorp | | | 1,500 | | | | 74,985 | |
| Zions Bancorporation | | | 2,000 | | | | 109,620 | |
| | | | | | | | 745,637 | |
| Biotechnology - 6.21% | | | | | | | | |
| Amgen, Inc. (b) | | | 1,100 | | | | 197,582 | |
| Gilead Sciences, Inc. (b) | | | 3,000 | | | | 202,200 | |
| | | | | | | | 399,782 | |
| Building Materials - 4.27% | | | | | | | | |
| Eagle Materials, Inc. | | | 2,000 | | | | 216,760 | |
| Summit Materials, Inc. - Class A (a) | | | 2,043 | | | | 58,062 | |
| | | | | | | | 274,822 | |
| Cosmetics & Personal Care - 1.46% | | | | | | | | |
| elf Beauty, Inc. (a) | | | 5,000 | | | | 94,250 | |
| | | | | | | | | |
| Diversified Financial Services - 0.75% | | | | | | | | |
| Waddell & Reed Financial, Inc. - Class A | | | 2,500 | | | | 48,500 | |
| | | | | | | | | |
| Food - 3.03% | | | | | | | | |
| Sysco Corp. | | | 3,000 | | | | 195,090 | |
| | | | | | | | | |
| Healthcare - Products - 1.73% | | | | | | | | |
| Zimmer Biomet Holdings, Inc. | | | 1,000 | | | | 111,510 | |
| | | | | | | | | |
| Housewares - 2.20% | | | | | | | | |
| Newell Brands, Inc. | | | 6,000 | | | | 141,480 | |
| | | | | | | | | |
| Insurance - 1.77% | | | | | | | | |
| Axis Capital Holdings Ltd. - Bermuda | | | 2,000 | | | | 113,700 | |
| | | | | | | | | |
| Internet - 2.45% | | | | | | | | |
| Spotify Technology SA -Sweden (a) | | | 1,000 | | | | 157,710 | |
| | | | | | | | | |
| Leisure Time - 2.44% | | | | | | | | |
| Norwegian Cruise Line Holdings Ltd. (a) | | | 3,000 | | | | 157,020 | |
| HEDGEROW INCOME AND OPPORTUNITY FUND | |
| SCHEDULE OF INVESTMENTS | |
| May 31, 2018 (Unaudited) | SEMI-ANNUAL REPORT |
| COMMON STOCK - 85.56% (continued) | | Shares | | | Fair Value | |
| | | | | | | |
| Media - 5.68% | | | | | | | | |
| CBS Corp. - Class B | | | 4,500 | | | $ | 226,665 | |
| Walt Disney Co. (b) | | | 1,400 | | | | 139,258 | |
| | | | | | | | 365,923 | |
| Mining - 1.76% | | | | | | | | |
| Wheaton Precious Metals Corp. - Canada | | | 5,200 | | | | 113,672 | |
| | | | | | | | | |
| Oil & Gas Services - 2.95% | | | | | | | | |
| Baker Hughes a GE Co. (b) | | | 5,500 | | | | 190,245 | |
| | | | | | | | | |
| Pharmaceuticals - 4.32% | | | | | | | | |
| Bristol-Myers Squibb Co. (b) | | | 3,100 | | | | 163,122 | |
| Mylan NV (a) | | | 3,000 | | | | 115,380 | |
| | | | | | | | 278,502 | |
| Retail - 8.79% | | | | | | | | |
| Starbucks Corp. | | | 2,000 | | | | 113,340 | |
| TJX Cos., Inc. (b) | | | 2,200 | | | | 198,704 | |
| Walmart, Inc. | | | 2,000 | | | | 165,080 | |
| Williams-Sonoma, Inc. | | | 1,600 | | | | 88,592 | |
| | | | | | | | 565,716 | |
| Semiconductors - 4.67% | | | | | | | | |
| Broadcom, Inc. | | | 800 | | | | 201,656 | |
| Lam Research Corp. | | | 500 | | | | 99,090 | |
| | | | | | | | 300,746 | |
| Software - 4.07% | | | | | | | | |
| Electronic Arts, Inc. (a) (b) | | | 2,000 | | | | 261,820 | |
| | | | | | | | | |
| Telecommunications - 5.03% | | | | | | | | |
| AT&T, Inc. (b) | | | 5,000 | | | | 161,600 | |
| Finisar Corp. (a) | | | 10,000 | | | | 162,100 | |
| | | | | | | | 323,700 | |
| Transportation - 2.32% | | | | | | | | |
| FedEx Corp. | | | 600 | | | | 149,472 | |
| | | | | | | | | |
| TOTAL COMMON STOCK (Cost $5,617,295) | | | | | | | 5,509,090 | |
| | | | | | | | | |
| OPTIONS PURCHASED (Cost $408) - 0.00% (d) | | | | | | | 50 | |
| | | | | | | | | |
| SHORT-TERM INVESTMENTS - 6.84% | | | | | | | | |
| Federated Government Obligations Fund - Institutional Shares, 1.61% (c) | | | 440,217 | | | | 440,217 | |
| TOTAL SHORT-TERM INVESTMENTS (Cost $440,217) | | | | | | | 440,217 | |
| HEDGEROW INCOME AND OPPORTUNITY FUND | |
| SCHEDULE OF INVESTMENTS | |
| May 31, 2018 (Unaudited) | SEMI-ANNUAL REPORT |
| | | Fair Value | |
| | | | |
| TOTAL INVESTMENTS (Cost $6,057,920) – 92.40% | | $ | 5,949,357 | |
| | | | | |
| OPTIONS WRITTEN (Proceeds $126,040) - (1.79%) (e) | | | (115,170 | ) |
| | | | | |
| OTHER ASSETS IN EXCESS OF LIABILITIES, NET - 9.39% | | | 604,492 | |
| | | | | |
| NET ASSETS - 100% | | $ | 6,438,679 | |
| (a) | Non-income producing security. |
| (b) | All or a portion of the security is segregated as collateral for call options written. |
| (c) | Rate shown represents the 7-day effective yield at May 31, 2018, is subject to change and resets daily. |
| (d) | Please refer to the Schedule of Options Purchased for details of options purchased. |
| (e) | Please refer to the Schedule of Options Written for details of options written. |
ADR - American Depositary Receipt.
The accompanying notes are an integral part of these financial statements.
| HEDGEROW INCOME AND OPPORTUNITY FUND | |
| SCHEDULE OF OPTIONS PURCHASED | |
| May 31, 2018 (Unaudited) | SEMI-ANNUAL REPORT |
| OPTIONS PURCHASED - 0.00% | | | | | | | | | | | | | | | |
| | | | | | | | | | | | | | | | |
| CALL OPTIONS PURCHASED - 0.00% | | | | | Notional | | | Exercise | | | | | | | |
| | | Contracts 1 | | | Amount | | | Price | | | Expiration | | | Fair Value | |
| | | | | | | | | | | | | | | | |
| TravelCenters of America LLC | | | 10 | | | | 5,000 | | | $ | 5.00 | | | | 6/15/2018 | | | | 50 | |
| | | | | | | | | | | | | | | | | | | | | |
| TOTAL CALL OPTIONS PURCHASED (Cost $408) | | | | | | | | | | | | | | | | | | | 50 | |
| | | | | | | | | | | | | | | | | | | | | |
| TOTAL OPTIONS PURCHASED (Cost $408) | | | | | | | | | | | | | | | | | | $ | 50 | |
1 Each option contract is equivalent to 100 shares of common stock.
All options are non-income producing.
The accompanying notes are an integral part of these financial statements.
| HEDGEROW INCOME AND OPPORTUNITY FUND | |
| SCHEDULE OF OPTIONS WRITTEN | |
| May 31, 2018 (Unaudited) | SEMI-ANNUAL REPORT |
| OPTIONS WRITTEN - (1.79)% | | | | | | | | | | | | | | | |
| | | | | | Notional | | | Exercise | | | | | | | |
| CALL OPTIONS WRITTEN - (1.75)% | | Contracts 1 | | | Amount | | | Price | | | Expiration | | | Fair Value | |
| | | | | | | | | | | | | | | | |
| Amgen, Inc. | | | 7 | | | $ | 136,500 | | | $ | 195.00 | | | | 9/21/2018 | | | $ | 2,023 | |
| Baker Hughes a GE Co. | | | 35 | | | | 119,000 | | | $ | 34.00 | | | | 10/19/2018 | | | | 11,200 | |
| Baker Hughes a GE Co. | | | 20 | | | | 74,000 | | | $ | 37.00 | | | | 10/19/2018 | | | | 3,700 | |
| Bank of New York Mellon Corp. | | | 43 | | | | 258,000 | | | $ | 60.00 | | | | 9/21/2018 | | | | 2,580 | |
| BankUnited, Inc. | | | 15 | | | | 60,000 | | | $ | 40.00 | | | | 8/17/2018 | | | | 4,575 | |
| Bristol-Myers Squibb Co. | | | 10 | | | | 55,000 | | | $ | 55.00 | | | | 7/20/2018 | | | | 750 | |
| Broadcom Ltd. | | | 8 | | | | 200,000 | | | $ | 250.00 | | | | 7/20/2018 | | | | 8,080 | |
| CBS Corp. - Class B | | | 35 | | | | 201,250 | | | $ | 57.50 | | | | 9/21/2018 | | | | 2,380 | |
| Delta Air Lines, Inc. | | | 10 | | | | 57,500 | | | $ | 57.50 | | | | 8/17/2018 | | | | 1,220 | |
| Delta Air Lines, Inc. | | | 15 | | | | 90,000 | | | $ | 60.00 | | | | 7/20/2018 | | | | 480 | |
| Delta Air Lines, Inc. | | | 10 | | | | 60,000 | | | $ | 60.00 | | | | 9/21/2018 | | | | 1,020 | |
| Eagle Materials, Inc. | | | 20 | | | | 220,000 | | | $ | 110.00 | | | | 7/20/2018 | | | | 6,200 | |
| Electronic Arts, Inc. | | | 10 | | | | 125,000 | | | $ | 125.00 | | | | 6/15/2018 | | | | 6,710 | |
| Electronic Arts, Inc. | | | 10 | | | | 135,000 | | | $ | 135.00 | | | | 8/17/2018 | | | | 5,400 | |
| elf Beauty, Inc. | | | 10 | | | | 20,000 | | | $ | 20.00 | | | | 8/17/2018 | | | | 850 | |
| elf Beauty, Inc. | | | 10 | | | | 22,500 | | | $ | 22.50 | | | | 8/17/2018 | | | | 300 | |
| FedEx Corp. | | | 6 | | | | 156,000 | | | $ | 260.00 | | | | 7/20/2018 | | | | 2,370 | |
| Finisar Corp. | | | 25 | | | | 62,500 | | | $ | 25.00 | | | | 9/21/2018 | | | | 250 | |
| General Motors Co. | | | 20 | | | | 78,000 | | | $ | 39.00 | | | | 8/17/2018 | | | | 8,500 | |
| Gilead Sciences, Inc. | | | 10 | | | | 70,000 | | | $ | 70.00 | | | | 7/20/2018 | | | | 1,090 | |
| Goldman Sachs Group, Inc. | | | 8 | | | | 216,000 | | | $ | 270.00 | | | | 7/20/2018 | | | | 144 | |
| JetBlue Airways Corp. | | | 20 | | | | 52,000 | | | $ | 26.00 | | | | 9/21/2018 | | | | 200 | |
| KeyCorp | | | 25 | | | | 55,000 | | | $ | 22.00 | | | | 9/21/2018 | | | | 575 | |
| Lam Research Corp. | | | 5 | | | | 110,000 | | | $ | 220.00 | | | | 7/20/2018 | | | | 985 | |
| Mylan NV | | | 20 | | | | 100,000 | | | $ | 50.00 | | | | 7/20/2018 | | | | 140 | |
| Norwegian Cruise Line Holdings, Ltd. | | | 20 | | | | 115,000 | | | $ | 57.50 | | | | 9/21/2018 | | | | 2,580 | |
| Spotify Technology, SA | | | 5 | | | | 82,500 | | | $ | 165.00 | | | | 7/20/2018 | | | | 2,500 | |
| Summit Materials, Inc. - Class A | | | 10 | | | | 30,000 | | | $ | 30.00 | | | | 6/15/2018 | | | | 125 | |
| Summit Materials, Inc. - Class A | | | 10 | | | | 35,000 | | | $ | 35.00 | | | | 8/17/2018 | | | | 350 | |
| Sysco Corp. | | | 10 | | | | 65,000 | | | $ | 65.00 | | | | 6/15/2018 | | | | 1,190 | |
| Sysco Corp. | | | 20 | | | | 130,000 | | | $ | 65.00 | | | | 8/17/2018 | | | | 4,200 | |
| TJX Cos., Inc. | | | 6 | | | | 48,000 | | | $ | 80.00 | | | | 7/20/2018 | | | | 6,510 | |
| TJX Cos., Inc. | | | 16 | | | | 136,000 | | | $ | 85.00 | | | | 7/20/2018 | | | | 9,792 | |
| US Bancorp | | | 15 | | | | 78,750 | | | $ | 52.50 | | | | 8/17/2018 | | | | 960 | |
| US Bancorp | | | 15 | | | | 82,500 | | | $ | 55.00 | | | | 9/21/2018 | | | | 495 | |
| Walmart, Inc. | | | 15 | | | | 127,500 | | | $ | 85.00 | | | | 7/20/2018 | | | | 1,815 | |
| Walt Disney Co. | | | 5 | | | | 55,000 | | | $ | 110.00 | | | | 7/20/2018 | | | | 150 | |
| Walt Disney Co. | | | 9 | | | | 99,000 | | | $ | 110.00 | | | | 9/21/2018 | | | | 918 | |
| Wheaton Precious Metals Corp. - Canada | | | 25 | | | | 56,250 | | | $ | 22.50 | | | | 6/15/2018 | | | | 375 | |
| Williams-Sonoma, Inc. | | | 16 | | | | 88,000 | | | $ | 55.00 | | | | 6/15/2018 | | | | 2,208 | |
| Zimmer Biomet Holdings, Inc. | | | 10 | | | | 120,000 | | | $ | 120.00 | | | | 9/21/2018 | | | | 2,200 | |
| Zions Bancorporation | | | 20 | | | | 110,000 | | | $ | 55.00 | | | | 7/20/2018 | | | | 4,340 | |
| TOTAL CALL OPTIONS WRITTEN (Proceeds $122,895) | | | | | | | | | | | | | | | | | | | 112,430 | |
| HEDGEROW INCOME AND OPPORTUNITY FUND | |
| SCHEDULE OF OPTIONS WRITTEN | |
| May 31, 2018 (Unaudited) | SEMI-ANNUAL REPORT |
| OPTIONS WRITTEN - (1.79)% (continued) | | | | | | | | | | | | | | | |
| | | | | | Notional | | | Exercise | | | | | | | |
| PUT OPTIONS WRITTEN - (0.04)% | | Contracts 1 | | | Amount | | | Price | | | Expiration | | | Fair Value | |
| | | | | | | | | | | | | | | | |
| Mylan NV | | | 10 | | | | 40,000 | | | $ | 40.00 | | | | 7/20/2018 | | | | 2,740 | |
| TOTAL PUT OPTIONS WRITTEN (Proceeds $3,145) | | | | | | | | | | | | | | | | | | | 2,740 | |
| | | | | | | | | | | | | | | | | | | | | |
| TOTAL OPTIONS WRITTEN (Proceeds $126,040) | | | | | | | | | | | | | | | | | | $ | 115,170 | |
| 1 | Each option contract is equivalent to 100 shares of common stock. |
All options are non-income producing.
The accompanying notes are an integral part of these financial statements.
| HEDGEROW INCOME AND OPPORTUNITY FUND | |
| STATEMENT OF ASSETS AND LIABILITIES | |
| | |
| May 31, 2018 (Unaudited) | SEMI-ANNUAL REPORT |
| Assets: | | | |
| Investments, at value | | $ | 5,949,357 | |
| Deposits at broker | | | 614,809 | |
| Due from adviser | | | 2,205 | |
| Receivables: | | | | |
| Interest | | | 1,585 | |
| Dividends | | | 7,289 | |
| Prepaid expenses | | | 4,908 | |
| Total assets | | | 6,580,153 | |
| | | | | |
| Liabilities: | | | | |
| Options written, at value | | | 115,170 | |
| Payables: | | | | |
| Accrued distribution (12b-1) fees | | | 166 | |
| Due to administrator | | | 6,084 | |
| Accrued expenses | | | 20,054 | |
| Total liabilities | | | 141,474 | |
| Net Assets | | $ | 6,438,679 | |
| | | | | |
| Sources of Net Assets: | | | | |
| Paid-in capital | | $ | 6,333,611 | |
| Accumulated undistributed net realized gain on investments and options | | | 210,278 | |
| Accumulated net investment loss | | | (7,517 | ) |
| Net unrealized depreciation on investments and options | | | (97,693 | ) |
| Total Net Assets (Unlimited shares of beneficial interest authorized) | | $ | 6,438,679 | |
| | | | | |
| Total Investments, at cost | | $ | 6,057,920 | |
| Proceeds from options written | | $ | 126,040 | |
| | | | | |
| Class A Shares: | | | | |
| Net assets | | $ | 400,712 | |
| Shares Outstanding (Unlimited shares of beneficial interest authorized) | | | 36,712 | |
| Net Asset Value Per Share | | $ | 10.91 | |
| | | | | |
| Maximum Offering Price Per Share (a) | | $ | 11.54 | |
| | | | | |
| Minimum Redemption Price Per Share (b) | | $ | 10.80 | |
| | | | | |
| Institutional Class Shares: | | | | |
| Net assets | | $ | 6,037,967 | |
| Shares Outstanding (Unlimited shares of beneficial interest authorized) | | | 549,775 | |
| Net Asset Value, Offering and Redemption Price Per Share | | $ | 10.98 | |
| (a) | A maximum sales charge of 5.50% is imposed on Class A shares. |
| (b) | Investments in Class A shares made at or above the $1 million breakpoint are not subject to an initial sales charge and may be subject to a 1.00% contingent deferred sales charge ("CDSC") on shares redeemed within one year from the date of purchase. |
The accompanying notes are an integral part of these financial statements.
| HEDGEROW INCOME AND OPPORTUNITY FUND | |
| STATEMENT OF OPERATIONS | |
| | |
| May 31, 2018 (Unaudited) | SEMI-ANNUAL REPORT |
| | | For the | |
| | | Six Month | |
| | | Period Ended | |
| | | May 31, 2018 | |
| | | | (Unaudited) | |
| Investment income: | | | | |
| Dividends (net of foreign withholding taxes of $140) | | $ | 44,863 | |
| Interest | | | 7,006 | |
| Total investment income | | | 51,869 | |
| | | | | |
| Expenses: | | | | |
| Management fees (Note 6) | | | 37,788 | |
| Distribution (12b-1) fees - Class A | | | 499 | |
| Accounting and transfer agent fees and expenses | | | 30,495 | |
| Legal fees | | | 8,730 | |
| Trustee fees and expenses | | | 7,480 | |
| Audit fees | | | 6,982 | |
| Pricing fees | | | 7,979 | |
| Custodian fees | | | 4,987 | |
| Registration and filing fees | | | 907 | |
| Dealer network fees | | | 4,053 | |
| Miscellaneous | | | 1,977 | |
| Interest expense | | | — | |
| Insurance | | | 226 | |
| Reports to shareholders | | | 249 | |
| Total expenses | | | 112,352 | |
| Less: fees waived and expenses absorbed | | | (52,966 | ) |
| Net expenses | | | 59,386 | |
| | | | | |
| Net investment loss | | | (7,517 | ) |
| | | | | |
| Realized and unrealized gain (loss): | | | | |
| Net realized gain (loss) on: | | | | |
| Investments | | | 29,105 | |
| Options purchased | | | (298 | ) |
| Options written | | | 183,966 | |
| Net realized gain on investments and options | | | 212,773 | |
| | | | | |
| Net change in unrealized appreciation (depreciation) on: | | | | |
| Investments | | | (154,814 | ) |
| Options purchased | | | (358 | ) |
| Options written | | | 45,079 | |
| Net change in unrealized depreciation on investments and options | | | (110,093 | ) |
| | | | | |
| Net gain on investments and options | | | 102,680 | |
| | | | | |
| Net increase in net assets resulting from operations | | $ | 95,163 | |
The accompanying notes are an integral part of these financial statements.
| HEDGEROW INCOME AND OPPORTUNITY FUND | |
| STATEMENTS OF CHANGES IN NET ASSETS | |
| | |
| May 31, 2018 (Unaudited) | SEMI-ANNUAL REPORT |
| | | For the | | | | |
| | | Six Month | | | For the | |
| | | Period Ended | | | Year Ended | |
| | | May 31, 2018 | | | November 30, 2017 | |
| | | (Unaudited) | |
| Increase (decrease) in net assets from: | | | | | | | | |
| Operations: | | | | | | | | |
| Net investment loss | | $ | (7,517 | ) | | $ | (24,893 | ) |
| Net realized gain on investments and options | | | 212,773 | | | | 634,960 | |
| Net unrealized depreciation on investments and options | | | (110,093 | ) | | | (187,034 | ) |
| Net increase in net assets resulting from operations | | | 95,163 | | | | 423,033 | |
| | | | | | | | | |
| Distributions to shareholders from: | | | | | | | | |
| Net realized capital gains - Class A | | | (40,850 | ) | | | (299 | ) |
| Net realized capital gains - Institutional Class | | | (563,465 | ) | | | (3,118 | ) |
| Total distributions | | | (604,315 | ) | | | (3,417 | ) |
| | | | | | | | | |
| Capital share transactions (Note 4): | | | | | | �� | | |
| Increase in net assets from capital share transactions | | | 971,358 | | | | 1,445,839 | |
| | | | | | | | | |
| Increase in net assets | | | 462,206 | | | | 1,865,455 | |
| | | | | | | | | |
| Net Assets: | | | | | | | | |
| Beginning of period | | | 5,976,473 | | | | 4,111,018 | |
| | | | | | | | | |
| End of period | | $ | 6,438,679 | | | $ | 5,976,473 | |
| Accumulated net investment loss | | $ | (7,517 | ) | | $ | — | |
| (a) | The HedgeRow Income and Opportunity Fund commenced operations on January 21, 2016. |
The accompanying notes are an integral part of these financial statements.
| HEDGEROW INCOME AND OPPORTUNITY FUND | |
| FINANCIAL HIGHLIGHTS | |
| | |
| May 31, 2018 (Unaudited) | SEMI-ANNUAL REPORT |
The following tables set forth the per share operating performance data for a share of capital stock outstanding, total return ratios to average net assets and other supplemental data for the period indicated.
| | | | | | | | | | |
| | | | Class A | |
| | | | For the | | | | | | | | | |
| | | | Six Month | | | | For the | | | | For the | |
| | | | Period Ended | | | | Year Ended | | | | Period Ended | |
| | | | May 31, 2018 | | | | November 30, 2017 | | | | November 30, 2016 (a) | |
| | | | (Unaudited) | | | | | | | | | |
| | | | | | | | | | | | | |
| Net Asset Value, Beginning of Period | | $ | 11.97 | | | $ | 11.03 | | | $ | 10.00 | |
| | | | | | | | | | | | | |
| Investment Operations: | | | | | | | | | | | | |
| Net investment loss (b) | | | (0.03 | ) | | | (0.08 | ) | | | (0.11 | ) |
| Net realized and unrealized gain on investments and options | | | 0.20 | | | | 1.03 | | | | 1.14 | |
| Total from investment operations | | | 0.17 | | | | 0.95 | | | | 1.03 | |
| | | | | | | | | | | | | |
| Distributions: | | | | | | | | | | | | |
| From net realized capital gains | | | (1.23 | ) | | | (0.01 | ) | | | — | |
| Total distributions | | | (1.23 | ) | | | (0.01 | ) | | | — | |
| | | | | | | | | | | | | |
| Net Asset Value, End of Period | | $ | 10.91 | | | $ | 11.97 | | | $ | 11.03 | |
| | | | | | | | | | | | | |
| Total Return (c) | | | 0.43 | % | | | 8.61 | % | | | 10.30 | %(d) |
| | | | | | | | | | | | | |
| Ratios/Supplemental Data | | | | | | | | | | | | |
| Net assets, end of period (in 000's) | | $ | 401 | | | $ | 398 | | | $ | 370 | |
| | | | | | | | | | | | | |
| Ratios of expenses to average net assets: | | | | | | | | | | | | |
| Before fees waived and expenses absorbed | | | 3.95 | %(f) | | | 4.52 | %(f) | | | 7.31 | %(e) (f) |
| After fees waived and expenses absorbed | | | 2.20 | %(f) | | | 2.26 | %(f) | | | 2.30 | %(e) (f) |
| | | | | | | | | | | | | |
| Ratios of net investment loss: | | | | | | | | | | | | |
| Before fees waived and expenses absorbed | | | (2.23 | )%(f) | | | (2.99 | )%(f) | | | (6.26 | )%(e) (f) |
| After fees waived and expenses absorbed | | | (0.48 | )%(f) | | | (0.73 | )%(f) | | | (1.24 | )%(e) (f) |
| | | | | | | | | | | | | |
| Portfolio turnover rate | | | 28.47 | % | | | 94.23 | % | | | 29.55 | %(d) |
| (a) | The HedgeRow Income and Opportunity Fund commenced operations on January 21, 2016. |
| (b) | Net investment loss per share is based on average shares outstanding. |
| (c) | Total Return represents the rate that the investor would have earned or lost on an investment in the Fund, assuming reinvestment of dividends. |
| (f) | The ratios include 0.06% of interest expense during the year ended November 30, 2017 and 0.10% of interest expense during the period ended November 30, 2016. |
The accompanying notes are an integral part of these financial statements.
| HEDGEROW INCOME AND OPPORTUNITY FUND | |
| FINANCIAL HIGHLIGHTS | |
| | |
| May 31, 2018 (Unaudited) | SEMI-ANNUAL REPORT |
The following tables set forth the per share operating performance data for a share of capital stock outstanding, total return ratios to average net assets and other supplemental data for the period indicated.
| | | | | | | | | | |
| | | | Institutional Class | |
| | | | For the | | | | | | | | | |
| | | | Six Month | | | | For the | | | | For the | |
| | | | Period Ended | | | | Year Ended | | | | Period Ended | |
| | | | May 31, 2018 | | | | November 30, 2017 | | | | November 30, 2016 (a) | |
| | | | (Unaudited) | | | | | | | | | |
| | | | | | | | | | | | | |
| Net Asset Value, Beginning of Period | | $ | 12.02 | | | $ | 11.05 | | | $ | 10.00 | |
| | | | | | | | | | | | | |
| Investment Operations: | | | | | | | | | | | | |
| Net investment loss (b) | | | (0.01 | ) | | | (0.05 | ) | | | (0.09 | ) |
| Net realized and unrealized gain on investments and options | | | 0.20 | | | | 1.03 | | | | 1.14 | |
| Total from investment operations | | | 0.19 | | | | 0.98 | | | | 1.05 | |
| | | | | | | | | | | | | |
| Distributions: | | | | | | | | | | | | |
| From net realized capital gains | | | (1.23 | ) | | | (0.01 | ) | | | — | |
| Total distributions | | | (1.23 | ) | | | (0.01 | ) | | | — | |
| | | | | | | | | | | | | |
| Net Asset Value, End of Period | | $ | 10.98 | | | $ | 12.02 | | | $ | 11.05 | |
| | | | | | | | | | | | | |
| Total Return (c) | | | 0.61 | % | | | 8.86 | % | | | 10.50 | %(d) |
| | | | | | | | | | | | | |
| Ratios/Supplemental Data | | | | | | | | | | | | |
| Net assets, end of period (in 000's) | | $ | 6,038 | | | $ | 5,578 | | | $ | 3,741 | |
| | | | | | | | | | | | | |
| Ratios of expenses to average net assets: | | | | | | | | | | | | |
| Before fees waived and expenses absorbed | | | 3.70 | %(f) | | | 4.27 | %(f) | | | 7.06 | %(e) (f) |
| After fees waived and expenses absorbed | | | 1.95 | %(f) | | | 2.01 | %(f) | | | 2.05 | %(e) (f) |
| | | | | | | | | | | | | |
| Ratios of net investment loss: | | | | | | | | | | | | |
| Before fees waived and expenses absorbed | | | (1.98 | )%(f) | | | (2.74 | )%(f) | | | (6.01 | )%(e) (f) |
| After fees waived and expenses absorbed | | | (0.23 | )%(f) | | | (0.48 | )%(f) | | | (0.99 | )%(e) (f) |
| | | | | | | | | | | | | |
| Portfolio turnover rate | | | 28.47 | % | | | 94.23 | % | | | 29.55 | %(d) |
| (a) | The HedgeRow Income and Opportunity Fund commenced operations on January 21, 2016. |
| (b) | Net investment loss per share is based on average shares outstanding. |
| (c) | Total Return represents the rate that the investor would have earned or lost on an investment in the Fund, assuming reinvestment of dividends. |
| (f) | The ratios include 0.06% of interest expense during the year ended November 30, 2017 and 0.10% of interest expense during the period ended November 30, 2016. |
The accompanying notes are an integral part of these financial statements.
| HedgeRow Income and Opportunity Fund | SEMI-ANNUAL REPORT |
NOTES TO THE FINANCIAL STATEMENTS
May 31, 2018 (Unaudited)
1. ORGANIZATION AND SIGNIFICANT ACCOUNTING POLICIES
The HedgeRow Income and Opportunity Fund (the “Fund”) is a series of 360 Funds (the “Trust”). The Trust was organized on February 24, 2005 as a Delaware statutory trust. The Trust is registered as an open-end management investment company under the Investment Company Act of 1940 (the “1940 Act”). The Fund is a non-diversified Fund. As a non-diversified Fund, it may invest a significant portion of its assets in a small number of companies. The Fund’s investment objective is total return. The Fund’s investment adviser is Willard Mills Advisory, LLC (the “Adviser”). The Fund offers two classes of shares, Class A and Institutional Class shares. Each class of shares commenced operations on January 21, 2016. Each class differs as to sales and redemption charges and ongoing fees. Income and realized/unrealized gains or losses are allocated to each class based on relative share balances.
The following is a summary of the significant accounting policies followed by the Fund in the preparation of its financial statements. The Fund is an investment company that follows the accounting and reporting guidance of Accounting Standards Codification Topic 946 applicable to investment companies.
a) Security Valuation – All investments in securities are recorded at their estimated fair value, as described in note 2.
b) Options – The Fund uses an option strategy in an effort to limit market exposure and volatility. The extent of option selling will depend upon market conditions and the Adviser’s judgment of the advantages of selling call options on the Fund’s equity investments. The sale of put options generates income for the Fund, but exposes it to the risk of declines in the value of the underlying assets. The risk in purchasing options is limited to the premium paid by the Fund for the options. The sale of call options generates income for the Fund, but may limit the Fund's participation in equity market gains. The Fund’s investment advisor seeks to reduce the overall volatility of returns for the Fund by managing a portfolio of options. When the Fund writes or purchases an option, an amount equal to the premium received or paid by the Fund is recorded as a liability or an asset and is subsequently adjusted to the current market value of the option written or purchased. Premiums received or paid from writing or purchasing options which expire unexercised are treated by the Fund on the expiration date as realized gains or losses. The difference between the premium and the amount paid or received on effecting a closing purchase or sale transaction, including brokerage commissions, is also treated as a realized gain or loss. If an option is exercised, the premium paid or received is added to the cost of the purchase or proceeds from the sale in determining whether the Fund has realized a gain or a loss on investment transactions.
Purchasing and writing put and call options are highly specialized activities and entail greater than ordinary investment risks. The successful use of options depends in part on the ability of the Adviser to manage future price fluctuations and the degree of correlation between the options and securities markets. By writing put options on equity securities, the Fund strike prices of the written put options, but continues to bear the risk of declines in the value of its common stock portfolio. The Fund will receive a premium from writing a covered call option that it retains whether or not the option is exercised. The premium received from the written options may not be sufficient to offset any losses sustained from the volatility of the underlying equity securities over time.
c) Federal Income Taxes – The Fund has qualified and intends to continue to qualify as a regulated investment company under Subchapter M of the Internal Revenue Code of 1986, as amended (the “Code”). It is the policy of the Fund to comply with the requirements of the Code applicable to regulated investment companies and to distribute substantially all of its net investment company taxable income and net capital gains. The Fund also intends to distribute sufficient net investment income and net capital gains, if any, so that it will not be subject to excise tax on undistributed income and gains. Therefore, no federal income tax or excise provision is required.
As of and for the six month period ended May 31, 2018, the Fund did not have a liability for any unrecognized tax expenses. The Fund recognizes interest and penalties, if any, related to unrecognized tax liability as income tax expense in the statement of operations. For the six month period ended May 31, 2018, the Fund did not incur any interest or penalties. The Fund identifies its major tax jurisdiction as U.S. Federal.
In addition, accounting principles generally accepted in the United States of America (“GAAP”) requires management of the Fund to analyze all open tax years, as defined by IRS statute of limitations for all major industries, including federal tax authorities and certain state tax authorities. As of and for the six month period ended May 31, 2018, and for all other open tax years, the Fund did not have a liability for any unrecognized tax benefits. The Fund has no examinations in progress and is not aware of any tax positions for which it is reasonably possible that the total tax amounts of unrecognized tax benefits will significantly change in the next twelve months.
| HedgeRow Income and Opportunity Fund | SEMI-ANNUAL REPORT |
NOTES TO THE FINANCIAL STATEMENTS
May 31, 2018 (Unaudited)
1. ORGANIZATION AND SIGNIFICANT ACCOUNTING POLICIES (continued)
d) Distributions to Shareholders – Dividends from net investment income and distributions of net realized capital gains, if any, will be declared and paid at least annually. Income and capital gain distributions, which are determined in accordance with income tax regulations, are recorded on the ex-dividend date. GAAP requires that permanent financial reporting differences relating to shareholder distributions be reclassified to paid-in capital or net realized gains.
e) Use of Estimates – The preparation of financial statements in conformity with GAAP requires management to make estimates and assumptions that affect the reported amounts of assets and liabilities and disclosure of contingent assets and liabilities at the date of the financial statements and the reported amounts of revenues and expenses during the reporting period. Actual results could differ from those estimates.
f) Non-Diversified Fund – The Fund is a non-diversified fund. In general, a non-diversified fund may invest a greater percentage of its assets in a particular issue and may own fewer securities than other mutual funds. Accordingly, a non-diversified fund is generally subject to the risk that a large loss in an individual issue will cause a greater loss for the fund than it would if the fund was required to hold a larger number of securities or smaller positions.
g) Other – Investment and shareholder transactions are recorded on trade date. The Fund determines the gain or loss realized from the investment transactions by comparing the original cost of the security lot sold with the net sales proceeds. Dividend income is recognized on the ex-dividend date or as soon as information is available to the Fund and interest income is recognized on an accrual basis. Withholding taxes on foreign dividends have been provided for in accordance with the Fund’s understanding of the applicable country’s tax rules and rates.
h) Sales Charges – A maximum sales charge of 5.50% is imposed on certain purchases of Class A shares. A contingent deferred sales charge (“CDSC”) is imposed upon certain redemptions of Class A shares purchased at net asset value in amounts totaling $1 million if the dealer’s commission was paid by the underwriter and the shares are redeemed within one year from the date of purchase. The CDSC will be paid to the Distributor and will be equal to 1.00% of the lesser of (1) the net asset value at the time of purchase of the Class A shares being redeemed; or (2) the net asset value of such shares at the time of redemption. There were no CDSC Fees paid to the Distributor for the six month period ended May 31, 2018.
2. SECURITIES VALUATIONS
Processes and Structure
The Fund’s Board of Trustees has adopted guidelines for valuing securities and other derivative instruments including in circumstances in which market quotes are not readily available, and has delegated authority to the Adviser to apply those guidelines in determining fair value prices, subject to review by the Board of Trustees.
Hierarchy of Fair Value Inputs
The Fund utilizes various methods to measure the fair value of most of its investments on a recurring basis. GAAP establishes a hierarchy that prioritizes inputs to valuation techniques used to measure fair value. The three levels of inputs are as follows:
| • | Level 1 – Unadjusted quoted prices in active markets for identical assets or liabilities that the Fund has the ability to access. |
| • | Level 2 – Observable inputs other than quoted prices included in level 1 that are observable for the asset or liability either directly or indirectly. These inputs may include quoted prices for the identical instrument on an inactive market, prices for similar instruments, interest rates, prepayment speeds, credit risk, yield curves, default rates, and similar data. |
| • | Level 3 – Unobservable inputs for the asset or liability to the extent that relevant observable inputs are not available, representing the Fund’s own assumptions about the assumptions that a market participant would use in valuing the asset or liability, and that would be based on the best information available. |
The availability of observable inputs can vary from security to security and is affected by a wide variety of factors, including, for example, the type of security, whether the security is new and not yet established in the marketplace, the liquidity of markets, and other characteristics particular to the security. To the extent that valuation is based on models or inputs that are less observable or unobservable in the market, the determination of fair value requires more judgment. Accordingly, the degree of judgment exercised in determining fair value is greatest for instruments categorized in level 3.
| HedgeRow Income and Opportunity Fund | SEMI-ANNUAL REPORT |
NOTES TO THE FINANCIAL STATEMENTS
May 31, 2018 (Unaudited)
2. SECURITIES VALUATIONS (continued)
The inputs used to measure fair value may fall into different levels of the fair value hierarchy. In such cases, for disclosure purposes, the level in the fair value hierarchy within which the fair value measurement falls in its entirety is determined based on the lowest level input that is significant to the fair value measurement in its entirety.
Fair Value Measurements
A description of the valuation techniques applied to the Trust's major categories of assets and liabilities measured at fair value on a recurring basis follows.
Equity securities (common stock) – Securities traded on a national securities exchange (or reported on the NASDAQ national market) are stated at the last reported sales price on the day of valuation. To the extent these securities are actively traded, and valuation adjustments are not applied, they are categorized in level 1 of the fair value hierarchy. Certain foreign securities may be fair valued using a pricing service that considers the correlation of the trading patterns of the foreign security to the intraday trading in the U.S. markets for investments such as American Depositary Receipts, financial futures, Exchange Traded Funds, and the movement of the certain indexes of securities based on a statistical analysis of the historical relationship and that are categorized in level 2. Preferred stock and other equities traded on inactive markets or valued by reference to similar instruments are also categorized in level 2.
Money market funds – Money market funds are valued at their net asset value of $1.00 per share and are categorized as level 1.
Derivative instruments – Listed derivatives, including options, that are actively traded, are valued based on quoted prices from the exchange and categorized in level 1 of the fair value hierarchy. Options held by the Fund for which no current quotations are readily available and which are not traded on the valuation date are valued at the mean price and are categorized within level 2 of the fair value hierarchy. Over-the-counter (OTC) derivative contracts include forward, swap, and option contracts related to interest rates; foreign currencies; credit standing of reference entities; equity prices; or commodity prices, and warrants on exchange-traded securities. Depending on the product and terms of the transaction, the fair value of the OTC derivative products can be modeled taking into account the counterparties' creditworthiness and using a series of techniques, including simulation models. Many pricing models do not entail material subjectivity because the methodologies employed do not necessitate significant judgments, and the pricing inputs are observed from actively quoted markets, as is the case of interest rate swap and option contracts. OTC derivative products valued using pricing models are categorized within level 2 of the fair value hierarchy.
If the Adviser decides that a price provided by the pricing service does not accurately reflect the fair value of the securities, when prices are not readily available from a pricing service, or when certain restricted or illiquid securities are being valued, securities are valued at fair value as determined in good faith by the Adviser, in conformity with guidelines adopted by and subject to review of the Board and the Fair Valuation Committee. These securities will be categorized as level 3 securities.
The following tables summarize the inputs used to value the Fund’s assets and liabilities measured at fair value as of May 31, 2018.
| Financial Instruments – Assets | | | | | | | | | | | | |
| | | | | | | | | | | | | |
| Security Classification (1) | | Level 1 | | | Level 2 | | | Level 3 | | | Totals | |
| Common Stock (2) | | $ | 5,509,090 | | | $ | — | | | $ | — | | | $ | 5,509,090 | |
| Call Options Purchased | | | 50 | | | | — | | | | — | | | | 50 | |
| Short-Term Investments | | | 440,217 | | | | — | | | | — | | | | 440,217 | |
| Total Assets | | $ | 5,949,357 | | | $ | — | | | $ | — | | | $ | 5,949,357 | |
| | | | | | | | | | | | | | | | | |
| HedgeRow Income and Opportunity Fund | SEMI-ANNUAL REPORT |
NOTES TO THE FINANCIAL STATEMENTS
May 31, 2018 (unaudited)
2. SECURITIES VALUATIONS (continued)
| Derivative Instruments – Liabilities | | | | | | | | | | | | |
| | | | | | | | | | | | | |
| Security Classification (1) | | Level 1 | | | Level 2 | | | Level 3 | | | Totals | |
| Call Options Written | | $ | 112,430 | | | $ | — | | | $ | — | | | $ | 112,430 | |
| Put Options Written | | | 2,740 | | | | — | | | | — | | | | 2,740 | |
| Total Liabilities | | $ | 115,170 | | | $ | — | | | $ | — | | | $ | 115,170 | |
| | | | | | | | | | | | | | | | | |
| | | | | | | | | | | | | | | | | |
(1) As of and for the six month period ended May 31, 2018, the Fund held no securities that were considered to be “level 3” securities (those valued using significant unobservable inputs). Therefore, a reconciliation of assets in which significant unobservable inputs (level 3) were used in determining fair value is not applicable.
(2) All common stock held in the Fund are level 1 securities. For a detailed break-out of common stock by industry, please refer to the Schedule of Investments.
There were no transfers into and out of any level for the six month period ended May 31, 2018. It is the Fund’s policy to recognize transfers between levels at the end of the reporting period.
During the six month period ended May 31, 2018, no securities were fair valued.
3. DERIVATIVES TRANSACTIONS
As of May 31, 2018, portfolio securities valued at $1,593,703 were held in escrow by the custodian as cover for options written by the Fund.
As of May 31, 2018, the location on the Statements of Assets and Liabilities for financial derivative instrument fair values is as follows:
| Assets | | Location | | | Equity Contracts | | | Total | |
| Call options written | | Investments, at value | | | $ | 50 | | | $ | 50 | |
| Total Assets | | | | | $ | 50 | | | $ | 50 | |
| Liabilities | | Location | | | Equity Contracts | | | Total | |
| Call options written | | Options written, at value | | | $ | 112,430 | | | $ | 112,430 | |
| Put options written | | Options written, at value | | | | 2,740 | | | | 2,740 | |
| Total Liabilities | | | | | $ | 115,170 | | | $ | 115,170 | |
Realized and unrealized gains and losses on derivatives contracts entered into by the Fund for the six month period ended May 31, 2018, are recorded in the following locations in the Statement of Operations:
| Net change in unrealized appreciation (depreciation) on: | | Location | | Equity Contracts | | | Total | |
| Call options purchased | | Options purchased | | $ | (358 | ) | | $ | (358 | ) |
| Call options written | | Options written | | | 41,828 | | | | 41,828 | |
| Put option written | | Options written | | | 3,251 | | | | 3,251 | |
| | | | | $ | 44,721 | | | $ | 44,721 | |
| HedgeRow Income and Opportunity Fund | SEMI-ANNUAL REPORT |
NOTES TO THE FINANCIAL STATEMENTS
May 31, 2018 (Unaudited)
3. DERIVATIVES TRANSACTIONS (continued)
| Net realized gain (loss) on: | | Location | | Equity Contracts | | | Total | |
| Call options purchased | | Options purchased | | $ | (298 | ) | | $ | (298 | ) |
| Call options written | | Options written | | | 111,139 | | | | 111,139 | |
| Put option written | | Options written | | | 72,827 | | | | 72,827 | |
| | | | | $ | 183,668 | | | $ | 183,668 | |
For the six month period ended May 31, 2018, the total amount of all options, as presented in the Schedule of Written Options, is representative of the volume of activity for these derivative types during the period.
The following tables present the Fund’s liability derivatives available for offset under a master netting arrangement net of collateral pledged as of May 31, 2017.
| Liabilities: | | | | Gross Amounts of Liabilities Presented in the Statement of Assets & Liabilities | |
| | | | Gross Amounts of Recognized Liabilities | | | Gross Amounts Offset in the Statement of Financial Position | | | Net Amounts of Liabilities Presented in the Statement of Financial Position | | | | Financial Instruments Pledged | | | Cash Collateral Pledged | | | Net Amount of Liabilities | |
| Options Contracts Written | | | $ | 115,170 | (1) | | $ | — | | | $ | 115,170 | (1) | | | $ | 115,170 | (2) | | $ | — | | | $ | — | |
| Total | | | $ | 115,170 | (1) | | $ | — | | | $ | 115,170 | (1) | | | $ | 115,170 | (2) | | $ | — | | | $ | — | |
(1) Written options at value as presented in the Fund’s Schedule of Written Options.
(2) The amounts are limited to the derivative asset and liability balances and accordingly do not include excess collateral pledged.
4. CAPITAL SHARE TRANSACTIONS
Transactions in shares of capital stock for the Fund for the six month period ended May 31, 2018 were as follows:
| | | Sold | | | Redeemed | | | Reinvested | | | Net Increase | |
| Class A | | | | | | | | | | | | | | | | |
| Shares | | | 969 | | | | (1,284 | ) | | | 3,734 | | | | 3,419 | |
| Value | | $ | 10,733 | | | $ | (13,832 | ) | | $ | 40,850 | | | $ | 37,751 | |
| Institutional Class | | | | | | | | | | | | | | | | |
| Shares | | | 53,487 | | | | (14,372 | ) | | | 46,532 | | | | 85,647 | |
| Value | | $ | 583,980 | | | $ | (161,759 | ) | | $ | 511,386 | | | $ | 933,607 | |
Transactions in shares of capital stock for the Fund for the year ended November 30, 2017 were as follows:
| | | Sold | | | Redeemed | | | Reinvested | | | Net Increase
(Decrease) | |
| Class A | | | | | | | | | | | | | | | | |
| Shares | | | 1,883 | | | | (2,169 | ) | | | 27 | | | | (259 | ) |
| Value | | $ | 21,808 | | | $ | (25,200 | ) | | $ | 299 | | | $ | (3,093 | ) |
| Institutional Class | | | | | | | | | | | | | | | | |
| Shares | | | 131,251 | | | | (6,039 | ) | | | 243 | | | | 125,455 | |
| Value | | $ | 1,514,916 | | | $ | (68,724 | ) | | $ | 2,740 | | | $ | 1,448,932 | |
| HedgeRow Income and Opportunity Fund | SEMI-ANNUAL REPORT |
NOTES TO THE FINANCIAL STATEMENTS
May 31, 2018 (Unaudited)
5. INVESTMENT TRANSACTIONS
For the six month period ended May 31, 2018, aggregate purchases and sales of investment securities (excluding short-term investments) for the Fund were as follows:
| Purchases | | | Sales | |
| $ | 2,647,385 | | | $ | 1,391,235 | |
There were no U.S. Government securities purchased or sold during the year.
6. ADVISORY FEES AND OTHER RELATED PARTY TRANSACTIONS
The Fund has entered into an Investment Advisory Agreement (the “Advisory Agreement”) with the Adviser. Pursuant to the Advisory Agreement, the Adviser manages the operations of the Fund and manages the Fund’s investments in accordance with the stated policies of the Fund. As compensation for the investment advisory services provided to the Fund, the Adviser will receive a monthly management fee equal to an annual rate of 1.25% of the Fund’s net assets. For the six month period ended May 31, 2018, the Adviser earned $37,788 of management fees.
The Adviser has entered into an Expense Limitation Agreement with the Fund under which it has agreed to waive or reduce its fees and to assume other expenses of the Fund, if necessary, in an amount that limits the Fund’s annual operating expenses (exclusive of interest, taxes, brokerage fees and commissions, acquired funds fees and expenses, extraordinary expenses, dividend and interest expenses related to short investments, and payments, if any, under the Rule 12b-1 Plan) to not more than 1.95% through at least March 31, 2019. Subject to approval by the Fund’s Board, any waiver under the Expense Limitation Agreement is subject to repayment by the Fund within the three fiscal years following the year in which such waiver occurred, if the Fund is able to make the payment without exceeding the 1.95% expense limitation. The current contractual agreement cannot be terminated prior to at least one year after the effective date without the Board of Trustees’ approval. For the six month period ended May 31, 2018, the Adviser waived advisory fees of $37,788 and reimbursed expenses of $15,178.
If, at any time, the annualized expenses of the Fund are less than the annualized expense limitation ratios, the Fund would reimburse the Adviser for any fees previously waived and/or expenses previously assumed; provided, however, that repayment would be payable only to the extent that it (a) can be made during the three (3) years following the time at which the Adviser waived fees or assumed expenses for the Fund, and (b) can be repaid without causing the expenses of the Fund to exceed the annualized expense limitation ratios. The cumulative unreimbursed amount paid and/or waived by the Adviser on behalf of the Fund is $266,493, of which $52,966 can be recouped no later than November 30, 2021, $114,816 can be recouped no later than November 30, 2020 and $98,711 can be recouped no later than November 30, 2019.
The Fund has entered into an Investment Company Services Agreement (“ICSA”) with M3Sixty Administration, LLC (“M3Sixty”). Pursuant to the ICSA, M3Sixty will provide day-to-day operational services to the Fund including, but not limited to: (a) Fund accounting services; (b) financial statement preparation; (c) valuation of the Fund's portfolio securities; (d) pricing the Fund's shares; (e) assistance in preparing tax returns; (f) preparation and filing of required regulatory reports; (g) communications with shareholders; (h) coordination of Board and shareholder meetings; (i) monitoring the Fund's legal compliance; (j) maintaining shareholder account records.
For the six month period ended May 31, 2018, M3Sixty earned $30,495, including out of pocket expenses with $6,084 remaining payable at May 31, 2018.
Certain officers and an interested Trustee of the Trust are also employees and/or officers of M3Sixty.
| HedgeRow Income and Opportunity Fund | SEMI-ANNUAL REPORT |
NOTES TO THE FINANCIAL STATEMENTS
May 31, 2018 (Unaudited)
6. ADVISORY FEES AND OTHER RELATED PARTY TRANSACTIONS (continued)
The Fund has entered into a Distribution Agreement with Matrix 360 Distributors, LLC (“M3SixtyD” or the “Distributor”). Pursuant to the Distribution Agreement, the Distributor provides distribution services to the Fund. The Distributor served as underwriter/distributor of the Fund. M3SixtyD may receive commissions from the sale of Class A shares. During the six month period ended May 31, 2018, commissions of $97 were paid to the Distributor.
M3SixtyD is an affiliate of M3Sixty.
The Fund has adopted a Distribution Plan (“Plan”) pursuant to Rule 12b-1 under the Investment Company Act of 1940 for its Class A shares. The Fund may expend up to 0.25% for Class A shares of the Fund’s average daily net assets annually to pay for any activity primarily intended to result in the sale of shares of the Fund and the servicing of shareholder accounts, provided that the Trustees have approved the category of expenses for which payment is being made.
The distribution plan for the Class A shares of the Fund took effect October 7, 2015. For the six month period ended May 31, 2018, the Fund accrued $499 in 12b-1 expenses attributable to Class A shares.
7. TAX MATTERS
For U.S. Federal income tax purposes, the cost of securities owned, gross appreciation, gross depreciation, and net unrealized appreciation/(depreciation) of investments at May 31, 2018 were as follows:
| Cost | | | Gross Appreciation | | | Gross Depreciation | | | Net Depreciation | |
| $ | 6,059,382 | | | $ | 254,490 | | | $ | (364,515 | ) | | $ | 110,025 | |
The difference between book basis and tax basis unrealized appreciation (depreciation) is primarily attributable to the tax deferral of losses on wash sales.
The Fund’s tax basis distributable earnings are determined only at the end of each fiscal year. The tax character of distributable earnings (deficit) at November 30, 2017, the Fund’s most recent fiscal year end, was as follows:
| Unrealized Appreciation (Depreciation) | | | Undistributed Ordinary Income | | | Undistributed Long-Term Capital Gains | | | Capital Loss Carry Forwards | | | Post-October Loss and Late Year Loss | | | Total Distributable Earnings | |
| $ | 10,938 | | | $ | 393,865 | | | $ | 209,417 | | | $ | — | | | $ | — | | | $ | 614,220 | |
The difference between book basis and tax basis unrealized appreciation (depreciation), post-October loss and late year loss and accumulated net realized losses from investments is primarily attributable to the tax deferral of losses on wash sales.
Under current tax law, net capital losses realized after October 31st and net ordinary losses incurred after December 31st may be deferred and treated as occurring on the first day of the following fiscal year. The Fund’s carryforward losses, post-October losses and post-December losses are determined only at the end of each fiscal year. As of November 30, 2017, the Fund elected to defer net capital losses as indicated in the chart below.
| | Post-October Losses | | | | Post-December Losses | |
| | Deferred | | | | Utilized | | | | Deferred | | | | Utilized | |
| $ | — | | | $ | 5,563 | | | $ | — | | | $ | — | |
In accordance with accounting pronouncements, the Fund has recorded reclassifications in the capital accounts. These reclassifications have no impact on the net asset value of the Fund and are designed generally to present accumulated undistributed net investment income (loss) and accumulated realized losses on a tax basis which is considered to be more informative to the shareholder. As of November 30, 2017, the Fund recorded reclassifications to increase (decrease) the capital accounts as follows:
Net Investment Loss | | | Net Realized Loss | | | Paid-in Capital | |
| $ | 24,893 | | | $ | (24,893 | ) | | $ | — | |
| HedgeRow Income and Opportunity Fund | SEMI-ANNUAL REPORT |
NOTES TO THE FINANCIAL STATEMENTS
May 31, 2018 (unaudited)
| 7. | TAX MATTERS (continued) |
Under the Regulated Investment Company Modernization Act of 2010 (the “Act”), net capital losses recognized after December 31, 2010, may be carried forward indefinitely, and their character is retained as short-term and/or long-term. As of November 30, 2017, the Fund had no capital loss carryforwards for federal income tax purposes.
For the six month period ended May 31, 2018, the Fund distributed $393,866 of ordinary income and $210,449 of long-term capital gains.
For the year ended November 30, 2017, the Fund distributed $3,417 of ordinary income.
The beneficial ownership, either directly or indirectly, of more than 25% of the voting securities of a fund creates a presumption of control of the fund, under Section 2(a)(9) of the Investment Company Act of 1940. As of May 31, 2018, Charles Schwab and Co., Inc. held 76.74% of the Fund’s shares in omnibus accounts for the sole benefit of its customers. The Trust does not know whether any of the underlying beneficial shareholders of the omnibus accounts held by Charles Schwab and Co., Inc. own more than 25% of the voting securities of the Fund.
| 9. | COMMITMENTS AND CONTINGENCIES |
In the normal course of business, the Trust may enter into contracts that may contain a variety of representations and warranties and provide general indemnifications. The Trust’s maximum exposure under these arrangements is dependent on future claims that may be made against the Funds and, therefore, cannot be estimated; however, management considers the risk of loss from such claims to be remote.
In accordance with GAAP, Management has evaluated the impact of all subsequent events on the Fund through the date the financial statements were issued, and has determined that there were no subsequent events requiring recognition or disclosure in the financial statements.
| HedgeRow Income and Opportunity Fund | SEMI-ANNUAL REPORT |
ADDITIONAL INFORMATION
May 31, 2018 (Unaudited)
The Fund files its complete schedules of portfolio holdings with the Securities and Exchange Commission (the “Commission”) for the first and third quarters of each fiscal year on Form N-Q. The Fund’s Forms N-Q are available on the Commission’s website at http://www.sec.gov. The Fund’s Forms N-Q may be reviewed and copied at the Commission’s Public Reference Room in Washington, DC. Information on the operation of the Commission’s Public Reference Room may be obtained by calling 1-800-SEC-0330.
A description of the policies and procedures that the Fund uses to determine how to vote proxies relating to portfolio securities is available without charge, upon request, by calling 1-877-244-6235; and on the Commission’s website at http://www.sec.gov.
Information regarding how the Fund voted proxies relating to portfolio securities during the most recent 12-month period ended June 30th is available without charge, upon request, by calling 1-877-244-6235; and on the Commission’s website at http://www.sec.gov.
Shareholder Tax Information - The Fund is required to advise you within 60 days of the Fund’s fiscal year end regarding the federal tax status of distributions received by shareholders during the fiscal year. The Fund paid $393,866 of ordinary income distributions and $210,449 of long-term capital gains distributions for the six month period ended May 31, 2018.
Tax information is reported from the Fund’s fiscal year and not calendar year, therefore, shareholders should refer to their Form 1099-DIV or other tax information which will be mailed in 2019 to determine the calendar year amounts to be included on their 2018 tax returns. Shareholders should consult their own tax advisors.
BOARD OF TRUSTEES, OFFICERS AND PRINCIPAL SHAREHOLDERS
The Trustees are responsible for the management and supervision of the Funds. The Trustees approve all significant agreements between the Trust, on behalf of the Fund, and those companies that furnish services to the Fund; review performance of the Fund; and oversee activities of the Fund. This section provides information about the persons who serve as Trustees and Officers to the Trust and Fund, respectively. The Statement of Additional Information of the Trust includes additional information about the Fund’s Trustees and is available upon request, without charge, by calling (877) 244-6235.
Remuneration Paid to Trustees and Officers - Officers of the Trust and Trustees who are “interested persons” of the Trust or the Adviser will receive no salary or fees from the Trust. Officers of the Trust and interested Trustees do receive compensation directly from certain service providers to the Trust, including Matrix Capital Group, Inc., Matrix 360 Distributors, LLC and M3Sixty Administration LLC. Each Trustee who is not an “interested person” receives a fee of $1,500 each year plus $200 per Board or committee meeting attended. The Trust reimburses each Trustee and officer for his or her travel and other expenses relating to attendance at such meetings.
| Name of Trustee1 | | Aggregates Compensation From each Fund2 | | | Pension or Retirement Benefits Accrued As Part of Portfolio Expenses | | Estimated Annual Benefits Upon Retirement | | Total Compensation From the Funds Paid to Trustees2 | |
| Independent Trustees | |
| Art Falk | | $ | 1,150 | | | None | | None | | $ | 1,150 | |
| Thomas Krausz | | $ | 1,150 | | | None | | None | | $ | 1,150 | |
| Tom M. Wirtshafter | | $ | 1,150 | | | None | | None | | $ | 1,150 | |
| Gary DiCenzo | | $ | 1,150 | | | None | | None | | $ | 1,150 | |
| Interested Trustees and Officers | |
| Randall K. Linscott | | | None | | | Not Applicable | | Not Applicable | | | None | |
1 Each of the Trustees serves as a Trustee to each Series of the Trust. The Trust currently offers thirteen (13) series of shares.
2 Figures are for the six month period ended May 31, 2018.
| HedgeRow Income and Opportunity Fund | SEMI-ANNUAL REPORT |
Information About Your Fund’s Expenses – (Unaudited)
As a shareholder of the Fund, you incur two types of costs: (1) transaction costs, such as the sales charge (load) imposed on certain subscriptions and the contingent deferred sales charge (“CDSC”) imposed on certain short-term redemptions; and (2) ongoing costs, including management fees, distribution and/or service (12b-1) fees; and other Fund expenses. The example below is intended to help you understand your ongoing costs (in dollars) of investing in the Fund and to compare these costs with the ongoing costs of investing in other mutual funds.
The example is based on an investment of $1,000 invested at the beginning of the period and held for the entire period as indicated below.
Actual Expenses – The first section of the table provides information about actual account values and actual expenses (relating to the example $1,000 investment made at the beginning of the period). You may use the information in this section, together with the amount you invested, to estimate the expenses that you paid over the period. Simply divide your account value by $1,000 (for example, an $8,600 account value divided by $1,000 = 8.6), then multiply the result by the number in the first section under the heading entitled “Expenses Paid During Period” to estimate the expenses you paid on your account during this period.
Hypothetical Example for Comparison Purposes – The second section of the table provides information about the hypothetical account values and hypothetical expenses based on the Fund’s actual expense ratios and an assumed rate of return of 5% per year before expenses, which is not the Fund’s actual return. The hypothetical account values and expenses may not be used to estimate the actual ending account balance or expenses you paid for the period. You may use this information to compare the ongoing costs of investing in the Fund to other funds. To do so, compare this 5% hypothetical example with the 5% hypothetical examples that appear in the shareholder reports of the other funds.
Please note that the expenses shown in the table are meant to highlight your ongoing costs only and do not reflect any transactional costs, such as sales charges (loads), CDSC fees, or exchange fees. Therefore, the second section of the table is useful in comparing ongoing costs only, and will not help you determine the relative total costs of owning different funds. In addition, if these transactional costs were included, your costs would have been higher. For more information on transactional costs, please refer to the Fund’s prospectus.
| Expenses and Value of a $1,000 Investment for the period from 12/01/17 through 05/31/18 | |
| | |
| | | Beginning Account
Value (12/01/2017) | | | Annualized Expense
Ratio for the Period | | | Ending Account Value (05/31/2017) | | | Expenses Paid
During Period (a) | |
| Actual Fund Return (in parentheses) | | | | | | | | | |
| Class A (+1.37%) | | $ | 1,000.00 | | | | 2.20 | % | | $ | 1,013.70 | | | $ | 11.05 | |
| Institutional Class (+1.55%) | | $ | 1,000.00 | | | | 1.95 | % | | $ | 1,015.50 | | | $ | 9.80 | |
| Hypothetical 5% Return | | | | | | | | | | | | | | | | |
| Class A | | $ | 1,000.00 | | | | 2.20 | % | | $ | 1,014.00 | | | $ | 11.05 | |
| Institutional Class | | $ | 1,000.00 | | | | 1.95 | % | | $ | 1,015.20 | | | $ | 9.80 | |
| (a) | Expenses are equal to the Fund’s annualized expense ratios, multiplied by the average account value over the period, multiplied by 182/365 to reflect the one-half year period. |
For more information on Fund expenses, please refer to the Fund’s prospectus, which can be obtained from your investment representative or by calling 1-877-244-6235. Please read it carefully before you invest or send money.
| HedgeRow Income and Opportunity Fund | SEMI-ANNUAL REPORT |
Information About Your Fund’s Expenses – (Unaudited) (continued)
Total Fund operating expense ratios as stated in the current Fund prospectus dated March 30, 2018 for the Fund were as follows: |
| HedgeRow Income and Opportunity Fund Class A, gross of fee waivers or expense reimbursements | 4.54% |
| HedgeRow Income and Opportunity Fund Class A, after waiver and reimbursement* | 2.28% |
| HedgeRow Income and Opportunity Fund Institutional Class, gross of fee waivers or expense reimbursements | 4.29% |
| HedgeRow Income and Opportunity Fund Institutional Class, after waiver and reimbursement* | 2.03% |
* Willard Mills Advisory, LLC (the “Adviser”) has entered into an Expense Limitation Agreement with the Fund under which it has agreed to waive or reduce its fees and to assume other expenses of the Fund, if necessary, in an amount that limits the Fund’s annual operating expenses (exclusive of interest, taxes, brokerage fees and commissions, acquired fund fees and expenses, extraordinary expenses, dividend and interest expenses related to short investments, and payments, if any, under the Rule 12b-1 Plan) to not more than 1.95% through at least March 31, 2019. Subject to approval by the Fund’s Board, any waiver under the Expense Limitation Agreement is subject to repayment by the Fund within the three fiscal years following the year in which such waiver occurred, if the Fund is able to make the payment without exceeding the 1.95% expense limitation. The current contractual agreement cannot be terminated prior to at least one year after the effective date without the Board of Trustees’ approval. Total Gross Operating Expenses for the six month period ended May 31, 2018 were 3.95% and 3.70% for the HedgeRow Income and Opportunity Fund Class A shares and HedgeRow Income and Opportunity Fund Institutional Class shares, respectively. Please see the Information About Your Fund’s Expenses, the Financial Highlights and Notes to Financial Statements (Note 6) sections of this report for expense related disclosures for the six month period ended May 31, 2018. |
360 FUNDS
4300 Shawnee Mission Pkwy
Suite 100
Fairway, KS 66205
INVESTMENT ADVISER
Willard Mills Advisory, LLC
P.O. Box 2549
Brentwood, TN 37024-2549
ADMINISTRATOR & TRANSFER AGENT
M3Sixty Administration, LLC
4300 Shawnee Mission Pkwy
Suite 100
Fairway, KS 66205
DISTRIBUTOR
Matrix 360 Distributors, LLC
4300 Shawnee Mission Pkwy
Suite 100
Fairway, KS 66205
INDEPENDENT REGISTERED PUBLIC ACCOUNTING FIRM
Sanville & Company
1514 Old York Road
Abington, PA 19001
LEGAL COUNSEL
Practus, LLP
11300 Tomahawk Creek Parkway
Suite 310
Leawood, KS 66211
CUSTODIAN BANK
Fifth Third Bank
Fifth Third Center
38 Fountain Square Plaza
Cincinnati, OH 45263
Not applicable at this time.
| ITEM 3. | AUDIT COMMITTEE FINANCIAL EXPERT. |
Not applicable at this time.
| ITEM 4. | PRINCIPAL ACCOUNTANT FEES AND SERVICES. |
Not applicable at this time.
| ITEM 5. | AUDIT COMMITTEE OF LISTED REGISTRANTS. |
Not applicable.
| ITEM 6. | SCHEDULE OF INVESTMENTS. |
Included in semi-annual report to shareholders filed under item 1 of this form.
| ITEM 7. | DISCLOSURE OF PROXY VOTING POLICIES AND PROCEDURES FOR CLOSED-END MANAGEMENT INVESTMENT COMPANIES. |
Not applicable as the Fund is an open-end management investment company.
| ITEM 8. | PORTFOLIO MANAGERS OF CLOSED-END MANAGEMENT INVESTMENT COMPANIES. |
Not applicable as the Fund is an open-end management investment company.
| ITEM 9. | PURCHASES OF EQUITY SECURITIES BY CLOSED-END MANAGEMENT INVESTMENT COMPANY AND AFFILIATED PURCHASERS. |
Not applicable as the Fund is an open-end management investment company.
| ITEM 10. | SUBMISSION OF MATTERS TO A VOTE OF SECURITY HOLDERS. |
Not applicable at this time.
| ITEM 11. | CONTROLS AND PROCEDURES. |
| (a) | The registrant's principal executive and principal financial officers, or persons performing similar functions, have concluded that the registrant's disclosure controls and procedures (as defined in Rule 30a-3(c) under the 1940 Act, are effective, as of a date within 90 days of the filing date of this report, based on the evaluation of these controls and procedures required by Rule 30a-3(b) under the 1940 Act and Rule 15d-15(b) under the Securities Exchange Act of 1934, as amended. |
| (b) | There were no changes in the registrant's internal control over financial reporting (as defined in Rule 30a-3(d) under the 1940 Act) that occurred during the period covered by this report that have materially affected, or are reasonably likely to materially affect, the registrant's internal control over financial reporting. |
| ITEM 12. | DISCLOSURE OF SECURITIES LENDING ACTIVITIES FOR CLOSED-END MANAGEMENT INVESTMENT COMPANIES. |
Not applicable as the Fund is an open-end management investment company.
(1) Certifications pursuant to Section 302 of the Sarbanes-Oxley Act of 2002 are filed herewith.
(2) Certifications pursuant to Section 906 of the Sarbanes-Oxley Act of 2002 are filed herewith.
SIGNATURES
Pursuant to the requirements of the Securities Exchange Act of 1934 and the Investment Company Act of 1940, the registrant has duly caused this report to be signed on its behalf by the undersigned, thereunto duly authorized.
360 Funds
| /s/ Randy Linscott | |
| By Randy Linscott | |
| Principal Executive Officer |
| Date: August 6, 2018 | |
Pursuant to the requirements of the Securities Exchange Act of 1934 and the Investment Company Act of 1940, this report has been signed below by the following person on behalf of the registrant and in the capacities and on the date indicated.
| /s/ Justin Thompson | |
| By Justin Thompson | |
| Principal Financial Officer |
| Date: August 6, 2018 | |