UNITED STATES
SECURITIES AND EXCHANGE COMMISSION
Washington, D.C. 20549
FORM N-CSR
CERTIFIED SHAREHOLDER REPORT OF REGISTERED MANAGEMENT INVESTMENT COMPANIES
Investment Company Act File Number 811-21726
360 Funds
(Exact name of registrant as specified in charter)
| 4300 Shawnee Mission Parkway, Suite 100, Fairway, KS | 66205 |
| (Address of principal executive offices) | (Zip code) |
The Corporation Trust Company
Corporation Trust Center
1209 Orange St.
Wilmington, DE 19801
(Name and address of agent for service)
With Copies To:
John H. Lively
Practus, LLP
11300 Tomahawk Creek Parkway, Suite 310
Leawood, KS 66211
Registrant's telephone number, including area code: 877-244-6235
Date of fiscal year end: 09/30/2018
Date of reporting period: 09/30/2018
| ITEM 1. | REPORTS TO SHAREHOLDERS |
The Annual report to Shareholders of the EAS Crow Point Alternatives Fund (the “EAS Fund”), Crow Point Global Tactical Allocation Fund (the “Global Fund”) and Crow Point Alternative Income Fund (the “Income Fund”), each a series of the 360 Funds (the “registrant”), for the fiscal periods/year ended September 30, 2018 pursuant to Rule 30e-1 under the Investment Company Act of 1940 (the “1940 Act”), as amended (17 CFR 270.30e-1) is filed herewith.

EAS Crow Point Alternatives Fund
Class A Shares (Ticker Symbol: EASAX)
Class C Shares (Ticker Symbol: EASYX)
Class I Shares (Ticker Symbol: EASIX)
Crow Point Global Tactical Allocation Fund
Investor Class Shares (Ticker Symbol: CGHAX)
Institutional Class Shares (Ticker Symbol: CGHIX)
Crow Point Alternative Income Fund
Investor Class Shares (Ticker Symbol: AAIFX)
Series of the
360 Funds
ANNUAL REPORT
September 30, 2018
Investment Adviser:
Crow Point Partners, LLC
25 Recreation Drive, Suite 206
Hingham, MA 02043
1-877-327-0757
www.crowpointfunds.com
Distributed by Matrix 360 Distributors, LLC
Member FINRA
This report is authorized for distribution only to shareholders and to others who have received a copy of the Fund’s prospectus.
TABLE OF CONTENTS
Dear Investor:
Your EAS Crow Point Alternatives Fund (the “Fund”) just completed a very strong year. For the year ended September 30, 2018, the Fund’s Class I shares returned 10.93% versus (1.22)% and 3.62% for its benchmarks, the Bloomberg Barclays U.S. Aggregate Bond Index (the “Barclays Index”) and HFRI Fund-of-Funds Conservative Index (the “HFRI Index”), respectively. For the most recently completed quarter ended September 30, 2018 the Fund returned 5.49% versus (0.02)% and 0.47% for the Barclays Index and HFRI Index, respectively. The Fund ended the year ranked in the fourth Morningstar percentile, a performance about which we are quite happy. Recent performance continued a string of strong quarterly performances relative to our peer group. The Fund has now outperformed its Morningstar peer group for six consecutive quarters. Most importantly, we are happy to report that Morningstar awarded the Fund its fifth star, the highest possible Morningstar rating. We know we will be on the other side of this performance curve from time-to-time, and we have had exceptional performance from some select sectors, meanwhile, we remain focused on the Fund’s core mandate: consistent low volatility returns.
Two positions drove a good portion of our performance in the second half of 2018. As many of you know, the Fund has been short Tesla for quite some time and that position paid off quite well during 3Q 2018 as Tesla was one of the worst performing stocks in the market. With Tesla being a volatile stock, we always hedge that position with calls to protect against surprise rallies, and we managed to trade that hedge very effectively. We also owned $4 calls in Amarin Pharmaceuticals at the time Amarin announced a very successful trial result of its most important drug. We expected an announcement in September, did not know in which direction the FDA ruling would go, and so also owned puts with our calls. Upon announcing the successful result, AMRN stock traded up to almost $19 per share resulting in a significant gain for the Fund.
Our broader asset allocation moves also yielded benefits in the last year. While many investors were concerned about the sharp uptick in volatility in February 2018, our models kept us overweight equities and that paid off. Furthermore, our models kept us in small caps and that has really paid off. Basically, for the past twelve months, we have favored small caps over large, growth stocks over value, the U.S. over the Rest of the World, cash and alternatives over bonds. Additionally, while we overallocated to growth, our small cap managers also outperformed their benchmarks by wide margins, which helped performance even more. We expect there to be a reversion to the mean soon, and we are adding value stocks to the Fund’s portfolio and will likely continue to do so.
Going forward, we are exploring adding a managed futures sleeve as we believe that is the best and most efficient way to hedge against broad market declines. While our models continue to tilt in favor of risk assets, we are as jumpy as everyone else now and are watching the data closely. So far, the correct positioning has been to stay with the risk trade.
As we indicated in the last quarterly letter, our proprietary risk tools identify three kinds of markets: (1) low-risk bull, characterized by low levels of market volatility and high returns (what we exited in 2017); (2) high-risk bull, where volatility spikes but return potential remains high; and (3) high-risk bear, where volatility and return potential works against the investor. A high-risk bull market, where we are now in our opinion, means that optimal portfolio positions will be smaller than normal. With more names in the portfolio, diversification becomes an ally.
We continue to minimize long exposure to bonds (less than 10% of net Fund assets), and what bonds we do own are of a short duration, hedged in some manner, or highly credit sensitive where we have a high degree of confidence in the underlying credit. We will likely be rolling into more floating rate notes going forward. Right now, the Fund’s portfolio construction is as follows: approximately 60% of the Fund’s net assets are invested in various long/short strategies, primarily equity based; 21% in global macro; 19% in various arbitrage strategies (mostly through our investment in an outside limited partnership); and the remainder in other opportunistic situations.
That’s it for now. We thank you for being a shareholder. We are honored by the privilege. As always, please reach out to us at any time if you have questions.
Sincerely,
Peter J. DeCaprio
Crow Point Partners
See following for important disclosures.
Before investing in EAS Crow Point Alternatives Fund, you should carefully consider the Fund’s investment objectives, risks, charges, and expenses. For a current Prospectus, which contain this and other important information, visit cppfunds.com. Please read the Prospectus carefully before investing.
Performance data quoted represents past performance. Past performance is no guarantee of future results and investment returns and principal value of the Fund will fluctuate so that shares, when redeemed, may be worth more or less than their original cost. Current performance may be higher or lower than the performance quoted. Call 1-877-244-6235 for current month end performance.
Positive performance of holdings does not indicate positive portfolio returns.
The Barclay’s US Aggregate Bond Index is a broad-based flagship benchmark that measures the investment grade, US dollar-denominated, fixed-rate taxable bond market. The index includes Treasuries, government-related and corporate securities, MBS (agency fixed-rate and hybrid ARM passthroughs), ABS and CMBS (agency and non-agency).
HFRI Fund of Funds Conservative Index (the “Index”) is an unmanaged index. Funds in the Index generally seek consistent returns by primarily investing in funds that generally engage in more conservative strategies such as equity market neutral, fixed income arbitrage and convertible arbitrage. Index returns assume reinvestment of dividends. Investors may not invest in the Index directly; unlike the Fund’s returns, the Index does not reflect any fees or expenses.
The Fund’s portfolio may differ significantly from the securities held in the Index. You cannot invest directly in an Index, therefore its performance does not reflect the expenses associated with the active management of an actual portfolio.
As of September 30, 2018, the top ten holdings for the EAS Crow Point Alternatives Fund: Crow Point Growth Fund, 20.96%; Crow Point Alternative Income Fund, 12.55%; ACA Master Select Fund LP, 12.02%; RVX Emerging Markets Equity Fund, 9.12%; Eagle Rock Floating Rate Fund, 6.85%; LS Opportunity Fund, 3.03%; Mainstay Medical International PLC, 1.14%; Amarin Corp. PLC, 12/21/18, $4.00 Call Option, 1.11%; SVB Financial Group, 1.10% and Amarin Corp. PLC, 01/18/19, $4.00 Call Option, 1.06%. Fund holdings are subject to change and holding discussions are not recommendations to buy or sell any security. Current and future holdings are subject to risk.
Fund distributed by Matrix 360 Distributors, LLC.
Dear Investor:
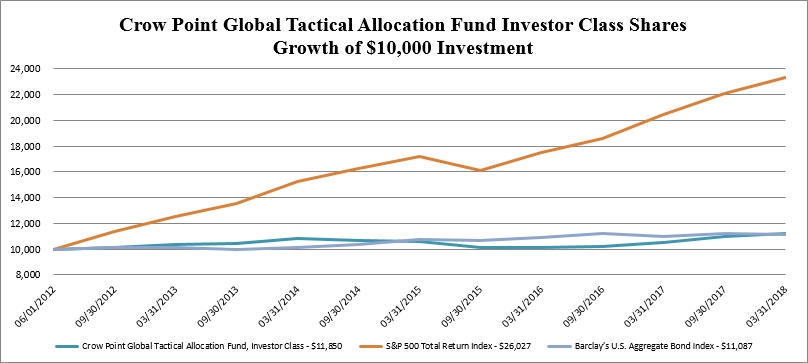
The Crow Point Global Tactical Allocation Fund (the “Fund”) posted strong results over the third quarter of 2018, rising approximately 5.22% versus 7.71% and (0.02)% for the S&P 500® Total Return Index (the “S&P 500”) and the Bloomberg Barclays U.S. Aggregate Bond Index (the “Barclays Index”), the Fund’s benchmarks. Year to date through September 30, the portfolio was up 3.92% versus 10.56% for the S&P 500 and (1.60)% the Barclays Index, respectively, and over 1 year is up 8.36% versus 17.91% for the S&P 500 and (1.22)% for the Barclays Index. These investment returns place the Fund in the top quartile of funds in the Morningstar Tactical Allocation category, over the 1 year time period.
Over the course of this year, despite several bouts of market volatility and uncertainty, the portfolio team maintained a constructive viewpoint on economic growth driven by simulative fiscal policy in the United States. This economic growth coupled with reasonable valuations and high degrees of corporate profit growth led to overweighted positions in U.S. equities, particularly small cap companies. Over the course of the third quarter, the portfolio maintained roughly 25% of all holdings in small cap companies, small cap exchange-traded and closed-end funds. These small cap positions were the greatest contributor to the Fund’s strong performance.
Although the Fund’s investment opportunity set is global, the portfolio has focused almost exclusively on investment opportunities in the United States. Avoiding non-U.S. investments was beneficial as foreign markets have posted negative returns through the third quarter and throughout 2018. The Fund maintained tactical short positions in Emerging Markets, which contributed positively to total returns.
Lastly, over the course of 2018, given the team’s constructive viewpoint on the domestic economy coupled with tightening policy on behalf of the Federal Reserve, the Fund generally avoided interest rate risk and minimized positions in fixed income. Avoiding fixed income additionally proved to be beneficial to Fund returns as bond returns have been negative this year.
Going forward, markets may continue to be volatile yet overall, we remain constructive on economic growth and on risk assets broadly. Given large valuation differences between U.S. and international markets as well as a reduction in policy risks overseas, the Fund has begun increasing non-U.S. exposures, particularly in Emerging Markets.
Sincerely,
Peter J. DeCaprio
Crow Point Partners
See following for important disclosures.
Before investing in Crow Point Global Tactical Allocation Fund, you should carefully consider the Fund’s investment objectives, risks, charges, and expenses. For a current Prospectus, which contain this and other important information, visit cppfunds.com. Please read the Prospectus carefully before investing.
Performance data quoted represents past performance. Past performance is no guarantee of future results and investment returns and principal value of the Fund will fluctuate so that shares, when redeemed, may be worth more or less than their original cost. Current performance may be higher or lower than the performance quoted. Call 1-877-244-6235 for current month end performance.
Positive performance of holdings does not indicate positive portfolio returns.
The S&P 500® Total Return Index is a broad unmanaged index of 500 stocks, which is widely recognized as representative of the equity market in general.
The Barclay’s US Aggregate Bond Index is a broad-based flagship benchmark that measures the investment grade, US dollar-denominated, fixed-rate taxable bond market. The index includes Treasuries, government-related and corporate securities, MBS (agency fixed-rate and hybrid ARM passthroughs), ABS and CMBS (agency and non-agency).
The Fund’s portfolio may differ significantly from the securities held in the index. You cannot invest directly in an index, therefore its performance does not reflect the expenses associated with the active management of an actual portfolio.
As of September 30, 2018, the top ten holdings for the Crow Point Global Tactical Allocation Fund: SPDR S&P 500 ETF Trust, 9.12%; iShares MSCI Emerging Markets ETF, 7.09%; Technology Select Sector SPDR Fund, 6.39%; Consumer Discretionary Select Sector SPDR Fund, 6.15%; Eagle Rock Floating Rate Fund, 5.54%; iShares Russell 3000 ETF, 4.74%; Financial Select Sector SPDR Fund, 4.56%; Industrial Select Sector SPDR Fund, 4.49%; iShares Core S&P Small-Cap ETF, 3.84% and RVX Emerging Markets Equity Fund, 3.69%. Fund holdings are subject to change and holding discussions are not recommendations to buy or sell any security. Current and future holdings are subject to risk.
Fund distributed by Matrix 360 Distributors, LLC.
Dear Investor:
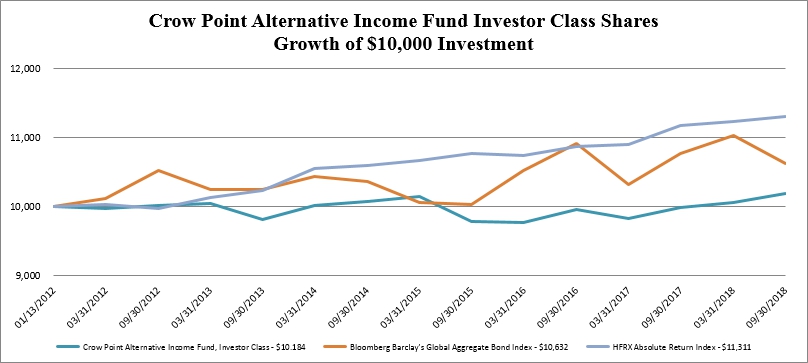
The Crow Point Alternative Income Fund (the “Fund”) posted relatively strong performance for the third quarter of 2018, rising by 0.48% versus (0.92)% for the Bloomberg Barclays Global Aggregate Bond Index (the “Barclays Index”) and (0.04)% for the HFRX Absolute Return Index (the “HFRX Index”). Year to date through September 30, 2018, the Fund had a modest negative return of (0.12)% versus (2.37)% for the Barclays Index and 1.00% for the HFRI Index; and over 1 year posted a return of 1.93% versus (1.32)% for the Barclays Index and 1.13% for the HFRI Index. These returns compare favorably to bond market returns as fixed income as an asset class has had negative returns over all recent periods. The Fund’s one-year performance placed it in the top half of Non-Traditional bond funds, according to Morningstar.
Given the U.S. economy’s strong performance, the Federal Reserve has continued its policy of raising the Federal Funds rate thus limiting attractive investment opportunities in the fixed income marketplace. Over the quarter and throughout most of 2018, the investment team has looked to minimize interest rate risk in portfolio construction in lieu of more economically cyclical investments including credit, both high yield and high grade, convertible bonds and dividend-oriented equities.
Over the past 10 years, money market investments, very short-term bonds and floating rate bank debt have all been very unattractive investments given the extraordinarily accommodative posture of the Federal Reserve which resulted short term rates that hovered around zero. Yet, since 2015, the Fed has begun a very gradual but steady process of normalizing interest rates, pushing the Fed Funds target rate to a more normal 2.25%. As such, the investment team has found investments in short term paper increasingly attractive and beneficial to the portfolio.
Going forward, the investment team anticipates an environment similar to what we’ve experienced recently as the Fed continues a gradual increase in short rates thus resulting in a challenging investment environment for traditional fixed income securities. As such, the Fund will continue to minimize interest rate risks and look to make opportunistic investments which benefit both from rising short rates and a positive economic environment.
Sincerely,
Peter J. DeCaprio
Crow Point Partners
See following for important disclosures.
Before investing in Crow Point Alternative Income Fund, you should carefully consider the Fund’s investment objectives, risks, charges, and expenses. For a current Prospectus, which contain this and other important information, visit cppfunds.com. Please read the Prospectus carefully before investing.
Performance data quoted represents past performance. Past performance is no guarantee of future results and investment returns and principal value of the Fund will fluctuate so that shares, when redeemed, may be worth more or less than their original cost. Current performance may be higher or lower than the performance quoted. Call 1-877-244-6235 for current month end performance.
Positive performance of holdings does not indicate positive portfolio returns.
The Bloomberg Barclays Global Aggregate Bond Index is a flagship measure of global investment grade debt from twenty-four local currency markets. This multi-currency benchmark includes treasury, government-related, corporate and securitized fixed-rate bonds from both developed and emerging markets issuers.
The HFRX Absolute Return Index is designed to be representative of the overall composition of the hedge fund universe. It is comprised of all eligible hedge fund strategies; including but not limited to convertible arbitrage, distressed securities, equity hedge, equity market neutral, event driven, macro, merger arbitrage, and relative value arbitrage. As a component of the optimization process, the index selects constituents which characteristically exhibit lower volatilities and lower correlations to standard directional benchmarks of equity market and hedge fund industry performance.
The Fund’s portfolio may differ significantly from the securities held in the index. You cannot invest directly in an index, therefore its performance does not reflect the expenses associated with the active management of an actual portfolio.
As of September 30, 2018, the top ten holdings for the Crow Point Alternative Income Fund: iShares Core U.S. Aggregate Bond ETF, 15.86%; SPDR S&P 500 ETF Trust, 11.65%; iShares 20+ Year Treasury Bond ETF, 7.05%; SPDR Bloomberg Barclays High Yield Bond ETF, 5.06%; Eagle Rock Floating Rate Fund, 5.05%; Invesco Senior Loan ETF, 4.87%; Eaton Vance Limited Duration Income Fund, 4.51%; SPDR Bloomberg Barclays Short Term High Yield Bond ETF, 4.15%; Structured Asset Securities Corp. Mortgage Loan Trust 2006-WF1, 1 mo. LIBOR plus 0.16%, 2.556%, due 02/25/2036, 4.01%;and Vemo Education, Inc., 3.66%. Fund holdings are subject to change and holding discussions are not recommendations to buy or sell any security. Current and future holdings are subject to risk.
Fund distributed by Matrix 360 Distributors, LLC.
| Crow Point Funds | ANNUAL REPORT |
INVESTMENT HIGHLIGHTS
EAS Crow Point Alternatives Fund
September 30, 2018 (Unaudited) | |
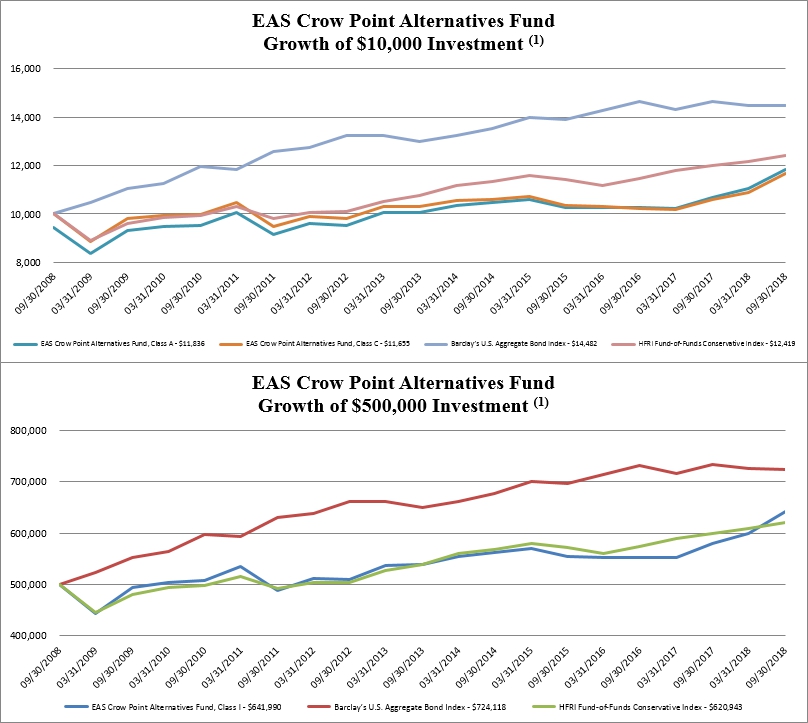
(1) The Class A shares includes the deduction of the current maximum initial sales charge of 5.50%. The minimum initial investment for the Class I shares is $500,000.
| Returns as of September 30, 2018 | One year ended | Five years ended | Ten years ended |
| | September 30, 2018 | September 30, 2018 | September 30, 2018 |
| EAS Crow Point Alternatives Fund Class A without sales charge | 10.75% | 3.28% | 2.28% |
| EAS Crow Point Alternatives Fund Class A with sales charge | 4.66% | 2.12% | 1.70% |
| EAS Crow Point Alternatives Fund Class C without CDSC | 9.91% | 2.52% | 1.54% |
| EAS Crow Point Alternatives Fund Class I | 10.93% | 3.55% | 2.53% |
| Bloomberg Barclay’s U.S. Aggregate Bond Index | (1.22)% | 2.16% | 3.77% |
| HFRI Fund-of-Funds Conservative Index | 3.62% | 2.92% | 2.19% |
The performance information quoted in this annual report assumes the reinvestment of all dividend and capital gain distributions, if any, and represents past performance, which is not a guarantee of future results. The returns shown do not reflect taxes that a shareholder would pay on Fund distributions or on the redemption of Fund shares. The investment return and principal value of an investment will fluctuate and, therefore, an investor’s shares, when redeemed, may be worth more or less than their original cost. Updated performance data current to the most recent month-end can be obtained by calling 1-877-244-6235.
| Crow Point Funds | ANNUAL REPORT |
INVESTMENT HIGHLIGHTS
EAS Crow Point Alternatives Fund
September 30, 2018 (Unaudited) | |
The above graph depicts the performance of the EAS Crow Point Alternatives Fund versus the Bloomberg Barclay’s U.S. Aggregate Bond Index (the “Barclays Index”) and the HFRI Fund-of-Funds Conservative Index (the “HFRI Index”). The Barclays Index provides a measure of the performance of the U.S. investment grade bonds market, which includes investment grade U.S. Government bonds, investment grade corporate bonds, mortgage pass-through securities, and asset-backed securities that are publicly offered for sale in the United States. The securities in the Barclays Index must have at least 1 year remaining to maturity. In addition, the securities must be denominated in U.S. dollars and must be fixed-rate, nonconvertible and taxable. The HFRI Index is an unmanaged index. Funds in the HFRI Index generally seek consistent returns by primarily investing in funds that generally engage in more conservative strategies such as equity market neutral, fixed income arbitrage and convertible arbitrage. Index returns assume reinvestment of dividends. Investors may not invest in the Index directly; unlike the Fund’s returns, the Index does not reflect any fees or expenses.
The investment objective of the EAS Crow Point Alternatives Fund (the “Fund”) is preservation and growth of capital.
Crow Point Partners, LLC’s (the “Adviser”) investment philosophy centers on the preservation and growth of capital through both good and bad markets. The Adviser believes that for most shareholders, investment success is about growing capital over time while protecting it at all times, not about beating a market index which can frequently involve losses while still meeting the objective. Thus, the Adviser follows an absolute return approach in managing the Fund, as defined below. In executing its strategy, the Adviser attempts to generate consistent, positive returns regardless of market conditions by allocating the Fund’s investments among multiple alternative investment asset classes and strategies.
The Fund’s investments will be allocated among multiple alternative investment classes using primarily liquid instruments. The Fund may, generally, pursue investments among the following alternative investment classes or strategies: Arbitrage; Commodities; Convertibles; Floating Rate Debt; Currencies; Emerging Markets Bonds; Emerging Market Equities; High Yield; Long-Short Equity; Long-Short Credit; Managed Futures; Capital Structure Arbitrage; and Real Estate (primarily through real estate investment trusts (“REITs”). The Fund may invest in securities directly, or through other mutual funds, ETFs, closed-end funds, and private funds (“Underlying Funds”) across these alternative investment styles. An ETF is an investment company that typically seeks to track the performance of an index by holding in its portfolio either the contents of the index or a representative sample of the securities in the index. The Adviser may invest a portion of the Fund’s assets in other mutual funds that are also advised by the Adviser. Investments in private funds such as hedge funds will be limited to no more than 15% of the Fund’s net assets at the time of purchase. The Adviser will periodically adjust the asset allocation among each alternative investment class based on its assessment of market conditions and investment opportunities.
Allocation of Portfolio Holdings
| Asset Class | | Percentage of Net Assets |
| Mutual Funds | | 52.83 | % |
| Common Stock | | 26.64 | % |
| Hedge Funds | | 12.02 | % |
| Call Options | | 2.24 | % |
| Corporate Bond | | 0.82 | % |
| Asset Backed Securities | | 0.09 | % |
| Put Options | | 0.01 | % |
| Exchange-Traded Funds | | (22.82 | )% |
| Other, Cash and Cash Equivalents | | 28.17 | % |
| | | 100.00 | % |
The percentages in the above table are based on the portfolio holdings of the Fund as of September 30, 2018 and are subject to change. For a detailed break-out of holdings by industry and investment type, please refer to the Schedule of Investments.
| Crow Point Funds | ANNUAL REPORT |
INVESTMENT HIGHLIGHTS
Crow Point Global Tactical Allocation Fund
September 30, 2018 (Unaudited) | |
| Returns as of September 30, 2018 | One year ended
September 30, 2018 | Five years ended
September 30, 2018 | Commencement of
Operations through
September 30, 2018* |
| Crow Point Global Tactical Allocation Fund Investor Class | | | |
| without sales charge | 7.98% | 2.56% | 2.72% |
| S&P 500 Total Return Index | 17.91% | 13.94% | 16.30% |
| Bloomberg Barclays U.S. Aggregate Bond Index | (1.22)% | 2.16% | 1.64% |
* The Crow Point Global Tactical Allocation Fund Investor Class shares commenced operations on June 1, 2012. Effective September 28, 2018, the Fund's Class A shares and Class I shares were re-designated as the Investor Class shares and the Institutional Class shares, respectively.
The performance information quoted in this annual report assumes the reinvestment of all dividend and capital gain distributions, if any, and represents past performance, which is not a guarantee of future results. The returns shown do not reflect taxes that a shareholder would pay on Fund distributions or on the redemption of Fund shares. The investment return and principal value of an investment will fluctuate and, therefore, an investor’s shares, when redeemed, may be worth more or less than their original cost. Updated performance data current to the most recent month-end can be obtained by calling 1-877-244-6235.
| Crow Point Funds | ANNUAL REPORT |
INVESTMENT HIGHLIGHTS
Crow Point Global Tactical Allocation Fund
September 30, 2018 (Unaudited) | |
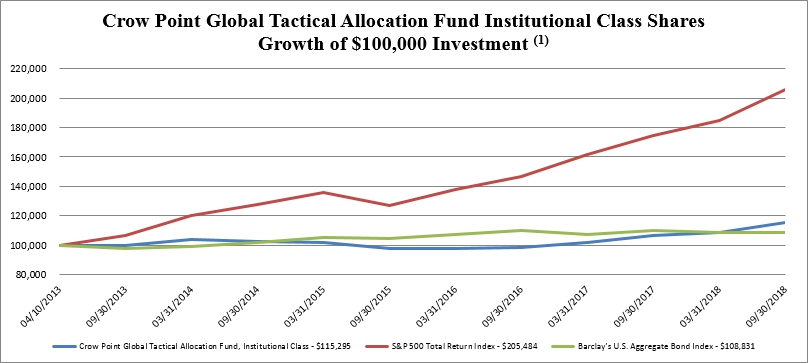
(1) The minimum initial investment for the Class I shares is $100,000.
| Returns as of September 30, 2018 | One year ended
September 30, 2018 | Five years ended
September 30, 2018 | Commencement of
Operations through
September 30, 2018* |
| Crow Point Global Tactical Allocation Fund | | | |
| Institutional Class | 8.36% | 2.86% | 2.63% |
| S&P 500 Total Return Index | 17.91% | 13.94% | 14.05% |
| Bloomberg Barclays U.S. Aggregate Bond Index | (1.22)% | 2.16% | 1.56% |
* The Crow Point Global Tactical Allocation Fund Institutional Class shares commenced operations on April 10, 2013. Effective September 28, 2018, the Fund's Class A shares and Class I shares were re-designated as the Investor Class shares and the Institutional Class shares, respectively.
The performance information quoted in this annual report assumes the reinvestment of all dividend and capital gain distributions, if any, and represents past performance, which is not a guarantee of future results. The returns shown do not reflect taxes that a shareholder would pay on Fund distributions or on the redemption of Fund shares. The investment return and principal value of an investment will fluctuate and, therefore, an investor’s shares, when redeemed, may be worth more or less than their original cost. Updated performance data current to the most recent month-end can be obtained by calling 1-877-244-6235.
| Crow Point Funds | ANNUAL REPORT |
INVESTMENT HIGHLIGHTS
Crow Point Global Tactical Allocation Fund
September 30, 2018 (Unaudited) | |
The above graphs depict the performance of the Fund versus the S&P 500 Total Return Index (“S&P 500”) and the Bloomberg Barclays U.S. Aggregate Bond Index (the “Barclays Index”). The S&P 500 is a broad unmanaged index of 500 stocks, which is widely recognized as representative of the equity market in general. Index returns assume reinvestment of dividends. The Barclays Index provides a measure of the performance of the U.S. investment grade bonds market, which includes investment grade U.S. Government bonds, investment grade corporate bonds, mortgage pass-through securities, and asset-backed securities that are publicly offered for sale in the United States. The securities in the Barclays Index must have at least 1 year remaining to maturity. In addition, the securities must be denominated in U.S. dollars and must be fixed-rate, nonconvertible and taxable. Investors may not invest in any index directly; unlike the Fund’s returns, the Index does not reflect any fees or expenses. The Fund will generally not invest in all the securities comprising each index.
The investment objective of the Fund is to seek income with long-term growth of capital as a secondary objective.
Crow Point Partners, LLC’s (the “Adviser”) fundamentally-driven investment process is used to identify companies with attractive and growing franchises, sustainable and high dividend yields, and low correlations to the broader equity markets. Long dated put options will be employed to hedge individual stock positions. Call options will be sold when possible to reduce the costs of the put protection and to offer additional yield support. Individual position concentration will be low to help reduce risk. In addition, options will be purchased and sold on selected U.S. and non-U.S.-based securities indices, on exchange-traded funds providing returns based on certain indices, countries, or market sectors for the purpose of hedging the portfolio against losses.
The Fund expects normally to invest at least 80% of its total assets in equity securities (including securities convertible into equity securities) of U.S. and non-U.S. companies that pay attractive dividends or that the Fund’s Adviser believes have the potential to increase dividends over time. The Fund has the flexibility to invest up to 20% of its net assets in preferred securities. Securities will be chosen using a proprietary fundamental investment process by which the Fund’s Adviser seeks to identify quality companies around the world with a proven track record of delivering consistent or rising dividends and companies likely to raise their dividends meaningfully or to pay a significant special dividend.
Allocation of Portfolio Holdings
| Asset Class/Industry Sector | | Percentage of Net Assets* |
| Exchange-Traded Funds | | 58.31 | % |
| Mutual Funds | | 9.24 | % |
| Closed-End Funds | | 4.24 | % |
| Common Stock | | 3.55 | % |
| Put Options | | 0.22 | % |
| Asset Backed Securities | | 0.10 | % |
| Call Options | | (0.13 | )% |
| Cash and Cash Equivalents | | 24.47 | % |
| | | 100.00 | % |
* The percentages in the above table are based on the portfolio holdings of the Fund as of September 30, 2018 and are subject to change. For a detailed break-out of holdings by industry and investment type, please refer to the Schedule of Investments.
| Crow Point Funds | ANNUAL REPORT |
INVESTMENT HIGHLIGHTS
Crow Point Alternative Income Fund
September 30, 2018 (Unaudited) | |
| Returns as of September 30, 2018 | One year ended
September 30, 2018 | Five years ended
September 30, 2018 | Commencement of
Operations through
September 30, 2018* |
| Crow Point Alternative Income Fund Investor Class | 1.93% | 0.75% | 0.27% |
| Bloomberg Barclay’s Global Aggregate Bond Index | (1.32)% | 0.75% | 0.92% |
| HFRX Absolute Return Index | 1.13% | 2.01% | 1.85% |
* The Crow Point Alternative Income Fund Investor Class shares commenced operations on January 13, 2012.
The performance information quoted in this annual report assumes the reinvestment of all dividend and capital gain distributions, if any, and represents past performance, which is not a guarantee of future results. The returns shown do not reflect taxes that a shareholder would pay on Fund distributions or on the redemption of Fund shares. The investment return and principal value of an investment will fluctuate and, therefore, an investor’s shares, when redeemed, may be worth more or less than their original cost. Updated performance data current to the most recent month-end can be obtained by calling 1-877-244-6235.
| Crow Point Funds | ANNUAL REPORT |
INVESTMENT HIGHLIGHTS
Crow Point Alternative Income Fund
September 30, 2018 (Unaudited) | |
The above graph depicts the performance of the Crow Point Alternative Income Fund versus the Bloomberg Barclays Global Aggregate Bond Index (the “Barclays Global Index”) and the HFRX Absolute Return Index (the “HFRX Index”). The Barclays Global Index is a flagship measure of global investment grade debt from twenty-four local currency markets. This multi-currency benchmark includes treasury, government-related, corporate and securitized fixed-rate bonds from both developed and emerging markets issuers. The HFRX Index is designed to be representative of the overall composition of the hedge fund universe. It is comprised of all eligible hedge fund strategies; including but not limited to convertible arbitrage, distressed securities, equity hedge, equity market neutral, event driven, macro, merger arbitrage, and relative value arbitrage. As a component of the optimization process, the index selects constituents which characteristically exhibit lower volatilities and lower correlations to standard directional benchmarks of equity market and hedge fund industry performance. Index returns assume reinvestment of dividends. Investors may not invest in the Index directly; unlike the Fund’s returns, the Index does not reflect any fees or expenses.
The investment objective of the Crow Point Alternative Income Fund (the “Fund”) is to seek above-average total returns over a complete market cycle primarily through capital appreciation and income generation. Crow Point Partners, LLC (the “Adviser”) serves as the Fund’s investment adviser.
The Fund seeks to achieve its investment objective under normal market conditions of providing shareholders with above-average total returns over a complete market cycle primarily through capital appreciation and income generation by allocating assets among credit related instruments such as corporate bonds, municipal bonds, mortgage and asset-backed securities, and floating rate securities. The Fund considers “above-average total returns” to be returns that are uncorrelated to, and greater than, the Fund’s primary benchmark. The Fund may invest in investment grade as well as below investment grade securities (also known as “junk bonds”). The Fund may invest without regard to maturity. The Fund may also invest in equity securities including those of private issuers, debt securities of private issuers, non-publicly traded real estate investments trusts (“REITs”), exchange-traded-notes (ETNs”), exchange-traded funds (“ETFs”), mutual funds and publicly traded and non-publicly traded business development companies (“BDCs”). In regard to investments in equity securities, the Fund may invest without regard to market capitalization.
Allocation of Portfolio Holdings
| Asset Class/Industry Sector | | Percentage of Net Assets |
| Exchange-Traded Funds | | 58.02 | % |
| Bonds & Notes | | 7.47 | % |
| Closed-End Funds | | 7.05 | % |
| Mutual Funds | | 5.05 | % |
| Private Investment | | 3.66 | % |
| Preferred Stock | | 0.60 | % |
| Put Options | | 0.12 | % |
| Call Options | | (0.05 | )% |
| Common Stock | | (0.80 | )% |
| Other, Cash and Cash Equivalents | | 18.88 | % |
| | | 100.00 | % |
The percentages in the above table are based on the portfolio holdings of the Fund as of September 30, 2018 and are subject to change. For a detailed break-out of holdings by industry and investment type, please refer to the Schedule of Investments.
| EAS CROW POINT ALTERNATIVES FUND | |
| SCHEDULE OF INVESTMENTS | |
| September 30, 2018 | ANNUAL REPORT |
| COMMON STOCK - 32.09% | | Shares | | | Value | |
| | | | | | | |
| Airlines - 0.20% | | | | | | | | |
| JetBlue Airways Corp. (a) (b) | | | 3,377 | | | $ | 65,379 | |
| | | | | | | | | |
| Apparel - 2.51% | | | | | | | | |
| Columbia Sportswear Co. (b) | | | 2,322 | | | | 216,108 | |
| Michael Kors Holdings Ltd. (a) - British Virgin Islands | | | 2,962 | | | | 203,075 | |
| Ralph Lauren Corp. (b) | | | 2,446 | | | | 336,447 | |
| VF Corp. (b) | | | 783 | | | | 73,171 | |
| | | | | | | | 828,801 | |
| Auto Manufacturers - 0.42% | | | | | | | | |
| PACCAR, Inc. (b) | | | 2,048 | | | | 139,653 | |
| | | | | | | | | |
| Banks - 2.09% | | | | | | | | |
| Capital One Financial Corp. (b) | | | 2,831 | | | | 268,747 | |
| IBERIABANK Corp. (b) | | | 708 | | | | 57,596 | |
| SVB Financial Group (a) (b) | | | 1,171 | | | | 363,982 | |
| | | | | | | | 690,325 | |
| Biotechnology - 2.93% | | | | | | | | |
| Alnylam Pharmaceuticals, Inc. (a) (b) | | | 926 | | | | 81,043 | |
| BioMarin Pharmaceutical, Inc. (a) (b) | | | 1,013 | | | | 98,231 | |
| Bluebird Bio, Inc. (a) (b) | | | 432 | | | | 63,072 | |
| Exact Sciences Corp. (a) (b) | | | 1,973 | | | | 155,709 | |
| Illumina, Inc. (a) (b) | | | 266 | | | | 97,638 | |
| Mainstay Medical International PLC (a) - Ireland | | | 21,429 | | | | 378,129 | |
| PolarityTE, Inc. (a) (b) | | | 5,000 | | | | 95,500 | |
| | | | | | | | 969,322 | |
| Chemicals - 0.70% | | | | | | | | |
| Albemarle Corp. (b) | | | 795 | | | | 79,325 | |
| Celanese Corp. - Class A (b) | | | 1,348 | | | | 153,672 | |
| | | | | | | | 232,997 | |
| Commercial Services - 0.90% | | | | | | | | |
| CoStar Group, Inc. (a) (b) | | | 253 | | | | 106,473 | |
| Quanta Services, Inc. (a) (b) | | | 2,253 | | | | 75,205 | |
| Worldpay, Inc. - Class A (a) (b) | | | 1,155 | | | | 116,967 | |
| | | | | | | | 298,645 | |
| Computers - 0.78% | | | | | | | | |
| CyberArk Software Ltd. (a) | | | 983 | | | | 78,483 | |
| Lumentum Holdings, Inc. (a) (b) | | | 1,487 | | | | 89,146 | |
| Nutanix, Inc. - Class A (a) (b) | | | 2,140 | | | | 91,421 | |
| | | | | | | | 259,050 | |
| Distribution & Wholesale - 0.14% | | | | | | | | |
| WW Grainger, Inc. | | | 131 | | | | 46,821 | |
| | | | | | | | | |
| Diversified Financial Services - 0.82% | | | | | | | | |
| Affiliated Managers Group, Inc. | | | 333 | | | | 45,528 | |
| LPL Financial Holdings, Inc. (b) | | | 3,399 | | | | 219,269 | |
| Mastercard, Inc. - Class A (b) | | | 29 | | | | 6,456 | |
| | | | | | | | 271,253 | |
| Electric - 0.18% | | | | | | | | |
| DTE Energy Co. (b) | | | 554 | | | | 60,458 | |
| EAS CROW POINT ALTERNATIVES FUND | |
| SCHEDULE OF INVESTMENTS | |
| September 30, 2018 | ANNUAL REPORT |
| COMMON STOCK -32.09% (continued) | | Shares | | | Value | |
| | | | | | | |
| Engineering & Construction - 0.18% | | | | | | | | |
| Dycom Industries, Inc. (a) | | | 714 | | | $ | 60,404 | |
| | | | | | | | | |
| Entertainment - 0.25% | | | | | | | | |
| IMAX Corp. (a) (b) - Canada | | | 3,246 | | | | 83,747 | |
| | | | | | | | | |
| Healthcare - Products - 2.65% | | | | | | | | |
| Align Technology, Inc. (a) (b) | | | 817 | | | | 319,627 | |
| Bio-Techne Corp. (b) | | | 464 | | | | 94,707 | |
| Intuitive Surgical, Inc. (a) (b) | | | 578 | | | | 331,772 | |
| Nevro Corp. (a) (b) | | | 824 | | | | 46,968 | |
| Penumbra, Inc. (a) (b) | | | 554 | | | | 82,934 | |
| | | | | | | | 876,008 | |
| Healthcare - Services - 0.81% | | | | | | | | |
| Molina Healthcare, Inc. (a) (b) | | | 1,594 | | | | 237,028 | |
| Teladoc, Inc. (a) | | | 367 | | | | 31,690 | |
| | | | | | | | 268,718 | |
| Home Builders - 0.37% | | | | | | | | |
| PulteGroup, Inc. | | | 1,921 | | | | 47,583 | |
| Toll Brothers, Inc. (b) | | | 2,260 | | | | 74,648 | |
| | | | | | | | 122,231 | |
| Insurance - 0.94% | | | | | | | | |
| Progressive Corp. (b) | | | 4,376 | | | | 310,871 | |
| | | | | | | | | |
| Internet - 2.30% | | | | | | | | |
| Expedia Group, Inc. (b) | | | 1,727 | | | | 225,339 | |
| Palo Alto Networks, Inc. (a) (b) | | | 1,203 | | | | 270,988 | |
| TripAdvisor, Inc. (a) (b) | | | 2,491 | | | | 127,215 | |
| Twilio, Inc. - Class A (a) (b) | | | 1,593 | | | | 137,444 | |
| | | | | | | | 760,986 | |
| Iron & Steel - 0.10% | | | | | | | | |
| Nucor Corp. | | | 512 | | | | 32,486 | |
| | | | | | | | | |
| Leisure Time - 0.27% | | | | | | | | |
| Norwegian Cruise Line Holdings Ltd. (a) | | | 1,563 | | | | 89,763 | |
| | | | | | | | | |
| Machinery - Construction & Mining - 0.45% | | | | | | | | |
| Caterpillar, Inc. (b) | | | 985 | | | | 150,203 | |
| | | | | | | | | |
| Media - 0.20% | | | | | | | | |
| AMC Networks, Inc. - Class A (a) (b) | | | 995 | | | | 66,008 | |
| | | | | | | | | |
| Metal Fabricate & Hardware - 0.28% | | | | | | | | |
| RBC Bearings, Inc. (a) (b) | | | 623 | | | | 93,674 | |
| | | | | | | | | |
| Miscellaneous Manufacturing - 0.26% | | | | | | | | |
| Hexcel Corp. (b) | | | 1,271 | | | | 85,221 | |
| EAS CROW POINT ALTERNATIVES FUND | |
| SCHEDULE OF INVESTMENTS | |
| September 30, 2018 | ANNUAL REPORT |
| COMMON STOCK - 32.09% (continued) | | Shares | | | Value | |
| | | | | | | |
| Oil & Gas - 1.43% | | | | | | | | |
| ConocoPhillips (b) | | | 2,388 | | | $ | 184,831 | |
| EOG Resources, Inc. (b) | | | 1,458 | | | | 185,997 | |
| Whiting Petroleum Corp. (a) (b) | | | 1,956 | | | | 103,746 | |
| | | | | | | | 474,574 | |
| Packaging & Containers - 0.22% | | | | | | | | |
| Berry Global Group, Inc. (a) (b) | | | 1,515 | | | | 73,311 | |
| | | | | | | | | |
| Pharmaceuticals - 0.66% | | | | | | | | |
| Neurocrine Biosciences, Inc. (a) (b) | | | 1,776 | | | | 218,359 | |
| | | | | | | | | |
| Pipelines - 0.41% | | | | | | | | |
| Cheniere Energy, Inc. (a) (b) | | | 1,944 | | | | 135,089 | |
| | | | | | | | | |
| REITS - 0.98% | | | | | | | | |
| CyrusOne, Inc. (b) | | | 1,263 | | | | 80,074 | |
| Prologis, Inc. (b) | | | 3,599 | | | | 243,976 | |
| | | | | | | | 324,050 | |
| Retail - 0.57% | | | | | | | | |
| Five Below, Inc. (a) (b) | | | 892 | | | | 116,013 | |
| Ulta Beauty, Inc. (a) (b) | | | 253 | | | | 71,376 | |
| | | | | | | | 187,389 | |
| Semiconductors - 2.64% | | | | | | | | |
| Integrated Device Technology, Inc. (b) | | | 2,531 | | | | 118,982 | |
| Maxim Integrated Products, Inc. (b) | | | 5,864 | | | | 330,671 | |
| Micron Technology, Inc. (a) (b) | | | 4,898 | | | | 221,537 | |
| Monolithic Power Systems, Inc. (b) | | | 781 | | | | 98,039 | |
| Qorvo, Inc. (a) (b) | | | 1,348 | | | | 103,648 | |
| | | | | | | | 872,877 | |
| Software - 2.69% | | | | | | | | |
| Adobe Systems, Inc. (a) (b) | | | 832 | | | | 224,598 | |
| Atlassian Corp. PLC - Class A (a) - Australia | | | 2,102 | | | | 202,086 | |
| Splunk, Inc. (a) (b) | | | 1,274 | | | | 154,039 | |
| Tableau Software, Inc. - Class A (a) (b) | | | 944 | | | | 105,483 | |
| Take-Two Interactive Software, Inc. (a) (b) | | | 589 | | | | 81,276 | |
| Ultimate Software Group, Inc. (a) (b) | | | 380 | | | | 122,432 | |
| | | | | | | | 889,914 | |
| Telecommunications - 0.46% | | | | | | | | |
| CenturyLink, Inc. (b) | | | 4,588 | | | | 97,266 | |
| LogMeIn, Inc. | | | 626 | | | | 55,777 | |
| | | | | | | | 153,043 | |
| Textiles - 0.14% | | | | | | | | |
| Mohawk Industries, Inc. (a) | | | 253 | | | | 44,364 | |
| | | | | | | | | |
| Transportation - 1.17% | | | | | | | | |
| CSX Corp. | | | 2,340 | | | | 173,277 | |
| JB Hunt Transport Services, Inc. | | | 771 | | | | 91,703 | |
| XPO Logistics, Inc. (a) (b) | | | 1,076 | | | | 122,847 | |
| | | | | | | | 387,827 | |
| | | | | | | | | |
| TOTAL COMMON STOCK (Cost $10,116,740) | | | | | | | 10,623,821 | |
| EAS CROW POINT ALTERNATIVES FUND | |
| SCHEDULE OF INVESTMENTS | |
| September 30, 2018 | ANNUAL REPORT |
| CLOSED-END FUND - 0.00% | | Shares | | | Value | |
| | | | | | | |
| Royce Value Trust, Inc. | | | 52 | | | $ | 850 | |
| | | | | | | | | |
| TOTAL CLOSED-END FUND (Cost $816) | | | | | | | 850 | |
| | | | | | | | | |
| HEDGE FUND - 12.02% | | | | | | | | |
| ACA Master Select Fund LP (a) (e) | | | 36,932 | | | | 3,981,142 | |
| | | | | | | | | |
| TOTAL HEDGE FUND (Cost $3,771,057) | | | | | | | 3,981,142 | |
| | | | | | | | | |
| MUTUAL FUNDS - 52.83% | | | | | | | | |
| | | | | | | | | |
| Asset Allocation Funds - 12.88% | | | | | | | | |
| Crow Point Alternative Income Fund - Investor Class (c) | | | 492,449 | | | | 4,156,271 | |
| Wells Fargo Utility and Telecommunications Fund - Class A | | | 4,921 | | | | 106,545 | |
| | | | | | | | 4,262,816 | |
| Debt Fund - 6.85% | | | | | | | | |
| Eagle Rock Floating Rate Fund - Institutional Class (a) (c) | | | 225,125 | | | | 2,267,010 | |
| | | | | | | | | |
| Equity Fund - 33.10% | | | | | | | | |
| Crow Point Growth Fund - Institutional Class (a) (c) | | | 703,680 | | | | 6,938,283 | |
| LS Opportunity Fund | | | 69,528 | | | | 1,003,290 | |
| RVX Emerging Markets Equity Fund - Institutional Class (a) (c) | | | 330,915 | | | | 3,017,945 | |
| | | | | | | | 10,959,518 | |
| | | | | | | | | |
| TOTAL MUTUAL FUNDS (Cost $16,778,915) | | | | | | | 17,489,344 | |
| ASSET BACKED SECURITIES - 0.09% | | Principal Amount | | | Value | |
| | | | | | | |
| Commercial MBS - 0.08% | | | | | | | | |
| Morgan Stanley Capital I Trust 2006-IQ11, 6.367%, due 10/15/2042 (b) (d) | | $ | 27,261 | | | $ | 27,197 | |
| | | | | | | | | |
| Home Equity ABS - 0.01% | | | | | | | | |
| RASC Series 2003-KS4 Trust, 3.87%, due 05/25/2033 (b) | | | 1,625 | | | | 1,636 | |
| | | | | | | | | |
| TOTAL ASSET BACKED SECURITIES (Cost $29,466) | | | | | | | 28,833 | |
| | | | | | | | | |
| CORPORATE BOND - 0.82% | | | | | | | | |
| Frontier Communications Corp., 10.500%, due 09/15/2022 (b) | | | 300,000 | | | | 272,700 | |
| | | | | | | | | |
| TOTAL CORPORATE BOND (Cost $272,700) | | | | | | | 272,700 | |
OPTIONS PURCHASED - 2.27%
| CALL OPTIONS PURCHASED - 2.26% | | | | | Notional | | | Exercise | | | | | | | |
| | | Contracts 1 | | | Amount | | | Price | | | Expiration | | | Fair Value | |
| | | | | | | | | | | | | | | | |
| Amarin Corp. PLC | | | 300 | | | $ | 120,000 | | | $ | 4.00 | | | | 12/21/2018 | | | | 369,000 | |
| Amarin Corp. PLC | | | 300 | | | $ | 120,000 | | | $ | 4.00 | | | | 1/18/2019 | | | | 349,500 | |
| CVS Health Corp. | | | 50 | | | $ | 387,500 | | | $ | 77.50 | | | | 11/16/2018 | | | | 17,500 | |
| Tesla, Inc. | | | 12 | | | $ | 342,000 | | | $ | 285.00 | | | | 10/19/2018 | | | | 11,148 | |
| TOTAL CALL OPTIONS PURCHASED (Cost $111,048) | | | | | | | | | | | | | | | | | | | 747,148 | |
| EAS CROW POINT ALTERNATIVES FUND | |
| SCHEDULE OF INVESTMENTS | |
| September 30, 2018 | ANNUAL REPORT |
OPTIONS PURCHASED - 2.27% (continued)
| PUT OPTIONS PURCHASED - 0.01% | | | | | Notional | | | Exercise | | | | | | | |
| | | Contracts 1 | | | Amount | | | Price | | | Expiration | | | Fair Value | |
| | | | | | | | | | | | | | | | |
| Amarin Corp. PLC | | | 300 | | | $ | 90,000 | | | $ | 3.00 | | | | 10/19/2018 | | | $ | 600 | |
| Amarin Corp. PLC | | | 300 | | | $ | 90,000 | | | $ | 3.00 | | | | 12/21/2018 | | | | 900 | |
| Amarin Corp. PLC | | | 300 | | | $ | 90,000 | | | $ | 3.00 | | | | 1/18/2019 | | | | 1,200 | |
| TOTAL PUT OPTIONS PURCHASED (Cost $110,682) | | | | | | | | | | | | | | | | | | | 2,700 | |
| | | | | | | | | | | | | | | | | | | | | |
| TOTAL OPTIONS PURCHASED (Cost $221,730) | | | | | | | | | | | | | | | | | | | 749,848 | |
| | | | | | | | | | | | | | | | | | | | | |
| TOTAL INVESTMENTS (Cost $31,191,424) – 100.12% | | | | | | | | | | | | | | | | | | | 33,146,538 | |
| | | | | | | | | | | | | | | | | | | | | |
| SECURITIES SOLD SHORT (Proceeds $9,354,426) - (28.27%) | | | | | | | | | | | | | | | | | | | (9,359,404 | ) |
| | | | | | | | | | | | | | | | | | | | | |
| OPTIONS WRITTEN (Proceeds $3,800) - (0.02%) | | | | | | | | | | | | | | | | | | | (6,400 | ) |
| | | | | | | | | | | | | | | | | | | | | |
| OTHER ASSETS IN EXCESS OF LIABILITIES, NET - 28.17% | | | | | | | | | | | | | | | | | | | 9,327,240 | |
| | | | | | | | | | | | | | | | | | | | | |
| NET ASSETS - 100% | | | | | | | | | | | | | | | | | | $ | 33,107,974 | |
(a) Non-income producing security.
(b) All or a portion of the security is segregated as collateral for call options written and securities sold short.
(c) Affiliated investment company.
(d) Variable rate security - Interest rate shown represents the rate on September 30, 2018.
(e) Private equity fund purchased on March 1, 2016 that invests in the DCM Multi-Manager Fund, LLC (Series A) and the DCM Multi-Manager Fund, LLC (Series D). Redemptions may be made monthly upon 30 days written notice. There were no unfunded commitments as of September 30, 2018. This investment is valued using the practical expedient. For more information on the practical expedient, please refer to the security valuation section on Note 3 of the accompanying notes to the financial statements.
1 Each option contract is equivalent to 100 shares of the underlying common stock. All options are non-income producing.
LP - Limited Partnership
PLC - Public Limited Company
The accompanying notes are an integral part of these financial statements.
| EAS CROW POINT ALTERNATIVES FUND | |
| SCHEDULE OF INVESTMENTS - SECURITIES SOLD SHORT | |
| September 30, 2018 | ANNUAL REPORT |
SECURITIES SOLD SHORT - (28.27)%
| COMMON STOCK - (5.45)% | | Shares | | | Value | |
| | | | | | | |
| Auto Manufacturers - (1.44)% | | | | | | | | |
| Tesla, Inc. (a) | | | 1,800 | | | $ | 476,586 | |
| | | | | | | | | |
| Auto Parts & Equipment - (0.26)% | | | | | | | | |
| BorgWarner, Inc. | | | 2,044 | | | | 87,442 | |
| | | | | | | | | |
| Commercial Services - (0.09)% | | | | | | | | |
| Laureate Education, Inc. - Class A (a) | | | 1,937 | | | | 29,907 | |
| | | | | | | | | |
| Diversified Financial Services - (0.77)% | | | | | | | | |
| American Express Co. | | | 548 | | | | 58,356 | |
| Legg Mason, Inc. | | | 4,698 | | | | 146,719 | |
| Navient Corp. | | | 3,778 | | | | 50,927 | |
| | | | | | | | 256,002 | |
| Electronics - (0.31)% | | | | | | | | |
| Agilent Technologies, Inc. | | | 1,447 | | | | 102,071 | |
| | | | | | | | | |
| Forest Products & Paper - (0.55)% | | | | | | | | |
| International Paper Co. | | | 3,703 | | | | 182,003 | |
| | | | | | | | | |
| Internet - (0.57)% | | | | | | | | |
| SINA Corp. - China (a) | | | 2,693 | | | | 187,110 | |
| | | | | | | | | |
| Media - (0.23)% | | | | | | | | |
| Houghton Mifflin Harcourt Co. (a) | | | 11,035 | | | | 77,245 | |
| | | | | | | | | |
| Pharmaceuticals - (0.61)% | | | | | | | | |
| CVS Health Corp. | | | 2,560 | | | | 201,523 | |
| | | | | | | | | |
| Retail - (0.62)% | | | | | | | | |
| Barnes & Noble Education, Inc. (a) | | | 6,627 | | | | 38,172 | |
| McDonald’s Corp. | | | 1,000 | | | | 167,290 | |
| | | | | | | | 205,462 | |
| | | | | | | | | |
| TOTAL COMMON STOCK (Proceeds $1,907,199) | | | | | | | 1,805,351 | |
| EAS CROW POINT ALTERNATIVES FUND | |
| SCHEDULE OF INVESTMENTS - SECURITIES SOLD SHORT | |
| September 30, 2018 | ANNUAL REPORT |
SECURITIES SOLD SHORT - (28.27)% (continued)
| EXCHANGE TRADED FUNDS - (22.82)% | | Shares | | | Value | |
| | | | | | | |
| Equity Fund - (22.82)% | | | | | | | | |
| iShares MSCI Emerging Markets ETF | | | 15,000 | | | $ | 643,800 | |
| iShares MSCI India ETF | | | 1,721 | | | | 55,881 | |
| iShares MSCI Italy ETF | | | 1,000 | | | | 27,660 | |
| iShares MSCI Mexico ETF | | | 2,000 | | | | 102,460 | |
| iShares Russell 2000 Growth ETF | | | 10,904 | | | | 2,345,232 | |
| iShares Russell Mid-Cap Growth ETF | | | 13,000 | | | | 1,762,540 | |
| SPDR S&P 500 ETF Trust | | | 9,000 | | | | 2,616,480 | |
| | | | | | | | 7,554,053 | |
| | | | | | | | | |
| TOTAL EXCHANGE TRADED FUNDS (Proceeds $7,447,227) | | | | | | | 7,554,053 | |
| | | | | | | | | |
| TOTAL SECURITIES SOLD SHORT (Proceeds $9,354,426) | | | | | | $ | 9,359,404 | |
(a) Non-income producing security.
ETF - Exchange Traded Fund
The accompanying notes are an integral part of these financial statements.
| EAS CROW POINT ALTERNATIVES FUND | |
| SCHEDULE OF INVESTMENTS - WRITTEN OPTIONS | |
| September 30, 2018 | ANNUAL REPORT |
OPTIONS WRITTEN - (0.02)%
| CALL OPTIONS WRITTEN - (0.02)% | | Contracts 1 | | | Notional
Amount | | | Exercise
Price | | | Expiration | | | Value | |
| | | | | | | | | | | | | | | | |
| CVS Health Corp. | | | 50 | | | $ | 412,500 | | | $ | 82.50 | | | | 11/16/2018 | | | $ | 6,400 | |
| TOTAL CALL OPTIONS WRITTEN (Proceeds $3,800) | | | | | | | | | | | | | | | | | | | 6,400 | |
| | | | | | | | | | | | | | | | | | | | | |
| TOTAL OPTIONS WRITTEN (Proceeds $3,800) | | | | | | | | | | | | | | | | | | $ | 6,400 | |
1 Each option contract is equivalent to 100 shares of the underlying common stock. All options are non-income producing.
The accompanying notes are an integral part of these financial statements.
| CROW POINT GLOBAL TACTICAL ALLOCATION FUND | |
| SCHEDULE OF INVESTMENTS | |
| September 30, 2018 | ANNUAL REPORT |
| COMMON STOCK - 5.30% | | Shares | | | Fair Value | |
| | | | | | | |
| Biotechnology - 2.13% | | | | | | | | |
| Alnylam Pharmaceuticals, Inc. (a) | | | 750 | | | $ | 65,640 | |
| Exact Sciences Corp. (a) | | | 2,100 | | | | 165,732 | |
| HTG Molecular Diagnostics, Inc. (a) | | | 20,000 | | | | 101,000 | |
| PolarityTE, Inc. (a) | | | 2,800 | | | | 53,480 | |
| | | | | | | | 385,852 | |
| Computers - 0.33% | | | | | | | | |
| Lumentum Holdings, Inc. (a) | | | 1,000 | | | | 59,950 | |
| | | | | | | | | |
| Healthcare - Products - 1.16% | | | | | | | | |
| CytoSorbents Corp. (a) | | | 6,000 | | | | 77,400 | |
| Novocure Ltd. (a) | | | 2,550 | | | | 133,620 | |
| | | | | | | | 211,020 | |
| Internet - 0.44% | | | | | | | | |
| RingCentral, Inc. - Class A (a) | | | 850 | | | | 79,092 | |
| | | | | | | | | |
| Semiconductors - 0.25% | | | | | | | | |
| Qorvo, Inc. (a) | | | 600 | | | | 46,134 | |
| | | | | | | | | |
| Software - 0.99% | | | | | | | | |
| New Relic, Inc. (a) | | | 850 | | | | 80,095 | |
| Rapid7, Inc. (a) | | | 2,700 | | | | 99,684 | |
| | | | | | | | 179,779 | |
| | | | | | | | | |
| TOTAL COMMON STOCK (Cost $689,718) | | | | | | | 961,827 | |
| | | | | | | | | |
| CLOSED-END FUNDS - 4.24% | | | | | | | | |
| Eaton Vance Limited Duration Income Fund | | | 30,570 | | | | 387,628 | |
| MFS Multimarket Income Trust | | | 69,300 | | | | 383,229 | |
| | | | | | | | | |
| TOTAL CLOSED-END FUNDS (Cost $840,452) | | | | | | | 770,857 | |
| | | | | | | | | |
| EXCHANGE TRADED FUNDS - 59.79% | | | | | | | | |
| | | | | | | | | |
| Debt Funds - 3.12% | | | | | | | | |
| iShares Floating Rate Bond ETF (b) | | | 11,100 | | | | 566,322 | |
| | | | | | | | | |
| Equity Funds - 56.67% | | | | | | | | |
| Consumer Discretionary Select Sector SPDR Fund | | | 9,530 | | | | 1,117,107 | |
| Financial Select Sector SPDR Fund | | | 30,000 | | | | 827,400 | |
| Industrial Select Sector SPDR Fund | | | 10,408 | | | | 815,987 | |
| iShares China Large-Cap ETF | | | 12,000 | | | | 513,840 | |
| iShares Core S&P Small-Cap ETF (b) | | | 8,000 | | | | 697,920 | |
| iShares MSCI ACWI ETF | | | 6,800 | | | | 504,968 | |
| iShares MSCI Brazil ETF | | | 5,500 | | | | 185,515 | |
| iShares MSCI Emerging Markets ETF | | | 30,000 | | | | 1,287,600 | |
| iShares Russell 3000 ETF | | | 5,000 | | | | 861,500 | |
| SPDR S&P 500 ETF Trust (b) | | | 5,700 | | | | 1,657,104 | |
| Technology Select Sector SPDR Fund | | | 15,400 | | | | 1,160,082 | |
| Vanguard Total Stock Market ETF (b) | | | 4,430 | | | | 662,950 | |
| | | | | | | | 10,291,973 | |
| | | | | | | | | |
| TOTAL EXCHANGE TRADED FUNDS (Cost $10,226,713) | | | | | | | 10,858,295 | |
| | | | | | | | | |
| MUTUAL FUNDS - 9.24% | | | | | | | | |
| | | | | | | | | |
| Debt Fund - 5.55% | | | | | | | | |
| Eagle Rock Floating Rate Fund - Institutional Class (a) (d) | | | 100,000 | | | | 1,007,000 | |
| CROW POINT GLOBAL TACTICAL ALLOCATION FUND | |
| SCHEDULE OF INVESTMENTS | |
| September 30, 2018 | ANNUAL REPORT |
| MUTUAL FUNDS - 9.24% (continued) | | Shares | | | Fair Value | |
| | | | | | | |
| Equity Fund - 3.69% | | | | | | | | |
| RVX Emerging Markets Equity Fund - Institutional Class (a) (d) | | | 73,539 | | | $ | 670,676 | |
| | | | | | | | | |
| TOTAL MUTUAL FUNDS (Cost $1,734,783) | | | | | | | 1,677,676 | |
| ASSET BACKED SECURITIES - 0.10% | | Principal Amount | | | Fair Value | |
| | | | | | | |
| Commercial MBS - 0.04% | | | | | | | | |
| Banc of America Funding 2006-2 Trust, 5.750%, due 03/25/2036 (b) | | $ | 3,324 | | | $ | 3,211 | |
| WaMu Mortgage Pass-Through Certificates Series 2003-S12 Trust, 4.750%, due 11/25/2018 (b) | | | 418 | | | | 417 | |
| Washington Mutual Mortgage Pass-Through Certificates WMALT Series 2006-7 Trust, 4.400%, 09/25/2036 (b) (e) | | | 8,565 | | | | 4,148 | |
| | | | | | | | 7,776 | |
| Home Equity ABS - 0.03% | | | | | | | | |
| Countrywide Asset-Backed Certificates, 5.216%, due 10/25/2017 (b) (e) | | | 2,484 | | | | 2,516 | |
| RASC Series 2003-KS4 Trust, 3.870%, due 06/25/2033 (b) | | | 2,031 | | | | 2,045 | |
| | | | | | | | 4,561 | |
| Other ABS - 0.03% | | | | | | | | |
| Equity One Mortgage Pass-Through Trust 2003-4, 5.869%, 10/25/2034 (b) (e) | | | 5,950 | | | | 5,877 | |
| | | | | | | | | |
| TOTAL ASSET BACKED SECURITIES (Cost $17,491) | | | | | | | 18,214 | |
OPTIONS PURCHASED - 0.27%
| PUT OPTIONS PURCHASED - 0.27% | | | | | Notional | | | Exercise | | | | | | | |
| | | Contracts 1 | | | Amount | | | Price | | | Expiration | | | Fair Value | |
| | | | | | | | | | | | | | | | |
| Financial Select Sector SPDR Fund | | | 300 | | | $ | 870,000 | | | $ | 29.00 | | | | 10/19/2018 | | | | 43,200 | |
| iShares MSCI Emerging Markets ETF | | | 120 | | | $ | 420,000 | | | $ | 35.00 | | | | 10/19/2018 | | | | 120 | |
| SPDR S&P 500 ETF Trust | | | 57 | | | $ | 1,618,800 | | | $ | 284.00 | | | | 10/19/2018 | | | | 5,700 | |
| TOTAL PUT OPTIONS PURCHASED (Cost $52,611) | | | | | | | | | | | | | | | | | | | 49,020 | |
| | | | | | | | | | | | | | | | | | | | | |
| TOTAL OPTIONS PURCHASED (Cost $52,611) | | | | | | | | | | | | | | | | | | | 49,020 | |
| | | | | | | | | | | | | | | | | | | | | |
| SHORT-TERM INVESTMENTS - 17.07% | | | | | | | | | | | | | | | | | | | | |
| Federated Government Obligations Fund - Institutional Class, 1.89% (c) | | | | | | | | | | | | | | | 3,099,946 | | | | 3,099,946 | |
| | | | | | | | | | | | | | | | | | | | | |
| TOTAL SHORT-TERM INVESTMENTS (Cost $3,099,946) | | | | | | | | | | | | | | | | | | | 3,099,946 | |
| | | | | | | | | | | | | | | | | | | | | |
| TOTAL INVESTMENTS (Cost $16,661,714) – 96.01% | | | | | | | | | | | | | | | | | | $ | 17,435,835 | |
| | | | | | | | | | | | | | | | | | | | | |
| SECURITIES SOLD SHORT (Proceeds $609,673) - (3.23%) | | | | | | | | | | | | | | | | | | | (585,974 | ) |
| | | | | | | | | | | | | | | | | | | | | |
| OPTIONS WRITTEN (Proceeds $50,389) - (0.18%) | | | | | | | | | | | | | | | | | | | (33,339 | ) |
| | | | | | | | | | | | | | | | | | | | | |
| OTHER ASSETS IN EXCESS OF LIABILITIES, NET - 7.40% | | | | | | | | | | | | | | | | | | | 1,344,388 | |
| | | | | | | | | | | | | | | | | | | | | |
| NET ASSETS - 100% | | | | | | | | | | | | | | | | | | $ | 18,160,910 | |
(a) Non-income producing security.
(b) All or a portion of the security is segregated as collateral for options written and securities sold short.
(c) Rate shown represents the 7-day effective yield at September 30, 2018, is subject to change and resets daily.
(d) Affiliated investment company.
(e) Variable coupon security - Interest rate shown represents the rate on September 30, 2018.
1 Each option contract is equivalent to 100 shares of the underlying ETF. All options are non-income producing.
ETF - Exchange Traded Fund
The accompanying notes are an integral part of these financial statements.
| CROW POINT GLOBAL TACTICAL ALLOCATION FUND | |
| SCHEDULE OF INVESTMENTS - SECURITIES SOLD SHORT | |
| September 30, 2018 | ANNUAL REPORT |
SECURITIES SOLD SHORT - (3.23)%
| COMMON STOCK - (1.75)% | | Shares | | | Fair Value | |
| | | | | | | |
| Auto Manufacturers - (1.75)% | | | | | | | | |
| Tesla, Inc. (a) | | | 1,200 | | | $ | 317,724 | |
| | | | | | | | | |
| TOTAL COMMON STOCK (Proceeds $353,629) | | | | | | | 317,724 | |
| | | | | | | | | |
| EXCHANGE TRADED FUNDS - (1.48)% | | | | | | | | |
| | | | | | | | | |
| Equity Fund - (1.48)% | | | | | | | | |
| iShares MSCI South Africa ETF | | | 5,000 | | | | 268,250 | |
| | | | | | | | | |
| TOTAL EXCHANGE TRADED FUNDS (Proceeds $256,044) | | | | | | | 268,250 | |
| | | | | | | | | |
| TOTAL SECURITIES SOLD SHORT (Proceeds $609,673) | | | | | | $ | 585,974 | |
(a) Non-income producing security.
ETF - Exchange Traded Fund
The accompanying notes are an integral part of these financial statements.
| CROW POINT GLOBAL TACTICAL ALLOCATION FUND | |
| SCHEDULE OF INVESTMENTS - WRITTEN OPTIONS | |
| September 30, 2018 | ANNUAL REPORT |
OPTIONS WRITTEN - (0.18)%
| CALL OPTIONS WRITTEN - (0.13)% | | Contracts 1 | | | Notional
Amount | | | Exercise
Price | | | Expiration | | | Fair Value | |
| | | | | | | | | | | | | | | | |
| iShares MSCI Brazil ETF | | | 55 | | | $ | 192,500 | | | $ | 35.00 | | | | 10/19/2018 | | | $ | 4,840 | |
| SPDR S&P 500 ETF Trust | | | 57 | | | $ | 1,653,000 | | | $ | 290.00 | | | | 10/19/2018 | | | | 18,240 | |
| TOTAL CALL OPTIONS WRITTEN (Proceeds $18,603) | | | | | | | | | | | | | | | | | | | 23,080 | |
| PUT OPTIONS WRITTEN - (0.05%) | | Contracts 1 | | | Notional
Amount | | | Exercise
Price | | | Expiration | | | Fair Value | |
| | | | | | | | | | | | | | | | |
| iShares MSCI Brazil ETF | | | 55 | | | $ | 225,500 | | | $ | 41.00 | | | | 10/19/2018 | | | | 4,730 | |
| iShares MSCI Emerging Markets ETF | | | 120 | | | $ | 390,000 | | | $ | 32.50 | | | | 10/19/2018 | | | | 2,280 | |
| SPDR S&P 500 ETF Trust | | | 57 | | | $ | 1,596,000 | | | $ | 280.00 | | | | 10/19/2018 | | | | 3,249 | |
| TOTAL PUT OPTIONS WRITTEN (Proceeds $31,786) | | | | | | | | | | | | | | | | | | | 10,259 | |
| | | | | | | | | | | | | | | | | | | | | |
| TOTAL OPTIONS WRITTEN (Proceeds $50,389) | | | | | | | | | | | | | | | | | | $ | 33,339 | |
1 Each option contract is equivalent to 100 shares of the underlying ETF. All options are non-income producing.
ETF - Exchange Traded Fund
The accompanying notes are an integral part of these financial statements.
| CROW POINT ALTERNATIVE INCOME FUND | |
| SCHEDULE OF INVESTMENTS | |
| September 30, 2018 | ANNUAL REPORT |
PREFERRED STOCK - 0.60%
| Banks - 0.49% | | | | | | |
| Bank of America Corp., 6.20% | | | 1,900 | | | $ | 49,210 | |
| | | | | | | | | |
| Diversified Financial Services - 0.11% | | | | | | | | |
| Legg Mason, Inc., 6.375% | | | 400 | | | | 10,348 | |
| | | | | | | | | |
| TOTAL PREFERRED STOCK (Cost $60,843) | | | | | | | 59,558 | |
| | | | | | | | | |
| CLOSED-END FUNDS - 7.05% | | | | | | | | |
| | | | | | | | | |
| Eaton Vance Limited Duration Income Fund | | | 35,475 | | | | 449,823 | |
| MFS Multimarket Income Trust | | | 45,969 | | | | 254,209 | |
| | | | | | | | 704,032 | |
| | | | | | | | | |
| TOTAL CLOSED END FUNDS (Cost $771,177) | | | | | | | 704,032 | |
| | | | | | | | | |
| MUTUAL FUNDS - 5.05% | | | | | | | | |
| | | | | | | | | |
| Debt Fund - 5.05% | | | | | | | | |
| Eagle Rock Floating Rate Fund - Institutional Class (a) (c) | | | 50,000 | | | | 503,500 | |
| | | | | | | | | |
| TOTAL MUTUAL FUNDS (Cost $500,000) | | | | | | | 503,500 | |
| | | | | | | | | |
| EXCHANGE-TRADED FUNDS - 58.02% | | | | | | | | |
| | | | | | | | | |
| Asset Allocation Fund - 2.70% | | | | | | | | |
| SPDR Barclays Convertible Securities ETF | | | 5,000 | | | | 269,700 | |
| | | | | | | | | |
| Debt Funds - 36.98% | | | | | | | | |
| iShares 20+ Year Treasury Bond ETF | | | 6,000 | | | | 703,620 | |
| iShares Core U.S. Aggregate Bond ETF | | | 15,000 | | | | 1,582,800 | |
| Invesco Senior Loan ETF | | | 21,000 | | | | 486,570 | |
| SPDR Bloomberg Barclays High Yield Bond ETF | | | 14,000 | | | | 504,700 | |
| SPDR Bloomberg Barclays Short Term High Yield Bond ETF | | | 15,000 | | | | 413,850 | |
| | | | | | | | 3,691,540 | |
| Equity Funds - 18.34% | | | | | | | | |
| Consumer Discretionary Select Sector SPDR Fund | | | 1,500 | | | | 175,830 | |
| Financial Select Sector SPDR Fund | | | 7,800 | | | | 215,124 | |
| Industrial Select Sector SPDR Fund | | | 2,000 | | | | 156,800 | |
| SPDR S&P 500 ETF Trust | | | 4,000 | | | | 1,162,880 | |
| Technology Select Sector SPDR Fund | | | 1,600 | | | | 120,527 | |
| | | | | | | | 1,831,161 | |
| | | | | | | | | |
| TOTAL EXCHANGE-TRADED FUNDS (Cost $5,772,875) | | | | | | | 5,792,401 | |
| CROW POINT ALTERNATIVE INCOME FUND | |
| SCHEDULE OF INVESTMENTS | |
| September 30, 2018 | ANNUAL REPORT |
| BONDS & NOTES - 7.47% | | Principal Amount | | | Fair Value | |
| | | | | | | |
| Asset Backed Securities - 5.91% | | | | | | | | |
| Ameriquest Mortgage Securities, Inc. Asset-Backed Pass-Through Certificates Series 2003-11, 5.066%, due 12/25/2033 (d) | | $ | 2,514 | | | $ | 2,599 | |
| Countrywide Asset-Backed Certificates, 4.554%, due 10/25/2017 (d) | | | 7,451 | | | | 7,548 | |
| Equity One Mortgage Pass-Through Trust 2003-4, 4.509%, due 10/25/2034 (e) | | | 17,851 | | | | 17,632 | |
| Fremont Home Loan Trust 2005-B, 1 mo. LIBOR plus 0.71%, 2.921%, due 04/25/2035 (d) | | | 57,575 | | | | 57,738 | |
| GE Capital Mortgage Services, Inc. 1999-HE1 Trust, 6.265%, due 04/25/2029 | | | 1,283 | | | | 1,302 | |
| Option One Mortgage Loan Trust 2005-1, 1 mo. LIBOR plus 0.80%, 3.016%, due 02/25/2035 (e) | | | 3,206 | | | | 3,205 | |
| RAMP Series 2005-RS1 Trust, 4.713%, due 11/25/2034 | | | 2,824 | | | | 2,825 | |
| | | | | | | | | |
| RASC Series 2003-KS4 Trust, 3.870%, due 05/25/2033 (d) | | | 6,093 | | | | 6,134 | |
| | | | | | | | | |
| RASC Series 2004-KS2 Trust, 4.300%, due 03/25/2034 (d) | | | 1,869 | | | | 1,869 | |
| | | | | | | | | |
| Structured Asset Securities Corp. Mortgage Loan Trust 2006-AM1, 1 mo. LIBOR plus 0.34%, 2.376%, due 04/25/2036 (d) | | | 89,399 | | | | 89,143 | |
| | | | | | | | | |
| Structured Asset Securities Corp. Mortgage Loan Trust 2006-WF1, 1 mo. LIBOR plus 0.16%, 2.556%, due 02/25/2036 (d) | | | 399,874 | | | | 400,057 | |
| | | | | | | | 590,052 | |
| Mortgage Backed Securities - 1.56% | | | | | | | | |
| Adjustable Rate Mortgage Trust 2005-5, 1 mo. LIBOR plus 0.28%, 2.625%, due 09/25/2035 (d) | | | 25,680 | | | | 25,540 | |
| Banc of America Funding 2006-2 Trust, 5.750%, due 03/25/2036 | | | 9,971 | | | | 9,633 | |
| JP Morgan Chase Commercial Mortgage Securities Trust 2012-CIBX, 3.139%, due 06/15/2045 | | | 107,186 | | | | 107,155 | |
| WaMu Mortgage Pass-Through Certificates Series 2003-S12 Trust, 4.750%, due 11/25/2018 | | | 1,253 | | | | 1,251 | |
| | | | | | | | | |
| Washington Mutual Mortgage Pass-Through Certificates WMALT Series 2006-7 Trust, 4.400%, due 09/25/2036 (d) | | | 25,696 | | | | 12,445 | |
| | | | | | | | 156,024 | |
| | | | | | | | | |
| TOTAL BONDS & NOTES (Cost $693,307) | | | | | | | 746,076 | |
| PRIVATE INVESTMENT - 3.66% | | Shares | | | Fair Value | |
| | | | | | | |
| Finance - 3.66% | | | | | | | | |
| Vemo Education, Inc. (a) (e) | | | 2,250,000 | | | | 365,826 | |
| | | | | | | | | |
| TOTAL PRIVATE INVESTMENT (Cost $300,000) | | | | | | | 365,826 | |
OPTIONS PURCHASED - 0.13%
| PUT OPTIONS PURCHASED - 0.13% | | Contracts 1 | | | Notional
Amount | | | Exercise
Price | | | Expiration | | | Fair Value | |
| | | | | | | | | | | | | | | | |
| Financial Select Sector SPDR Fund | | | 78 | | | $ | 226,200 | | | $ | 29.00 | | | | 10/19/2018 | | | | 11,232 | |
| iShares MSCI Emerging Markets ETF | | | 25 | | | $ | 87,500 | | | $ | 35.00 | | | | 10/19/2018 | | | | 25 | |
| SPDR S&P 500 ETF Trust | | | 15 | | | $ | 426,000 | | | $ | 284.00 | | | | 10/19/2018 | | | | 1,500 | |
| TOTAL PUT OPTIONS PURCHASED (Cost $15,296) | | | | | | | | | | | | | | | | | | | 12,757 | |
| | | | | | | | | | | | | | | | | | | | | |
| TOTAL OPTIONS PURCHASED (Cost $15,296) | | | | | | | | | | | | | | | | | | | 12,757 | |
| CROW POINT ALTERNATIVE INCOME FUND | |
| SCHEDULE OF INVESTMENTS | |
| September 30, 2018 | ANNUAL REPORT |
| SHORT-TERM INVESTMENT - 7.66% | | Shares | | | Fair Value | |
| | | | | | | |
| Federated Government Obligations Fund - Institutional Class, 1.89% (b) | | | 764,051 | | | $ | 764,051 | |
| | | | | | | | | |
| TOTAL SHORT-TERM INVESTMENT (Cost $764,051) | | | | | | | 764,051 | |
| | | | | | | | | |
| TOTAL INVESTMENTS (Cost $8,877,549) - 89.64% | | | | | | | 8,948,201 | |
| | | | | | | | | |
| SECURITIES SOLD SHORT (Proceeds $88,410) - (0.80%) | | | | | | | (79,431 | ) |
| | | | | | | | | |
| OPTIONS WRITTEN (Proceeds $11,240) - (0.06%) | | | | | | | (6,250 | ) |
| | | | | | | | | |
| OTHER ASSETS IN EXCESS OF LIABILITIES, NET - 11.22% | | | | | | | 1,120,235 | |
| | | | | | | | | |
| NET ASSETS - 100% | | | | | | $ | 9,982,755 | |
(a) Non-income producing security.
(b) Rate shown represents the 7-day effective yield at September 30, 2018, is subject to change and resets daily.
(c) Affiliated investment company.
(d) Variable or step coupon security - Interest rate shown represents the rate on September 30, 2018.
(e) The value has been determined under the policies of the Board of Trustees. The value of such securities is $365,826 or 3.66% of net assets.
1 Each option contract is equivalent to 100 shares of the underlying ETF. All options are non-income producing.
ETF - Exchange Traded Fund
The accompanying notes are an integral part of these financial statements.
| CROW POINT ALTERNATIVE INCOME FUND | |
| SCHEDULE OF INVESTMENTS - SECURITIES SOLD SHORT | |
| September 30, 2018 | ANNUAL REPORT |
SECURITIES SOLD SHORT - (0.80)%
| COMMON STOCK - (0.80)% | | Shares | | | Fair Value | |
| | | | | | | |
| Auto Manufacturers - (0.80)% | | | | | | | | |
| Tesla, Inc. (a) | | | 300 | | | $ | 79,431 | |
| | | | | | | | | |
| TOTAL COMMON STOCK (Proceeds $88,410) | | | | | | $ | 79,431 | |
(a) Non-income producing security.
The accompanying notes are an integral part of these financial statements.
| CROW POINT ALTERNATIVE INCOME FUND | |
| SCHEDULE OF INVESTMENTS - WRITTEN OPTIONS | |
| September 30, 2018 | ANNUAL REPORT |
OPTIONS WRITTEN - (0.06)%
| CALL OPTIONS WRITTEN - (0.05)% | | Contracts 1 | | | Notional
Amount | | | Exercise
Price | | | Expiration | | | Fair Value | |
| | | | | | | | | | | | | | | | |
| SPDR S&P 500 ETF Trust | | | 10 | | | $ | 292,000 | | | $ | 292.00 | | | | 10/1/2018 | | | $ | 120 | |
| SPDR S&P 500 ETF Trust | | | 15 | | | $ | 435,000 | | | $ | 290.00 | | | | 10/19/2018 | | | | 4,800 | |
| TOTAL CALL OPTIONS WRITTEN (Proceeds $7,565) | | | | | | | | | | | | | | | | | | | 4,920 | |
| PUT OPTIONS WRITTEN - (0.01%) | | Contracts 1 | | | Notional Amount | | | Exercise
Price | | | Expiration | | | Fair Value | |
| | | | | | | | | | | | | | | | |
| iShares MSCI Emerging Markets ETF | | | 25 | | | $ | 102,500 | | | $ | 41.00 | | | | 10/19/2018 | | | $ | 475 | |
| SPDR S&P 500 ETF Trust | | | 15 | | | $ | 420,000 | | | $ | 280.00 | | | | 10/19/2018 | | | | 855 | |
| TOTAL PUT OPTIONS WRITTEN (Proceeds $3,675) | | | | | | | | | | | | | | | | | | | 1,330 | |
| | | | | | | | | | | | | | | | | | | | | |
| TOTAL OPTIONS WRITTEN (Proceeds $11,240) | | | | | | | | | | | | | | | | | | $ | 6,250 | |
1 Each option contract is equivalent to 100 shares of the underlying ETF. All options are non-income producing.
ETF - Exchange Traded Fund
The accompanying notes are an integral part of these financial statements.
| EAS CROW POINT ALTERNATIVES FUND | |
| STATEMENT OF ASSETS AND LIABILITIES | |
| | |
| September 30, 2018 | ANNUAL REPORT |
| Assets: | | | |
| Investment securities: | | | | |
| Unaffiliated Securities at Cost | | $ | 15,472,509 | |
| Affiliated Securities at Cost | | | 15,718,915 | |
| Total Securities at Cost | | | 31,191,424 | |
| Unaffiliated Securities at Value | | | 16,767,029 | |
| Affiliated Securities at Value | | | 16,379,509 | |
| Deposits at broker | | | 8,788,462 | |
| Due from adviser | | | 14,876 | |
| Receivables: | | | | |
| Interest | | | 3,175 | |
| Dividends | | | 4,132 | |
| Tax reclaims | | | 8,613 | |
| Investment securities sold | | | 543,074 | |
| Fund shares sold | | | 67 | |
| Prepaid expenses and other assets | | | 62,492 | |
| Total assets | | | 42,571,429 | |
| | | | | |
| Liabilities: | | | | |
| Securities sold short and options written: | | | | |
| Proceeds from securities sold short | | | 9,354,426 | |
| Proceeds from options written | | | 3,800 | |
| Total proceeds from securities sold short and options written | | | 9,358,226 | |
| Securities sold short at value | | | 9,359,404 | |
| Options written at value | | | 6,400 | |
| Total securities sold short and options written at value | | | 9,365,804 | |
| Payables: | | | | |
| Dividend expense from securities sold short | | | 16,803 | |
| Accrued distribution (12b-1) fees | | | 2,005 | |
| Due to administrator | | | 13,998 | |
| Cash overdraft due to custodian | | | 60,470 | |
| Accrued expenses | | | 4,375 | |
| Total liabilities | | | 9,463,455 | |
| Net Assets | | $ | 33,107,974 | |
| | | | | |
| Sources of Net Assets: | | | | |
| Paid-in capital | | $ | 32,173,899 | |
| Total distributable earnings | | | 934,075 | |
| Total Net Assets (Unlimited shares of beneficial interest authorized) | | $ | 34,042,049 | |
| | | | | |
| Class A Shares: | | | | |
| Net assets | | $ | 2,056,030 | |
| Shares Outstanding ($0 par value, Unlimited shares of beneficial interest authorized) | | | 207,303 | |
| Net Asset Value Per Share | | $ | 9.92 | |
| | | | | |
| Maximum Offering Price Per Share (a) | | $ | 10.50 | |
| Minimum Redemption Price Per Share (b) | | $ | 9.82 | |
| | | | | |
| Class C Shares: | | | | |
| Net assets | | $ | 891,655 | |
| Shares Outstanding ($0 par value, Unlimited shares of beneficial interest authorized) | | | 93,004 | |
| Net Asset Value and Offering Price Per Share | | $ | 9.59 | |
| | | | | |
| Minimum Redemption Price Per Share (c) | | $ | 9.49 | |
| | | | | |
| Class I Shares: | | | | |
| Net assets | | $ | 30,160,289 | |
| Shares Outstanding ($0 par value, Unlimited shares of beneficial interest authorized) | | | 3,014,737 | |
| Net Asset Value, Offering and Redemption Price Per Share | | $ | 10.00 | |
| (a) A maximum sales charge of 5.50% is imposed on Class A shares. |
| (b) Investments in Class A shares made at or above the $1 million breakpoint are not subject to an initial sales charge and may be subject to a 1.00% contingent deferred sales charge (“CDSC”) on shares redeemed within one year from the date of purchase. |
| (c) A contingent deferred sales charge (“CDSC”) of 1.00% is imposed in the event of certain redemption transactions made within one year from the date of purchase. |
The accompanying notes are an integral part of these financial statements.
| EAS CROW POINT ALTERNATIVES FUND | |
| STATEMENTS OF OPERATIONS | |
| September 30, 2018 | ANNUAL REPORT |
| | | For the | | | For the | |
| | | Period Ended | | | Year Ended | |
| | | September 30, 2018 (a) | | | April 30, 2018 | |
| | | | | | | |
| Investment income: | | | | | | | | |
| Dividends (net of foreign withholding taxes of $17 and $2, respectively) | | $ | 31,031 | | | $ | 162,114 | |
| Dividends from affiliated funds | | | — | | | | 63,043 | |
| Interest | | | 32,398 | | | | 24,975 | |
| Total investment income | | | 63,429 | | | | 250,132 | |
| | | | | | | | | |
| Expenses: | | | | | | | | |
| Management fees (Note 7) | | | 109,988 | | | | 231,659 | |
| Distribution (12b-1) fees - Class A | | | 2,372 | | | | 11,885 | |
| Distribution (12b-1) fees - Class C | | | 3,518 | | | | 8,461 | |
| Accounting and transfer agent fees and expenses | | | 63,702 | | | | 94,974 | |
| Professional fees | | | 43,182 | | | | 83,165 | |
| Prior administrator fees | | | — | | | | 65,867 | |
| Dividends on securities sold short | | | 29,990 | | | | 65,838 | |
| Registration and filing fees | | | 18,297 | | | | 51,004 | |
| Miscellaneous | | | 13,004 | | | | 2,530 | |
| Dealer network fees | | | — | | | | 5,174 | |
| Interest expense | | | 13,169 | | | | 61,614 | |
| Custodian fees | | | 8,927 | | | | 40,252 | |
| Pricing fees | | | 6,879 | | | | 12,950 | |
| Trustee fees and expenses | | | 6,491 | | | | 12,811 | |
| Compliance officer fees | | | 6,250 | | | | 7,500 | |
| Insurance | | | 725 | | | | 1,533 | |
| Reports to shareholders | | | 361 | | | | 8,302 | |
| Total expenses | | | 326,855 | | | | 765,519 | |
| Less expense reimbursement: | | | | | | | | |
| Fees waived by Adviser | | | (74,935 | ) | | | (179,534 | ) |
| Fees waived by Adviser for affiliated holdings | | | (25,402 | ) | | | (54,616 | ) |
| Fees waived by administrator | | | (16,250 | ) | | | (44,660 | ) |
| Net expenses | | | 210,268 | | | | 486,709 | |
| | | | | | | | | |
| Net investment loss | | | (146,839 | ) | | | (236,577 | ) |
| | | | | | | | | |
| Realized and unrealized gain (loss): | | | | | | | | |
| Net realized gain (loss) on: | | | | | | | | |
| Unaffiliated Investments | | | 1,094,912 | | | | 1,742,373 | |
| Affiliated Investments | | | — | | | | 81,485 | |
| Foreign currency transactions | | | (1,107 | ) | | | 1,496 | |
| Options written | | | 22,490 | | | | (11,609 | ) |
| Securities sold short | | | (45,936 | ) | | | (259,827 | ) |
| Net realized gain on investments, foreign currency transactions, written options and securities sold short | | | 1,070,359 | | | | 1,553,918 | |
| | | | | | | | | |
| Net change in unrealized appreciation (depreciation) on: | | | | | | | | |
| Unaffiliated Investments | | | 563,563 | | | | 245,233 | |
| Affiliated Investments | | | 659,566 | | | | 127,658 | |
| Foreign currency translations | | | 110 | | | | (3,608 | ) |
| Options written | | | (12,570 | ) | | | 4,641 | |
| Securities sold short | | | (24,468 | ) | | | (1,032 | ) |
| Net change in unrealized appreciation on investments, foreign currency translations, written options and securities sold short | | | 1,186,201 | | | | 372,892 | |
| | | | | | | | | |
| Net gain on investments, options written, securities sold short and foreign currency transactions | | | 2,256,560 | | | | 1,926,810 | |
| | | | | | | | | |
| Net increase in net assets resulting from operations | | $ | 2,109,721 | | | $ | 1,690,233 | |
(a) Represents the period from May 1, 2018 through September 30, 2018.
The accompanying notes are an integral part of these financial statements.
| EAS CROW POINT ALTERNATIVES FUND | |
| STATEMENTS OF CHANGES IN NET ASSETS | |
| | |
| September 30, 2018 | ANNUAL REPORT |
| | | For the | | | For the | | | For the | |
| | | Period Ended | | | Year Ended | | | Year Ended | |
| | | September 30, 2018 (a) | | | April 30, 2018 | | | April 30, 2017 | |
| | | | | | | | | | |
| Increase (decrease) in net assets from: | | | | | | | | | | | | |
| Operations: | | | | | | | | | | | | |
| Net investment loss | | $ | (146,839 | ) | | $ | (236,577 | ) | | $ | (34,289 | ) |
| Net realized gain (loss) from investments, foreign currency transactions, written options and securities sold short | | | 1,070,359 | | | | 1,553,918 | | | | (136,837 | ) |
| Net change in unrealized appreciation on investments, foreign currency translations, written options and securities sold short | | | 1,186,201 | | | | 372,892 | | | | 394,847 | |
| Net increase in net assets resulting from operations | | | 2,109,721 | | | | 1,690,233 | | | | 223,721 | |
| | | | | | | | | | | | | |
| Distributions to shareholders from: | | | | | | | | | | | | |
| Net investment income - Class A | | | — | | | | (17,465 | ) | | | (37,351 | ) |
| Net investment income - Class C | | | — | | | | (458 | ) | | | — | |
| Net investment income - Class I | | | — | | | | (113,800 | ) | | | (39,980 | ) |
| Total distributions | | | — | | | | (131,723 | ) | | | (77,331 | ) |
| | | | | | | | | | | | | |
| From shares of beneficial interest: | | | | | | | | | | | | |
| Proceeds from shares sold: | | | | | | | | | | | | |
| Class A | | | 5,200 | | | | 134,893 | | | | 2,515,557 | |
| Class C | | | 28,000 | | | | 4,000 | | | | 56,128 | |
| Class I | | | 17,498,537 | | | | 9,960,572 | | | | 10,067,605 | |
| Net asset value of shares issued in reinvestment of distributions to shareholders: | | | | | | | | | | | | |
| Class A | | | | | | | 15,347 | | | | 33,593 | |
| Class C | | | | | | | 428 | | | | — | |
| Class I | | | | | | | 111,539 | | | | 36,651 | |
| Redemption fee proceeds: | | | | | | | | | | | | |
| Class A | | | — | | | | — | | | | 5,147 | |
| Class C | | | — | | | | — | | | | 350 | |
| Class I | | | | | | | — | | | | 2,832 | |
| Payments for shares redeemed: | | | | | | | | | | | | |
| Class A | | | (855,606 | ) | | | (10,107,175 | ) | | | (13,182,684 | ) |
| Class C | | | (13,498 | ) | | | (171,481 | ) | | | (699,001 | ) |
| Class I | | | (6,069,711 | ) | | | (9,310,754 | ) | | | (8,274,474 | ) |
| Increase (decrease) in net assets from shares of beneficial interest | | | 10,592,922 | | | | (9,362,631 | ) | | | (9,438,296 | ) |
| | | | | | | | | | | | | |
| Increase (decrease) in net assets | | | 12,702,643 | | | | (7,804,121 | ) | | | (9,291,906 | ) |
| | | | | | | | | | | | | |
| Net Assets: | | | | | | | | | | | | |
| Beginning of year/period | | | 20,405,331 | | | | 28,209,452 | | | | 37,501,358 | |
| | | | | | | | | | | | | |
| End of year/period | | $ | 33,107,974 | | | $ | 20,405,331 | | | $ | 28,209,452 | |
| Accumulated net investment loss | | $ | (102,853 | ) | | $ | (102,853 | ) | | $ | 21,737 | |
| | | | | | | | | | | | | |
| Capital share activity: | | | | | | | | | | | | |
| Class A: | | | | | | | | | | | | |
| Shares Sold | | | 546 | | | | 14,767 | | | | 292,404 | |
| Shares Reinvested | | | — | | | | 1,679 | | | | 3,909 | |
| Shares Redeemed | | | (91,132 | ) | | | (1,136,016 | ) | | | (1,535,565 | ) |
| Net decrease in shares of beneficial interest outstanding | | | (90,586 | ) | | | (1,119,570 | ) | | | (1,239,252 | ) |
| Class C: | | | | | | | | | | | | |
| Shares Sold | | | 2,950 | | | | 446 | | | | 6,698 | |
| Shares Reinvested | | | — | | | | 48 | | | | — | |
| Shares Redeemed | | | (1,451 | ) | | | (19,881 | ) | | | (83,298 | ) |
| Net increase (decrease) in shares of beneficial interest outstanding | | | 1,499 | | | | (19,387 | ) | | | (76,600 | ) |
| Class I: | | | | | | | | | | | | |
| Shares Sold | | | 1,829,979 | | | | 1,090,024 | | | | 1,160,329 | |
| Shares Reinvested | | | — | | | | 12,111 | | | | 4,242 | |
| Shares Redeemed | | | (631,396 | ) | | | (1,009,516 | ) | | | (955,385 | ) |
| Net increase in shares of beneficial interest outstanding | | | 1,198,583 | | | | 92,619 | | | | 209,186 | |
(a) Represents the period from May 1, 2018 through September 30, 2018.
The accompanying notes are an integral part of these financial statements.
| EAS CROW POINT ALTERNATIVES FUND | |
| FINANCIAL HIGHLIGHTS | |
| | |
| September 30, 2018 | ANNUAL REPORT |
The following tables set forth the per share operating performance data for a share of beneficial interest outstanding, total return ratios to average net assets and other supplemental data for the year or period indicated.
| | | | | | | | | | | | | | | | | | | |
| | | | Class A | |
| | | For the | | | For the | | | For the | | | For the | | | For the | | | For the | |
| | | Period Ended | | | Year Ended | | | Year Ended | | | Year Ended | | | Year Ended | | | Year Ended | |
| | | September 30, 2018 (a) | | | April 30, 2018 | | | April 30, 2017 | | | April 30, 2016 | | | April 30, 2015 | | | April 30, 2014 | |
| | | | | | | | | | | | | | | | | | | | | | | | | |
| Net Asset Value, Beginning of Year/Period | | $ | 9.20 | | | $ | 8.64 | | | $ | 8.59 | | | $ | 9.18 | | | $ | 8.85 | | | $ | 8.80 | |
| | | | | | | | | | | | | | | | | | | | | | | | | |
| Investment Operations: | | | | | | | | | | | | | | | | | | | | | | | | |
| Net investment income (loss) (1) | | | (0.06 | ) | | | (0.11 | ) | | | (0.02 | ) | | | 0.08 | | | | 0.09 | | | | 0.04 | |
| Net realized and unrealized gain (loss) on investments | | | 0.78 | | | | 0.71 | | | | 0.09 | | | | (0.62 | ) | | | 0.33 | | | | 0.06 | |
| Total from investment operations | | | 0.72 | | | | 0.60 | | | | 0.07 | | | | (0.54 | ) | | | 0.42 | | | | 0.10 | |
| | | | | | | | | | | | | | | | | | | | | | | | | |
| Distributions: | | | | | | | | | | | | | | | | | | | | | | | | |
| From net investment income | | | — | | | | (0.04 | ) | | | (0.02 | ) | | | (0.06 | ) | | | (0.09 | ) | | | (0.05 | ) |
| Total distributions | | | — | | | | (0.04 | ) | | | (0.02 | ) | | | (0.06 | ) | | | (0.09 | ) | | | (0.05 | ) |
| | | | | | | | | | | | | | | | | | | | | | | | | |
| Paid in capital from redemption fees | | | — | | | | — | | | | 0.00 | (2) | | | 0.01 | | | | 0.00 | (2) | | | 0.00 | (2) |
| | | | | | | | | | | | | | | | | | | | | | | | | |
| Net Asset Value, End of Year/Period | | $ | 9.92 | | | $ | 9.20 | | | $ | 8.64 | | | $ | 8.59 | | | $ | 9.18 | | | $ | 8.85 | |
| | | | | | | | | | | | | | | | | | | | | | | | | |
| Total Return (3) | | | 7.83 | %(9) | | | 6.99 | %(8) | | | 0.80 | % | | | (5.75 | )% | | | 4.78 | % | | | 1.18 | % |
| | | | | | | | | | | | | | | | | | | | | | | | | |
| Ratios/Supplemental Data | | | | | | | | | | | | | | | | | | | | | | | | |
| Net assets, end of year/period (in 000’s) | | $ | 2,056 | | | $ | 2,742 | | | $ | 12,253 | | | $ | 22,830 | | | $ | 11,122 | | | $ | 11,508 | |
| | | | | | | | | | | | | | | | | | | | | | | | | |
| Ratio of gross expenses to average net assets (4) (5): | | | 3.17 | %(10) | | | 3.54 | % | | | 2.54 | % | | | 3.20 | % | | | 3.01 | % | | | 2.31 | % |
| Ratio of net expenses to average net assets (4) (6): | | | 2.11 | %(10) | | | 2.26 | % | | | 2.18 | % | | | 2.62 | % | | | 2.83 | % | | | 2.14 | % |
| | | | | | | | | | | | | | | | | | | | | | | | | |
| Ratio of net investment income (loss) to average net assets (7) | | | (1.53 | )%(10) | | | (1.27 | )% | | | (0.19 | )% | | | 0.86 | % | | | 1.02 | % | | | 0.42 | % |
| | | | | | | | | | | | | | | | | | | | | | | | | |
| Portfolio turnover rate | | | 66 | %(9) | | | 165 | % | | | 138 | % | | | 149 | % | | | 136 | % | | | 219 | % |
| (1) | Per share amounts calculated using the average shares method, which more appropriately presents the per share data for the year. |
| (2) | Resulted in less than $0.01 per share. |
| (3) | Total Return represents the rate that the investor would have earned or lost on an investment in the Fund, assuming reinvestment of dividends. Total returns shown exclude the effect of applicable sales loads/redemption fees. |
| (4) | The ratios of expenses to average net assets do not reflect the Fund’s proportionate share of expenses of underlying investment companies in which the Fund invests. |
| (5) | Includes dividends from securities sold short and interest expense. Excluding dividends from securities sold short and interest expense, the ratio of gross expenses to average net assets would have been 2.11%, 2.12%, 2.53%, 2.31%, 3.00% and 2.78% for the years ended April 30, 2014, April 30, 2015, April 30, 2016, April 30, 2017, April 30, 2018, and the period September 30, 2018, respectively. |
| (6) | Includes dividends from securities sold short and interest expense. Excluding dividends from securities sold short and interest expense, the ratio of net expenses to average net assets would have been 1.95%, 1.95%, 1.95%, 1.95%, 1.71% and 1.72% for the years ended April 30, 2014, April 30, 2015, April 30, 2016, April 30, 2017, April 30, 2018 and the period September 30, 2018, respectively. |
| (7) | Recognition of net investment income (loss) by the Fund is affected by the timing and declaration of dividends by the underlying investment companies in which the Fund invests. |
| (8) | Includes adjustments in accordance with accounting principles generally accepted in the United States of America and, consequently, the net asset value for financial reporting purposes and the returns based upon those net asset values may differ from the net asset values and returns for shareholder transactions. |
| (9) | Not annualized |
| (10) | Annualized |
| (a) | Represents the period from May 1, 2018 through September 30, 2018. |
The accompanying notes are an integral part of these financial statements.
| EAS CROW POINT ALTERNATIVES FUND | |
| FINANCIAL HIGHLIGHTS | |
| | |
| September 30, 2018 | ANNUAL REPORT |
The following tables set forth the per share operating performance data for a share of beneficial interest outstanding, total return ratios to average net assets and other supplemental data for the year or period indicated.
| | | Class C | |
| | | For the | | | For the | | | For the | | | For the | | | For the | | | For the | |
| | | Period Ended | | | Year Ended | | | Year Ended | | | Year Ended | | | Year Ended | | | Year Ended | |
| | | September 30, 2018 (a) | | | April 30, 2018 | | | April 30, 2017 | | | April 30, 2016 | | | April 30, 2015 | | | April 30, 2014 | |
| | | | | | | | | | | | | | | | | | | | | | | | | |
| Net Asset Value, Beginning of Year/Period | | $ | 8.93 | | | $ | 8.41 | | | $ | 8.41 | | | $ | 9.00 | | | $ | 8.69 | | | $ | 8.69 | |
| | | | | | | | | | | | | | | | | | | | | | | | | |
| Investment Operations: | | | | | | | | | | | | | | | | | | | | | | | | |
| Net investment income (loss) (1) | | | (0.09 | ) | | | (0.17 | ) | | | (0.07 | ) | | | 0.01 | | | | 0.02 | | | | (0.03 | ) |
| Net realized and unrealized gain (loss) on investments | | | 0.75 | | | | 0.69 | | | | 0.07 | | | | (0.57 | ) | | | 0.33 | | | | 0.06 | |
| Total from investment operations | | | 0.66 | | | | 0.52 | | | | — | | | | (0.56 | ) | | | 0.35 | | | | 0.03 | |
| | | | | | | | | | | | | | | | | | | | | | | | | |
| Distributions: | | | | | | | | | | | | | | | | | | | | | | | | |
| From net investment income | | | — | | | | 0.00 | (2) | | | — | | | | (0.03 | ) | | | (0.04 | ) | | | (0.03 | ) |
| Total distributions | | | — | | | | — | | | | — | | | | (0.03 | ) | | | (0.04 | ) | | | (0.03 | ) |
| | | | | | | | | | | | | | | | | | | | | | | | | |
| Paid in capital from redemption fees | | | — | | | | — | | | | 0.00 | (2) | | | 0.00 | (2) | | | 0.00 | (2) | | | 0.00 | (2) |
| | | | | | | | | | | | | | | | | | | | | | | | | |
| Net Asset Value, End of Year/Period | | $ | 9.59 | | | $ | 8.93 | | | $ | 8.41 | | | $ | 8.41 | | | $ | 9.00 | | | $ | 8.69 | |
| | | | | | | | | | | | | | | | | | | | | | | | | |
| Total Return (3) | | | 7.39 | %(9) | | | 6.24 | %(8) | | | 0.00 | % | | | (6.40 | )% | | | 3.99 | % | | | 0.36 | % |
| | | | | | | | | | | | | | | | | | | | | | | | | |
| Ratios/Supplemental Data | | | | | | | | | | | | | | | | | | | | | | | | |
| Net assets, end of year/period (in 000’s) | | $ | 892 | | | $ | 817 | | | $ | 932 | | | $ | 1,576 | | | $ | 2,379 | | | $ | 2,282 | |
| | | | | | | | | | | | | | | | | | | | | | | | | |
| Ratio of gross expenses to average net assets (4) (5): | | | 3.92 | %(10) | | | 4.21 | % | | | 3.31 | % | | | 4.13 | % | | | 3.76 | % | | | 3.06 | % |
| Ratio of net expenses to average net assets (4) (6): | | | 2.86 | %(10) | | | 3.02 | % | | | 2.94 | % | | | 3.44 | % | | | 3.58 | % | | | 2.89 | % |
| | | | | | | | | | | | | | | | | | | | | | | | | |
| Ratio of net investment income (loss) to average net assets (7) | | | (2.28 | )%(10) | | | (1.95 | )% | | | (0.84 | )% | | | 0.08 | % | | | 0.24 | % | | | (0.33 | )% |
| | | | | | | | | | | | | | | | | | | | | | | | | |
| Portfolio turnover rate | | | 66 | %(9) | | | 165 | % | | | 138 | % | | | 149 | % | | | 136 | % | | | 219 | % |
| (1) | Per share amounts calculated using the average shares method, which more appropriately presents the per share data for the year. |
| (2) | Resulted in less than $0.01 per share. |
| (3) | Total Return represents the rate that the investor would have earned or lost on an investment in the Fund, assuming reinvestment of dividends. Total returns shown exclude the effect of applicable sales loads/redemption fees. |
| (4) | The ratios of expenses to average net assets do not reflect the Fund’s proportionate share of expenses of underlying investment companies in which the Fund invests. |
| (5) | Includes dividends from securities sold short and interest expense. Excluding dividends from securities sold short and interest expense, the ratio of gross expenses to average net assets would have been 2.86%, 2.88%, 3.40%, 3.07%, 3.67% and 3.53% for the years ended April 30, 2014, April 30, 2015, April 30, 2016, April 30, 2017, April 30, 2018, and the period ended September 30, 2018, respectively. |
| (6) | Includes dividends from securities sold short and interest expense. Excluding dividends from securities sold short and interest expense, the ratio of net expenses to average net assets would have been 2.70%, 2.70%, 2.70%, 2.70%, 2.46% and 2.47% for the years ended April 30, 2014, April 30, 2015, April 30, 2016, April 30, 2017, April 30, 2018 and the period ended September 30, 2018, respectively. |
| (7) | Recognition of net investment income (loss) by the Fund is affected by the timing and declaration of dividends by the underlying investment companies in which the Fund invests. |
| (8) | Includes adjustments in accordance with accounting principles generally accepted in the United States of America and, consequently, the net asset value for financial reporting purposes and the returns based upon those net asset values may differ from the net asset values and returns for shareholder transactions. |
| (9) | Not annualized |
| (10) | Annualized |
| | |
| (a) | Represents the period from May 1, 2018 through September 30, 2018. |
The accompanying notes are an integral part of these financial statements.
| EAS CROW POINT ALTERNATIVES FUND | |
| FINANCIAL HIGHLIGHTS | |
| | |
| September 30, 2018 | ANNUAL REPORT |
The following tables set forth the per share operating performance data for a share of beneficial interest outstanding, total return ratios to average net assets and other supplemental data for the year or period indicated.
| | | Class I | |
| | | For the | | | For the | | | For the | | | For the | | | For the | | | For the | |
| | | Period Ended | | | Year Ended | | | Year Ended | | | Year Ended | | | Year Ended | | | Year Ended | |
| | | September 30, 2018 (a) | | | April 30, 2018 | | | April 30, 2017 | | | April 30, 2016 | | | April 30, 2015 | | | April 30, 2014 | |
| | | | | | | | | | | | | | | | | | | | | | | | | |
| Net Asset Value, Beginning of Year/Period | | $ | 9.28 | | | $ | 8.72 | | | $ | 8.65 | | | $ | 9.24 | | | $ | 8.90 | | | $ | 8.84 | |
| | | | | | | | | | | | | | | | | | | | | | | | | |
| Investment Operations: | | | | | | | | | | | | | | | | | | | | | | | | |
| Net investment income (loss) (1) | | | (0.05 | ) | | | (0.08 | ) | | | 0.01 | | | | 0.10 | | | | 0.12 | | | | 0.06 | |
| Net realized and unrealized gain (loss) on investments | | | 0.77 | | | | 0.71 | | | | 0.10 | | | | (0.61 | ) | | | 0.33 | | | | 0.07 | |
| Total from investment operations | | | 0.72 | | | | 0.63 | | | | 0.11 | | | | (0.51 | ) | | | 0.45 | | | | 0.13 | |
| | | | | | | | | | | | | | | | | | | | | | | | | |
| Distributions: | | | | | | | | | | | | | | | | | | | | | | | | |
| From net investment income | | | — | | | | (0.07 | ) | | | (0.04 | ) | | | (0.08 | ) | | | (0.11 | ) | | | (0.07 | ) |
| Total distributions | | | — | | | | (0.07 | ) | | | (0.04 | ) | | | (0.08 | ) | | | (0.11 | ) | | | (0.07 | ) |
| | | | | | | | | | | | | | | | | | | | | | | | | |
| Paid in capital from redemption fees | | | — | | | | — | | | | 0.00 | (2) | | | 0.00 | (2) | | | 0.00 | (2) | | | 0.00 | (2) |
| | | | | | | | | | | | | | | | | | | | | | | | | |
| Net Asset Value, End of Year/Period | | $ | 10.00 | | | $ | 9.28 | | | $ | 8.72 | | | $ | 8.65 | | | $ | 9.24 | | | $ | 8.90 | |
| | | | | | | | | | | | | | | | | | | | | | | | | |
| Total Return (3) | | | 7.76 | %(9) | | | 7.20 | %(8) | | | 1.25 | % | | | (5.50 | )% | | | 5.13 | % | | | 1.43 | % |
| | | | | | | | | | | | | | | | | | | | | | | | | |
| Ratios/Supplemental Data | | | | | | | | | | | | | | | | | | | | | | | | |
| Net assets, end of year/period (in 000’s) | | $ | 30,160 | | | $ | 16,846 | | | $ | 15,024 | | | $ | 13,095 | | | $ | 18,089 | | | $ | 22,063 | |
| | | | | | | | | | | | | | | | | | | | | | | | | |
| Ratio of gross expenses to average net assets (4) (5) | | | 2.92 | %(10) | | | 3.19 | % | | | 2.32 | % | | | 3.13 | % | | | 2.75 | % | | | 2.06 | % |
| Ratio of net expenses to average net assets (4) (6): | | | 1.86 | %(10) | | | 2.02 | % | | | 1.97 | % | | | 2.44 | % | | | 2.58 | % | | | 1.89 | % |
| | | | | | | | | | | | | | | | | | | | | | | | | |
| Ratio of net investment income (loss) to average net assets (7) | | | (1.28 | )%(10) | | | (0.91 | )% | | | 0.07 | % | | | 1.07 | % | | | 1.28 | % | | | 0.67 | % |
| | | | | | | | | | | | | | | | | | | | | | | | | |
| Portfolio turnover rate | | | 66 | %(9) | | | 165 | % | | | 138 | % | | | 149 | % | | | 136 | % | | | 219 | % |
| (1) | Per share amounts calculated using the average shares method, which more appropriately presents the per share data for the year. |
| (2) | Resulted in less than $0.01 per share. |
| (3) | Total Return represents the rate that the investor would have earned or lost on an investment in the Fund, assuming reinvestment of dividends. Total returns shown exclude the effect of applicable sales loads/redemption fees. |
| (4) | The ratios of expenses to average net assets do not reflect the Fund’s proportionate share of expenses of underlying investment companies in which the Fund invests. |
| (5) | Includes dividends from securities sold short and interest expense. Excluding dividends from securities sold short and interest expense, the ratio of gross expenses to average net assets would have been 1.86%, 1.87%, 2.39%, 2.04%, 2.65%, and 2.53% for the years ended April 30, 2014, April 30, 2015, April 30, 2016, April 30, 2017, April 30, 2018 and the period ended September 30, 2018, respectively. |
| (6) | Includes dividends from securities sold short and interest expense. Excluding dividends from securities sold short and interest expense, the ratio of net expenses to average net assets would have been 1.70%, 1.70%, 1.70%, 1.70%, 1.46% and 1.47% for the years ended April 30, 2014, April 30, 2015, April 30, 2016, April 30, 2017, April 30, 2018 and the period ended September 30, 2018, respectively. |
| (7) | Recognition of net investment income (loss) by the Fund is affected by the timing and declaration of dividends by the underlying investment companies in which the Fund invests. |
| (8) | Includes adjustments in accordance with accounting principles generally accepted in the United States of America and, consequently, the net asset value for financial reporting purposes and the returns based upon those net asset values may differ from the net asset values and returns for shareholder transactions. |
| (9) | Not annualized |
| (10) | Annualized |
| (a) | Represents the period from May 1, 2018 through |
The accompanying notes are an integral part of these financial statements.
| CROW POINT GLOBAL TACTICAL ALLOCATION FUND | | |
| STATEMENT OF ASSETS AND LIABILITIES | | |
| | | |
| September 30, 2018 | | ANNUAL REPORT |
| Assets: | | | |
| Investment securities: | | | | |
| Unaffiliated securities at cost | | $ | 14,926,931 | |
| Affiliated securities at cost | | | 1,734,783 | |
| Total securities at cost | | $ | 16,661,714 | |
| Unaffiliated securities at value | | | 15,758,159 | |
| Affiliated securities at value | | | 1,677,676 | |
| Deposits at broker | | | 997,762 | |
| Due from adviser | | | 24,497 | |
| Receivables: | | | | |
| Interest | | | 5,353 | |
| Dividends | | | 19,012 | |
| Tax reclaims | | | 9,100 | |
| Investment securities sold | | | 258,841 | |
| Prepaid expenses and other assets | | | 42,613 | |
| Total assets | | | 18,793,013 | |
| | | | | |
| Liabilities: | | | | |
| Securities sold short and options written: | | | | |
| Proceeds from securities sold short | | | 609,673 | |
| Proceeds from options written | | | 50,389 | |
| Total proceeds from securities sold short and options written | | | 660,062 | |
| Securities sold short at value | | | 585,974 | |
| Options written at value | | | 33,339 | |
| Total securities sold short and options written at value | | | 619,313 | |
| Payables: | | | | |
| Due to administrator | | | 9,969 | |
| Accrued expenses | | | 2,821 | |
| Total liabilities | | | 632,103 | |
| Net Assets | | $ | 18,160,910 | |
| | | | | |
| Sources of Net Assets: | | | | |
| Paid-in capital | | $ | 18,132,614 | |
| Total distributable earnings | | | 28,296 | |
| Total Net Assets | | $ | 18,160,910 | |
| | | | | |
| Investor Class Shares: | | | | |
| Net assets | | $ | 1,733,076 | |
| Shares Outstanding ($0 par value, Unlimited shares of beneficial interest authorized) | | | 188,770 | |
| Net Asset Value, Offering and Redemption Price Per Share | | $ | 9.18 | |
| | | | | |
| Institutional Class Shares: | | | | |
| Net assets | | $ | 16,427,834 | |
| Shares Outstanding ($0 par value, Unlimited shares of beneficial interest authorized) | | | 1,770,617 | |
| Net Asset Value, Offering and Redemption Price Per Share | | $ | 9.28 | |
The accompanying notes are an integral part of these financial statements.
| CROW POINT GLOBAL TACTICAL ALLOCATION FUND | |
| STATEMENTS OF OPERATIONS | |
| | |
| September 30, 2018 | ANNUAL REPORT |
| | | For the | | | For the | |
| | | Period Ended | | | Year Ended | |
| | | September 30, 2018 (a) | | | May 31, 2018 | |
| Investment income: | | | | | | | | |
| Dividends (net of foreign withholding taxes of $0 and $2,773, respectively) | | $ | 105,771 | | | $ | 264,785 | |
| Interest | | | 9,683 | | | | 10,486 | |
| Total investment income | | | 115,454 | | | | 275,271 | |
| | | | | | | | | |
| Expenses: | | | | | | | | |
| Management fees (Note 7) | | | 50,095 | | | | 99,433 | |
| Distribution (12b-1) fees - Class A | | | 1,623 | | | | 9,782 | |
| Prior administrator fees | | | — | | | | 79,705 | |
| Professional fees | | | 27,548 | | | | 36,557 | |
| Accounting and transfer agent fees and expenses | | | 35,311 | | | | 68,785 | |
| Registration and filing fees | | | 10,851 | | | | 34,436 | |
| Miscellaneous | | | 5,028 | | | | 7,188 | |
| Custodian fees | | | 3,550 | | | | 20,930 | |
| Reports to shareholders | | | — | | | | 3,384 | |
| Dividend expense | | | 6,076 | | | | 12,455 | |
| Trustee fees and expenses | | | 4,360 | | | | 16,155 | |
| Dealer network fees | | | — | | | | 4,529 | |
| Compliance officer fees | | | 5,000 | | | | 9,428 | |
| Pricing fees | | | 2,507 | | | | 5,014 | |
| Interest expense | | | 2,204 | | | | 1,414 | |
| Insurance | | | 820 | | | | 1,212 | |
| Total expenses | | | 154,973 | | | | 410,407 | |
| Less expense reimbursement: | | | | | | | | |
| Fees waived/reimbursed by Adviser | | | (79,439 | ) | | | (233,525 | ) |
| Fees waived by Adviser for affiliated holdings | | | (4,383 | ) | | | (1,084 | ) |
| Fees waived by Administrator | | | (8,750 | ) | | | (39,934 | ) |
| Net expenses | | | 62,401 | | | | 135,864 | |
| | | | | | | | | |
| Net investment income | | | 53,053 | | | | 139,407 | |
| | | | | | | | | |
| Realized and unrealized gain (loss): | | | | | | | | |
| Net realized gain (loss) on: | | | | | | | | |
| Unaffiliated investments | | | 191,469 | | | | 1,038,237 | |
| Affiliated Investments | | | (65,217 | ) | | | — | |
| Foreign currency transactions | | | 1,107 | | | | (8,832 | ) |
| Options written | | | 1,701 | | | | 70,527 | |
| Securities sold short | | | 31,577 | | | | (37,835 | ) |
| Net realized gain on investments, options written, securities sold short and foreign currency transactions | | | 160,637 | | | | 1,062,097 | |
| | | | | | | | | |
| Net change in unrealized appreciation (depreciation) on: | | | | | | | | |
| Unaffiliated investments | | | 476,615 | | | | (270,095 | ) |
| Affiliated investments | | | (18,949 | ) | | | (38,158 | ) |
| Securities sold short | | | 7,623 | | | | 16,076 | |
| Foreign currency translations | | | (64 | ) | | | 310 | |
| Options written | | | 18,904 | | | | (21,717 | ) |
| Net change in unrealized appreciation (depreciation) on investments, options written, securities sold short and foreign currency translations | | | 484,129 | | | | (313,584 | ) |
| | | | | | | | | |
| Net gain on investments, options written, securities sold short and foreign currency | | | 644,766 | | | | 748,513 | |
| | | | | | | | | |
| Net increase in net assets resulting from operations | | $ | 697,819 | | | $ | 887,920 | |
(a) Represents the period from June 1, 2018 through September 30, 2018
The accompanying notes are an integral part of these financial statements.
| CROW POINT GLOBAL TACTICAL ALLOCATION FUND |
| STATEMENTS OF CHANGES IN NET ASSETS | |
| | | | | | | |
| September 30, 2018 | ANNUAL REPORT |
| | | For the
Period Ended
September 30,
2018 (a) | | For the
Year Ended
May 31,
2018 | | For the
Year Ended
May 31,
2017 |
| | | | | | | |
| Increase (decrease) in net assets from: | | | | | | | | | | | | |
| Operations: | | | | | | | | | | | | |
| Net investment income | | $ | 53,053 | | | $ | 139,407 | | | $ | 322,162 | |
| Net realized gain (loss) on investments, options written, securities sold short and foreign currency transactions | | | 160,637 | | | | 1,062,097 | | | | (619,755 | ) |
| Net change in unrealized appreciation (depreciation) on investments, options written, securities sold short and foreign currency translations | | | 484,129 | | | | (313,584 | ) | | | 709,052 | |
| Net increase in net assets resulting from operations | | | 697,819 | | | | 887,920 | | | | 411,459 | |
| | | | | | | | | | | | | |
| Distributions to shareholders from: | | | | | | | | | | | | |
| Net investment income - Investor Class | | | — | | | | (43,883 | ) | | | (165,495 | ) |
| Net investment income - Institutional Class | | | — | | | | (74,894 | ) | | | (32,061 | ) |
| Net realized capital gains - Investor Class | | | — | | | | — | | | | (62,569 | ) |
| Net realized capital gains - Institutional Class | | | — | | | | — | | | | (47,645 | ) |
| Total distributions | | | — | | | | (118,777 | ) | | | (307,770 | ) |
| | | | | | | | | | | | | |
| Transactions in shares of beneficial interest: | | | | | | | | | | | | |
| Proceeds from shares sold: | | | | | | | | | | | | |
| Investor Class | | | 100 | | | | 1,040,198 | | | | 1,069,978 | |
| Institutional Class | | | 6,289,883 | | | | 15,313,850 | | | | 3,149,723 | |
| Net asset value of shares issued in reinvestment of distributions: | | | | | | | | | | | | |
| Investor Class | | | — | | | | 41,930 | | | | 216,493 | |
| Institutional Class | | | — | | | | 46,699 | | | | 15,918 | |
| Redemption fee proceeds: | | | | | | | | | | | | |
| Investor Class | | | — | | | | 1,773 | | | | 3,398 | |
| Institutional Class | | | 302 | | | | 3,348 | | | | 1,015 | |
| Payments for shares redeemed: | | | | | | | | | | | | |
| Investor Class | | | (764,684 | ) | | | (3,407,587 | ) | | | (8,056,858 | ) |
| Institutional Class | | | (413,683 | ) | | | (9,490,978 | ) | | | (709,061 | ) |
| Increase (decrease) in net assets from transactions in shares of beneficial interest | | | 5,111,918 | | | | 3,549,233 | | | | (4,309,394 | ) |
| | | | | | | | | | | | | |
| Increase (decrease) in net assets | | | 5,809,737 | | | | 4,318,376 | | | | (4,205,705 | ) |
| | | | | | | | | | | | | |
| Net Assets: | | | | | | | | | | | | |
| Beginning of year/period | | | 12,351,173 | | | | 8,032,797 | | | | 12,238,502 | |
| | | | | | | | | | | | | |
| End of year/period | | $ | 18,160,910 | | | $ | 12,351,173 | | | $ | 8,032,797 | |
| Undistributed (accumulated) net investment income (loss) | | $ | 73,120 | | | $ | 14,935 | | | $ | (1,518 | ) |
| | | | | | | | | | | | | |
| Share activity: | | | | | | | | | | | | |
| Investor Class: | | | | | | | | | | | | |
| Shares sold | | | 11 | | | | 121,704 | | | | 130,848 | |
| Shares reinvested | | | — | | | | 4,844 | | | | 26,362 | |
| Shares redeemed | | | (86,513 | ) | | | (385,679 | ) | | | (981,017 | ) |
| Net decrease in shares of beneficial interest | | | (86,502 | ) | | | (259,131 | ) | | | (823,807 | ) |
| | | | | | | | | | | | | |
| Institutional Class: | | | | | | | | | | | | |
| Shares sold | | | 700,675 | | | | 1,734,305 | | | | 376,577 | |
| Shares reinvested | | | — | | | | 5,281 | | | | 1,920 | |
| Shares redeemed | | | (46,255 | ) | | | (1,050,506 | ) | | | (85,255 | ) |
| Net increase in shares of beneficial interest | | | 654,420 | | | | 689,080 | | | | 293,242 | |
(a) Represents the period from June 1, 2018 through September 30, 2018
The accompanying notes are an integral part of these financial statements.
| CROW POINT GLOBAL TACTICAL ALLOCATION FUND | |
| FINANCIAL HIGHLIGHTS | | |
| | | | | | | | | | | | | | | | |
| September 30, 2018 | ANNUAL REPORT |
| | | | | | | | | | | | | | | | |
| The following tables set forth the per share operating performance data for a share of beneficial interest outstanding, total return ratios to average net assets and other supplemental data for each of the years or period indicated. |
| | | Investor Class |
| | | For the
Period Ended
September 30, 2018 (a) | | | For the
Year Ended
May 31, 2018 | | | For the
Year Ended
May 31, 2017 | | | For the
Year Ended
May 31, 2016 | | | For the
Year Ended
May 31, 2015 | | | For the
Year Ended
May 31, 2014 | |
| | | | | | | | | | | | | | | | | | | | | | | | | |
| Net Asset Value, Beginning of Year/Period | | $ | 8.81 | | | $ | 8.33 | | | $ | 8.20 | | | $ | 9.81 | | | $ | 10.35 | | | $ | 10.16 | |
| | | | | | | | | | | | | | | | | | | | | | | | | |
| Investment Operations: | | | | | | | | | | | | | | | | | | | | | | | | |
| Net investment income (1) | | | 0.02 | | | | 0.12 | | | | 0.32 | | | | 0.39 | | | | 0.53 | | | | 0.43 | |
| Net realized and unrealized gain (loss) on investments | | | 0.35 | | | | 0.45 | | | | 0.13 | | | | (1.18 | ) | | | (0.56 | ) | | | 0.20 | |
| Total from investment operations | | | 0.37 | | | | 0.57 | | | | 0.45 | | | | (0.79 | ) | | | (0.03 | ) | | | 0.63 | |
| | | | | | | | | | | | | | | | | | | | | | | | | |
| Distributions: | | | | | | | | | | | | | | | | | | | | | | | | |
| From net investment income | | | — | | | | (0.09 | ) | | | (0.21 | ) | | | (0.27 | ) | | | (0.48 | ) | | | (0.44 | ) |
| From net realized capital gains | | | — | | | | — | | | | — | | | | — | | | | — | | | | 0.00 | (2) |
| From return of capital | | | — | | | | — | | | | (0.11 | ) | | | (0.57 | ) | | | (0.03 | ) | | | — | |
| Total distributions | | | — | | | | (0.09 | ) | | | (0.32 | ) | | | (0.84 | ) | | | (0.51 | ) | | | (0.44 | ) |
| | | | | | | | | | | | | | | | | | | | | | | | | |
| Paid in capital from redemption fees | | | 0.00 | (2) | | | — | | | | 0.00 | (2) | | | 0.02 | | | | 0.00 | (2) | | | 0.00 | (2) |
| | | | | | | | | | | | | | | | | | | | | | | | | |
| Net Asset Value, End of Year/Period | | $ | 9.18 | | | $ | 8.81 | | | $ | 8.33 | | | $ | 8.20 | | | $ | 9.81 | | | $ | 10.35 | |
| | | | | | | | | | | | | | | | | | | | | | | | | |
| Total Return (3) | | | 4.20 | %(9) | | | 6.86 | % | | | 5.57 | %(8) | | | (7.84 | )% | | | (0.24 | )% | | | 6.42 | % |
| | | | | | | | | | | | | | | | | | | | | | | | | |
| Ratios/Supplemental Data | | | | | | | | | | | | | | | | | | | | | | | | |
| Net assets, end of year/period (in 000’s) | | $ | 1,733 | | | $ | 2,425 | | | $ | 4,450 | | | $ | 11,133 | | | $ | 3,839 | | | $ | 7,937 | |
| | | | | | | | | | | | | | | | | | | | | | | | | |
| Ratios of expenses to average net assets: | | | | | | | | | | | | | | | | | | | | | | | | |
| Before fees waived and expenses reimbursed (4) (11) | | | 2.94 | %(5)(10) | | | 3.77 | %(5) | | | 3.68 | % | | | 4.14 | %(5) | | | 3.21 | % | | | 3.68 | % |
| After fees waived and expenses reimbursed (11) | | | 1.32 | %(7)(10) | | | 1.32 | %(7) | | | 1.26 | % | | | 1.29 | %(7) | | | 1.25 | %(6) | | | 1.13 | %(6) |
| | | | | | | | | | | | | | | | | | | | | | | | | |
| Ratios of net investment income to average net assets (11) (12) | | | 0.71 | %(10) | | | 1.38 | % | | | 3.92 | % | | | 4.53 | % | | | 5.30 | % | | | 4.18 | % |
| | | | | | | | | | | | | | | | | | | | | | | | | |
| Portfolio turnover rate | | | 73 | %(9) | | | 324 | % | | | 101 | % | | | 160 | % | | | 113 | % | | | 95 | % |
| (1) | Per share amounts calculated using the average shares method, which more appropriately presents the per share data for the period. |
| (2) | Amount represents less than $0.01 per share. |
| (3) | Total Return represents the rate that the investor would have earned or lost on an investment in the Fund, assuming reinvestment of dividends, if any. |
| (4) | Represents the ratio of expenses to average net assets absent fee waivers and/or expense reimbursements by the Adviser. |
| (5) | Includes dividends from securities sold short and interest expense. Excluding dividends from securities sold short and interest expense, the ratio of gross expenses to average net assets would have been 4.10%, 3.67% and 2.79% for the years ended May 31, 2016, May 31, 2018 and the period ended September 30, 2018, respectively. |
| (6) | Includes commission recapture. Excluding commission recapture, the ratio of net expenses to average net assets would have been 1.25% for the year ended May 31, 2014, and 1.30% for the year ended May 31, 2015. |
| (7) | Includes dividends from securities sold short and interest expense. Excluding dividends from securities sold short and interest expense, the ratio of net expenses to average net assets would have been 1.25%, 1.22% and 1.17% for the years ended May 31, 2016, May 31, 2018 and the period ended September 30, 2018, respectively. |
| (8) | As a result of a trade error, the Crow Point Global Tactical Allocation Fund experienced a loss of $10,469 for the year ended May 31, 2017, which was reimbursed by the Adviser. There was no effect on total return due to the trade error. |
| (11) | The ratios of expenses and net investment income to average net assets do not reflect the Fund’s proportionate share of expenses of underlying investment companies in which the Fund invests. |
| (12) | Recognition of net investment income by the Fund is affected by the timing and declaration of dividends by the underlying investment companies in which the Fund invests. |
| (a) | Represents the period from June 1, 2018 through September 30, 2018 |
The accompanying notes are an integral part of these financial statements.
| CROW POINT GLOBAL TACTICAL ALLOCATION FUND |
| FINANCIAL HIGHLIGHTS | |
| | | | | | | | | | | | | | | | |
| September 30, 2018 | | | ANNUAL REPORT |
| | | | | | | | | | | | | | | | |
| The following tables set forth the per share operating performance data for a share of beneficial interest outstanding, total return ratios to average net assets and other supplemental data for each of the years or period indicated. |
| | | Institutional Class |
| | | | For the
Period Ended
September 30, 2018 (a) | | | | | For the
Year Ended
May 31, 2018 | | | | For the
Year Ended
May 31, 2017 | | | | For the
Year Ended
May 31, 2016 | | | | For the
Year Ended
May 31, 2015 | | | | For the
Year Ended
May 31, 2014 | |
| | | | | | | | | | | | | | | | | | | | | | | | | | |
| | | | | | | | | | | | | | | | | | | | | | | | | | |
| Net Asset Value, Beginning of Year/Period | | $ | 8.89 | | | | $ | 8.39 | | | $ | 8.26 | | | $ | 9.90 | | | $ | 10.44 | | | $ | 10.17 | |
| | | | | | | | | | | | | | | | | | | | | | | | | | |
| Investment Operations: | | | | | | | | | | | | | | | | | | | | | | | | | |
| Net investment income (1) | | | 0.03 | | | | | 0.10 | | | | 0.36 | | | | 0.38 | | | | 0.56 | | | | 0.46 | |
| Net realized and unrealized gain (loss) on investments | | | 0.36 | | | | | 0.49 | | | | 0.11 | | | | (1.14 | ) | | | (0.56 | ) | | | 0.20 | |
| Total from investment operations | | | 0.39 | | | | | 0.59 | | | | 0.47 | | | | (0.76 | ) | | | — | | | | 0.66 | |
| | | | | | | | | | | | | | | | | | | | | | | | | | |
| Distributions: | | | | | | | | | | | | | | | | | | | | | | | | | |
| From net investment income | | | — | | | | | (0.10 | ) | | | (0.22 | ) | | | (0.29 | ) | | | (0.52 | ) | | | (0.39 | ) |
| From net realized capital gains | | | — | | | | | — | | | | — | | | | — | | | | — | | | | 0.00 | (2) |
| From return of capital | | | — | | | | | — | | | | (0.12 | ) | | | (0.59 | ) | | | (0.02 | ) | | | — | |
| Total distributions | | | — | | | | | (0.10 | ) | | | (0.34 | ) | | | (0.88 | ) | | | (0.54 | ) | | | (0.39 | ) |
| | | | | | | | | | | | | | | | | | | | | | | | | | |
| Paid in capital from redemption fees | | | 0.00 | (2) | | | | 0.01 | | | | 0.00 | (2) | | | 0.00 | (2) | | | 0.00 | (2) | | | 0.00 | (2) |
| | | | | | | | | | | | | | | | | | | | | | | | | | |
| Net Asset Value, End of Year/Period | | $ | 9.28 | | | | $ | 8.89 | | | $ | 8.39 | | | $ | 8.26 | | | $ | 9.90 | | | $ | 10.44 | |
| | | | | | | | | | | | | | | | | | | | | | | | | | |
| Total Return (3) | | | 4.39 | %(9) | | | | 7.22 | % | | | 5.82 | %(8) | | | (7.61 | )% | | | 0.06 | % | | | 6.65 | % |
| | | | | | | | | | | | | | | | | | | | | | | | | | |
| Ratios/Supplemental Data | | | | | | | | | | | | | | | | | | | | | | | | | |
| Net assets, end of year/period (in 000’s) | | $ | 16,428 | | | | $ | 9,926 | | | $ | 3,583 | | | $ | 1,105 | | | $ | 6,223 | | | $ | 2,531 | |
| | | | | | | | | | | | | | | | | | | | | | | | | | |
| Ratios of expenses to average net assets: | | | | | | | | | | | | | | | | | | | | | | | | | |
| Before fees waived and expenses reimbursed (4) (11) | | | 2.69 | %(5) (10) | | | | 3.55 | %(5) | | | 3.75 | % | | | 4.88 | %(5) | | | 2.95 | % | | | 3.38 | % |
| After fees waived and expenses reimbursed (11) | | | 1.07 | %(7) (10) | | | | 1.14 | %(7) | | | 1.05 | % | | | 1.04 | %(7) | | | 1.00 | %(6) | | | 0.88 | %(6) |
| | | | | | | | | | | | | | | | | | | | | | | | | | |
| Ratios of net investment income to average net assets (11) (12) | | | 0.96 | %(10) | | | | 1.16 | % | | | 4.36 | % | | | 4.19 | % | | | 5.55 | % | | | 4.50 | % |
| | | | | | | | | | | | | | | | | | | | | | | | | | |
| Portfolio turnover rate | | | 73 | %(i) | | | | 324 | % | | | 101 | % | | | 160 | % | | | 113 | % | | | 95 | % |
| (1) | Per share amounts calculated using the average shares method, which more appropriately presents the per share data for the period. |
| (2) | Amount represents less than $0.01 per share. |
| (3) | Total Return represents the rate that the investor would have earned or lost on an investment in the Fund, assuming reinvestment of dividends. |
| (4) | Represents the ratio of expenses to average net assets absent fee waivers and/or expense reimbursements by the Adviser. |
| (5) | Includes dividends from securities sold short and interest expense. Excluding dividends from securities sold short and interest expense, the ratio of gross expenses to average net assets would have been 4.84%, 3.41% and 2.54% for the years ended May 31, 2016, May 31, 2018 and the period ended September 30, 2018, respectively. |
| (6) | Includes commission recapture. Excluding commission recapture, the ratio of net expenses to average net assets would have been 1.00% for the year ended May 31, 2014 and 1.04% for the year ended May 31, 2015. |
| (7) | Includes dividends from securities sold short and interest expense. Excluding dividends from securities sold short and interest expense, the ratio of net expenses to average net assets would have been 1.00%, 1.00% and 0.92% for the years ended May 31, 2016, May 31, 2018 and the period ended September 30, 2018, respectively. |
| (8) | As a result of a trade error, the Crow Point Global Tactical Allocation Fund experienced a loss of $10,469 for the year ended May 31, 2017, which was reimbursed by the Adviser. There was no effect on total return due to the trade error. |
| (11) | The ratios of expenses and net investment income to average net assets do not reflect the Fund’s proportionate share of expenses of underlying investment companies in which the Fund invests. |
| (12) | Recognition of net investment income by the Fund is affected by the timing and declaration of dividends by the underlying investment companies in which the Fund invests. |
| (a) | Represents the period from June 1, 2018 through September 30, 2018 |
The accompanying notes are an integral part of these financial statements.
| CROW POINT ALTERNATIVE INCOME FUND |
| STATEMENT OF ASSETS AND LIABILITIES |
| | | |
| September 30, 2018 | ANNUAL REPORT |
| Assets: | | |
| Investment securities: | | | | |
| Unaffiliated Securities at Cost | | $ | 8,377,549 | |
| Affiliated Securities at Cost | | | 500,000 | |
| Total Securities at Cost | | | 8,877,549 | |
| Unaffiliated Securities at Value | | | 8,444,701 | |
| Affiliated Securities at Value | | | 503,500 | |
| Deposits at broker | | | 1,585,527 | |
| Due from adviser | | | 14,167 | |
| Receivables: | | | | |
| Interest | | | 1,273 | |
| Dividends | | | 10,592 | |
| Investment securities sold | | | 198,924 | |
| Prepaid expenses and other assets | | | 32,353 | |
| Total assets | | | 10,791,037 | |
| | | | | |
| Liabilities: | | | | |
| Securities sold short and options written: | | | | |
| Proceeds from securities sold short | | | 88,410 | |
| Proceeds from options written | | | 11,240 | |
| Total proceeds from securities sold short and options written | | | 99,650 | |
| Securities sold short at value | | | 79,431 | |
| Options written at value | | | 6,250 | |
| Total securities sold short and options written at value | | | 85,681 | |
| Payables: | | | | |
| Investment securities purchased | | | 705,469 | |
| Accrued distribution (12b-1) fees | | | 5,268 | |
| Due to administrator | | | 7,574 | |
| Accrued expenses | | | 4,290 | |
| Total liabilities | | | 808,282 | |
| Net Assets | | $ | 9,982,755 | |
| | | | | |
| Sources of Net Assets: | | | | |
| Paid-in capital | | $ | 11,422,045 | |
| Total distributable earnings | | | (1,439,290 | ) |
| Total Net Assets (Unlimited shares of beneficial interest authorized) | | $ | 9,982,755 | |
| | | | | |
| Investor Class Shares: | | | | |
| Net assets | | $ | 9,982,755 | |
| Shares Outstanding ($0 par value, Unlimited shares of beneficial interest authorized) | | | 1,183,024 | |
| Net Asset Value, Offering and Redemption Price Per Share | | $ | 8.44 | |
The accompanying notes are an integral part of these financial statements.
| CROW POINT ALTERNATIVE INCOME FUND |
| STATEMENT OF OPERATIONS |
| | | |
| September 30, 2018 | ANNUAL REPORT |
| | | For the
Year Ended
September 30, 2018 |
| | | |
| Investment income: | | | | |
| Dividends (net of foreign withholding taxes of $0) | | $ | 221,383 | |
| Interest | | | 47,228 | |
| Total investment income | | | 268,611 | |
| | | | | |
| Expenses: | | | | |
| Management fees (Note 7) | | | 113,068 | |
| Distribution (12b-1) fees - Investor Class | | | 28,267 | |
| Accounting and transfer agent fees and expenses | | | 80,686 | |
| Professional fees | | | 53,459 | |
| Registration and filing fees | | | 28,852 | |
| Trustee fees and expenses | | | 15,617 | |
| Pricing fees | | | 13,371 | |
| Miscellaneous | | | 9,158 | |
| Custodian fees | | | 9,341 | |
| Dealer network fees | | | 9,113 | |
| Compliance officer fees | | | 15,000 | |
| Dividend expense | | | 1,402 | |
| Insurance | | | 296 | |
| Total expenses | | | 377,630 | |
| Less expense reimbursement: | | | | |
| Fees waived by Adviser | | | (80,949 | ) |
| Fees waived by Adviser for affiliated holdings | | | (754 | ) |
| Fees waived by administrator | | | (40,833 | ) |
| Net expenses | | | 255,094 | |
| | | | | |
| Net investment income | | | 13,517 | |
| | | | | |
| Realized and unrealized gain (loss): | | | | |
| Net realized gain on: | | | | |
| Unaffiliated investments | | | 332,438 | |
| Securities sold short | | | (36,163 | ) |
| Options written | | | 32,875 | |
| Net realized gain on investments, options written and securities sold short | | | 329,150 | |
| | | | | |
| Net change in unrealized appreciation (depreciation) on: | | | | |
| Unaffiliated investments | | | (45,048 | ) |
| Affiliated Investments | | | 3,500 | |
| Securities sold short | | | 8,979 | |
| Options written | | | 4,990 | |
| securities sold short | | | (27,579 | ) |
| | | | | |
| Net gain on investments, options written and securities sold short | | | 301,571 | |
| | | | | |
| Net increase in net assets resulting from operations | | $ | 315,088 | |
The accompanying notes are an integral part of these financial statements.
| CROW POINT ALTERNATIVE INCOME FUND |
| STATEMENTS OF CHANGES IN NET ASSETS |
| | | | | |
| September 30, 2018 | ANNUAL REPORT |
| | | For the
Year Ended
September 30, 2018 | | For the
Year Ended
September 30, 2017 |
| | | | | |
| Increase (decrease) in net assets from: | | | | | | | | |
| Operations: | | | | | | | | |
| Net investment income | | $ | 13,517 | | | $ | 50,332 | |
| Net realized gain (loss) on investments, options written and securities sold short | | | 329,150 | | | | (8,786 | ) |
| Distributions of capital gains from underlying investments | | | — | | | | 2,206 | |
| Net unrealized depreciation on investments, options written and securities sold short | | | (27,579 | ) | | | (11,264 | ) |
| Net increase in net assets resulting from operations | | | 315,088 | | | | 32,488 | |
| | | | | | | | | |
| Distributions to shareholders from: | | | | | | | | |
| Net investment income - Investor Class | | | (18,527 | ) | | | (139,442 | ) |
| Total distributions | | | (18,527 | ) | | | (139,442 | ) |
| | | | | | | | | |
| Capital share transactions: | | | | | | | | |
| Proceeds from shares sold: | | | | | | | | |
| Investor Class | | | 14,624,493 | | | | 2,577,764 | |
| Net asset value of shares issued in reinvestment of distributions: | | | | | | | | |
| Investor Class | | | 12,755 | | | | 26,378 | |
| Payments for shares redeemed: | | | | | | | | |
| Investor Class | | | (12,799,380 | ) | | | (1,340,102 | ) |
| Increase in net assets from capital share transactions | | | 1,837,868 | | | | 1,264,040 | |
| | | | | | | | | |
| Increase in net assets | | | 2,134,429 | | | | 1,157,086 | |
| | | | | | | | | |
| Net Assets: | | | | | | | | |
| Beginning of year | | | 7,848,326 | | | | 6,691,240 | |
| | | | | | | | | |
| End of year | | $ | 9,982,755 | | | $ | 7,848,326 | |
| Accumulated net investment loss | | $ | (13,991 | ) | | $ | (15,708 | ) |
| | | | | | | | | |
| Share activity: | | | | | | | | |
| Investor Class: | | | | | | | | |
| Shares sold | | | 1,746,456 | | | | 313,485 | |
| Shares reinvested | | | 1,509 | | | | 3,209 | |
| Shares redeemed | | | (1,511,960 | ) | | | (162,386 | ) |
| Net increase in shares of beneficial interest | | | 236,005 | | | | 154,308 | |
The accompanying notes are an integral part of these financial statements.
| CROW POINT ALTERNATIVE INCOME FUND |
| FINANCIAL HIGHLIGHTS |
| | | | | |
| September 30, 2018 | ANNUAL REPORT |
The following tables set forth the per share operating performance data for a share of capital stock outstanding, total return ratios to average net assets and other supplemental data for the years indicated.
| | Investor Class |
| | | For the
Year Ended
September 30, 2018 | | | For the
Year Ended
September 30, 2017 | | | For the
Year Ended
September 30, 2016 | | | For the
Year Ended
September 30, 2015 | | | For the
Year Ended
September 30, 2014 (5) | |
| | | | | | | | | | | | | | | | | | | | | |
| Net Asset Value, Beginning of Year | | $ | 8.29 | | | $ | 8.44 | | | $ | 8.47 | | | $ | 8.84 | | | $ | 9.04 | |
| | | | | | | | | | | | | | | | | | | | | |
| Investment Operations: | | | | | | | | | | | | | | | | | | | | |
| Net investment income (1) | | | 0.01 | | | | 0.06 | | | | 0.10 | | | | 0.11 | | | | 0.23 | |
| Net realized and unrealized gain (loss) on investments and options | | | 0.15 | | | | (0.04 | ) | | | 0.04 | | | | (0.35 | ) | | | 0.01 | (6) |
| Total from investment operations | | | 0.16 | | | | 0.02 | | | | 0.14 | | | | (0.24 | ) | | | 0.24 | |
| | | | | | | | | | | | | | | | | | | | | |
| Distributions: | | | | | | | | | | | | | | | | | | | | |
| From net investment income | | | (0.01 | ) | | | (0.17 | ) | | | (0.17 | ) | | | (0.13 | ) | | | (0.44 | ) |
| Total distributions | | | (0.01 | ) | | | (0.17 | ) | | | (0.17 | ) | | | (0.13 | ) | | | (0.44 | ) |
| | | | | | | | | | | | | | | | | | | | | |
| Net Asset Value, End of Year | | $ | 8.44 | | | $ | 8.29 | | | $ | 8.44 | | | $ | 8.47 | | | $ | 8.84 | |
| | | | | | | | | | | | | | | | | | | | | |
| Total Return (2) | | | 1.93 | % | | | 0.32 | %(7) | | | 1.76 | % | | | (2.81 | )% | | | 2.65 | % |
| | | | | | | | | | | | | | | | | | | | | |
| Ratios/Supplemental Data | | | | | | | | | | | | | | | | | | | | |
| Net assets, end of year (in 000’s) | | $ | 9,983 | | | $ | 7,848 | | | $ | 6,691 | | | $ | 8,211 | | | $ | 16,479 | |
| | | | | | | | | | | | | | | | | | | | | |
| Ratios of expenses to average net assets (3): | | | | | | | | | | | | | | | | | | | | |
| Before fees waived and expenses reimbursed | | | 3.34 | % | | | 4.25 | % | | | 3.67 | % | | | 4.34 | % | | | 4.01 | % |
| After fees waived and expenses reimbursed | | | 2.26 | % | | | 2.25 | % | | | 2.27 | % | | | 3.33 | % | | | 2.93 | % |
| | | | | | | | | | | | | | | | | | | | | |
| Ratios of expenses to average net assets (excluding dividends and interest on margin account) (3): | | | | | | | | | | | | | | | | | | | | |
| Before fees waived and expenses reimbursed | | | 3.33 | % | | | 4.24 | % | | | 3.65 | % | | | 3.26 | % | | | 3.26 | % |
| After fees waived and expenses reimbursed | | | 2.25 | % | | | 2.25 | % | | | 2.25 | % | | | 2.25 | % | | | 2.18 | % |
| | | | | | | | | | | | | | | | | | | | | |
| Ratios of net investment income to average net assets (3) (4) | | | 0.12 | % | | | 0.76 | % | | | 1.20 | % | | | 1.21 | % | | | 2.58 | % |
| | | | | | | | | | | | | | | | | | | | | |
| Portfolio turnover rate | | | 301 | % | | | 268 | % | | | 162 | % | | | 999 | % | | | 1125 | % |
| (1) | Per share amounts calculated using the average shares method, which more appropriately presents the per share data for the year. |
| (2) | Total Return represents the rate that the investor would have earned or lost on an investment in the Fund, assuming reinvestment of dividends. |
| (3) | The ratios of expenses to average net assets and net investment income to average net assets do not reflect the expenses of the underlying investment companies in which the Fund invests. |
| (4) | Recognition of net investment income by the Fund is affected by the timing and declaration of dividends by the underlying investment companies in which the Fund invests. |
| (5) | On January 27, 2014, Class A, Class C and Class R shares were exchanged for shares of Class Y which was renamed Investor Class shares. |
| (6) | The net realized and unrealized gain on investments per share does not accord with the net of the amounts reported in the statement of operations due to the timing of purchases and redemptions of the Fund shares during the period. |
| (7) | As a result of a trade error, Crow Point Alternative Income Fund experienced a loss of $3,364 for the year ended September 30, 2017, which was reimbursed by the Adviser. There was no effect on total return due to the trade error. |
The accompanying notes are an integral part of these financial statements.
| Crow Point Funds | ANNUAL REPORT |
NOTES TO THE FINANCIAL STATEMENTS
September 30, 2018
The EAS Crow Point Alternatives Fund (the “EAS Fund”) was organized on October 13, 2017, and the Crow Point Global Tactical Allocation Fund (the “Global Fund”), formerly the Crow Point Defined Risk Global Equity Income Fund, and Crow Point Alternative Income Fund (the “Income Fund”) (collectively, the “Funds”) were organized on October 6, 2017 as separate diversified series of 360 Funds (the “Trust”). The Trust was organized on February 24, 2005 as a Delaware statutory trust. The Trust is registered as an open-end management investment company under the Investment Company Act of 1940 (the “1940 Act”). The Fund’s investment objective is preservation and growth of capital. The Funds’ investment adviser is Crow Point Partners, LLC (the “Adviser”).
The EAS Fund offers three classes of shares, Class A, Class C and Class I shares. The Global Fund offers two classes of shares, Investor Class and Institutional Class. The Income Fund offers one class of shares, Investor Class. Each class differs as to sales and redemption charges and ongoing fees. Income and realized/unrealized gains or losses are allocated to each class based on relative net assets.
Effective as of the close of business on October 6, 2017 for the Global Fund and the Income Fund and October 13, 2017 for the EAS Fund, pursuant to an Agreement and Plan of Reorganization (the “Reorganization”), the Trust’s Funds received all the assets and liabilities of the Northern Light Series Trust’s (the “Former Trust”) Global Fund (the “Predecessor Global Fund”), Income Fund (the “Predecessor Income Fund”) and EAS Fund (Predecessor EAS Fund), collectively, (the “Predecessor Funds”). The shareholders of the Predecessor Funds received shares of the Funds with aggregate net asset values equal to the aggregate net asset values of their shares in the Predecessor Funds immediately prior to the Reorganization. The Predecessor Funds’ investment objectives, policies and limitations were substantially identical to those of the Funds, which had no operations prior to the Reorganization. For financial reporting purposes, the Predecessor Funds’ operating history prior to the Reorganization is reflected in their financial statements and financial highlights. The Reorganization was treated as a tax-free reorganization for federal income tax purposes and, accordingly, the basis of the assets of the Funds reflected the historical basis of the assets of the Predecessor Funds as of the date of the Reorganization. The Reorganization is also considered tax-free based on accounting principles generally accepted in the United States of America (“GAAP”).
The 360 Funds’ Board of Trustees unanimously approved a change in the EAS Fund’s fiscal year end from April 30th to September 30th and a change in the Global Fund’s fiscal year end from May 31st to September 30th. Consequently, this annual report will only cover the period from May 1, 2018 through September 30, 2018 for the EAS Fund and the period from June 1, 2018 through September 30, 2018 for the Global Fund.
| 2. | SIGNIFICANT ACCOUNTING POLICIES |
The following is a summary of the significant accounting policies followed by the Funds in the preparation of their financial statements. The Funds are investment companies that follow the accounting and reporting guidance of Accounting Standards Codification Topic 946 applicable to investment companies.
a) Security Valuation – All investments in securities are recorded at their estimated fair value, as described in note 3.
b) Short Sales – The Funds may sell securities short. A short sale is a transaction in which a Fund sells a security it does not own or have the right to acquire (or that it owns but does not wish to deliver) in anticipation that the market price of that security will decline.
When Funds make a short sale, the broker-dealer through which the short sale is made must borrow the security sold short and deliver it to the party purchasing the security. Funds are required to make a margin deposit in connection with such short sales; the Funds may have to pay a fee to borrow particular securities and will often be obligated to pay over any dividends and accrued interest on borrowed securities.
If the price of the security sold short increases between the time of the short sale and the time the Funds cover their short positions, the Funds will incur a loss; conversely, if the price declines, the Funds will realize a capital gain. Any gain will be decreased, and any loss increased, by the transaction costs described above. The successful use of short selling may be adversely affected by imperfect correlation between movements in the price of the security sold short and the securities being hedged.
| Crow Point Funds | ANNUAL REPORT |
NOTES TO THE FINANCIAL STATEMENTS
September 30, 2018
| 2. | SIGNIFICANT ACCOUNTING POLICIES (continued) |
To the extent the Funds sell securities short, they will provide collateral to the broker-dealer and (except in the case of short sales “against the box”) will maintain additional asset coverage in the form of cash, U.S. government securities or other liquid securities with its Custodian in a segregated account in an amount at least equal to the difference between the current market value of the securities sold short and any amounts required to be deposited as collateral with the selling broker (not including the proceeds of the short sale).
c) Investment Companies – The Funds may invest in investment companies such as open-end funds (mutual funds), including exchange-traded funds (“ETFs”) and closed-end funds (“CEFs”) (also referred to as “Underlying Funds”) subject to limitations as defined in the Investment Company Act of 1940. Your cost of investing in the Funds will generally be higher than the cost of investing directly in the Underlying Funds. By investing in the Funds, you will indirectly bear fees and expenses charged by the Underlying Funds in which the Funds invest in addition to the Funds’ direct fees and expenses. Also, with respect to dividends paid by the Underlying Funds, it is possible for these dividends to exceed the underlying investments’ taxable earnings and profits resulting in the excess portion of such dividends being designated as a return of capital. Distributions received from investments in securities that represent a return of capital or capital gains are recorded as a reduction of the cost of investments or as a realized gain, respectively.
d) Options – The Funds may purchase and write (i.e., sell) put and call options. Such options may relate to particular securities or stock indices, and may or may not be listed on a domestic or foreign securities exchange and may or may not be issued by the Options Clearing Corporation. Options trading is a highly specialized activity that entails greater than ordinary investment risk. Options may be more volatile than the underlying instruments, and therefore, on a percentage basis, an investment in options may be subject to greater fluctuation than an investment in the underlying instruments themselves.
A call option for a particular security gives the purchaser of the option the right to buy, and the writer (seller) the obligation to sell, the underlying security at the stated exercise price at any time prior to the expiration of the option, regardless of the market price of the security. The premium paid to the writer is in consideration for undertaking the obligation under the option contract. A put option for a particular security gives the purchaser the right to sell, and the writer (seller) the obligation to buy the security at the stated exercise price at any time prior to the expiration date of the option, regardless of the market price of the security.
If an option purchased by the Funds expires unexercised, the Funds realize a loss equal to the premium paid. If the Funds enter into a closing sale transaction on an option purchased by it, the Funds will realize a gain if the premium received by the Funds on the closing transaction is more than the premium paid to purchase the option or a loss if it is less. If an option written by the Funds expires on the stipulated expiration date or if the Funds enter into a closing purchase transaction, they will realize a gain (or loss if the cost of a closing purchase transaction exceeds the net premium received when the option is sold). If a call option written by the Funds is exercised, the proceeds of the sale will be increased by the net premium originally received and the Funds will realize a gain or loss. If a put option written by the Funds is exercised, the cost of the purchase will be decreased by the net premium originally received.
e) Federal Income Taxes – The Funds have qualified and intend to continue to qualify as regulated investment companies under Subchapter M of the Internal Revenue Code of 1986, as amended (the “Code”). It is the policy of the Funds to comply with the requirements of the Code applicable to regulated investment companies and to distribute substantially all of their net investment company taxable income and net capital gains. The Funds also intend to distribute sufficient net investment income and net capital gains, if any, so that they will not be subject to excise tax on undistributed income and gains. Therefore, no federal income tax or excise tax provision is required.
As of and during the periods/year ended September 30, 2018, the Funds did not have a liability for any unrecognized tax expenses. The Funds recognize interest and penalties, if any, related to unrecognized tax liability as income tax expense in the statements of operations. During the periods/year ended September 30, 2018, the Funds did not incur any interest or penalties. The Funds identify their major tax jurisdictions as U.S. Federal and Delaware state.
| Crow Point Funds | ANNUAL REPORT |
NOTES TO THE FINANCIAL STATEMENTS
September 30, 2018
| 2. | SIGNIFICANT ACCOUNTING POLICIES (continued) |
In addition, accounting principles generally accepted in the United States of America (“GAAP”) requires management of the Funds to analyze all open tax years, as defined by IRS statute of limitations for all major industries, including federal tax authorities and certain state tax authorities. As of and during the years ended April 30, 2015, April 30, 2016, April 30, 2017 and April 30, 2018 and the periods ended September 30, 2018 for the EAS Fund; and the years ended May 31, 2015, May 31, 2016, May 31, 2017 and May 31, 2018 and the period ended September 30, 2018 for the Global Fund; and the years ended September 30, 2015, September 30, 2016, September 30, 2017 and September 30, 2018 for the Income Fund, the Funds did not have a liability for any unrecognized tax benefits. The Funds have no examinations in progress and are not aware of any tax positions for which it is reasonably possible that the total amounts of unrecognized tax benefits will significantly change in the next twelve months.
f) Distributions to Shareholders – Dividends from net investment income and distributions of net realized capital gains, if any, will be declared and paid at least annually. Income and capital gain distributions, which are determined in accordance with income tax regulations, are recorded on the ex-dividend date. GAAP requires that permanent financial reporting differences relating to shareholder distributions be reclassified to paid-in capital or net realized gains.
g) Use of Estimates – The preparation of financial statements in conformity with GAAP requires management to make estimates and assumptions that affect the reported amounts of assets and liabilities and disclosure of contingent assets and liabilities at the date of the financial statements and the reported amounts of revenues and expenses during the reporting period. Actual results could differ from those estimates.
h) Other – Investment and shareholder transactions are recorded on trade date. The Funds determine the gain or loss realized from the investment transactions by comparing the original cost of the security lot sold with the net sales proceeds. Dividend income is recognized on the ex-dividend date or as soon as information is available to the Funds and interest income is recognized on an accrual basis. Withholding taxes on foreign dividends have been provided for in accordance with the Funds’ understanding of the applicable country’s tax rules and rates.
i) Sales Charges and Redemption Fees – A maximum sales charge of 5.50% is imposed on certain purchases of the EAS Fund’s Class A shares. A contingent deferred sales charge (“CDSC”) is imposed upon certain redemptions of the EAS Fund’s Class A shares purchased at net asset value in amounts totaling $1 million or more if the dealer’s commission was paid by the underwriter and the shares are redeemed within one year from the date of purchase. The CDSC will be paid to the Distributor and will be equal to 1.00% of the lesser of (1) the net asset value at the time of purchase of the Class A shares being redeemed; or (2) the net asset value of such shares at the time of redemption. A CDSC of 1.00% will be imposed on redemptions of the EAS Fund’s Class C shares made within one year of their purchase. The CDSC will be a percentage of the dollar amount of shares redeemed and will be assessed on an amount equal to the net asset value at the time of purchase of the Class C shares being redeemed. There were no CDSC Fees paid to the Distributor during the periods/year ended September 30, 2018.
Processes and Structure
The Funds’ Board of Trustees has adopted guidelines for valuing securities and other derivative instruments including in circumstances in which market quotes are not readily available, and has delegated authority to the Adviser to apply those guidelines in determining fair value prices, subject to review by the Board of Trustees.
Hierarchy of Fair Value Inputs
The Funds utilize various methods to measure the fair value of their investments on a recurring basis. GAAP establishes a hierarchy that prioritizes inputs to valuation techniques used to measure fair value. The three levels of inputs are as follows:
| ● | Level 1 – Unadjusted quoted prices in active markets for identical assets or liabilities that the Fund has the ability to access. |
| ● | Level 2 – Observable inputs other than quoted prices included in level 1 that are observable for the asset or liability either directly or indirectly. These inputs may include quoted prices for the identical instrument on an inactive market, prices for similar instruments, interest rates, prepayment speeds, credit risk, yield curves, default rates, and similar data. |
| Crow Point Funds | ANNUAL REPORT |
NOTES TO THE FINANCIAL STATEMENTS
September 30, 2018
| 3. | SECURITIES VALUATIONS (continued) |
| ● | Level 3 – Unobservable inputs for the asset or liability to the extent that relevant observable inputs are not available, representing the Fund’s own assumptions about the assumptions that a market participant would use in valuing the asset or liability, and that would be based on the best information available. |
The availability of observable inputs can vary from security to security and is affected by a wide variety of factors, including, for example, the type of security, whether the security is new and not yet established in the marketplace, the liquidity of markets, and other characteristics particular to the security. To the extent that valuation is based on models or inputs that are less observable or unobservable in the market, the determination of fair value requires more judgment. Accordingly, the degree of judgment exercised in determining fair value is greatest for instruments categorized in level 3.
The inputs used to measure fair value may fall into different levels of the fair value hierarchy. In such cases, for disclosure purposes, the level in the fair value hierarchy within which the fair value measurement falls in its entirety is determined based on the lowest level input that is significant to the fair value measurement in its entirety.
Fair Value Measurements
A description of the valuation techniques applied to the Trust’s major categories of assets and liabilities measured at fair value on a recurring basis follows.
Equity securities (common stock, ETFs, mutual funds and CEFs) – Securities traded on a national securities exchange (or reported on the NASDAQ national market) are stated at the last reported sales price on the day of valuation. To the extent these securities are actively traded, and valuation adjustments are not applied, they are categorized in level 1 of the fair value hierarchy. Certain foreign securities may be fair valued using a pricing service that considers the correlation of the trading patterns of the foreign security to the intraday trading in the U.S. markets for investments such as American Depositary Receipts, financial futures, Exchange Traded Funds, and the movement of the certain indexes of securities based on a statistical analysis of the historical relationship and are categorized in level 2. Preferred stock and other equities traded on inactive markets or valued by reference to similar instruments are also categorized in level 2.
Money market funds – Money market funds are valued at their net asset value per share and are categorized as level 1.
Derivative instruments – Listed derivatives, including options, that are actively traded, are valued based on quoted prices from the exchange and categorized in level 1 of the fair value hierarchy. Options held by the Funds for which no current quotations are readily available and which are not traded on the valuation date are valued at the mean price and are categorized within level 2 of the fair value hierarchy. Over-the-counter (OTC) derivative contracts include forward, swap, and option contracts related to interest rates; foreign currencies; credit standing of reference entities; equity prices; or commodity prices, and warrants on exchange-traded securities. Depending on the product and terms of the transaction, the fair value of the OTC derivative products can be modeled taking into account the counterparties’ creditworthiness and using a series of techniques, including simulation models. Many pricing models do not entail material subjectivity because the methodologies employed do not necessitate significant judgments, and the pricing inputs are observed from actively quoted markets, as is the case of interest rate swap and option contracts. OTC derivative products valued using pricing models are categorized within level 2 of the fair value hierarchy.
In accordance with the Trust’s good faith pricing guidelines, the Adviser is required to consider all appropriate factors relevant to the value of securities for which it has determined other pricing sources are not available or reliable as described above. No single standard exists for determining fair value, because fair value depends upon the circumstances of each individual case. As a general principle, the current fair value of an issue of securities being valued by the Adviser would appear to be the amount which the owner might reasonably expect to receive for them upon their current sale. Methods which are in accordance with this principle may, for example, be based on (i) a multiple of earnings; (ii) a discount from market of a similar freely traded security (including a derivative security or a basket of securities traded on other markets, exchanges or among dealers); or (iii) yield to maturity with respect to debt issues, or a combination of these and other methods. Good faith pricing is permitted if, in the Adviser’s opinion, the validity of market quotations appears to be questionable based on factors such as evidence of a thin market in the security based on a small number of quotations, a significant event occurs after the close of a market but before the Funds’ NAV calculations that may affect a security’s value, or the Adviser is aware of any other data that calls into question the reliability of market quotations. Good faith pricing may also be used in instances when the bonds in which the Funds invest may default or otherwise cease to have market quotations readily available.
| Crow Point Funds | ANNUAL REPORT |
NOTES TO THE FINANCIAL STATEMENTS
September 30, 2018
| 3. | SECURITIES VALUATIONS (continued) |
The Trustees of the 360 Funds adopted the M3Sixty Consolidated Valuation Procedures, which established a Valuation Committee to work with the Adviser and report to the Board of Trustees (the “Board”) on securities being fair valued or manually priced. The Lead Chairman and Trustee of the 360 Funds, along with the Trust’s Principal Financial Officer and Chief Compliance Officer are members of the Valuation Committee which meets at least monthly or, as required, to review the interim actions and coordination with the Adviser in pricing fair valued securities, and consideration of any unresolved valuation issue or a request to change the methodology for manually pricing a security. In turn, the Lead Chairman provides updates to the Board at the regularly scheduled board meetings as well as interim updates to the board members on substantive changes in a daily valuation or methodology issue.
If the Adviser decides that a price provided by the pricing service does not accurately reflect the fair value of the securities, when prices are not readily available from a pricing service, or when certain restricted or illiquid securities are being valued, securities are valued at fair value as determined in good faith by the Adviser, in conformity with guidelines adopted by and subject to review of the Board and the Fair Valuation Committee. These securities will be categorized as level 3 securities.
The following tables summarize the inputs used to value the Funds’ assets and liabilities measured at fair value as of September 30, 2018.
EAS Fund:
Financial Instruments – Assets
Security Classification | | | Level 1 | | | | Level 2 | | | | Level 3 | | | | Totals | |
| Common Stock (1) | | $ | 10,245,692 | | | $ | 378,129 | | | $ | — | | | $ | 10,623,821 | |
| Closed-End Fund (1) | | | 850 | | | | — | | | | — | | | | 850 | |
| Hedge Fund measured at net asset value (2) | | | — | | | | — | | | | — | | | | 3,981,142 | |
| Mutual Funds (1) | | | 16,379,509 | | | | 1,109,835 | | | | — | | | | 17,489,344 | |
| Asset Backed Securities | | | — | | | | 28,833 | | | | — | | | | 28,833 | |
| Corporate Bond | | | — | | | | 272,700 | | | | — | | | | 272,700 | |
| Call Options Purchased | | | 378,148 | | | | 369,000 | | | | — | | | | 747,148 | |
| Put Options Purchased | | | 2,700 | | | | — | | | | — | | | | 2,700 | |
| Total Assets | | $ | 27,006,899 | | | $ | 2,158,497 | | | $ | — | | | $ | 33,146, 538 | |
Financial Instruments – Liabilities
Securities Sold Short
Classification | | Level 1 | | Level 2 | | Level 3 | | Totals |
| Common Stock (1) | | $ | 1,805,351 | | | $ | — | | | $ | — | | | $ | 1,805,351 | |
| Exchange-Traded Funds (1) | | | 7,554,053 | | | | — | | | | — | | | | 7,554,053 | |
| Put Options Written | | | 6,400 | | | | — | | | | — | | | | 6,400 | |
| Total Liabilities | | $ | 9,365,804 | | | $ | — | | | $ | — | | | $ | 9,365, 804 | |
(1) For a detailed break-out of common stock, ETFs, CEFs and mutual funds by industry or asset class, please refer to the Schedules of Investments.
(2) In accordance with Subtopic 820-10, certain investments that are measured at fair value using the net asset value per share (or its equivalent) practical expedient have not been classified in the fair value hierarchy. The fair value amounts presented in this table are intended to permit reconciliation of the fair value hierarchy to the amounts presented in the schedule of investments.
| Crow Point Funds | ANNUAL REPORT |
NOTES TO THE FINANCIAL STATEMENTS
September 30, 2018
| 3. | SECURITIES VALUATIONS (continued) |
Following is a reconciliation of investments in which significant unobservable inputs (Level 3) were used in determining fair value for the EAS Fund:
| | Balance as of April 30, 2018 | Realized gain (loss) | Amortization | Change in unrealized appreciation (depreciation) | Purchases | Sales | Transfers into Level 3 | Transfers out of Level 3 | Balance as of September 30, 2018 |
| Bonds & Notes | $ 38,020 | $ 520 | $ 7 | $ (527) | $ — | $ (38,020) | $ — | $ — | $ — |
| Total | $ 38,020 | $ 520 | $ 7 | $ (527) | $ — | $ (38,020) | $ — | $ — | $ — |
Global Fund:
Financial Instruments – Assets
Security Classification | | Level 1 | | Level 2 | | Level 3 | | Totals |
| Common Stock (1) | | $ | 961,827 | | | $ | — | | | $ | — | | | $ | 961,827 | |
| Closed-End Funds (1) | | | 770,857 | | | | — | | | | — | | | | 770,857 | |
| Exchange-Traded Funds (1) | | | 10,858,295 | | | | — | | | | — | | | | 10,858,295 | |
| Mutual Funds (1) | | | 1,677,676 | | | | — | | | | — | | | | 1,677,676 | |
| Asset Backed Securities | | | — | | | | 18,214 | | | | — | | | | 18,214 | |
| Put Options | | | 49,020 | | | | — | | | | | | | | 49,020 | |
| Short-Term Investments | | | 3,099,946 | | | | — | | | | — | | | | 3,099,946 | |
| Total Assets | | $ | 17,417,621 | | | $ | 18,214 | | | $ | — | | | $ | 17,435,835 | |
Financial Instruments – Liabilities
Security Classification | | Level 1 | | Level 2 | | Level 3 | | Totals |
| Common Stock (1) | | $ | 317,724 | | | $ | — | | | $ | — | | | $ | 317,724 | |
| Exchange-Traded Funds (1) | | | 268,250 | | | | — | | | | — | | | | 268,250 | |
| Call Options Written | | | 23,080 | | | | — | | | | — | | | | 23,080 | |
| Put Options Written | | | 10,259 | | | | — | | | | — | | | | 10,259 | |
| Total Liabilities | | $ | 619,313 | | | $ | — | | | $ | — | | | $ | 619, 313 | |
| (1) | For a detailed break-out of common stock, ETFs, CEFs and mutual funds by industry or asset class, please refer to the Schedules of Investments. |
| Crow Point Funds | ANNUAL REPORT |
NOTES TO THE FINANCIAL STATEMENTS
September 30, 2018
| 3. | SECURITIES VALUATIONS (continued) |
Income Fund:
Financial Instruments – Assets
Security Classification | | Level 1 | | Level 2 | | Level 3 | | Totals |
| Preferred Stock (1) | | $ | 59,558 | | | $ | — | | | $ | — | | | $ | 59,558 | |
| Closed-End Funds (1) | | | 704,032 | | | | — | | | | — | | | | 704,032 | |
| Exchange-Traded Funds (1) | | | 5,792,401 | | | | — | | | | — | | | | 5,792,401 | |
| Mutual Funds (1) | | | 503,500 | | | | — | | | | — | | | | 503,500 | |
| Bonds & Notes | | | — | | | | 746,076 | | | | — | | | | 746,076 | |
| Private Investment | | | — | | | | — | | | | 365,826 | | | | 365,826 | |
| Put Options | | | 12,757 | | | | — | | | | — | | | | 12,757 | |
| Short-Term Investments | | | 764,051 | | | | — | | | | — | | | | 764,051 | |
| Total Assets | | $ | 7,836,299 | | | $ | 746,076 | | | $ | 365,826 | | | $ | 8,948,201 | |
Financial Instruments – Liabilities
Security Classification | | Level 1 | | Level 2 | | Level 3 | | Totals |
| Common Stock (1) | | $ | 79,431 | | | $ | — | | | $ | — | | | $ | 79,431 | |
| Call Options Written | | | 4,920 | | | | — | | | | — | | | | 4,920 | |
| Put Options Written | | | 1,330 | | | | — | | | | — | | | | 1,330 | |
| Total Liabilities | | $ | 85,681 | | | $ | — | | | $ | — | | | $ | 85,681 | |
(1) For a detailed break-out of common stock, preferred stock, ETFs, CEFs and mutual funds by industry or asset class, please refer to the Schedules of Investments.
Following is a reconciliation of investments in which significant unobservable inputs (Level 3) were used in determining fair value for the Income Fund:
| | Balance as of September 30, 2017 | Realized gain (loss) | Amortization | Change in unrealized appreciation (depreciation) | Purchases | Sales | Transfers into Level 3 | Transfers out of Level 3 | Balance as of September 30, 2018 |
| Private Investment | $ — | $ — | $ — | $ — | $ — | $ — | $ 365,826 | $ — | $ 365,826 |
| Total | $ — | $ — | $ — | $ — | $ — | $ — | $ 365,826 | $ — | $ 365,826 |
The price for the Private Investment is determined based on the price change of a basket of five comparable public companies using the following formula: Previous day’s price multiplied by the sum of 1/5th of the daily price change of each public company within the basket equals current day’s price. This price represents the Private Investment’s estimated fair value. Given that the Private Investment has not yet released financial statements, the estimated fair value is currently non-verifiable, thus has been transferred from Level 2 to Level 3. The actual value of the Private Investment could differ substantially from the estimate provided herein.
It is the Funds’ policy to recognize transfers between levels at the end of the reporting period.
| 4. | DERIVATIVES TRANSACTIONS |
As of September 30, 2018, portfolio securities valued at $9,599,520 and $2,170,785 were held in escrow by the custodian as collateral for securities sold short and options written by the EAS Fund and Global Fund, respectively.
| Crow Point Funds | ANNUAL REPORT |
NOTES TO THE FINANCIAL STATEMENTS
September 30, 2018
| 4. | DERIVATIVES TRANSACTIONS (continued) |
As of September 30, 2018, the location on the Statements of Assets and Liabilities for financial derivative instrument fair values is as follows:
| EAS Fund: | | | | |
| Assets | | Location | | Equity Contracts |
| Call options purchased | | Unaffiliated securities, at value | | $ | 747,148 | |
| Put options purchased | | Unaffiliated securities, at value | | | 2,700 | |
| Total Assets | | | | $ | 749,848 | |
| Liabilities | | Location | | | Equity Contracts | |
| Call options written | | Options written, at value | | $ | 6,400 | |
| Total Liabilities | | | | $ | 6,400 | |
| Global Fund: | | | | |
| Assets | | Location | | Equity Contracts |
| Put options purchased | | Unaffiliated securities, at value | | $ | 49,020 | |
| Total Assets | | | | $ | 49,020 | |
| Liabilities | | Location | | | Equity Contracts | |
| Call options written | | Options written, at value | | $ | 23,080 | |
| Put options written | | Options written, at value | | | 10,259 | |
| Total Liabilities | | | | $ | 33,339 | |
| Income Fund: | | | | |
| Assets | | Location | | Equity Contracts |
| Put options purchased | | Unaffiliated securities, at value | | $ | 12,757 | |
| Total Assets | | | | $ | 12,757 | |
| Liabilities | | Location | | | Equity Contracts | |
| Call options written | | Options written, at value | | $ | 4,920 | |
| Put options written | | Options written, at value | | | 1,330 | |
| Total Liabilities | | | | $ | 6,250 | |
| Crow Point Funds | ANNUAL REPORT |
NOTES TO THE FINANCIAL STATEMENTS
September 30, 2018
| 4. | DERIVATIVES TRANSACTIONS (continued) |
Realized and unrealized gains and losses on derivatives contracts entered into by the Funds during the periods/year ended September 30, 2018, are recorded in the following locations in the Statements of Operations:
| EAS Fund: | | | | |
| Net change in unrealized appreciation/(depreciation) on: | | Location | | Equity Contracts |
| Call options purchased | | Unaffiliated Investments | | $ | 639,178 | |
| Put options purchased | | Unaffiliated Investments | | | (48,639 | ) |
| Call options written | | Options written | | | (2,600 | ) |
| Put option written | | Options written | | | (9,970 | ) |
| | | | | $ | 577,969 | |
| Net realized gain (loss) on: | | Location | | | Equity Contracts | |
| Call options purchased | | Unaffiliated Investments | | $ | 135,787 | |
| Put options purchased | | Unaffiliated Investments | | | (132,168 | ) |
| Put option written | | Options written | | | 22,490 | |
| | | | | $ | 26,109 | |
| Global Fund: | | | | |
Net change in unrealized
appreciation/(depreciation) on: | | Location | | Equity Contracts |
| Put options purchased | | Unaffiliated Investments | | $ | 1,654 | |
| Call options written | | Options written | | | (1,519 | ) |
| Put option written | | Options written | | | 20,423 | |
| | | | | $ | 20,558 | |
| Net realized gain (loss) on: | | Location | | Equity Contracts |
| Call options purchased | | Unaffiliated Investments | | $ | (8,025 | ) |
| Put options purchased | | Unaffiliated Investments | | | (13,863 | ) |
| Call options written | | Options written | | | (1,406 | ) |
| Put option written | | Options written | | | 3,107 | |
| | | | | $ | (20,187 | ) |
| Income Fund: | | | | |
| Net change in unrealized appreciation/(depreciation) on: | | Location | | Equity Contracts |
| Put options purchased | | Unaffiliated Investments | | $ | (2,539 | ) |
| Call options written | | Options written | | | (1,245 | ) |
| Put option written | | Options written | | | 6,235 | |
| | | | | $ | 2,451 | |
| Net realized gain (loss) on: | | Location | | Equity Contracts |
| Call options purchased | | Unaffiliated Investments | | $ | (4,117 | ) |
| Put options purchased | | Unaffiliated Investments | | | (14,648 | ) |
| Call options written | | Options written | | | 20,866 | |
| Put option written | | Options written | | | 12.009 | |
| | | | | $ | 14,110 | |
| Crow Point Funds | ANNUAL REPORT |
NOTES TO THE FINANCIAL STATEMENTS
September 30, 2018
| 4. | DERIVATIVES TRANSACTIONS (continued) |
Realized and unrealized gains and losses on derivatives contracts entered into by the EAS Fund during the year ended April 30, 2018, are recorded in the following locations in the Statements of Operations:
| EAS Fund: | | | | |
| Net change in unrealized appreciation/(depreciation) on: | | Location | | Equity Contracts |
| Call options purchased | | Unaffiliated Investments | | $ | (4,054 | ) |
| Put options purchased | | Unaffiliated Investments | | | (59,343 | ) |
| Put option written | | Options written | | | 4,641 | |
| | | | | $ | (58,760 | ) |
| Net realized gain (loss) on: | | Location | | Equity Contracts |
| Call options purchased | | Unaffiliated Investments | | $ | (29,168 | ) |
| Put options purchased | | Unaffiliated Investments | | | (16,182 | ) |
| Put option written | | Options written | | | (11,609 | ) |
| | | | | $ | (56,959 | ) |
Realized and unrealized gains and losses on derivatives contracts entered into by the Global Fund during the year ended May 31, 2018, are recorded in the following locations in the Statement of Operations:
| Net change in unrealized appreciation (depreciation) on: | | Location | | Equity Contracts |
| Put options purchased | | Unaffiliated Investments | | $ | 45,632 | |
| Call options written | | Options written | | | (2,958 | ) |
| Put options written | | Options written | | | (18,759 | ) |
| | | | | $ | 23,915 | |
| Net realized gain (loss) on: | | Location | | Equity Contracts |
| Call options purchased | | Unaffiliated Investments | | $ | 5,287 | |
| Put options purchased | | Unaffiliated Investments | | | (127,490 | ) |
| Call options written | | Options written | | | 6,978 | |
| Put options written | | Options written | | | 63,549 | |
| | | | | $ | (51,676 | ) |
The amounts realized and changes in unrealized gains and losses on derivative instruments during the periods/years as disclosed above and within the Statements of Operations serve as indicators of the volume of derivative activity for the Funds.
| 5. | INVESTMENT TRANSACTIONS |
For the periods/year ended September 30, 2018, aggregate purchases and sales of investment securities (excluding short-term investments) for the Funds were as follows:
| | Purchases | | Sales |
| EAS Fund | $ | 27,792,401 | | | $ | 16,133,413 | |
| Global Fund | | 12,909,966 | | | | 10,564,362 | |
| Income Fund | | 29,282,998 | | | | 28,754,656 | |
There were no Government securities purchased or sold during the periods/year.
| Crow Point Funds | ANNUAL REPORT |
NOTES TO THE FINANCIAL STATEMENTS
September 30, 2018
6. INVESTMENTS IN AFFILIATED COMPANIES
An affiliated company is a company in which the Funds have ownership of at least 5% of the voting securities or of common management. Companies which are affiliates of the Funds at September 30, 2018, are noted in the Funds’ Schedules of Investments. The Income Fund, Crow Point Growth Fund (the “Growth Fund”), Eagle Rock Floating Rate Fund (the “Eagle Rock Fund”) and RVX Emerging Markets Equity Fund (the “RVX Fund”) are mutual funds which are considered affiliates because they are also of common management of the Adviser.
Transactions during the periods/year with affiliated companies were as follows:
EAS Fund: | Value as of April 30, 2018 | Realized gain
(loss) | Change in
unrealized
appreciation
(depreciation) | Purchases | Sales | Value as of
September 30,
2018 | Income received |
| Income Fund | $ 3,319,068 | $ — | $ 37,203 | $ 800,000 | $ — | $ 4,156,271 | $ — |
| Growth Fund* | 100,875 | — | 687,408 | 6,150,000 | — | 6,938,283 | — |
| Eagle Rock Fund | — | — | 17,010 | 2,250,000 | — | 2,267,010 | — |
| RVX Fund | — | — | (82,055) | 3,100,000 | — | 3,017,945 | — |
| Total | $ 3,419,943 | $ — | $ 659,566 | $ 12,300,000 | $ — | $ 16,379,509 | $ — |
* On May 14, 2018, the Adviser became the investment adviser of the Goodwood SMID Long/Short Fund (“Goodwood”). As of April 30, 2018, the EAS Fund owned 12,500 shares of Goodwood valued at $100,875. Accordingly, subsequent to April 30, 2018, Goodwood became an affiliated company to the Funds and its name was changed to the Crow Point Growth Fund.
Global Fund: | Value as of May 31, 2018 | Realized gain
(loss) | Change in
unrealized
appreciation
(depreciation) | Purchases | Sales | Value as of September 30,
2018 | Income
received |
| RVX Fund | $ 1,511,842 | $ (65,217) | $ (25,949) | $ — | $ (750,000) | $ 670,676 | $ — |
| Eagle Rock Fund | — | — | 7,000 | 1,000,000 | — | 1,007,000 | — |
| Total | $ 1,511,842 | $ (65,217) | $ (18,949) | $ 1,000,000 | $ (750,000) | $ 1,677,676 | $ — |
Income Fund: | Value as of September 30, 2017 | Realized gain
(loss) | Change in
unrealized
appreciation
(depreciation) | Purchases | Sales | Value as of September 30,
2018 | Income
received |
| Eagle Rock Fund | $ — | $ — | $ 3,500 | $ 500,000 | $ — | $ 503,500 | $ — |
| Total | $ — | $ — | $ 3,500 | $ 500,000 | $ — | $ 503,500 | $ — |
Transactions with affiliated companies for the EAS Fund during the year ended April 30, 2018 were as follows:
EAS Fund: | Value as of April 30, 2017 | Realized gain
(loss) | Change in
unrealized
appreciation
(depreciation) | Purchases | Sales | Value as of April 30,
2018 | Income
received |
| Alternative Income Fund | $ 5,413,279 | $ 48,915 | $ 66,874 | $ 300,000 | $ (2,510,000) | $ 3,319,068 | $ 34,515 |
| Defined Risk Fund | 1,342,792 | 32,570 | 60,784 | 300,000 | (1,736,146) | — | 28,528 |
| Total | $ 6,756,071 | $ 81,485 | $ 127,658 | $ 600,000 | $ (4,246,146) | $ 3,319,068 | $ 63,043 |
Transactions with affiliated companies for the Global Fund during the year ended May 31, 2018 were as follows:
Global Fund: | Value as of May 31, 2017 | Realized gain
(loss) | Change in
unrealized
appreciation
(depreciation) | Purchases | Sales | Value as of May 31,
2018 | Income
received |
| RVX Fund | $ — | $ — | $ (38,158) | $ 1,550,000 | $ — | $ 1,511,842 | $ — |
| Total | $ — | $ — | $ (38,158) | $ 1,550,000 | $ — | $ 1,511,842 | $ — |
| Crow Point Funds | ANNUAL REPORT |
NOTES TO THE FINANCIAL STATEMENTS
September 30, 2018
7. ADVISORY FEES AND OTHER RELATED PARTY TRANSACTIONS
The EAS Fund and the Global Fund have entered into Investment Advisory Agreements with the Adviser. Pursuant to the Reorganization on October 6, 2017, the Income Fund has also entered into an Investment Advisory Agreement with the Adviser (collectively, the “Advisory Agreements”). Under the Advisory Agreements, the Adviser, under the supervision of the Board, agrees to invest the assets of the Funds in accordance with applicable law and the investment objective, policies and restrictions set forth in the Funds’ current Prospectuses and Statements of Additional Information, and subject to such further limitations as the Trust may from time to time impose by written notice to the Adviser. The Adviser shall act as the investment advisor to the Funds and, as such shall (i) obtain and evaluate such information relating to the economy, industries, business, securities markets and securities as it may deem necessary or useful in discharging its responsibilities here under, (ii) formulate a continuing program for the investment of the assets of the Funds in a manner consistent with their investment objectives, policies and restrictions, and (iii) determine from time to time securities to be purchased, sold, retained or lent by the Funds, and implement those decisions, including the selection of entities with or through which such purchases, sales or loans are to be effected; provided, that the Adviser will place orders pursuant to its investment determinations either directly with the issuer or with a broker or dealer, and if with a broker or dealer, (a) will attempt to obtain the best price and execution of its orders, and (b) may nevertheless in its discretion purchase and sell portfolio securities from and to brokers who provide the Adviser with research, analysis, advice and similar services and pay such brokers in return a higher commission or spread than may be charged by other brokers.
Prior to the Reorganization, the Former Trust was party to an advisory agreement (the “Former Agreement”) with the Adviser, pursuant to which the Adviser served as investment adviser to the Predecessor Income Fund. Pursuant to the Former Agreement between the Adviser and the Former Trust, on behalf of the Predecessor Income Fund, the Adviser, under the oversight of the Former Board of Trustees, directed the daily operations of the Predecessor Income Fund and supervised the performance of administrative and professional services provided by others.
Under the terms of the Advisory Agreement with the Funds and the Former Agreement with the Predecessor Income Fund, the Adviser receives a monthly management fee equal to annual rates of the Funds’ net assets as follows:
| | | Management Fee Rates |
| EAS Fund | | 1.00% |
| Global Fund | | 0.88% |
| Income Fund | | 1.00% |
For the periods/year ended September 30, 2018, the Adviser earned management fees as follows:
| | | Management Fees |
| EAS Fund | | | $ | 109,988 | |
| Global Fund | | | 50,095 | |
| Income Fund | | | 113,068 | |
For the year ended April 30, 2018, the Adviser earned $231,659 of management fees from the EAS Fund. For the year ended May 31, 2018, the Adviser earned $99,433 of management fees from the Global Fund.
The Adviser has contractually agreed to waive or reduce its fees and to assume other expenses of the EAS Fund and the Global Fund, if necessary, in an amount that limits “Total Annual Fund Operating Expenses” (exclusive of interest, expenses incurred under a plan of distribution adopted pursuant to Rule 12b-1 under the 1940 Act, taxes, acquired fund fees and expenses, brokerage commissions, dividend expenses on securities sold short and other expenditures which are capitalized in accordance with generally accepted accounting principles and other extraordinary expenses not incurred in the ordinary course of such Fund’s business) to not more than 1.70% of the average daily net assets of each share class of the EAS Fund and 1.35% of the average daily net assets of each share class of the Global Fund through January 31, 2020. These operating expense limitation agreements can be terminated only by, or with the consent of, the Board of Trustees.
The Adviser has also contractually agreed to waive its fees and reimburse expenses of the Income Fund, at least until January 31, 2019 to ensure that Total Annual Fund Operating Expenses After Fee Waiver and Reimbursement (exclusive of any front-end or contingent deferred loads, taxes, brokerage fees and commissions, borrowing costs (such as interest and dividend expense on securities sold short), acquired fund fees and expenses, or extraordinary expenses such as litigation) will not exceed 2.25% of the Fund’s average daily net assets.
| Crow Point Funds | ANNUAL REPORT |
NOTES TO THE FINANCIAL STATEMENTS
September 30, 2018
7. ADVISORY FEES AND OTHER RELATED PARTY TRANSACTIONS (continued)
For the periods/year ended September 30, 2018, the Adviser waived advisory fees and reimbursed expenses as follows:
| | Advisory Fees Waived | | Expenses Reimbursed |
| EAS Fund | $ 74,935 | | $ — |
| Global Fund | 50,095 | | 29,344 |
| Income Fund | 80,949 | | — |
For the year ended April 30, 2018, the Adviser waived advisory fees of $179,534 earned from the EAS Fund. For the year ended May 31, 2018, the Adviser waived advisory fees of $98,349 and reimbursed expenses of $135,176 to the Global Fund.
The Funds invested a portion of their assets in the Income Fund, Growth Fund, Eagle Rock Fund and RVX Fund, which are affiliated Funds (Note 6). As such, the Adviser has agreed to waive its advisory fees on the portion of the Funds’ assets that are invested in the Income Fund, Growth Fund, Eagle Rock Fund and RVX Fund. For the periods/year ended September 30, 2018, the Adviser waived advisory fees related to assets invested in the affiliated funds as follows:
| | | Affiliated Funds Advisory Fees Waived |
| EAS Fund | | $ 25,402 |
| Global Fund | | 4,383 |
| Income Fund | | 754 |
For the year ended April 30, 2018, the Adviser waived $54,616 in advisory fees related to the EAS Fund’s assets invested in the affiliated funds. For the year ended May 31, 2018, the Adviser waived $1,084 in advisory fees related to the Global Fund’s assets invested in the affiliated funds.
These waivers are in addition to amounts waived pursuant to the contractual expense limitations detailed in the above paragraphs and are not recoupable.
Expense waivers and reimbursements are subject to possible recoupment from the Funds in future years on a rolling three year basis (within the three years after the fees have been waived or reimbursed) if such recoupment can be achieved within the foregoing expense limits. Expense waivers and reimbursements made by the Predecessor Income Fund were also subject to possible recoupment from the Predecessor Fund under the same terms. As of September 30, 2018, the total amount of expenses waived/reimbursed subject to recapture and their expiration dates, pursuant to the waiver agreements, was as follows:
| | Amount Subject to Recoupment | | Expiration Dates |
| EAS Fund | $ 177,286 | | April 30, 2019 |
| EAS Fund | 100,591 | | April 30, 2020 |
| EAS Fund | 175,252 | | April 30, 2021 |
| EAS Fund | 74,935 | | September 30, 2021 |
| Global Fund | 264,268 | | May 31, 2019 |
| Global Fund | 205,491 | | May 31, 2020 |
| Global Fund | 233,525 | | May 31, 2021 |
| Global Fund | 79,439 | | September 30, 2021 |
| Income Fund | 109,295 | | September 30, 2019 |
| Income Fund | 130,930 | | September 30, 2020 |
| Income Fund | 80,949 | | September 30, 2021 |
The EAS Fund and the Global Fund have entered into an Investment Company Services Agreement (“ICSA”) with M3Sixty Administration, LLC (“M3Sixty”). Pursuant to the Reorganization, the Income Fund has also entered into an ICSA with M3Sixty. Pursuant to the ICSA, M3Sixty is responsible for a wide variety of functions, including but not limited to: (a) Fund accounting services; (b) financial statement preparation; (c) valuation of the Fund’s portfolio securities; (d) pricing the Fund’s shares; (e) assistance in preparing tax returns; (f) preparation and filing of required regulatory reports; (g) communications with shareholders; (h) coordination of Board and shareholder meetings; (i) monitoring the Fund’s legal compliance; and (j) maintaining shareholder account records.
| Crow Point Funds | ANNUAL REPORT |
NOTES TO THE FINANCIAL STATEMENTS
September 30, 2018
7. ADVISORY FEES AND OTHER RELATED PARTY TRANSACTIONS (continued)
For the periods/year ended September 30, 2018, M3Sixty earned fees as follows:
| | | ICSA Fees |
| EAS Fund | | $ 69,952 |
| Global Fund | | 40,311 |
| Income Fund | | 95,686 |
For the period from October 14, 2017 through April 30, 2018 for EAS Fund, M3Sixty earned $94,974. For the period from October 7, 2017 through May 31, 2018 for the Global Fund, M3Sixty earned $68,785.
M3Sixty has also agreed to voluntarily waive certain fees until certain thresholds are met by the Funds. During the periods/year ended September 30, 2018, M3Sixty waived fees as follows:
| | | ICSA Fees Waived |
| EAS Fund | | $ 16,250 |
| Global Fund | | 8,750 |
| Income Fund | | 40,833 |
During the period from October 14, 2017 through April 30, 2018 for the EAS Fund, M3Sixty waived $44,660 of fees. During the period from October 7, 2017 through May 31, 2018 for the Global Fund, M3Sixty waived $39,934 of fees.
Certain officers of the Fund are also employees or officers of M3Sixty.
Prior to the Reorganization, Gemini Fund Services, LLC (“GFS”), an affiliate of Northern Lights Distributors, LLC (the “Predecessor Distributor”), provided administration, fund accounting, and transfer agent services to the Predecessor Funds. Pursuant to separate servicing agreements with GFS, the Predecessor Funds paid GFS customary fees for providing administration, fund accounting and transfer agency services to the Predecessor Fund.
Matrix 360 Distributors, LLC (the “Distributor”) acts as the principal underwriter and distributor (the “Distributor”) of the EAS Fund’s and Global Fund’s shares for the purpose of facilitating the registration of shares of the EAS Fund and the Global Fund under state securities laws and to assist in sales of the EAS Fund’s and the Global Fund’s shares pursuant to a Distribution Agreement (the “Distribution Agreement”) approved by the Trustees. Pursuant to the Reorganization, the Distributor also acts as the principal underwriter and distributor of the Income Fund’s shares. The Distribution Agreement between the Funds and the Distributor requires the Distributor to use all reasonable efforts in connection with the distribution of the Funds’ shares. However, the Distributor has no obligation to sell any specific number of shares and will only sell shares for orders it receives. The Distributor may receive commissions from the sale of the EAS Fund’s Class A shares. During the periods/year ended September 30, 2018, there were no commissions paid to the Distributor. During the period from October 14, 2017 through April 30, 2018 for the EAS Fund and October 7, 2017 through May 31, 2018 for the Global Fund, there were no commissions paid to the Distributor.
The Distributor is an affiliate of M3Sixty.
Prior to the Reorganization, the Predecessor Distributor served as the principal underwriter and national distributor for shares of the Predecessor Funds. The Predecessor Distributor was obligated to sell the shares of the Predecessor Funds on a best efforts basis only against purchase orders for the shares. Shares of the Predecessor Funds were offered to the public on a continuous basis.
The EAS Fund has adopted a Distribution Plan (“Plan”) pursuant to Rule 12b-1 under the 1940 Act for its Class A and Class C shares. The Global Fund has adopted a Plan pursuant to Rule 12b-1 under the Investment Company Act of 1940 for its Investor Class shares. Pursuant to the Reorganization, the Income Fund has adopted a Plan pursuant to Rule 12b-1 under the 1940 Act for its Investor Class shares. Under the Plans, the Funds may use 12b-1 fees to compensate broker-dealers (including, without limitation, the Distributor) for sales of Fund shares, or for other expenses associated with distributing Fund shares. The EAS Fund may expend up to 1.00% for Class C shares and up to 0.25% for Class A shares, the Global Fund may expend up to 0.25% for its Investor shares and the Income Fund may expend up to 0.25% of its Investor shares of the Funds’ average daily net assets annually to pay for any activity primarily intended to result in the sale of shares of the Funds and the servicing of shareholder accounts, provided that the Trustees have approved the category of expenses for which payment is being made.
| Crow Point Funds | ANNUAL REPORT |
NOTES TO THE FINANCIAL STATEMENTS
September 30, 2018
7. ADVISORY FEES AND OTHER RELATED PARTY TRANSACTIONS (continued)
The Plan for the EAS Fund took effect October 14, 2017. The Plans for the Global Fund and the Income Fund took effect October 7, 2017. For the periods/year ended September 30, 2018, the Fund accrued 12b-1 expenses attributable to Class A, Class C and Investor class shares as follows:
| | | Class A | | Class C | | Investor Class |
| EAS Fund | | $ 2,372 | | $ 3,518 | | N/A |
| Global Fund | | N/A | | N/A | | $ 1,623 |
| Income Fund | | N/A | | N/A | | 28,267 |
Prior to the Reorganization, the Predecessor Trust had adopted a Master Distribution and Shareholder Servicing Plan (the “Predecessor Plan”), pursuant to Rule 12b-1 under the 1940 Act, to pay for certain distribution activities and shareholder services. Under the Predecessor Plan, the Predecessor EAS Fund paid 0.25% and 1.00% per year of the average daily net assets of the Predecessor EAS Fund’s Class A and Class C shares, respectively; and the Predecessor Global Fund paid 0.25% per year of the average daily net assets of the Predecessor Global Fund’s Investor Class shares; and the Predecessor Income Fund paid 0.25% per year of the average daily net assets of the Predecessor Income Fund’s Investor Class shares for such distribution and shareholder service activities. During the period from October 1, 2017 through October 6, 2017, pursuant to the Predecessor Plan, the Predecessor Global Fund’s and the Predecessor Income Fund’s Investor Class shares accrued $5,764 and $324, respectively. During the period from October 1, 2017 through October 13, 2017, pursuant to the Predecessor Plan, the Predecessor EAS Fund’s Class A and Class I shares accrued $7,125 and $3,954, respectively.
8. DISTRIBUTIONS TO SHAREHOLDERS AND TAX MATTERS
The tax character of distributions during the periods/year ended September 30, 2018 was as follows:
| | Ordinary Income | | Long-Term Capital Gains |
| EAS Fund | $ — | | $ — |
| Global Fund | — | | — |
| Income Fund | 18,527 | | — |
The tax character of distributions during the year ended April 30, 2018 for the EAS Fund, during the year ended May 31, 2018 for the Global Fund and during the year ended September 30, 2017 for the Income Fund was as follows:
| | Ordinary Income | | Long-Term Capital Gains |
| EAS Fund | $ 131,723 | | $ — |
| Global Fund | 118,777 | | — |
| Income Fund | 139,442 | | — |
The tax character of distributions during the year ended April 30, 2017 for the EAS Fund and during the year ended May 31, 2017 for the Global Fund was as follows:
| | Ordinary Income | | Return of Capital |
| EAS Fund | $ 77,331 | | $ — |
| Global Fund | 197,556 | | 110,214 |
| Crow Point Funds | ANNUAL REPORT |
NOTES TO THE FINANCIAL STATEMENTS
September 30, 2018
8. DISTRIBUTIONS TO SHAREHOLDERS AND TAX MATTERS (continued)
The tax character of distributable earnings (deficit) at September 30, 2018, the Funds’ most recent fiscal periods/year end, was as follows:
| | Undistributed Ordinary Income | Post-October Loss and Late Year Loss | Capital Loss Carry Forwards | Other Book/Tax Differences | Unrealized
Appreciation/ (Depreciation) | Total Distributable Earnings/(Deficit) |
| EAS Fund | $ — | $ — | $ (449,667) | $ (39,510) | $ 1,423,252 | $ 934,075 |
| Global Fund | 73,120 | — | (847,732) | (4,563) | 807,471 | 28,296 |
| Income Fund | — | — | (1,500,040) | (23,796) | 84,546 | (1,439,290) |
The difference between book basis and tax basis undistributed net investment income (loss), accumulated net realized loss, and unrealized appreciation from investments is primarily attributable to the tax deferral of losses on wash sales and straddles, and adjustments for partnerships, real estate investment trusts, grantor trusts and C-Corporation return of capital distributions. In addition, the amount listed under other book/tax differences for the Fund is primarily attributable to the tax deferral of losses on straddles and adjustments for constructive sales of securities held short.
Capital losses incurred after October 31 within the fiscal year are deemed to arise on the first business day of the following fiscal year for tax purposes. The Funds did not defer any capital losses.
At September 30, 2018, the Fund had capital loss carry forwards for federal income tax purposes available to offset future capital gains as follows:
| | | | Non-Expiring Short-Term | | Non-Expiring Long-Term | | Total |
| | EAS Fund | | $ 449,667 | | $ — | | $ 449,667 |
| | Global Fund | | 847,730 | | 2 | | 847,732 |
| | Income Fund | | 1,455,893 | | 44,147 | | 1,500,040 |
Permanent book and tax differences, primarily attributable to the book/tax basis treatment of foreign currency gains/(losses), and adjustments for paydowns, C-Corporation return of capital distributions, real estate investment trusts, grantor trusts, partnerships, and the capitalization of in lieu dividend payments, resulted in reclassifications for the periods/year ended September 30, 2018 as follows:
| | | Paid-in Capital | | Undistributed Net Investment
Income | | Accumulated Net Realized Loss |
| EAS Fund | | $ (145,722) | | $ 146,839 | | $ (1,117) |
| Global Fund | | — | | 5,132 | | (5,132) |
| Income Fund | | (3,242) | | 6,727 | | (3,485) |
For U.S. Federal income tax purposes, the cost of securities owned, gross appreciation, gross depreciation, and net unrealized appreciation/(depreciation) of investments at September 30, 2018 were as follows:
| | | Cost | | Gross Appreciation | | Gross Depreciation | | Net Appreciation |
| EAS Fund | | $ 22,357,870 | | $ 2,203,563 | | $ (780,699) | | $ 1,422,864 |
| Global Fund | | 16,009,323 | | 1,013,342 | | (206,143) | | 807,199 |
| Income Fund | | 8,777,974 | | 208,505 | | (123,959) | | 84,546 |
The difference between book basis and tax basis undistributed net investment income (loss), accumulated net realized loss, and unrealized appreciation from investments is primarily attributable to the tax deferral of losses on wash sales and straddles, and adjustments for partnerships, real estate investment trusts, grantor trusts and C-Corporation return of capital distributions.
| Crow Point Funds | ANNUAL REPORT |
NOTES TO THE FINANCIAL STATEMENTS
September 30, 2018
9. COMMITMENTS AND CONTINGENCIES
In the normal course of business, the Trust may enter into contracts that may contain a variety of representations and warranties and provide general indemnifications. The Trust’s maximum exposure under these arrangements is dependent on future claims that may be made against the Funds and, therefore, cannot be estimated; however, management considers the risk of loss from such claims to be remote.
10. SUBSEQUENT EVENTS
In accordance with GAAP, Management has evaluated the impact of all subsequent events on the Funds through the date the financial statements were issued, and has determined that there were no subsequent events requiring recognition or disclosure in the financial statements.
11. RECENT ACCOUNTING PRONOUNCEMENTS
In August 2018, the Financial Accounting Standards Board (“FASB”) issued Accounting Standards Update (ASU) No. 2018-13 “Fair Value Measurement (Topic 820): Disclosure Framework – Changes to the Disclosure Requirements for Fair Value Measurement” (“ASU 2018-13”) which includes amendments intended to improve the effectiveness of disclosures in the notes to financial statements. For example, ASU 2018-13 includes additional disclosures regarding the range and weighted average of significant unobservable inputs used to develop Level 3 fair value measurements, and clarifications to the narrative description of measurement uncertainty disclosures. ASU 2018-13 is effective for interim and annual periods beginning after December 15, 2019. Management is currently evaluating the impact that ASU 2018- 13 will have on the Funds’ financial statements and related disclosures.
In March 2017, the FASB issued ASU No. 2017-08, Receivables—Nonrefundable Fees and Other Costs (Subtopic 310-20): Premium Amortization on Purchased Callable Debt Securities. The amendments in the ASU shorten the amortization period for certain callable debt securities, held at a premium, to be amortized to the earliest call date. The ASU does not require an accounting change for securities held at a discount; which continues to be amortized to maturity. The ASU is effective for fiscal years and interim periods within those fiscal years beginning after December 15, 2018. Management is currently evaluating the impact, if any, of applying this provision.

REPORT OF INDEPENDENT REGISTERED PUBLIC ACCOUNTING FIRM
To the Board of Trustees of 360 Funds
and the Shareholders of EAS Crow Point Alternatives Fund,
Crow Point Global Tactical Allocation Fund, and
Crow Point Alternative Income Fund
Opinion on the Financial Statements
We have audited the accompanying statements of assets and liabilities of EAS Crow Point Alternatives Fund (the “EAS Fund”), Crow Point Global Tactical Allocation Fund (the “Global Fund”) (f/k/a Crow Point Defined Risk Global Equity Income Fund), and Crow Point Alternative Income Fund (the “Income Fund”), each a series of shares of beneficial interest in 360 Funds (the “Funds”), including the schedules of investments, as of September 30, 2018, and the related statements of operations for each of the year or periods presented, and the statements of changes in net assets for each of the years or periods presented ending in 2018.. We have also audited the financial highlights for the EAS Fund for period ended September 30, 2018 and the year ended April 30, 2018, the financial highlights for the Global Fund for the period ended September 30, 2018 and the period ended May 31, 2018, and the financial highlights for the Income Fund for each the years in the five year period ended September 30, 2018, as well as the related notes (all of these statements and notes referred to in the previous two sentences are collectively referred to as the “financial statements”). In our opinion, the financial statements present fairly, in all material respects, the financial position of the Funds as of September 30, 2018, and the results of their operations, the changes in their net assets and their financial highlights for each of the years or periods described above, in conformity with accounting principles generally accepted in the United States of America. The statement of changes in net assets for the year ended April 30, 2017 and the financial highlights for each of the years in the four-year period then ended for the EAS Fund were audited by other auditors, whose report dated June 29, 2017, expressed an unqualified opinion on such financial statement and financial highlights. The statement of changes in net assets for the year ended May 31, 2017 and the financial highlights for each of the years in the four-year period then ended for the Global Fund were audited by other auditors, whose report dated July 31, 2017, expressed an unqualified opinion on such financial statement and financial highlights.
Basis for Opinion
These financial statements are the responsibility of the Funds’ management. Our responsibility is to express an opinion on the Funds’ financial statements based on our audits. We are a public accounting firm registered with the Public Company Accounting Oversight Board (United States) (“PCAOB”) and are required to be independent with respect to the Funds in accordance with the U.S. federal securities law and the applicable rules and regulations of the Securities and Exchange Commission and the PCAOB.
We conducted our audits in accordance with the standards of the PCAOB. Those standards require that we plan and perform the audits to obtain reasonable assurance about whether the financial statements are free of material misstatement, whether due to error or fraud. The Funds are not required to have, nor were we engaged to perform, an audit of their internal control over financial reporting. As part of our audits we are required to obtain an understanding of internal control over financial reporting but not for the purpose of expressing an opinion on the effectiveness of the Funds’ internal control over financial reporting. Accordingly, we express no such opinion.
Our audits included performing procedures to assess the risk of material misstatement of the financial statements, whether due to error or fraud, and performing procedures that respond to those risks. Such procedures included examining, on a test basis, evidence regarding the amounts and disclosures in the financial statements. Our procedures included confirmation of securities owned as of September 30, 2018 by correspondence with the custodian, brokers, other appropriate parties, or by other appropriate auditing procedures where replies from brokers were not received. Our audits also included evaluating the accounting principles used and significant estimates made by management, as well as evaluating the overall presentation of the financial statements. We believe that our audits provide a reasonable basis for our opinion.

BBD, LLP
We have served as the auditor of one or more of the Funds in the 360 Funds since 2018.
Philadelphia, Pennsylvania
November 29, 2018
| Crow Point Funds | ANNUAL REPORT |
ADDITIONAL INFORMATION
September 30, 2018 (Unaudited)
The Funds file their complete schedules of portfolio holdings with the Securities and Exchange Commission (the “Commission”) for the first and third quarters of each fiscal year on Forms N-Q. The Funds’ Forms N-Q are available on the Commission’s website at http://www.sec.gov. The Funds’ Forms N-Q may be reviewed and copied at the Commission’s Public Reference Room in Washington, DC. Information on the operation of the Commission’s Public Reference Room may be obtained by calling 1-800-SEC-0330.
A description of the policies and procedures that the Funds use to determine how to vote proxies relating to portfolio securities is available without charge, upon request, by calling 1-877-244-6235; and on the Commission’s website at http://www.sec.gov.
Information regarding how the Funds voted proxies relating to portfolio securities during the most recent 12-month period ended June 30th is available without charge, upon request, by calling 1-877-244-6235; and on the Commission’s website at http://www.sec.gov.
Shareholder Tax Information - The Funds are required to advise you within 60 days of the Funds’ fiscal year end regarding the federal tax status of distributions received by shareholders during the fiscal year. The Income Fund paid $18,527 of ordinary income distributions during the year ended September 30, 2018. The EAS Fund and the Global Fund did not pay any distributions during the periods/year ended September 30, 2018.
Tax information is reported from the Funds’ fiscal year and not calendar year, therefore, shareholders should refer to their Form 1099-DIV or other tax information which will be mailed in 2019 to determine the calendar year amounts to be included on their 2018 tax returns. Shareholders should consult their own tax advisors.
SPECIAL MEETING OF SHAREHOLDERS
On September 21, 2018, a Special Meeting of Shareholders of the Trust was held for the purpose of voting on the following proposal:
Proposal 1: To elect six Trustees to the Board of Trustees of the Trust. The Nominees are as follows:
Arthur Falk
Tom M. Wirtshafter
Gary DiCenzo
Steven D. Poppen
Randall K. Linscott
Thomas J. Schmidt
The total number of shares of the Trust present in person or by proxy represented approximately 67.37% of the Trust’s shares entitled to vote at the Special Meeting. The shareholders of the Trust voted to approve Proposal 1. The votes cast by the Trust’s shareholders with respect to Proposal 1 were as follows:
| Proposal 1 | For | Against | Abstain |
| Arthur Falk | 11,600,022 | 726 | 180,762 |
| Tom M. Wirtshafter | 11,600,022 | 726 | 180,762 |
| Gary DiCenzo | 11,600,022 | 726 | 180,762 |
| Steven D. Poppen | 11,598,966 | — | 180,762 |
| Randall K. Linscott | 11,600,022 | — | 180,762 |
| Thomas J. Schmidt | 11,600,022 | — | 180,762 |
| Crow Point Funds | ANNUAL REPORT |
ADDITIONAL INFORMATION
September 30, 2018 (Unaudited)
BOARD OF TRUSTEES, OFFICERS AND PRINCIPAL SHAREHOLDERS - (Unaudited)
The Trustees are responsible for the management and supervision of the Fund. The Trustees approve all significant agreements between the Trust, on behalf of the Fund, and those companies that furnish services to the Fund; review performance of the Fund; and oversee activities of the Fund. The Statement of Additional Information of the Trust includes additional information about the Fund’s Trustees and is available upon request, without charge, by calling (877) 244-6235.
Trustees and Officers. Following are the Trustees and Officers of the Trust, their age and address, their present position with the Trust or the Funds, and their principal occupation during the past five years. Each of the Trustees of the Trust will generally hold office indefinitely. The Officers of the Trust will hold office indefinitely, except that: (1) any Officer may resign or retire and (2) any Officer may be removed any time by written instrument signed by at least two-thirds of the number of Trustees prior to such removal. In case a vacancy or an anticipated vacancy on the Board of Trustees shall for any reason exist, the vacancy shall be filled by the affirmative vote of a majority of the remaining Trustees, subject to certain restrictions under the 1940 Act. Those Trustees who are “interested persons” (as defined in the 1940 Act) by virtue of their affiliation with either the Trust or the Adviser, are indicated in the table. The address of each trustee and officer is 4300 Shawnee Mission Parkway, Suite 100, Fairway, KS 66205.
Name, Address and Year of
Birth (“YOB”) | Position(s)
Held with
Trust | Length of
Service | Principal Occupation(s) During Past 5 Years | Number
of Series
Overseen | Other Directorships
During Past 5 Years |
| Independent Trustees |
Arthur Q. Falk YOB : 1937 | Trustee and Independent Chairman | Since 2011 | Retired. President, Murray Hill Financial Marketing, (financial marketing consultant) (1990–2012). | Twelve | None |
Tom M. Wirtshafter YOB : 1954 | Trustee | Since 2011 | Senior Vice President, American Portfolios Financial Services, (broker-dealer), American Portfolios Advisors (investment adviser) (2009–Present). | Twelve | None |
Gary W. DiCenzo YOB: 1962 | Trustee | Since 2014 | Chief Executive Officer, Cognios Capital (investment management firm) (2015-present); President and CEO, IMC Group, LLC (asset management firm consultant) (2010-2015). | Twelve | FNEX Ventures (1) |
Steven D. Poppen YOB : 1968 | Trustee | Since 2018 | Executive Vice President and Chief Financial Officer, Minnesota Vikings (professional sports organization) (1998-present). | Twelve | M3Sixty Funds Trust (3) |
Thomas J. Schmidt YOB: 1963 | Trustee | Since 2018 | Principal, Tom Schmidt & Associates Consulting, LLC (2015-Present); Vice President of the Mutual Fund and Alternative Investment Full Service Transfer Agent (1986-2014). | Twelve | None |
| Interested Trustee* | | | | | |
Randall K. Linscott YOB: 1971 | President | Since 2013 | Chief Executive Officer, M3Sixty Administration, LLC (2013 – present); Chief Operating Officer, M3Sixty Administration, LLC (2011–2013); Division Vice President, Boston Financial Data Services, (2005–2011). | Twelve | N/A |
* The Interested Trustee is an Interested Trustee because he is an officer and employee of the Administrator.
| Crow Point Funds | ANNUAL REPORT |
ADDITIONAL INFORMATION
September 30, 2018 (Unaudited)
BOARD OF TRUSTEES, OFFICERS AND PRINCIPAL SHAREHOLDERS - (Unaudited) (continued)
Name, Address and Year of
Birth (“YOB”) | Position(s)
Held with
Trust | Length of Service | Principal Occupation(s) During Past 5 Years | Number
of Series
Overseen | Other Directorships
During Past 5 Years |
Officers | | | | | |
Andras P. Teleki YOB: 1971 | Chief Compliance Officer and Secretary | Since 2015 | Chief Legal Officer, M3Sixty Administration, LLC, M3Sixty Holdings, LLC, Matrix 360 Distributors, LLC and M3Sixty Advisors, LLC (2015–present); Chief Compliance Officer and Secretary, M3Sixty Funds Trust (2016–present); Chief Compliance Officer and Secretary, WP Trust (2016-present); Secretary and Assistant Treasurer, Capital Management Investment Trust (2015–present); Partner, K&L Gates, (2009–2015). | N/A | N/A |
Brandon J. Byrd YOB: 1981 | Assistant Secretary and Anti-Money Laundering Officer Vice President | Since 2013 Since 2018 | Chief Operating Officer, M3Sixty Administration, LLC (2013-present); Anti-Money Laundering Compliance Officer, Monteagle Funds (2015-2016); Division Manager - Client Service Officer, Boston Financial Data Services (mutual find service provider) (2010-2012). | N/A | N/A |
Justin J. Thompson YOB: 1983 | Treasurer | Since 2017 | Director of Fund Accounting & Administration, M3Sixty Administration, LLC (2017-present); Treasurer, WP Trust (2017-present); Treasurer, Capital Management Investment Trust (2017-present); Treasurer, 360 Funds (2017-present); Officer of Fund Accounting – State Street Bank & Trust (2009-2016). | N/A | N/A |
Larry E. Beaver, Jr. YOB: 1969 | Assistant Treasurer | Since 2017 | Fund Accounting, Administration and Tax Officer, M3Sixty Administration, LLC (2017- present); Director of Fund Accounting & Administration, M3Sixty Administration, LLC (2005-2017). Chief Accounting Officer, Amidex Funds, Inc. (2003-present); Treasurer and Assistant Secretary, Capital Management Investment Trust (2008-2017). Treasurer, 360 Funds (2007-2017); Treasurer, M3Sixty Funds Trust (2015-2017); Treasurer, WP Trust (2015-2017); Treasurer and Chief Financial Officer, Monteagle Funds (2008-2016). | N/A | N/A |
John H. Lively YOB: 1969 | Assistant Secretary | Since 2017 | Attorney, Practus, LLP (law firm) (May 2018-present); Attorney, The Law Offices of John H. Lively & Associates, Inc. (law firm) (2010-May 2018). | N/A | N/A |
Ted L. Akins YOB: 1974 | Assistant Secretary | Since 2017 | Vice President of Operations, M3Sixty Administration, LLC (2012-present). | N/A | N/A |
| Crow Point Funds | ANNUAL REPORT |
ADDITIONAL INFORMATION
September 30, 2018 (Unaudited)
BOARD OF TRUSTEES, OFFICERS AND PRINCIPAL SHAREHOLDERS - (Unaudited) (continued)
Remuneration Paid to Trustees and Officers - Officers of the Trust and Trustees who are “interested persons” of the Trust or the Adviser will receive no salary or fees from the Trust. Officers of the Trust and interested Trustees do receive compensation directly from certain service providers to the Trust, including Matrix 360 Distributors, LLC and M3Sixty Administration, LLC. Each Trustee who is not an “interested person” receives a fee of $1,500 each year plus $200 per Board or committee meeting attended. The Trust reimburses each Trustee and officer for his or her travel and other expenses relating to attendance at such meetings.
| Name of Trustee1 | Aggregate
Compensation From each Fund2 | Pension or Retirement
Benefits Accrued As Part
of Portfolio Expenses | Estimated
Annual Benefits
Upon
Retirement | Total Compensation From the Funds Paid to Trustees2 |
| Independent Trustees |
| Arthur Falk | $ 2,500 | None | None | $ 7,500 |
| Thomas Krausz 3 | $ 2,300 | None | None | $ 6,900 |
| Tom M. Wirtshafter | $ 2,300 | None | None | $ 6,900 |
| Gary W. DiCenzo | $ 2,300 | None | None | $ 6,900 |
| Steven D. Poppen | None | None | None | None |
| Thomas J. Schmidt | None | None | None | None |
| Interested Trustees and Officers |
| Randall K. Linscott | None | Not Applicable | Not Applicable | None |
| | | | | | |
1 Each of the Trustees serves as a Trustee to each Series of the Trust. The Trust currently offers twelve (12) series of shares.
2 Figures are for the period from October 7, 2017 through September 30, 2018.
3 Resigned as Independent Trustee effective July 13, 2018.
| Crow Point Funds | ANNUAL REPORT |
Information About Your Funds’ Expenses – (Unaudited)
As a shareholder of the Funds, you incur two types of costs: (1) transaction costs, such as the sales charge (load) imposed on certain subscriptions and the contingent deferred sales charge (“CDSC”) and redemption fees imposed on certain short-term redemptions; and (2) ongoing costs, including management fees, distribution and/or service (12b-1) fees; and other Fund expenses. The example below is intended to help you understand your ongoing costs (in dollars) of investing in the Funds and to compare these costs with the ongoing costs of investing in other mutual funds.
The example is based on an investment of $1,000 invested at the beginning of the period and held for the entire period as indicated below.
Actual Expenses – The first section of the table provides information about actual account values and actual expenses (relating to the example $1,000 investment made at the beginning of the period). You may use the information in this section, together with the amount you invested, to estimate the expenses that you paid over the period. Simply divide your account value by $1,000 (for example, an $8,600 account value divided by $1,000 = 8.6), then multiply the result by the number in the first section under the heading entitled “Expenses Paid During Period” to estimate the expenses you paid on your account during this period.
Hypothetical Example for Comparison Purposes – The second section of the table provides information about the hypothetical account values and hypothetical expenses based on the Funds’ actual expense ratios and an assumed rate of return of 5% per year before expenses, which is not the Funds’ actual return. The hypothetical account values and expenses may not be used to estimate the actual ending account balance or expenses you paid for the period. You may use this information to compare the ongoing costs of investing in the Funds to other funds. To do so, compare this 5% hypothetical example with the 5% hypothetical examples that appear in the shareholder reports of the other funds.
Please note that the expenses shown in the table are meant to highlight your ongoing costs only and do not reflect any transactional costs, such as sales charges (loads), CDSC fees, or exchange fees. Therefore, the second section of the table is useful in comparing ongoing costs only, and will not help you determine the relative total costs of owning different funds. In addition, if these transactional costs were included, your costs would have been higher. For more information on transactional costs, please refer to the Funds’ prospectuses.
| Expenses and Value of a $1,000 Investment for the period from 04/01/18 through 09/30/18 |
| | | | | |
| EAS Fund: | Beginning Account
Value (04/01/2018) | Annualized Expense
Ratio for the Period | Ending Account
Value (09/30/2018) | Expenses Paid
During Period (a) |
| Actual Fund Return (in parentheses) | | | |
| Class A (+7.24%) | $1,000.00 | 2.05% | $1,072.40 | $10.65 |
| Class C (+6.91%) | $1,000.00 | 2.80% | $1,069.10 | $14.52 |
| Class I (+7.30%) | $1,000.00 | 1.80% | $1,073.00 | $ 9.35 |
| Hypothetical 5% Return | | | |
| Class A | $1,000.00 | 2.05% | $1,014.80 | $10.35 |
| Class C | $1,000.00 | 2.80% | $1,011.00 | $14.12 |
| Class I | $1,000.00 | 1.80% | $1,016.00 | $ 9.10 |
| | | | | |
| Global Fund: | Beginning Account
Value (04/01/2018) | Annualized Expense
Ratio for the Period | Ending Account
Value (09/30/2018) | Expenses Paid
During Period (a) |
| Actual Fund Return (in parentheses) | | | |
| Investor Class (+5.76%) | $1,000.00 | 1.30% | $1,057.60 | $ 6.71 |
| Institutional Class (+5.94%) | $1,000.00 | 1.05% | $1,059.40 | $ 5.42 |
| Hypothetical 5% Return | | | |
| Investor Class | $1,000.00 | 1.30% | $1,018.60 | $ 6.58 |
| Institutional Class | $1,000.00 | 1.05% | $1,019.80 | $ 5.32 |
| Crow Point Funds | ANNUAL REPORT |
Information About Your Fund’s Expenses – (Unaudited) (continued)
| | Expenses and Value of a $1,000 Investment for the period from 04/01/18 through 09/30/18 |
| Income Fund: | Beginning Account
Value (04/01/2018) | Annualized Expense
Ratio for the Period | Ending Account
Value (09/30/2018) | Expenses Paid
During Period (a) |
| Actual Fund Return (in parentheses) | | | |
| Investor Class (+1.20%) | $1,000.00 | 2.24% | $1,012.00 | $11.30 |
| Hypothetical 5% Return | | | |
| Investor Class | $1,000.00 | 2.24% | $1,013.80 | $11.31 |
| | | | | | |
| (a) | Expenses are equal to the Funds’ annualized expense ratios, multiplied by the average account value over the period, multiplied by 183/365 to reflect the one-half year period. |
For more information on Fund expenses, please refer to the Funds’ prospectuses, which can be obtained from your investment representative or by calling 1-877-244-6235. Please read them carefully before you invest or send money.
Total EAS Fund operating expense ratios as stated in the current EAS Fund prospectus dated August 28, 2018 for the EAS Fund were as follows: |
| EAS Crow Point Alternatives Fund Class A, gross of fee waivers or expense reimbursements | 4.28% |
| EAS Crow Point Alternatives Fund Class A, after waiver and reimbursement* | 3.23% |
| EAS Crow Point Alternatives Fund Class C, gross of fee waivers or expense reimbursements | 4.95% |
| EAS Crow Point Alternatives Fund Class C, after waiver and reimbursement* | 3.98% |
| EAS Crow Point Alternatives Fund Class I, gross of fee waivers or expense reimbursements | 3.93% |
| EAS Crow Point Alternatives Fund Class I, after waiver and reimbursement* | 2.98% |
| | |
Pursuant to an operating expense limitation agreement between Crow Point Partners, LLC (the “Adviser”) and the Fund, the Adviser has agreed to waive or reduce its fees and to assume other expenses of the Fund, if necessary, in an amount that limits “Total Annual Fund Operating Expenses” (exclusive of interest, expenses incurred under a plan of distribution adopted pursuant to Rule 12b-1 under the 1940 Act, taxes, acquired fund fees and expenses, brokerage commissions, dividend expenses short sales and other expenditures which are capitalized in accordance with generally accepted accounting principles and other extraordinary expenses not incurred in the ordinary course of such Fund’s business) to not more than 1.70% of the average daily net assets of each share class of the Fund through January 31, 2020. This operating expense limitation agreement can be terminated only by, or with the consent of, the Board of Trustees. The Adviser is permitted to receive reimbursement of any excess expense payments paid by it pursuant to the operating expense limitation agreement in future years on a rolling three-year basis, as long as the reimbursement does not cause the Fund’s annual operating expenses to exceed the expense cap. Total Gross Operating Expenses during the period ended September 30, 2018 were 3.17%, 3.92% and 2.92% for the EAS Crow Point Alternatives Fund Class A, Class C and Class I shares, respectively. Please see the Information About Your Fund’s Expenses, the Financial Highlights and Notes to Financial Statements (Note 7) sections of this report for expense related disclosures during the period ended September 30, 2018. |
| Crow Point Funds | ANNUAL REPORT |
Information About Your Fund’s Expenses – (Unaudited) (continued)
Total Global Fund operating expense ratios as stated in the current Global Fund prospectus dated September 28, 2018 were as follows: |
| Crow Point Global Tactical Allocation Fund Investor Class, gross of fee waivers or expense reimbursements | 4.00% |
| Crow Point Global Tactical Allocation Fund Investor Class, after waiver and reimbursement* | 1.93% |
| Crow Point Global Tactical Allocation Fund Institutional Class, gross of fee waivers or expense reimbursements | 3.78% |
| Crow Point Global Tactical Allocation Fund Institutional Class, after waiver and reimbursement* | 1.72% |
| | |
Pursuant to an operating expense limitation agreement between Crow Point Partners, LLC (the “Adviser”) and the Fund, the Adviser has agreed to waive or reduce its fees and to assume other expenses of the Fund, if necessary, in an amount that limits “Total Annual Fund Operating Expenses” (exclusive of interest, expenses incurred under a plan of distribution adopted pursuant to Rule 12b-1 under the 1940 Act, taxes, acquired fund fees and expenses, brokerage commissions, dividend expenses short sales and other expenditures which are capitalized in accordance with generally accepted accounting principles and other extraordinary expenses not incurred in the ordinary course of such Fund’s business) to not more than 1.35% of the average daily net assets of each share class of the Fund through January 31, 2020. This operating expense limitation agreement can be terminated only by, or with the consent of, the Board of Trustees. The Adviser is permitted to receive reimbursement of any excess expense payments paid by it pursuant to the operating expense limitation agreement in future years on a rolling three-year basis, as long as the reimbursement does not cause the Fund’s annual operating expenses to exceed the expense cap. Total Gross Operating Expenses during the period ended September 30, 2018 were 2.94% and 2.69% for the Crow Point Global Tactical Allocation Fund Investor Class and Institutional Class shares, respectively. Please see the Information About Your Fund’s Expenses, the Financial Highlights and Notes to Financial Statements (Note 7) sections of this report for expense related disclosures during the period ended September 30, 2018. |
Total Income Fund operating expense ratios as stated in the current Income Fund prospectus dated January 29, 2018 for the Income Fund were as follows: |
| Crow Point Alternative Income Fund Investor Class, gross of fee waivers or expense reimbursements | 4.60% |
| Crow Point Alternative Income Fund Investor Class, after waiver and reimbursement* | 2.60% |
| | |
Crow Point Partners, LLC (the “Adviser”), the Fund’s adviser, has contractually agreed to waive its fees and reimburse expenses of the Fund, at least until January 31, 2019 to ensure that Total Annual Fund Operating Expenses After Fee Waiver and Reimbursement (exclusive of any front-end or contingent deferred loads, taxes, brokerage fees and commissions, borrowing costs (such as interest and dividend expense on securities sold short), acquired fund fees and expenses, or extraordinary expenses such as litigation) will not exceed 2.25% of the Fund’s average daily net assets. These fee waivers and expense reimbursements are subject to possible recoupment from the Fund within the three years after the fiscal year end during which the fees have been waived or reimbursed, if such recoupment can be achieved within the foregoing expense limits. This agreement may be terminated only by the Fund’s Board of Trustees, on 60 days’ written notice to the Fund’s adviser. Total Gross Operating Expenses during the year ended September 30, 2018 were 3.34% for the Crow Point Alternative Income Fund Investor Class. Please see the Information About Your Fund’s Expenses, the Financial Highlights and Notes to Financial Statements (Note 7) sections of this report for expense related disclosures during the year ended September 30, 2018. |
360 FUNDS
4300 Shawnee Mission Pkwy
Suite 100
Fairway, KS 66205
INVESTMENT ADVISER
Crow Point Partners, LLC
25 Recreation Drive
Suite 206
Hingham, MA 02043
ADMINISTRATOR & TRANSFER AGENT
M3Sixty Administration, LLC
4300 Shawnee Mission Pkwy
Suite 100
Fairway, KS 66205
DISTRIBUTOR
Matrix 360 Distributors, LLC
4300 Shawnee Mission Pkwy
Suite 100
Fairway, KS 66205
INDEPENDENT REGISTERED PUBLIC ACCOUNTING FIRM
BBD, LLP
1835 Market Street
3rd Floor
Philadelphia, PA 19103
LEGAL COUNSEL
Practus, LLP
11300 Tomahawk Creek Parkway
Suite 310
Leawood, KS 66211
CUSTODIAN BANK
Fifth Third Bank
Fifth Third Center
38 Fountain Square Plaza
Cincinnati, OH 45263
| (a) | The registrant has, as of the end of the periods covered by this report, adopted a code of ethics that applies to the registrant's principal executive officer, principal financial officer, and principal accounting officer or controller, or persons performing similar functions, regardless of whether these individuals are employed by the registrant or a third party. |
| (b) | During the period covered by this report, there were no amendments to any provision of the code of ethics. |
| (c) | During the period covered by this report, there were no waivers or implicit waivers of a provision of the code of ethics. |
| (d) | The registrant’s Code of Ethics is filed herewith. |
| ITEM 3. | AUDIT COMMITTEE FINANCIAL EXPERT. |
| | The registrant's Board of Trustees has determined that Tom Wirtshafter serves on its audit committee as the “audit committee financial expert” as defined in Item 3. |
| ITEM 4. | PRINCIPAL ACCOUNTANT FEES AND SERVICES. |
(a) | Audit Fees. The aggregate fees billed for the period ended September 30, 2018 and each of the last two fiscal years ended April 30, 2018 and April 30, 2017 for professional services rendered by the principal accountants for the audit of the EAS Fund’s annual financial statements or for services that are normally provided by the accountant in connection with statutory and regulatory filings or engagements were $8,900 with respect to the period ended September 30, 2018, $12,700 with respect to the registrant’s fiscal year ended April 30, 2018 and $14,200 with respect to the registrant’s fiscal year ended April 30, 2017. |
| | The aggregate fees billed for the period ended September 30, 2018 and each of the last two fiscal years ended May 31, 2018 and May 31, 2017 for professional services rendered by the principal accountants for the audit of the Global Fund’s annual financial statements or for services that are normally provided by the accountant in connection with statutory and regulatory filings or engagements were $8,900 with respect to the period ended September 30, 2018, $12,700 with respect to the registrant’s fiscal year ended May 31, 2018 and $13,750 with respect to the registrant’s fiscal year ended May 31, 2017. The aggregate fees billed for each of the last two fiscal years ended September 30, 2018 and September 30, 2017 for professional services rendered by the principal accountants for the audit of the Income Fund’s annual financial statements or for services that are normally provided by the accountant in connection with statutory and regulatory filings or engagements were $12,700 with respect to the fiscal year ended September 30, 2018 and $14,700 with respect to the registrant’s fiscal year ended September 30, 2017. |
| (b) | Audit-Related Fees. There were no fees billed during the last two fiscal years/periods for assurances and related services by the principal accountants that are reasonably related to the performance of the audit of the registrant’s financial statements and are not reported under paragraph (a) of this item. |
| (c) | Tax Fees. The aggregate fees billed for the period ended September 30, 2018 and each of the last two fiscal years ended April 30, 2018 and April 30, 2017 for professional services rendered by the principal accountant to the EAS Fund for tax compliance, tax advice and tax planning were $3,000 with respect to the period ended September 30, 2018, $3,000 with respect to the fiscal year ended April 30, 2018 and $3,100 with respect to the fiscal year ended April 30, 2017. The services comprising these fees are the preparation of the registrant’s federal and state income tax returns, review of calculations of required excise distributions and preparation of federal excise tax returns. The aggregate fees billed for the period ended September 30, 2018 and each of the last two fiscal years ended May 31, 2018 and May 31, 2017 for professional services rendered by the principal accountant to the Global Fund for tax compliance, tax advice and tax planning were $3,000 with respect to the period ended September 30, 2018, $3,000 with respect to the fiscal year ended May 31, 2018 and $2,800 with respect to the fiscal year ended May 31, 2017. The services comprising these fees are the preparation of the registrant’s federal and state income tax returns, review of calculations of required excise distributions and preparation of federal excise tax returns. The aggregate fees billed for each of the last two fiscal years ended September 30, 2018 and September 30, 2017 for professional services rendered by the principal accountant to the Global Fund for tax compliance, tax advice and tax planning were $3,000 with respect to the fiscal year ended September 30, 2018 and $2,200 with respect to the fiscal year ended September 30, 2017. The services comprising these fees are the preparation of the registrant’s federal and state income tax returns, review of calculations of required excise distributions and preparation of federal excise tax returns. |
| (d) | All Other Fees. The aggregate fees billed in the period ended September 30, 2018 and for the last two fiscal years ended April 30, 2018 and April 30, 2017 for the EAS Fund; the period ended September 30, 2018 and for the last two fiscal years ended May 31, 2018 and May 31, 2017 for the Global Fund; and for the last two fiscal years ended September 30, 2018 and September 30, 2017 for the Income Fund for products and services provided by the registrant’s principal accountant, other than the services reported in paragraphs (a) through (c) of this item were $0 for all periods and fiscal years mentioned above. |
| (e)(1) | The audit committee does not have pre-approval policies and procedures. Instead, the audit committee or audit committee chairman approves on a case-by-case basis each audit or non-audit service before the principal accountant is engaged by the registrant. |
| (e)(2) | There were no services described in each of paragraphs (b) through (d) of this Item that were approved by the audit committee pursuant to paragraph (c)(7)(i)(C) of Rule 2-01 of Regulation S-X |
| f) | Not applicable. The percentage of hours expended on the principal accountant's engagement to audit the registrant's financial statements for the most recent fiscal year that were attributed to work performed by persons other than the principal accountant's full-time, permanent employees was zero percent (0%). |
| (g) | All non-audit fees billed by the registrant's principal accountant for services rendered to the registrant for the period ended September 30, 2018 and for the last two fiscal years ended April 30, 2018 and April 30, 2017 for the EAS Fund; the period ended September 30, 2018 and for the last two fiscal years ended May 31, 2018 and May 31, 2017 for the Global Fund; and for the last two fiscal years ended September 30, 2018 and September 30, 2017 for the Income Fund are disclosed in (b)-(d) above. There were no audit or non-audit services performed by the registrant's principal accountant for the registrant's adviser during the periods and fiscal years mentioned above. |
| (h) | There were no non-audit services rendered to the registrant’s investment adviser. |
| ITEM 5. | AUDIT COMMITTEE OF LISTED REGISTRANTS. |
Not applicable
| ITEM 6. | SCHEDULES OF INVESTMENTS |
Included in annual report to shareholders filed under item 1 of this form.
| ITEM 7. | DISCLOSURE OF PROXY VOTING POLICIES AND PROCEDURES FOR CLOSED-END MANAGEMENT INVESTMENT COMPANIES. |
Not applicable Fund is an open-end management investment company
| ITEM 8. | PORTFOLIO MANAGERS OF CLOSED-END MANAGEMENT INVESTMENT COMPANIES |
Not applicable Fund is an open-end management investment company
| ITEM 9. | PURCHASES OF EQUITY SECURITIES BY CLOSED-END MANAGEMENT INVESTMENT COMPANY AND AFFILIATED PURCHASERS. |
Not applicable Fund is an open-end management investment company
| ITEM 10. | SUBMISSION OF MATTERS TO A VOTE OF SECURITY HOLDERS. |
On September 21, 2018, a Special Meeting of Shareholders of the Trust was held for the purpose of voting on the following proposal:
Proposal 1: To elect six Trustees to the Board of Trustees of the Trust. The Nominees are as follows:
Arthur Falk
Tom M. Wirtshafter
Gary DiCenzo
Steven D. Poppen
Randall K. Linscott
Thomas J. Schmidt
The total number of shares of the Trust present in person or by proxy represented approximately 67.37% of the Trust’s shares entitled to vote at the Special Meeting. The shareholders of the Trust voted to approve Proposal 1. The votes cast by the Trust’s shareholders with respect to Proposal 1 were as follows:
| Proposal 1 | For | Against | Abstain |
| Arthur Falk | 11,600,022 | 726 | 180,762 |
| Tom M. Wirtshafter | 11,600,022 | 726 | 180,762 |
| Gary DiCenzo | 11,600,022 | 726 | 180,762 |
| Steven D. Poppen | 11,598,966 | - | 180,762 |
| Randall K. Linscott | 11,600,022 | - | 180,762 |
| Thomas J. Schmidt | 11,600,022 | - | 180,762 |
| ITEM 11. | CONTROLS AND PROCEDURES. |
| (a) | The registrant's principal executive and principal financial officers, or persons performing similar functions, have concluded that the registrant's disclosure controls and procedures (as defined in Rule 30a-3(c) under the 1940 Act, are effective, as of a date within 90 days of the filing date of this report, based on the evaluation of these controls and procedures required by Rule 30a-3(b) under the 1940 Act and Rule 15d-15(b) under the Securities Exchange Act of 1934, as amended. |
| (b) | There were no changes in the registrant's internal control over financial reporting (as defined in Rule 30a-3(d) under the 1940 Act) that occurred during the period covered by this report that have materially affected, or are reasonably likely to materially affect, the registrant's internal control over financial reporting. |
| ITEM 12. | DISCLOSURE OF SECURITIES LENDING ACTIVITIES FOR CLOSED-END MANAGEMENT INVESTMENT COMPANIES. |
Not applicable, Fund is an open-end management investment company
SIGNATURES
Pursuant to the requirements of the Securities Exchange Act of 1934 and the Investment Company Act of 1940, the registrant has duly caused this report to be signed on its behalf by the undersigned, thereunto duly authorized.
360 Funds
/s/ Randy Linscott
| By Randy Linscott | |
| Principal Executive Officer | |
| Date: December 10, 2018 | |
Pursuant to the requirements of the Securities Exchange Act of 1934 and the Investment Company Act of 1940, this report has been signed below by the following person on behalf of the registrant and in the capacities and on the date indicated.
/s/ Justin Thompson
| By Justin Thompson | |
| Principal Financial Officer | |
| Date: December 10, 2018 | |