UNITED STATES
SECURITIES AND EXCHANGE COMMISSION
Washington, D.C. 20549
FORM N-CSR
CERTIFIED SHAREHOLDER REPORT OF REGISTERED MANAGEMENT INVESTMENT COMPANIES
Investment Company Act File Number 811-21726
360 Funds
(Exact name of registrant as specified in charter)
4300 Shawnee Mission Parkway, Suite 100 Fairway, KS | 66205 |
(Address of principal executive offices) | (Zip code) |
The Corporation Trust Company
Corporation Trust Center
1209 Orange St.
Wilmington, DE 19801
(Name and address of agent for service)
With Copies To:
John H. Lively
Practus, LLP
11300 Tomahawk Creek Parkway, Suite 310
Leawood, KS 66211
Registrant’s telephone number, including area code:800-934-5550
Date of fiscal year end: 06/30/2020
Date of reporting period:12/31/2019
ITEM 1. REPORTS TO SHAREHOLDERS
The Semi-Annual report to Shareholders of the IMS Family of Funds (the “Funds”), series of the 360 Funds (the “registrant”), for the period ended December 31, 2019 pursuant to Rule 30e-1 under the Investment Company Act of 1940 (the “1940 Act”), as amended (17 CFR 270.30e-1) is filed herewith.
| | IMS Capital Value Fund IMS Strategic Income Fund IMS Dividend Growth Fund | |
Semi-Annual Report
December 31, 2019
Fund Advisor:
IMS Capital Management, Inc.
8995 S.E. Otty Road
Portland, OR 97086
Toll Free (800) 934-5550
IMPORTANT NOTE: Beginning on January 1, 2021, as permitted by regulations adopted by the SEC, paper copies of the IMS Family of Funds’ shareholder reports will no longer be sent by mail unless you specifically request paper copies of the reports from an IMS Fund or from your financial intermediary, such as a broker-dealer or bank. Instead, the reports will be made available on a website, and you will be notified by mail each time a report is posted and provided with a website link to access the report. If you already elected to receive shareholder reports electronically, you will not be affected by this change and you need not take any action. You may elect to receive all future reports in paper free of charge. You can inform an IMS Fund or your financial intermediary that you wish to continue receiving paper copies of your shareholder reports by calling or sending an e-mail request. Your election to receive reports in paper will apply to all funds held with the IMS Family of Funds complex/your financial intermediary.
INVESTMENT RESULTS – (Unaudited)
| | Average Annual Total Returns | |
| | (for periods ended December 31, 2019) | |
| | One Year | | Five Year | | Ten Year | |
| IMS Capital Value Fund* | 32.45% | | 6.65% | | 8.10% | |
| S&P 500® Index** | 31.49% | | 11.69% | | 13.55% | |
| | | | | | | |
| Total annual operating expenses, as disclosed in the Fund’s current prospectus dated October 28, 2019, were 1.80% of average daily net assets. The Advisor has contractually agreed to waive its management fee and/or reimburse expenses so that total annual fund operating expenses (excluding interest, taxes, brokerage fees and commissions, other expenditures that are capitalized in accordance with generally accepted accounting principles, acquired fund fees and expenses, other extraordinary expenses not incurred in the ordinary course of the Value Fund’s business, interest and dividend expense on securities sold short, and amounts, if any payable pursuant to a plan adopted in accordance with Rule 12b-1 under the Investment Company Act of 1940, as amended (the “1940 Act”)) do not exceed 1.95% of the Value Fund’s average daily net assets through October 31, 2020, subject to the Advisor’s right to recoup payments on a rolling three-year basis so long as the payment would not exceed the 1.95% expense cap. This expense cap agreement may be terminated by either party upon 60 days’ written notice prior to the end of the then-current term of the agreement. |
The performance quoted represents past performance, which does not guarantee future results. The investment return and principal value of an investment will fluctuate so that an investor’s shares, when redeemed, may be worth more or less than their original cost. The returns shown do not reflect the deduction of taxes that a shareholder would pay on Fund distributions or the redemption of Fund shares. Current performance of the Fund may be lower or higher than the performance quoted.The Fund’s investment objectives, risks, charges and expenses must be considered carefully before investing. Performance data current to the most recent month end may be obtained by calling Shareholder Services at 1-800-934-5550.
| * | Return figures reflect any change in price per share and assume the reinvestment of all distributions. |
| ** | The S&P 500® Index is a widely recognized unmanaged index of equity prices and is representative of a broader market and range of securities than is found in the Fund’s portfolio. Individuals cannot invest directly in the Index; however, an individual can invest in exchange-traded funds or other investment vehicles that attempt to track the performance of a benchmark index. The annual total returns included for the above Fund are net of the total annual operating expenses for the Fund, while no annual operating expenses are deducted for S&P 500®Index. |
INVESTMENT RESULTS – (Unaudited)
| | Average Annual Total Returns | |
| | (for periods ended December 31, 2019) | |
| | One Year | | Five Year | | Ten Year | |
| IMS Strategic Income Fund* | 15.96% | | (5.56)% | | (1.03)% | |
| Bloomberg Barclays U.S. Aggregate Bond Index** | 8.72% | | 3.05% | | 3.74% | |
| | | | | | | |
| Total annual operating expenses, as disclosed in the Fund’s current prospectus dated October 28, 2019, were 4.29% of average daily net assets (1.98% after fee waivers/expense reimbursements by the Advisor). The Advisor contractually agreed to waive its management fee and/or reimburse expenses so that total annual fund operating expenses (excluding interest, taxes, brokerage fees and commissions, other expenditures that are capitalized in accordance with generally accepted accounting principles, acquired fund fees and expenses, other extraordinary expenses not incurred in the ordinary course of the Income Fund’s business, interest and dividend expense on securities sold short, and amounts, if any payable pursuant to a plan adopted in accordance with Rule 12b-1 under the 1940 Act) do not exceed 1.95% of the Income Fund’s average daily net assets through October 31, 2020, subject to the Advisor’s right to recoup payments on a rolling three-year basis so long as the payment would not exceed the 1.95% expense cap. This expense cap agreement may be terminated by either party upon 60 days’ written notice prior to the end of the then-current term of the agreement. |
The performance quoted represents past performance, which does not guarantee future results. The investment return and principal value of an investment will fluctuate so that an investor’s shares, when redeemed, may be worth more or less than their original cost. The returns shown do not reflect the deduction of taxes that a shareholder would pay on Fund distributions or the redemption of Fund shares. Current performance of the Fund may be lower or higher than the performance quoted.The Fund’s investment objectives, risks, charges and expenses must be considered carefully before investing. Performance data current to the most recent month end may be obtained by calling Shareholder Services at 1-800-934-5550.
| * | Return figures reflect any change in price per share and assume the reinvestment of all distributions. |
| ** | The Bloomberg Barclays U.S. Aggregate Bond Index is a widely-used indicator of the bond market. The index is market capitalization-weighted and is made up of U.S. bonds that are primarily investment grade, which has a greater number of securities than is found in the Fund’s portfolio. Individuals cannot invest directly in the Index; however, an individual can invest in exchange-traded funds or other investment vehicles that attempt to track the performance of a benchmark index. The annual total returns included for the above Fund are net of the total annual operating expenses for the Fund, while no annual operating expenses are deducted for the Bloomberg Barclays U.S. Aggregate Bond Index. |
INVESTMENT RESULTS – (Unaudited)
| | Average Annual Total Returns | |
| | (for periods ended December 31, 2019) | |
| | One Year | | Five Year | | Ten Year | |
| IMS Dividend Growth Fund* | 29.89% | | 7.76% | | 9.55% | |
| S&P 500® Index** | 31.49% | | 11.69% | | 13.55% | |
| | | | | | | |
| Total annual operating expenses, as disclosed in the Fund’s current prospectus dated October 28, 2019, were 2.47% of average daily net assets (1.96% after fee waivers/expense reimbursements by the Advisor). The Advisor has contractually agreed to waive its management fee and/or reimburse expenses so that total annual fund operating expenses (excluding interest, taxes, brokerage fees and commissions, other expenditures that are capitalized in accordance with generally accepted accounting principles, acquired fund fees and expenses, other extraordinary expenses not incurred in the ordinary course of the Growth Fund’s business, interest and dividend expense on securities sold short, and amounts, if any payable pursuant to a plan adopted in accordance with Rule 12b-1 under the 1940 Act) do not exceed 1.95% of the Growth Fund’s average daily net assets through October 31, 2020, subject to the Advisor’s right to recoup payments on a rolling three-year basis so long as the payment would not exceed the 1.95% expense cap. This expense cap agreement may be terminated by either party upon 60 days’ written notice prior to the end of the then-current term of the agreement. |
The performance quoted represents past performance, which does not guarantee future results. The investment return and principal value of an investment will fluctuate so that an investor’s shares, when redeemed, may be worth more or less than their original cost. The returns shown do not reflect the deduction of taxes that a shareholder would pay on Fund distributions or the redemption of Fund shares. Current performance of the Fund may be lower or higher than the performance quoted.The Fund’s investment objectives, risks, charges and expenses must be considered carefully before investing. Performance data current to the most recent month end may be obtained by calling Shareholder Services at 1-800-934-5550.
| * | Return figures reflect any change in price per share and assume the reinvestment of all distributions. |
| ** | The S&P 500® Index is a widely recognized unmanaged index of equity prices and has a greater number of securities than is found in the Fund’s portfolio. Individuals cannot invest directly in the Index; however, an individual can invest in exchange-traded funds or other investment vehicles that attempt to track the performance of a benchmark index. The annual total returns included for the above Fund are net of the total operating expenses for the Fund, while no annual operating expenses are deducted for the S&P 500 Index. |
FUND HOLDINGS –(Unaudited)
IMS Capital Value Fund Holdings as of December 31, 20191
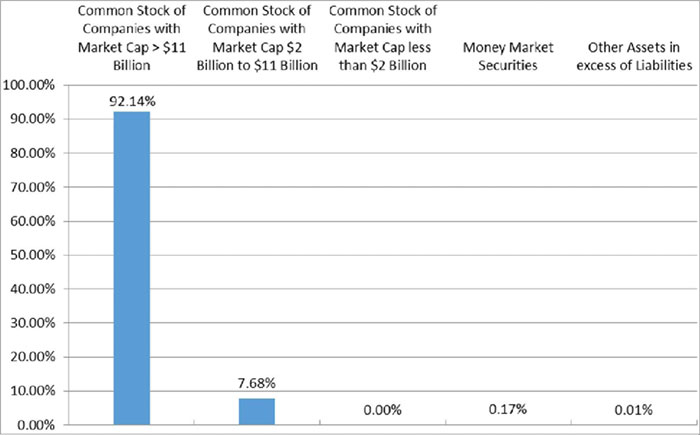
1As a percent of net assets.
The investment objective of the IMS Capital Value Fund is long-term growth from capital appreciation and, secondarily, income from dividends. The IMS Capital Value Fund typically invests in mid-cap securities, which the Advisor defines as those with a market capitalization of approximately $2 billion to $11 billion, and in large-cap securities, which the Advisor defines as those with a market capitalization of greater than $11 billion.
FUND HOLDINGS –(Unaudited) (continued)
IMS Strategic Income Fund Holdings as of December 31, 20191

1As a percent of net assets.
The investment objective of the IMS Strategic Income Fund is current income, and a secondary objective of capital appreciation. In pursuing its investment objectives, the Strategic Income Fund generally invests in corporate bonds, government bonds, dividend-paying common stocks, preferred and convertible preferred stocks, income trusts (including business trusts, oil royalty trusts and real estate investment trusts), money market instruments and cash equivalents. The Strategic Income Fund may also invest in structured products, such as reverse convertible notes, a type of structured note, and in 144A securities that are purchased in private placements and thus are subject to restrictions on resale (either as a matter of contract or under federal securities laws), but only where the Advisor has determined that a liquid trading market exists. Under normal circumstances, the Strategic Income Fund will invest at least 80% of its assets in dividend paying or other income producing securities.
FUND HOLDINGS –(Unaudited) (continued)
IMS Dividend Growth Fund Holdings as of December 31, 20191
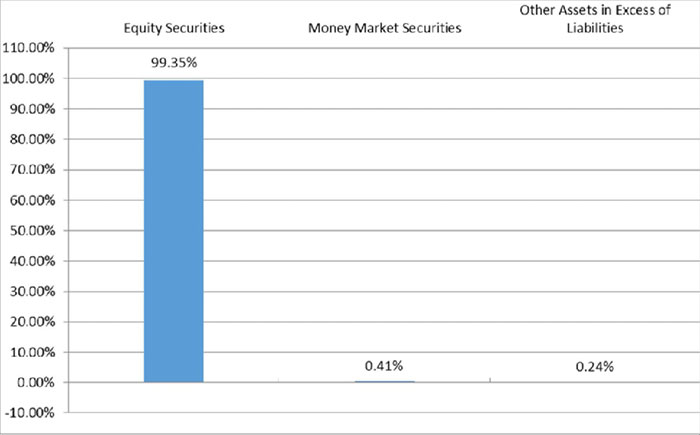
1As a percent of net assets.
The investment objective of the IMS Dividend Growth Fund is long-term growth from capital appreciation and dividends. The Dividend Growth Fund invests primarily in a diversified portfolio of dividend–paying common stocks. The Dividend Growth Fund’s Advisor, IMS Capital Management, Inc., employs a combination of fundamental, technical and macro market research to identify companies that the Advisor believes have the ability to maintain or increase their dividend payments, because of their significant cash flow production.
Availability of Portfolio Schedules – (Unaudited)
The Funds file their complete schedules of portfolio holdings with the Securities and Exchange Commission (“SEC”) for the first and third quarters of each fiscal year on Form N-Q. The Funds’ Forms N-Q are available at the SEC’s website at www.sec.gov. The Funds’ Forms N-Q may be reviewed and copied at the Public Reference Room in Washington, DC. Information on the operation of the Public Reference Room may be obtained by calling 1-800-SEC-0330.
Summary of Funds’ Expenses – (Unaudited)
As a shareholder of the Funds, you incur two types of costs: (1) transaction costs, such as short-term redemption fees; and (2) ongoing costs, including management fees and other Fund expenses. This Example is intended to help you understand your ongoing costs (in dollars) of investing in the Funds and to compare these costs with the ongoing costs of investing in other mutual funds.
The example is based on an investment of $1,000 invested at the beginning of the period and held for the entire period (July 1, 2019 through December 31, 2019).
Actual Expenses
The first line of the table below provides information about actual account values and actual expenses. You may use the information in this line, together with the amount you invested, to estimate the expenses that you paid over the period. Simply divide your account value by $1,000 (for example, an $8,600 account value divided by $1,000 = 8.60), then multiply the result by the number in the first line under the heading entitled “Expenses Paid During Period” to estimate the expenses you paid on your account during this period.
Hypothetical Example for Comparison Purposes
The second line of the table below provides information about hypothetical account values and hypothetical expenses based on the Funds’ actual expense ratios and an assumed rate of return of 5% per year before expenses, which are not the Funds’ actual returns. The hypothetical account values and expenses may not be used to estimate the actual ending account balance or expenses you paid for the period. You may use this information to compare the ongoing costs of investing in the Funds and other funds. To do so, compare this 5% hypothetical example with the 5% hypothetical examples that appear in the shareholder reports of other funds.
Please note that the expenses shown in the table are meant only to highlight your ongoing costs and do not reflect any transactional costs, such as short-term redemption fees. Therefore, the second line is only useful in comparing ongoing costs only and will not help you determine the relative costs of owning different funds. In addition, if these transactions costs were included, your costs would have been higher.
| | | | | | | |
| IMS Funds | Beginning
Account Value
July 1, 2019 | Ending Account
Value
December 31, 2019 | Expenses Paid
During the Period*
July 1, 2019 –
December 31, 2019 |
| Capital Value Fund | | | | | | |
| Actual (+9.37%) | $1,000.00 | | $1,093.70 | | $ 9.37 | |
| Hypothetical** | $1,000.00 | | $1,016.20 | | $ 9.02 | |
| Strategic Income Fund | | | | | | |
| Actual (+1.98)% | $1,000.00 | | $1,019.80 | | $ 9.95 | |
| Hypothetical** | $1,000.00 | | $1,015.30 | | $ 9.93 | |
| Dividend Growth Fund | | | | | | |
| Actual (+11.20%) | $1,000.00 | | $1,112.00 | | $ 10.41 | |
| Hypothetical** | $1,000.00 | | $1,015.30 | | $ 9.93 | |
| * | Expenses are equal to the Funds’ annualized expense ratios, multiplied by the average account value over the period, multiplied by 184/366 (to reflect the one-half year period). The annualized expense ratios for the Capital Value Fund, Strategic Income Fund, and the Dividend Growth Fund were 1.78%, 1.96%, and 1.96%, respectively. |
| ** | Assumes a 5% annual return before expenses. |
| IMS CAPITAL VALUE FUND |
| SCHEDULE OF INVESTMENTS |
| December 31, 2019 (Unaudited) |
| | | | | | | |
| COMMON STOCK - 99.82% | | Shares | | | Fair Value | |
| | | | | | | |
| Communication Services - 9.79% | | | | | | | | |
| Alphabet, Inc. - Class C(a) | | | 315 | | | $ | 421,161 | |
| AT&T, Inc. | | | 14,000 | | | | 547,120 | |
| Comcast Corp. - Class A | | | 10,000 | | | | 449,700 | |
| Electronic Arts, Inc.(a) | | | 3,357 | | | | 360,911 | |
| Facebook, Inc. - Class A(a) | | | 2,277 | | | | 467,354 | |
| Verizon Communications, Inc. | | | 8,065 | | | | 495,191 | |
| Walt Disney Co. | | | 2,300 | | | | 332,649 | |
| | | | | | | | 3,074,086 | |
| Consumer Discretionary - 10.72% | | | | | | | | |
| Amazon.com, Inc.(a) | | | 191 | | | | 352,937 | |
| Dollar Tree, Inc.(a) | | | 7,955 | | | | 748,168 | |
| Domino’s Pizza, Inc. | | | 1,715 | | | | 503,833 | |
| Home Depot, Inc. | | | 2,239 | | | | 488,953 | |
| Service Corp. International | | | 9,125 | | | | 420,024 | |
| Starbucks Corp. | | | 4,562 | | | | 401,091 | |
| Yum! Brands, Inc. | | | 4,455 | | | | 448,752 | |
| | | | | | | | 3,363,758 | |
| Consumer Staples - 6.16% | | | | | | | | |
| Constellation Brands, Inc. | | | 2,200 | | | | 417,450 | |
| Energizer Holdings, Inc. | | | 12,200 | | | | 612,684 | |
| Kraft Heinz Co. | | | 13,200 | | | | 424,116 | |
| Wal-Mart Stores, Inc. | | | 4,039 | | | | 479,995 | |
| | | | | | | | 1,934,245 | |
| Energy - 5.75% | | | | | | | | |
| Apache Corp. | | | 10,700 | | | | 273,813 | |
| Exxon Mobile Corp. | | | 5,900 | | | | 411,702 | |
| Helmerich & Payne, Inc. | | | 5,100 | | | | 231,693 | |
| HollyFrontier Corp. | | | 10,200 | | | | 517,242 | |
| Occidential Petroleum Corp. | | | 9,000 | | | | 370,890 | |
| | | | | | | | 1,805,340 | |
| Financials - 14.79% | | | | | | | | |
| American International Group | | | 7,400 | | | | 379,842 | |
| Bank of America Corp. | | | 19,495 | | | | 686,614 | |
| Capital One Financial Corp. | | | 5,174 | | | | 532,456 | |
| Goldman Sachs Group, Inc. | | | 2,500 | | | | 574,825 | |
| JPMorgan Chase & Co. | | | 4,700 | | | | 655,180 | |
| New York Community Bancorp, Inc. | | | 29,511 | | | | 354,722 | |
| PNC Financial Service Group, Inc. | | | 3,410 | | | | 544,338 | |
| US Bancorp/MN | | | 8,420 | | | | 499,222 | |
| Wells Fargo & Co. | | | 7,700 | | | | 414,260 | |
| | | | | | | | 4,641,459 | |
| IMS CAPITAL VALUE FUND |
| SCHEDULE OF INVESTMENTS |
| December 31, 2019 (Unaudited) |
| COMMON STOCK - 99.82% (continued) | | Shares | | | Fair Value | |
| | | | | | | |
| Health Care - 16.68% | | | | | | | | |
| AbbVie, Inc. | | | 7,200 | | | $ | 637,488 | |
| Amgen, Inc. | | | 2,500 | | | | 602,675 | |
| Bristol-Myers Squibb Co. | | | 10,380 | | | | 666,292 | |
| Cardinal Health Inc. | | | 10,000 | | | | 505,800 | |
| Edwards Lifesciences Corp.(a) | | | 2,125 | | | | 495,741 | |
| Gilead Sciences, Inc. | | | 3,900 | | | | 253,422 | |
| IDEXX Laboratories, Inc.(a) | | | 1,750 | | | | 456,978 | |
| Johnson & Johnson | | | 3,700 | | | | 539,719 | |
| UnitedHealth Group, Inc. | | | 1,900 | | | | 558,562 | |
| Zoetis, Inc. | | | 3,915 | | | | 518,150 | |
| | | | | | | | 5,234,827 | |
| Industrials - 9.16% | | | | | | | | |
| 3M Co. | | | 2,700 | | | | 476,334 | |
| Boeing Co. | | | 1,100 | | | | 358,336 | |
| FedEx Corp. | | | 2,600 | | | | 393,146 | |
| General Electric Co. | | | 48,200 | | | | 537,912 | |
| Kansas City Southern | | | 3,819 | | | | 584,918 | |
| Stanley Black & Decker, Inc. | | | 3,166 | | | | 524,733 | |
| | | | | | | | 2,875,379 | |
| Information Technology - 22.52% | | | | | | | | |
| Advanced Micro Devices, Inc.(a) | | | 12,500 | | | | 573,250 | |
| Apple, Inc. | | | 2,035 | | | | 597,578 | |
| Cisco Systems, Inc. | | | 9,300 | | | | 446,028 | |
| Fidelity National Information Services | | | 2,800 | | | | 389,452 | |
| Intel Corp. | | | 10,000 | | | | 598,500 | |
| International Business Machines, Inc. | | | 2,800 | | | | 375,312 | |
| Mastercard, Inc. - Class A | | | 1,900 | | | | 567,321 | |
| Microsoft Corp. | | | 3,900 | | | | 615,030 | |
| NortonLifeLock, Inc. | | | 12,300 | | | | 313,896 | |
| NVIDIA Corp. | | | 2,776 | | | | 653,193 | |
| PayPal Holdings, Inc.(a) | | | 4,000 | | | | 432,680 | |
| QUALCOMM, Inc. | | | 6,156 | | | | 543,144 | |
| Texas Instruments, Inc. | | | 3,100 | | | | 397,699 | |
| Visa, Inc. - Class A | | | 3,000 | | | | 563,700 | |
| | | | | | | | 7,066,783 | |
| Materials - 2.74% | | | | | | | | |
| El Du Pont de Nemours & Co. | | | 6,000 | | | | 385,200 | |
| International Paper Co. | | | 10,300 | | | | 474,315 | |
| | | | | | | | 859,515 | |
| Utilities - 1.51% | | | | | | | | |
| Vistra Energy Corp. | | | 20,593 | | | | 473,433 | |
| | | | | | | | | |
| TOTAL COMMON STOCK (Cost $24,211,776) | | | | | | | 31,328,825 | |
| IMS CAPITAL VALUE FUND |
| SCHEDULE OF INVESTMENTS |
| December 31, 2019 (Unaudited) |
| | | Shares | | | Fair Value | |
| MONEY MARKET SECURITIES - 0.17% | | | | | | | | |
| Federated Government Obligations Fund - Institutional Shares, 1.48%(b) | | | 55,099 | | | $ | 55,099 | |
| | | | | | | | | |
| TOTAL MONEY MARKET SECURITIES (Cost $55,099) | | | | | | | 55,099 | |
| | | | | | | | | |
| TOTAL INVESTMENTS AT VALUE (Cost $24,266,875) - 99.99% | | | | | | $ | 31,383,924 | |
| OTHER ASSETS IN EXCESS OF LIABILITIES, NET - 0.01% | | | | | | | 2,939 | |
| NET ASSETS - 100.00% | | | | | | $ | 31,386,863 | |
Percentages are stated as a percent of net assets.
(a)Non-income producing security.
(b)Rate shown represents the 7-day yield at December 31, 2019, is subject to change and resets daily.
See accompanying notes which are an integral part of these financial statements.
| IMS STRATEGIC INCOME FUND |
| SCHEDULE OF INVESTMENTS |
| December 31, 2019 (Unaudited) |
| | | Shares | | | Fair Value | |
| COMMON STOCK - 16.14% | | | | | | | | |
| | | | | | | | | |
| Consumer Staples - 2.35% | | | | | | | | |
| Altria Group, Inc. | | | 3,700 | | | $ | 184,667 | |
| | | | | | | | | |
| Financials - 4.68% | | | | | | | | |
| Legg Mason, Inc. | | | 5,100 | | | | 183,141 | |
| Umpqua Holdings Corp. | | | 10,400 | | | | 184,080 | |
| | | | | | | | 367,221 | |
| Health Care - 2.38% | | | | | | | | |
| Cardinal Health, Inc. | | | 3,700 | | | | 187,146 | |
| | | | | | | | | |
| Information Technology - 2.01% | | | | | | | | |
| Broadcom, Inc. | | | 500 | | | | 158,010 | |
| | | | | | | | | |
| Materials - 2.37% | | | | | | | | |
| Nucor Corp. | | | 3,300 | | | | 185,724 | |
| | | | | | | | | |
| Utilities - 2.35% | | | | | | | | |
| Portland General Electric Co. | | | 3,300 | | | | 184,107 | |
| | | | | | | | | |
| TOTAL COMMON STOCK (Cost $1,292,837) | | | | | | | 1,266,875 | |
| | | | | | | |
| | | Principal Amount | | | Fair Value | |
| CORPORATE BONDS - 55.40% | | | | | | | | |
| BAT Capital Corp., 4.758%, due 09/06/2049 | | $ | 200,000 | | | $ | 206,791 | |
| Bombardier, Inc., 6.000%, due 10/15/2022 | | | 250,000 | | | | 249,925 | |
| California Resources Corp., 8.000% due 12/15/2022(c) | | | 350,000 | | | | 150,500 | |
| Century Link, Inc., 7.600%, due 09/15/2039 | | | 200,000 | | | | 209,000 | |
| DISH DBS Corp., 7.750%, due 07/01/2026 | | | 220,000 | | | | 233,066 | |
| Ford Motor Co., 4.750%, due 01/15/2043 | | | 220,000 | | | | 195,530 | |
| General Electric Co., 5.000%, Fixed to Variable Perpetual Bond(b) (l) | | | 320,000 | | | | 313,427 | |
| Genworth Holdings, Inc., 7.625%, due 09/24/2021 | | | 125,000 | | | | 131,675 | |
| HollyFrontier Corp., 5.875%, due 04/01/2026 | | | 300,000 | | | | 338,439 | |
| Mattel Inc., 6.200%, due 10/01/2040 | | | 230,000 | | | | 209,300 | |
| Mercer International, Inc. 5.500%, due 01/15/2026 | | | 200,000 | | | | 203,500 | |
| Nordstrom Inc., 5.000%, due 01/15/2044 | | | 200,000 | | | | 196,056 | |
| PetSmart, Inc., 7.125%, due 03/15/2023(c) | | | 200,000 | | | | 196,000 | |
| Realogy Group LLC, 9.375%, due 04/01/2027 | | | 225,000 | | | | 234,779 | |
| Hospitality Properties Trust, 3.950%, due 01/15/2028 | | | 200,000 | | | | 195,158 | |
| Tenet Healthcare Corp., 7.000%, due 08/01/2025 | | | 200,000 | | | | 211,250 | |
| Tenneco, Inc., 5.000%, due 07/15/2026 | | | 350,000 | | | | 322,000 | |
| Under Armour, Inc., 3.250%, due 06/15/2026 | | | 250,000 | | | | 243,264 | |
| United States Steel Corp., 6.650%, due 06/01/2037 | | | 230,000 | | | | 186,300 | |
| Vector Group Ltd., 6.125%, due 02/01/2025(c) | | | 125,000 | | | | 122,969 | |
| | | | | | | | | |
| TOTAL CORPORATE BONDS (Cost $4,329,638) | | | | | | | 4,348,929 | |
| | | | | | | | | |
| FOREIGN BONDS DENOMINATED IN US DOLLARS - 0.87% | | | | | | | | |
| Cash Store Financial Services, Inc., 11.500%, 01/31/2017 - Canada(a) (c) (d) (e) (f) | | | 1,289,000 | | | | 68,291 | |
| | | | | | | | | |
| TOTAL FOREIGN BONDS DENOMINATED IN US DOLLARS (Cost $1,120,977) | | | | | | | 68,291 | |
| IMS STRATEGIC INCOME FUND |
| SCHEDULE OF INVESTMENTS |
| December 31, 2019 (Unaudited) |
| | | | | | | |
| | | Principal Amount | | | Fair Value | |
| STRUCTURED NOTES - 15.09% | | | | | | | | |
| Citigroup Global Markets Holdings, Inc. Callable Fixed to Float Range Accrual Note, 8.000%, 12/26/2033(g) | | $ | 300,000 | | | $ | 292,920 | |
| Morgan Stanley Fixed to Floating Rate Leveraged CMS and Index Linked Note, 1.320%, 08/30/2028(b) (h) | | | 350,000 | | | | 264,250 | |
| Natixis US Medium-Term Note Program LLC Callable Fixed to Floating Capped Range Accrual Note, 0.483%, 10/31/2034(b) (i) | | | 500,000 | | | | 322,500 | |
| Societe Generale SA Callable Fixed to Floating Rate CMS and Index Linked Note, 10.000%, 06/28/2034 - France(j) | | | 325,000 | | | | 304,428 | |
| | | | | | | | | |
| TOTAL STRUCTURED NOTES (Cost $1,458,090) | | | | | | | 1,184,098 | |
| | | | | | | |
| | | Shares | | | Fair Value | |
| MONEY MARKET SECURITIES - 11.30% | | | | | | | | |
| Federated Government Obligations Fund - Institutional Shares, 1.48%(k) | | | 886,749 | | | | 886,749 | |
| | | | | | | | | |
| TOTAL MONEY MARKET SECURITIES (Cost $886,749) | | | | | | | 886,749 | |
| | | | | | | | | |
| TOTAL INVESTMENTS AT VALUE (Cost $9,088,291) - 98.79% | | | | | | $ | 7,754,942 | |
| OTHER ASSETS IN EXCESS OF LIABILITIES, NET - 1.21% | | | | | | | 95,289 | |
| NET ASSETS - 100.00% | | | | | | $ | 7,850,231 | |
Percentages are stated as a percent of net assets.
(a)This security is currently valued by the Advisor using fair valuation procedures approved by the Board of Trustees under the oversight of the Fair Valuation Committee.
(b)Variable rate security. Rate shown represents the rate in effect at December 31, 2019.
(c)Security exempted from registration under Rule 144A of the Securities Act of 1933. The security may be resold in transactions exempt from registration, normally to qualified institutional investors.
(d)Non-income producing security.
(e)Security is illiquid at December 31, 2019, at which time the aggregate value of illiquid securities is $68,291 or 0.87% of net assets.
(f)Issue is in default.
(g)On each coupon payment date occurring during the first year following issuance of the securities, the securities will pay a fixed coupon of 8.00% per annum, regardless of the CMS spread or the level of the underlying indices. Beginning in March 2020, the variable coupon rate will be determined as follows: Contingent rate of 8.000% multiplied by the number of days the accrual condition is met divided by the number of days in the accrual period, subject to the Maximum Interest Rate of 8.000% and the Minimum Interest Rate of 0.000%. The accrual condition will be satisfied on an elapsed day if, and only if, (i) the CMS spread is greater than the CMS spread barrier on that elapsed day and (ii) the closing level of each underlying index is greater than or equal to its accrual barrier level on that elapsed day.
(h)The variable rate is equal to 5 times the difference, if any, between the 30-Year Constant Maturity Swap Rate (“30CMS”) and the 2-year Constant Maturity Swap Rate (“2CMS”) as determined on the CMS reference determination date at the start of the quarterly interest payment period; subject to a maximum interest rate of 12.00% per annum for each interest payment period during the floating rate interest period and the minimum interest rate of 0.00% per annum.
(i)The variable rate is determined by multiplying (a) the product of the Multiplier and the applicable CMS30/CMS2 Spread determined as of the reference date at the start of the interest period, and subject to the minimum interest rate of 0.00% and the maximum interest rate of 10.00%, by (b) a fraction equal to the number of calendar days in such interest period with respect to which the closing level of the S&P 500® Index is greater than or equal to 60% of its closing level on trade date divided by the number of calendar days in such interest period.
(j)For each Interest Period commencing on or after the Original Issue Date through January 2021 (the “Fixed Rate Period”), the interest rate per annum will be equal to the Fixed Interest Rate of 10.000%. For each Interest Period beginning in January 2021 (the “Floating Rate Period”), the interest rate per annum will be equal to the product of (a) the 30-Year Constant Maturity Swap Rate minus the 2-Year Constant Maturity Swap Rate multiplied by the number of days the accrual condition is met divided by the number of days in the accrual period and (b) the Multiplier rate of 50, subject to the Maximum Interest Rate of 10.000% and the Minimum Interest Rate of 0.000%. The accrual condition is satisfied on days where RTY and SX7E are greater than or equal to 60% of the initial index level.
(k)Variable rate security. Rate shown represents the 7-day yield at December 31, 2019 and resets daily.
(l)With respect to the Fixed Rate Period ending January 21, 2021, interest will be paid at a rate of 5.00% per annum, payable semi-annually. Effective January 21, 2021, interest will be paid based on a floating rate equal to three-month LIBOR plus 3.33% per annum, payable quarterly.
See accompanying notes which are an integral part of these financial statements.
| IMS DIVIDEND GROWTH FUND |
| SCHEDULE OF INVESTMENTS |
| December 31, 2019 (Unaudited) |
| COMMON STOCK - 99.35% | | Shares | | | Fair Value | |
| | | | | | | |
| Communication Services - 4.06% | | | | | | | | |
| Alphabet Inc. - Class C(a) | | | 130 | | | $ | 173,813 | |
| Walt Disney Co. | | | 1,400 | | | | 202,482 | |
| | | | | | | | 376,295 | |
| Consumer Discretionary - 10.45% | | | | | | | | |
| General Motors Co. | | | 4,000 | | | | 146,400 | |
| McDonald’s Corp. | | | 750 | | | | 148,207 | |
| NVR, Inc.(a) | | | 42 | | | | 159,953 | |
| TJX Cos, Inc. | | | 6,000 | | | | 366,360 | |
| Whirlpool Corp. | | | 1,000 | | | | 147,530 | |
| | | | | | | | 968,450 | |
| Consumer Staples - 7.81% | | | | | | | | |
| Altria Group, Inc. | | | 6,110 | | | | 304,950 | |
| Kraft Heinz, Co. | | | 3,000 | | | | 96,390 | |
| Philip Morris International, Inc. | | | 3,796 | | | | 323,002 | |
| | | | | | | | 724,342 | |
| Financials - 19.84% | | | | | | | | |
| Axis Capital Holdings Ltd. | | | 2,500 | | | | 148,600 | |
| Bank of America Corp. | | | 10,000 | | | | 352,200 | |
| BlackRock, Inc. | | | 600 | | | | 301,620 | |
| CME Group, Inc. | | | 1,400 | | | | 281,008 | |
| M&T Bank Corp. | | | 1,300 | | | | 220,675 | |
| S&P Global, Inc. | | | 1,700 | | | | 464,185 | |
| State Street Corp. | | | 900 | | | | 71,190 | |
| | | | | | | | 1,839,478 | |
| Health Care - 16.78% | | | | | | | | |
| Abbott Laboratories | | | 3,500 | | | | 304,010 | |
| AbbVie, Inc. | | | 5,000 | | | | 442,700 | |
| Cardinal Health, Inc. | | | 2,034 | | | | 102,880 | |
| Danaher Corp. | | | 1,750 | | | | 268,590 | |
| Johnson & Johnson | | | 3,000 | | | | 437,610 | |
| | | | | | | | 1,555,790 | |
| Industrials - 12.85% | | | | | | | | |
| Boeing Co. | | | 300 | | | | 97,728 | |
| Copa Holdings SA - Class A - Panama | | | 1,000 | | | | 108,080 | |
| Lockheed Martin Corp. | | | 1,100 | | | | 428,318 | |
| Parker-Hannifin Corp. | | | 1,000 | | | | 205,820 | |
| Southwest Airlines Co. | | | 6,500 | | | | 350,870 | |
| | | | | | | | 1,190,816 | |
| IMS DIVIDEND GROWTH FUND |
| SCHEDULE OF INVESTMENTS |
| December 31, 2019 (Unaudited) |
| COMMON STOCK - 99.35% (continued) | | Shares | | | Fair Value | |
| | | | | | | |
| Information Technology - 27.56% | | | | | | | | |
| Apple, Inc. | | | 1,400 | | | $ | 411,110 | |
| CDK Global, Inc. | | | 3,000 | | | | 164,040 | |
| Mastercard, Inc. - Class A | | | 410 | | | | 122,422 | |
| Microsoft Corp. | | | 3,000 | | | | 473,100 | |
| Oracle Corp. | | | 3,869 | | | | 204,979 | |
| PayPal Holdings, Inc.(a) | | | 3,100 | | | | 335,327 | |
| QUALCOMM, Inc. | | | 5,000 | | | | 441,150 | |
| Visa, Inc. - Class A | | | 2,140 | | | | 402,106 | |
| | | | | | | | 2,554,234 | |
| | | | | | | | | |
| TOTAL COMMON STOCK (Cost $7,475,689) | | | | | | | 9,209,405 | |
| | | | | | | | | |
| MONEY MARKET SECURITIES - 0.41% | | | | | | | | |
| Federated Government Obligations Fund - Institutional Shares, 1.48%(b) | | | 37,844 | | | | 37,844 | |
| | | | | | | | | |
| TOTAL MONEY MARKET SECURITIES (Cost $37,844) | | | | | | | 37,844 | |
| | | | | | | | | |
| TOTAL INVESTMENTS AT VALUE (Cost $7,513,533) - 99.76% | | | | | | $ | 9,247,249 | |
| OTHER ASSETS IN EXCESS OF LIABILITIES, NET - 0.24% | | | | | | | 22,029 | |
| NET ASSETS - 100.00% | | | | | | $ | 9,269,278 | |
Percentages are stated as a percent of net assets.
(a)Non-income producing security.
(b)Rate shown represents the 7-day yield at December 31, 2019, is subject to change and resets daily.
See accompanying notes which are an integral part of these financial statements.
IMS FAMILY OF FUNDS
STATEMENTS OF ASSETS AND LIABILITIES
December 31, 2019 (Unaudited)
| | | IMS Capital
Value Fund | | | IMS Strategic
Income Fund | | | IMS Dividend
Growth Fund | |
| Assets: | | | | | | | | | | | | |
| Investments in securities: | | | | | | | | | | | | |
| At cost | | $ | 24,266,875 | | | $ | 9,088,291 | | | $ | 7,513,533 | |
| At fair value | | $ | 31,383,924 | | | $ | 7,754,942 | | | $ | 9,247,249 | |
| Due from advisor | | | — | | | | 338 | | | | — | |
| Receivables: | | | | | | | | | | | | |
| Interest | | | 1,221 | | | | 84,000 | | | | 126 | |
| Dividends | | | 23,321 | | | | 11,711 | | | | 18,245 | |
| Fund shares sold | | | 12,000 | | | | — | | | | 12,000 | |
| Prepaid expenses | | | 7,790 | | | | 5,333 | | | | 3,599 | |
| Total assets | | | 31,428,256 | | | | 7,856,324 | | | | 9,281,219 | |
| | | | | | | | | | | | | |
| Liabilities: | | | | | | | | | | | | |
| Payables: | | | | | | | | | | | | |
| Due to advisor | | | 31,879 | | | | — | | | | 2,389 | |
| Due to administrator, fund accountant and transfer agent | | | 3,873 | | | | 2,845 | | | | 3,156 | |
| Accrued expenses | | | 5,641 | | | | 3,248 | | | | 6,396 | |
| Total liabilities | | | 41,393 | | | | 6,093 | | | | 11,941 | |
| Net Assets | | $ | 31,386,863 | | | $ | 7,850,231 | | | $ | 9,269,278 | |
| | | | | | | | | | | | | |
| Net Assets consist of: | | | | | | | | | | | | |
| Paid-in capital | | $ | 24,206,184 | | | $ | 31,718,901 | | | $ | 6,799,171 | |
| Total distributable earnings (accumulated deficit) | | | 7,180,679 | | | | (23,868,670 | ) | | | 2,470,107 | |
| Total Net Assets | | $ | 31,386,863 | | | $ | 7,850,231 | | | $ | 9,269,278 | |
| | | | | | | | | | | | | |
| Shares outstanding (unlimited number of shares authorized, no par value) | | | 1,285,305 | | | | 3,028,993 | | | | 526,755 | |
| Net asset value and offering price per share | | $ | 24.42 | | | $ | 2.59 | | | $ | 17.60 | |
| Minimum redemption price per share(a) | | $ | 24.30 | | | $ | 2.58 | | | $ | 17.51 | |
| (a) | A redemption fee of 0.50% will be assessed on shares of the Fund that are redeemed within 90 days of purchase. |
See accompanying notes which are an integral part of these financial statements.
IMS FAMILY OF FUNDS
STATEMENTS OF OPERATIONS
For the Six Month Period Ended December 31, 2019 (Unaudited)
| | | IMS Capital Value Fund | | | IMS Strategic
Income Fund | | | IMS Dividend
Growth Fund | |
| Investment income: | | | | | | | | | | | | |
| Dividends (net of foreign withholding taxes of $0, $425 and $0, respectively) | | $ | 278,066 | | | $ | 92,489 | | | $ | 111,149 | |
| Interest | | | 15,243 | | | | 188,457 | | | | 1,839 | |
| Total investment income | | | 293,309 | | | | 280,946 | | | | 112,988 | |
| | | | | | | | | | | | | |
| Expenses: | | | | | | | | | | | | |
| Investment Advisor fees(a) | | | 184,639 | | | | 41,640 | | | | 60,262 | |
| Accounting, administration and transfer agent fees and expenses(a) | | | 46,203 | | | | 39,890 | | | | 42,846 | |
| Registration expenses | | | 2,498 | | | | 2,832 | | | | 2,201 | |
| Trustee expenses | | | 10,407 | | | | 10,407 | | | | 10,407 | |
| Audit expenses | | | 6,536 | | | | 6,536 | | | | 6,535 | |
| Miscellaneous expenses | | | 6,742 | | | | 5,428 | | | | 5,942 | |
| Custodian expenses | | | 2,513 | | | | 2,162 | | | | 2,061 | |
| Legal expenses | | | 4,273 | | | | 4,273 | | | | 4,272 | |
| Shareholder networking fees | | | 3,468 | | | | 804 | | | | 854 | |
| Interest expenses | | | 1,276 | | | | 148 | | | | 351 | |
| Pricing expenses | | | 2,112 | | | | 2,815 | | | | 2,263 | |
| Insurance expenses | | | 1,143 | | | | 889 | | | | 915 | |
| Printing expenses | | | 252 | | | | 252 | | | | 252 | |
| Total expenses | | | 272,062 | | | | 118,076 | | | | 139,161 | |
| Less: Fees waived and expenses absorbed by Advisor(a) | | | — | | | | (53,427 | ) | | | (45,564 | ) |
| Net expenses | | | 272,062 | | | | 64,649 | | | | 93,597 | |
| | | | | | | | | | | | | |
| Net Investment Income | | | 21,247 | | | | 216,297 | | | | 19,391 | |
| | | | | | | | | | | | | |
| Realized and unrealized gain (loss) on investment securities and foreign currency: | | | | | | | | | | | | |
| Net realized gain (loss) on investment securities and foreign currency | | | 221,388 | | | | (36,412 | ) | | | 811,758 | |
| Change in unrealized appreciation on investment securities and foreign currency | | | 2,483,928 | | | | 12,894 | | | | 143,320 | |
| Net realized and unrealized gain (loss) on investment securities and foreign currency | | | 2,705,316 | | | | (23,518 | ) | | | 955,078 | |
| | | | | | | | | | | | | |
| Net Increase in Net Assets Resulting from Operations | | $ | 2,726,563 | | | $ | 192,779 | | | $ | 974,469 | |
| (a) | See Note 4 in the Notes to Financial Statements. |
See accompanying notes which are an integral part of these financial statements.
IMS STRATEGIC INCOME FUND
STATEMENT OF CASH FLOWS
For the Six Month Period Ended December 31, 2019 (Unaudited)
| Increase (decrease) in cash: | | | |
| Cash flows from operating activities: | | | |
| Net increase in net assets from operations | | $ | 192,779 | |
| Adjustments to reconcile net increase in net assets from operations to net cash provided from operating activities: | | | | |
| Return of capital dividends received | | | | |
| Accretion of discount/Amortization of premium, net | | | (26,222 | ) |
| Purchase of investment securities | | | (11,090,220 | ) |
| Proceeds from disposition of investment securities | | | 9,284,393 | |
| Purchases of short-term investment securities, net | | | (60,921 | ) |
| Increase in due from advisor | | | (338 | ) |
| Decrease in dividends and interest receivable | | | (53,447 | ) |
| Increase in receivables for securities sold | | | 235,813 | |
| Increase in prepaid expenses | | | (1,828 | ) |
| Decrease in payable for securities purchased | | | (223,313 | ) |
| Decrease in accrued expenses | | | (23,391 | ) |
| Net unrealized appreciation on investment securities and foreign currency | | | (12,894 | ) |
| Net realized loss on investment securities | | | 36,412 | |
| Net cash provided from operating activities | | | (1,743,177 | ) |
| | | | | |
| Cash flows from financing activities: | | | | |
| Proceeds from Fund shares sold | | | 2,393,461 | |
| Payment on Fund shares redeemed | | | (642,085 | ) |
| Cash distributions paid | | | (8,199 | ) |
| Net cash used in financing activities | | | 1,743,177 | |
| | | | | |
| Net increase in cash | | $ | — | |
| | | | | |
| Cash: | | | | |
| Beginning of period | | $ | — | |
| End of period | | $ | — | |
Supplemental disclosure of cash flow information:
Noncash financing activities not included herein consist of reinvestment of distributions of $170,316.
Interest paid by the Fund for outstanding balances on the line of credit amounted to $148.
See accompanying notes which are an integral part of these financial statements.
IMS CAPITAL VALUE FUND
STATEMENTS OF CHANGES IN NET ASSETS
| | | Six Month | | | | |
| | | Period Ended | | | Year Ended | |
| | | December 31,
2019 | | | June 30,
2019 | |
| Increase (Decrease) in Net Assets due to: | | | (Unaudited) | | | | | |
| Operations: | | | | | | | | |
| Net investment income (loss) | | $ | 21,247 | | | $ | (31,750 | ) |
| Net realized gain on investment securities | | | 221,388 | | | | 1,561,393 | |
| Change in unrealized appreciation on investment securities | | | 2,483,928 | | | | 489,146 | |
| Net increase in net assets resulting from operations | | | 2,726,563 | | | | 2,018,789 | |
| | | | | | | | | |
| Distributions to shareholders from: | | | | | | | | |
| Total distributable earnings | | | (1,530,350 | ) | | | (3,206,262 | ) |
| Total Distributions | | | (1,530,350 | ) | | | (3,206,262 | ) |
| | | | | | | | | |
| Capital share transactions: | | | | | | | | |
| Proceeds from shares purchased | | | 323,250 | | | | 200,587 | |
| Reinvestment of distributions | | | 1,507,069 | | | | 3,158,798 | |
| Amount paid for shares redeemed | | | (2,011,354 | ) | | | (5,482,597 | ) |
| Proceeds from redemption fees | | | 33 | | | | 13 | |
| Net decrease in net assets from share transactions | | | (181,002 | ) | | | (2,123,199 | ) |
| | | | | | | | | |
| Total Increase (Decrease) in Net Assets | | | 1,015,211 | | | | (3,310,672 | ) |
| | | | | | | | | |
| Net Assets: | | | | | | | | |
| Beginning of year/period | | | 30,371,652 | | | | 33,682,324 | |
| | | | | | | | | |
| End of year/period | | $ | 31,386,863 | | | $ | 30,371,652 | |
| | | | | | | | | |
| Capital Share Transactions | | | | | | | | |
| Shares purchased | | | 13,281 | | | | 8,746 | |
| Shares issued in reinvestment of distributions | | | 62,199 | | | | 160,345 | |
| Shares redeemed | | | (84,396 | ) | | | (235,860 | ) |
| Net decrease in capital shares | | | (8,916 | ) | | | (66,769 | ) |
See accompanying notes which are an integral part of these financial statements.
IMS STRATEGIC INCOME FUND
STATEMENTS OF CHANGES IN NET ASSETS
| | | Six Month | | | | |
| | | Period Ended | | | Year Ended | |
| | | December 31,
2019 | | | June 30,
2019 | |
| Increase (Decrease) in Net Assets due to: | | | (Unaudited) | | | | | |
| Operations: | | | | | | | | |
| Net investment income | | $ | 216,297 | | | $ | 210,978 | |
| Net realized loss on investment securities and foreign currency | | | (36,412 | ) | | | (823,906 | ) |
| Change in unrealized appreciation on investment securities and foreign currency | | | 12,894 | | | | 1,025,534 | |
| Net increase in net assets resulting from operations | | | 192,779 | | | | 412,606 | |
| | | | | | | | | |
| Distributions to shareholders from: | | | | | | | | |
| Total distributable earnings | | | (178,515 | ) | | | (207,454 | ) |
| Total Distributions | | | (178,515 | ) | | | (207,454 | ) |
| | | | | | | | | |
| Capital share transactions: | | | | | | | | |
| Proceeds from shares purchased | | | 2,393,461 | | | | 3,123,941 | |
| Reinvestment of distributions | | | 170,316 | | | | 193,223 | |
| Amount paid for shares redeemed | | | (642,956 | ) | | | (1,537,861 | ) |
| Proceeds from redemption fees | | | 871 | | | | 2,313 | |
| Net Increase in net assets from share transactions | | | 1,921,692 | | | | 1,781,616 | |
| | | | | | | | | |
| Total Increase in Net Assets | | | 1,935,956 | | | | 1,986,768 | |
| | | | | | | | | |
| Net Assets: | | | | | | | | |
| Beginning of year/period | | | 5,914,275 | | | | 3,927,507 | |
| | | | | | | | | |
| End of year/period | | $ | 7,850,231 | | | $ | 5,914,275 | |
| | | | | | | | | |
| Capital Share Transactions | | | | | | | | |
| Shares purchased | | | 952,588 | | | | 1,206,276 | |
| Shares issued in reinvestment of distributions | | | 66,696 | | | | 77,284 | |
| Shares redeemed | | | (253,155 | ) | | | (625,652 | ) |
| Net increase in capital shares | | | 766,129 | | | | 657,908 | |
See accompanying notes which are an integral part of these financial statements.
IMS DIVIDEND GROWTH FUND
STATEMENTS OF CHANGES IN NET ASSETS
| | | Six Month | | | | |
| | | Period Ended | | | Year Ended | |
| | | December 31,
2019 | | | June 30,
2019 | |
| Increase (Decrease) in Net Assets due to: | | | (Unaudited) | | | | | |
| Operations: | | | | | | | | |
| Net investment income | | $ | 19,391 | | | $ | 60,818 | |
| Net realized gain on investment securities | | | 811,758 | | | | 408,322 | |
| Change in unrealized appreciation on investment securities | | | 143,320 | | | | 305,852 | |
| Net increase in net assets resulting from operations | | | 974,469 | | | | 774,992 | |
| | | | | | | | | |
| Distributions to shareholders from: | | | | | | | | |
| Total distributable earnings | | | (499,932 | ) | | | (63,965 | ) |
| Total Distributions | | | (499,932 | ) | | | (63,965 | ) |
| | | | | | | | | |
| Capital share transactions: | | | | | | | | |
| Proceeds from shares purchased | | | 87,995 | | | | 687,809 | |
| Reinvestment of distributions | | | 496,616 | | | | 63,627 | |
| Amount paid for shares redeemed | | | (1,759,845 | ) | | | (2,524,931 | ) |
| Net decrease in net assets from share transactions | | | (1,175,234 | ) | | | (1,773,495 | ) |
| | | | | | | | | |
| Total Decrease in Net Assets | | | (700,697 | ) | | | (1,062,468 | ) |
| | | | | | | | | |
| Net Assets: | | | | | | | | |
| Beginning of year/period | | | 9,969,976 | | | | 11,032,444 | |
| | | | | | | | | |
| End of year/period | | $ | 9,269,279 | | | $ | 9,969,976 | |
| | | | | | | | | |
| Capital Share Transactions | | | | | | | | |
| Shares purchased | | | 5,215 | | | | 47,431 | |
| Shares issued in reinvestment of distributions | | | 28,262 | | | | 4,099 | |
| Shares redeemed | | | (103,346 | ) | | | (160,420 | ) |
| Net decrease in capital shares | | | (69,869 | ) | | | (108,890 | ) |
See accompanying notes which are an integral part of these financial statements.
IMS CAPITAL VALUE FUND
FINANCIAL HIGHLIGHTS
For a Fund share outstanding throughout each year/period
| | | For the Six | | | | | | | | | | | | | | | | |
| | | Month Period Ended | | | For the Years Ended | |
| | | December 31, 2019 | | | June 30, 2019 | | | June 30, 2018 | | | June 30, 2017 | | | June 30, 2016 | | | June 30, 2015 | |
| | | (Unaudited) | | | | | | | | | | | | | | | | |
| Net Asset Value, Beginning of Year/Period | | $ | 23.47 | | | | 24.75 | | | $ | 24.05 | | | $ | 21.52 | | | $ | 23.16 | | | $ | 21.10 | |
| | | | | | | | | | | | | | | | | | | | | | | | | |
| Investment Operations: | | | | | | | | | | | | | | | | | | | | | | | | |
| Net investment income (loss) | | | 0.02 | | | | (0.02 | ) | | | (0.00 | )(a) | | | 0.02 | | | | (0.04 | ) | | | (0.04 | ) |
| Net realized and unrealized gain (loss) on investments | | | 2.17 | | | | 1.27 | | | | 1.22 | | | | 2.51 | | | | (1.60 | ) | | | 2.10 | |
| Total from investment operations | | | 2.19 | | | | 1.25 | | | | 1.22 | | | | 2.53 | | | | (1.64 | ) | | | 2.06 | |
| | | | | | | | | | | | | | | | | | | | | | | | | |
| Less Distributions to shareholders: | | | | | | | | | | | | | | | | | | | | | | | | |
| From net investment income | | | — | | | | — | | | | (0.02 | ) | | | — | | | | — | | | | — | |
| From net realized capital gains | | | (1.24 | ) | | | (2.53 | ) | | | (0.50 | ) | | | — | | | | — | | | | — | |
| Total distributions | | | (1.24 | ) | | | (2.53 | ) | | | (0.52 | ) | | | — | | | | — | | | | — | |
| | | | | | | | | | | | | | | | | | | | | | | | | |
| Paid in capital from redemption fees(a) | | | 0.00 | | | | 0.00 | | | | 0.00 | | | | 0.00 | | | | 0.00 | | | | 0.00 | |
| | | | | | | | | | | | | | | | | | | | | | | | | |
| Net Asset Value, End of Year/Period | | $ | 24.42 | | | | 23.47 | | | $ | 24.75 | | | $ | 24.05 | | | $ | 21.52 | | | $ | 23.16 | |
| | | | | | | | | | | | | | | | | | | | | | | | | |
| Total Return(b) | | | 9.37 | %(d) | | | 6.99 | % | | | 5.05 | % | | | 11.76 | % | | | (7.08 | )% | | | 9.76 | % |
| | | | | | | | | | | | | | | | | | | | | | | | | |
| Ratios/Supplemental Data | | | | | | | | | | | | | | | | | | | | | | | | |
Net assets, end of year/period
(in 000's) | | $ | 31,387 | | | | 30,372 | | | $ | 33,682 | | | $ | 40,707 | | | $ | 38,683 | | | $ | 40,716 | |
| | | | | | | | | | | | | | | | | | | | | | | | | |
| Ratio of expenses to average net assets: | | | 1.78 | %(c)(e) | | | 1.80 | %(c) | | | 1.74 | %(c) | | | 1.69 | % | | | 1.69 | % | | | 1.74 | % |
| | | | | | | | | | | | | | | | | | | | | | | | | |
| Ratio of net investment income (loss) to average net assets: | | | 0.14 | %(c)(e) | | | (0.10 | )%(c) | | | (0.01 | )%(c) | | | 0.08 | % | | | (0.19 | )% | | | (0.17 | )% |
| | | | | | | | | | | | | | | | | | | | | | | | | |
| Portfolio turnover rate | | | 107.86 | %(d) | | | 17.29 | % | | | 40.01 | % | | | 84.33 | % | | | 64.78 | % | | | 62.98 | % |
| (a) | Net investment loss and redemption fees resulted in less than $0.005 per share. |
| (b) | Total return in the above table represents the rate that the investor would have earned or lost on an investment in the Fund assuming reinvestment of dividends. |
| (c) | The ratios include 0.01% of interest expense during the years ended June 30, 2018 and June 30, 2019 and during the six month period ended December 31, 2019. |
| (d) | Not annualized. |
| (e) | Annualized. |
See accompanying notes which are an integral part of these financial statements.
IMS STRATEGIC INCOME FUND
FINANCIAL HIGHLIGHTS
For a Fund share outstanding throughout each year/period
| | | For the Six | | | | | | | | | | | | | | | | |
| | | Month Period Ended | | | For the Years Ended | |
| | | December 31, 2019 | | | June 30, 2019 | | | June 30, 2018 | | | June 30, 2017 | | | June 30, 2016 | | | June 30, 2015 | |
| | | (Unaudited) | | | | | | | | | | | | | | | | |
| Net Asset Value, Beginning of Year/Period | | $ | 2.61 | | | $ | 2.45 | | | $ | 2.93 | | | $ | 3.27 | | | $ | 4.53 | | | $ | 5.95 | |
| | | | | | | | | | | | | | | | | | | | | | | | | |
| Investment Operations: | | | | | | | | | | | | | | | | | | | | | | | | |
| Net investment income | | | 0.01 | | | | 0.13 | | | | 0.19 | | | | 0.24 | | | | 0.35 | | | | 0.45 | |
| Net realized and unrealized gain (loss) on investments and foreign currency(a) | | | (0.03 | ) | | | 0.16 | | | | (0.49 | ) | | | (0.32 | ) | | | (1.28 | ) | | | (1.37 | ) |
| Total from investment operations | | | (0.02 | ) | | | 0.29 | | | | (0.30 | ) | | | (0.08 | ) | | | (0.93 | ) | | | (0.92 | ) |
| | | | | | | | | | | | | | | | | | | | | | | | | |
| Less Distributions to shareholders: | | | | | | | | | | | | | | | | | | | | | | | | |
| From net investment income | | | — | | | | (0.13 | ) | | | (0.18 | ) | | | (0.26 | ) | | | (0.33 | ) | | | (0.39 | ) |
| Tax return of capital | | | — | | | | — | | | | — | | | | — | | | | — | | | | (0.11 | ) |
| Total distributions | | | — | | | | (0.13 | ) | | | (0.18 | ) | | | (0.26 | ) | | | (0.33 | ) | | | (0.50 | ) |
| | | | | | | | | | | | | | | | | | | | | | | | | |
| Paid in capital from redemption fees(b) | | | 0.00 | | | | 0.00 | | | | 0.00 | | | | 0.00 | | | | 0.00 | | | | 0.00 | |
| | | | | | | | | | | | | | | | | | | | | | | | | |
| Net Asset Value, End of Year/Period | | $ | 2.59 | | | $ | 2.61 | | | $ | 2.45 | | | $ | 2.93 | | | $ | 3.27 | | | $ | 4.53 | |
| | | | | | | | | | | | | | | | | | | | | | | | | |
| Total Return(c) | | | 1.98 | %(e) | | | 12.22 | % | | | (10.71 | )% | | | (2.69 | )% | | | (20.99 | )% | | | (16.13 | )% |
| | | | | | | | | | | | | | | | | | | | | | | | | |
| Ratios/Supplemental Data | | | | | | | | | | | | | | | | | | | | | | | | |
| Net assets, end of year/period (in 000's) | | $ | 7,850 | | | $ | 5,914 | | | $ | 3,928 | | | $ | 5,580 | | | $ | 8,865 | | | $ | 20,865 | |
| | | | | | | | | | | | | | | | | | | | | | | | | |
| Ratio of expenses to average net assets: | | | 1.96 | %(d)(f) | | | 1.98 | %(d) | | | 2.02 | %(d) | | | 1.98 | %(d) | | | 1.98 | %(d) | | | 1.96 | %(d) |
| Ratio of expenses to average net assets before waiver & reimbursement: | | | 3.57 | %(d)(f) | | | 4.29 | %(d) | | | 3.36 | %(d) | | | 2.93 | %(d) | | | 2.25 | %(d) | | | 1.92 | %(d) |
| | | | | | | | | | | | | | | | | | | | | | | | | |
| Ratio of net investment income to average net assets: | | | 6.54 | %(d)(f) | | | 5.27 | %(d) | | | 6.99 | %(d) | | | 7.83 | %(d) | | | 9.13 | %(d) | | | 8.94 | %(d) |
| Ratio of net investment income to average net assets before waiver & reimbursement: | | | 4.93 | %(d)(f) | | | 2.95 | %(d) | | | 5.64 | %(d) | | | 6.87 | %(d) | | | 8.85 | %(d) | | | 8.90 | %(d) |
| | | | | | | | | | | | | | | | | | | | | | | | | |
| Portfolio turnover rate | | | 163.18 | %(e) | | | 728.46 | % | | | 758.79 | % | | | 505.62 | % | | | 394.23 | % | | | 562.40 | % |
| (a) | Realized and unrealized gains and losses per share in this caption are balancing amounts necessary to reconcile the changes in net assets value per share for the period, and may not reconcile with the aggregate gains and losses in the statement of operations. |
| (b) | Redemption fees resulted in less than $0.005 per share. |
| (c) | Total return in the above table represents the rate that the investor would have earned or lost on an investment in the Fund assuming reinvestment of dividends. |
| (d) | The ratios include 0.01% of interest expense during the year ended June 30, 2015, 0.03% of interest expense during the year ended June 30, 2016, 0.04% of interest expense during the year ended June 30, 2017, 0.07% of interest expense during the year ended June 30, 2018, 0.03% of interest expense during the year ended June 30, 2019 and 0.01% of interest expense during the six month period ended December 31, 2019. |
| (e) | Not annualized. |
| (f) | Annualized. |
See accompanying notes which are an integral part of these financial statements.
IMS DIVIDEND GROWTH FUND
FINANCIAL HIGHLIGHTS
For a Fund share outstanding throughout each year/period
| | | For the Six | | | | | | | | | | | | | | | | |
| | | Month Period Ended | | | For the Years Ended | |
| | | December 31, 2019 | | | June 30, 2019 | | | June 30, 2018 | | | June 30, 2017 | | | June 30, 2016 | | | June 30, 2015 | |
| | | (Unaudited) | | | | | | | | | | | | | | | | |
| Net Asset Value, Beginning of Year/Period | | $ | 16.71 | | | $ | 15.64 | | | $ | 14.72 | | | $ | 12.62 | | | $ | 13.03 | | | $ | 12.44 | |
| | | | | | | | | | | | | | | | | | | | | | | | | |
| Investment Operations: | | | | | | | | | | | | | | | | | | | | | | | | |
| Net investment income | | | 0.02 | | | | 0.09 | | | | 0.10 | | | | 0.10 | | | | 0.11 | | | | 0.09 | |
| Net realized and unrealized gain (loss) on investments | | | 1.83 | | | | 1.08 | | | | 0.94 | | | | 2.09 | | | | (0.41 | ) | | | 0.59 | |
| Total from investment operations | | | 1.85 | | | | 1.17 | | | | 1.04 | | | | 2.19 | | | | (0.30 | ) | | | 0.68 | |
| | | | | | | | | | | | | | | | | | | | | | | | | |
| Less Distributions to shareholders: | | | | | | | | | | | | | | | | | | | | | | | | |
| From net investment income | | | — | | | | (0.10 | ) | | | (0.12 | ) | | | (0.09 | ) | | | (0.11 | ) | | | (0.09 | ) |
| Tax return of capital | | | — | | | | — | | | | 0.00 | (d) | | | — | | | | — | | | | — | |
| Total distributions | | | (0.96 | ) | | | (0.10 | ) | | | (0.12 | ) | | | (0.09 | ) | | | (0.11 | ) | | | (0.09 | ) |
| | | | | | | | | | | | | | | | | | | | | | | | | |
| Paid in capital from redemption fees | | | — | | | | — | | | | 0.00 | (a) | | | 0.00 | (a) | | | 0.00 | (a) | | | 0.00 | (a) |
| | | | | | | | | | | | | | | | | | | | | | | | | |
| Net Asset Value, End of Year/Period | | $ | 17.60 | | | $ | 16.71 | | | $ | 15.64 | | | $ | 14.72 | | | $ | 12.62 | | | $ | 13.03 | |
| | | | | | | | | | | | | | | | | | | | | | | | | |
| Total Return(b) | | | 11.20 | %(e) | | | 7.53 | % | | | 7.05 | % | | | 17.38 | % | | | (2.27 | )% | | | 5.48 | % |
| | | | | | | | | | | | | | | | | | | | | | | | | |
| Ratios/Supplemental Data | | | | | | | | | | | | | | | | | | | | | | | | |
| Net assets, end of year/period (in 000's) | | $ | 9,269 | | | $ | 9,970 | | | $ | 11,032 | | | $ | 9,797 | | | $ | 8,476 | | | $ | 10,291 | |
| | | | | | | | | | | | | | | | | | | | | | | | | |
| Ratio of expenses to average net assets: | | | 1.96 | %(c) (f) | | | 1.96 | %(c) | | | 1.96 | %(c) | | | 1.95 | % | | | 1.96 | %(c) | | | 1.95 | % |
| Ratio of expenses to average net assets before waiver & reimbursement: | | | 2.91 | %(c) (f) | | | 2.47 | %(c) | | | 2.13 | %(c) | | | 2.34 | % | | | 2.37 | %(c) | | | 2.50 | % |
| | | | | | | | | | | | | | | | | | | | | | | | | |
| Ratio of net investment income to average net assets: | | | 0.41 | %(c) (f) | | | 0.58 | %(c) | | | 0.64 | %(c) | | | 0.71 | % | | | 0.85 | %(c) | | | 0.69 | % |
| Ratio of net investment income to average net assets before waiver & reimbursement: | | | (0.55 | )%(c) (f) | | | 0.07 | %(c) | | | 0.47 | %(c) | | | 0.32 | % | | | 0.44 | %(c) | | | 0.14 | % |
| | | | | | | | | | | | | | | | | | | | | | | | | |
| Portfolio turnover rate | | | 8.29 | %(e) | | | 5.26 | % | | | 23.39 | % | | | 32.76 | % | | | 6.63 | % | | | 86.92 | % |
| (a) | Redemption fees resulted in less than $0.005 per share. |
| (b) | Total return in the above table represents the rate that the investor would have earned or lost on an investment in the Fund assuming reinvestment of dividends. |
| (c) | The ratios include 0.01% of interest expense during the year ended June 30, 2016, 0.01% of interest expense during the year ended June 30, 2018, 0.01% of interest expense during the year ended June 30, 2019 and 0.01% of interest expense for the six month period ended December 31, 2019. |
| (d) | Tax return of capital distributions were less than $0.005 per share. |
| (e) | Not annualized. |
| (f) | Annualized. |
See accompanying notes which are an integral part of these financial statements.
IMS FAMILY OF FUNDS
NOTES TO THE FINANCIAL STATEMENTS
December 31, 2019 (Unaudited)
NOTE 1. ORGANIZATION
The IMS Family of Funds (the “Funds”), comprising the IMS Capital Value Fund (the “Value Fund”), IMS Strategic Income Fund (the “Income Fund”) and IMS Dividend Growth Fund (the “Dividend Growth Fund”), were each organized as a diversified series of 360 Funds (the “Trust”) on June 20, 2014. The Trust was organized on February 24, 2005 as a Delaware statutory trust. The Trust is registered as an open-end management investment company under the Investment Company Act of 1940 (the “1940 Act”). The investment objective of the Value Fund is to provide long-term growth from capital appreciation and secondarily, income from dividends. The investment objective of the Income Fund is to provide current income and secondarily, capital appreciation. The investment objective of the Dividend Growth Fund is to provide long-term growth from capital appreciation and dividends. The investment advisor of each Fund is IMS Capital Management, Inc. (the “Advisor”).
NOTE 2. SIGNIFICANT ACCOUNTING POLICIES
The following is a summary of significant accounting policies followed by each Fund in the preparation of its financial statements. The Funds are investment companies and accordingly follow the investment company accounting and reporting guidance of the Financial Accounting Standards Board (“FASB”) Accounting Standards Codification Topic 946 applicable to investment companies.
Securities Valuations –All investments in securities are recorded at their estimated fair value as described in Note 3.
Foreign Currency –Investment securities denominated in foreign currencies are translated into U.S. dollar amounts at the date of valuation. Purchases and sales of investment securities and income and expense items denominated in foreign currencies are translated into U.S. dollar amounts on the respective dates of such transactions. Reported net realized foreign exchange gains or losses arise from currency gains or losses realized between the trade and settlement dates on securities transactions, and the difference between the amounts of dividends, interest and foreign withholding taxes recorded on the Funds’ books and the U.S. dollar equivalent of the amounts actually received or paid. The Funds do not isolate that portion of the results of operations resulting from changes in foreign exchange rates on investments from the fluctuations arising from changes in market prices of securities. Such fluctuations are included with the net realized and unrealized gain or loss from investments.
Reverse Convertible Bonds –The Funds may invest in reverse convertible notes, which are short-term notes (i.e., with maturities of one year or less) that are linked to individual equity securities. These notes make regular interest payments by the issuer, but also have a put option attached, giving the issuer the right to exercise that option only if the price of the related security drops below a stated price.
Structured notes, such as reverse convertible notes, are subject to a number of fixed income risks including general market risk, interest rate risk, as well as the risk that the issuer on the note may fail to make interest and/ or principal payments when due, or may default on its obligations entirely. In addition, as a result of imbedded derivative features in these securities, structured notes generally are subject to more risk than investing in a simple note or bond issued by the same issuer.
IMS FAMILY OF FUNDS
NOTES TO THE FINANCIAL STATEMENTS – (continued)
December 31, 2019 (Unaudited)
NOTE 2. SIGNIFICANT ACCOUNTING POLICIES (continued)
Federal Income Taxes –The Funds intend to qualify each year as regulated investment companies (“RICs”) under subchapter M of the Internal Revenue Code of 1986, as amended, by complying with the requirements applicable to RICs and by distributing substantially all of their taxable income. The Funds also intend to distribute sufficient net investment income and net capital gains, if any, so that they will not be subject to excise tax on undistributed income and gains. If the required amount of net investment income or gains is not distributed, the Funds could incur a tax expense.
Management has evaluated the Funds’ tax positions taken on Federal income tax returns for all open tax years (tax years ended June 30, 2016, June 30, 2017, June 30, 2018 and June 30, 2019) and expected to be taken during the year ended June 30, 2020 and has concluded that no provision for income tax is required in these financial statements. As of and during the six month period ended December 31, 2019, the Funds did not have a liability for any unrecognized tax benefits. The Funds recognize interest and penalties, if any, related to unrecognized tax benefits as income tax expense in the statements of operations. During the six month period ended December 31, 2019, the Funds did not incur any interest or penalties. The Funds are not subject to examination by U.S. federal tax authorities for tax years prior to 2016.
Expenses– Expenses incurred by the Trust that do not relate to a specific fund of the Trust are allocated to the individual funds based on each Fund’s relative net assets or another appropriate basis (as determined by the Board of Trustees (the “Board”)).
Security Transactions and Related Income –Each Fund follows industry practice and records security transactions on the trade date for financial reporting purposes. The first in, first out method is used for determining gains or losses for financial statements and income tax purposes. Dividend income is recorded on the ex-dividend date and interest income is recorded on an accrual basis. Dividend income from real estate investment trusts (REITS) and distributions from limited partnerships are recognized on the ex-date and included in dividend income. The calendar year-end classification of distributions received from REITS during the fiscal year are reported subsequent to year end; accordingly, the Funds estimate the character of REIT distributions based on the most recent information available. Withholding taxes on foreign dividends have been provided for in accordance with each Fund’s understanding of the applicable country’s tax rules and rates. Discounts and premiums on securities purchased are amortized or accreted using the effective interest method. For bonds that miss a scheduled interest payment, after the grace period, all interest accrued on the bond is written off and no additional interest will be accrued. However, for illiquid bonds or those bonds fair valued by the Advisor, if the Advisor’s research indicates a high recovery rate in restructuring, and the Fund expects to hold the bond until the issue is restructured, past due interest may not be written off in its entirety. The ability of issuers of debt securities held by the Funds to meet their obligations may be affected by economic and political developments in a specific country or region.
Use of Estimates – The preparation of financial statements in conformity with U.S. generally accepted accounting principles (“GAAP”) requires management to make estimates and assumptions that affect the reported amounts of assets and liabilities and disclosure of contingent assets and liabilities at the date of the financial statements and the reported amounts of revenues and expenses during the reporting period. Actual results could differ from those estimates.
IMS FAMILY OF FUNDS
NOTES TO THE FINANCIAL STATEMENTS – (continued)
December 31, 2019 (Unaudited)
NOTE 2. SIGNIFICANT ACCOUNTING POLICIES (continued)
Dividends and Distributions –The Income Fund intends to distribute substantially all of its net investment income as dividends to its shareholders on a monthly basis. The Value Fund and Dividend Growth Fund intend to distribute substantially all of their net investment income as dividends to their shareholders on at least an annual basis. Each Fund intends to distribute its net realized long-term capital gains and its net realized short-term capital gains at least once a year. Dividends to shareholders, which are determined in accordance with income tax regulations, are recorded on the ex-dividend date. The treatment for financial reporting purposes of distributions made to shareholders during the year from net investment income or net realized capital gains may differ from their ultimate treatment for federal income tax purposes. These differences are caused primarily by differences in the timing of the recognition of certain components of income, expense or realized capital gain for federal income tax purposes. Where such differences are permanent in nature, they are reclassified in the components of the net assets based on their ultimate characterization for federal income tax purposes. Any such reclassifications will have no effect on net assets, results of operations or net asset values per share of the Funds.
There were no reclassifications to the components of net assets during the six month period ended December 31, 2019.
NOTE 3. SECURITIES VALUATION AND FAIR VALUE MEASUREMENTS
Fair value is defined as the price that a Fund would receive upon selling an investment in an orderly transaction to an independent buyer in the principal or most advantageous market of the investment. GAAP establishes a three-tier hierarchy to maximize the use of observable market data and minimize the use of unobservable inputs and to establish classification of fair value measurements for disclosure purposes.
Inputs refer broadly to the assumptions that market participants would use in pricing the asset or liability, including assumptions about risk (the risk inherent in a particular valuation technique used to measure fair value such as a pricing model and/or the risk inherent in the inputs to the valuation technique). Inputs may be observable or unobservable. Observable inputs are inputs that reflect the assumptions market participants would use in pricing the asset or liability developed based on market data obtained from sources independent of the reporting entity. Unobservable inputs are inputs that reflect the reporting entity’s own assumptions about the assumptions market participants would use in pricing the asset or liability developed based on the best information available in the circumstances.
Various inputs are used in determining the value of each Fund’s investments. These inputs are summarized in the three broad levels listed below.
| • | Level 1 – | quoted prices in active markets for identical securities |
| • | Level 2 – | other significant observable inputs (including, but not limited to, quoted prices for an identical security in an inactive market, quoted prices for similar securities, interest rates, prepayment speeds, credit risk, etc.) |
| • | Level 3 – | significant unobservable inputs (including each Fund’s own assumptions in determining fair value of investments based on the best information available) |
IMS FAMILY OF FUNDS
NOTES TO THE FINANCIAL STATEMENTS – (continued)
December 31, 2019 (Unaudited)
NOTE 3. SECURITIES VALUATION AND FAIR VALUE MEASUREMENTS (continued)
The inputs used to measure fair value may fall into different levels of the fair value hierarchy. In such cases, for disclosure purposes, the level in the fair value hierarchy within which the fair value measurement falls in its entirety, is determined based on the lowest level input that is significant to the fair value measurement in its entirety.
A description of the valuation techniques applied to each Fund’s major categories of assets measured at fair value on a recurring basis follows:
Equity securities, including common stock, real estate investment trusts, and preferred securities, are generally valued by using market quotations, but may be valued on the basis of prices furnished by a pricing service when the Advisor believes such prices more accurately reflect the fair value of such securities. Securities that are traded on any stock exchange are generally valued by the pricing service at the last quoted sale price. Lacking a last sale price, an exchange traded security is generally valued by the pricing service at its last bid price.
Securities traded in the NASDAQ over-the-counter market are generally valued by the pricing service at the NASDAQ Official Closing Price. When using the market quotations or close prices provided by the pricing service and when the market is considered active, the security will be classified as a Level 1 security. Sometimes, an equity security owned by a Fund will be valued by the pricing service with factors other than market quotations or when the market is considered inactive. When this happens, the security will be classified as a Level 2 security.
Investments in mutual funds, including money market mutual funds, are generally priced at the ending net asset value (NAV) provided by the service agent of the mutual funds. These securities will be categorized as Level 1 securities.
Fixed income securities such as corporate bonds, municipal bonds, structured notes, and foreign bonds denominated in U.S. dollars, when valued using market quotations in an active market, will be categorized as Level 2 securities. However, they may be valued on the basis of prices furnished by a pricing service when the Advisor believes such prices more accurately reflect the fair value of such securities. A pricing service utilizes electronic data processing techniques based on yield spreads relating to securities with similar characteristics to determine prices for normal institutional-size trading units of debt securities without regard to sale or bid prices. These securities will generally be categorized as Level 2 securities. If the Advisor decides that a price provided by the pricing service does not accurately reflect the fair value of the securities, when prices are not readily available from a pricing service, or when certain restricted or illiquid securities are being valued, securities are valued at fair value as determined in good faith by the Advisor, in conformity with guidelines adopted by and subject to review of the Board and the Fair Valuation Committee. These securities will be categorized as Level 3 securities. See the chart on page 34 for more information on the inputs used by the Advisor in determining fair value of such Level 3 securities. The Advisor has used inputs such as evaluated broker quotes in inactive markets, actual trade prices in inactive markets, present value of expected future cash flows, terms of expected bond restructurings, and yields on similar securities in determining the fair value of such Level 3 securities.
IMS FAMILY OF FUNDS
NOTES TO THE FINANCIAL STATEMENTS – (continued)
December 31, 2019 (Unaudited)
NOTE 3. SECURITIES VALUATION AND FAIR VALUE MEASUREMENTS (continued)
Short-term investments in fixed income securities (those with maturities of less than 60 days when acquired) are valued by using the amortized cost method of valuation, which the Board has determined will represent fair value. These securities will be classified as Level 2 securities.
In accordance with the Trust’s good faith pricing guidelines, the Advisor is required to consider all appropriate factors relevant to the value of securities for which it has determined other pricing sources are not available or reliable as described above. No single standard exists for determining fair value, because fair value depends upon the circumstances of each individual case. As a general principle, the current fair value of an issue of securities being valued by the Advisor would appear to be the amount which the owner might reasonably expect to receive for them upon their current sale. Methods which are in accordance with this principle may, for example, be based on (i) a multiple of earnings; (ii) a discount from market of a similar freely traded security (including a derivative security or a basket of securities traded on other markets, exchanges or among dealers); or (iii) yield to maturity with respect to debt issues, or a combination of these and other methods. Good faith pricing is permitted if, in the Advisor’s opinion, the validity of market quotations appears to be questionable based on factors such as evidence of a thin market in the security based on a small number of quotations, a significant event occurs after the close of a market but before a Fund’s NAV calculation that may affect a security’s value, or the Advisor is aware of any other data that calls into question the reliability of market quotations. Good faith pricing may also be used in instances when the bonds in which the Funds invest may default or otherwise cease to have market quotations readily available.
The Trustees of the 360 Funds adopted the M3Sixty Consolidated Valuation Procedures on June 24, 2014, which established a Valuation Committee to work with the Advisor and report to the Board on securities being fair valued or manually priced. The Lead Chairman and Trustee for the 360 Funds, along with the Fund Principal Financial Officer and Chief Compliance Officer are members of the Valuation Committee which meets at least monthly or, as required, to review the interim actions and coordination with the Advisor in pricing fair valued securities, and consideration of any unresolved valuation issue or a request to change the methodology for manually pricing a security. In turn, the Lead Chairman provides updates to the Board at the regularly scheduled board meetings as well as interim updates to the board members on substantive changes in a daily valuation or methodology issue.
The following is a summary of the inputs used to value the Value Fund’s investments as of December 31, 2019:
| | | Valuation Inputs | |
Investments at Value | | Level 1 –
Quoted Prices in
Active Markets | | | Level 2 –
Other
Significant
Observable
Inputs | | | Level 3 –
Significant
Unobservable
Inputs | | | Total | |
| Common Stocks* | $ | 31,328,825 | | $ | — | | $ | — | | $ | 31,328,825 | |
| Money Market Securities | | 55,099 | | | — | | | — | | | 55,099 | |
| Total | $ | 31,383,924 | | $ | — | | $ | — | | $ | 31,383,924 | |
* Refer to the Schedule of Investments for industry classifications.
IMS FAMILY OF FUNDS
NOTES TO THE FINANCIAL STATEMENTS – (continued)
December 31, 2019 (Unaudited)
NOTE 3. SECURITIES VALUATION AND FAIR VALUE MEASUREMENTS (continued)
The Value Fund did not hold any investments at any time during the reporting period in which significant unobservable inputs were used in determining fair value; therefore, no reconciliation of Level 3 securities is included for this reporting period. The Value Fund did not hold any derivative instruments during the reporting period. During the six month period ended December 31, 2019, there were no transfers between levels. The Value Fund recognizes transfers between fair value hierarchy levels at the end of the reporting period.
The following is a summary of the inputs used to value the Income Fund’s investments as of December 31, 2019:
| | | Valuation Inputs | |
Investments at value | | Level 1 –
Quoted
Prices in Active
Markets | | | Level 2 –
Other Significant
Observable
Inputs | | | Level 3 –
Significant
Unobservable
Inputs | | | Total | |
| Common Stocks* | $ | 1,266,875 | | $ | — | | $ | — | | $ | 1,266,875 | |
| Corporate Bonds | | — | | | 4,348,929 | | | — | | | 4,348,929 | |
| Foreign Bonds | | — | | | — | | | 68,291 | | | 68,291 | |
| Structured Notes | | — | | | 1,184,098 | | | — | | | 1,184,098 | |
| Money Market Securities | | 886,749 | | | — | | | — | | | 886,749 | |
| Total | $ | 2,646,591 | | $ | 3,171,197 | | $ | 68,291 | | $ | 7,754,942 | |
* Refer to the Schedule of Investments for industry classifications.
Following is a reconciliation of investments in which significant unobservable inputs (Level 3) were used in determining fair value for the Income Fund:
| | Balance as of June 30, 2019 | | Realized
gain
(loss) | | Amortization | | Change in
unrealized appreciation (depreciation) | | Purchases | | Sales | |
Transfers
in to
Level 3 | | Transfers
out of
Level 3 | | Balance as of December 31, 2019 | |
| Foreign Bonds | $ | 67,702 | | $ | — | | $ | — | | $ | 589 | | $ | — | | $ | — | | $ | — | | $ | — | | $ | 68,291 | |
| Total | $ | 67,702 | | $ | — | | $ | — | | $ | 589 | | $ | — | | $ | — | | $ | — | | $ | — | | $ | 68,291 | |
The following is a quantitative summary of the techniques and inputs used to fair value the Level 3 securities as of December 31, 2019:
| Quantitative information about Level 3 fair value measurements | | |
| | | Fair value at 12/31/2019 | | Valuation technique(s) | Unobservable input | | Range (Weighted Average) | |
| Foreign Bonds | $ | 68,291 | | Asset based | Estimated value of potential litigation proceeds(1) | | 20%-30%% of outstanding debt | |
| | | | | | Marketability discount | | 28% | |
(1)A significant increase in this input in isolation would result in a significantly higher fair value measurement.
IMS FAMILY OF FUNDS
NOTES TO THE FINANCIAL STATEMENTS – (continued)
December 31, 2019 (Unaudited)
NOTE 3. SECURITIES VALUATION AND FAIR VALUE MEASUREMENTS (continued)
The total change in unrealized appreciation (depreciation) attributable to Level 3 investments still held at December 31, 2019 was $589 as shown below.
| | | Total Change in Unrealized Depreciation | |
| Foreign Bonds | | $ | 589 | |
| Total | | $ | 589 | |
See reconciliation of investments for Level 3 securities in chart above. The Income Fund recognizes transfers between fair value hierarchy levels at the end of the reporting period.
There were no transfers of assets between levels during the six month period ended December 31, 2019 for the Income Fund.
The following is a summary of the inputs used to value the Dividend Growth Fund’s investments as of December 31, 2019:
| | | | | | | Valuation Inputs | | | | | |
Investments at value | | | Level 1 –
Quoted
Prices in Active
Markets | | | | Level 2 –
Other
Significant
Observable
Inputs | | | | Level 3 –
Significant
Unobservable
Inputs | | | | Total | |
| Common Stocks* | | $ | 9,209,405 | | | $ | — | | | $ | — | | | $ | 9,209,405 | |
| Money Market Securities | | | 37,844 | | | | — | | | | — | | | | 37,844 | |
| Total | | $ | 9,247,249 | | | $ | — | | | $ | — | | | $ | 9,247,249 | |
*Refer to the Schedule of Investments for industry classifications.
The Dividend Growth Fund did not hold any investments at any time during the reporting period in which significant unobservable inputs were used in determining fair value; therefore, no reconciliation of Level 3 securities is included for this reporting period. During the six month period ended December 31, 2019, there were no transfers between levels. The Dividend Growth Fund recognizes transfers between fair value hierarchy levels at the end of the reporting period.
IMS FAMILY OF FUNDS
NOTES TO THE FINANCIAL STATEMENTS – (continued)
December 31, 2019 (Unaudited)
NOTE 4. FEES AND OTHER TRANSACTIONS WITH AFFILIATES
The Advisor serves as investment advisor to the Funds pursuant to an Investment Advisory Agreement (the “Advisory Agreement”) with the Trust. Pursuant to the Advisory Agreement, the Advisor manages the operations of the Funds and manages the Funds’ investments in accordance with the stated policies of the Funds, subject to approval of the Board of Trustees.
In addition, the Funds have entered into an Expense Limitation Agreement under which the Advisor has agreed to waive or reduce its fees and to assume other expenses of the Funds, if necessary, in an amount that limits annual operating expenses (exclusive of interest, taxes, brokerage fees and commissions, acquired fund fees and expenses, shareholder servicing fees, extraordinary expenses, and, dividend and interest expenses in connection with securities sold short) to not more than 1.95% of the Funds’ average daily net assets through October 31, 2020, subject to the Advisor’s right to recoup payments on a rolling three-year basis, so long as the payments would not exceed the 1.95% expense cap.
Under the terms of the Advisory Agreement, the Funds are obligated to pay the Advisor a fee computed and accrued daily and paid monthly. Please see the chart below for information regarding the management fee rates, management fees earned, fee waivers and recoupments, and expenses reimbursed during the six month period ended December 31, 2019, as well as amounts due to the Advisor at December 31, 2019.
| | | Value Fund | | | Income Fund | | | Dividend
Growth Fund | |
| Management fee under Advisory Agreement (as a percentage of average net assets) | | | 1.21 | % | | | 1.26 | % | | | 1.26 | % |
| Expense limitation (as a percentage of average net assets) | | | 1.95 | % | | | 1.95 | % | | | 1.95 | % |
| Management fees earned | | $ | 184,639 | | | $ | 41,640 | | | $ | 60,262 | |
| Fees recouped (waived) and (expenses reimbursed) | | $ | — | | | $ | (53,427 | ) | | $ | (45,564 | ) |
| Payable to (Due from) Advisor | | $ | 31,879 | | | $ | (338 | ) | | $ | 2,389 | |
Each waiver or reimbursement by the Advisor is subject to repayment by the Funds within the three fiscal years following the fiscal year in which the particular expense was incurred, provided that the Funds are able to make the repayment without exceeding the expense limitations in effect at the time the expenses were waived or currently in effect, whichever is lower as described above.
The amounts subject to repayment by the Income Fund and Dividend Growth Fund, pursuant to the aforementioned conditions, are as follows:
| Fund | | | Amount | | | Expires June 30, | |
| Income Fund | | | $ | 69,739 | | | | 2020 | |
| Income Fund | | | $ | 65,700 | | | | 2021 | |
| Income Fund | | | $ | 81,754 | | | | 2022 | |
| Income Fund | | | $ | 53,427 | | | | 2023 | |
| Dividend Growth Fund | | | $ | 36,744 | | | | 2020 | |
| Dividend Growth Fund | | | $ | 20,568 | | | | 2021 | |
| Dividend Growth Fund | | | $ | 47,020 | | | | 2022 | |
| Dividend Growth Fund | | | $ | 45,564 | | | | 2023 | |
IMS FAMILY OF FUNDS
NOTES TO THE FINANCIAL STATEMENTS – (continued)
December 31, 2019 (Unaudited)
NOTE 4. FEES AND OTHER TRANSACTIONS WITH AFFILIATES (continued)
There are no amounts subject to repayment by the Value Fund.
The Trust has entered into an Investment Company Services Agreement (the “Services Agreement”) with M3Sixty Administration, LLC (“M3Sixty”). Under the Services Agreement, M3Sixty is responsible for a wide variety of functions, including but not limited to: (a) Fund accounting services; (b) financial statement preparation; (c) valuation of the Funds’ portfolio securities; (d) pricing the Funds’ shares; (e) assistance in preparing tax returns; (f) preparation and filing of required regulatory reports; (g) communications with shareholders; (h) coordination of Board and shareholder meetings; (i) monitoring the Funds’ legal compliance; (j) maintaining shareholder account records.
For the six month period ended December 31, 2019, the Funds accrued servicing fees, including out of pocket expenses, as follows:
| Fund | | | Service Fees | |
| Value Fund | | | $ | 46,203 | |
| Income Fund | | | $ | 39,890 | |
| Dividend Growth Fund | | | $ | 42,846 | |
Certain officers and a Trustee of the Trust are also employees and/or officers of M3Sixty.
Matrix 360 Distributors, LLC (the “Distributor”) acts as the principal distributor of the Funds. There were no payments made to the Distributor by the Funds for the six month period ended December 31, 2019.
The Distributor is not affiliated with the Advisor. The Distributor is an affiliate of M3Sixty.
NOTE 5. LINE OF CREDIT
During the six month period ended December 31, 2019, the IMS Funds each respectively entered into an agreement with The Huntington National Bank, the custodian of the Funds’ investments, to open secured lines of credit secured by the Funds’ investments. Borrowings under this agreement bear interest at LIBOR plus 1.500%. Maximum borrowings for each Fund are lesser of $2,000,000 or 10.000% of the Fund’s daily investments at value. Total borrowings for the Funds cannot exceed $2,000,000 at any time. The current agreement expires on September 6, 2020.
| | | Value Fund | | | Income Fund | | | Dividend
Growth Fund | |
| Maximum available bank line of credit as of December 31, 2019 | | $ | 2,000,000 | | | $ | 775,494 | | | $ | 924,725 | |
| Average borrowings for the period | | $ | 205,191 | | | $ | 0 | | | $ | 78,604 | |
| Average interest rate for the period | | | 3.593 | % | | | 3.593 | % | | | 3.593 | % |
| Highest balance drawn during the year | | $ | 729,194 | | | $ | 0 | | | $ | 447,386 | |
| Interest rate at December 31, 2019 | | | 3.281 | % | | | 3.281 | % | | | 3.281 | % |
| Line of credit borrowing at December 31, 2019 | | $ | — | | | $ | — | | | $ | — | |
IMS FAMILY OF FUNDS
NOTES TO THE FINANCIAL STATEMENTS – (continued)
December 31, 2019 (Unaudited)
NOTE 6. INVESTMENTS
For the six month period ended December 31, 2019, purchases and sales of investment securities, other than short-term investments and short-term U.S. government obligations were as follows:
| | | | Value Fund | | | Income Fund | | | Dividend
Growth Fund | |
| Purchases | | | | | | | | | | |
| Other | | | $ | 30,661,283 | | | $ | 11,090,220 | | | $ | 773,735 | |
| Sales | | | | | | | | | | | | | |
| Other | | | $ | 31,987,509 | | | $ | 9,284,393 | | | $ | 2,485,655 | |
As of December 31, 2019, the net unrealized appreciation (depreciation) of investments for tax purposes was as follows:
| | | Value Fund | | | Income Fund | | | Dividend
Growth Fund | |
| Gross Appreciation | | $ | 7,204,275 | | | $ | 185,830 | | | $ | 2,212,466 | |
| Gross (Depreciation) | | | (241,686 | ) | | | (1,519,179 | ) | | | (478,750 | ) |
| Net Appreciation (Depreciation) on Investments | | $ | 6,962,589 | | | $ | (1,333,349 | ) | | $ | 1,733,716 | |
| Tax Cost | | $ | 24,421,335 | | | $ | 9,088,291 | | | $ | 7,513,533 | |
For the Value Fund, the difference between book basis and tax basis unrealized appreciation (depreciation) of investments is primarily attributable to the tax deferral of losses on wash sales.
NOTE 7. ESTIMATES
The preparation of financial statements in conformity with GAAP requires management to make estimates and assumptions that affect the reported amounts of assets and liabilities and disclosure of contingent assets and liabilities at the date of the financial statements and the reported amounts of increases and decreases in net assets from operations during the reporting period. Actual results could differ from those estimates.
NOTE 8. BENEFICIAL OWNERSHIP
The beneficial ownership, either directly or indirectly, of more than 25% of the voting securities of a fund creates a presumption of control of the fund, under Section 2(a)(9) of the Investment Company Act of 1940. As of December 31, 2019, National Financial Securities Corp. (“National Financial”) held, for the benefit of its customers, 40.56% of the Value Fund and 56.29% of the Dividend Growth Fund. As a result, National Financial may be deemed to control the Value Fund and Dividend Growth Fund. As of December 31, 2019, TD Ameritrade, Inc. (“Ameritrade”) held, for the benefit of its customers, 28.70% of the Value Fund, 61.03% of the Income Fund and 31.26% of the Dividend Growth Fund. As a result, Ameritrade may be deemed to control the Value Fund, Income Fund and Dividend Growth Fund.
IMS FAMILY OF FUNDS
NOTES TO THE FINANCIAL STATEMENTS – (continued)
December 31, 2019 (Unaudited)
NOTE 9. DISTRIBUTIONS TO SHAREHOLDERS
Value Fund – For the six month period ending December 31, 2019, the Value Fund paid distributions totaling $1.239437 per share.
The tax characterization of distributions for the six month period ended December 31, 2019 and for the fiscal year ended June 30, 2019 was as follows:
| Distributions paid from: | | Six Month Period Ended December 31,
2019 | | | Fiscal Year
Ended June 30,
2019 | |
| Ordinary Income | | $ | 552,132 | | | $ | 609,750 | |
| Long-term Capital Gains | | | 978,218 | | | | 2,596,512 | |
| Total Distributions paid | | $ | 1,530,350 | | | $ | 3,206,262 | |
Income Fund –For the six month period ended December 31, 2019, the Income Fund paid monthly distributions totaling $0.070 per share.
The tax characterization of distributions for the six month period ended December 31, 2019 and for the fiscal year ended June 30, 2019 was as follows:
| Distributions paid from: | | Six Month Period Ended December 31,
2019 | | | Fiscal Year
Ended June 30,
2019 | |
| Ordinary Income | | $ | 178,515 | | | $ | 207,454 | |
| Total Distributions paid | | $ | 178,515 | | | $ | 207,454 | |
Dividend Growth Fund – For the six month period ended December 31, 2019, the Dividend Growth Fund paid distributions totaling $0.979547 per share.
The tax characterization of distributions for the six month period ended December 31, 2019 and for the fiscal year ended June 30, 2019 was as follows:
| Distributions paid from: | | Six Month Period Ended December 31,
2019 | | | Fiscal Year
Ended June 30,
2019 | |
| Ordinary Income | | $ | 28,133 | | | $ | 63,965 | |
| Long-term Capital Gains | | | 471,799 | | | | — | |
| Total Distributions paid | | $ | 499,932 | | | $ | 63,965 | |
IMS FAMILY OF FUNDS
NOTES TO THE FINANCIAL STATEMENTS – (continued)
December 31, 2019 (Unaudited)
NOTE 9. DISTRIBUTIONS TO SHAREHOLDERS (continued)
The Funds’ tax basis distributable earnings are determined only at the end of each fiscal year. As of June 30, 2019, the components of distributable earnings (accumulated losses) on a tax basis were as follows:
| | | Value Fund | | | Income Fund | | | Dividend
Growth Fund | |
Undistributed net investment income
| | $ | 552,132 | | | $ | 12,965 | | | $ | 17,260 | |
| Deferred capital and other losses | | | (24,545 | ) | | | (76,184 | ) | | | — | |
| Accumulated realized capital gains (losses) | | | 978,218 | | | | (22,473,472 | ) | | | 387,915 | |
| Net unrealized appreciation (depreciation) | | | 4,478,661 | | | | (1,346,243 | ) | | | 1,590,396 | |
| | | $ | 5,984,466 | | | $ | (23,882,934 | ) | | $ | 1,995,571 | |
Under current law, capital losses and specified gains realized after October 31, and net investment losses realized after December 31 of a Fund’s fiscal year may be deferred and treated as occurring on the first business day of the following fiscal year for tax purposes. For disclosure purposes, these deferrals are included in “Deferred capital and other losses” above.
As of June 30, 2019, deferred capital and other losses noted above consist of:
| | | | Post-October
Capital Losses | | | Late Year
Ordinary Losses | |
| Value Fund | | | $ | — | | | $ | 24,545 | |
| Income Fund | | | | 76,184 | | | | — | |
| Dividend Growth Fund | | | | — | | | | — | |
NOTE 10. CAPITAL LOSS CARRYFORWARDS
At June 30, 2019, for federal income tax purposes, the Funds have capital loss carryforwards, in the following amounts:
| | | Value Fund | | | Income Fund | | | Dividend
Growth Fund | |
| No expiration – short term | | $ | — | | | $ | 8,547,242 | | | $ | — | |
| No expiration – long term | | | — | | | | 13,926,230 | | | | — | |
| | | $ | — | | | $ | 22,473,472 | | | $ | — | |
Capital loss carryforwards are available to offset future realized capital gains. To the extent that these carryforwards are used to offset future capital gains, it is probable that the amount offset will not be distributed to shareholders. During the year ended June 30, 2019, the Funds did not utilize any capital loss carryforwards. Capital loss carryforwards of $2,678,326 expired in the Income Fund.
IMS FAMILY OF FUNDS
NOTES TO THE FINANCIAL STATEMENTS – (continued)
December 31, 2019 (Unaudited)
NOTE 11. RESTRICTED SECURITIES
Restricted securities are securities that may only be resold upon registration under federal securities laws or in transactions exempt from such registration. In some cases, the issuer of restricted securities has agreed to register such securities for resale, at the issuer’s expense, either upon demand by a fund or in connection with another registered offering of the securities. Many restricted securities may be resold in the secondary market in transactions exempt from registration. Such restricted securities may be determined to be liquid. The Funds will not incur any registration costs upon such resale. The Income Fund’s restricted securities are valued at the price provided by pricing services or dealers in the secondary market or, if no market prices are available, at the fair value price as determined by the Fund’s Advisor or pursuant to the Fund’s fair value policy, subject to oversight by the Board of Trustees. The Income Fund has acquired securities, the sale of which is restricted under Rule 144A or Regulation S the Securities Act of 1933. It is possible that the fair value price may differ significantly from the amount that may ultimately be realized in the near term, and the difference could be material.
At December 31, 2019, the aggregate value of such securities amounted to $537,760 and the value amounts to 6.85% of the net assets of the Income Fund.
| | | Acquisition Date | | Principal Amount | | | Amortized Cost | | | Fair Value | |
| California Resources Corp., 8.000% due 12/15/2022, 144A | | 4/17/2019 | | $ | 350,000 | | | $ | 299,870 | | | $ | 150,500 | |
| Cash Store Financial Services, Inc. 11.500%, 01/31/2017, 144A | | 5/21/2012(a) | | | 1,289,000 | | | | 1,120,977 | | | | 68,291 | |
| PetSmart, Inc. , 7.125%, due 03/15/2023, 144A | | 5/02/2019 | | | 200,000 | | | | 182,069 | | | | 196,000 | |
| Vector Group Ltd., 6.125%, due 02/01/2025, 144A | | 6/05/2019 | | | 125,000 | | | | 116,260 | | | | 122,969 | |
| | | | | | | | | $ | 1,719,176 | | | $ | 537,760 | |
| (a) | Purchased on various dates beginning 05/21/2012. |
NOTE 12. SUBSEQUENT EVENTS
On January 15, 2020, the Income Fund declared a dividend of $61,325, which was payable on January 15, 2020. On February 18, 2020, the Income Fund declared a dividend of $62,650, which was payable on February 18, 2020.
Management has evaluated subsequent events through the issuance of the financial statements and has noted no other such events that would require disclosure.
NOTE 13. INDEMNIFICATIONS
In the normal course of business, the Funds enter into contracts that contain general indemnifications to other parties. The Funds’ maximum exposure under these contracts is unknown as this would involve future claims that may be made against the Funds that have not yet occurred. The Funds expect the risk of loss to be remote.
IMS FAMILY OF FUNDS
NOTES TO THE FINANCIAL STATEMENTS – (continued)
December 31, 2019 (Unaudited)
NOTE 14. RECENT ACCOUNTING PRONOUNCEMENTS
In August 2018, the Financial Accounting Standards Board (“FASB”) issued Accounting Standards Update (ASU) No. 2018-13 “Fair Value Measurement (Topic 820): Disclosure Framework – Changes to the Disclosure Requirements for Fair Value Measurement” (“ASU 2018-13”) which includes amendments intended to improve the effectiveness of disclosures in the notes to financial statements. For example, ASU 2018-13 includes additional disclosures regarding the range and weighted average of significant unobservable inputs used to develop Level 3 fair value measurements, and clarifications to the narrative description of measurement uncertainty disclosures. ASU 2018-13 is effective for interim and annual periods beginning after December 15, 2019. Management has evaluated the implications of certain provisions of ASU 2018-13 and has elected to early adopt all aspects of the amendment effective with the Funds’ financial statements within this Semi-Annual Report.
TRUSTEES AND OFFICERS – (Unaudited)
The Trustees are responsible for the management and supervision of the Funds. The Trustees approve all significant agreements between the Trust, on behalf of the Funds, and those companies that furnish services to the Funds; review performance of the Funds; and oversee activities of the Funds. This section provides information about the persons who serve as Trustees and Officers to the Trust and Funds, respectively. The Statement of Additional Information for each Fund includes additional information about the Trustees and officers and is available, without charge, upon request by calling the Funds toll-free at (800) 934-5550.
Trustees and Officers. Following are the Trustees and Officers of the Trust, their age and address, their present position with the Trust or the Funds, and their principal occupation during the past five years. As described above under “Description of the Trust”, each of the Trustees of the Trust will generally hold office indefinitely. The Officers of the Trust will hold office indefinitely, except that: (1) any Officer may resign or retire and (2) any Officer may be removed any time by written instrument signed by at least two-thirds of the number of Trustees prior to such removal. In case a vacancy or an anticipated vacancy on the Board of Trustees shall for any reason exist, the vacancy shall be filled by the affirmative vote of a majority of the remaining Trustees, subject to certain restrictions under the 1940 Act. Those Trustees who are “interested persons” (as defined in the 1940 Act) by virtue of their affiliation with either the Trust or the Advisor, are indicated in the table. The address of each trustee and officer is 4300 Shawnee Mission Parkway, Suite 100, Fairway, KS 66205.
Name and Year of Birth | Position(s) Held with Trust | Length of Service | Principal Occupation(s) During Past 5 Years | Number of Series Overseen | Other Directorships During Past 5 Years |
| Independent Trustees |
Arthur Q. Falk YOB: 1937 | Trustee | Since 2011 | Retired. President, Murray Hill Financial Marketing, (financial marketing consultant) (1990–2012). | Ten | None |
Tom M. Wirtshafter YOB: 1954 | Trustee | Since 2011 | Senior Vice President, American Portfolios Financial Services, (broker-dealer), American Portfolios Advisors (investment advisor) (2009–Present). | Ten | None |
Gary W. DiCenzo YOB: 1962 | Trustee Independent Chairman | Since 2014 Since 2019 | Partner, Cognios Capital (investment management firm) (2015–present) Chief Executive officer 2015–2019; President and CEO, IMC Group, LLC (asset management firm consultant) (2010–2015). | Ten | FNEX Ventures (2018-present) |
Steven D. Poppen YOB: 1968 | Trustee | Since 2018 | Executive Vice President and Chief Financial Officer, Minnesota Vikings (professional sports organization) (1998–present). | Ten | M3Sixty Funds Trust (3 portfolios) (2015-present); FNEX Ventures (2018-present) |
| Thomas J. Schmidt YOB: 1963 | Trustee | Since 2018 | Principal, Tom Schmidt & Associates Consulting, LLC (financial services consulting practice) (2015–Present); Vice President, DST Systems, Inc. (financial services transfer agent) (1986–2014). | Ten | FNEX Ventures (2018-present) |
TRUSTEES AND OFFICERS – (Unaudited) (continued)
Name, Address and Year of Birth | Position(s) Held with Trust | Length of Service | Principal Occupation(s) During Past 5 Years | Number of Series Overseen | Other Directorships During Past 5 Years |
| Interested Trustee* | | | | | |
Randall K. Linscott YOB: 1971 | President | Since 2013 | Chief Executive Officer, M3Sixty Administration, LLC (2013–present); Chief Operating Officer, M3Sixty Administration, LLC (2011–2013); Division Vice President, Boston Financial Data Services, (2005–2011). | Ten | M3Sixty Funds Trust
(3 portfolios)
(2015-Present) |
| Officers | | | | | |
Andras P. Teleki YOB: 1971 | Chief Compliance Officer and Secretary | Since 2015 | Chief Legal Officer, M3Sixty Administration, LLC, M3Sixty Holdings, LLC, Matrix 360 Distributors, LLC and M3Sixty Advisors, LLC (2015–present); Chief Compliance Officer and Secretary, M3Sixty Funds Trust (2016–present); Chief Compliance Officer and Secretary, WP Trust (2016–present); Secretary and Assistant Treasurer, Capital Management Investment Trust (2015); Partner, K&L Gates, (2009–2015). | N/A | N/A |
Brandon J. Byrd YOB: 1981 | Assistant Secretary and Anti-Money Laundering Officer; Vice President | Since 2013 Since 2018 | Chief Operating Officer, M3Sixty Administration, LLC (2013–present); Anti-Money Laundering Compliance Officer, Monteagle Funds (2015–2016); Division Manager - Client Service Officer, Boston Financial Data Services (mutual find service provider) (2010–2012). | N/A | N/A |
* The Interested Trustee is an Interested Trustee because he is an officer and employee of the Administrator.
TRUSTEES AND OFFICERS – (Unaudited) (continued)
Name, Address and Year of Birth | Position(s) Held with Trust | Length of Service | Principal Occupation(s) During Past 5 Years | Number of Series Overseen | Other Directorships During Past 5 Years |
| Officers (continued) | | | | | |
Larry E. Beaver, Jr.** YOB: 1969 | Assistant Treasurer | Since 2017 | Fund Accounting, Administration and Tax Officer, M3Sixty Administration, LLC (2017–Present); Director of Fund Accounting & Administration, M3Sixty Administration, LLC (2005–2017); Chief Accounting Officer, Amidex Funds, Inc. (2003–Present); Assistant Treasurer, Capital Management Investment Trust (July 2017–Present); Assistant Treasurer, M3Sixty Funds Trust (July 2017–Present; Assistant Treasurer, WP Funds Trust (July 2017–Present); Treasurer and Assistant Secretary, Capital Management Investment Trust (2008–2017); Treasurer, 360 Funds (2007–2017); Treasurer, M3Sixty Funds Trust (2015–2017); Treasurer, WP Trust (2015–2017); Treasurer and Chief Financial Officer, Monteagle Funds (2008–2016). | N/A | N/A |
John H. Lively YOB: 1969 | Assistant Secretary | Since 2017 | Managing Partner, Practus, LLP (law firm) (May 2018–present); Attorney, The Law Offices of John H. Lively & Associates, Inc. (law firm) (May 2018). | N/A | N/A |
Ted L. Akins YOB: 1974 | Assistant Secretary | Since 2018 | Vice President of Operations, M3Sixty Administration, LLC (2012–present). | N/A | N/A |
** Effective December 28, 2018, Larry E. Beaver, Jr. was assigned as Inerim Treasurer until a new Treasurer is appointed by the Board.
TRUSTEES AND OFFICERS – (Unaudited) (continued)
Remuneration Paid to Trustees and Officers - Officers of the Trust and Trustees who are “interested persons” of the Trust or the Advisor will receive no salary or fees from the Trust. Officers of the Trust and interested Trustees do receive compensation directly from certain service providers to the Trust, including Matrix 360 Distributors, LLC and M3Sixty Administration, LLC. Each Trustee who is not an “interested person” receives a $5,000 annual retainer (paid quarterly). In addition, each Independent Trustee receives, on a per fund basis: (i) a fee of $1,500 per fund each year (paid quarterly); (ii) a fee of $200 per Board meeting attended; and (iii) a fee of $200 per committee meeting attended. The Trust will also reimburse each Trustee for travel and other expenses incurred in connection with, and/or related to, the performance of their obligations as a Trustee. Officers of the Trust will also be reimbursed for travel and other expenses relating to their attendance at Board meetings.
| Name of Trustee1 | | Aggregate
Compensation From the IMS
Family of Funds2 | | | Pension or Retirement
Benefits Accrued As Part
of Portfolio Expenses | | Estimated
Annual Benefits
Upon
Retirement | | Total Compensation From the IMS Family of Funds Paid to Trustees2 | |
| Independent Trustees | |
| Arthur Q. Falk | | $ | 5,200 | | | None | | | None | | | $ | 5,200 | |
| Tom M. Wirtshafter | | $ | 4,800 | | | None | | | None | | | $ | 4,800 | |
| Gary W. DiCenzo | | $ | 5,200 | | | None | | | None | | | $ | 5,200 | |
| Steven D. Poppen | | $ | 4,800 | | | None | | | None | | | $ | 4,800 | |
| Thomas J. Schmidt | | $ | 5,200 | | | None | | | None | | | $ | 5,200 | |
| | | | | | | | | | | | | | | |
| Interested Trustee | |
| Randall K. Linscott | | | None | | | None | | | None | | | | None | |
1Each of the Trustees serves as a Trustee to three (3) IMS Family of Funds of the Trust. The Trust currently offers ten (10) series of shares.
2Figures are for the six month period ended December 31, 2019.
OTHER INFORMATION – (Unaudited)
The Funds’ Statement of Additional Information (“SAI”) includes additional information about the trustees and is available without charge, upon request. You may call toll-free at (800) 934-5550 to request a copy of the SAI or to make shareholder inquiries.
The Funds file their complete schedules of portfolio holdings with the Securities and Exchange Commission (the “Commission”) for the first and third quarters of each fiscal year on Form N-Q. The Funds’ Forms N-Q are available on the Commission’s website at http://www.sec.gov. The Funds’ Forms N-Q may be reviewed and copied at the Commission’s Public Reference Room in Washington, DC. Information on the operation of the Commission’s Public Reference Room may be obtained by calling 1-800-SEC-0330.
A description of the policies and procedures that the Funds use to determine how to vote proxies relating to portfolio securities is available without charge, upon request, by calling (800) 934-5550; and on the Commission’s website at http://www.sec.gov.
Information regarding how the Funds voted proxies relating to portfolio securities during the most recent 12-month period ended June 30th is available without charge, upon request, by calling (800) 934-5550; and on the Commission’s website at http://www.sec.gov.
Shareholder Tax Information - The Funds are required to advise you within 60 days of the Fund’s fiscal year end regarding the federal tax status of distributions received by shareholders during the fiscal year. For the six month period ended December 31, 2019, certain distributions paid by the Funds may be subject to a maximum tax rate of 20%. The Value Fund, Income Fund and Dividend Growth Fund intend to designate up to a maximum amount of $1,530,350, $178,515 and $499,932, respectively, as taxed at a maximum rate of 20%.
Tax information is reported from the Funds’ fiscal year and not calendar year, therefore, shareholders should refer to their Form 1099-DIV or other tax information which will be mailed in 2020 to determine the calendar year amounts to be included on their 2019 tax returns. Shareholders should consult their own tax advisors.
360 FUNDS
4300 Shawnee Mission Parkway
Suite 100
Fairway, KS 66205
INVESTMENT ADVISOR
IMS Capital Management, Inc.
8995 S.E. Otty Road,
Portland, OR 97086
ADMINISTRATOR & TRANSFER AGENT
M3Sixty Administration, LLC
4300 Shawnee Mission Parkway
Suite 100
Fairway, KS 66205
DISTRIBUTOR
Matrix 360 Distributors, LLC
4300 Shawnee Mission Parkway
Suite 100
Fairway, KS 66205
INDEPENDENT REGISTERED PUBLIC ACCOUNTING FIRM
BBD, LLP
1835 Market Street
3rdFloor
Philadelphia, PA 19103
LEGAL COUNSEL
Practus, LLP
11300 Tomahawk Creek Parkway
Suite 310
Leawood, KS 66211
CUSTODIAN BANK
Huntington National Bank
41 South Street
Columbus, OH 43125
This report is intended only for the information of shareholders or those who have received the Funds’ prospectus which contains information about each Fund’s management fee and expenses. Please read the prospectus carefully before investing.
Not applicable at this time.
| ITEM 3. | AUDIT COMMITTEE FINANCIAL EXPERT. |
Not applicable at this time.
| ITEM4. | PRINCIPAL ACCOUNTANT FEES AND SERVICES. |
Not applicable at this time.
| ITEM 5. | AUDIT COMMITTEE OF LISTED REGISTRANTS. |
Not applicable.
| ITEM 6. | SCHEDULE OF INVESTMENTS. |
Included in semi-annual report to shareholders filed under item 1 of this form.
| ITEM 7. | DISCLOSURE OF PROXY VOTING POLICIES AND PROCEDURES FOR CLOSED-END MANAGEMENT INVESTMENT COMPANIES. |
Not applicable as the Funds are open-end management investment companies.
| ITEM 8. | PORTFOLIO MANAGERS OF CLOSED-END MANAGEMENT INVESTMENT COMPANIES. |
Not applicable as the Funds are open-end management investment companies.
| ITEM 9. | PURCHASES OF EQUITY SECURITIES BY CLOSED-END MANAGEMENT INVESTMENT COMPANY AND AFFILIATED PURCHASERS. |
Not applicable as the Funds are open-end management investment companies.
| ITEM 10. | SUBMISSION OF MATTERS TO A VOTE OF SECURITY HOLDERS. |
Not applicable at this time.
| ITEM 11. | CONTROLS AND PROCEDURES. |
| (a) | The registrant’s principal executive and principal financial officers, or persons performing similar functions, have concluded that the registrant’s disclosure controls and procedures (as defined in Rule 30a-3(c) under the 1940 Act, are effective, as of a date within 90 days of the filing date of this report, based on the evaluation of these controls and procedures required by Rule 30a-3(b) under the 1940 Act and Rule 15d-15(b) under the Securities Exchange Act of 1934, as amended. |
| (b) | There were no changes in the registrant’s internal control over financial reporting (as defined in Rule 30a-3(d) under the 1940 Act) that occurred during the period covered by this report that have materially affected, or are reasonably likely to materially affect, the registrant’s internal control over financial reporting. |
| ITEM 12. | DISCLOSURE OF SECURITIES LENDING ACTIVITIES FOR CLOSED-END MANAGEMENT INVESTMENT COMPANIES. |
Not applicable as the Funds are open-end management investment companies.
(a) Certifications pursuant to Section 302 of the Sarbanes-Oxley Act of 2002 are filed herewith.
(b) Certifications pursuant to Section 906 of the Sarbanes-Oxley Act of 2002 are filed herewith.
SIGNATURES
Pursuant to the requirements of the Securities Exchange Act of 1934 and the Investment Company Act of 1940, the registrant has duly caused this report to be signed on its behalf by the undersigned, thereunto duly authorized.
360 Funds
/s/ Randy Linscott | |
By: Randy Linscott | |
Principal Executive Officer | |
Date: March 6, 2020 | |
Pursuant to the requirements of the Securities Exchange Act of 1934 and the Investment Company Act of 1940, this report has been signed below by the following person on behalf of the registrant and in the capacities and on the date indicated.
/s/ Randy Linscott | |
By: Randy Linscott | |
Principal Executive Officer, | |
Date: March 6, 2020 | |
Pursuant to the requirements of the Securities Exchange Act of 1934 and the Investment Company Act of 1940, this report has been signed below by the following person on behalf of the registrant and in the capacities and on the date indicated.
/s/ Larry E. Beaver, Jr. | |
By: Larry E. Beaver, Jr. | |
Assistant Treasurer and Acting Principal Financial Officer |
Date: March 6, 2020 | |