UNITED STATES
SECURITIES AND EXCHANGE COMMISSION
Washington, D.C. 20549
FORM N-CSR
CERTIFIED SHAREHOLDER REPORT OF REGISTERED MANAGEMENT INVESTMENT COMPANIES
Investment Company Act File Number 811-21726
360 Funds
(Exact name of registrant as specified in charter)
| 4300 Shawnee Mission Parkway, Suite 100 Fairway, KS | 66205 |
| (Address of principal executive offices) | (Zip code) |
The Corporation Trust Company
Corporation Trust Center
1209 Orange St.
Wilmington, DE 19801
(Name and address of agent for service)
With Copies To:
Bo J. Howell
Strauss Troy Co., LPA
Federal Reserve Building
150 E. 4th Street, 4th Floor
Cincinnati, OH 45202-4018
Registrant's telephone number, including area code: 877-244-6235
Date of fiscal year end: 11/30/2021
Date of reporting period: 05/31/2021
| ITEM 1. | REPORTS TO SHAREHOLDERS |
The Semi-Annual report to Shareholders of the FinTrust Income and Opportunity Fund (the “Fund”), a series of the 360 Funds (the “registrant”), for the period ended May 31, 2021 pursuant to Rule 30e-1 under the Investment Company Act of 1940, as amended (the “1940 Act”) (17 CFR 270.30e-1) is filed herewith.

FinTrust Income and Opportunity Fund
Class A Shares (Ticker Symbol: HROAX)
Institutional Class Shares (Ticker Symbol: HIOIX)
A Series of the
360 Funds
SEMI-ANNUAL REPORT
May 31, 2021
Investment Adviser:
FinTrust Capital Advisors, LLC
124 Verdae Boulevard, Suite 504
Greenville, SC 29607
IMPORTANT NOTE: Beginning on January 1, 2021, as permitted by regulations adopted by the SEC, paper copies of the FinTrust Fund’s shareholder reports are no longer being sent by mail unless you specifically requested paper copies of the reports from a FinTrust Fund or from your financial intermediary, such as a broker-dealer or bank. Instead, the reports will be made available on a website, and you will be notified by mail each time a report is posted and provided with a website link to access the report. If you already elected to receive shareholder reports electronically, you will not be affected by this change and you need not take any action. You may elect to receive all future reports in paper free of charge. You can inform a FinTrust Fund or your financial intermediary that you wish to continue receiving paper copies of your shareholder reports by calling or sending an e-mail request. Your election to receive reports in paper will apply to all funds held within the FinTrust Fund complex/your financial intermediary.
TABLE OF CONTENTS
| FinTrust Income and Opportunity Fund | SEMI-ANNUAL REPORT |
INVESTMENT HIGHLIGHTS (Unaudited)
May 31, 2021
The investment objective of the FinTrust Income and Opportunity Fund (the “Fund”) is total return comprised of income and capital appreciation. To meet its investment objective, the Fund will invest primarily in domestic equity securities that in the opinion of FinTrust Capital Advisors, LLC (the “Adviser”) have above average intellectual property portfolios and other characteristics, like strong earnings and dividend growth that are members of the S&P 1500 Composite, relative to their sector competitors.
The Fund will typically invest in issuers that have established markets and operations and generate excess cash flow. The Fund looks for stocks with attributes which suggest they will thrive in good markets and survive potential economic setbacks. The Fund employs detailed quantitative assessments to construct its equity portfolio. Portfolio parameters include, but are not limited to, a quantitative valuation of the strength of the company’s intellectual property portfolio, steady growing earnings, dividend yield with a tendency to raise such yield and availability at reasonable price-earnings ratios. The Fund seeks to invest in stocks that are undervalued by the market, but with strong business models, which may provide for lower levels of market volatility or non-correlated volatility, The Fund also prefers to invest in equity stocks that have options traded on them.
The Fund may also invest in companies that are experiencing a “special situation” that makes them undervalued relative to their long-term potential. Developments creating special situations may include new intellectual property developments, intellectual property licensing deals, mergers, spin-offs, litigation resolutions, new products or management changes. The Fund may also invest in convertible securities. The Fund also seeks to generate income for shareholders by selling options against the risk taken by owning common stocks. For example, the Fund intends to sell covered call options on a portion of its stock holdings. This income is designed to, over time, add to portfolio stability and improve returns. The Fund uses an options strategy to limit market exposure and volatility. The extent of option selling will depend upon market conditions and the Adviser’s judgment of the advantages of selling call options on the Fund’s equity investments. Additionally, the Fund will enter into call spreads. A spread is an options position established by purchasing one option and selling another option of the same class, but of a different series.
The Fund may be appropriate for investors with long-term time horizons who are not sensitive to short-term losses and want to participate in the long-term growth of the financial markets. The Fund seeks to avoid or minimize the effects of inflation on the portfolio.
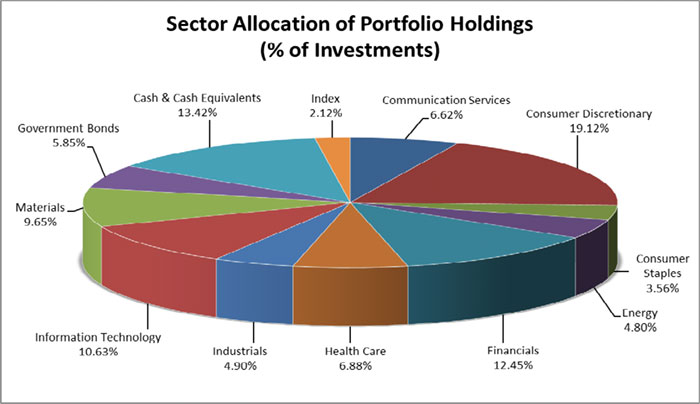
The percentages in the above graph are based on the portfolio holdings of the Fund as of May 31, 2021 and are subject to change. For a detailed break-out of holdings by industry and investment type, please refer to the Schedule of Investments and Schedule of Written Options.
| FINTRUST INCOME AND OPPORTUNITY FUND | |
| SCHEDULE OF INVESTMENTS | |
| May 31, 2021 (Unaudited) | SEMI-ANNUAL REPORT |
| | |
| COMMON STOCK - 76.81% | | Shares | | | Value | |
| | | | | | | |
| Aerospace & Defense - 0.69% | | | | | | | | |
| Embraer SA - Brazil - ADR (a) | | | 15,000 | | | $ | 200,850 | |
| | | | | | | | | |
| Agriculture - 1.17% | | | | | | | | |
| Archer-Daniels-Midland Co. | | | 1,500 | | | | 99,795 | |
| Bunge Ltd. (d) | | | 2,750 | | | | 238,755 | |
| | | | | | | | 338,550 | |
| Auto Manufacturers - 5.85% | | | | | | | | |
| Ford Motor Co. (a) | | | 50,000 | | | | 726,500 | |
| Tesla, Inc. (a) | | | 300 | | | | 187,566 | |
| Volkswagen AG - Germany - ADR | | | 10,000 | | | | 361,650 | |
| Workhorse Group, Inc. (a) | | | 45,000 | | | | 421,650 | |
| | | | | | | | 1,697,366 | |
| Auto Parts & Equipment - 1.08% | | | | | | | | |
| Tenneco, Inc. - Class A (a) | | | 20,000 | | | | 313,600 | |
| | | | | | | | | |
| Banks - 2.84% | | | | | | | | |
| Eagle Bancorp, Inc. | | | 4,000 | | | | 228,560 | |
| First Internet Bancorp | | | 5,000 | | | | 169,600 | |
| Regions Financial Corp. | | | 5,000 | | | | 117,050 | |
| Truist Financial Corp. | | | 5,000 | | | | 308,900 | |
| | | | | | | | 824,110 | |
| Beverages - 2.69% | | | | | | | | |
| Ambev SA - Brazil - ADR | | | 95,000 | | | | 328,700 | |
| Molson Coors Beverage Co. - Class B | | | 7,750 | | | | 451,980 | |
| | | | | | | | 780,680 | |
| Building Materials - 2.79% | | | | | | | | |
| Builders FirstSource, Inc. (a) | | | 10,000 | | | | 445,400 | |
| JELD-WEN Holding, Inc. (a) | | | 13,000 | | | | 364,130 | |
| | | | | | | | 809,530 | |
| Chemicals - 3.01% | | | | | | | | |
| Chemours Co. | | | 10,000 | | | | 359,300 | |
| Element Solutions, Inc. | | | 5,000 | | | | 116,950 | |
| Mosaic Co. (d) | | | 11,000 | | | | 397,540 | |
| | | | | | | | 873,790 | |
| Computers - 3.62% | | | | | | | | |
| Apple, Inc. (d) | | | 1,500 | | | | 186,915 | |
| Lumentum Holdings, Inc. (a) | | | 5,800 | | | | 471,946 | |
| Vuzix Corp. (a) | | | 22,500 | | | | 392,850 | |
| | | | | | | | 1,051,711 | |
| Diversified Financial Services - 3.90% | | | | | | | | |
| Discover Financial Services (d) | | | 4,000 | | | | 469,040 | |
| Enova International, Inc. (a) | | | 17,500 | | | | 662,725 | |
| | | | | | | | 1,131,765 | |
| Electronics - 1.23% | | | | | | | | |
| Wrap Technologies, Inc. (a) | | | 40,000 | | | | 358,400 | |
| | | | | | | | | |
| Engineering & Construction - 2.01% | | | | | | | | |
| Sterling Construction Co., Inc. (a) | | | 26,000 | | | | 585,000 | |
| | | | | | | | | |
| Healthcare - Products - 0.65% | | | | | | | | |
| Medtronic PLC - Ireland (d) | | | 1,500 | | | | 189,885 | |
| | | | | | | | | |
| Healthcare - Services - 1.27% | | | | | | | | |
| Centene Corp. (a) (d) | | | 5,000 | | | | 368,000 | |
| FINTRUST INCOME AND OPPORTUNITY FUND | |
| SCHEDULE OF INVESTMENTS | |
| May 31, 2021 (Unaudited) | SEMI-ANNUAL REPORT |
| COMMON STOCK - 76.81% (continued) | | Shares | | | Value | |
| | | | | | | |
| Home Furnishings - 1.52% | | | | | | | | |
| Tempur Sealy International, Inc. | | | 11,500 | | | $ | 442,750 | |
| | | | | | | | | |
| Insurance - 2.63% | | | | | | | | |
| Brighthouse Financial, Inc. (a) | | | 10,000 | | | | 486,600 | |
| Greenlight Capital Re Ltd. - Class A - Cayman Islands (a) | | | 30,000 | | | | 277,500 | |
| | | | | | | | 764,100 | |
| | | | | | | | | |
| Internet - 6.27% | | | | | | | | |
| Alphabet, Inc. - Class C (a) (d) | | | 400 | | | | 964,624 | |
| Amazon.com, Inc. (a) (d) | | | 100 | | | | 322,307 | |
| eBay, Inc. | | | 3,750 | | | | 228,300 | |
| Jumia Technologies AG - Germany - ADR (a) (d) | | | 2,500 | | | | 72,975 | |
| Yatra Online, Inc. - India (a) | | | 110,000 | | | | 232,100 | |
| | | | | | | | 1,820,306 | |
| Leisure Time - 3.81% | | | | | | | | |
| Callaway Golf Co. (a) (d) | | | 30,000 | | | | 1,107,600 | |
| | | | | | | | | |
| Lodging - 0.86% | | | | | | | | |
| Target Hospitality Corp. (a) | | | 65,000 | | | | 250,250 | |
| | | | | | | | | |
| Media - 1.11% | | | | | | | | |
| Discovery, Inc. (a) | | | 10,000 | | | | 321,100 | |
| | | | | | | | | |
| Mining - 6.55% | | | | | | | | |
| Barrick Gold Corp. - Canada | | | 7,000 | | | | 168,560 | |
| Cameco Corp. - Canada | | | 15,000 | | | | 299,550 | |
| Energy Fuels, Inc. - Canada (a) | | | 20,000 | | | | 129,800 | |
| Freeport-McMoRan, Inc. (d) | | | 6,000 | | | | 256,320 | |
| Glencore PLC - Switzerland - ADR | | | 25,000 | | | | 226,250 | |
| Newmont Corp. | | | 3,000 | | | | 220,440 | |
| Pan American Silver Corp. - Canada (d) | | | 15,000 | | | | 504,600 | |
| Wheaton Precious Metals Corp. - Canada (d) | | | 2,000 | | | | 96,040 | |
| | | | | | | | 1,901,560 | |
| Oil & Gas - 0.86% | | | | | | | | |
| SM Energy Co. (d) | | | 12,500 | | | | 248,750 | |
| | | | | | | | | |
| Packaging & Containers - 0.95% | | | | | | | | |
| O-I Glass, Inc. (a) | | | 15,000 | | | | 276,450 | |
| | | | | | | | | |
| Pharmaceuticals - 4.38% | | | | | | | | |
| AbbVie, Inc. (d) | | | 1,500 | | | | 169,800 | |
| Bristol-Myers Squibb Co. | | | 5,000 | | | | 328,600 | |
| Curaleaf Holdings, Inc. (a) | | | 50,000 | | | | 736,920 | |
| SIGA Technologies, Inc. (a) | | | 5,000 | | | | 35,250 | |
| | | | | | | | 1,270,570 | |
| Pipelines - 2.67% | | | | | | | | |
| Green Plains Partners LP | | | 20,000 | | | | 248,800 | |
| Williams Cos., Inc. | | | 20,000 | | | | 526,800 | |
| | | | | | | | 775,600 | |
| Private Equity - 0.45% | | | | | | | | |
| Carlyle Group, Inc. | | | 3,000 | | | | 130,920 | |
| | | | | | | | | |
| FINTRUST INCOME AND OPPORTUNITY FUND | |
| SCHEDULE OF INVESTMENTS | |
| May 31, 2021 (Unaudited) | SEMI-ANNUAL REPORT |
| | |
| COMMON STOCK - 76.81% (continued) | | Shares | | | Value | |
| | | | | | | |
| Retail - 3.35% | | | | | | | | |
| Academy Sports & Outdoors, Inc. (a) | | | 5,000 | | | $ | 182,650 | |
| Arcos Dorados Holdings, Inc. - Class A - Uruguay (a) | | | 74,000 | | | | 478,780 | |
| GameStop Corp. - Class A (a) (d) | | | 1,400 | | | | 310,800 | |
| | | | | | | | 972,230 | |
| Semiconductors - 2.72% | | | | | | | | |
| NXP Semiconductors NV - Netherlands (d) | | | 2,000 | | | | 422,840 | |
| QUALCOMM, Inc. | | | 200 | | | | 26,908 | |
| Skyworks Solutions, Inc. | | | 2,000 | | | | 340,000 | |
| | | | | | | | 789,748 | |
| Software - 1.13% | | | | | | | | |
| Activision Blizzard, Inc. (d) | | | 2,000 | | | | 194,500 | |
| Domo, Inc. - Class B (a) (d) | | | 2,000 | | | | 133,000 | |
| | | | | | | | 327,500 | |
| Telecommunications - 4.75% | | | | | | | | |
| Nokia Oyi - Finland - ADR (a) | | | 85,000 | | | | 438,600 | |
| Telefonaktiebolaget LM Ericsson - Sweden - ADR | | | 70,000 | | | | 940,100 | |
| | | | | | | | 1,378,700 | |
| | | | | | | | | |
| TOTAL COMMON STOCK (Cost $19,403,050) | | | | | | | 22,301,371 | |
| | | | | | | | | |
| PREFERRED STOCK - 4.32% | | | | | | | | |
| | | | | | | | | |
| Banks - 2.00% | | | | | | | | |
| United Community Banks, Inc., 6.875% - Series I (e) | | | 21,000 | | | | 580,230 | |
| | | | | | | | | |
| Media - 1.00% | | | | | | | | |
| ViacomCBS, Inc., 5.75% - Series A | | | 4,000 | | | | 291,920 | |
| | | | | | | | | |
| Sovereign - 1.32% | | | | | | | | |
| Federal National Mortgage Association, 8.25% - Series S (a) | | | 60,000 | | | | 382,200 | |
| | | | | | | | | |
| TOTAL PREFERRED STOCK (Cost $1,370,221) | | | | | | | 1,254,350 | |
| | | | | | | | | |
| EXCHANGE-TRADED FUND - 1.38% | | | | | | | | |
| | | | | | | | | |
| Commodity Fund - 1.38% | | | | | | | | |
| ProShares Ultra Silver (a) | | | 7,500 | | | | 399,975 | |
| | | | | | | | | |
| TOTAL EXCHANGE-TRADE FUNDS (Cost $372,724) | | | | | | | 399,975 | |
| | | | | | Exercise | | | | | | | |
| WARRANTS - 0.21% | | Shares 1 | | | Price | | | Expiration | | | | |
| | | | | | | | | | | | | |
| Energy Fuels, Inc. - Canada (a) | | | 15,000 | | | $ | 2.45 | | | | 9/20/2021 | | | $ | 60,975 | |
| | | | | | | | | | | | | | | | | |
| TOTAL WARRANTS (Cost $34,718) | | | | | | | | | | | | | | | 60,975 | |
| GOVERNMENT BONDS - 6.27% | | Principal | | | | |
| | | | | | | |
| U.S. Treasury Note, 0.125%, due 10/31/2022 (e) | | $ | 815,000 | | | $ | 815,222 | |
| U.S. Treasury Note, 1.375%, due 01/31/2022 (e) | | | 500,000 | | | | 504,375 | |
| U.S. Treasury Bill, 0.025%, due 01/27/2022 (e) (f) | | | 500,000 | | | | 499,917 | |
| | | | | | | | | |
| TOTAL GOVERNMENT BONDS (Cost $1,815,495) | | | | | | | 1,819,514 | |
| FINTRUST INCOME AND OPPORTUNITY FUND | |
| SCHEDULE OF INVESTMENTS | |
| May 31, 2021 (Unaudited) | SEMI-ANNUAL REPORT |
| | |
| OPTIONS PURCHASED - 5.81% | |
| | |
| | | | | | Notional | | | Exercise | | | | | | | |
| CALL OPTIONS PURCHASED - 3.30% | | Contracts 2 | | | Amount | | | Price | | | Expiration | | | Value | |
| Alphabet, Inc. - Class C | | | 2 | | | $ | 300,000 | | | $ | 1,500.00 | | | | 1/21/2022 | | | $ | 189,066 | |
| Amazon.com, Inc. | | | 1 | | | | 260,000 | | | | 2,600.00 | | | | 1/21/2022 | | | | 72,310 | |
| Boston Scientific Corp. | | | 60 | | | | 180,000 | | | | 30.00 | | | | 1/21/2022 | | | | 78,450 | |
| Bristol-Myers Squibb Co. | | | 50 | | | | 275,000 | | | | 55.00 | | | | 1/21/2022 | | | | 55,800 | |
| Citigroup, Inc. | | | 50 | | | | 300,000 | | | | 60.00 | | | | 1/21/2022 | | | | 98,600 | |
| CVS Health Corp. | | | 50 | | | | 300,000 | | | | 60.00 | | | | 1/21/2022 | | | | 136,350 | |
| Facebook, Inc. - Class A | | | 15 | | | | 337,500 | | | | 225.00 | | | | 1/21/2022 | | | | 162,525 | |
| Intel Corp. | | | 30 | | | | 150,000 | | | | 50.00 | | | | 1/21/2022 | | | | 27,750 | |
| Intel Corp. | | | 50 | | | | 250,000 | | | | 50.00 | | | | 1/20/2023 | | | | 58,750 | |
| Pfizer, Inc. | | | 30 | | | | 90,000 | | | | 30.00 | | | | 1/21/2022 | | | | 26,910 | |
| Pfizer, Inc. | | | 20 | | | | 60,000 | | | | 30.00 | | | | 7/16/2021 | | | | 18,120 | |
| Sally Beauty Holdings, Inc. | | | 50 | | | | 75,000 | | | | 15.00 | | | | 6/18/2021 | | | | 34,000 | |
| | | | | | | | | | | | | | | | | | | | | |
| TOTAL CALL OPTIONS PURCHASED (Cost $845,148) | | | | 958,631 | |
| | | | | | | | | | | | | | | | | | | | | |
| PUT OPTIONS PURCHASED - 2.51% | | | | | | | | | | |
| Invesco QQQ Trust Series 1 | | | 105 | | | | 3,255,000 | | | | 310.00 | | | | 9/30/2021 | | | | 91,245 | |
| iShares Russell 2000 ETF | | | 100 | | | | 2,100,000 | | | | 210.00 | | | | 9/30/2021 | | | | 64,300 | |
| iShares Russell 2000 ETF | | | 60 | | | | 1,350,000 | | | | 225.00 | | | | 9/30/2021 | | | | 68,880 | |
| Moderna, Inc. | | | 10 | | | | 150,000 | | | | 150.00 | | | | 10/15/2021 | | | | 9,650 | |
| SPDR S&P 500 ETF Trust | | | 155 | | | | 6,122,500 | | | | 395.00 | | | | 9/30/2021 | | | | 142,290 | |
| SPDR S&P 500 ETF Trust | | | 150 | | | | 6,150,000 | | | | 410.00 | | | | 12/31/2021 | | | | 292,200 | |
| Scotts Miracle-Gro Co. | | | 50 | | | | 1,050,000 | | | | 210.00 | | | | 9/17/2021 | | | | 60,750 | |
| | | | | | | | | | | | | | | | | | | | | |
| TOTAL PUT OPTIONS PURCHASED (Cost $1,067,124) | | | | 729,315 | |
| | | | | | | | | | | | | | | | | | | | | |
| TOTAL OPTIONS PURCHASED (Cost $1,912,272) | | | | 1,687,946 | |
| | | Shares | | | | |
| SHORT-TERM INVESTMENTS - 14.37% | | | | | | | | |
| Federated Hermes Government Obligations Fund - Institutional Shares, 0.01% (b) | | | 4,172,373 | | | | 4,172,373 | |
| | | | | | | | | |
| TOTAL SHORT-TERM INVESTMENTS (Cost $4,172,373) | | | | | | | 4,172,373 | |
| FINTRUST INCOME AND OPPORTUNITY FUND | |
| SCHEDULE OF INVESTMENTS | |
| May 31, 2021 (Unaudited) | SEMI-ANNUAL REPORT |
| TOTAL INVESTMENTS, AT VALUE (Cost $29,080,853) - 109.17% | | $ | 31,696,504 | |
| | | | | |
| OPTIONS WRITTEN, AT VALUE (Premiums $626,272) - (2.09)% (c) | | | (607,070 | ) |
| | | | | |
| LIABILITIES IN EXCESS OF OTHER ASSETS, NET - (7.08)% | | | (2,054,665 | ) |
| | | | | |
| NET ASSETS - 100% | | $ | 29,034,769 | |
(a) Non-income producing security.
(b) Rate shown represents the 7-day effective yield at May 31, 2021, is subject to change and resets daily.
(c) Please refer to the Schedule of Options Written for details of options written.
(d) Subject to call options written by the Fund.
(e) All or a portion of the security is segregated as collateral for options written and securities sold short.
(f) Rate shown represents the effective yield at May 31, 2021.
1 Each warrant is equivalent to 1 share of the underlying common stock.
2 Each option contract is equivalent to 100 shares of the underlying common stock or exchange-traded fund. All options are non-income producing.
ADR - American Depositary Receipt
AG - Aktiengesellschaft (German Public Limited Company)
ETF - Exchange-Traded Fund
LP - Limited Partnership
Ltd. - Limited
NV - Naamloze Vennootschap (Dutch Public Company)
PLC - Public Limited Company
The accompanying notes are an integral part of these financial statements.
| FINTRUST INCOME AND OPPORTUNITY FUND | |
| SCHEDULE OF OPTIONS WRITTEN | |
| May 31, 2021 (Unaudited) | SEMI-ANNUAL REPORT |
OPTIONS WRITTEN - (2.09)%
| CALL OPTIONS WRITTEN - (0.80)% | | Contracts 1 | | | Notional
Amount | | | Exercise
Price | | | Expiration | | | Value | |
| | | | | | | | | | | | | | | | |
| AbbVie, Inc. | | | 7 | | | $ | 84,000 | | | $ | 120.00 | | | | 7/17/2021 | | | $ | 700 | |
| Activision Blizzard, Inc. | | | 20 | | | | 200,000 | | | | 100.00 | | | | 6/19/2021 | | | | 1,900 | |
| Alphabet, Inc. - Class C | | | 2 | | | | 486,000 | | | | 2,430.00 | | | | 7/3/2021 | | | | 11,544 | |
| Amazon.com, Inc. | | | 1 | | | | 345,000 | | | | 3,450.00 | | | | 7/17/2021 | | | | 2,800 | |
| Apple, Inc. | | | 10 | | | | 140,000 | | | | 140.00 | | | | 7/17/2021 | | | | 400 | |
| Bunge Ltd | | | 18 | | | | 157,500 | | | | 87.50 | | | | 6/19/2021 | | | | 3,222 | |
| Callaway Golf Co. | | | 20 | | | | 66,000 | | | | 33.00 | | | | 7/17/2021 | | | | 9,820 | |
| Centene Corp. | | | 25 | | | | 175,000 | | | | 70.00 | | | | 6/19/2021 | | | | 10,600 | |
| Discover Financial Services | | | 20 | | | | 220,000 | | | | 110.00 | | | | 6/19/2021 | | | | 14,200 | |
| Domo, Inc. - Class B | | | 20 | | | | 140,000 | | | | 70.00 | | | | 6/19/2021 | | | | 4,000 | |
| Freeport-McMoRan, Inc. | | | 30 | | | | 150,000 | | | | 50.00 | | | | 7/17/2021 | | | | 2,250 | |
| Freeport-McMoRan, Inc. | | | 20 | | | | 90,000 | | | | 45.00 | | | | 8/21/2021 | | | | 5,740 | |
| GameStop Corp. - Class A | | | 14 | | | | 210,000 | | | | 150.00 | | | | 6/19/2021 | | | | 112,000 | |
| Jumia Technologies AG - Germany - ADR | | | 20 | | | | 56,000 | | | | 28.00 | | | | 6/19/2021 | | | | 5,660 | |
| Medtronic PLC - Ireland | | | 7 | | | | 91,000 | | | | 130.00 | | | | 8/21/2021 | | | | 1,995 | |
| Mosaic Co. | | | 90 | | | | 315,000 | | | | 35.00 | | | | 6/19/2021 | | | | 18,000 | |
| NXP Semiconductors NV - Netherlands | | | 10 | | | | 210,000 | | | | 210.00 | | | | 7/17/2021 | | | | 9,820 | |
| Pan American Silver Corp. - Canada | | | 40 | | | | 144,000 | | | | 36.00 | | | | 6/19/2021 | | | | 2,200 | |
| SM Energy Co. | | | 30 | | | | 52,500 | | | | 17.50 | | | | 6/19/2021 | | | | 8,550 | |
| Wheaton Precious Metals Corp. - Canada | | | 20 | | | | 90,000 | | | | 45.00 | | | | 6/19/2021 | | | | 6,400 | |
| | | | | | | | | | | | | | | | | | | | | |
| TOTAL CALL OPTIONS WRITTEN (Premiums $126,422) | | | | | | | | | | | | | | | | | | | 231,801 | |
| | | | | | | | | | | | | | | | | | | | | |
| PUT OPTIONS WRITTEN - (1.29)% | | | | | | | | | | | | | | | | | | | | |
| | | | | | | | | | | | | | | | | | | | | |
| Academy Sports & Outdoors, Inc. | | | 50 | | | | 175,000 | | | | 35.00 | | | | 7/16/2021 | | | | 12,600 | |
| Advanced Micro Devices, Inc. | | | 30 | | | | 232,500 | | | | 77.50 | | | | 7/16/2021 | | | | 7,620 | |
| Alphabet, Inc. - Class C | | | 1 | | | | 225,000 | | | | 2,250.00 | | | | 7/16/2021 | | | | 2,450 | |
| Alphabet, Inc. - Class C | | | 1 | | | | 235,000 | | | | 2,350.00 | | | | 7/16/2021 | | | | 4,760 | |
| Amazon.com, Inc. | | | 1 | | | | 312,000 | | | | 3,120.00 | | | | 7/16/2021 | | | | 5,835 | |
| Amazon.com, Inc. | | | 1 | | | | 320,500 | | | | 3,205.00 | | | | 7/16/2021 | | | | 8,897 | |
| Amkor Technology, Inc. | | | 50 | | | | 95,000 | | | | 19.00 | | | | 9/17/2021 | | | | 6,375 | |
| Apple, Inc. | | | 20 | | | | 260,000 | | | | 130.00 | | | | 6/18/2021 | | | | 12,020 | |
| Applied Materials, Inc. | | | 30 | | | | 345,000 | | | | 115.00 | | | | 8/20/2021 | | | | 6,390 | |
| Applied Materials, Inc. | | | 20 | | | | 250,000 | | | | 125.00 | | | | 8/20/2021 | | | | 8,460 | |
| Builders FirstSource, Inc. | | | 30 | | | | 150,000 | | | | 50.00 | | | | 6/18/2021 | | | | 17,100 | |
| Builders FirstSource, Inc. | | | 30 | | | | 150,000 | | | | 50.00 | | | | 8/20/2021 | | | | 21,600 | |
| Callaway Golf Co. | | | 25 | | | | 85,000 | | | | 34.00 | | | | 8/20/2021 | | | | 4,437 | |
| Centene Corp. | | | 40 | | | | 260,000 | | | | 65.00 | | | | 6/18/2021 | | | | 800 | |
| Chemours Co. | | | 50 | | | | 155,000 | | | | 31.00 | | | | 7/16/2021 | | | | 2,500 | |
| Constellation Brands, Inc. | | | 10 | | | | 240,000 | | | | 240.00 | | | | 7/16/2021 | | | | 8,300 | |
| Discover Financial Services | | | 20 | | | | 220,000 | | | | 110.00 | | | | 7/16/2021 | | | | 4,950 | |
| Eagle Materials, Inc. | | | 10 | | | | 130,000 | | | | 130.00 | | | | 7/16/2021 | | | | 1,425 | |
| Eagle Materials, Inc. | | | 10 | | | | 140,000 | | | | 140.00 | | | | 7/16/2021 | | | | 3,360 | |
| Eagle Materials, Inc. | | | 10 | | | | 140,000 | | | | 140.00 | | | | 6/18/2021 | | | | 1,375 | |
| EOG Resources, Inc. | | | 20 | | | | 145,000 | | | | 72.50 | | | | 7/16/2021 | | | | 3,540 | |
| EOG Resources, Inc. | | | 30 | | | | 232,500 | | | | 77.50 | | | | 7/16/2021 | | | | 10,410 | |
| First Solar, Inc. | | | 20 | | | | 165,000 | | | | 82.50 | | | | 6/18/2021 | | | | 14,050 | |
| Freeport-McMoRan, Inc. | | | 50 | | | | 180,000 | | | | 36.00 | | | | 7/16/2021 | | | | 3,050 | |
| Freeport-McMoRan, Inc. | | | 50 | | | | 220,000 | | | | 44.00 | | | | 7/16/2021 | | | | 17,750 | |
| Jumia Technologies AG - Germany - ADR | | | 25 | | | | 87,500 | | | | 35.00 | | | | 6/18/2021 | | | | 15,775 | |
| Lumentum Holdings, Inc. | | | 10 | | | | 77,500 | | | | 77.50 | | | | 7/16/2021 | | | | 2,350 | |
| Microsoft Corp. | | | 10 | | | | 250,000 | | | | 250.00 | | | | 7/16/2021 | | | | 7,300 | |
| Mosaic Co. | | | 50 | | | | 170,000 | | | | 34.00 | | | | 6/18/2021 | | | | 2,600 | |
| Mosaic Co. | | | 50 | | | | 175,000 | | | | 35.00 | | | | 9/17/2021 | | | | 15,250 | |
| NXP Semiconductors NV - Netherlands | | | 10 | | | | 200,000 | | | | 200.00 | | | | 6/18/2021 | | | | 2,090 | |
| FINTRUST INCOME AND OPPORTUNITY FUND | |
| SCHEDULE OF OPTIONS WRITTEN | |
| May 31, 2021 (Unaudited) | SEMI-ANNUAL REPORT |
OPTIONS WRITTEN - (2.09)% (continued)
| PUT OPTIONS WRITTEN - (1.29)% (continued) | | | | | Notional | | | Exercise | | | | | | | |
| | | Contracts 1 | | | Amount | | | Price | | | Expiration | | | Value | |
| | | | | | | | | | | | | | | | |
| QUALCOMM, Inc. | | | 10 | | | | 125,000 | | | | 125.00 | | | | 7/16/2021 | | | $ | 1,850 | |
| ROBLOX Corp. | | | 20 | | | | 130,000 | | | | 65.00 | | | | 1/21/2023 | | | | 27,700 | |
| ROBLOX Corp. | | | 15 | | | | 127,500 | | | | 85.00 | | | | 7/16/2021 | | | | 8,550 | |
| ROBLOX Corp. | | | 10 | | | | 90,000 | | | | 90.00 | | | | 7/16/2021 | | | | 8,010 | |
| Skyworks Solutions, Inc. | | | 10 | | | | 160,000 | | | | 160.00 | | | | 8/20/2021 | | | | 6,270 | |
| SPDR S&P Regional Banking ETF | | | 70 | | | | 490,000 | | | | 70.00 | | | | 8/20/2021 | | | | 24,080 | |
| Sterling Construction Co., Inc. | | | 40 | | | | 90,000 | | | | 22.50 | | | | 9/17/2021 | | | | 6,600 | |
| Sunrun, Inc. | | | 25 | | | | 137,500 | | | | 55.00 | | | | 6/18/2021 | | | | 27,125 | |
| Ulta Beauty, Inc. | | | 5 | | | | 160,000 | | | | 320.00 | | | | 7/16/2021 | | | | 2,945 | |
| Ulta Beauty, Inc. | | | 10 | | | | 320,000 | | | | 320.00 | | | | 9/17/2021 | | | | 14,720 | |
| Ultra Clean Holdings, Inc. | | | 20 | | | | 110,000 | | | | 55.00 | | | | 6/18/2021 | | | | 3,300 | |
| Ultra Clean Holdings, Inc. | | | 20 | | | | 120,000 | | | | 60.00 | | | | 6/18/2021 | | | | 8,700 | |
| | | | | | | | | | | | | | | | | | | | | |
| TOTAL PUT OPTIONS WRITTEN (Premiums $499,850) | | | | | | | | | | | | | | | | | | | 375,269 | |
| | | | | | | | | | | | | | | | | | | | | |
| TOTAL OPTIONS WRITTEN (Premiums $626,272) | | | | | | | | | | | | | | | | | | $ | 607,070 | |
1 Each option contract is equivalent to 100 shares of common stock. All options are non-income producing.
ADR - American Depositary Receipt
AG - Aktiengesellschaft (German Public Limited Company)
ETF - Exchange-Traded Fund
Ltd. - Limited
NV - Naamloze Vennootschap (Dutch Public Company)
PLC - Public Limited Company
The accompanying notes are an integral part of these financial statements.
| FINTRUST INCOME AND OPPORTUNITY FUND | |
| STATEMENT OF ASSETS AND LIABILITIES | |
| | |
| May 31, 2021 (Unaudited) | SEMI-ANNUAL REPORT |
| Assets: | | | | |
| | | | | |
| Total Investments, at cost | | $ | 29,080,853 | |
| Investments, at value | | $ | 31,696,504 | |
| Receivables: | | | | |
| Interest | | | 2,451 | |
| Dividends | | | 24,537 | |
| Investment securities sold | | | 283,023 | |
| Prepaid expenses | | | 3,396 | |
| Total assets | | | 32,009,911 | |
| | | | | |
| Liabilities: | | | | |
| Premiums from options written | | $ | 626,272 | |
| Options written, at value | | $ | 607,070 | |
| Cash due to broker | | | 1,540,781 | |
| Payables: | | | | |
| Investment securities purchased | | | 777,582 | |
| Due to adviser | | | 25,619 | |
| Accrued distribution (12b-1) fees | | | 37 | |
| Due to administrator | | | 9,364 | |
| Accrued Trustee fees | | | 104 | |
| Accrued expenses | | | 14,585 | |
| Total liabilities | | | 2,975,142 | |
| Net Assets | | $ | 29,034,769 | |
| | | | | |
| Sources of Net Assets: | | | | |
| Paid-in capital | | $ | 24,506,966 | |
| Total distributable earnings | | | 4,527,803 | |
| Total Net Assets | | $ | 29,034,769 | |
| | | | | |
| Class A Shares: | | | | |
| Net Assets | | $ | 92,623 | |
| Shares Outstanding (Unlimited shares of $0 par value beneficial interest authorized) | | | 7,313 | |
| Net Asset Value Per Share | | $ | 12.67 | |
| | | | | |
| Maximum Offering Price Per Share (a) | | $ | 13.41 | |
| | | | | |
| Minimum Redemption Price Per Share (b) | | $ | 12.54 | |
| | | | | |
| Institutional Class Shares: | | | | |
| Net Assets | | $ | 28,942,146 | |
| Shares Outstanding (Unlimited shares of $0 par value beneficial interest authorized) | | | 2,250,866 | |
| Net Asset Value, Offering and Redemption Price Per Share | | $ | 12.86 | |
(a) A maximum sales charge of 5.50% is imposed on Class A shares.
(b) Investments in Class A shares made at or above the $1 million breakpoint are not subject to an initial sales charge and may be subject to a 1.00% contingent deferred sales charge ("CDSC") on shares redeemed within one year from the date of purchase.
The accompanying notes are an integral part of these financial statements.
| FINTRUST INCOME AND OPPORTUNITY FUND | |
| STATEMENT OF OPERATIONS | SEMI-ANNUAL REPORT |
| | | For the
Six Month Period Ended
May 31, 2021 | |
| | | (Unaudited) | |
| Investment income: | | | | |
| Dividends (net of foreign withholding taxes of $1,824) | | $ | 100,636 | |
| Interest | | | 5,436 | |
| Total investment income | | | 106,072 | |
| | | | | |
| Expenses: | | | | |
| Management fees (Note 6) | | | 140,297 | |
| Distribution (12b-1) fees - Class A (Note 6) | | | 109 | |
| Accounting and transfer agent fees and expenses | | | 50,052 | |
| Interest expense | | | 14,736 | |
| Liquidity Rule fees | | | 11,335 | |
| Pricing fees | | | 10,471 | |
| Trustee fees and expenses | | | 8,976 | |
| Legal fees | | | 8,438 | |
| Reports to shareholders | | | 7,480 | |
| Custodian fees | | | 7,480 | |
| Audit fees | | | 7,231 | |
| Miscellaneous | | | 6,670 | |
| Dividends on securities sold short | | | 1,200 | |
| Insurance | | | 1,102 | |
| Registration and filing fees | | | 906 | |
| Compliance officer fees | | | 637 | |
| Total expenses | | | 277,120 | |
| Less: fees waived (Note 6) | | | (42,175 | ) |
| Net expenses | | | 234,945 | |
| | | | | |
| Net investment loss | | | (128,873 | ) |
| | | | | |
| Realized and unrealized gain (loss): | | | | |
| Net realized gain (loss) on: | | | | |
| Investments | | | 1,848,288 | |
| Options written | | | 491,228 | |
| Securities sold short | | | (238,076 | ) |
| Net realized gains on investments, options written and securities sold short | | | 2,101,440 | |
| | | | | |
| Net change in unrealized appreciation on: | | | | |
| Investments | | | 1,845,537 | |
| Options written | | | 5,631 | |
| Securities sold short | | | 89,906 | |
| Net change in unrealized appreciation on investments, options written and securities sold short | | | 1,941,074 | |
| | | | | |
| Net realized and unrealized gain on investments, options written and securities sold short | | | 4,042,514 | |
| | | | | |
| Net increase in net assets resulting from operations | | $ | 3,913,641 | |
The accompanying notes are an integral part of these financial statements.
| FINTRUST INCOME AND OPPORTUNITY FUND | |
| STATEMENTS OF CHANGES IN NET ASSETS | SEMI-ANNUAL REPORT |
| | | | | | | |
| | | For the
Six Month Period Ended
May 31, 2021 | | | For the
Year Ended
November 30, 2020 | |
| | | (Unaudited) | | | | | |
| Increase (decrease) in net assets from: | | | | | | | | |
| Operations: | | | | | | | | |
| Net investment loss | | $ | (128,873 | ) | | $ | (158,861 | ) |
| Net realized gain on investments, options written and securities sold short | | | 2,101,440 | | | | 1,108,160 | |
| Net change in unrealized appreciation on investments, options written and securities sold short | | | 1,941,074 | | | | 856,405 | |
| Net increase in net assets resulting from operations | | | 3,913,641 | | | | 1,805,704 | |
| | | | | | | | | |
| Distributions to shareholders from: | | | | | | | | |
| Total distributable earnings - Class A | | | (4,673 | ) | | | (3,800 | ) |
| Total distributable earnings - Institutional Class | | | (1,003,570 | ) | | | (401,040 | ) |
| Total distributions | | | (1,008,243 | ) | | | (404,840 | ) |
| | | | | | | | | |
| Capital share transactions (Note 4): | | | | | | | | |
| Increase in net assets from capital share transactions | | | 8,046,804 | | | | 6,299,972 | |
| | | | | | | | | |
| Increase in net assets | | | 10,952,202 | | | | 7,700,836 | |
| | | | | | | | | |
| Net Assets: | | | | | | | | |
| Beginning of year/period | | | 18,082,567 | | | | 10,381,731 | |
| | | | | | | | | |
| End of year/period | | $ | 29,034,769 | | | $ | 18,082,567 | |
The accompanying notes are an integral part of these financial statements.
| FINTRUST INCOME AND OPPORTUNITY FUND | |
| FINANCIAL HIGHLIGHTS | SEMI-ANNUAL REPORT |
The following tables set forth the per share operating performance data for a share of beneficial interest outstanding, total return, ratios to average net assets and other supplemental data for the years or periods indicated.
| | | Class A | |
| | | | | | | | | | | | | | | | | | | | | | | | | |
| | | For the
Six Month Period Ended
May 31, 2021 | | | For the
Year Ended
November 30, 2020 | | | For the
Year Ended
November 30, 2019 | | | For the
Year Ended
November 30, 2018 | | | For the
Year Ended
November 30, 2017 | | | For the
Period Ended
November 30, 2016 (a) | |
| | | (Unaudited) | | | | | | | | | | | | | | | | | | | | | |
| | | | | | | | | | | | | | | | | | | | | | | | | |
| Net Asset Value, Beginning of Year/Period | | $ | 11.19 | | | $ | 10.71 | | | $ | 10.73 | | | $ | 11.97 | | | $ | 11.03 | | | $ | 10.00 | |
| | | | | | | | | | | | | | | | | | | | | | | | | |
| Investment Operations: | | | | | | | | | | | | | | | | | | | | | | | | |
| Net investment loss (b) | | | (0.08 | ) | | | (0.15 | ) | | | (0.06 | ) | | | (0.05 | ) | | | (0.08 | ) | | | (0.11 | ) |
| Net realized and unrealized gains on investments, options written and securities sold short | | | 2.19 | | | | 1.05 | | | | 0.56 | | | | 0.04 | | | | 1.03 | | | | 1.14 | |
| Total from investment operations | | | 2.11 | | | | 0.90 | | | | 0.50 | | | | (0.01 | ) | | | 0.95 | | | | 1.03 | |
| | | | | | | | | | | | | | | | | | | | | | | | | |
| Distributions: | | | | | | | | | | | | | | | | | | | | | | | | |
| From net realized capital gains | | | (0.63 | ) | | | (0.42 | ) | | | (0.52 | ) | | | (1.23 | ) | | | (0.01 | ) | | | — | |
| Total distributions | | | (0.63 | ) | | | (0.42 | ) | | | (0.52 | ) | | | (1.23 | ) | | | (0.01 | ) | | | — | |
| | | | | | | | | | | | | | | | | | | | | | | | | |
| Net Asset Value, End of Year/Period | | $ | 12.67 | | | $ | 11.19 | | | $ | 10.71 | | | $ | 10.73 | | | $ | 11.97 | | | $ | 11.03 | |
| | | | | | | | | | | | | | | | | | | | | | | | | |
| Total Return (c) | | | 19.72 | %(d) | | | 8.68 | % | | | 5.32 | % | | | (0.31 | )% | | | 8.61 | % | | | 10.30 | %(d) |
| | | | | | | | | | | | | | | | | | | | | | | | | |
| Ratios/Supplemental Data | | | | | | | | | | | | | | | | | | | | | | | | |
| Net assets, end of year/period (in 000's) | | $ | 93 | | | $ | 83 | | | $ | 97 | | | $ | 92 | | | $ | 398 | | | $ | 370 | |
| | | | | | | | | | | | | | | | | | | | | | | | | |
| Ratios of expenses to average net assets: | | | | | | | | | | | | | | | | | | | | | | | | |
| Before fees waived and expenses absorbed | | | 2.72 | %(e)(f) | | | 3.29 | %(f) | | | 3.66 | %(f) | | | 4.57 | % | | | 4.52 | %(f) | | | 7.31 | %(e)(f) |
| After fees waived and expenses absorbed | | | 2.34 | %(e)(f) | | | 2.35 | %(f) | | | 2.22 | %(f) | | | 2.20 | % | | | 2.26 | %(f) | | | 2.30 | %(e)(f) |
| | | | | | | | | | | | | | | | | | | | | | | | | |
| Ratios of net investment loss: | | | | | | | | | | | | | | | | | | | | | | | | |
| Before fees waived and expenses absorbed | | | (1.77 | )%(e)(f) | | | (2.35 | )%(f) | | | (2.06 | )%(f) | | | (2.84 | )% | | | (2.99 | )%(f) | | | (6.26 | )%(e)(f) |
| After fees waived and expenses absorbed | | | (1.39 | )%(e)(f) | | | (1.41 | )%(f) | | | (0.63 | )%(f) | | | (0.47 | )% | | | (0.73 | )%(f) | | | (1.24 | )%(e)(f) |
| | | | | | | | | | | | | | | | | | | | | | | | | |
| Portfolio turnover rate | | | 137.25 | %(d) | | | 271.84 | % | | | 192.88 | % | | | 280.78 | % | | | 94.23 | % | | | 29.55 | %(d) |
| (a) | The FinTrust Income and Opportunity Fund commenced operations on January 21, 2016. |
| (b) | Net investment loss per share is based on average shares outstanding. |
| (c) | Total Return represents the rate that the investor would have earned or lost on an investment in the Fund, assuming reinvestment of dividends and does not reflect the impact of sales charges. |
| (f) | The ratios include 0.13% of interest expense and 0.01% of dividend expense during the six month period ended May 31, 2021, 0.15% of interest expense during the year ended November 30, 2020, 0.02% of interest expense during the year ended November 30, 2019, 0.06% of interest expense during the year ended November 30, 2017 and 0.10% of interest expense during the period ended November 30, 2016. |
The accompanying notes are an integral part of these financial statements.
| FINTRUST INCOME AND OPPORTUNITY FUND | |
| FINANCIAL HIGHLIGHTS | SEMI-ANNUAL REPORT |
The following tables set forth the per share operating performance data for a share of beneficial interest outstanding, total return, ratios to average net assets and other supplemental data for the years or periods indicated.
| | | Institutional Class | |
| | | | | | | | | | | | | | | | | | | | | | | | | |
| | | For the
Six Month Period Ended
May 31, 2021 | | | For the
Year Ended
November 30, 2020 | | | For the
Year Ended
November 30, 2019 | | | For the
Year Ended
November 30, 2018 | | | For the
Year Ended
November 30, 2017 | | | For the
Period Ended
November 30, 2016 (a) | |
| | | (Unaudited) | | | | | | | | | | | | | | | | | | | | | |
| | | | | | | | | | | | | | | | | | | | | | | | | |
| Net Asset Value, Beginning of Year/Period | | $ | 11.34 | | | $ | 10.82 | | | $ | 10.81 | | | $ | 12.02 | | | $ | 11.05 | | | $ | 10.00 | |
| | | | | | | | | | | | | | | | | | | | | | | | | |
| Investment Operations: | | | | | | | | | | | | | | | | | | | | | | | | |
| Net investment loss (b) | | | (0.07 | ) | | | (0.12 | ) | | | (0.04 | ) | | | (0.02 | ) | | | (0.05 | ) | | | (0.09 | ) |
| Net realized and unrealized gains on investments, options written and securities sold short | | | 2.22 | | | | 1.06 | | | | 0.57 | | | | 0.04 | | | | 1.03 | | | | 1.14 | |
| Total from investment operations | | | 2.15 | | | | 0.94 | | | | 0.53 | | | | 0.02 | | | | 0.98 | | | | 1.05 | |
| | | | | | | | | | | | | | | | | | | | | | | | | |
| Distributions: | | | | | | | | | | | | | | | | | | | | | | | | |
| From net realized capital gains | | | (0.63 | ) | | | (0.42 | ) | | | (0.52 | ) | | | (1.23 | ) | | | (0.01 | ) | | | — | |
| Total distributions | | | (0.63 | ) | | | (0.42 | ) | | | (0.52 | ) | | | (1.23 | ) | | | (0.01 | ) | | | — | |
| | | | | | | | | | | | | | | | | | | | | | | | | |
| Net Asset Value, End of Year/Period | | $ | 12.86 | | | $ | 11.34 | | | $ | 10.82 | | | $ | 10.81 | | | $ | 12.02 | | | $ | 11.05 | |
| | | | | | | | | | | | | | | | | | | | | | | | | |
| Total Return (c) | | | 19.82 | %(d) | | | 8.97 | % | | | 5.57 | % | | | (0.03 | )%(g) | | | 8.86 | % | | | 10.50 | %(d) |
| | | | | | | | | | | | | | | | | | | | | | | | | |
| Ratios/Supplemental Data | | | | | | | | | | | | | | | | | | | | | | | | |
| Net assets, end of year/period (in 000's) | | $ | 28,942 | | | $ | 17,999 | | | $ | 10,285 | | | $ | 5,680 | | | $ | 5,578 | | | $ | 3,741 | |
| | | | | | | | | | | | | | | | | | | | | | | | | |
| Ratios of expenses to average net assets: | | | | | | | | | | | | | | | | | | | | | | | | |
| Before fees waived and expenses absorbed | | | 2.47 | %(e)(f) | | | 3.04 | %(f) | | | 3.41 | %(f) | | | 4.32 | % | | | 4.27 | %(f) | | | 7.06 | %(e)(f) |
| After fees waived and expenses absorbed | | | 2.09 | %(e)(f) | | | 2.10 | %(f) | | | 1.97 | %(f) | | | 1.95 | % | | | 2.01 | %(f) | | | 2.05 | %(e)(f) |
| | | | | | | | | | | | | | | | | | | | | | | | | |
| Ratios of net investment loss: | | | | | | | | | | | | | | | | | | | | | | | | |
| Before fees waived and expenses absorbed | | | (1.52 | )%(e)(f) | | | (2.10 | )%(f) | | | (1.81 | )%(f) | | | (2.59 | )% | | | (2.74 | )%(f) | | | (6.01 | )%(e)(f) |
| After fees waived and expenses absorbed | | | (1.14 | )%(e)(f) | | | (1.16 | )%(f) | | | (0.38 | )%(f) | | | (0.22 | )% | | | (0.48 | )%(f) | | | (0.99 | )%(e)(f) |
| | | | | | | | | | | | | | | | | | | | | | | | | |
| Portfolio turnover rate | | | 137.25 | %(d) | | | 271.84 | % | | | 192.88 | % | | | 280.78 | % | | | 94.23 | % | | | 29.55 | %(d) |
| (a) | The FinTrust Income and Opportunity Fund commenced operations on January 21, 2016. |
| (b) | Net investment loss per share is based on average shares outstanding. |
| (c) | Total Return represents the rate that the investor would have earned or lost on an investment in the Fund, assuming reinvestment of dividends. |
| (f) | The ratios include 0.13% of interest expense and 0.01% of dividend expense during the six month period ended May 31, 2021, 0.15% of interest expense during the year ended November 30, 2020, 0.02% of interest expense during the year ended November 30, 2019, 0.06% of interest expense during the year ended November 30, 2017 and 0.10% of interest expense during the period ended November 30, 2016. |
| (g) | Total return does not correlate to the total from investment operations due to the timing of certain subscriptions and redemptions in the Fund. |
The accompanying notes are an integral part of these financial statements.
| FinTrust Income and Opportunity Fund | SEMI-ANNUAL REPORT |
NOTES TO THE FINANCIAL STATEMENTS
May 31, 2021 (Unaudited)
| 1. | ORGANIZATION AND SIGNIFICANT ACCOUNTING POLICIES |
The FinTrust Income and Opportunity Fund (the “Fund”), is a series of 360 Funds (the “Trust”). The Trust was organized on February 24, 2005 as a Delaware statutory trust. The Trust is registered as an open-end management investment company under the Investment Company Act of 1940 (the “1940 Act”). The Fund is a non-diversified Fund. As a non-diversified Fund, it may invest a significant portion of its assets in a small number of companies. The Fund’s investment objective is total return comprised of income and capital appreciation. The Fund’s investment adviser is FinTrust Capital Advisors, LLC (the “Adviser”). The Fund offers two classes of shares, Class A and Institutional Class shares. Each class of shares commenced operations on January 21, 2016. Each class differs as to sales and redemption charges and ongoing fees. Income and expenses (other than class specific), and realized/unrealized gains or losses are allocated to each class based on their relative net asset values.
The following is a summary of the significant accounting policies followed by the Fund in the preparation of its financial statements. The Fund is an investment company that follows the accounting and reporting guidance of Accounting Standards Codification Topic 946 applicable to investment companies.
a) Security Valuation – All investments in securities are recorded at their estimated fair value, as described in Note 2.
b) Options – The Fund uses an option strategy in an effort to limit market exposure and volatility. The extent of option selling will depend upon market conditions and the Adviser’s judgment of the advantages of selling call options on the Fund’s equity investments. The sale of put options generates income for the Fund, but exposes it to the risk of declines in the value of the underlying assets. The risk in purchasing options is limited to the premium paid by the Fund for the options. The sale of call options generates income for the Fund, but may limit the Fund's participation in equity market gains. The Fund’s investment adviser seeks to reduce the overall volatility of returns for the Fund by managing a portfolio of options. When the Fund writes or purchases an option, an amount equal to the premium received or paid by the Fund is recorded as a liability or an asset and is subsequently adjusted to the current market value of the option written or purchased. Premiums received or paid from writing or purchasing options which expire unexercised are treated by the Fund on the expiration date as realized gains or losses. The difference between the premium and the amount paid or received on effecting a closing purchase or sale transaction, including brokerage commissions, is also treated as a realized gain or loss. If an option is exercised, the premium paid or received is added to the cost of the purchase or proceeds from the sale in determining whether the Fund has realized a gain or a loss on investment transactions.
Purchasing and writing put and call options are highly specialized activities and entail greater than ordinary investment risks. The successful use of options depends in part on the ability of the Adviser to manage future price fluctuations and the degree of correlation between the options and securities markets. By writing put options on equity securities, the Fund gives up the opportunity to benefit from potential increases in the value of the underlying securities above the strike prices of the written put options, but continues to bear the risk of declines in the value of underlying securities held by the Fund. The Fund will receive a premium from writing a covered call option that it retains whether or not the option is exercised. The premium received from the written options may not be sufficient to offset any losses sustained from the volatility of the underlying equity securities over time.
c) Exchange-Traded Funds (“ETFs”) – The Fund may invest in ETFs. An ETF is a fund that holds a portfolio of common stocks or bonds designed to track the performance of a securities index or sector of an index. ETFs are traded on a securities exchange based on their market value. An ETF portfolio holds the same stocks or bonds as the index it tracks, so its market price reflects the value of the index at any given time. ETFs are registered investment companies and incur fees and expenses such as operating expenses, licensing fees, registration fees, trustees’ fees, and marketing expenses, and ETF shareholders, such as the Fund, pay their proportionate share of these expenses. Your cost of investing in the Fund will generally be higher than the cost of investing directly in ETFs. By investing in the Fund, you will indirectly bear fees and expenses charged by the underlying ETFs in which the Fund invests in addition to the Fund’s direct fees and expenses.
d) Federal Income Taxes – The Fund has qualified and intends to continue to qualify as a regulated investment company under Subchapter M of the Internal Revenue Code of 1986, as amended (the “Code”). It is the policy of the Fund to comply with the requirements of the Code applicable to regulated investment companies and to distribute substantially all of its net investment company taxable income and net capital gains. The Fund also intends to distribute sufficient net investment income and net capital gains, if any, so that it will not be subject to excise tax on undistributed income and gains. Therefore, no federal income tax or excise provision is required.
| FinTrust Income and Opportunity Fund | SEMI-ANNUAL REPORT |
NOTES TO THE FINANCIAL STATEMENTS
May 31, 2021 (Unaudited)
| 1. | ORGANIZATION AND SIGNIFICANT ACCOUNTING POLICIES (continued) |
As of and for the six month period ended May 31, 2021, the Fund did not have a liability for any unrecognized tax expenses. The Fund recognizes interest and penalties, if any, related to unrecognized tax liability as income tax expense in the Statement of Operations. For the six month period ended May 31, 2021, the Fund did not incur any interest or penalties. The Fund identifies its major tax jurisdiction as U.S. Federal.
In addition, accounting principles generally accepted in the United States of America (“GAAP”) requires management of the Fund to analyze all open tax years, as defined by the Internal Revenue Service statute of limitations for all major jurisdictions, including federal tax authorities and certain state tax authorities. As of the six month period ended May 31, 2021, and for all other open tax years (years ended November 30, 2020, November 30, 2019, November 30, 2018 and November 30, 2017), the Fund did not have a liability for any unrecognized tax benefits. The Fund has no examinations in progress and is not aware of any tax positions for which it is reasonably possible that the total tax amounts of unrecognized tax benefits will significantly change in the next twelve months.
e) Distributions to Shareholders – Dividends from net investment income and distributions of net realized capital gains, if any, will be declared and paid at least annually. Income and capital gain distributions, which are determined in accordance with income tax regulations, are recorded on the ex-dividend date. GAAP requires that permanent financial reporting differences relating to shareholder distributions be reclassified to paid-in capital.
f) Use of Estimates – The preparation of financial statements in conformity with GAAP requires management to make estimates and assumptions that affect the reported amounts of assets and liabilities and disclosure of contingent assets and liabilities at the date of the financial statements and the reported amounts of revenues and expenses during the reporting period. Actual results could differ from those estimates.
g) Non-Diversified Fund – The Fund is a non-diversified fund. In general, a non-diversified fund may invest a greater percentage of its assets in a particular issue and may own fewer securities than other mutual funds. Accordingly, a non-diversified fund is generally subject to the risk that a large loss in an individual issue will cause a greater loss for the fund than it would if the fund was required to hold a larger number of securities or smaller positions.
h) Sales Charges – A maximum sales charge of 5.50% is imposed on certain purchases of Class A shares. A contingent deferred sales charge (“CDSC”) is imposed upon certain redemptions of Class A shares purchased at net asset value in amounts totaling $1 million if the dealer’s commission was paid by the underwriter and the shares are redeemed within one year from the date of purchase. The CDSC will be paid to the Distributor and will be equal to 1.00% of the lesser of (1) the net asset value at the time of purchase of the Class A shares being redeemed; or (2) the net asset value of such shares at the time of redemption. There were no CDSC Fees paid to the Distributor for the six month period ended May 31, 2021.
i) Expenses – Expenses incurred by the Trust that do not relate to a specific fund of the Trust are allocated to the individual funds based on each fund's relative net assets or another appropriate basis as determined by the Board.
j) Other – Investment and shareholder transactions are recorded on trade date. The Fund determines the gain or loss realized from the investment transactions by comparing the original cost of the security lot sold with the net sales proceeds. Dividend income is recognized on the ex-dividend date or as soon as information is available to the Fund and interest income is recognized on an accrual basis. Withholding taxes on foreign dividends have been provided for in accordance with the Fund’s understanding of the applicable country’s tax rules and rates.
Processes and Structure
The Fund’s Board of Trustees (the “Board”) has adopted guidelines for valuing securities and other derivative instruments including in circumstances in which market quotes are not readily available, and has delegated authority to the Adviser to apply those guidelines in determining fair value prices, subject to review by the Board.
| FinTrust Income and Opportunity Fund | SEMI-ANNUAL REPORT |
NOTES TO THE FINANCIAL STATEMENTS
May 31, 2021 (Unaudited)
| 2. | SECURITIES VALUATIONS (continued) |
Hierarchy of Fair Value Inputs
The Fund utilizes various methods to measure the fair value of most of its investments on a recurring basis. GAAP establishes a hierarchy that prioritizes inputs to valuation techniques used to measure fair value. The three levels of inputs are as follows:
| ● | Level 1 – Unadjusted quoted prices in active markets for identical assets or liabilities that the Fund has the ability to access. |
| ● | Level 2 – Observable inputs other than quoted prices included in Level 1 that are observable for the asset or liability either directly or indirectly. These inputs may include quoted prices for the identical instrument on an inactive market, prices for similar instruments, interest rates, prepayment speeds, credit risk, yield curves, default rates, and similar data. |
| ● | Level 3 – Unobservable inputs for the asset or liability to the extent that relevant observable inputs are not available, representing the Fund’s own assumptions about the assumptions that a market participant would use in valuing the asset or liability, and that would be based on the best information available. |
The availability of observable inputs can vary from security to security and is affected by a wide variety of factors, including, for example, the type of security, whether the security is new and not yet established in the marketplace, the liquidity of markets, and other characteristics particular to the security. To the extent that valuation is based on models or inputs that are less observable or unobservable in the market, the determination of fair value requires more judgment. Accordingly, the degree of judgment exercised in determining fair value is greatest for instruments categorized in Level 3.
The inputs used to measure fair value may fall into different levels of the fair value hierarchy. In such cases, for disclosure purposes, the level in the fair value hierarchy within which the fair value measurement falls in its entirety is determined based on the lowest level input that is significant to the fair value measurement in its entirety.
Fair Value Measurements
A description of the valuation techniques applied to the Trust's major categories of assets and liabilities measured at fair value on a recurring basis are as follows:
Equity securities (common stock, preferred stock and ETFs) – Securities traded on a national securities exchange (or reported on the NASDAQ national market) are stated at the last reported sales price on the day of valuation. To the extent these securities are actively traded, and valuation adjustments are not applied, they are categorized in Level 1 of the fair value hierarchy. Certain foreign securities may be fair valued using a pricing service that considers the correlation of the trading patterns of the foreign security to the intraday trading in the U.S. markets for investments such as American Depositary Receipts, financial futures, Exchange-Traded Funds, and the movement of the certain indexes of securities based on a statistical analysis of the historical relationship and are categorized in Level 2. Preferred stock and other equities traded on inactive markets or valued by reference to similar instruments are also categorized in Level 2.
Money market funds – Money market funds are valued at their net asset value and are categorized as Level 1.
Derivative instruments – Listed derivatives, including options, that are actively traded, are valued based on quoted prices from the exchange and categorized in Level 1 of the fair value hierarchy. Options held by the Fund for which no current quotations are readily available and which are not traded on the valuation date are valued at the mean price and are categorized within Level 2 of the fair value hierarchy. Over-the-counter (OTC) derivative contracts include forward, swap, and option contracts related to interest rates; foreign currencies; credit standing of reference entities; equity prices; or commodity prices, and warrants on exchange-traded securities. Depending on the product and terms of the transaction, the fair value of the OTC derivative products can be modeled taking into account the counterparties' creditworthiness and using a series of techniques, including simulation models. Many pricing models do not entail material subjectivity because the methodologies employed do not necessitate significant judgments, and the pricing inputs are observed from actively quoted markets, as is the case of interest rate swap and option contracts. OTC derivative products valued using pricing models are categorized within Level 2 of the fair value hierarchy.
| FinTrust Income and Opportunity Fund | SEMI-ANNUAL REPORT |
NOTES TO THE FINANCIAL STATEMENTS
May 31, 2021 (Unaudited)
| 2. | SECURITIES VALUATIONS (continued) |
If the Adviser decides that a price provided by the pricing service does not accurately reflect the fair value of the securities, when prices are not readily available from a pricing service, or when certain restricted or illiquid securities are being valued, securities are valued at fair value as determined in good faith by the Adviser, in conformity with guidelines adopted by and subject to review of the Board and the Fair Valuation Committee. These securities will be categorized as Level 3 securities.
The following tables summarize the inputs used to value the Fund’s assets and liabilities measured at fair value as of May 31, 2021.
| Financial Instruments – Assets | | | | | | | | | | | | |
| | | | | | | | | | | | | |
| Security Classification (1) | | Level 1 | | | Level 2 | | | Level 3 | | | Totals | |
| Common Stock (2) | | $ | 22,301,371 | | | $ | — | | | $ | — | | | $ | 22,301,371 | |
| Exchange-Traded Funds | | | 399,975 | | | | — | | | | — | | | | 399,975 | |
| Preferred Stock (2) | | | 1,254,350 | | | | — | | | | — | | | | 1,254,350 | |
| Government Bonds | | | — | | | | 1,819,514 | | | | — | | | | 1,819,514 | |
| Call Options Purchased | | | 683,656 | | | | 274,975 | | | | — | | | | 958,631 | |
| Put Options Purchased | | | 535,385 | | | | 193,930 | | | | — | | | | 729,315 | |
| Warrants | | | 60,975 | | | | — | | | | — | | | | 60,975 | |
| Short-Term Investments | | | 4,172,373 | | | | — | | | | — | | | | 4,172,373 | |
| Total Assets | | $ | 29,408,085 | | | $ | 2,288,419 | | | $ | — | | | $ | 31,696,504 | |
| Derivative and Financial Instruments – Liabilities | | | | | | | | | | | | |
| | | | | | | | | | | | | |
| Security Classification (1) | | Level 1 | | | Level 2 | | | Level 3 | | | Totals | |
| Call Options Written | | $ | 231,801 | | | $ | — | | | $ | — | | | $ | 231,801 | |
| Put Options Written | | | 270,932 | | | | 104,337 | | | | — | | | | 375,269 | |
| Total Liabilities | | $ | 502,733 | | | $ | 104,337 | | | $ | — | | | $ | 607,070 | |
(1) As of and for the six month period ended May 31, 2021, the Fund held no securities that were considered to be “Level 3” securities (those valued using significant unobservable inputs). Therefore, a reconciliation of assets in which significant unobservable inputs (Level 3) were used in determining fair value is not applicable.
(2) All common and preferred stock held in the Fund are Level 1 securities. For a detailed break-out of common and preferred stock by industry, please refer to the Schedule of Investments.
| 3. | DERIVATIVE TRANSACTIONS |
As of May 31, 2021, the location on the Statement of Assets and Liabilities for financial derivative instrument fair values is as follows:
| Assets | | Location | | | Equity Contracts | |
| Call options purchased | | Investments, at value | | | $ | 958,631 | |
| Put options purchased | | Investments, at value | | | | 729,315 | |
| Total Assets | | | | | $ | 1,687,946 | |
| FinTrust Income and Opportunity Fund | SEMI-ANNUAL REPORT |
NOTES TO THE FINANCIAL STATEMENTS
May 31, 2021 (Unaudited)
| 3. | DERIVATIVES TRANSACTIONS (continued) |
| Liabilities | | Location | | | Equity Contracts | |
| Call options written | | Options written, at value | | | $ | 231,801 | |
| Put options written | | Options written, at value | | | | 375,269 | |
| Total Liabilities | | | | | $ | 607,070 | |
Realized and unrealized gains and losses on derivatives contracts entered into by the Fund for the six month period ended May 31, 2021, are recorded in the following locations in the Statement of Operations:
| Net change in unrealized appreciation (depreciation) on: | | Location | | | Equity Contracts | |
| Call options purchased | | Investments | | | $ | 217,482 | |
| Put options purchased | | Investments | | | | (278,416 | ) |
| Call options written | | Options written | | | | (102,343 | ) |
| Put options written | | Options written | | | | 107,974 | |
| | | | | | $ | (55,303 | ) |
| Net realized gain (loss) on: | | Location | | | Equity Contracts | |
| Call options purchased | | Investments | | | $ | (38,937 | ) |
| Put options purchased | | Investments | | | | (661,670 | ) |
| Call options written | | Options written | | | | 61,883 | |
| Put options written | | Options written | | | | 429,345 | |
| | | | | | $ | (209,379 | ) |
For the six month period ended May 31, 2021, the average month-end notional value of purchased and written option contracts for the Fund was $13,544,143 and ($7,865,514), respectively. The primary risk category for all open options positions during the fiscal year was equity risk.
| 4. | CAPITAL SHARE TRANSACTIONS |
Transactions in shares of capital stock for the six month period ended May 31, 2021, were as follows:
| | | Sold | | | Redeemed | | | Reinvested | | | Net Increase (Decrease) | |
| Class A | | | | | | | | | | | | | | | | |
| Shares | | | 1 | | | | (557 | ) | | | 427 | | | | (129 | ) |
| Value | | $ | 3 | | | $ | (6,089 | ) | | $ | 4,672 | | | $ | (1,414 | ) |
| Institutional Class | | | | | | | | | | | | | | | | |
| Shares | | | 635,046 | | | | (61,960 | ) | | | 90,412 | | | | 663,498 | |
| Value | | $ | 7,765,515 | | | $ | (720,867 | ) | | $ | 1,003,570 | | | $ | 8,048,218 | |
| FinTrust Income and Opportunity Fund | SEMI-ANNUAL REPORT |
NOTES TO THE FINANCIAL STATEMENTS
May 31, 2021 (Unaudited)
| 4. | CAPITAL SHARE TRANSACTIONS (continued) |
Transactions in shares of capital stock for the year ended November 30, 2020, were as follows:
| | | Sold | | | Redeemed | | | Reinvested | | | Net Increase (Decrease) | |
| Class A | | | | | | | | | | | | | | | | |
| Shares | | | 10 | | | | (1,961 | ) | | | 363 | | | | (1,588 | ) |
| Value | | $ | 101 | | | $ | (20,261 | ) | | $ | 3,800 | | | $ | (16,360 | ) |
| Institutional Class | | | | | | | | | | | | | | | | |
| Shares | | | 741,588 | | | | (142,803 | ) | | | 37,870 | | | | 636,655 | |
| Value | | $ | 7,332,702 | | | $ | (1,417,410 | ) | | $ | 401,040 | | | $ | 6,316,332 | |
| 5. | INVESTMENT TRANSACTIONS |
For the six month period ended May 31, 2021, aggregate purchases and sales of investment securities (excluding short-term investments and U.S. Government securities) for the Fund were as follows:
| Purchases | | | Sales | |
| $ | 32,648,687 | | | $ | 27,174,608 | |
The cost of purchases and proceeds from sales of U.S. government securities during the six month period ended May 31, 2021, were $499,901 and $250,000, respectively.
| 6. | ADVISORY FEES AND OTHER RELATED PARTY TRANSACTIONS |
The Fund has entered into an Investment Advisory Agreement (the “Advisory Agreement”) with the Adviser. Pursuant to the Advisory Agreement, the Adviser manages the operations of the Fund and manages the Fund’s investments in accordance with the stated policies of the Fund. As compensation for the investment advisory services provided to the Fund, the Adviser will receive a monthly management fee equal to an annual rate of 1.25% of the Fund’s net assets. For the six month period ended May 31, 2021, the Adviser earned $140,297 of management fees.
The Adviser has entered into an Expense Limitation Agreement with the Fund under which it has agreed to waive or reduce its fees and to assume other expenses of the Fund, if necessary, in an amount that limits the Fund’s annual operating expenses (excluding interest, distribution fees pursuant to Rule 12b-1 Plans, taxes, acquired fund fees and expenses, brokerage commissions, dividend expenses on short sales, and other expenditures which are capitalized in accordance with generally accepted accounting principles and other extraordinary expenses not incurred in the ordinary course of such Fund’s business) to not more than 1.95% of the Fund’s average daily net assets. The current contractual agreement cannot be terminated before March 31, 2023, without the Board of Trustees’ approval. For the six month period ended May 31, 2021, the Adviser waived advisory fees of $42,175.
Subject to approval by the Fund’s Board, any waiver under the Expense Limitation Agreement is subject to repayment by the Fund within the three years following the month in which such waiver or reimbursement occurred, if the Fund can make the payment without exceeding the 1.95% expense limitation. The cumulative reimbursement is $363,391, of which $63,687, $128,536, $128,993 and $42,175 can be recouped no later than November 30, 2021, November 30, 2022, November 30, 2023 and May 31, 2024, respectively.
The Fund has entered into an Investment Company Services Agreement (“ICSA”) with M3Sixty Administration, LLC (“M3Sixty”). Pursuant to the ICSA, M3Sixty will provide daily operational services to the Fund including, but not limited to: (a) Fund accounting services; (b) financial statement preparation; (c) valuation of the Fund's portfolio securities; (d) pricing the Fund's shares; (e) assistance in preparing tax returns; (f) preparation and filing of required regulatory reports; (g) communications with shareholders; (h) coordination of Board and shareholder meetings; (i) monitoring the Fund's legal compliance; (j) maintaining shareholder account records.
For the six month period ended May 31, 2021, M3Sixty earned $50,052, including out of pocket expenses, pursuant to the ICSA.
| FinTrust Income and Opportunity Fund | SEMI-ANNUAL REPORT |
NOTES TO THE FINANCIAL STATEMENTS
May 31, 2021 (Unaudited)
| 6. | ADVISORY FEES AND OTHER RELATED PARTY TRANSACTIONS (continued) |
The Fund has also entered into a Chief Compliance Officer Service Agreement (“CCO Agreement”) with M3Sixty. Pursuant to the CCO Agreement, M3Sixty agrees to provide a Chief Compliance Officer (“CCO”), as described in Rule 38a-1 of the 1940 Act, to the Fund for the year and on the terms and conditions set forth in the CCO Agreement.
For the six month period ended May 31, 2021, M3Sixty earned $637 of fees pursuant to the CCO Agreement.
Certain officers and an interested Trustee of the Trust are also employees and/or officers of M3Sixty.
The Fund has entered into a Distribution Agreement with Matrix 360 Distributors, LLC (“M3SixtyD” or the “Distributor”). Pursuant to the Distribution Agreement, the Distributor provides distribution services to the Fund. The Distributor served as underwriter/distributor of the Fund. M3SixtyD may receive commissions from the sale of Class A shares. During the six month period ended May 31, 2021, no commissions were paid to the Distributor. M3SixtyD is an affiliate of M3Sixty.
The Fund has adopted a Distribution Plan (“Plan”) pursuant to Rule 12b-1 under the Investment Company Act of 1940 for its Class A shares. The Fund may expend up to 0.25% for Class A shares of the Fund’s average daily net assets annually to pay for any activity primarily intended to result in the sale of shares of the Fund and the servicing of shareholder accounts, provided that the Trustees have approved the category of expenses for which payment is being made.
The distribution plan for the Class A shares of the Fund took effect January 21, 2016. For the six month period ended May 31, 2021, the Fund accrued $109 in 12b-1 expenses attributable to Class A shares.
For U.S. Federal income tax purposes, the cost of securities owned, gross appreciation, gross depreciation, and net unrealized appreciation/(depreciation) of investments, including written options and securities sold short, at May 31, 2021 were as follows:
| Cost | | | Gross Appreciation | | | Gross Depreciation | | | Net Appreciation | |
| $ | 28,661,391 | | | $ | 3,715,396 | | | $ | (1,287,353 | ) | | $ | 2,428,043 | |
The difference between book basis and tax basis unrealized appreciation (depreciation) is primarily attributable to the tax deferral of losses on wash sales and straddles.
The Fund’s tax basis distributable earnings are determined at the end of each fiscal year. The tax character of distributable earnings (deficit) at November 30, 2020, the Fund’s most recent fiscal year end, is as follows:
Unrealized
Appreciation | | | Undistributed Ordinary Income | | | Undistributed Long-Term Capital Gains | | | Capital Loss Carry Forwards | | | Post-October Loss and Late Year Loss | | | Other Book/Tax
Differences | | | Total Distributable Earnings | |
| $ | 645,068 | | | $ | 847,129 | | | $ | 164,014 | | | $ | — | | | $ | — | | | $ | (33,806 | ) | | $ | 1,622,405 | |
Under current tax law, net capital losses realized after October 31st and net ordinary losses incurred after December 31st may be deferred and treated as occurring on the first day of the following fiscal year. As of November 30, 2020 the Fund did not elect to defer any losses.
In accordance with accounting pronouncements, the Fund may record reclassifications in the capital accounts. These reclassifications have no impact on the net asset value of the Fund and are designed generally to present distributable earnings on a tax basis which is considered to be more informative to the shareholder. As of November 30, 2020, the Fund did not record any reclassifications to capital accounts.
Under the Regulated Investment Company Modernization Act of 2010 (the “Act”), net capital losses recognized after December 31, 2010, may be carried forward indefinitely, and their character is retained as short-term and/or long-term. As of November 30, 2020, the Fund had no capital loss carryforwards for federal income tax purposes.
For the six month ended May 31, 2021, the Fund distributed, on a tax basis, $844,230 of ordinary income and $164,013 of long-term capital gains.
| FinTrust Income and Opportunity Fund | SEMI-ANNUAL REPORT |
| NOTES TO THE FINANCIAL STATEMENTS | |
| May 31, 2021 (Unaudited) | |
| 7. | TAX MATTERS (continued) |
For the year ended November 30, 2020, the Fund distributed, on a tax basis, $362,575 of ordinary income and $42,265 of long-term capital gains.
The beneficial ownership, either directly or indirectly, of more than 25% of the voting securities of a fund creates a presumption of control of the fund, under Section 2(a)(9) of the Investment Company Act of 1940. As of May 31, 2021, Charles Schwab and Co., Inc. held 58.48% and National Financial Services, LLC held 41.30% of the Fund’s shares in omnibus accounts for the sole benefit of their customers. The Trust does not know whether any of the underlying beneficial shareholders of the omnibus accounts held by Charles Schwab and Co., Inc. or National Financial Services, LLC own more than 25% of the voting securities of the Fund.
| 9. | COMMITMENTS AND CONTINGENCIES |
In the normal course of business, the Trust may enter into contracts that may contain a variety of representations and warranties and provide general indemnifications. The Trust’s maximum exposure under these arrangements is dependent on future claims that may be made against the Fund and, therefore, cannot be estimated; however, management considers the risk of loss from such claims to be remote.
At a Special Meeting of the Board held on June 28, 2021 (the “Special Meeting”), the Board was notified that the parent company of the Adviser (the “Parent Company”), which owns 100% of the Adviser, has entered into a membership interest purchase agreement (the “MIPA”) with United Community Bank, Inc. (“UCBI”) for 100% of the interest of the Parent Company. Under the MIPA, UCBI will acquire 100% of the interests in the Parent Company, and, therefore, will become the ultimate parent company of the Adviser. The closing date of the transaction was July 6, 2021.
Upon closing of the MIPA, the Advisory Agreement was terminated because of a change in control of the Adviser that resulted in the assignment of the Advisory Agreement under federal securities laws. For the Adviser to continue to provide investment management services to the Fund, the Board voted unanimously to approve an Interim Investment Advisory Agreement at the Special Meeting for a term not greater than 150 days or until shareholders approve a New Investment Advisory Agreement (“New Agreement”).
At the Special Meeting, the Board approved the New Agreement as well as a New Expense Limitation Agreement for the Fund which will also need to be approved by shareholders. A Special Meeting of Shareholders has been called to be held on or around September 17, 2021 for the purpose of approving the New Agreement and New Expense Limitation Agreement, and to conduct any other business that may lawfully be presented at such meeting.
In accordance with GAAP, Management has evaluated the impact of all subsequent events on the Fund through the date the financial statements were issued, and has determined that there were no other subsequent events requiring recognition or disclosure in the financial statements.
| FinTrust Income and Opportunity Fund | SEMI-ANNUAL REPORT |
| ADDITIONAL INFORMATION | |
| May 31, 2021 (Unaudited) | |
The Fund files its complete schedules of portfolio holdings with the Securities and Exchange Commission (the “Commission”) for the first and third quarters of each fiscal year on Form N-PORT. The Fund’s Forms N-PORT are available on the Commission’s website at http://www.sec.gov. The Fund’s Forms N-PORT may be reviewed and copied at the Commission’s Public Reference Room in Washington, DC. Information on the operation of the Commission’s Public Reference Room may be obtained by calling 1-800-SEC-0330.
Prior to March 31, 2020, the Fund filed its complete schedules of portfolio holdings with the Commission for the first and third quarters of each fiscal year on Form N-Q. The Fund’s Forms N-Q are available on the Commission’s website at http://www.sec.gov.
A description of the policies and procedures that the Fund uses to determine how to vote proxies relating to portfolio securities is available without charge, upon request, by calling 1-877-244-6235; and on the Commission’s website at http://www.sec.gov.
Information regarding how the Fund voted proxies relating to portfolio securities during the most recent 12-month period ended June 30th is available without charge, upon request, by calling 1-877-244-6235; and on the Commission’s website at http://www.sec.gov.
Shareholder Tax Information - The Fund is required to advise you within 60 days of the Fund’s fiscal year end regarding the federal tax status of distributions received by shareholders during the fiscal year. The Fund paid $844,230 of ordinary income and $164,013 of long-term capital gain distributions for the six month period ended May 31, 2021.
Tax information is reported from the Fund’s fiscal year and not calendar year, therefore, shareholders should refer to their Form 1099-DIV or other tax information which will be mailed in 2022 to determine the calendar year amounts to be included on their 2021 tax returns. Shareholders should consult their own tax advisors.
| FinTrust Income and Opportunity Fund | SEMI-ANNUAL REPORT |
| ADDITIONAL INFORMATION | |
| May 31, 2021 (Unaudited) | |
BOARD OF TRUSTEES, OFFICERS AND PRINCIPAL SHAREHOLDERS - (Unaudited)
The Trustees are responsible for the management and supervision of the Fund. The Trustees approve all significant agreements between the Trust, on behalf of the Fund, and those companies that furnish services to the Fund; review performance of the Fund; and oversee activities of the Fund. The Statement of Additional Information of the Trust includes additional information about the Fund’s Trustees and is available upon request, without charge, by calling (877) 244-6235.
Remuneration Paid to Trustees and Officers - Officers of the Trust and Trustees who are “interested persons” of the Trust or the Adviser will receive no salary or fees from the Trust. Officers of the Trust and interested Trustees do receive compensation directly from certain service providers to the Trust, including Matrix 360 Distributors, LLC and M3Sixty Administration, LLC. Each Trustee who is not an “interested person” (an “Independent Trustee”) receives a $5,000 annual retainer (paid quarterly). In addition, each Independent Trustee receives, on a per fund basis: (i) a fee of $1,500 per fund each year (paid quarterly); (ii) a fee of $200 per Board meeting attended; and (iii) a fee of $200 per committee meeting attended. The Trust will also reimburse each Trustee for travel and other expenses incurred in connection with, and/or related to, the performance of their obligations as a Trustee. Officers of the Trust will also be reimbursed for travel and other expenses relating to their attendance at Board meetings.
| Name of Trustee1 | | Aggregate
Compensation
From each Fund2 | | | Pension or Retirement
Benefits Accrued As Part
of Portfolio Expenses | | Estimated
Annual Benefits
Upon
Retirement | | Total Compensation
From the Fund
Paid to Trustees2 | |
| Independent Trustees |
| Arthur Q. Falk | | $ | 1,767 | | | None | | None | | $ | 1,767 | |
| Tom M. Wirtshafter | | $ | 1,767 | | | None | | None | | $ | 1,767 | |
| Gary W. DiCenzo | | $ | 1,767 | | | None | | None | | $ | 1,767 | |
| Steven D. Poppen | | $ | 1,767 | | | None | | None | | $ | 1,767 | |
| Thomas J. Schmidt | | $ | 1,767 | | | None | | None | | $ | 1,767 | |
| Interested Trustees and Officers |
| Randall K. Linscott | | | None | | | Not Applicable | | Not Applicable | | | None | |
1 Each of the Trustees serves as a Trustee to each Series of the Trust. The Trust currently offers six (6) series of shares.
2 Figures are for the six month period ended May 31, 2021.
| FinTrust Income and Opportunity Fund | SEMI-ANNUAL REPORT |
Information About Your Fund’s Expenses – (Unaudited)
As a shareholder of the Fund, you incur two types of costs: (1) transaction costs, such as the sales charge (load) imposed on certain subscriptions and the contingent deferred sales charge (“CDSC”) imposed on certain short-term redemptions; and (2) ongoing costs, including management fees, distribution and/or service (12b-1) fees; and other Fund expenses. The example below is intended to help you understand your ongoing costs (in dollars) of investing in the Fund and to compare these costs with the ongoing costs of investing in other mutual funds.
The example is based on an investment of $1,000 invested at the beginning of the period and held for the entire period as indicated below.
Actual Expenses – The first section of the table provides information about actual account values and actual expenses (relating to the example $1,000 investment made at the beginning of the period). You may use the information in this section, together with the amount you invested, to estimate the expenses that you paid over the period. Simply divide your account value by $1,000 (for example, an $8,600 account value divided by $1,000 = 8.6), then multiply the result by the number in the first section under the heading entitled “Expenses Paid During Period” to estimate the expenses you paid on your account during this period.
Hypothetical Example for Comparison Purposes – The second section of the table provides information about the hypothetical account values and hypothetical expenses based on the Fund’s actual expense ratios and an assumed rate of return of 5% per year before expenses, which is not the Fund’s actual return. The hypothetical account values and expenses may not be used to estimate the actual ending account balance or expenses you paid for the period. You may use this information to compare the ongoing costs of investing in the Fund to other funds. To do so, compare this 5% hypothetical example with the 5% hypothetical examples that appear in the shareholder reports of the other funds.
Please note that the expenses shown in the table are meant to highlight your ongoing costs only and do not reflect any transactional costs, such as sales charges (loads), CDSC fees, or exchange fees. Therefore, the second section of the table is useful in comparing ongoing costs only, and will not help you determine the relative total costs of owning different funds. In addition, if these transactional costs were included, your costs would have been higher. For more information on transactional costs, please refer to the Fund’s prospectus.
Expenses and Value of a $1,000 Investment for the period from 11/30/20 through 05/31/21
| | | Beginning Account
Value (11/30/20) | | | Annualized Expense
Ratio for the Period | | | Ending Account
Value (05/31/21) | | | Expenses Paid
During Period (a) | |
| Actual Fund Return (in parentheses) | | | | | | | | | | | | | | | | |
| Class A (19.72%) | | $ | 1,000.00 | | | | 2.34 | % | | $ | 1,197.20 | | | $ | 12.82 | |
| Institutional Class (19.82%) | | $ | 1,000.00 | | | | 2.09 | % | | $ | 1,198.20 | | | $ | 11.45 | |
| Hypothetical 5% Return | | | | | | | | | | | | | | | | |
| Class A | | $ | 1,000.00 | | | | 2.34 | % | | $ | 1,013.30 | | | $ | 11.75 | |
| Institutional Class | | $ | 1,000.00 | | | | 2.09 | % | | $ | 1,014.50 | | | $ | 10.50 | |
| (a) | Expenses are equal to the Fund’s annualized expense ratios, multiplied by the average account value over the period, multiplied by 182/365 to reflect the one-half year period. |
For more information on Fund expenses, please refer to the Fund’s prospectus, which can be obtained from your investment representative or by calling 1-877-244-6235. Please read it carefully before you invest or send money.
| FinTrust Income and Opportunity Fund | SEMI-ANNUAL REPORT |
Information About Your Fund’s Expenses – (Unaudited) (continued)
Total Fund operating expense ratios as stated in the current Fund prospectus dated March 30, 2021 for the Fund were as follows: |
| FinTrust Income and Opportunity Fund Class A, gross of fee waivers or expense reimbursements | 3.30% |
| FinTrust Income and Opportunity Fund Class A, after waiver and reimbursement* | 2.36% |
| FinTrust Income and Opportunity Fund Institutional Class, gross of fee waivers or expense reimbursements | 3.05% |
| FinTrust Income and Opportunity Fund Institutional Class, after waiver and reimbursement* | 2.11% |
* FinTrust Capital Advisors, LLC (the “Adviser”) has entered into an Expense Limitation Agreement with the Fund under which it has agreed to waive or reduce its fees and to assume other expenses of the Fund, if necessary, in an amount that limits the Fund’s annual operating expenses (excluding interest, distribution fees pursuant to Rule 12b-1 Plans, taxes, acquired fund fees and expenses, brokerage commissions, dividend expenses on short sales, and other expenditures which are capitalized in accordance with generally accepted accounting principles and other extraordinary expenses not incurred in the ordinary course of such Fund’s business) to not more than 1.95%. The Expense Limitation Agreement covers the period during which the Interim Investment Advisory Agreement was in place and the period following shareholder approval of the new Investment Advisory Agreement through at least March 31, 2022. Subject to approval by the Fund’s Board, any waiver under the Expense Limitation Agreement is subject to repayment by the Fund within the three fiscal years following the year in which such waiver occurred, if the Fund is able to make the payment without exceeding the 1.95% expense limitation. The current contractual agreement cannot be terminated prior to at least one year after the effective date without the Board of Trustees’ approval. Total Gross Operating Expenses for the six month period ended May 31, 2021 were 2.72% and 2.47% for the FinTrust Income and Opportunity Fund Class A shares and FinTrust Income and Opportunity Fund Institutional Class shares, respectively. Please see the Information About Your Fund’s Expenses, the Financial Highlights and Notes to Financial Statements (Note 6) sections of this report for expense related disclosures for the six month period ended May 31, 2021. |
| FinTrust Income and Opportunity Fund | SEMI-ANNUAL REPORT |
Liquidity Risk Management Program (Unaudited)
In accordance with Rule 22e-4 under the Investment Company Act of 1940, as amended (the “Liquidity Rule”), the Fund has established a liquidity risk management program (the “Liquidity Program”) that is reasonably designed to assess and manage the Fund’s liquidity risk, which generally represents the risk that the Fund could not meet redemption requests without significant dilution of remaining investors’ interests. The Board has appointed M3Sixty Administration, LLC (“M3Sixty”), as the administrator of the Liquidity Program. As administrator, M3Sixty is responsible for overseeing the daily operations of the Liquidity Program, and annually assessing, managing, and reviewing with the Board the liquidity risk of each series in the Trust. M3Sixty works with the Fund’s investment adviser, as necessary, to execute the Liquidity Program and address issues as they arise.
The Liquidity Program’s principal objectives include supporting the Fund’s compliance with limits on investments in illiquid assets and mitigating the risk that the Fund cannot timely meet its redemption obligations. The Liquidity Program also includes a number of elements that support the management and assessment of liquidity risk, including an annual assessment of factors that influence each Fund’s liquidity and the periodic classification and reclassification of its investments into categories that reflect each investment adviser’s assessment of the Fund’s relative liquidity under current market conditions. Under the Liquidity Program, every investment held by the Fund is classified at least monthly into one of four liquidity categories based on estimations of the investment’s ability to be sold during designated time frames in current market conditions without significantly changing the investment’s market value.
As required by the Liquidity Rule, at a meeting held on January 27, 2021, M3Sixty presented an annual assessment to the Board that addressed the operation of the Liquidity Program and assessed its adequacy and effectiveness of implementation, including any material changes to the Liquidity Program and the determination of each Fund’s Highly Liquid Investment Minimum (“HLIM”). The annual assessment included consideration of the following factors, as applicable:
| ● | the Fund’s investment strategy and liquidity of portfolio investments during normal and reasonably foreseeable stressed conditions, including whether the investment strategy is appropriate for an open-end fund; |
| ● | the extent to which the strategy involves a relatively concentrated portfolio or large positions in particular issuers; |
| ● | the use of borrowings and derivatives for investment and redemption purposes; |
| ● | short-term and long-term cash flow projections covering both normal and reasonably foreseeable stressed conditions; and holdings of cash and cash equivalents |
For each series in the Trust, the annual assessment incorporated a report related to each Fund’s holdings, shareholder and portfolio concentration, any borrowings during the period, cash flow projections, and other relevant data for the period of December 1, 2019 through November 30, 2020. The report described the methodology for classifying each Fund’s investments (including derivative transactions) into one of four liquidity categories, as well as the percentage of each Fund’s investments assigned to each category. It also explained the methodology for establishing a Fund’s HLIM and noted that the investment adviser reviews the HLIM assigned to each Fund no less frequently than annually.
During the period, M3Sixty noted that the COVID-19 pandemic, especially in the March 2020 through mid-April 2020 timeframe, was the key factor and/or market event that impacted liquidity risk. Other factors included portfolio composition and client base during the period.
During the assessment period, the Board did not approve any material changes to the program.
For the Trust, certain provisions of the Liquidity Program initially became effective on June 1, 2019, and the full Liquidity Program was formally approved by the Board in December 2019. During the period covered by the annual assessment, M3Sixty concluded, and reported to the Board, that the Liquidity Program since its implementation has operated adequately and effectively and is reasonably designed to assess and manage each Fund’s liquidity risk.
360 FUNDS
4300 Shawnee Mission Pkwy
Suite 100
Fairway, KS 66205
INVESTMENT ADVISER
FinTrust Capital Advisors, LLC
124 Verdae Boulevard
Suite 504
Greenville, SC 29607
ADMINISTRATOR & TRANSFER AGENT
M3Sixty Administration, LLC
4300 Shawnee Mission Parkway
Suite 100
Fairway, KS 66205
DISTRIBUTOR
Matrix 360 Distributors, LLC
4300 Shawnee Mission Parkway
Suite 100
Fairway, KS 66205
INDEPENDENT REGISTERED PUBLIC ACCOUNTING FIRM
BBD, LLP
1835 Market Street
3rd Floor
Philadelphia, PA 19103
LEGAL COUNSEL
Strauss Troy Co., LPA
Federal Reserve Building
150 E. 4th Street
4th Floor
Cincinnati, OH 45202
CUSTODIAN BANK
Fifth Third Bank
Fifth Third Center
38 Fountain Square Plaza
Cincinnati, OH 45263
Not applicable at this time.
| ITEM 3. | AUDIT COMMITTEE FINANCIAL EXPERT. |
Not applicable at this time.
| ITEM 4. | PRINCIPAL ACCOUNTANT FEES AND SERVICES. |
Not applicable at this time.
| ITEM 5. | AUDIT COMMITTEE OF LISTED REGISTRANTS. |
Not applicable
| ITEM 6. | SCHEDULE OF INVESTMENTS. |
Included in Semi-Annual Report to shareholders filed under Item 1 of this Form.
| ITEM 7. | DISCLOSURE OF PROXY VOTING POLICIES AND PROCEDURES FOR CLOSED-END MANAGEMENT INVESTMENT COMPANIES. |
Not applicable as the Fund is an open-end management investment company.
| ITEM 8. | PORTFOLIO MANAGERS OF CLOSED-END MANAGEMENT INVESTMENT COMPANIES. |
Not applicable as the Fund is an open-end management investment company.
| ITEM 9. | PURCHASES OF EQUITY SECURITIES BY CLOSED-END MANAGEMENT INVESTMENT COMPANY AND AFFILIATED PURCHASERS. |
Not applicable as the Fund is an open-end management investment company.
| ITEM 10. | SUBMISSION OF MATTERS TO A VOTE OF SECURITY HOLDERS. |
Not applicable at this time.
| ITEM 11. | CONTROLS AND PROCEDURES. |
| (a) | The registrant's principal executive and principal financial officers, or persons performing similar functions, have concluded that the registrant's disclosure controls and procedures (as defined in Rule 30a-3(c) under the 1940 Act, are effective, as of a date within 90 days of the filing date of this report, based on the evaluation of these controls and procedures required by Rule 30a-3(b) under the 1940 Act and Rule 15d-15(b) under the Securities Exchange Act of 1934, as amended. |
| (b) | There were no changes in the registrant's internal control over financial reporting (as defined in Rule 30a-3(d) under the 1940 Act) that occurred during the period covered by this report that have materially affected, or are reasonably likely to materially affect, the registrant's internal control over financial reporting. |
| ITEM 12. | DISCLOSURE OF SECURITIES LENDING ACTIVITIES FOR CLOSED-END MANAGEMENT INVESTMENT COMPANIES. |
Not applicable as the Fund is an open-end management investment company.
(1) Certifications pursuant to Section 302 of the Sarbanes-Oxley Act of 2002 are filed herewith.
(2) Certifications pursuant to Section 906 of the Sarbanes-Oxley Act of 2002 are filed herewith.
SIGNATURES
Pursuant to the requirements of the Securities Exchange Act of 1934 and the Investment Company Act of 1940, the registrant has duly caused this report to be signed on its behalf by the undersigned, thereunto duly authorized.
360 Funds
| /s/ Randy Linscott | |
| By Randy Linscott | |
| Principal Executive Officer |
| Date: August 6, 2021 | |
Pursuant to the requirements of the Securities Exchange Act of 1934 and the Investment Company Act of 1940, this report has been signed below by the following person on behalf of the registrant and in the capacities and on the date indicated.
| /s/ Larry E. Beaver, Jr. | |
| By Larry E. Beaver, Jr. | |
| Assistant Treasurer and Acting Principal Financial Officer |
Date: August 6, 2021 | |