| SNOW FAMILY OF FUNDS | SEMI-ANNUAL REPORT |
| SCHEDULES OF INVESTMENTS | | | |
| AUGUST 31, 2013 (Unaudited) | | | |
| | | | |
| SNOW CAPITAL FOCUSED VALUE FUND | | | |
| | | Shares | | | Fair Value | |
| COMMON STOCK - 95.92% | | | | | | |
| | | | | | | |
| Aerospace & Defense - (3.82%) | | | | | | |
| General Dynamics Corp. | | | 125 | | | $ | 10,406 | |
| | | | | | | | | |
| Banks - (8.22%) | | | | | | | | |
| JPMorgan Chase & Co. | | | 325 | | | | 16,422 | |
| KeyCorp | | | 510 | | | | 5,952 | |
| | | | | | | | 22,374 | |
| Electronics - (6.47%) | | | | | | | | |
| Agilent Technologies, Inc. | | | 175 | | | | 8,162 | |
| Avnet, Inc. | | | 245 | | | | 9,447 | |
| | | | | | | | 17,609 | |
| Hand & Machine Tools - (4.53%) | | | | | | | | |
| Kennametal, Inc. | | | 290 | | | | 12,331 | |
| | | | | | | | | |
| Healthcare Services - (9.24%) | | | | | | | | |
| Community Health Systems, Inc. | | | 315 | | | | 12,367 | |
| WellPoint, Inc. | | | 150 | | | | 12,771 | |
| | | | | | | | 25,138 | |
| Insurance - (15.87%) | | | | | | | | |
Genworth Financial, Inc. (a) | | | 955 | | | | 11,269 | |
| Hartford Financial Services Group, Inc. | | | 485 | | | | 14,356 | |
| MetLife, Inc. | | | 380 | | | | 17,552 | |
| | | | | | | | 43,177 | |
| Leisure Time - (3.24%) | | | | | | | | |
| Royal Caribbean Cruises Ltd | | | 240 | | | | 8,806 | |
| | | | | | | | | |
| Machinery - (1.97%) | | | | | | | | |
Terex Corp. (a) | | | 185 | | | | 5,365 | |
| | | | | | | | | |
| Mining - (4.31%) | | | | | | | | |
| Rio Tinto PLC - ADR | | | 260 | | | | 11,729 | |
| | | | | | | | | |
| Miscellaneous Manufacturing - (6.59%) | | | | | | | | |
| Eaton Corp. PLC | | | 160 | | | | 10,131 | |
| Textron, Inc. | | | 290 | | | | 7,813 | |
| | | | | | | | 17,944 | |
| Oil & Gas - (11.23%) | | | | | | | | |
| BP PLC - ADR | | | 370 | | | | 15,281 | |
| Chesapeake Energy Corp. | | | 395 | | | | 10,195 | |
| Nabors Industries Ltd. | | | 330 | | | | 5,082 | |
| | | | | | | | 30,558 | |
| Oil & Gas Services - (4.02%) | | | | | | | | |
| Baker Hughes, Inc. | | | 235 | | | | 10,925 | |
| | | | | | | | | |
| Retail - (8.23%) | | | | | | | | |
Big Lots, Inc. (a) | | | 335 | | | | 11,866 | |
| Kohl's Corp. | | | 205 | | | | 10,518 | |
| | | | | | | | 22,384 | |
| Software - (8.18%) | | | | | | | | |
| Microsoft Corp. | | | 420 | | | | 14,028 | |
VeriFone Systems, Inc. (a) | | | 415 | | | | 8,225 | |
| | | | | | | | 22,253 | |
| | | | | | | | | |
| TOTAL COMMON STOCK COST (Cost $242,891) | | | | | | | 260,999 | |
| SNOW FAMILY OF FUNDS | SEMI-ANNUAL REPORT |
| SCHEDULES OF INVESTMENTS | | | |
| AUGUST 31, 2013 (Unaudited) | | | |
| | | | |
| SNOW CAPITAL FOCUSED VALUE FUND | | | |
| | | Shares | | | Fair Value | |
| | | | | | | |
| SHORT TERM INVESTMENTS - (5.69%) | | | | | | |
Fidelity Institutional Money Market Funds - Money Market Portfolio, 0.08% (b) (Cost $15,490) | | | 15,490 | | | | 15,490 | |
| | | | | | | | | |
| TOTAL INVESTMENTS (Cost $258,381) - 101.61% | | | | | | $ | 276,489 | |
| LIABILITIES IN EXCESS OTHER ASSETS, NET - (1.61%) | | | | | | | (4,394 | ) |
| NET ASSETS - (100%) | | | | | | $ | 272,095 | |
Percentages are stated as a percent of net assets.
(a) Non-Income producing security.
(b) Rate shown represents the rate at August 31, 2013, is subject to change and resets daily.
ADR - American Depositary Receipt.
The accompanying notes are an integral part of these financial statements.
| SNOW FAMILY OF FUNDS | SEMI-ANNUAL REPORT |
| SCHEDULES OF INVESTMENTS | | | |
| AUGUST 31, 2013 (Unaudited) | | | |
| | | | |
| SNOW CAPITAL HEDGED EQUITY FUND | | | |
| | | Shares | | | Fair Value | |
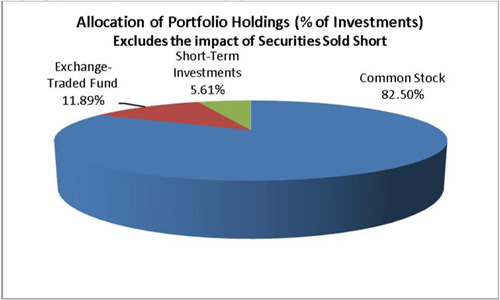
| COMMON STOCK - 82.02% | | | | | | |
| | | | | | | |
| Aerospace & Defense - (2.72%) | | | | | | |
| General Dynamics Corp. | | | 170 | | | $ | 14,152 | |
| | | | | | | | | |
| Banks - (5.70%) | | | | | | | | |
| JPMorgan Chase & Co. | | | 520 | | | | 26,276 | |
| KeyCorp | | | 290 | | | | 3,384 | |
| | | | | | | | 29,660 | |
| Electronics - (4.98%) | | | | | | | | |
| Agilent Technologies Inc.. | | | 10 | | | | 466 | |
| Avnet, Inc. | | | 660 | | | | 25,450 | |
| | | | | | | | 25,916 | |
| Hand & Machine Tools - (3.19%) | | | | | | | | |
| Kennametal, Inc. | | | 390 | | | | 16,583 | |
| | | | | | | | | |
| Healthcare Services - (12.18%) | | | | | | | | |
| Community Health Systems, Inc. | | | 790 | | | | 31,015 | |
| WellPoint, Inc. | | | 380 | | | | 32,353 | |
| | | | | | | | 63,368 | |
| Insurance - (15.41%) | | | | | | | | |
Genworth Financial, Inc. (a) | | | 2,560 | | | | 30,208 | |
| Hartford Financial Services Group, Inc. | | | 750 | | | | 22,200 | |
| MetLife, Inc. | | | 600 | | | | 27,714 | |
| | | | | | | | 80,122 | |
| Leisure Time - (3.88%) | | | | | | | | |
| Royal Caribbean Cruises Ltd. | | | 550 | | | | 20,179 | |
| | | | | | | | | |
| Machinery - (0.56%) | | | | | | | | |
Terex Corp. (a) | | | 100 | | | | 2,900 | |
| | | | | | | | | |
| Mining - (3.12%) | | | | | | | | |
| Rio Tinto PLC - ADR | | | 360 | | | | 16,240 | |
| | | | | | | | | |
| Miscellaneous Manufacturing - (4.60%) | | | | | | | | |
| Eaton Corp. PLC | | | 250 | | | | 15,830 | |
| Textron, Inc. | | | 300 | | | | 8,082 | |
| | | | | | | | 23,912 | |
| Oil & Gas - (7.42%) | | | | | | | | |
| BP PLC - ADR | | | 510 | | | | 21,063 | |
| Chesapeake Energy Corp. | | | 620 | | | | 16,002 | |
| Nabors Industries Ltd. | | | 100 | | | | 1,540 | |
| | | | | | | | 38,605 | |
| Oil & Gas Services - (2.86%) | | | | | | | | |
| Baker Hughes Inc. | | | 320 | | | | 14,877 | |
| | | | | | | | | |
| Retail - (7.27%) | | | | | | | | |
Big Lots, Inc. (a) | | | 430 | | | | 15,231 | |
| Kohl's Corp. | | | 440 | | | | 22,576 | |
| | | | | | | | 37,807 | |
| Software - (8.13%) | | | | | | | | |
| Microsoft Corp. | | | 1,040 | | | | 34,736 | |
VeriFone Systems, Inc. (a) | | | 380 | | | | 7,532 | |
| | | | | | | | 42,268 | |
| | | | | | | | | |
| TOTAL COMMON STOCK (Cost $416,006) | | | | | | | 426,589 | |
| | | | | | | | | |
| EXCHANGE-TRADED FUND - 11.83% | | | | | | | | |
| Equity Funds - (11.83%) | | | | | | | | |
| Consumer Staples Select Sector SPDR Fund | | | 700 | | | | 27,657 | |
| SPDR S&P Telecom ETF | | | 360 | | | | 17,802 | |
| Utilities Select Sector SPDR Fund | | | 430 | | | | 16,039 | |
| TOTAL EXCHANGE-TRADED FUND (Cost $62,739) | | | | | | | 61,498 | |
| SNOW FAMILY OF FUNDS | SEMI-ANNUAL REPORT |
| SCHEDULES OF INVESTMENTS | | | |
| AUGUST 31, 2013 (Unaudited) | | | |
| | | | |
| SNOW CAPITAL HEDGED EQUITY FUND | | | |
| | | Shares | | | Fair Value | |
| SHORT TERM INVESTMENTS - 5.58% | | | | | | |
Fidelity Institutional Money Market Funds - Money Market Portfolio, 0.08% (b) (Cost $29,019) | | | 29,019 | | | $ | 29,019 | |
| | | | | | | | | |
| TOTAL INVESTMENTS - (Cost $507,764) - 99.43% | | | | | | $ | 517,106 | |
| OTHER ASSETS LESS LIABILITIES, NET - 32.05% | | | | | | | 166,704 | |
| SECURITIES SOLD SHORT (Proceeds, $164,657) - (31.48)% | | | | | | | (163,714 | ) |
| Net Assets - 100% | | | | | | $ | 520,096 | |
| | | | | | | | | |
| SECURITIES SOLD SHORT - (-31.48)% | | | | | | | | |
| COMMON STOCK - (-4.93)% | | Shares | | | Fair Value | |
| | | | | | | | | |
| Beverages - (-0.52%) | | | | | | | | |
Constellation Brands, Inc. (a) | | | 50 | | | $ | 2,713 | |
| | | | | | | | | |
| Building Materials - (-0.46%) | | | | | | | | |
| Vulcan Materials Co. | | | 50 | | | | 2,390 | |
| | | | | | | | | |
| Electric - (-0.45%) | | | | | | | | |
Dynegy, Inc. (a) | | | 120 | | | | 2,332 | |
| | | | | | | | | |
| Electronics - (-0.48%) | | | | | | | | |
| National Instruments Corp. | | | 90 | | | | 2,498 | |
| | | | | | | | | |
| Insurance - (-0.57%) | | | | | | | | |
| Erie Indemnity Co. | | | 40 | | | | 2,950 | |
| | | | | | | | | |
| Oil & Gas - (-0.48%) | | | | | | | | |
Cheniere Energy, Inc. (a) | | | 90 | | | | 2,519 | |
| | | | | | | | | |
| Pharmaceuticals - (-0.49%) | | | | | | | | |
| AbbVie, Inc. | | | 60 | | | | 2,557 | |
| | | | | | | | | |
| Retail - (-0.42%) | | | | | | | | |
Krispy Kreme Doughnuts, Inc. (a) | | | 110 | | | | 2,169 | |
| | | | | | | | | |
| Telecommunications - (-0.53%) | | | | | | | | |
Crown Castle International Corp. (a) | | | 40 | | | | 2,777 | |
| | | | | | | | | |
| Transportation - (-0.53%) | | | | | | | | |
| Landstar System, Inc. | | | 50 | | | | 2,732 | |
| | | | | | | | | |
| TOTAL COMMON STOCK SOLD SHORT (Proceeds $26,868) | | | | | | | 25,637 | |
| | | | | | | | | |
| EXCHANGE-TRADED FUND - (-26.55%) | | | | | | | | |
| Equity Fund - (-26.55%) | | | | | | | | |
| Consumer Discretionary Select Sector SPDR Fund | | | 350 | | | | 20,188 | |
| Energy Select Sector SPDR Fund | | | 240 | | | | 19,577 | |
| Financial Select Sector SPDR Fund | | | 1,000 | | | | 19,440 | |
| Health Care Select Sector SPDR Fund | | | 410 | | | | 20,180 | |
| Industrial Select Sector SPDR Fund | | | 450 | | | | 19,818 | |
| Materials Select Sector SPDR Fund | | | 480 | | | | 19,406 | |
| Technology Select Sector SPDR Fund | | | 620 | | | | 19,468 | |
| TOTAL EXCHANGE-TRADED FUNDS SOLD SHORT (Cost $137,789) | | | | | | | 138,077 | |
| TOTAL SECURITIES SOLD SHORT (Proceeds $164,657) | | | | | | $ | 163,714 | |
Percentages are stated as a percent of net assets.
(a) Non-Income producing security.
(b) Rate shown represents the rate at August 31, 2013, is subject to change and resets daily.
ADR - American Depositary Receipt.
The accompanying notes are an integral part of these financial statements.
| SNOW FAMILY OF FUNDS | SEMI-ANNUAL REPORT |
| SCHEDULES OF INVESTMENTS | | | |
| AUGUST 31, 2013 (Unaudited) | | | |
| | | | |
| SNOW CAPITAL MARKET PLUS FUND | | | |
| | | Shares | | | Fair Value | |
| | | | | | | |
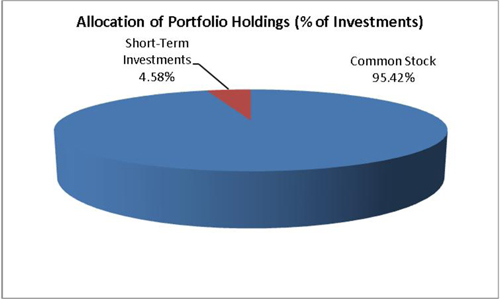
| COMMON STOCK - 96.94% | | | | | | |
| | | | | | | |
| Aerospace & Defense - (2.48%) | | | | | | |
| General Dynamics Corp. | | | 80 | | | $ | 6,660 | |
| | | | | | | | | |
| Agriculture - (0.46%) | | | | | | | | |
| Archer-Daniels-Midland Co. | | | 35 | | | | 1,232 | |
| | | | | | | | | |
| Banks - (15.69%) | | | | | | | | |
| Bank of America Corp. | | | 385 | | | | 5,436 | |
| Citigroup, Inc. | | | 100 | | | | 4,833 | |
| Goldman Sachs Group, Inc. | | | 15 | | | | 2,282 | |
| JPMorgan Chase & Co. | | | 290 | | | | 14,654 | |
| KeyCorp | | | 305 | | | | 3,559 | |
| Morgan Stanley | | | 65 | | | | 1,674 | |
| PNC Financial Services Group, Inc. | | | 30 | | | | 2,168 | |
| US Bancorp | | | 50 | | | | 1,806 | |
| Wells Fargo & Co. | | | 140 | | | | 5,751 | |
| | | | | | | | 42,163 | |
| Computers - (1.81%) | | | | | | | | |
| Apple, Inc. | | | 10 | | | | 4,870 | |
| | | | | | | | | |
| Cosmetics & Personal Care - (1.16%) | | | | | | | | |
| Procter & Gamble Co. | | | 40 | | | | 3,116 | |
| | | | | | | | | |
| Electric - (2.46%) | | | | | | | | |
| Dominion Resources, Inc. | | | 25 | | | | 1,459 | |
| Duke Energy Corp. | | | 35 | | | | 2,296 | |
| NextEra Energy, Inc. | | | 20 | | | | 1,607 | |
| Southern Co. | | | 30 | | | | 1,249 | |
| | | | | | | | 6,611 | |
| Electronics - (4.05%) | | | | | | | | |
| Agilent Technologies, Inc. | | | 105 | | | | 4,897 | |
| Avnet, Inc. | | | 155 | | | | 5,977 | |
| | | | | | | | 10,874 | |
| Food - (0.91%) | | | | | | | | |
| Mondelez International, Inc. | | | 80 | | | | 2,454 | |
| | | | | | | | | |
| Hand & Machine Tools - (2.69%) | | | | | | | | |
| Kennametal, Inc. | | | 170 | | | | 7,228 | |
| | | | | | | | | |
| Healthcare Products - (1.13%) | | | | | | | | |
| Johnson & Johnson | | | 35 | | | | 3,024 | |
| | | | | | | | | |
| Healthcare Services - (5.86%) | | | | | | | | |
| Community Health Systems, Inc. | | | 180 | | | | 7,067 | |
| UnitedHealth Group, Inc. | | | 20 | | | | 1,435 | |
| WellPoint, Inc. | | | 85 | | | | 7,237 | |
| | | | | | | | 15,739 | |
| Insurance - (11.32%) | | | | | | | | |
| American International Group, Inc. | | | 40 | | | | 1,858 | |
Berkshire Hathaway, Inc. (a) | | | 35 | | | | 3,893 | |
Genworth Financial, Inc. (a) | | | 565 | | | | 6,667 | |
| Hartford Financial Services Group, Inc. | | | 280 | | | | 8,288 | |
| MetLife, Inc. | | | 210 | | | | 9,700 | |
| | | | �� | | | | 30,406 | |
| SNOW FAMILY OF FUNDS | SEMI-ANNUAL REPORT |
| SCHEDULES OF INVESTMENTS | | | |
| AUGUST 31, 2013 (Unaudited) | | | |
| | | | |
| SNOW CAPITAL MARKET PLUS FUND | | | |
| | | Shares | | | Fair Value | |
| COMMON STOCK - 96.94% (continued) | | | | | | |
| | | | | | | |
| Leisure Time - (1.77%) | | | | | | |
| Royal Caribbean Cruises Ltd. | | | 130 | | | $ | 4,770 | |
| | | | | | | | | |
| Machinery - Construction & Mining - (1.08%) | | | | | | | | |
| Terex Corp. | | | 100 | | | | 2,900 | |
| | | | | | | | | |
| Media - (0.45%) | | | | | | | | |
| Walt Disney Co. | | | 20 | | | | 1,217 | |
| | | | | | | | | |
| Mining - (2.60%) | | | | | | | | |
| Rio Tinto PLC - ADR | | | 155 | | | | 6,992 | |
| | | | | | | | | |
| Miscellaneous Manufacturing - (5.67%) | | | | | | | | |
| Eaton Corp. PLC | | | 90 | | | | 5,699 | |
| General Electric Co. | | | 220 | | | | 5,091 | |
| Textron, Inc. | | | 165 | | | | 4,445 | |
| | | | | | | | 15,235 | |
| Oil & Gas - (14.38%) | | | | | | | | |
| BP PLC - ADR | | | 215 | | | | 8,879 | |
| Chesapeake Energy Corp. | | | 230 | | | | 5,936 | |
| Chevron Corp. | | | 55 | | | | 6,624 | |
| ConocoPhillips | | | 35 | | | | 2,320 | |
| Exxon Mobil Corp. | | | 85 | | | | 7,409 | |
| Nabors Industries Ltd. | | | 330 | | | | 5,082 | |
| Occidental Petroleum Corp. | | | 15 | | | | 1,323 | |
| Valero Energy Corp. | | | 30 | | | | 1,066 | |
| | | | | | | | 38,639 | |
| Oil & Gas Services - (2.42%) | | | | | | | | |
| Baker Hughes, Inc. | | | 140 | | | | 6,509 | |
| | | | | | | | | |
| Pharmaceuticals - (3.54%) | | | | | | | | |
| Merck & Co., Inc. | | | 85 | | | | 4,020 | |
| Pfizer, Inc. | | | 195 | | | | 5,501 | |
| | | | | | | | 9,521 | |
| Retail - (5.77%) | | | | | | | | |
Big Lots, Inc. (a) | | | 190 | | | | 6,730 | |
| CVS Caremark Corp. | | | 45 | | | | 2,612 | |
| Kohl's Corp. | | | 120 | | | | 6,157 | |
| | | | | | | | 15,499 | |
| Semiconductors - (1.43%) | | | | | | | | |
| Intel Corp. | | | 175 | | | | 3,847 | |
| | | | | | | | | |
| Software - (4.73%) | | | | | | | | |
| Microsoft Corp. | | | 235 | | | | 7,849 | |
VeriFone Systems, Inc. (a) | | | 245 | | | | 4,856 | |
| | | | | | | | 12,705 | |
| Telecommunications - (3.08%) | | | | | | | | |
| AT&T, Inc. | | | 110 | | | | 3,721 | |
| Cisco Systems, Inc. | | | 195 | | | | 4,545 | |
| | | | | | | | 8,266 | |
| | | | | | | | | |
| TOTAL COMMON STOCK (Cost $246,269) | | | 7,225 | | | | 260,477 | |
| | | | | | | | | |
| SHORT TERM INVESTMENTS - 4.65% | | | | | | | | |
Fidelity Institutional Money Market Funds - Money Market Portfolio, 0.08% (b) (Cost $12,508) | | | 12,508 | | | | 12,508 | |
| | | | | | | | | |
| | | | | | | | | |
| TOTAL INVESTMENTS (Cost $258,777) - 101.59% | | | | | | $ | 272,985 | |
| LIABILITIES IN EXCESS OTHER ASSETS, NET - (1.59)% | | | | | | | (4,282 | ) |
| NET ASSETS - 100% | | | | | | $ | 268,703 | |
Percentages are stated as a percent of net assets.
(a) Non-income producing security.
(b) Rate shown represents the rate at August 31, 2013, is subject to change and resets daily.
ADR - American Depositary Receipt.
The accompanying notes are an integral part of these schedule of investments.
| SNOW FAMILY OF FUNDS | SEMI-ANNUAL REPORT |
| SCHEDULES OF INVESTMENTS | | | |
| AUGUST 31, 2013 (Unaudited) | | | |
| | | | |
| SNOW CAPITAL INFLATION ADVANTAGED EQUITIES FUND | | | |
| | | Shares | | | Fair Value | |
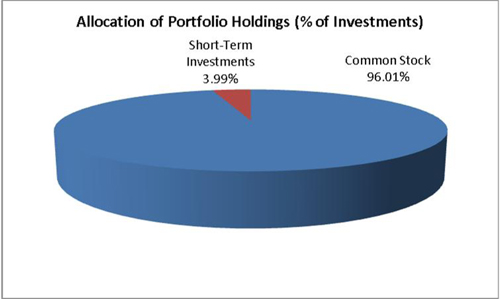
| COMMON STOCK - 97.68% | | | | | | |
| | | | | | | |
| Agriculture - (3.69%) | | | | | | |
| Archer-Daniels-Midland Co. | | | 270 | | | $ | 9,507 | |
| | | | | | | | | |
| Auto Parts & Equipment - (3.30%) | | | | | | | | |
| Johnson Controls, Inc. | | | 210 | | | | 8,511 | |
| | | | | | | | | |
| Banks - (9.62%) | | | | | | | | |
| Bank of America Corp. | | | 590 | | | | 8,331 | |
| Goldman Sachs Group, Inc. | | | 55 | | | | 8,367 | |
| JPMorgan Chase & Co. | | | 160 | | | | 8,085 | |
| | | | | | | | 24,783 | |
| Chemicals - (5.72%) | | | | | | | | |
| EI du Pont de Nemours & Co. | | | 150 | | | | 8,493 | |
| Mosaic Co. | | | 150 | | | | 6,247 | |
| | | | | | | | 14,740 | |
| Cosmetics & Personal Care - (2.42%) | | | | | | | | |
| Procter & Gamble Co. | | | 80 | | | | 6,231 | |
| | | | | | | | | |
| Electronics - (2.44%) | | | | | | | | |
| Agilent Technologies, Inc. | | | 135 | | | | 6,296 | |
| | | | | | | | | |
| Food - (3.10%) | | | | | | | | |
| Mondelez International, Inc. | | | 260 | | | | 7,974 | |
| | | | | | | | | |
| Forest Products & Paper - (2.93%) | | | | | | | | |
| International Paper Co. | | | 160 | | | | 7,554 | |
| | | | | | | | | |
| Hand & Machine Tools - (3.14%) | | | | | | | | |
| Kennametal, Inc. | | | 190 | | | | 8,079 | |
| | | | | | | | | |
| Healthcare Products - (3.18%) | | | | | | | | |
Hospira, Inc. (a) | | | 210 | | | | 8,196 | |
| | | | | | | | | |
| Healthcare Services - (2.06%) | | | | | | | | |
| Community Health Systems, Inc. | | | 135 | | | | 5,300 | |
| | | | | | | | | |
| Insurance - (14.24%) | | | | | | | | |
| Aspen Insurance Holdings Ltd. | | | 210 | | | | 7,470 | |
| Hartford Financial Services Group, Inc. | | | 340 | | | | 10,064 | |
| MetLife, Inc. | | | 235 | | | | 10,855 | |
| XL Group PLC | | | 280 | | | | 8,277 | |
| | | | | | | | 36,666 | |
| Machinery - Construction & Mining - (2.77%) | | | | | | | | |
| Joy Global, Inc. | | | 145 | | | | 7,122 | |
| | | | | | | | | |
| Mining - (9.49%) | | | | | | | | |
| Alcoa, Inc. | | | 530 | | | | 4,081 | |
| Freeport-McMoRan Copper & Gold, Inc. | | | 200 | | | | 6,044 | |
| Newmont Mining Corp. | | | 195 | | | | 6,195 | |
| Rio Tinto PLC - ADR | | | 180 | | | | 8,120 | |
| | | | | | | | 24,440 | |
| SNOW FAMILY OF FUNDS | SEMI-ANNUAL REPORT |
| SCHEDULES OF INVESTMENTS | | | |
| AUGUST 31, 2013 (Unaudited) | | | |
| | | | |
| SNOW CAPITAL INFLATION ADVANTAGED EQUITIES FUND | | | |
| | | Shares | | | Fair Value | |
| COMMON STOCK - 97.68% (Continued) | | | | | | |
| | | | | | | |
| Miscellaneous Manufacturing - (4.76%) | | | | | | |
| Eaton Corp. PLC | | | 115 | | | $ | 7,282 | |
| General Electric Co. | | | 215 | | | | 4,975 | |
| | | | | | | | 12,257 | |
| Oil & Gas - (13.76%) | | | | | | | | |
| BP PLC - ADR | | | 215 | | | | 8,879 | |
| Devon Energy Corp. | | | 140 | | | | 7,993 | |
| Nabors Industries Ltd. | | | 400 | | | | 6,160 | �� |
| Noble Corp. | | | 180 | | | | 6,696 | |
| Phillips 66 | | | 100 | | | | 5,710 | |
| | | | | | | | 35,438 | |
| Oil & Gas Services - (3.34%) | | | | | | | | |
| Baker Hughes, Inc. | | | 185 | | | | 8,601 | |
| | | | | | | | | |
| Packaging & Containers - (3.31%) | | | | | | | | |
| Sealed Air Corp. | | | 300 | | | | 8,520 | |
| | | | | | | | | |
| Retail - (2.27%) | | | | | | | | |
| Wal-Mart Stores, Inc. | | | 80 | | | | 5,838 | |
| | | | | | | | | |
| Software - (2.14%) | | | | | | | | |
| Microsoft Corp. | | | 165 | | | | 5,511 | |
| | | | | | | | | |
| TOTAL COMMON STOCK (Cost $247,943) | | | | | | | 251,564 | |
| | | | | | | | | |
| SHORT TERM INVESTMENTS - 4.06% | | | | | | | | |
Fidelity Institutional Money Market Funds - Money Market Portfolio, 0.08% (b) (Cost $10,460) | | | 10,460 | | | | 10,460 | |
| | | | | | | | | |
| TOTAL INVESTMENTS (Cost $258,403) - 101.74% | | | | | | $ | 262,024 | |
| LIABILITIES IN EXCESS OTHER ASSETS, NET - (1.74)% | | | | | | | (4,478 | ) |
| NET ASSETS - 100% | | | | | | $ | 257,546 | |
Percentages are stated as a percent of net assets.
(a) Non-income producing security.
(b) Rate shown represents the rate at August 31, 2013, is subject to change and resets daily.
ADR - American Depositary Receipt.
The accompanying notes are an integral part of these financial statements.
| SNOW FAMILY OF FUNDS | SEMI-ANNUAL REPORT |
| SCHEDULES OF INVESTMENTS | | | |
| AUGUST 31, 2013 (Unaudited) | | | |
| | | | |
| SNOW CAPITAL DIVIDEND PLUS FUND | | | |
| | | Shares | | | Fair Value | |
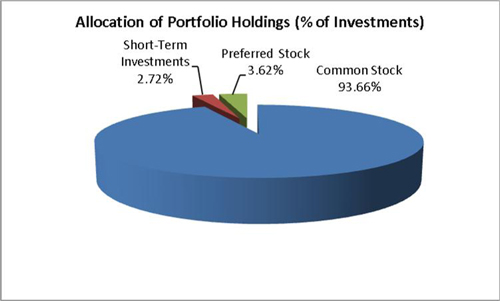
| COMMON STOCK - 95.26% | | | | | | |
| | | | | | | |
| Aerospace & Defense - (2.05%) | | | | | | |
| General Dynamics Corp. | | | 65 | | | $ | 5,411 | |
| | | | | | | | | |
| Agriculture - (3.65%) | | | | | | | | |
| Archer-Daniels-Midland Corp. | | | 165 | | | | 5,810 | |
| Lorillard, Inc. | | | 90 | | | | 3,807 | |
| | | | | | | | 9,617 | |
| Banks - (8.79%) | | | | | | | | |
| Banco Santander SA - ADR | | | 740 | | | | 5,261 | |
| Capital One Financial Corp. | | | 70 | | | | 4,519 | |
| JPMorgan Chase & Corp. | | | 265 | | | | 13,390 | |
| | | | | | | | 23,170 | |
| Chemicals - (3.64%) | | | | | | | | |
PetroLogistics LP (a) | | | 800 | | | | 9,608 | |
| | | | | | | | | |
| Computers - (1.78%) | | | | | | | | |
| Hewlett-Packard Co. | | | 210 | | | | 4,691 | |
| | | | | | | | | |
| Diversified Financial Services - (2.32%) | | | | | | | | |
| Federated Investors, Inc. | | | 225 | | | | 6,111 | |
| | | | | | | | | |
| Electric - (2.36%) | | | | | | | | |
| Duke Energy Corp. | | | 55 | | | | 3,608 | |
| FirstEnergy Corp. | | | 70 | | | | 2,623 | |
| | | | | | | | 6,231 | |
| Hand & Machine Tools - (2.98%) | | | | | | | | |
| Kennametal, Inc. | | | 185 | | | | 7,866 | |
| | | | | | | | | |
| Healthcare Services - (5.09%) | | | | | | | | |
| Select Medical Holdings Corp. | | | 630 | | | | 5,336 | |
| WellPoint, Inc. | | | 95 | | | | 8,088 | |
| | | | | | | | 13,424 | |
| Insurance - (6.16%) | | | | | | | | |
| Hartford Financial Services Group, Inc. | | | 245 | | | | 7,252 | |
| MetLife, Inc. | | | 195 | | | | 9,007 | |
| | | | | | | | 16,259 | |
| Iron & Steel - (1.81%) | | | | | | | | |
| Nucor Corp. | | | 105 | | | | 4,776 | |
| | | | | | | | | |
| Leisure Time - (3.06%) | | | | | | | | |
| Royal Caribbean Cruises Ltd. | | | 220 | | | | 8,072 | |
| | | | | | | | | |
| Media - (1.60%) | | | | | | | | |
| Gannett Co., Inc. | | | 175 | | | | 4,216 | |
| | | | | | | | | |
| Miscellaneous Manufacturing - (1.92%) | | | | | | | | |
| Eaton Corp. PLC | | | 80 | | | | 5,066 | |
| | | | | | | | | |
| Oil & Gas - (14.57%) | | | | | | | | |
| BP PLC - ADR | | | 185 | | | | 7,640 | |
| Chesapeake Energy Corp. | | | 255 | | | | 6,582 | |
| ConocoPhillips | | | 45 | | | | 2,983 | |
| Devon Energy Corp. | | | 135 | | | | 7,707 | |
| Noble Corp. | | | 125 | | | | 4,650 | |
| Phillips 66 | | | 155 | | | | 8,850 | |
| | | | | | | | 38,412 | |
| SNOW FAMILY OF FUNDS | SEMI-ANNUAL REPORT |
| SCHEDULES OF INVESTMENTS | | | |
| AUGUST 31, 2013 (Unaudited) | | | |
| | | | |
| SNOW CAPITAL DIVIDEND PLUS FUND | | | |
| | | Shares | | | Fair Value | |
| COMMON STOCK - 95.26% (Continued) | | | | | | |
| | | | | | | |
| Oil & Gas Services - (5.33%) | | | | | | |
| Baker Hughes, Inc. | | | 145 | | | $ | 6,741 | |
Suburban Propane Partners LP (a) | | | 160 | | | | 7,328 | |
| | | | | | | | 14,069 | |
| Packaging & Containers - (1.62%) | | | | | | | | |
| Sealed Air Corp. | | | 150 | | | | 4,260 | |
| | | | | | | | | |
| Pharmaceuticals - (3.70%) | | | | | | | | |
| Teva Pharmaceutical Industries Ltd. - ADR | | | 255 | | | | 9,746 | |
| | | | | | | | | |
| Real Estate Investment Trust - (3.03%) | | | | | | | | |
| Annaly Capital Management, Inc. | | | 685 | | | | 7,994 | |
| | | | | | | | | |
| Retail - (3.11%) | | | | | | | | |
| Kohl's Corp. | | | 160 | | | | 8,210 | |
| | | | | | | | | |
| Savings & Loans - (3.89%) | | | | | | | | |
| First Niagara Financial Group, Inc. | | | 1,015 | | | | 10,252 | |
| | | | | | | | | |
| Semiconductors - (5.40%) | | | | | | | | |
| Intel Corp. | | | 405 | | | | 8,902 | |
| Intersil Corp. | | | 240 | | | | 2,489 | |
| Marvell Technology Group Ltd. | | | 235 | | | | 2,846 | |
| | | | | | | | 14,237 | |
| Software - (5.69%) | | | | | | | | |
| Microsoft Corp. | | | 270 | | | | 9,018 | |
| Quality Systems, Inc. | | | 290 | | | | 6,000 | |
| | | | | | | | 15,018 | |
| Telecommunications - (1.71%) | | | | | | | | |
| Verizon Communications, Inc. | | | 95 | | | | 4,501 | |
| | | | | | | | | |
| TOTAL COMMON STOCK (Cost $243,311) | | | | | | | 251,217 | |
| | | | | | | | | |
| PREFERRED STOCK - 3.68% | | | | | | | | |
| Banks - (3.68%) | | | | | | | | |
| Bank of America Corp., 7.25%, Series L | | | 9 | | | | 9,710 | |
| TOTAL PREFERRED STOCK (Cost $11,381) | | | | | | | 9,710 | |
| | | | | | | | | |
| SHORT TERM INVESTMENTS - (2.77%) | | | | | | | | |
Fidelity Institutional Money Market Funds - Money Market Portfolio, 0.08% (b) (Cost $7,288) | | | 7,288 | | | | 7,288 | |
| | | | | | | | | |
| TOTAL INVESTMENTS (Cost $261,980) - 101.71% | | | | | | $ | 268,215 | |
| LIABILITIES IN EXCESS OTHER ASSETS, NET - (1.71%) | | | | | | | (4,500 | ) |
| NET ASSETS - 100% | | | | | | $ | 263,715 | |
Percentages are stated as a percent of net assets.
(a) Non-income producing security.
(b) Rate shown represents the rate at August 31, 2013, is subject to change and resets daily.
ADR - American Depositary Receipt.
The accompanying notes are an integral part of these financial statements.
| SNOW FAMILY OF FUNDS | SEMI-ANNUAL REPORT |
| SCHEDULES OF INVESTMENTS | | | |
| AUGUST 31, 2013 (Unaudited) | | | |
| | | | |
| SNOW CAPITAL MID CAP VALUE FUND | | | |
| | | Shares | | | Fair Value | |
| COMMON STOCK - 95.63% | | | | | | |
| | | | | | | |
| Aerospace & Defense - (4.07%) | | | | | | |
| General Dynamics Corp. | | | 100 | | | $ | 8,325 | |
Spirit Aerosystems Holdings, Inc. (a) | | | 120 | | | | 2,710 | |
| | | | | | | | 11,035 | |
| Agriculture - (2.47%) | | | | | | | | |
| Archer-Daniels-Midland Co. | | | 190 | | | | 6,690 | |
| | | | | | | | | |
| Airlines - (1.32%) | | | | | | | | |
| Southwest Airlines Co. | | | 280 | | | | 3,587 | |
| | | | | | | | | |
| Autoparts & Equipment - (5.25%) | | | | | | | | |
| Johnson Controls, Inc. | | | 215 | | | | 8,714 | |
TRW Automotive Holdings Corp. (a) | | | 80 | | | | 5,526 | |
| | | | | | | | 14,240 | |
| Banks - (4.43%) | | | | | | | | |
| KeyCorp | | | 625 | | | | 7,294 | |
| TCF Financial Corp. | | | 335 | | | | 4,707 | |
| | | | | | | | 12,001 | |
| Electronics - (5.59%) | | | | | | | | |
| Agilent Technologies, Inc. | | | 180 | | | | 8,395 | |
| Avnet, Inc. | | | 175 | | | | 6,748 | |
| | | | | | | | 15,143 | |
| Engineering & Construction - (1.38%) | | | | | | | | |
| KBR, Inc. | | | 125 | | | | 3,732 | |
| | | | | | | | | |
| Forest Products & Paper - (1.91%) | | | | | | | | |
| International Paper Co. | | | 110 | | | | 5,193 | |
| | | | | | | | | |
| Hand & Machine Tools - (3.53%) | | | | | | | | |
| Kennametal, Inc. | | | 225 | | | | 9,567 | |
| | | | | | | | | |
| Healthcare Products - (2.81%) | | | | | | | | |
Hospira, Inc. (a) | | | 195 | | | | 7,611 | |
| | | | | | | | | |
| Healthcare Services - (6.24%) | | | | | | | | |
| Community Health Systems, Inc. | | | 55 | | | | 2,159 | |
Health Management Associates, Inc. (a) | | | 485 | | | | 6,237 | |
| WellPoint, Inc. | | | 100 | | | | 8,514 | |
| | | | | | | | 16,910 | |
| Insurance - (9.78%) | | | | | | | | |
| Assurant, Inc. | | | 115 | | | | 6,100 | |
Genworth Financial, Inc. (a) | | | 435 | | | | 5,133 | |
| Hartford Financial Services Group, Inc. | | | 300 | | | | 8,880 | |
| Protective Life Corp. | | | 65 | | | | 2,716 | |
| XL Group PLC | | | 125 | | | | 3,695 | |
| | | | | | | | 26,524 | |
| Leisure Time - (2.10%) | | | | | | | | |
| Royal Caribbean Cruises Ltd. | | | 155 | | | | 5,687 | |
| | | | | | | | | |
| Machinery - Construction & Mining - (1.50%) | | | | | | | | |
Terex Corp. (a) | | | 140 | | | | 4,060 | |
| | | | | | | | | |
| Mining - (2.10%) | | | | | | | | |
| Alcoa, Inc. | | | 740 | | | | 5,698 | |
| | | | | | | | | |
| Miscellaneous Manufacturing - (1.99%) | | | | | | | | |
| Textron, Inc. | | | 200 | | | | 5,388 | |
| SNOW FAMILY OF FUNDS | SEMI-ANNUAL REPORT |
| SCHEDULES OF INVESTMENTS | | | |
| AUGUST 31, 2013 (Unaudited) | | | |
| | | | |
| SNOW CAPITAL MID CAP VALUE FUND | | | |
| | | | |
| COMMON STOCK - 95.63% (Continued) | | | |
| | | Shares | | | Fair Value | |
| Oil & Gas - (14.48%) | | | | | | |
| Chesapeake Energy Corp. | | | 245 | | | $ | 6,323 | |
| Devon Energy Corp. | | | 130 | | | | 7,422 | |
| Nabors Industries Ltd. | | | 330 | | | | 5,082 | |
| Noble Corp. | | | 230 | | | | 8,556 | |
| Patterson-UTI Energy, Inc. | | | 210 | | | | 4,114 | |
Ultra Petroleum Corp. (a) | | | 375 | | | | 7,762 | |
| | | | | | | | 39,259 | |
| Oil & Gas Services - (2.31%) | | | | | | | | |
| Baker Hughes, Inc. | | | 135 | | | | 6,276 | |
| | | | | | | | | |
| Packaging & Containers - (2.15%) | | | | | | | | |
| Sealed Air Corp. | | | 205 | | | | 5,822 | |
| | | | | | | | | |
| Pharmaceuticals - (3.03%) | | | | | | | | |
Endo Health Solutions, Inc. (a) | | | 200 | | | | 8,218 | |
| | | | | | | | | |
| Retail - (9.29%) | | | | | | | | |
Big Lots, Inc. (a) | | | 210 | | | | 7,438 | |
| Kohl's Corp. | | | 190 | | | | 9,749 | |
| Macy's, Inc. | | | 180 | | | | 7,997 | |
| | | | | | | | 25,184 | |
| Savings & Loans - (3.69%) | | | | | | | | |
| First Niagara Financial Group, Inc. | | | 990 | | | | 9,999 | |
| | | | | | | | | |
| Semiconductors - (1.07%) | | | | | | | | |
| Marvell Technology Group Ltd. | | | 240 | | | | 2,906 | |
| | | | | | | | | |
| Software - (3.14%) | | | | | | | | |
VeriFone Systems, Inc. (a) | | | 430 | | | | 8,523 | |
| | | | | | | | | |
| TOTAL COMMON STOCK (Cost $242,253) | | | 10,170 | | | | 259,253 | |
| | | | | | | | | |
| SHORT TERM INVESTMENTS - 6.21% | | | | | | | | |
Fidelity Institutional Money Market Funds - Money Market Portfolio, 0.08% (b) (Cost $16,850) | | | 16,850 | | | | 16,850 | |
| | | | | | | | | |
| TOTAL INVESTMENTS (Cost $259,103) - 101.84% | | | | | | $ | 276,103 | |
| LIABILITIES IN EXCESS OF OTHER ASSETS, NET - (1.84)% | | | | | | | (4,992 | ) |
| NET ASSETS - 100% | | | | | | $ | 271,111 | |
Percentages are stated as a percent of net assets.
(a) Non-income producing security.
(b) Rate shown represents the rate at August 31, 2013, is subject to change and resets daily.
ADR - American Depositary Receipt.
The accompanying notes are an integral part of these financial statements.
| SNOW FAMILY OF FUNDS | | SEMI-ANNUAL REPORT |
| STATEMENTS OF ASSETS AND LIABILITIES | | |
| AUGUST 31, 2013 (Unaudited) | | |
| | | Snow Capital | | | | Snow Capital | | | Snow Capital | |
| | | Focused Value Fund | | | | Hedged Equity Fund | | | Market Plus Fund | |
| Assets: | | | | | | | | | | |
| Investments, at value | | $ | 276,489 | | | | $ | 517,106 | | | $ | 272,985 | |
| Deposits at broker | | | - | | | | | 170,309 | | | | - | |
| Due from advisor | | | 4,304 | | | | | 4,074 | | | | 4,650 | |
| Receivables: | | | | | | | | | | | | | |
| Interest | | | 1 | | | | | 2 | | | | 1 | |
| Dividends | | | 713 | | | | | 1,136 | | | | 776 | |
| Prepaid expenses | | | 930 | | | | | 930 | | | | 930 | |
| Total assets | | | 282,437 | | | | | 693,557 | | | | 279,342 | |
| | | | | | | | | | | | | | |
| Liabilities: | | | | | | | | | | | | | |
| Securities sold short, at value | | | - | | | | | 163,714 | | | | - | |
| Payables: | | | | | | | | | | | | | |
| Dividends on securities sold short | | | - | | | | | 18 | | | | - | |
| Accrued distribution (12b-1) fees | | | 11 | | | | | 11 | | | | 11 | |
| Due to administrator | | | 4,660 | | | | | 4,692 | | | | 4,659 | |
| Accrued expenses | | | 5,671 | | | | | 5,026 | | | | 5,969 | |
| Total liabilities | | | 10,342 | | | | | 173,461 | | | | 10,639 | |
| Net Assets | | $ | 272,095 | | | | $ | 520,096 | | | $ | 268,703 | |
| | | | | | | | | | | | | | |
| Sources of Net Assets: | | | | | | | | | | | | | |
| Paid-in capital | | $ | 250,000 | | | | $ | 500,000 | | | $ | 250,000 | |
| Undistributed net realized gain on investments | | | 3,109 | | | | | 10,167 | | | | 2,827 | |
| Undistributed (accumulated) net investment income (loss) | | | 878 | | | | | (356 | ) | | | 1,668 | |
| Net unrealized appreciation on investments | | | 18,108 | | | | | 9,342 | | | | 14,208 | |
| Net unrealized appreciation on securities sold short | | | - | | | | | 943 | | | | - | |
| Total Net Assets (Unlimited shares of beneficial interest authorized) | | $ | 272,095 | | | | $ | 520,096 | | | $ | 268,703 | |
| | | | | | | | | | | | | | |
| Total Investments, at cost | | | 258,381 | | | | | 507,764 | | | | 258,777 | |
| Proceeds from securities sold short | | | - | | | | | 164,657 | | | | - | |
| | | | | | | | | | | | | | |
| Class A Shares: | | | | | | | | | | | | | |
| Net assets | | $ | 10,872 | | | | $ | 10,391 | | | $ | 10,737 | |
| Shares Outstanding (Unlimited shares of beneficial interest authorized) | | | 500 | | | | | 500 | | | | 500 | |
| Net Asset Value Per Share | | $ | 21.74 | | | | $ | 20.78 | | | $ | 21.47 | |
| | | | | | | | | | | | | | |
| Maximum Offering Price Per Share (a) | | $ | 22.94 | | | | $ | 21.93 | | | $ | 22.66 | |
| | | | | | | | | | | | | | |
| Minimum Redemption Price Per Share (b)(c) | | $ | 21.52 | | | | $ | 20.57 | | | $ | 21.26 | |
| | | | | | | | | | | | | | |
| Class I Shares: | | | | | | | | | | | | | |
| Net assets | | $ | 261,223 | | | | $ | 509,705 | | | $ | 257,966 | |
| Shares Outstanding (Unlimited shares of beneficial interest authorized) | | | 12,000 | | | | | 24,500 | | | | 12,000 | |
| Net Asset Value and Offering Price Per Share | | $ | 21.77 | | | | $ | 20.80 | | | $ | 21.50 | |
| | | | | | | | | | | | | | |
| Minimum Redemption Price Per Share (c) | | $ | 21.66 | | | | $ | 20.70 | | | $ | 21.39 | |
(a) A maximum sales charge of 5.25% is imposed on Class A shares.
(b) Investments in Class A shares made at or above the $1 million breakpoint are not subject to an initial sales charge and may be subject to a 0.50% contingent deferred sales charge ("CDSC") on shares redeemed within one year from the date of purchase.
(c) A redemption fee of 0.50% will be assessed on shares of the Fund that are held for 30 days or less.
The accompanying notes are an integral part of these financial statements.
| SNOW FAMILY OF FUNDS | | SEMI-ANNUAL REPORT |
| STATEMENTS OF ASSETS AND LIABILITIES | | |
| AUGUST 31, 2013 (Unaudited) | | |
| | | Snow Capital | | | | | | | |
| | | Inflation Advantaged Equities Fund | | | Plus Fund | | | Value Fund | |
| Assets: | | | | | | | | | |
| Investments, at value | | $ | 262,024 | | | $ | 268,215 | | | $ | 276,103 | |
| Due from advisor | | | 4,369 | | | | 4,480 | | | | 4,446 | |
| Receivables: | | | | | | | | | | | | |
| Interest | | | - | | | | - | | | | 1 | |
| Dividends | | | 710 | | | | 656 | | | | 190 | |
| Prepaid expenses | | | 930 | | | | 930 | | | | 930 | |
| Total assets | | | 268,033 | | | | 274,281 | | | | 281,670 | |
| | | | | | | | | | | | | |
| Liabilities: | | | | | | | | | | | | |
| Payables: | | | | | | | | | | | | |
| Accrued distribution (12b-1) fees | | | 11 | | | | 11 | | | | 11 | |
| Due to administrator | | | 4,658 | | | | 4,659 | | | | 4,660 | |
| Accrued expenses | | | 5,818 | | | | 5,896 | | | | 5,888 | |
| Total liabilities | | | 10,487 | | | | 10,566 | | | | 10,559 | |
| Net Assets | | $ | 257,546 | | | $ | 263,715 | | | $ | 271,111 | |
| | | | | | | | | | | | | |
| Sources of Net Assets: | | | | | | | | | | | | |
| Paid-in capital | | $ | 250,000 | | | $ | 250,000 | | | $ | 250,000 | |
| Undistributed net realized gain on investments | | | 2,703 | | | | 5,070 | | | | 3,887 | |
| Undistributed net investment income | | | 1,222 | | | | 2,410 | | | | 224 | |
| Net unrealized appreciation on investments | | | 3,621 | | | | 6,235 | | | | 17,000 | |
| Total Net Assets (Unlimited shares of beneficial interest authorized) | | $ | 257,546 | | | $ | 263,715 | | | $ | 271,111 | |
| | | | | | | | | | | | | |
| Total Investments, at cost | | | 258,403 | | | | 261,980 | | | | 259,103 | |
| | | | | | | | | | | | | |
| Class A Shares: | | | | | | | | | | | | |
| Net assets | | $ | 10,291 | | | $ | 10,538 | | | $ | 10,833 | |
| Shares Outstanding (Unlimited shares of beneficial interest authorized) | | | 500 | | | | 500 | | | | 500 | |
| Net Asset Value Per Share | | $ | 20.58 | | | $ | 21.08 | | | $ | 21.67 | |
| | | | | | | | | | | | | |
| Maximum Offering Price Per Share (a) | | $ | 21.72 | | | $ | 22.25 | | | $ | 22.87 | |
| | | | | | | | | | | | | |
| Minimum Redemption Price Per Share (b)(c) | | $ | 20.37 | | | $ | 20.87 | | | $ | 21.45 | |
| | | | | | | | | | | | | |
| Class I Shares: | | | | | | | | | | | | |
| Net assets | | $ | 247,255 | | | $ | 253,177 | | | $ | 260,278 | |
| Shares Outstanding (Unlimited shares of beneficial interest authorized) | | | 12,000 | | | | 12,000 | | | | 12,000 | |
| Net Asset Value and Offering Price Per Share | | $ | 20.60 | | | $ | 21.10 | | | $ | 21.69 | |
| | | | | | | | | | | | | |
| Minimum Redemption Price Per Share (c) | | $ | 20.50 | | | $ | 20.99 | | | $ | 21.58 | |
(a) A maximum sales charge of 5.50% is imposed on Class A shares.
(b) Investments in Class A shares made at or above the $1 million breakpoint are not subject to an initial sales charge and may be subject to a 0.50% contingent deferred sales charge ("CDSC") on shares redeemed within 12 months of purchase.
(c) A redemption fee of 0.50% will be assessed on shares of the Fund that are held for 30 days or less.
The accompanying notes are an integral part of these financial statements.
| SNOW FAMILY OF FUNDS | | SEMI-ANNUAL REPORT |
| STATEMENTS OF OPERATIONS | | |
| AUGUST 31, 2013 (Unaudited) | | |
| | | Snow Capital | | | Snow Capital | | | Snow Capital | |
| | | Focused Value Fund | | | Hedged Equity Fund | | | Market Plus Fund | |
| | | | | | | | | | |
| | | For the | | | For the | | | For the | |
| | | Period Ended | | | Period Ended | | | Period Ended | |
| | | August 31, 2013 (a) | | | August 31, 2013 (a) | | | August 31, 2013 (a) | |
| | | (Unaudited) | | | (Unaudited) | | | (Unaudited) | |
| Investment income: | | | | | | | | | |
| Dividends | | $ | 2,199 | | | $ | 3,379 | | | $ | 2,529 | |
| Interest | | | 5 | | | | 31 | | | | 4 | |
| Total investment income | | | 2,204 | | | | 3,410 | | | | 2,533 | |
| | | | | | | | | | | | | |
| Expenses: | | | | | | | | | | | | |
| Management fees | | | 1,029 | | | | 2,223 | | | | 569 | |
| Distribution (12b-1) fees - Class A | | | 11 | | | | 11 | | | | 11 | |
| Administration, Accounting and transfer agent fees and expenses | | | 12,533 | | | | 12,691 | | | | 12,532 | |
| Miscellaneous | | | 3,039 | | | | 3,046 | | | | 3,041 | |
| Audit fees | | | 2,428 | | | | 2,428 | | | | 2,428 | |
| Legal fees | | | 1,460 | | | | 1,460 | | | | 1,460 | |
| Custodian fees | | | 1,048 | | | | 1,048 | | | | 1,048 | |
| Pricing fees | | | 907 | | | | 1,048 | | | | 2,137 | |
| Trustee fees and expenses | | | 765 | | | | 765 | | | | 765 | |
| Registration and filing fees | | | 214 | | | | 214 | | | | 214 | |
| Insurance | | | 33 | | | | 33 | | | | 33 | |
| Dividends on securities sold short | | | - | | | | 735 | | | | - | |
| Interest expense | | | - | | | | 241 | | | | - | |
| Total expenses | | | 23,467 | | | | 25,943 | | | | 24,238 | |
| Less: fees waived and expenses absorbed | | | (22,141 | ) | | | (22,177 | ) | | | (23,373 | ) |
| Net expenses | | | 1,326 | | | | 3,766 | | | | 865 | |
| | | | | | | | | | | | | |
| Net investment income (loss) | | | 878 | | | | (356 | ) | | | 1,668 | |
| | | | | | | | | | | | | |
| Realized and unrealized gain (loss): | | | | | | | | | | | | |
| Net realized gain (loss) on: | | | | | | | | | | | | |
| Investments | | | 3,109 | | | | 12,507 | | | | 2,827 | |
| Securities sold short | | | - | | | | (2,340 | ) | | | - | |
| Net realized gain on investments | | | 3,109 | | | | 10,167 | | | | 2,827 | |
| | | | | | | | | | | | | |
| Net change in unrealized appreciation on: | | | | | | | | | | | | |
| Investments | | | 18,108 | | | | 9,342 | | | | 14,208 | |
| Securities sold short | | | - | | | | 943 | | | | - | |
| Net change in unrealized appreciation | | | 18,108 | | | | 10,285 | | | | 14,208 | |
| | | | | | | | | | | | | |
| Net gain on investments | | | 21,217 | | | | 20,452 | | | | 17,035 | |
| | | | | | | | | | | | | |
| Net increase in net assets resulting from operations | | $ | 22,095 | | | $ | 20,096 | | | $ | 18,703 | |
(a) The Funds commenced operations on March 28, 2013.
The accompanying notes are an integral part of these financial statements.
| SNOW FAMILY OF FUNDS | | SEMI-ANNUAL REPORT |
| STATEMENTS OF OPERATIONS | | |
| AUGUST 31, 2013 (Unaudited) | | |
| | | Snow Capital | | | | | | | |
| | | Inflation Advantaged Equities Fund | | | Plus Fund | | | Value Fund | |
| | | | | | | | | | |
| | | For the | | | For the | | | For the | |
| | | Period Ended | | | Period Ended | | | Period Ended | |
| | | August 31, 2013 (a) | | | August 31, 2013 (a) | | | August 31, 2013 (a) | |
| | | (Unaudited) | | | (Unaudited) | | | (Unaudited) | |
| Investment income: | | | | | | | | | |
Dividends (b) | | $ | 2,609 | | | $ | 3,542 | | | $ | 1,367 | |
| Interest | | | 4 | | | | 3 | | | | 5 | |
| Total investment income | | | 2,613 | | | | 3,545 | | | | 1,372 | |
| | | | | | | | | | | | | |
| Expenses: | | | | | | | | | | | | |
| Management fees | | | 1,104 | | | | 843 | | | | 853 | |
| Distribution (12b-1) fees - Class A | | | 11 | | | | 11 | | | | 11 | |
| Administration, Accounting and transfer agent fees and expenses | | | 12,527 | | | | 12,530 | | | | 12,532 | |
| Miscellaneous | | | 3,040 | | | | 3,040 | | | | 3,039 | |
| Audit fees | | | 2,428 | | | | 2,428 | | | | 2,428 | |
| Legal fees | | | 1,460 | | | | 1,460 | | | | 1,460 | |
| Custodian fees | | | 1,048 | | | | 1,048 | | | | 1,048 | |
| Pricing fees | | | 1,279 | | | | 1,571 | | | | 1,426 | |
| Trustee fees and expenses | | | 765 | | | | 765 | | | | 765 | |
| Registration and filing fees | | | 214 | | | | 214 | | | | 214 | |
| Insurance | | | 33 | | | | 33 | | | | 33 | |
| Total expenses | | | 23,909 | | | | 23,943 | | | | 23,809 | |
| Less: fees waived and expenses absorbed | | | (22,518 | ) | | | (22,808 | ) | | | (22,661 | ) |
| Net expenses | | | 1,391 | | | | 1,135 | | | | 1,148 | |
| | | | | | | | | | | | | |
| Net investment income | | | 1,222 | | | | 2,410 | | | | 224 | |
| | | | | | | | | | | | | |
| Realized and unrealized gain: | | | | | | | | | | | | |
| Net realized gain on: | | | | | | | | | | | | |
| Investments | | | 2,703 | | | | 5,070 | | | | 3,887 | |
| Net realized gain on investments | | | 2,703 | | | | 5,070 | | | | 3,887 | |
| | | | | | | | | | | | | |
| Net change in unrealized appreciation on: | | | | | | | | | | | | |
| Investments | | | 3,621 | | | | 6,235 | | | | 17,000 | |
| Net change in unrealized appreciation | | | 3,621 | | | | 6,235 | | | | 17,000 | |
| | | | | | | | | | | | | |
| Net gain on investments | | | 6,324 | | | | 11,305 | | | | 20,887 | |
| | | | | | | | | | | | | |
| Net increase in net assets resulting from operations | | $ | 7,546 | | | $ | 13,715 | | | $ | 21,111 | |
(a) The Funds commenced operations on March 28, 2013.
(b) Includes foreign taxes withheld of $9, $73, and $0, respectively.
The accompanying notes are an integral part of these financial statements.
| SNOW FAMILY OF FUNDS | | SEMI-ANNUAL REPORT |
| STATEMENTS OF CHANGES IN NET ASSETS | | |
| AUGUST 31, 2013 (Unaudited) | | |
| | | Snow Capital | | | Snow Capital | | | Snow Capital | |
| | | Focused Value Fund | | | Hedged Equity Fund | | | Market Plus Fund | |
| | | | | | | | | | |
| | | For the | | | For the | | | For the | |
| | | Period Ended | | | Period Ended | | | Period Ended | |
| | | August 31, 2013 (a) | | | August 31, 2013 (a) | | | August 31, 2013 (a) | |
| | | (Unaudited) | | | (Unaudited) | | | (Unaudited) | |
| Increase in net assets from: | | | | | | | | | |
| Operations: | | | | | | | | | |
| Net investment income (loss) | | $ | 878 | | | $ | (356 | ) | | $ | 1,668 | |
| Net realized gain on investments | | | 3,109 | | | | 10,167 | | | | 2,827 | |
| Net unrealized appreciation on investments | | | 18,108 | | | | 10,285 | | | | 14,208 | |
| Net increase in net assets resulting from operations | | | 22,095 | | | | 20,096 | | | | 18,703 | |
| | | | | | | | | | | | | |
| Capital share transactions (Note 2): | | | | | | | | | | | | |
| Increase in net assets from capital share transactions | | | 250,000 | | | | 500,000 | | | | 250,000 | |
| | | | | | | | | | | | | |
| Increase in net assets | | | 272,095 | | | | 520,096 | | | | 268,703 | |
| | | | | | | | | | | | | |
| Net Assets: | | | | | | | | | | | | |
| Beginning of period | | | - | | | | - | | | | - | |
| | | | | | | | | | | | | |
| End of period | | $ | 272,095 | | | $ | 520,096 | | | $ | 268,703 | |
| Undistributed (accumulated) net investment income (loss) | | $ | 878 | | | $ | (356 | ) | | $ | 1,668 | |
(a) The Funds commenced operations on March 28, 2013.
The accompanying notes are an integral part of these financial statements.
| SNOW FAMILY OF FUNDS | | SEMI-ANNUAL REPORT |
| STATEMENTS OF CHANGES IN NET ASSETS | | |
| AUGUST 31, 2013 (Unaudited) | | |
| | | Snow Capital | | | | | | | |
| | | Inflation Advantaged Equities Fund | | | Plus Fund | | | Value Fund | |
| | | | | | | | | | |
| | | For the | | | For the | | | For the | |
| | | Period Ended | | | Period Ended | | | Period Ended | |
| | | August 31, 2013 (a) | | | August 31, 2013 (a) | | | August 31, 2013 (a) | |
| | | (Unaudited) | | | (Unaudited) | | | (Unaudited) | |
| Increase in net assets from: | | | | | | | | | |
| Operations: | | | | | | | | | |
| Net investment income | | $ | 1,222 | | | $ | 2,410 | | | $ | 224 | |
| Net realized gain on investments | | | 2,703 | | | | 5,070 | | | | 3,887 | |
| Net unrealized appreciation on investments | | | 3,621 | | | | 6,235 | | | | 17,000 | |
| Net increase in net assets resulting from operations | | | 7,546 | | | | 13,715 | | | | 21,111 | |
| | | | | | | | | | | | | |
| Capital share transactions (Note 2): | | | | | | | | | | | | |
| Increase in net assets from capital share transactions | | | 250,000 | | | | 250,000 | | | | 250,000 | |
| | | | | | | | | | | | | |
| Increase in net assets | | | 257,546 | | | | 263,715 | | | | 271,111 | |
| | | | | | | | | | | | | |
| Net Assets: | | | | | | | | | | | | |
| Beginning of period | | | - | | | | - | | | | - | |
| | | | | | | | | | | | | |
| End of period | | $ | 257,546 | | | $ | 263,715 | | | $ | 271,111 | |
| Undistributed net investment income | | $ | 1,222 | | | $ | 2,410 | | | $ | 224 | |
(a) The Funds commenced operations on March 28, 2013.
The accompanying notes are an integral part of these financial statements.
| SNOW FAMILY OF FUNDS | SEMI-ANNUAL REPORT |
| FINANCIAL HIGHLIGHTS | |
| AUGUST 31, 2013 (Unaudited) | |
The following tables set forth the per share operating performance data for a share of capital stock outstanding, total return ratios to average net assets and other supplemental data for the period indicated.
| | | Snow Capital Focused Value Fund | | | | Snow Capital Hedged Equity Fund | | |
| | | | | | | | | | | | | | | | | |
| | | Class A | | | | Class I | | | | Class A | | | | Class I | | |
| | | For the | | | | For the | | | | For the | | | | For the | | |
| | | Period Ended | | | | Period Ended | | | | Period Ended | | | | Period Ended | | |
| | | August 31, 2013 (a) | | | | August 31, 2013 (a) | | | | August 31, 2013 (a) | | | | August 31, 2013 (a) | | |
| | | (Unaudited) | | | | (Unaudited) | | | | (Unaudited) | | | | (Unaudited) | | |
| | | | | | | | | | | | | | | | | |
| Net Asset Value, Beginning of Period | | $ | 20.00 | | | | $ | 20.00 | | | | $ | 20.00 | | | | $ | 20.00 | | |
| | | | | | | | | | | | | | | | | | | | | |
| Investment Operations: | | | | | | | | | | | | | | | | | | | | |
| Net investment income (loss) | | | 0.05 | | | | | 0.07 | | | | | (0.04 | ) | | | | (0.01 | ) | |
Net realized and unrealized gain on investments | | | 1.69 | | | | | 1.70 | | | | | 0.82 | | | | | 0.81 | | |
| Total from investment operations | | | 1.74 | | | | | 1.77 | | | | | 0.78 | | | | | 0.80 | | |
| | | | | | | | | | | | | | | | | | | | | |
| Net Asset Value, End of Period | | $ | 21.74 | | | | $ | 21.77 | | | | $ | 20.78 | | | | $ | 20.80 | | |
| | | | | | | | | | | | | | | | | | | | | |
| Total Return (b) | | | 8.70 | % | (c) | | | 8.85 | % | (c) | | | 3.90 | % | (c) | | | 4.00 | % | (c) |
| | | | | | | | | | | | | | | | | | | | | |
| Ratios/Supplemental Data | | | | | | | | | | | | | | | | | | | | |
| Net assets, end of period (in 000's) | | $ | 11 | | | | $ | 261 | | | | $ | 10 | | | | $ | 510 | | |
| | | | | | | | | | | | | | | | | | | | | |
| Ratio of expenses to average net assets: | | | | | | | | | | | | | | | | | | | | |
| Before fees waived and expenses absorbed | | | 20.77 | % | (d) | | | 20.52 | % | (d) | | | 11.91 | % | (d) (e) | | | 11.66 | % | (d) (e) |
| After fees waived and expenses absorbed | | | 1.40 | % | (d) | | | 1.15 | % | (d) | | | 1.94 | % | (d) (e) | | | 1.69 | % | (d) (e) |
| | | | | | | | | | | | | | | | | | | | | |
| Ratio of net investment income (loss): | | | | | | | | | | | | | | | | | | | | |
| Before fees waived and expenses absorbed | | | (18.85 | )% | (d) | | | (18.59 | )% | (d) | | | (10.38 | )% | (d) (e) | | | (10.13 | )% | (d) (e) |
| After fees waived and expenses absorbed | | | 0.53 | % | (d) | | | 0.78 | % | (d) | | | (0.40 | )% | (d) (e) | | | (0.16 | )% | (d) (e) |
| | | | | | | | | | | | | | | | | | | | | |
| Portfolio turnover rate | | | 22.26 | % | (c) | | | 22.26 | % | (c) | | | 119.37 | % | (c) | | | 119.37 | % | (c) |
(a) The Funds commenced operations on March 28, 2013.
(b) Total Return represents the rate that the investor would have earned or lost on an investment in the Fund, assuming reinvestment of dividends.
(c) Not annualized.
(d) Annualized.
(e) The ratios include 0.44% for dividends on securities sold short and interest expense.
The accompanying notes are an integral part of these financial statements.
| SNOW FAMILY OF FUNDS | SEMI-ANNUAL REPORT |
| FINANCIAL HIGHLIGHTS | |
| AUGUST 31, 2013 (Unaudited) | |
The following tables set forth the per share operating performance data for a share of capital stock outstanding, total return ratios to average net assets and other supplemental data for the period indicated.
| | | | | | | | | | | Snow Capital | | |
| | | Snow Capital Market Plus Fund | | | | Inflation Advantaged Equities Fund | | |
| | | | | | | | | | | | | | | | | |
| | | Class A | | | | Class I | | | | Class A | | | | Class I | | |
| | | For the | | | | For the | | | | For the | | | | For the | | |
| | | Period Ended | | | | Period Ended | | | | Period Ended | | | | Period Ended | | |
| | | August 31, 2013 (a) | | | | August 31, 2013 (a) | | | | August 31, 2013 (a) | | | | August 31, 2013 (a) | | |
| | | (Unaudited) | | | | (Unaudited) | | | | (Unaudited) | | | | (Unaudited) | | |
| | | | | | | | | | | | | | | | | |
| Net Asset Value, Beginning of Period | | $ | 20.00 | | | | $ | 20.00 | | | | $ | 20.00 | | | | $ | 20.00 | | |
| | | | | | | | | | | | | | | | | | | | | |
| Investment Operations: | | | | | | | | | | | | | | | | | | | | |
| Net investment income | | | 0.11 | | | | | 0.13 | | | | | 0.08 | | | | | 0.10 | | |
| Net realized and unrealized gain on investments | | | 1.36 | | | | | 1.37 | | | | | 0.50 | | | | | 0.50 | | |
| Total from investment operations | | | 1.47 | | | | | 1.50 | | | | | 0.58 | | | | | 0.60 | | |
| | | | | | | | | | | | | | | | | | | | | |
| Net Asset Value, End of Period | | $ | 21.47 | | | | $ | 21.50 | | | | $ | 20.58 | | | | $ | 20.60 | | |
| | | | | | | | | | | | | | | | | | | | | |
| Total Return (b) | | | 7.35 | % | (c) | | | 7.50 | % | (c) | | | 2.90 | % | (c) | | | 3.00 | % | (c) |
| | | | | | | | | | | | | | | | | | | | | |
| Ratios/Supplemental Data | | | | | | | | | | | | | | | | | | | | |
| Net assets, end of period (in 000's) | | $ | 11 | | | | $ | 258 | | | | $ | 10 | | | | $ | 247 | | |
| | | | | | | | | | | | | | | | | | | | | |
| Ratio of expenses to average net assets: | | | | | | | | | | | | | | | | | | | | |
| Before fees waived and expenses absorbed | | | 21.53 | % | (d) | | | 21.28 | % | (d) | | | 21.90 | % | (d) | | | 21.65 | % | (d) |
| After fees waived and expenses absorbed | | | 1.00 | % | (d) | | | 0.75 | % | (d) | | | 1.50 | % | (d) | | | 1.25 | % | (d) |
| | | | | | | | | | | | | | | | | | | | | |
| Ratio of net investment income (loss): | | | | | | | | | | | | | | | | | | | | |
| Before fees waived and expenses absorbed | | | (19.31 | )% | (d) | | | (19.06 | )% | (d) | | | (19.53 | )% | (d) | | | (19.28 | )% | (d) |
| After fees waived and expenses absorbed | | | 1.23 | % | (d) | | | 1.48 | % | (d) | | | 0.87 | % | (d) | | | 1.12 | % | (d) |
| | | | | | | | | | | | | | | | | | | | | |
| Portfolio turnover rate | | | 20.87 | % | (c) | | | 20.87 | % | (c) | | | 20.79 | % | (c) | | | 20.79 | % | (c) |
(a) The Funds commenced operations on March 28, 2013.
(b) Total Return represents the rate that the investor would have earned or lost on an investment in the Fund, assuming reinvestment of dividends.
(c) Not annualized.
(d) Annualized.
The accompanying notes are an integral part of these financial statements.
| SNOW FAMILY OF FUNDS | SEMI-ANNUAL REPORT |
| FINANCIAL HIGHLIGHTS | |
| AUGUST 31, 2013 (Unaudited) | |
The following tables set forth the per share operating performance data for a share of capital stock outstanding, total return ratios to average net assets and other supplemental data for the period indicated.
| | | Snow Capital Dividend Plus Fund | | | | Snow Capital Mid Cap Value Fund | | |
| | | | | | | | | | | | | | | | | |
| | | Class A | | | | Class I | | | | Class A | | | | Class I | | |
| | | For the | | | | For the | | | | For the | | | | For the | | |
| | | Period Ended | | | | Period Ended | | | | Period Ended | | | | Period Ended | | |
| | | August 31, 2013 (a) | | | | August 31, 2013 (a) | | | | August 31, 2013 (a) | | | | August 31, 2013 (a) | | |
| | | (Unaudited) | | | | (Unaudited) | | | | (Unaudited) | | | | (Unaudited) | | |
| | | | | | | | | | | | | | | | | |
| Net Asset Value, Beginning of Period | | $ | 20.00 | | | | $ | 20.00 | | | | $ | 20.00 | | | | $ | 20.00 | | |
| | | | | | | | | | | | | | | | | | | | | |
| Investment Operations: | | | | | | | | | | | | | | | | | | | | |
| Net investment income | | | 0.17 | | | | | 0.19 | | | | | - | | (b) | | | 0.02 | | |
| Net realized and unrealized gain on investments | | | 0.91 | | | | | 0.91 | | | | | 1.67 | | | | | 1.67 | | |
| Total from investment operations | | | 1.08 | | | | | 1.10 | | | | | 1.67 | | | | | 1.69 | | |
| | | | | | | | | | | | | | | | | | | | | |
| Net Asset Value, End of Period | | $ | 21.08 | | | | $ | 21.10 | | | | $ | 21.67 | | | | $ | 21.69 | | |
| | | | | | | | | | | | | | | | | | | | | |
| Total Return (c) | | | 5.40 | % | (d) | | | 5.50 | % | (d) | | | 8.35 | % | (d) | | | 8.45 | % | (d) |
| | | | | | | | | | | | | | | | | | | | | |
| Ratios/Supplemental Data | | | | | | | | | | | | | | | | | | | | |
| Net assets, end of period (in 000's) | | $ | 11 | | | | $ | 253 | | | | $ | 11 | | | | $ | 260 | | |
| | | | | | | | | | | | | | | | | | | | | |
| Ratio of expenses to average net assets: | | | | | | | | | | | | | | | | | | | | |
| Before fees waived and expenses absorbed | | | 21.53 | % | (e) | | | 21.29 | % | (e) | | | 21.17 | % | (e) | | | 20.92 | % | (e) |
| After fees waived and expenses absorbed | | | 1.25 | % | (e) | | | 1.00 | % | (e) | | | 1.25 | % | (e) | | | 1.00 | % | (e) |
| | | | | | | | | | | | | | | | | | | | | |
| Ratio of net investment income (loss): | | | | | | | | | | | | | | | | | | | | |
| Before fees waived and expenses absorbed | | | (18.38 | )% | (e) | | | (18.13 | )% | (e) | | | (19.96 | )% | (e) | | | (19.71 | )% | (e) |
| After fees waived and expenses absorbed | | | 1.91 | % | (e) | | | 2.16 | % | (e) | | | (0.04 | )% | (e) | | | 0.21 | % | (e) |
| | | | | | | | | | | | | | | | | | | | | |
| Portfolio turnover rate | | | 34.44 | % | (d) | | | 34.44 | % | (d) | | | 13.03 | % | (d) | | | 13.03 | % | (d) |
(a) The Funds commenced operations on March 28, 2013.
(b) Net investment income resulted in less than $0.01 per share.
(c) Total Return represents the rate that the investor would have earned or lost on an investment in the Fund, assuming reinvestment of dividends.
(d) Not annualized.
(e) Annualized.
The accompanying notes are an integral part of these financial statements.
August 31, 2013 (Unaudited)
| 1. | ORGANIZATION AND SIGNIFICANT ACCOUNTING POLICIES |
The Snow Family of Funds (the “Funds”) are a series of 360 Funds (the “Trust”). The Trust was organized on February 25, 2005 as a Delaware statutory trust. The Trust is registered as an open end management investment company under the Investment Company Act of 1940 (the “1940 Act”). The Trust currently offers eight series of shares. The following series of the Snow Family Funds: (i) Snow Capital Focused Value Fund (“Focused Value Fund”), (ii) Snow Capital Hedged Equity Fund (“Hedged Equity Fund”), (iii) Snow Capital Market Plus Fund (“Market Plus Fund”), (iv) Snow Capital Inflation Advantaged Equities Fund (“Inflation Advantaged Equities Fund”), (v) Snow Capital Dividend Plus Fund (“Dividend Plus Fund”), and (vi) Snow Capital Mid Cap Value Fund (“Mid Cap Value Fund”) (each a “Fund” and collectively, the Funds) are each an open end management investment company and separate series of the Trust. All of the Funds, except Snow Capital Dividend Plus Fund, are non-diversified Funds. As non-diversified Funds, they may invest a significant portion of its assets in a small number of companies. The Funds’ investment adviser is Snow Capital Management, L.P (the “Adviser”). Each Fund offers two classes of shares, Class A and Class I shares. Each class of shares commenced operations on March 28, 2013. Each class differs as to sales and redemption charges and ongoing fees. Income and realized/unrealized gains or losses are allocated to each class based on relative share balances. Each Fund’s investment objectives are as follows:
| Focused Value Fund | Long-term growth of capital |
| Hedged Equity Fund | Long-term growth of capital and protection of investment principal with lower volatility than the U.S. equity market |
| Market Plus Fund | Long-term growth of capital |
| Inflation Advantaged Equities Fund | Long-term growth of capital and protection of investment principal |
| Dividend Plus Fund | Long-term growth of capital and income |
| Mid Cap Value Fund | Long-term growth of capital |
The following is a summary of significant accounting policies consistently followed by the Fund. The policies are in conformity with accounting principles generally accepted in the United States of America (“GAAP”).
a) Investment Valuation - Equity securities, including Exchange Traded Funds (“ETFs”), listed on a securities exchange or quoted on a national market system are valued at 4:00 p.m., New York time, on the day of valuation. Price information on listed securities is taken from the exchange where the security is primarily traded. Equity securities that are traded on the NASDAQ National Market System, for which quotes are readily available, are valued at the official closing price. Securities that are listed on an exchange but which are not traded on the valuation date are valued at the most recent bid quotation. To the extent these securities are actively traded and valuation adjustments are not applied, they are categorized in Level 1 of the fair value hierarchy described below. When an equity security is valued by an independent pricing service using factors other than market quotations or the market is considered inactive, they will be categorized in Level 2. Money market funds are valued at their net asset value of $1.00 per share and are categorized as Level 1. Securities with maturities of 60 days or less may be valued at amortized cost, which approximates fair value and would be categorized as Level 2. The Funds normally use pricing services to obtain market quotations. Securities and assets for which representative market quotations are not readily available or which cannot be accurately valued using the Funds’ normal pricing procedures are valued at fair value as determined in good faith under policies approved by the Board of Trustees (the “Board”). Depending on the relative significance of valuation inputs, fair valued securities may be classified in either Level 2 or Level 3 of the fair value hierarchy. Fair value pricing may be used, for example, in situations where (i) a portfolio security, such as a small-cap stock, is so thinly traded that there have been no transactions for that stock over an extended period of time or the validity of a market quotation received is questionable; (ii) the exchange on which the portfolio security is principally traded closes early; (iii) trading of the particular portfolio security is halted during the day and does not resume prior to the Fund’s net asset value calculation; or (iv) the security or warrant is a restricted security not registered under federal securities laws purchased through a private placement not eligible for resale. Because a fair value determination is based on an assessment of the value of the security pursuant to the policies approved by the Fund’s Board, the fair value price may differ substantially from the price at which the security may ultimately be traded or sold. The differences could be material. As of August 31, 2013, no securities were fair valued as determined by the Board.
| Snow Family of Funds | SEMI-ANNUAL REPORT |
NOTES TO THE FINANCIAL STATEMENTS
August 31, 2013 (Unaudited)
| 1. | ORGANIZATION AND SIGNIFICANT ACCOUNTING POLICIES (continued) |
In accordance with the authoritative guidance on fair value measurements and disclosure under GAAP, the Fund discloses fair value of its investments in a hierarchy that prioritizes the inputs to valuation techniques used to measure fair value. The objective of a fair value measurement is to determine the price that would be received to sell an asset or paid to transfer a liability in an orderly transaction between market participants at the measurement date (an exit price). Accordingly, the fair value hierarchy gives the highest priority to quoted prices (unadjusted) in active markets for identical assets or liabilities (Level 1) and the lowest priority to unobservable inputs (Level 3). The three levels of the fair value hierarchy under ASC 820 are described below:
| Level 1 – | Quoted prices in active markets for identical securities. |
| Level 2 – | Other significant observable inputs (including quoted prices for similar securities, interest rates, prepayment speeds, credit risk, etc.). |
| Level 3 – | Significant unobservable inputs (including the Fund’s own assumptions in determining the fair value of investments). |
The inputs or methodology used for valuing securities are not an indication of the risk associated with investing in those securities.
The following is a summary of the inputs used, as of August 31, 2013, in valuing the Fund’s investments carried at fair value:
Security Classification (a) | | Level 1 | | | Level 2 | | | Level 3 | | | Total | |
| Focused Value Fund: | | | | | | | | | | | | |
Common Stock (b) | | | 260,999 | | | | - | | | | - | | | | 260,999 | |
| Short-Term Investments | | | 15,490 | | | | - | | | | - | | | | 15,490 | |
| Total Investments in Securities | | | 276,489 | | | | - | | | | - | | | | 276,489 | |
| Hedged Equity Fund: | | | | | | | | | | | | | | | | |
Common Stock (b) | | | 426,589 | | | | - | | | | - | | | | 426,589 | |
Exchange-Traded Funds (b) | | | 61,498 | | | | - | | | | - | | | | 61,498 | |
| Short-Term Investments | | | 29,019 | | | | - | | | | - | | | | 29,019 | |
| Total Investments in Securities | | | 517,106 | | | | - | | | | - | | | | 517,106 | |
Common Stock – Sold Short (b) | | | 25,637 | | | | - | | | | - | | | | 25,637 | |
Exchange-Traded Funds – Sold Short (b) | | | 138,077 | | | | - | | | | - | | | | 138,077 | |
| Total Investments in Securities Sold Short | | | 163,714 | | | | - | | | | - | | | | 163,714 | |
| Market Plus Fund: | | | | | | | | | | | | | | | | |
Common Stock (b) | | | 260,477 | | | | - | | | | - | | | | 260,477 | |
| Short-Term Investments | | | 12,508 | | | | - | | | | - | | | | 12,508 | |
| Total Investments in Securities | | | 272,985 | | | | - | | | | - | | | | 272,985 | |
| Inflation Advantaged Equities Fund: | | | | | | | | | | | | | | | | |
Common Stock (b) | | | 251,564 | | | | - | | | | - | | | | 251,564 | |
| Short-Term Investments | | | 10,460 | | | | - | | | | - | | | | 10,460 | |
| Total Investments in Securities | | | 262,024 | | | | - | | | | - | | | | 262,024 | |
| Dividend Plus Fund: | | | | | | | | | | | | | | | | |
Common Stock (b) | | | 251,217 | | | | - | | | | - | | | | 251,217 | |
Preferred Stock (b) | | | 9,710 | | | | - | | | | - | | | | 9,710 | |
| Short-Term Investments | | | 7,288 | | | | - | | | | - | | | | 7,288 | |
| Total Investments in Securities | | | 268,215 | | | | - | | | | - | | | | 268,215 | |
| Mid Cap Value Fund: | | | | | | | | | | | | | | | | |
Common Stock (b) | | | 259,253 | | | | - | | | | - | | | | 259,253 | |
| Short-Term Investments | | | 16,850 | | | | - | | | | - | | | | 16,850 | |
| Total Investments in Securities | | | 276,103 | | | | - | | | | - | | | | 276,103 | |
| Snow Family of Funds | SEMI-ANNUAL REPORT |
NOTES TO THE FINANCIAL STATEMENTS
August 31, 2013 (Unaudited)
| 1. | ORGANIZATION AND SIGNIFICANT ACCOUNTING POLICIES (continued) |
(a) At August 31, 2013, the Fund held no securities that were considered to be “Level 3” securities (those valued using significant unobservable inputs). Therefore, a reconciliation of assets in which significant unobservable inputs (Level 3) were used in determining fair value is not applicable.
(b) All common stock and exchange traded funds held in the Funds are Level 1 securities. For a detailed break-out of common stock by industry and exchange traded funds by investment type, please refer to the Schedules of Investments.
The Fund recognizes transfers, if any, between fair value hierarchy levels at the reporting period end. There were no transfers between levels as of May 31, 2013, from the valuation input levels used on March 28, 2013 (inception date).
b) Federal Income Taxes - The Funds intend to qualify as a regulated investment companies under Subchapter M of the Internal Revenue Code of 1986, as amended (the “Code”). It is the policy of the Funds to comply with the requirements of the Code applicable to regulated investment companies and to distribute substantially all of their net investment company taxable income and net capital gains. Therefore, no provisions for federal income taxes are required.
As of and during the period since inception of March 28, 2013 through August 31, 2013, the Funds did not have any liabilities for any unrecognized tax expenses. The Funds recognize interest and penalties, if any, related to unrecognized tax liability as income tax expense in the statements of operations. During the period since inception of March 28, 2013 through August 31, 2013, the Funds did not incur any interest or penalties. The Funds identify their major tax jurisdictions as U.S. Federal and the state of Delaware.
c) Distributions to Shareholders - Dividends from net investment income and distributions of net realized capital gains, if any, will be declared and paid at least annually. Income and capital gain distributions, which are determined in accordance with income tax regulations, are recorded on the ex-dividend date. GAAP requires that permanent financial reporting differences relating to shareholder distributions be reclassified to paid-in capital or net realized gains.
e) Use of Estimates - The preparation of financial statements in conformity with GAAP requires management to make estimates and assumptions that affect the reported amounts of assets and liabilities and disclosure of contingent assets and liabilities at the date of the financial statements and the reported amounts of revenues and expenses during the reporting period. Actual results could differ from those estimates.
f) Other - Investment and shareholder transactions are recorded on trade date. The Funds determine the gain or loss realized from the investment transactions by comparing the original cost of the security lot sold with the net sales proceeds. Dividend income is recognized on the ex-dividend date or as soon as information is available to the Funds and interest income is recognized on an accrual basis. Withholding taxes on foreign dividends have been provided for in accordance with the Funds’ understanding of the applicable country’s tax rules and rates.
g) Short Sales of Securities – A Fund may make short sales, which are transactions in which a Fund sells a security it does not own in anticipation of a decline in the market value of that security. To complete a short sale transaction, a Fund will borrow the security from a broker-dealer, which generally involves the payment of a premium and transaction costs. A Fund then sells the borrowed security to a buyer in the market. A Fund will then cover the short position by buying shares in the market either (i) at its discretion; or (ii) when called by the broker-dealer lender. Until the security is replaced, a Fund is required to pay the broker-dealer lender any dividends or interest that accrues during the period of the loan. In addition, the net proceeds of the short sale will be retained by the broker to the extent necessary to meet regulatory or other requirements, until the short position is closed out.
A Fund will incur a loss as a result of the short sale if the price of the security increases between the date of the short sale and the date on which a Fund replaces the borrowed security. A Fund will realize a gain if the security declines in price between those dates. The amount of any gain will be decreased, and the amount of any loss increased, by the amount of the premium, dividends, interest or expenses a Fund may be required to pay in connection with a short sale. When a Fund makes a short sale, a Fund will segregate liquid assets (such as cash, U.S. government securities, or equity securities) on a Fund’s books and/or in a segregated account at a Fund’s custodian in an amount sufficient to cover the current value of the securities to be replaced as well as any dividends, interest and/or transaction costs due to the broker-dealer lender. In determining the amount to be segregated, any securities that have been sold short by a Fund will be marked to market daily. To the extent the market price of the security sold short increases and more assets are required to meet a Fund’s short sale obligations, additional assets will be segregated to ensure adequate coverage of a Fund’s short position obligations.
| Snow Family of Funds | SEMI-ANNUAL REPORT |
NOTES TO THE FINANCIAL STATEMENTS
August 31, 2013 (Unaudited)
| 1. | ORGANIZATION AND SIGNIFICANT ACCOUNTING POLICIES (continued) |
In addition, a Fund may make short sales “against the box”, i.e., when a Fund sells a security short when a Fund has segregated securities equivalent in kind and amount to the securities sold short (or securities convertible or exchangeable into such securities) and will hold such securities while the short sale is outstanding. A Fund will incur transaction costs, including interest, in connection with opening, maintaining, and closing short sales against the box.
h) Exchange Traded Funds – A Fund may invest in Exchange Traded Funds (“ETFs”). ETFs are registered investment companies and incur fees and expenses such as operating expenses, licensing fees, registration fees, trustees fees, and marketing expenses, and ETF shareholders, such as a Fund, pay their proportionate share of these expenses. Your cost of investing in a Fund will generally be higher than the cost of investing directly in ETFs. By investing in a Fund, you will indirectly bear fees and expenses charged by the underlying ETFs in which a Fund invests in addition to a Fund's direct fees and expenses.
i) Redemption fees - Shareholders that redeem shares within 30 days of purchase will be assessed a redemption fee of 0.50% of the amount redeemed. The redemption fee is paid directly to and retained by the Funds, and is designed to deter excessive short-term trading and to offset brokerage commissions, market impact and other costs that may be associated with short-term money movement in and out of the Funds. No redemption fees were paid to the Funds during the period since inception of March 28, 2013 through August 31, 2013.
| 2. | CAPITAL SHARE TRANSACTIONS |
Transactions in shares of capital stock for the Funds for the period since inception of March 28, 2013 through August 31, 2013 were as follows:
| Focused Value Fund: | | Sold | | | Redeemed | | | Reinvested | | | Net Increase | |
| Class A | | | | | | | | | | | | |
| Shares | | | 500 | | | | - | | | | - | | | | 500 | |
| Value | | $ | 10,000 | | | | - | | | | - | | | $ | 10,000 | |
| Class I | | | | | | | | | | | | | | | | |
| Shares | | | 12,000 | | | | - | | | | - | | | | 12,000 | |
| Value | | $ | 240,000 | | | | - | | | | - | | | $ | 240,000 | |
| Hedged Equity Fund: | | Sold | | | Redeemed | | | Reinvested | | | Net Increase | |
| Class A | | | | | | | | | | | | |
| Shares | | | 500 | | | | - | | | | - | | | | 500 | |
| Value | | $ | 10,000 | | | | - | | | | - | | | $ | 10,000 | |
| Class I | | | | | | | | | | | | | | | | |
| Shares | | | 24,500 | | | | - | | | | - | | | | 24,500 | |
| Value | | $ | 490,000 | | | | - | | | | - | | | $ | 490,000 | |
| Market Plus Fund: | | Sold | | | Redeemed | | | Reinvested | | | Net Increase | |
| Class A | | | | | | | | | | | | |
| Shares | | | 500 | | | | - | | | | - | | | | 500 | |
| Value | | $ | 10,000 | | | | - | | | | - | | | $ | 10,000 | |
| Class I | | | | | | | | | | | | | | | | |
| Shares | | | 12,000 | | | | - | | | | - | | | | 12,000 | |
| Value | | $ | 240,000 | | | | - | | | | - | | | $ | 240,000 | |
| Snow Family of Funds | SEMI-ANNUAL REPORT |
NOTES TO THE FINANCIAL STATEMENTS
August 31, 2013 (Unaudited)
| 2. | CAPITAL SHARE TRANSACTIONS (continued) |
| Inflation Advantaged Equities Fund: | | Sold | | | Redeemed | | | Reinvested | | | Net Increase | |
| Class A | | | | | | | | | | | | |
| Shares | | | 500 | | | | - | | | | - | | | | 500 | |
| Value | | $ | 10,000 | | | | - | | | | - | | | $ | 10,000 | |
| Class I | | | | | | | | �� | | | | | | | | |
| Shares | | | 12,000 | | | | - | | | | - | | | | 12,000 | |
| Value | | $ | 240,000 | | | | - | | | | - | | | $ | 240,000 | |
| Dividend Plus Fund: | | Sold | | | Redeemed | | | Reinvested | | | Net Increase | |
| Class A | | | | | | | | | | | | |
| Shares | | | 500 | | | | - | | | | - | | | | 500 | |
| Value | | $ | 10,000 | | | | - | | | | - | | | $ | 10,000 | |
| Class I | | | | | | | | | | | | | | | | |
| Shares | | | 12,000 | | | | - | | | | - | | | | 12,000 | |
| Value | | $ | 240,000 | | | | - | | | | - | | | $ | 240,000 | |
| Mid Cap Value Fund: | | Sold | | | Redeemed | | | Reinvested | | | Net Increase | |
| Class A | | | | | | | | | | | | |
| Shares | | | 500 | | | | - | | | | - | | | | 500 | |
| Value | | $ | 10,000 | | | | - | | | | - | | | $ | 10,000 | |
| Class I | | | | | | | | | | | | | | | | |
| Shares | | | 12,000 | | | | - | | | | - | | | | 12,000 | |
| Value | | $ | 240,000 | | | | - | | | | - | | | $ | 240,000 | |
| 3. | INVESTMENT TRANSACTIONS |
For the period from inception of March 28, 2013 through October 31, 2012, aggregate purchases and sales of investment securities (excluding short-term investments) for Funds were as follows:
| Fund | | Purchases | | | Sales | |
| Focused Value Fund: | | $ | 296,062 | | | $ | 56,280 | |
| Hedged Equity Fund | | | 979,009 | | | | 512,771 | |
| Market Plus Fund | | | 296,783 | | | | 53,341 | |
| Inflation Advantaged Equities Fund | | | 297,015 | | | | 51,775 | |
| Dividend Plus Fund | | | 338,476 | | | | 88,473 | |
| Mid Cap Value Fund | | | 271,296 | | | | 32,930 | |
There were no government securities purchased or sold during the period.
| Snow Family of Funds | SEMI-ANNUAL REPORT |
NOTES TO THE FINANCIAL STATEMENTS
August 31, 2013 (Unaudited)
| 4. | ADVISORY FEES AND OTHER RELATED PARTY TRANSACTIONS |
The Funds have entered into Investment Advisory Agreements (the “Advisory Agreements”) with the Adviser. Pursuant to the Advisory Agreements, the Adviser provides investment management services to the Funds in accordance with their investment objectives, policies and restrictions. As compensation for the investment advisory services provided to the Funds, the Adviser will receive a monthly management fee equal to an annual rate of each Fund’s net assets for Class A and I shares as follows:
Fund | | Management Fee Rate | | Accrued | |
| Focused Value Fund: | | | 0.90 | % | | $ | 1,029 | |
| Hedged Equity Fund | | | 1.00 | % | | | 2,223 | |
| Market Plus Fund | | | 0.50 | % | | | 569 | |
| Inflation Advantaged Equities Fund | | | 1.00 | % | | | 1,104 | |
| Dividend Plus Fund | | | 0.75 | % | | | 843 | |
| Mid Cap Value Fund | | | 0.75 | % | | | 853 | |
The Adviser and the Funds have entered into an Expense Limitation Agreement (“Expense Agreements”) under which the Adviser has agreed to waive or reduce its fees and to assume other expenses of each Fund, if necessary, in an amount that limits annual operating expenses (exclusive of interest, taxes, brokerage fees and commissions, acquired fund fees and expenses, shareholder servicing fees, extraordinary expenses, dividend and interest expenses in connection with securities sold short and payments, if any, under the Rule 12b-1 Plan) to not more than the following average daily net assets of each of the Funds through April 30, 2014:
Fund | | Expense Limitation | | Management Fees Waived | | | Expenses Reimbursed | |
| Focused Value Fund: | | | 1.15 | % | | $ | 1,029 | | | $ | 21,112 | |
| Hedged Equity Fund | | | 1.25 | % | | | 2,223 | | | | 19,954 | |
| Market Plus Fund | | | 0.75 | % | | | 569 | | | | 22,804 | |
| Inflation Advantaged Equities Fund | | | 1.25 | % | | | 1,104 | | | | 21,414 | |
| Dividend Plus Fund | | | 1.00 | % | | | 843 | | | | 21,965 | |
| Mid Cap Value Fund | | | 1.00 | % | | | 853 | | | | 21,808 | |
If, at any time, the annualized expenses of Funds were less than the annualized expense ratios, the Trust, on behalf of Funds, would reimburse the Adviser for any fees previously waived and/or expenses previously assumed; provided, however, that repayment would be payable only to the extent that it (a) can be made during the three (3) years following the time at which the adviser waived fees or assumed expenses for the Funds, and (b) can be repaid without causing the expenses of Funds to exceed the annualized expense ratios.
At August 31, 2013, the cumulative unreimbursed amount paid and/or waived by the Adviser on behalf of the Funds that may be recouped no later than the dates stated below:
| Fund | | February 28, 2017 | | | Totals | |
| Focused Value Fund: | | $ | 22,141 | | | $ | 22,141 | |
| Hedged Equity Fund | | | 22,177 | | | | 22,177 | |
| Market Plus Fund | | | 23,373 | | | | 23,373 | |
| Inflation Advantaged Equities Fund | | | 22,518 | | | | 22,518 | |
| Dividend Plus Fund | | | 22,808 | | | | 22,808 | |
| Mid Cap Value Fund | | | 22,661 | | | | 22,661 | |
| Snow Family of Funds | SEMI-ANNUAL REPORT |
NOTES TO THE FINANCIAL STATEMENTS
August 31, 2013 (Unaudited)
| 4. | ADVISORY FEES AND OTHER RELATED PARTY TRANSACTIONS (continued) |
The Fund has entered into an Investment Company Services Agreement (the “Services Agreement”) with M3Sixty Administration, LLC (“M3Sixty”). Pursuant to the Services Agreement, M3Sixty will provide day-to-day operational services to the Fund including, but not limited to: (a) Fund accounting services; (b) financial statement preparation; (c) valuation of the Fund's portfolio securities; (d) pricing the Fund's shares; (e) assistance in preparing tax returns; (f) preparation and filing of required regulatory reports; (g) communications with shareholders; (h) coordination of Board and shareholder meetings; (i) monitoring the Fund's legal compliance; (j) maintaining shareholder account records.
Under the Services Agreement, the Trust, on behalf of the Funds, pays M3Sixty servicing fees as described below plus reimbursement of out of pocket expenses for each Fund:
| Fund Accounting | $5,000 annually, plus $1,500 for the second and each additional share class |
| Fund Administration | $5,000 annually, plus $1,500 for the second and each additional share class |
| Transfer Agency | $5,000 annually, plus $1,500 for the second and each additional share class |
| Fund Asset Based Fees (annualized) | 0.15% on daily net assets between $0 and $200 million; 0.10% on the next $200 million of daily net assets; 0.05% on the next $200 million of daily net assets; and 0.025% in excess of $600 million of daily net assets |
If the above fees, aggregated across all of the Funds (the “Complex”), are not at least $40,000 on an annual basis, a Complex minimum fee of $40,000 per year will apply.
For the period from inception of March 28, 2013 through August 31, 2013, the Funds accrued servicing fees as follows:
| Fund | | Service Fees | |
| Focused Value Fund: | | $ | 12,533 | |
| Hedged Equity Fund | | | 12,691 | |
| Market Plus Fund | | | 12,532 | |
| Inflation Advantaged Equities Fund | | | 12,527 | |
| Dividend Plus Fund | | | 12,530 | |
| Mid Cap Value Fund | | | 12,532 | |
Certain officers of the Funds are also employees of M3Sixty.
The Fund has entered into a Distribution Agreement (the “Distribution Agreement”) with Matrix Capital Group, Inc. (the “Distributor”). Pursuant to the Distribution Agreement, the Distributor will provide distribution services to the Funds. The Distributor serves as underwriter/distributor of the Funds. Under the Distribution Agreement, for each Fund, the Distributor shall be paid an annual fee of $9,000 (provided, however, that for so long as a Fund is in the incubation stage, the annual fee shall be $4,500). The annual fee above includes the first share class of a Fund; the Distributor shall receive $1,500 annually for each additional class. The Distributor shall also receive an annualized amount equal to 0.75 bps (0.0075%) of the average assets of each Fund.
An officer of the Distributor is also an officer of M3Sixty.
The Funds have adopted a Distribution Plan (“Plan”) pursuant to Rule 12b-1 of the 1940 Act for the Funds. The Funds may expend up to 0.25% for Class A shares of a Fund’s average daily net assets annually to pay for any activity primarily intended to result in the sale of shares of the Funds and the servicing of shareholder accounts, provided that the Trustees have approved the category of expenses for which payment is being made.
| Snow Family of Funds | SEMI-ANNUAL REPORT |
NOTES TO THE FINANCIAL STATEMENTS
August 31, 2013 (Unaudited)
| 4. | ADVISORY FEES AND OTHER RELATED PARTY TRANSACTIONS (continued) |
The distribution plans for the Class A shares of the Funds took effect March 28, 2013. For the period from inception of March 28, 2013 through August 31, 2013, the Funds accrued 12b-1 expenses attributable to Class A shares as follows:
| Fund | | Class A 12b-1 Fees | |
| Focused Value Fund: | | $ | 11 | |
| Hedged Equity Fund | | | 11 | |
| Market Plus Fund | | | 11 | |
| Inflation Advantaged Equities Fund | | | 11 | |
| Dividend Plus Fund | | | 11 | |
| Mid Cap Value Fund | | | 11 | |
There were no distributions paid during the period since inception of March 28, 2013 through August 31, 2013 for the Funds.
For U.S. Federal income tax purposes, the cost of securities owned, gross appreciation, gross depreciation, and net unrealized appreciation/(depreciation) of investments at August 31, 2013 were as follows:
Fund | | Tax Cost | | | Gross Unrealized Appreciation | | | Gross Unrealized Depreciation | | | Net Unrealized Appreciation | |
| Focused Value Fund: | | | 258,381 | | | | 22,295 | | | | (4,187 | ) | | | 18,108 | |
| Hedged Equity Fund | | | 347,555 | | | | 21,486 | | | | (15,649 | ) | | | 5,837 | |
| Market Plus Fund | | | 258,777 | | | | 18,184 | | | | (3,976 | ) | | | 14,208 | |
| Inflation Advantaged Equities Fund | | | 258,403 | | | | 12,827 | | | | (9,206 | ) | | | 3,621 | |
| Dividend Plus Fund | | | 261,980 | | | | 15,875 | | | | (9,640 | ) | | | 6,235 | |
| Mid Cap Value Fund | | | 259,103 | | | | 21,029 | | | | (4,029 | ) | | | 17,000 | |
The difference between book basis unrealized appreciation and tax-basis unrealized appreciation for the Hedged Equity Fund is attributable primarily to the tax deferral of losses on wash sales.
The Funds’ tax basis distributable earnings are determined only at the end of each fiscal year.
The beneficial ownership, either directly or indirectly, of more than 25% of the voting securities of a fund creates a presumption of control of the fund, under Section 2(a)(9) of the Investment Company Act of 1940. As of August 31, 2013, Snow Capital Management, L.P. held 100% of the Funds’ Class A & Class I shares outstanding.
| 7. | COMMITMENTS AND CONTINGENCIES |
In the normal course of business, the Trust may enter into contracts that may contain a variety of representations and warranties and provide general indemnifications. The Trust’s maximum exposure under these arrangements is dependent on future claims that may be made against the Fund and, therefore, cannot be estimated; however, management considers the risk of loss from such claims to be remote.
| Snow Family of Funds | SEMI-ANNUAL REPORT |
NOTES TO THE FINANCIAL STATEMENTS
August 31, 2013 (Unaudited)
In accordance with GAAP, Management has evaluated the impact of all subsequent events on the Fund through the date the financial statements were issued, and has determined that there were no subsequent events requiring recognition or disclosure in the financial statements.
| 9. | RECENT ACCOUNTING PRONOUNCEMENTS |
In December 2011, FASB issued ASU No. 2011-11 related to disclosures about offsetting assets and liabilities. The amendments in this ASU require an entity to disclose information about offsetting and related arrangements to enable users of its financial statements to understand the effect of those arrangements on its financial position.
In January 2013, the Financial Accounting Standards Board issued ASU No. 2013-01 “Clarifying the Scope of Disclosures about Offsetting Assets and Liabilities (“ASU 2013-01”) which amended ASC Subtopic 210-20, Balance Sheet Offsetting. ASU 2013-01 clarified the scope of ASU No. 2011-11 “Disclosures about Offsetting Assets and Liabilities (“ASU 2011-11”). ASU 2011-11 requires an entity to disclose information about offsetting and related arrangements to enable users of that entity’s financial statements to understand the effect of those arrangements on its financial position. ASU 2013-01 clarifies the scope of ASU 2011-11 as applying to derivatives accounted for in accordance with Topic 815, Derivatives and Hedging, including bifurcated embedded derivatives, repurchase agreements and reverse repurchase agreements, and securities borrowing and securities lending transactions that are offset either in accordance with other requirements of GAAP or subject to an enforceable master netting arrangement or similar agreement. The guidance in ASU 2013-01 and ASU 2011-11 is effective for interim and annual periods beginning on or after January 1, 2013. Management is evaluating any impact ASU 2013-01 and ASU 2011-11 may have on the Fund’s financial statements.
In June 2013, the FASB issued ASU 2013-08, Financial Services Investment Companies, which updates the scope, measurement, and disclosure requirements for U.S. GAAP including identifying characteristics of an investment company, measurement of ownership in other investment companies and requires additional disclosures regarding investment company status and following guidance in Topic 946 of the FASB Accounting Standards Codification (“FASC”). The ASU is effective for interim and annual reporting periods that begin after December 15, 2013. Management is currently evaluating the impact that these pronouncements may have on the Fund’s financial statements.
| Snow Family of Funds | SEMI-ANNUAL REPORT |
ADDITIONAL INFORMATION
August 31, 2013 (Unaudited)
The Funds file their complete schedules of portfolio holdings with the Securities and Exchange Commission (the “Commission”) for the first and third quarters of each fiscal year on Form N-Q. The Funds’ Forms N-Q are available on the Commission’s website at http://www.sec.gov. The Funds’ Forms N-Q may be reviewed and copied at the Commission’s Public Reference Room in Washington, DC. Information on the operation of the Commission’s Public Reference Room may be obtained by calling 1-800-SEC-0330.
A description of the policies and procedures that the Funds use to determine how to vote proxies relating to portfolio securities is available without charge, upon request, by calling 1-877-244-6235; and on the Commission’s website at http://www.sec.gov.
Information regarding how the Funds voted proxies relating to portfolio securities during the most recent 12-month period ended June 30th is available without charge, upon request, by calling 1-877-244-6235; and on the Commission’s website at http://www.sec.gov.
Shareholder Tax Information - The Funds are required to advise you within 60 days of the Fund’s fiscal year end regarding the federal tax status of distributions received by shareholders during the fiscal year. The Funds did not pay any distributions during the period since inception of March 28, 2013 through August 31, 2013.
Tax information is reported from the Funds’ fiscal year and not calendar year, therefore, shareholders should refer to their Form 1099-DIV or other tax information which will be mailed in 2014 to determine the calendar year amounts to be included on their 2013 tax returns. Shareholders should consult their own tax advisors.
TRUSTEES AND OFFICERS INFORMATION (Unaudited)
Remuneration Paid to Trustees and Officers - Officers of the Trust and Trustees who are “interested persons” of the Trust or the Adviser will receive no salary or fees from the Trust. Each Trustee who is not an “interested person” receives a fee of $500 each year plus $100 per Board or committee meeting attended per Fund, provided, that the Fund is in the incubation stage. The Trust reimburses each Trustee and officer for their travel and other expenses relating to attendance at such meetings.
Name of Trustee1 | Aggregate Compensation From the Snow Family Funds2 | Pension or Retirement Benefits Accrued As Part of Portfolio Expenses | Estimated Annual Benefits Upon Retirement | Total Compensation From the Snow Family Funds Paid to Trustees2 |
| Independent Directors |
| Art Falk | $1,350 | None | None | $1,350 |
| Thomas Krausz | $1,350 | None | None | $1,350 |
| Tom M. Wirtshafter | $1,350 | None | None | $1,350 |
| Interested Trustees |
| Randall K. Linscott | None | None | None | None |
| 1 | Each of the Trustees serves as a Trustee to six (6) Snow Family of Funds of the Trust. The Trust currently offers eight (8) series of shares. |
| 2 | Figures are for the period since inception of March 28, 2013 through August 31, 2013. Each of the Funds paid each Trustee $225 for the period. |
| Snow Family of Funds | SEMI-ANNUAL REPORT |
Information About Your Fund’s Expenses - (Unaudited)
As a shareholder of the Fund, you incur two types of costs: (1) transaction costs, such as the redemption fee imposed by the Fund for certain short-term redemptions; and (2) ongoing costs, including management fees, distribution and/or service (12b-1) fees; and other Fund expenses. The example below is intended to help you understand your ongoing costs (in dollars) of investing in the Fund and to compare these costs with the ongoing costs of investing in other mutual funds.
The example is based on an investment of $1,000 invested at the beginning of the period and held for the entire period as indicated below.
Actual Expenses
The first section of the table provides information about actual account values and actual expenses (relating to the example $1,000 investment made on 03/28/13). You may use the information in this section, together with the amount you invested, to estimate the expenses that you paid over the period. Simply divide your account value by $1,000 (for example, an $8,600 account value divided by $1,000 = 8.6), then multiply the result by the number in the first section under the heading entitled “Expenses Paid During Period” to estimate the expenses you paid on your account during this period.
Hypothetical Example for Comparison Purposes
The second section of the table provides information about the hypothetical account values and hypothetical expenses based on the Fund’s actual expense ratio and an assumed rate of return of 5% per year before expenses, which is not the Fund’s actual return. The hypothetical account values and expenses may not be used to estimate the actual ending account balance or expenses you paid for the period. You may use this information to compare the ongoing costs of investing in the Fund to other funds. To do so, compare this 5% hypothetical example with the 5% hypothetical examples that appear in the shareholder reports of the other funds.
Please note that the expenses shown in the table are meant to highlight your ongoing costs only and do not reflect any transactional costs, such as sales charges (loads), redemption fees, or exchange fees. Therefore, the second section of the table is useful in comparing ongoing costs only, and will not help you determine the relative total costs of owning different funds. In addition, if these transactional costs were included, your costs would have been higher. For more information on transactional costs, please refer to the Fund’s prospectus.
Expenses and Value of a $1,000 Investment for the period since inception of 03/28/13 through 08/31/13 |
Focused Value Fund: | | Beginning Account Value (03/28/2013) | | | Annualized Expense Ratio for the Period | | Ending Account Value (08/31/2013) | | | Expenses Paid During Period | |
| Actual Fund Return (in parentheses) | | | | | | | | | | |
| Class A (+8.75%) | | $ | 1,000.00 | | | | 1.40 | % | | $ | 1,.087.00 | | | $ | 6.28 | (a) |
| Class I (+8.85%) | | $ | 1,000.00 | | | | 1.15 | % | | $ | 1,088.50 | | | $ | 5.17 | (a) |
| Hypothetical 5% Fund Return | | | | | | | | | | | | | |
| Class A | | $ | 1,000.00 | | | | 1.40 | % | | $ | 1,018.10 | | | $ | 7.12 | (b) |
| Class I | | $ | 1,000.00 | | | | 1.15 | % | | $ | 1,019.40 | | | $ | 5.85 | (b) |
| | | | | | | | | | | | | | | | | |
| Hedged Equity Fund: | | | | | | | | | | | | | | | | |
| Actual Fund Return (in parentheses) | | | | | | | | | | | | | |
| Class A (+3.90%) | | $ | 1,000.00 | | | | 1.94 | % | | $ | 1,039.00 | | | $ | 8.51 | (a) |
| Class I (+4.00%) | | $ | 1,000.00 | | | | 1.69 | % | | $ | 1,040.00 | | | $ | 7.41 | (a) |
| Hypothetical 5% Fund Return | | | | | | | | | | | | | |
| Class A | | $ | 1,000.00 | | | | 1.94 | % | | $ | 1,015.40 | | | $ | 9.86 | (b) |
| Class I | | $ | 1,000.00 | | | | 1.69 | % | | $ | 1,016.70 | | | $ | 8.59 | (b) |
| Snow Family of Funds | SEMI-ANNUAL REPORT |
Information About Your Fund’s Expenses - (Unaudited)(continued)
Market Plus Fund: | | Beginning Account Value (03/28/2013) | | | Annualized Expense Ratio for the Period | | Ending Account Value (08/31/2013) | | | Expenses Paid During Period | |
| Actual Fund Return (in parentheses) | | | | | | | | | | |
| Class A (+7.35%) | | $ | 1,000.00 | | | | 1.00 | % | | $ | 1,.073.50 | | | $ | 4.46 | (a) |
| (1)Class I (+7.50%) | | $ | 1,000.00 | | | | 0.75 | % | | $ | 1,075.00 | | | $ | 3.35 | (a) |
| Hypothetical 5% Fund Return | | | | | | | | | | | | | |
| Class A | | $ | 1,000.00 | | | | 1.00 | % | | $ | 1,020.20 | | | $ | 5.09 | (b) |
| Class I | | $ | 1,000.00 | | | | 0.75 | % | | $ | 1,021.40 | | | $ | 3.82 | (b) |
| | | | | | | | | | |
| Inflation Advantaged Equities Fund: | | | | | | | | | |
| Actual Fund Return (in parentheses) | | | | | | | | | | | | | |
| Class A (+2.90%) | | $ | 1,000.00 | | | | 1.50 | % | | $ | 1,029.00 | | | $ | 6.55 | (a) |
| Class I (+3.00%) | | $ | 1,000.00 | | | | 1.25 | % | | $ | 1,030.00 | | | $ | 5.46 | (a) |
| Hypothetical 5% Fund Return | | | | | | | | | | | | | |
| Class A | | $ | 1,000.00 | | | | 1.50 | % | | $ | 1,017.60 | | | $ | 7.36 | (b) |
| Class I | | $ | 1,000.00 | | | | 1.25 | % | | $ | 1,018.90 | | | $ | 6.36 | (b) |
| | | | | | | | | | | | | | | | | |
| Dividend Plus Fund: | | | | | | | | | | | | | | | | |
| Actual Fund Return (in parentheses) | | | | | | | | | | | | | |
| Class A (+5.40%) | | $ | 1,000.00 | | | | 1.25 | % | | $ | 1,054.00 | | | $ | 5.52 | (a) |
| Class I (+5.50%) | | $ | 1,000.00 | | | | 1.00 | % | | $ | 1,055.00 | | | $ | 4.42 | (a) |
| Hypothetical 5% Fund Return | | | | | | | | | | | | | |
| Class A | | $ | 1,000.00 | | | | 1.25 | % | | $ | 1,018.90 | | | $ | 6.36 | (b) |
| Class I | | $ | 1,000.00 | | | | 1.00 | % | | $ | 1,020.20 | | | $ | 5.09 | (b) |
| | | | | | | | | | | | | | | | | |
| Mid Cap Value Fund: | | | | | | | | | | | | | | | | |
| Actual Fund Return (in parentheses) | | | | | | | | | | | | | |
| Class A (+8.35%) | | $ | 1,000.00 | | | | 1.25 | % | | $ | 1,083.50 | | | $ | 5.60 | (a) |
| Class I (+8.45%) | | $ | 1,000.00 | | | | 1.00 | % | | $ | 1,084.50 | | | $ | 4.48 | (a) |
| Hypothetical 5% Fund Return | | | | | | | | | | | | | |
| Class A | | $ | 1,000.00 | | | | 1.25 | % | | $ | 1,018.90 | | | $ | 6.36 | (b) |
| Class I | | $ | 1,000.00 | | | | 1.00 | % | | $ | 1,020.20 | | | $ | 5.09 | (b) |
| (a) | Expenses are equal to the Funds’ annualized expense ratios, multiplied by the average account value over the period, multiplied by 157/365 to reflect the period from 03/28/13 through 08/31/13. |
| (b) | Expenses are equal to the Funds’ annualized expense ratios, multiplied by the average account value over the period, multiplied by 184/365 to reflect the one-half year period. |
For more information on Fund expenses, please refer to the Fund’s prospectus, which can be obtained from your investment representative or by calling 1-877-244-6235. Please read it carefully before you invest or send money.
| Snow Family of Funds | SEMI-ANNUAL REPORT |
Information About Your Fund’s Expenses - (Unaudited)(continued)
| Total Fund operating expense ratios as stated in the current Fund prospectus dated March 28, 2013 for the Funds were as follows: |
| Focused Value Fund Class A, gross of fee waivers or expense reimbursements | 15.28% |
Focused Value Fund Class A, after waiver and reimbursement* | 1.40% |
| Focused Value Fund Class I, gross of fee waivers or expense reimbursements | 15.03% |
Focused Value Fund Class I, after waiver and reimbursement* | 1.15% |
| Hedged Equity Fund Class A, gross of fee waivers or expense reimbursements | 8.39% |
Hedged Equity Fund Class A, after waiver and reimbursement* | 1.50% |
| Hedged Equity Fund Class I, gross of fee waivers or expense reimbursements | 8.14% |
Hedged Equity Fund I, after waiver and reimbursement* | 1.25% |
| Market Plus Fund Class A, gross of fee waivers or expense reimbursements | 14.88% |
Market Plus Fund Class A, after waiver and reimbursement* | 1.00% |
| Market Plus Fund Class I, gross of fee waivers or expense reimbursements | 14.63% |
Market Plus Fund Class I, after waiver and reimbursement* | 0.75% |
Inflation Advantaged Equities Fund Class A, gross of fee waivers or expense reimbursements | 15.38% |
Inflation Advantaged Equities Fund Class A, after waiver and reimbursement* | 1.50% |
Inflation Advantaged Equities Fund Class I, gross of fee waivers or expense reimbursements | 15.13% |
Inflation Advantaged Equities Fund Class I, after waiver and reimbursement* | 1.25% |
| Dividend Plus Fund Class A, gross of fee waivers or expense reimbursements | 15.13% |
Dividend Plus Fund Class A, after waiver and reimbursement* | 1.25% |
| Dividend Plus Fund Class I, gross of fee waivers or expense reimbursements | 14.88% |
Dividend Plus Fund Class I, after waiver and reimbursement* | 1.00% |
| Mid Cap Value Fund Class A, gross of fee waivers or expense reimbursements | 15.13% |
Mid Cap Value Fund Class A, after waiver and reimbursement* | 1.25% |
| Mid Cap Value Fund Class I, gross of fee waivers or expense reimbursements | 14.88% |
Mid Cap Value Fund Class I, after waiver and reimbursement* | 1.00% |
| | |
* Snow Capital Management L.P. (the “Adviser”) has entered into an Expense Limitation Agreement with the Funds under which it has agreed to waive or reduce its fees and to assume other expenses of the Funds, if necessary, in an amount that limits the Funds’ annual operating expenses (exclusive of interest, taxes, brokerage fees and commissions, acquired funds fees and expenses, extraordinary expenses, dividend and interest expenses related to short investments, and payments, if any, under the Rule 12b-1 Plan) to not more than 1.15, 1.25%, 0.75%, 1.25%, 1.00% and 1.00% for the Focused Value Fund, Hedged Equity Fund, Market Plus Fund, Inflation Advantaged Equities Fund, Dividend Plus Fund and Mid Cap Value Fund, respectively through at least April 30, 2014. Subject to approval by the Funds’ Board, any waiver under the Expense Limitation Agreement is subject to repayment by the Funds within the three fiscal years following the year in which such waiver occurred, if the Funds are able to make the payment without exceeding the expense limitation in effect at that time. The current contractual agreement cannot be terminated prior to at least one year after the effective date without the Board of Trustees’ approval. Please see the Information About Your Fund’s Expenses, the Financial Highlights and Notes to Financial Statements (Note 4) sections of this report for gross and net expense related disclosures during the period since inception of March 28, 2013 through August 31, 2013. |
| Snow Family of Funds | SEMI-ANNUAL REPORT |
BOARD APPROVAL OF THE INVESTMENT ADVISORY AGREEMENT BY AND BETWEEN THE TRUST AND SNOW CAPITAL MANAGEMENT L.P.
On December 19, 2012, the Board of Trustees (the “Board” or the “Trustees”) of the 360 Funds (the “Trust”), comprised entirely of Trustees who are not “interested persons” of the Trust, as that term is defined by Section 2(a)(19) of the Investment Company Act of 1940 (the “Independent Trustees”), met in person to review and discuss approving the Investment Advisory Agreement between the Trust and Snow Capital Management L.P. (the “Adviser”) with respect to the Snow Capital Focused Value Fund, the Snow Capital Hedged Equity Fund, the Snow Capital Market Plus Fund, the Snow Capital Inflation Advantaged Equities Fund, the Snow Capital Dividend Plus Fund and the Snow Capital Mid Cap Value Fund (the “Funds”).
With the assistance and advice of independent counsel, the Trustees had requested and received information prior to the meeting that they deemed relevant or necessary to consider in the approval process. In addition, they received a memorandum from independent counsel discussing, among other things, the fiduciary duties and responsibilities of the Board in reviewing and considering approval. The Trustees reviewed and discussed the foregoing information during a private session with their counsel and during the Board meeting. Counsel also reviewed with the Trustees the types of information and factors that they should and should not take into consideration in making their decision about approval. Throughout the process the Trustees had the opportunity to ask questions, and answers to their questions were considered along with the other materials provided.
In assessing various factors in regard to approval, the Board took into consideration information prepared for the approval meeting, such as: (i) reports regarding the services and support to be provided to the Funds and their shareholders by the Adviser; (ii) presentations by the Funds’ portfolio managers addressing the Adviser’s investment philosophy, investment strategy and operations; (iii) compliance reports and background concerning the Funds and the Adviser; (iv) proposed disclosure information to be contained in the registration statement of the Trust and the Form ADV of the Adviser; (v) information on relevant developments in the mutual fund industry and how the Funds and the Adviser proposed to respond to them; (vi) financial information about the Adviser; (vii) a description of the personnel at the Adviser involved with the Funds, their background, professional skills and accomplishments; (viii) information on investment advice, performance, summaries of proposed fund expenses, compliance program, current legal matters, and other general information about the Adviser; (ix) comparative expense and performance information for other mutual funds that are similar to the Funds; (x) where available, information about performance and fees relative to other accounts managed by the Adviser that might be considered comparable to the Funds in terms of investment style; and (xi) any soft-dollar or other “fall-out” or similar benefits to be realized by the Adviser from its relationship with the Funds.
The Board did not identify any particular factor or information that was most relevant to its consideration to approve the Investment Advisory Agreement and each Trustee may have afforded different weight to the various factors considered. Following is a summary of the Board’s consideration of various factors:
The Nature, Extent, and Quality of the Services Provided by the Adviser.
The Trustees considered various aspects of the nature, extent and quality of the services to be provided by the Adviser to the Funds. They considered the following, without limitation: the quality of the investment advisory services (including research and recommendations with respect to portfolio securities), to be provided; the background, experience and professional ability and skill of the portfolio management personnel assigned to the Funds, noting the commitment to hire and retain qualified personnel to work on behalf of the Funds and their shareholders; the processes used for formulating investment recommendations and assuring compliance with each Fund’s investment objectives and limitations, as well as for assuring compliance with regulatory requirements, specifically noting that the Adviser had not reported any material compliance matter over the last year; the manner in which the Adviser seeks to satisfy their obligation to assure “best execution” in connection with securities transactions placed for the Funds, noting the Adviser’s policies and procedures on trading and brokerage, as well as expected average brokerage commissions paid; the investment strategies and sources of information upon which the
| Snow Family of Funds | SEMI-ANNUAL REPORT |
BOARD APPROVAL OF THE INVESTMENT ADVISORY AGREEMENT BY AND BETWEEN THE TRUST AND SNOW CAPITAL MANAGEMENT L.P. (Continued)
Adviser expects to rely in making investment decisions for the Funds; where applicable, the fees charged to and the performance of other accounts managed by the Adviser similar to the Funds; the oversight of the Funds’ portfolios by the Adviser; the Adviser’s succession plans and business continuity plans; and the coordination of services for the Funds among the service providers, Trust management and the Trustees.
After reviewing and considering the foregoing information and further information in the materials provided by the Adviser (including its Form ADV), the Board concluded, in light of all the facts and circumstances, that the expected nature, extent and quality of the services to be provided by the Adviser were satisfactory and adequate for the respective Funds.
The Costs of the Services to be provided and Profits Expected to be realized by the Adviser from its Relationships with the Funds.
In considering these factors, the Trustees took into consideration the overall expenses of each Fund, including the nature and frequency of advisory fee payments, the expected asset levels of each Fund and the gross and net expenses of the Funds as compared to gross and net expenses of a group of funds that may be considered similar, noting that the expenses of each of the Funds was within the range of expenses incurred by the other funds in its group. The Trustees also took into consideration the information provided about the financial condition and profitability of the Adviser and the level of commitment to the Funds by the principals of the Adviser to their roles for the Funds.
The Trustees also considered the fees charged by the Adviser to comparable accounts – such as institutional accounts -- they manage in a similar style and noted that, typically, the fees charged to the Funds were similar to fees charged to other accounts managed by the Adviser. The Trustees used this information as a potential gauge for what fees might be considered reasonable for similar investment services, although they also considered that accounts identified as similar for this purpose may also have material differences that impact their overall comparability, such as differences in the range of the investor base served by the account; the average account size; the customization of fees, services and reporting available; the daily liquidity, redemptions and turnover that might occur in a mutual fund that might not be the case in other accounts; the regulatory requirements applicable to a fund that do not apply to many non-fund accounts; and the Board oversight applicable to funds that does not apply to most other types of accounts; to name a few. The Trustees took into consideration these potential differences when assessing both performance and fee information with respect to comparable accounts.
After further consideration of these elements, the Board concluded, in light of all the facts and circumstances, that the costs of the services provided to the Funds and the profits expected to be realized by the Adviser from its relationship with the Funds were satisfactory.
Other Benefits Derived by the Adviser from its Relationships with the Funds and Conflicts of Interest.
The Trustees also considered other benefits that the Adviser could derive from their relationship with the Funds (sometimes referred to as “fall-out” benefits) and conflicts of interest. In particular, the Trustees considered that the Adviser may use “soft dollars,” or Fund commissions, to obtain research, and noted in addition to the amount of soft dollars reported that (i) Adviser reports it would select broker-dealers on the basis of best execution, even though some of the broker-dealers it selects also provide research, (ii) the Adviser reports it would only use “soft dollars” within the Section 28(e) safe harbor, which requires the Adviser to determine that the commissions paid were reasonable in relation to the value of the research received, and (iii) the Adviser would use the research received to implement its investment strategy generally, which benefits the Funds as well as the Adviser’s other accounts.
| Snow Family of Funds | SEMI-ANNUAL REPORT |
BOARD APPROVAL OF THE INVESTMENT ADVISORY AGREEMENT BY AND BETWEEN THE TRUST AND SNOW CAPITAL MANAGEMENT L.P. (Continued)
After reviewing and considering the foregoing information and other information they deemed relevant with regard to these matters, the Board concluded, in light of all the facts and circumstances, that the other benefits derived by the Adviser from its relationships with the Funds were satisfactory.
Economies of Scale.
The Trustees also considered the extent to which economies of scale would be realized if the Funds grow and whether the advisory fee levels reflect those economies of scale for the benefit of the Funds’ shareholders. In this regard, the Trustees considered the breakpoints in effect on the advisory fee schedule for each of the Funds at various asset levels, which are aimed at sharing with shareholders any economies of scale that are realized from Fund growth.
After considering these factors, the Board concluded, in light of all the facts and circumstances, that the fee levels and breakpoints were satisfactory and adequate to reflect economies of scale for the benefit of the Funds’ shareholders if the Funds grow.
Based on all of the information presented to the Board and its consideration of relevant factors, the Board, in the exercise of its reasonable business judgment, approved the Investment Advisory Agreement for the initial term, and determined that the compensation payable under each of the agreements was fair, reasonable and within a range of what could have been negotiated at arm’s-length in light of all the surrounding circumstances, including the services to be rendered and such other matters as the Board considered to be relevant.
360 FUNDS 4520 Main Street Suite 1425 Kansas City, MO 64111
INVESTMENT ADVISER Snow Capital Management, L.P. 2000 Georgetowne Drive Suite 200 Sewickley, PA 15143
ADMINISTRATOR & TRANSFER AGENT M3Sixty Administration, LLC 4520 Main Street Suite 1425 Kansas City, MO 64111
DISTRIBUTOR Matrix Capital Group, Inc. 242 East 72nd Street New York, NY 10021
INDEPENDENT REGISTERED PUBLIC ACCOUNTING FIRM Sanville & Company 1514 Old York Road Abington, PA 19001
LEGAL COUNSEL Graydon Head & Ritchey LLP 1900 Fifth Third Center 511 Walnut Street Cincinnati, OH 45202
CUSTODIAN BANK U.S. Bank, N.A 425 Walnut Street Cincinnati, OH 45202 |
| | Not applicable at this time. |
| ITEM 3. | AUDIT COMMITTEE FINANCIAL EXPERT. |
| | Not applicable at this time. |
| ITEM 4. | PRINCIPAL ACCOUNTANT FEES AND SERVICES. |
Not applicable at this time.
| ITEM 5. | AUDIT COMMITTEE OF LISTED REGISTRANTS. |
Not applicable
| ITEM 6. | SCHEDULE OF INVESTMENT |
Included in semi-annual report to shareholders filed under item 1 of this form.
| ITEM 7. | DISCLOSURE OF PROXY VOTING POLICIES AND PROCEDURES FOR CLOSED-END MANAGEMENT INVESTMENT COMPANIES. |
Not applicable Fund is an open-end management investment company
| ITEM 8. | PORTFOLIO MANAGERS OF CLOSED-END MANAGEMENT INVESTMENT COMPANIES |
Not applicable Fund is an open-end management investment company
| ITEM 9. | PURCHASES OF EQUITY SECURITIES BY CLOSED-END MANAGEMENT INVESTMENT COMPANY AND AFFILIATED PURCHASERS. |
Not applicable Fund is an open-end management investment company
| ITEM 10. | SUBMISSION OF MATTERS TO A VOTE OF SECURITY HOLDERS. |
Not applicable at this time.
| ITEM 11. | CONTROLS AND PROCEDURES. |
| | (a) | The registrant's principal executive and principal financial officers, or persons performing similar functions, have concluded that the registrant's disclosure controls and procedures (as defined in Rule 30a-3(c) under the 1940 Act, are effective, as of a date within 90 days of the filing date of this report, based on the evaluation of these controls and procedures required by Rule 30a-3(b) under the 1940 Act and Rule 15d-15(b) under the Securities Exchange Act of 1934, as amended. |
| | (b) | There were no changes in the registrant's internal control over financial reporting (as defined in Rule 30a-3(d) under the 1940 Act) that occurred during the period covered by this report that have materially affected, or are reasonably likely to materially affect, the registrant's internal control over financial reporting. |
| | (1) | Certifications pursuant to Section 302 of the Sarbanes-Oxley Act of 2002 are filed herewith. |
| | (2) | Certifications pursuant to Section 906 of the Sarbanes-Oxley Act of 2002 are filed herewith. |
SIGNATURES
Pursuant to the requirements of the Securities Exchange Act of 1934 and the Investment Company Act of 1940, the registrant has duly caused this report to be signed on its behalf by the undersigned, thereunto duly authorized.
360 Funds
| /s/ Randy Linscott | |
| By Randy Linscott | |
| President, |
| Date: November 7, 2013 | |
Pursuant to the requirements of the Securities Exchange Act of 1934 and the Investment Company Act of 1940, this report has been signed below by the following person on behalf of the registrant and in the capacities and on the date indicated.
| /s/ Randy Linscott | |
| By Randy Linscott | |
| President |
| |
Pursuant to the requirements of the Securities Exchange Act of 1934 and the Investment Company Act of 1940, this report has been signed below by the following person on behalf of the registrant and in the capacities and on the date indicated.
| /s/ Larry E. Beaver, Jr. | |
| By Larry E. Beaver, Jr. | |
| Treasurer |
| |