UNITED STATES
SECURITIES AND EXCHANGE COMMISSION
Washington, D.C. 20549
FORM N-CSR
CERTIFIED SHAREHOLDER REPORT OF REGISTERED
MANAGEMENT INVESTMENT COMPANIES
Investment Company Act File Number 811-21726
360 Funds
(Exact name of registrant as specified in charter)
| 4520 Main Street, Suite 1425 Kansas City, MO | 64111 |
| (Address of principal executive offices) | (Zip code) |
M3Sixty Administration, LLC
4520 Main Street
Suite 1425
Kansas City, MO 64111
(Name and address of agent for service)
Registrant's telephone number, including area code: 800-934-5550
Date of fiscal year end: 06/30/2017
Date of reporting period: 06/30/2017
| ITEM 1. | REPORTS TO SHAREHOLDERS |
The Annual report to Shareholders of the IMS Family of Funds, series of the 360 Funds (the “registrant”) for the year ended June 30, 2017 pursuant to Rule 30e-1 under the Investment Company Act of 1940 (the “1940 Act”), as amended (17 CFR 270.30e-1) is filed herewith.
| IMS Capital Value Fund IMS Strategic Income Fund IMS Dividend Growth Fund |
Annual Report
June 30, 2017
Fund Advisor:
IMS Capital Management, Inc.
8995 S.E. Otty Road
Portland, OR 97086
Toll Free (800) 934-5550
IMS CAPITAL VALUE FUND
MANAGEMENT’S DISCUSSION AND ANALYSIS
Annual Report
June 30, 2017
Dear Fellow Shareholders,
The U.S. Economy continued to chug along over the past year. An extremely divisive campaign process, a surprising election result and an incredibly tumultuous first six months of the Trump Presidency were not able to derail the stock market. In fact, several markets around the globe have been setting new highs recently. In general, markets have been very resilient. The positives are many including low interest rates, low unemployment, low inflation, low gas prices, strong consumer spending, high consumer confidence and surging corporate profits.
Despite the drama in Washington and lack of progress from the White House and Congress to pass new policy measures on healthcare or taxes, the markets continue to rally. One concern we have is that much of the investor zeal seems to be focused on the popular growth stocks that are already priced fairly high. The traditional, more conservative and reasonably-priced value stocks are being largely overlooked by the markets. While we are pleased that our value-focused IMS Capital Value Fund returned +11.76% over the past year, the growth-focused S&P 500 Index returned +17.90%. Over the first six months of 2017, the Fund gained 6.32% while the Index returned +9.34%. As a point of reference, during this same time period, the average diversified U.S. stock fund returned +6.91%.
While the value style of investing has outperformed the growth style of investing handily over time, there have always been periods where the reverse has been true. The disparity is currently historically large as illustrated by the 2017 YTD results as of June 30 for the Russell 1000 Value Index and the Russell 1000 Growth Index: the former is up +4.66% and the latter is up +13.99%. This disparity normally reverses itself over time, however, it sometimes takes a series of stock market declines to do so.
The Fund’s 50 holdings were diversified across all of the market’s major sectors. The three highest sector weightings in the Fund were consumer non-cyclicals 27.9%, consumer cyclicals 17.5% and financials 14.3%. The three lowest sector weightings were utilities 1.9%, energy 7.5% and industrial 8.0%. Approximately, 63% of the Fund is invested in large cap companies, while 33% is invested in mid cap companies with just 4% in small cap companies
During the past year, the best performer in the fund was Western Digital Corp. (WDC), the global leader in the hard disk drive market, which posted a one-year return of +83.37%. For fiscal 2017, the company reported net income of $397 million, or $1.34 per share, compared to fiscal 2016 net income of $242 million, or $1.00 per share. The company generated $3.4 billion in cash from operations during the 2017 fiscal year and returned $574 million in dividends to shareholders. Steve Milligan, chief executive officer stated that their unique platform of diverse storage technologies and value-added products helped drive performance as they addressed a broader set of markets following the SanDisk acquisition. The second best performer was IDEXX Laboratories, Inc. (IDXX), a manufacturer and distributor of products and services primarily for the companion animal veterinary, livestock and poultry, water testing and dairy markets. The stock returned +77.48% for the year due to double digit gains in its companion animal division. The company reported second quarter earnings of $85.4 million or 95 cents per share, ahead of estimates of 85 cents per share. The third best performer was Netflix (NFLX), the largest online video provider in the U.S., returning +73.9%. On July 17th, the company reported that they added 5.2 million new subscribers, beating expectations of 3.23 million. Customers were drawn to their large slate of original content that were released during the quarter.
1
Companies that detracted from the Fund’s performance over the last year included InVivo Therapeutics (NVIV), -72.22%. This early-stage, biomaterials company has an innovative, and so far, promising treatment for paralyzing spinal cord injuries. The company is focused on gaining FDA approval for their bioresorbable spinal implant product, yet they continue to have challenges and delays along the way. The second worst performing stock was Mattel (MAT) down 35.47%. The toymaker is known for Barbie, Hot Wheels, Fisher-Price, and American Girl. In the most recent quarter, Mattel's revenue increased to $974.5 million, up only 2% year over year, but higher selling and operating costs combined to quadruple the company's operating loss from the prior-year quarter and nearly triple its net loss to $56 million. Its new Chief Executive Officer (CEO) Margo Georgiadis announced plans to revive sales by slashing the company’s dividend in half to support its modernization into the digital age and expand into emerging markets. The third worst performer was auto part store, Autozone (AZO), down 33.68% due to Amazon taking away market share. The company has had a history of operational success, with an average return on capital of 29% a year for the past five years. Autozone’s customer base values service and instant access to much needed parts, which may insulate it from Amazon’s price competition.
We continue to look for undervalued, seasoned companies with positive business momentum that are diversified across strategically-chosen, opportunistic industries. We believe in buying strength on weakness, in other words, buying good strong companies when they are down, in industries that are well positioned for the long term. We thank you for continuing to invest alongside us in the IMS Capital Value Fund as we focus on building wealth wisely.
Sincerely,
Carl W. Marker
Portfolio Manager
IMS Capital Value Fund
2
INVESTMENT RESULTS – (Unaudited)
| Average Annual Total Returns (for periods ended June 30, 2017) | |||
| One Year | Five Year | Ten Year | |
| IMS Capital Value Fund* | 11.76% | 9.90% | 2.49% |
S&P 500® Index** | 17.90% | 14.61% | 7.17% |
| Total annual operating expenses, as disclosed in the Fund’s current prospectus dated October 28, 2016, were 1.69% of average daily net assets. The Advisor has contractually agreed to waive its management fee and/or reimburse expenses so that total annual fund operating expenses (excluding brokerage fees and commissions; borrowing costs, such as (a) interest and (b) dividend expenses on securities sold short; taxes; any indirect expenses such as acquired fund fees and expenses; and 12b-1 fees; and extraordinary litigation expenses) do not exceed 1.95% of the Fund’s average daily net assets through November 1, 2017, subject to the Advisor’s right to recoup payments on a rolling three-year basis so long as the payment would not exceed the 1.95% expense cap. This expense cap may not be terminated prior to November 1, 2017 except by the Board of Trustees of 360 Funds. |
The performance quoted represents past performance, which does not guarantee future results. The investment return and principal value of an investment will fluctuate so that an investor’s shares, when redeemed, may be worth more or less than their original cost. The returns shown do not reflect deduction of taxes that a shareholder would pay on Fund distributions or the redemption of Fund shares. Current performance of the Fund may be lower or higher than the performance quoted. The Fund’s investment objectives, risks, charges and expenses must be considered carefully before investing. Performance data current to the most recent month end may be obtained by calling Shareholder Services at 1-800-934-5550.
* | Return figures reflect any change in price per share and assume the reinvestment of all distributions. |
** | The S&P 500® Index is a widely recognized unmanaged index of equity prices and is representative of a broader market and range of securities than is found in the Fund’s portfolio. Individuals cannot invest directly in the Index; however, an individual can invest in exchange-traded funds or other investment vehicles that attempt to track the performance of a benchmark index. The annual total returns included for the above Fund are net of the total annual operating expenses for the Fund, while no annual operating expenses are deducted for S&P 500 Index. |
3
Comparison of the Growth of a $10,000 Investment in the IMS Capital Value Fund and the S&P 500® Index for the 10 Years Ended June 30, 2017 (Unaudited)
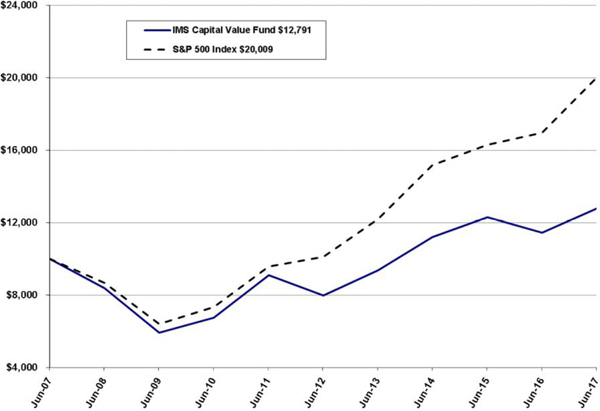
The chart above assumes an initial investment of $10,000 made on June 30, 2007 and held through June 30, 2017. The chart also assumes reinvestment of all dividends and distributions on the reinvestment dates during the period. THE FUND’S RETURN REPRESENTS PAST PERFORMANCE AND DOES NOT GUARANTEE FUTURE RESULTS. The returns shown do not reflect deduction of taxes that a shareholder would pay on Fund distributions or the redemption of Fund shares. Investment returns and principal values will fluctuate so that your shares, when redeemed, may be worth more or less than their original purchase price.
4
IMS STRATEGIC INCOME FUND
MANAGEMENT’S DISCUSSION AND ANALYSIS
Annual Report
June 30, 2017
Dear Fellow Shareholders,
The U.S. economy continues on one of its longest recovery cycles on record. Most economic measures are stronger than a year ago, and that has been reflected in both higher stock prices, and higher interest rates. Although more people are working and unemployment is historically low, inflation remains moderate near 2%. The Federal Reserve has been raising short-term rates slowly since December of 2015, 4 increases of 0.25% have pushed the Fed Funds target rate up to 1.25%. This minimal increase has had little to no negative effect on the real economy. U.S. Treasury Bonds in the most important maturities from 2-10 years, are up from 0.8 to 0.9% over the last year. This has been a negative headwind for investment grade bonds, but has been partially offset by the strong demand for corporate bonds in the market, reducing their yield premium above treasuries.
Much of the rest of the world is also in recovery mode, although at an earlier stage than the United States. But in Europe, Canada, Japan, and other countries, the monetary question is when their central banks will raise rates. In the big picture, major commodity prices are unchanged or higher than a year ago, at least in U.S. dollars. Measured against a basket of major currencies, the US dollar made an apparent peak at the end of 2016 following the election of President Trump, because of expectations for tax cuts, infrastructure spending, and much higher interest rates. So far these have not happened.
In this environment, bond returns were generally negative. The IMS Strategic Income Fund returned -2.62% during the past 6 months and -2.69% over the past 12 months ended June 30, 2017. The Barclay’s Aggregate Bond Index returned +2.27% and -0.31% over the same periods. The Barclay’s Index approximates the U.S. investment grade bond universe. It is roughly 1/3 US government bonds, 1/3 mortgage bonds, and 1/3 investment grade corporate debt. The IMS Strategic Income Fund has a much different composition. It began the fiscal year with 7% in U.S. stocks, 49% in U.S. and international high yield bonds, and 44% in investment grade bonds. About 31% of the fund was in energy-related bonds. The underperformance of the Fund was mostly from three defaulted and illiquid bonds. Two were in the energy sector (Performance Drilling and Thornton Drilling). The Fund was actively engaged to maximize recovery from the two drilling companies. The Performance position has been sold and the proceeds from sale of the Thornton Drilling assets should be distributed soon. The Fund’s performance has been negatively impacted by a series of small issue, high yield bonds over the past few years, many in the energy sector, that became distressed and in some cases defaulted. We have taken steps to liquidate these types of holdings in the Fund. By the next reporting period, we anticipate having less than 1% in the Fund and we are committed to avoiding this asset class entirely in the future.
5
Where do we see the most opportunity now? Our allocation to dividend stocks has increased to 31%. Considering the business cycle, U.S. dividend-paying stocks have the potential to outperform bonds, especially if we get a rising interest rate environment. The current “lower for longer” interest environment means that yields curves should remain positive, hence we continue to have much of our investment grade allocation in structured bonds that yield a higher coupon, and have a partial hedge on long-term rates going up. As of 6/30/17, the bond allocations are approximately 48% U.S.-domiciled investment grade bonds, 7% international investment grade bonds, 3% U.S. high yield bonds and 11% international high yield bonds.
The Fund has very little exposure to traditional investment grade bonds and no weighting in U.S. Treasury Bonds. Traditional investment-grade corporates and high yield bonds now have some of the lowest yields relative to risk-free rates, making positive returns after inflation more difficult. Our focus is on yield opportunities that will support a useful, monthly Fund dividend that is significantly greater than the rate of inflation.
The IMS Strategic Income Fund has paid a dividend every month for over 14 years. It continues to be a top priority. We continue to look for the best combination of current income, acceptable volatility, and appreciation potential. We thank you for investing alongside us in the IMS Strategic Income Fund.
Sincerely,
Carl W. Marker, Portfolio Manager, IMS Strategic Income Fund
6
INVESTMENT RESULTS – (Unaudited)
| Average Annual Total Returns | |||
| (for periods ended June 30, 2017) | |||
| One Year | Five Year | Ten Year | |
| IMS Strategic Income Fund* | (2.69)% | (5.35)% | (3.99)% |
| Barclays Capital Aggregate Bond Index** | (0.31)% | 2.21% | 4.47% |
| Total annual operating expenses, as disclosed in the Fund’s current prospectus dated October 28, 2016, were 2.25% of average daily net assets (1.98% after fee waivers/expense reimbursements by the Advisor). The Advisor has contractually agreed to waive its management fee and/or reimburse expenses so that total annual fund operating expenses (excluding brokerage fees and commissions; borrowing costs, such as (a) interest and (b) dividend expenses on securities sold short; taxes; any indirect expenses such as acquired fund fees and expenses; and 12b-1 fees; and extraordinary litigation expenses) do not exceed 1.95% of the Fund’s average daily net assets through November 1, 2017, subject to the Advisor’s right to recoup payments on a rolling three-year basis so long as the payment would not exceed the 1.95% expense cap. This expense cap may not be terminated prior to November 1, 2017 except by the Board of Trustees of 360 Funds. |
The performance quoted represents past performance, which does not guarantee future results. The investment return and principal value of an investment will fluctuate so that an investor’s shares, when redeemed, may be worth more or less than their original cost. The returns shown do not reflect deduction of taxes that a shareholder would pay on Fund distributions or the redemption of Fund shares. Current performance of the Fund may be lower or higher than the performance quoted. The Fund’s investment objectives, risks, charges and expenses must be considered carefully before investing. Performance data current to the most recent month end may be obtained by calling Shareholder Services at 1-800-934-5550.
| * | Return figures reflect any change in price per share and assume the reinvestment of all distributions. |
| ** | The Barclays Capital Aggregate Bond Index is a widely-used indicator of the bond market. The index is market capitalization-weighted and is made up of U.S. bonds that are primarily investment grade, which has a greater number of securities than is found in the Fund’s portfolio. Individuals cannot invest directly in the Index; however, an individual can invest in exchange-traded funds or other investment vehicles that attempt to track the performance of a benchmark index. The annual total returns included for the above Fund are net of the total annual operating expenses for the Fund, while no annual operating expenses are deducted for the Barclays Capital Aggregate Bond Index. |
7
Comparison of the Growth of a $10,000 Investment in the IMS Strategic Income Fund and the Barclays Captial Aggregate Bond Index for the 10 Years Ended June 30, 2017 (Unaudited)
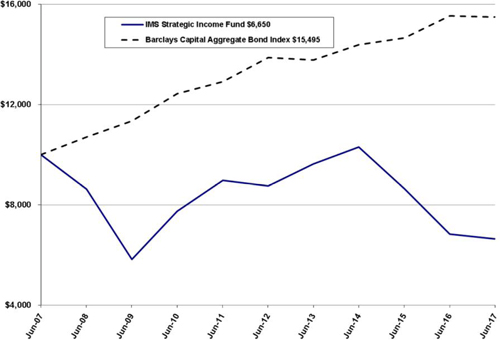
The chart above assumes an initial investment of $10,000 made on June 30, 2007 and held through June 30, 2017. The chart also assumes reinvestment of all dividends and distributions on the reinvestment dates during the period. THE FUND’S RETURN REPRESENTS PAST PERFORMANCE AND DOES NOT GUARANTEE FUTURE RESULTS. The returns shown do not reflect deduction of taxes that a shareholder would pay on Fund distributions or the redemption of Fund shares. Investment returns and principal values will fluctuate so that your shares, when redeemed, may be worth more or less than their original purchase price.
8
IMS DIVIDEND GROWTH FUND
MANAGEMENT’S DISCUSSION AND ANALYSIS
Annual Report
June 30, 2017
Dear Fellow Shareholders,
Equity markets surged in the year ending June 30, 2017, as a pickup in global economic activity helped lift expectations for corporate earnings growth in both the developed and emerging economies. U.S. economic data supports investors’ widespread optimism. Steady job growth in recent years has restored the labor force to near full employment, wage growth is ticking higher, and the Consumer Price Index ("CPI") remains benign. Investors have brushed off political gridlock in Washington, a lack of clarity regarding fiscal and foreign policy and the Fed's initial interest rate increases.
During the first half of fiscal 2017, the IMS Dividend Growth Fund (the “Fund”) performed well, beating the S&P 500 handily with a return of +10.23% vs. +7.82% for the six-month period ended December 31, 2016. Over the full one-year period ended June 30, 2017, the Fund returned 17.38% vs. the Index’s return of +17.90%. The S&P 500 is the Fund’s benchmark and is invested 100% in large U.S. stocks. The Fund is invested 7.5% in international stocks and 24.7% small and mid-cap stocks and remains committed to maintaining a value bias which has been out-of-favor over the last 12 months.
The S&P 500’s impressive 12-month return of +17.9% is almost twice the long-term average annual return. The US stock market’s impressive performance came as the so-called Trump reflation trade fizzled late in the fiscal year. Continental Europe delivered robust stock returns of 24.4%, shrugging off fears of heightened political risk and capitalizing on its attractive relative valuations.
The Fund’s best performers over the past year included Apple, the giant technology giant returned +53.5%, M&T Bank returning +39.7%, Microsoft returning +38.1% and CME Group returning +35.0%. We continue to see opportunity in large, predictable dividend paying businesses in areas like financial services, technology, and healthcare.
The Fund’s worst performers included Qualcomm (QCOM), which declined 21.4% as continued litigation regarding licensing fees with Apple creates revenue uncertainty. Twenty-First Century Fox (FOX), which has declined 21.1% over the last 12 months. The company’s slump can be attributed to several key films that have experienced higher marketing costs and lower box office results. Local ad softness at FOX’s TV stations, coupled with weaker national advertising has also adversely impacted results as well. Outfront Media (OUT) stock has returned -15.6% over the last year. OUT, similar to FOX is also experiencing a slowdown in both national and local advertising for their billboards and outdoor signage. We continue to think each of these businesses provides solid long-term return potential, but are experiencing difficult shorter-term operating environments.
9
We believe, reasonably valued dividend paying stocks will serve investors well over the long run.
We think the companies in the Fund have unique operating businesses, strong financial positioning, and opportunities for long-term future growth. These characteristics increase the likelihood that the companies in our Fund will continue to pay and increase dividends and appreciate over time. We thank you for investing alongside us in the IMS Dividend Growth Fund as we continue to focus on building wealth wisely.
Sincerely,
Carl W. Marker & Christopher L. Magaña
Co-Portfolio Managers
IMS Dividend Growth Fund
10
INVESTMENT RESULTS – (Unaudited)
Average Annual Total Returns (for periods ended June 30, 2017) | |||
| One Year | Five Year | Ten Year | |
| IMS Dividend Growth Fund* | 17.38% | 10.42% | 3.84% |
S&P 500® Index** | 17.90% | 14.61% | 7.17% |
| Total annual operating expenses, as disclosed in the Fund’s current prospectus dated October 28, 2016, were 2.37% of average daily net assets (1.96% after fee waivers/expense reimbursements by the Advisor). The Advisor has contractually agreed to waive its management fee and/or reimburse expenses so that total annual fund operating expenses (excluding brokerage fees and commissions; borrowing costs, such as (a) interest and (b) dividend expenses on securities sold short; taxes; any indirect expenses such as acquired fund fees and expenses; and 12b-1 fees; and extraordinary litigation expenses) do not exceed 1.95% of the Fund’s average daily net assets through November 1, 2017, subject to the Advisor’s right to recoup payments on a rolling three-year basis so long as the payment would not exceed the 1.95% expense cap. This expense cap may not be terminated prior to November 1, 2017 except by the Board of Trustees of 360 Funds. |
The performance quoted represents past performance, which does not guarantee future results. The investment return and principal value of an investment will fluctuate so that an investor’s shares, when redeemed, may be worth more or less than their original cost. The returns shown do not reflect deduction of taxes that a shareholder would pay on Fund distributions or the redemption of Fund shares. Current performance of the Fund may be lower or higher than the performance quoted. The Fund’s investment objectives, risks, charges and expenses must be considered carefully before investing. Performance data current to the most recent month end may be obtained by calling Shareholder Services at 1-800-934-5550.
| * | Return figures reflect any change in price per share and assume the reinvestment of all distributions. |
| ** | The S&P 500® Index is a widely recognized unmanaged index of equity prices and has a greater number of securities than is found in the Fund’s portfolio. Individuals cannot invest directly in the Index; however, an individual can invest in exchange-traded funds or other investment vehicles that attempt to track the performance of a benchmark index. The annual total returns included for the above Fund are net of the toual operating expenses for the Fund, while no annual operating expenses are deducted for the S&P 500 Index. |
11
Comparison of the Growth of a $10,000 Investment in the IMS Dividend Growth
and the S&P 500® Index for the 10 years Ended June 30, 2017 (Unaudited)
and the S&P 500® Index for the 10 years Ended June 30, 2017 (Unaudited)
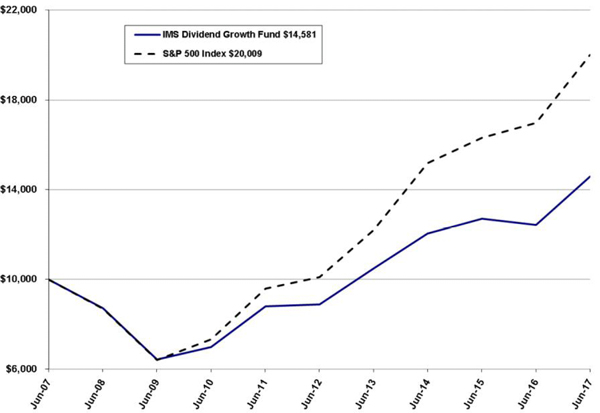
The chart above assumes an initial investment of $10,000 made on June 30, 2007 and held through June 30, 2017. The chart also assumes reinvestment of all dividends and distributions on the reinvestment dates during the period. THE FUND’S RETURN REPRESENTS PAST PERFORMANCE AND DOES NOT GUARANTEE FUTURE RESULTS. The returns shown do not reflect deduction of taxes that a shareholder would pay on Fund distributions or the redemption of Fund shares. Investment returns and principal values will fluctuate so that your shares, when redeemed, may be worth more or less than their original purchase price.
12
FUND HOLDINGS – (Unaudited)
IMS Capital Value Fund Holdings as of June 30, 20171
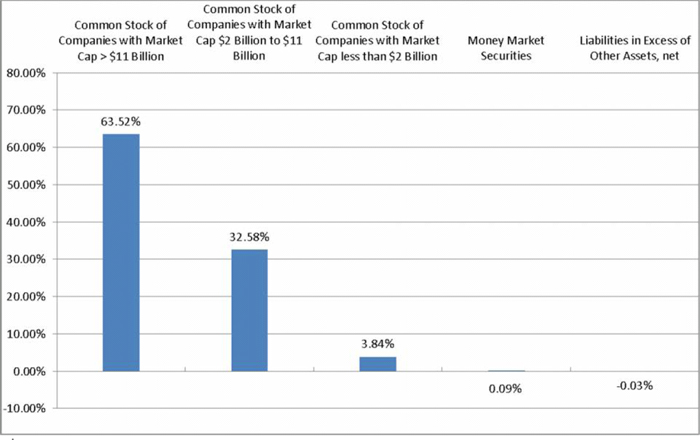
1 | As a percent of net assets. |
The investment objective of the IMS Capital Value Fund is long-term growth from capital appreciation and, secondarily, income from dividends. The IMS Capital Value Fund typically invests in mid-cap securities, which the Advisor defines as those with a market capitalization of approximately $2 billion to $11 billion, and in large-cap securities, which the Advisor defines as those with a market capitalization of greater than $11 billion.
13
FUND HOLDINGS – (Unaudited) (continued)
IMS Strategic Income Fund Holdings as of June 30, 20171
1 | As a percent of net assets. |
The investment objective of the IMS Strategic Income Fund is current income, and a secondary objective of capital appreciation. In pursuing its investment objectives, the Strategic Income Fund generally invests in corporate bonds, government bonds, dividend-paying common stocks, preferred and convertible preferred stocks, income trusts (including business trusts, oil royalty trusts and real estate investment trusts), money market instruments and cash equivalents. The Strategic Income Fund may also invest in structured products, such as reverse convertible notes, a type of structured note, and in 144A securities that are purchased in private placements and thus are subject to restrictions on resale (either as a matter of contract or under federal securities laws), but only where the Advisor has determined that a liquid trading market exists. Under normal circumstances, the Strategic Income Fund will invest at least 80% of its assets in dividend paying or other income producing securities.
14
FUND HOLDINGS – (Unaudited) (continued)
IMS Dividend Growth Fund Holdings as of June 30, 20171
1 | As a percent of net assets. |
The investment objective of the IMS Dividend Growth Fund is long-term growth from capital appreciation and dividends. The Dividend Growth Fund invests primarily in a diversified portfolio of dividend–paying common stocks. The Dividend Growth Fund’s Advisor, IMS Capital Management, Inc., employs a combination of fundamental, technical and macro market research to identify companies that the Advisor believes have the ability to maintain or increase their dividend payments, because of their significant cash flow production.
Availability of Portfolio Schedules – (Unaudited)
The Funds file their complete schedules of portfolio holdings with the Securities and Exchange Commission (“SEC”) for the first and third quarters of each fiscal year on Form N-Q. The Funds’ Forms N-Q are available at the SEC’s website at www.sec.gov. The Funds’ Forms N-Q may be reviewed and copied at the Public Reference Room in Washington, DC. Information on the operation of the Public Reference Room may be obtained by calling 1-800-SEC-0330.
15
Summary of Funds’ Expenses – (Unaudited)
As a shareholder of the Funds, you incur two types of costs: (1) transaction costs, such as short-term redemption fees; and (2) ongoing costs, including management fees and other Fund expenses. This Example is intended to help you understand your ongoing costs (in dollars) of investing in the Funds and to compare these costs with the ongoing costs of investing in other mutual funds.
The example is based on an investment of $1,000 invested at the beginning of the period and held for the entire period (January 1, 2017 through June 30, 2017).
Actual Expenses
The first line of the table below provides information about actual account values and actual expenses. You may use the information in this line, together with the amount you invested, to estimate the expenses that you paid over the period. Simply divide your account value by $1,000 (for example, an $8,600 account value divided by $1,000 = 8.60), then multiply the result by the number in the first line under the heading entitled “Expenses Paid
During Period” to estimate the expenses you paid on your account during this period.
Hypothetical Example for Comparison Purposes
The second line of the table below provides information about hypothetical account values and hypothetical expenses based on the Funds’ actual expense ratios and an assumed rate of return of 5% per year before expenses, which are not the Funds’ actual returns. The hypothetical account values and expenses may not be used to estimate the actual ending account balance or expenses you paid for the period. You may use this information to compare the ongoing costs of investing in the Funds and other funds. To do so, compare this 5% hypothetical example with the 5% hypothetical examples that appear in the shareholder reports of other funds.
Please note that the expenses shown in the table are meant only to highlight your ongoing costs and do not reflect any transactional costs, such as short-term redemption fees. Therefore, the second line is only useful in comparing ongoing costs only and will not help you determine the relative costs of owning different funds. In addition, if these transactions costs were included, your costs would have been higher.
IMS Funds | Beginning Account Value January 1, 2017 | Ending Account Value June 30, 2017 | Expenses Paid During the Period* January 1, 2017 – June 30, 2017 |
Capital Value Fund Actual (+6.32%) Hypothetical** | $ 1,000.00 $ 1,000.00 | $ 1,063.20 $ 1,016.40 | $ 8.65 $ 8.45 |
Strategic Income Fund Actual (-2.62)% Hypothetical** | $ 1,000.00 $ 1,000.00 | $ 973.80 $ 1,014.90 | $ 9.79 $ 9.99 |
Dividend Growth Fund Actual (+6.49%) Hypothetical** | $ 1,000.00 $ 1,000.00 | $ 1,064.90 $ 1,015.10 | $ 9.98 $ 9.74 |
| * | Expenses are equal to the Funds’ annualized expense ratios, multiplied by the average account value over the period, multiplied by 181/365 (to reflect the one-half year period). The annualized expense ratios for the Capital Value Fund, Strategic Income Fund, and the Dividend Growth Fund were 1.69%, 2.00%, and 1.95%, respectively. |
| ** | Assumes a 5% annual return before expenses. |
16
IMS CAPITAL VALUE FUND
SCHEDULE OF INVESTMENTS
June 30, 2017
| COMMON STOCK - 99.94% | Shares | Fair Value | ||||||
| Consumer Discretionary - 25.14% | ||||||||
Amazon.com, Inc. (a) | 930 | $ | 900,240 | |||||
AutoZone, Inc. (a) | 1,100 | 627,506 | ||||||
| BorgWarner, Inc. | 20,200 | 855,672 | ||||||
DISH Network Corp. - Class A (a) | 13,260 | 832,198 | ||||||
Dollar Tree, Inc. (a) | 12,900 | 901,968 | ||||||
| Domino's Pizza, Inc. | 3,800 | 803,814 | ||||||
| Home Depot, Inc. | 5,000 | 767,000 | ||||||
| Mattel, Inc. | 29,000 | 624,370 | ||||||
Netflix, Inc. (a) | 4,800 | 717,168 | ||||||
| Service Corp. International | 26,000 | 869,700 | ||||||
| Starbucks Corp. | 13,500 | 787,185 | ||||||
| Walt Disney Co. | 6,240 | 663,000 | ||||||
| Yum! Brands, Inc. | 12,000 | 885,120 | ||||||
| 10,234,941 | ||||||||
| Consumer Staples - 5.67% | ||||||||
| Dr Pepper Snapple Group, Inc. | 8,700 | 792,657 | ||||||
Hain Celestial Group, Inc. (a) | 16,600 | 644,412 | ||||||
| Wal-Mart Stores, Inc. | 11,500 | 870,320 | ||||||
| 2,307,389 | ||||||||
| Energy - 7.47% | ||||||||
| Apache Corp. | 10,000 | 479,300 | ||||||
| Helmerich & Payne, Inc. | 17,700 | 961,818 | ||||||
| Occidental Petroleum Corp. | 14,100 | 844,167 | ||||||
| Schlumberger Ltd. | 11,500 | 757,160 | ||||||
| 3,042,445 | ||||||||
| Financials - 14.32% | ||||||||
| Banc of California, Inc. | 38,300 | 823,450 | ||||||
| Capital One Financial Corp. | 9,600 | 793,152 | ||||||
| Columbia Banking System, Inc. | 21,000 | 836,850 | ||||||
| Federated Investors, Inc. - Class B | 30,900 | 872,925 | ||||||
| New York Community Bancorp, Inc. | 59,600 | 782,548 | ||||||
| TD Ameritrade Holding Corp. | 21,600 | 928,584 | ||||||
| Umpqua Holdings Corp. | 43,200 | 793,152 | ||||||
| 5,830,661 | ||||||||
| Health Care - 20.18% | ||||||||
| Bristol-Myers Squibb Co. | 16,514 | 920,160 | ||||||
Brookdale Senior Living, Inc. (a) | 66,700 | 981,157 | ||||||
Celgene Corp. (a) | 6,100 | 792,207 | ||||||
Edwards Lifesciences Corp. (a) | 8,800 | 1,040,512 | ||||||
| Gilead Sciences, Inc. | 12,300 | 870,594 | ||||||
IDEXX Laboratories, Inc. (a) | 5,535 | 893,460 | ||||||
InVivo Therapeutics Holdings Corp. (a) | 274,398 | 740,874 | ||||||
| Patterson Cos., Inc. | 23,500 | 1,103,325 | ||||||
| Zoetis, Inc. | 14,000 | 873,320 | ||||||
| 8,215,609 | ||||||||
17
IMS CAPITAL VALUE FUND
SCHEDULE OF INVESTMENTS
June 30, 2017
| COMMON STOCK - 99.94% (continued) | Shares | Fair Value | ||||||
| Industrials - 8.00% | ||||||||
| Arconic, Inc. | 30,000 | $ | 679,500 | |||||
| Kansas City Southern | 8,500 | 889,525 | ||||||
| Stanley Black & Decker, Inc. | 6,240 | 878,155 | ||||||
Stericycle, Inc. (a) | 10,600 | 808,992 | ||||||
| 3,256,172 | ||||||||
| Information Technology - 14.10% | ||||||||
Alphabet, Inc. - Class C (a) | 1,030 | 935,992 | ||||||
| Apple, Inc. | 6,600 | 950,532 | ||||||
| Intel Corp. | 22,300 | 752,402 | ||||||
| Paychex, Inc. | 16,200 | 922,428 | ||||||
PayPal Holdings, Inc. (a) | 15,500 | 831,885 | ||||||
| QUALCOMM, Inc. | 14,600 | 806,212 | ||||||
| Western Digital Corp. | 6,100 | 540,460 | ||||||
| 5,739,911 | ||||||||
| Telecommunication Services - 3.20% | ||||||||
| CenturyLink, Inc. | 29,500 | 704,460 | ||||||
| Verizon Communications, Inc. | 13,400 | 598,444 | ||||||
| 1,302,904 | ||||||||
| Utilities - 1.86% | ||||||||
| Vistra Energy Corp. | 45,000 | 755,550 | ||||||
| TOTAL COMMON STOCK (Cost $35,208,803) | 40,685,582 | |||||||
| MONEY MARKET SECURITIES - 0.09% | ||||||||
Federated Government Obligations Fund - Institutional Shares, 0.82% (b) | 35,180 | 35,180 | ||||||
| TOTAL MONEY MARKET SECURITIES (Cost $35,180) | 35,180 | |||||||
| TOTAL INVESTMENTS (Cost $35,243,983) - 100.03% | $ | 40,720,762 | ||||||
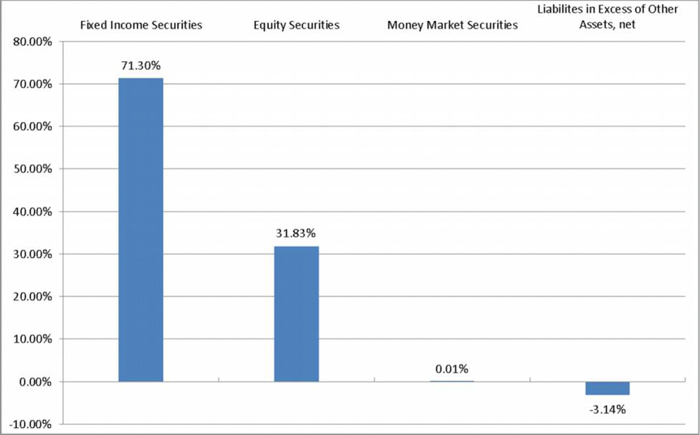
| LIABILITIES IN EXCESS OF OTHER ASSETS, NET - (0.03%) | (13,382 | ) | ||||||
| NET ASSETS - 100.00% | $ | 40,707,380 | ||||||
Percentages are stated as a percent of net assets.
| (a) | Non-income producing security. |
| (b) | Rate shown represents the 7-day yield at June 30, 2017, is subject to change and resets daily. |
See accompanying notes which are an integral part of these schedules of investments.
18
IMS STRATEGIC INCOME FUND
SCHEDULE OF INVESTMENTS
June 30, 2017
| COMMON STOCK - 31.83% | Shares | Fair Value | ||||||
| Consumer Staples - 9.52% | ||||||||
| Clorox Co. | 1,000 | $ | 133,240 | |||||
| General Mills, Inc. | 2,400 | 132,960 | ||||||
| Procter & Gamble Co. | 1,600 | 139,440 | ||||||
| Sysco Corp. | 2,500 | 125,825 | ||||||
| 531,465 | ||||||||
| Financials - 2.46% | ||||||||
| JPMorgan Chase & Co. | 1,500 | 137,100 | ||||||
| Health Care - 2.50% | ||||||||
| Bristol-Myers Squibb Co. | 2,500 | 139,300 | ||||||
| Information Technology - 7.70% | ||||||||
| Cisco Systems, Inc. | 9,300 | 291,090 | ||||||
| Texas Instruments, Inc. | 1,800 | 138,474 | ||||||
| 429,564 | ||||||||
| Materials - 2.31% | ||||||||
| Air Products & Chemicals, Inc. | 900 | 128,754 | ||||||
| Real Estate - 2.51% | ||||||||
| Apple Hospitality REIT, Inc. | 7,500 | 140,325 | ||||||
| Telecommunication Services- 4.83% | ||||||||
| AT & T, Inc. | 3,600 | 135,828 | ||||||
| Verizon Communications, Inc. | 3,000 | 133,980 | ||||||
| 269,808 | ||||||||
| TOTAL COMMON STOCK (Cost $1,809,096) | 1,776,316 | |||||||
| CORPORATE BONDS - 1.93% | Principal Amount | Fair Value | |||||||
Sabine Oil & Gas Corp., 7.250%, 06/15/2019 (e) (g) | 1,375,000 | 14 | |||||||
Thornton Drilling Co., 5.000%, 06/15/2018 (b) (e) (f) (g) | 477,977 | 107,545 | |||||||
| TOTAL CORPORATE BONDS (Cost $1,753,821) | 107,559 | ||||||||
| FOREIGN BONDS DENOMINATED IN US DOLLARS - 11.66% | |||||||||
Cash Store Financial Services, Inc., 11.500%, 01/31/2017 - Canada (b) (d) (e) (f) (g) | 1,289,000 | 84,495 | |||||||
Newland International Properties Corp., 9.500%, 07/03/2017 - Panama (d) (g) (i) | 572,479 | 143,120 | |||||||
Newland International Properties Corp., 9.500%, 07/03/2017 - Panama (g) (h) (i) | 349,168 | 87,292 | |||||||
Panama Canal Railway Co., 7.000%, 11/01/2026 - Panama (h) | 328,950 | 335,529 | |||||||
| TOTAL FOREIGN BONDS DENOMINATED IN US DOLLARS (Cost $2,334,807) | 650,436 | ||||||||
19
IMS STRATEGIC INCOME FUND
SCHEDULE OF INVESTMENTS
June 30, 2017
| Principal Amount | Fair Value | |||||||
| STRUCTURED NOTES - 56.37% | ||||||||
Bank of Nova Scotia Callable Steepener Note Series A, 2.696%, 07/29/2033 - Canada (c) | $ | 700,000 | $ | 536,900 | ||||
Barclays Bank PLC Callable Leveraged Steepener Note, 2.760%, 07/31/2034 - Britain (c) | 250,000 | 172,187 | ||||||
Credit Suisse AG Leveraged CMS Curve and Russell 2000 Index Linked Note, 7.072%, 07/31/2030 (c) | 450,000 | 371,813 | ||||||
JP Morgan Chase & Co. Callable Range Accrual Rate Linked Note, 9.360%, 05/06/2030 (c) | 500,000 | 455,700 | ||||||
Morgan Stanley Fixed to Floating Rate Leveraged CMS and Index Linked Note, 4.810%, 08/30/2028 (c) | 350,000 | 268,187 | ||||||
Morgan Stanley Senior Floating Rate Conversion CMS and Index Linked Note, 4.216%, 03/25/2031 (c) | 600,000 | 545,250 | ||||||
Natixis US Medium-Term Note Program LLC Callable Fixed-to Floating Capped Range Accrual Note, 6.188%, 10/31/2034 (c) | 500,000 | 365,000 | ||||||
SG Structured Products, Inc. Callable Fixed to Variable Barrier Range Dual Index Linked Note, 3.848%, 11/27/2028 (c) | 600,000 | 430,620 | ||||||
| TOTAL STRUCTURED NOTES (Cost $3,849,178) | 3,145,657 | |||||||
| SECURED SUBORDINATED PROMISSORY NOTES - 1.34% | ||||||||
Aequitas Commercial Finance, LLC Secured Subordinated Promissory Note, 11.000%, 07/28/2019 (b) (d) (e) (f) (g) | 750,000 | 75,000 | ||||||
| TOTAL SECURED SUBORDINATED PROMISSORY NOTES (Cost $750,000) | 75,000 | |||||||
| Shares | ||||||||
| MONEY MARKET SECURITIES - 0.01% | ||||||||
Federated Government Obligations Fund - Institutional Shares, 0.82% (a) | 667 | 667 | ||||||
| TOTAL MONEY MARKET SECURITIES (Cost $667) | 667 | |||||||
| Fair Value | ||||
| TOTAL INVESTMENTS (Cost $10,497,569) - 103.14% | $ | 5,755,635 | ||
| LIABILITIES IN EXCESS OF OTHER ASSETS, NET - (3.14%) | (175,237 | ) | ||
| NET ASSETS - 100.00% | $ | 5,580,398 | ||
Percentages are stated as a percent of net assets.
| (a) | Variable rate security. Rate shown represents the 7-day yield at June 30, 2017 and resets daily. |
| (b) | This security is currently valued by the Advisor using fair valuation procedures approved by the Board of Trustees under the oversight of the Fair Valuation Committee. |
| (c) | Variable rate security. Rate shown represents the rate in effect at June 30, 2017. |
| (d) | Security exempted from registration under Rule 144A of the Securities Act of 1933. The security may be resold in transactions exempt from registration, normally to qualified institutional investors. |
| (e) | Non-income producing security. |
| (f) | Security is illiquid at June 30, 2017, at which time the aggregate value of illiquid securities is $267,040 or 4.79% of net assets. |
| (g) | Issue is in default. |
| (h) | Security exempted from registration under Regulation S of the Securities Act of 1933. |
| (i) | Partial interest payments made during the year ended June 30, 2017. |
See accompanying notes which are an integral part of these schedules of investments.
20
IMS DIVIDEND GROWTH FUND
SCHEDULE OF INVESTMENTS
June 30, 2017
| COMMON STOCK - 99.84% | Shares | Fair Value | ||||||
| Consumer Discretionary - 13.28% | ||||||||
| General Motors Co. | 10,300 | $ | 359,779 | |||||
| TJX Cos., Inc. | 3,800 | 274,246 | ||||||
| Twenty-First Century Fox, Inc. - Class B | 9,500 | 264,765 | ||||||
| Whirlpool Corp. | 2,100 | 402,402 | ||||||
| 1,301,192 | ||||||||
| Consumer Staples - 11.01% | ||||||||
| Altria Group, Inc. | 4,100 | 305,327 | ||||||
| Kraft Heinz Co. | 4,300 | 368,252 | ||||||
| Philip Morris International, Inc. | 3,450 | 405,203 | ||||||
| 1,078,782 | ||||||||
| Energy - 2.02% | ||||||||
| PBF Energy, Inc. - Class A | 8,900 | 198,114 | ||||||
| Financials - 22.13% | ||||||||
| Axis Capital Holdings Ltd. | 5,300 | 342,698 | ||||||
| Bank of America Corp. | 6,300 | 152,838 | ||||||
| BlackRock, Inc. | 1,350 | 570,253 | ||||||
| CME Group, Inc. | 4,000 | 500,960 | ||||||
| M&T Bank Corp. | 1,300 | 210,535 | ||||||
| S&P Global, Inc. | 2,675 | 390,523 | ||||||
| 2,167,807 | ||||||||
| Health Care - 15.25% | ||||||||
| Abbott Laboratories | 6,500 | 315,965 | ||||||
| AbbVie, Inc. | 6,400 | 464,064 | ||||||
| Cardinal Health, Inc. | 4,240 | 330,381 | ||||||
| Johnson & Johnson | 2,900 | 383,641 | ||||||
| 1,494,051 | ||||||||
| Industrials - 11.50% | ||||||||
| Copa Holdings SA - Class A | 3,000 | 351,000 | ||||||
| Lockheed Martin Corp. | 1,758 | 488,038 | ||||||
| Parker-Hannifin Corp. | 1,800 | 287,676 | ||||||
| 1,126,714 | ||||||||
| Information Technology - 20.42% | ||||||||
| Apple, Inc. | 2,900 | 417,658 | ||||||
| CDK Global, Inc. | 6,520 | 404,631 | ||||||
| Microsoft Corp. | 7,775 | 535,931 | ||||||
| QUALCOMM, Inc. | 6,150 | 339,603 | ||||||
| Sabre Corp. | 13,900 | 302,603 | ||||||
| 2,000,426 | ||||||||
| Real Estate - 4.23% | ||||||||
| Outfront Media, Inc. | 17,900 | 413,848 | ||||||
| TOTAL COMMON STOCK (Cost $8,524,006) | 9,780,934 | |||||||
21
IMS DIVIDEND GROWTH FUND
SCHEDULE OF INVESTMENTS
June 30, 2017
| Shares | Fair Value | |||||||
| MONEY MARKET SECURITIES - 0.75% | ||||||||
Federated Government Obligations Fund - Institutional Shares, 0.82% (a) | 73,790 | $ | 73,790 | |||||
| TOTAL MONEY MARKET SECURITIES (Cost $73,790) | 73,790 | |||||||
| TOTAL INVESTMENTS (Cost $8,597,796) - 100.59% | $ | 9,854,724 | ||||||
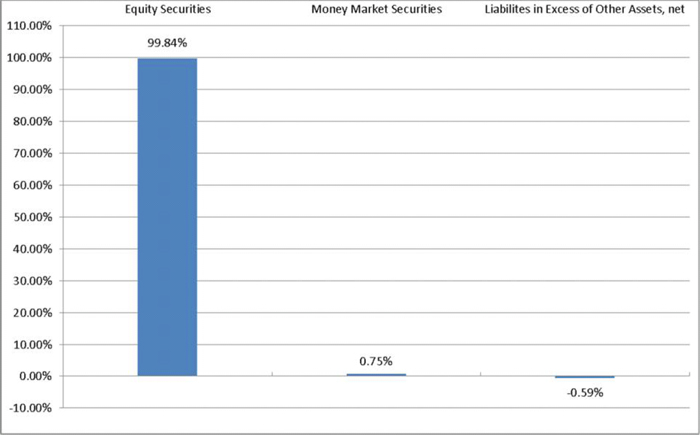
| LIABILITIES IN EXCESS OF OTHER ASSETS, NET - (0.59)% | (57,575 | ) | ||||||
| NET ASSETS - 100.00% | $ | 9,797,149 | ||||||
Percentages are stated as a percent of net assets.
| (a) | Rate shown represents the 7-day yield at June 30, 2017, is subject to change and resets daily. |
See accompanying notes which are an integral part of these schedules of investments.
22
IMS FAMILY OF FUNDS
STATEMENTS OF ASSETS AND LIABILITIES
June 30, 2017
IMS Capital Value Fund | IMS Strategic Income Fund | IMS Dividend Growth Fund | ||||||||||
| Assets: | ||||||||||||
| Investments in securities: | ||||||||||||
| At cost | $ | 35,243,983 | $ | 10,497,569 | $ | 8,597,796 | ||||||
| At fair value | $ | 40,720,762 | $ | 5,755,635 | $ | 9,854,724 | ||||||
| Receivables: | ||||||||||||
| Interest | 44 | 23,949 | 19 | |||||||||
| Dividends | 40,728 | 21,160 | 10,064 | |||||||||
| Fund shares sold | 13,325 | - | - | |||||||||
| Investments sold | - | 441,103 | - | |||||||||
| Prepaid expenses | 7,857 | 3,710 | 4,359 | |||||||||
| Total assets | 40,782,716 | 6,245,557 | 9,869,166 | |||||||||
| Liabilities: | ||||||||||||
| Payables: | ||||||||||||
| Line of credit borrowings | - | 81,000 | - | |||||||||
| Investments purchased | - | 555,728 | - | |||||||||
| Fund shares redeemed | 9,442 | 9,435 | 43,091 | |||||||||
| Due to advisor | 40,753 | 723 | 10,888 | |||||||||
| Due to administrator, fund accountant and transfer agent | 9,301 | 2,498 | 3,398 | |||||||||
| Accrued expenses | 15,840 | 15,775 | 14,640 | |||||||||
| Total liabilities | 75,336 | 665,159 | 72,017 | |||||||||
| Net Assets | $ | 40,707,380 | $ | 5,580,398 | $ | 9,797,149 | ||||||
| Net Assets consist of: | ||||||||||||
| Paid-in capital | $ | 34,657,448 | $ | 55,601,278 | $ | 9,358,663 | ||||||
| Undistributed net investment income (loss) | 9,376 | (7,762 | ) | 7,220 | ||||||||
| Undistributed (accumulated) net realized gain (loss) on investments | 563,777 | (45,271,184 | ) | (825,662 | ) | |||||||
| Net unrealized appreciation (depreciation) on investments | 5,476,779 | (4,741,934 | ) | 1,256,928 | ||||||||
| Total Net Assets | $ | 40,707,380 | $ | 5,580,398 | $ | 9,797,149 | ||||||
| Shares outstanding (unlimited number of shares authorized, no par value) | 1,692,856 | 1,905,376 | 665,685 | |||||||||
| Net asset value and offering price per share | $ | 24.05 | $ | 2.93 | $ | 14.72 | ||||||
Minimum redemption price per share (a) | $ | 23.93 | $ | 2.92 | $ | 14.65 | ||||||
| (a) | A redemption fee of 0.50% will be assessed on shares of the Fund that are redeemed within 90 days of purchase. |
See accompanying notes which are an integral part of these financial statements.
23
IMS FAMILY OF FUNDS
STATEMENTS OF OPERATIONS
For the Year Ended June 30, 2017
IMS Capital Value Fund | IMS Strategic Income Fund | IMS Dividend Growth Fund | ||||||||||
| Investment income: | ||||||||||||
| Dividends (net of foreign withholding taxes of $3, $1,610 and $0, respectively) | $ | 704,516 | $ | 249,089 | $ | 247,399 | ||||||
| Interest | 4,387 | 466,799 | 258 | |||||||||
| Total investment income | 708,903 | 715,888 | 247,657 | |||||||||
| Expenses: | ||||||||||||
Investment Advisor fees(a) | 484,779 | 92,013 | 117,392 | |||||||||
Accounting, administration and transfer agent fees and expenses (a) | 111,148 | 33,625 | 41,020 | |||||||||
| Registration expenses | 13,333 | 9,884 | 5,000 | |||||||||
| Miscellaneous expenses | 11,055 | 9,626 | 9,030 | |||||||||
| Shareholder networking fees | 7,614 | 2,934 | 1,671 | |||||||||
| Audit expenses | 12,000 | 23,500 | 12,000 | |||||||||
| Custodian expenses | 8,781 | 7,952 | 5,106 | |||||||||
| Trustee expenses | 15,877 | 18,276 | 15,876 | |||||||||
| Pricing expenses | 4,812 | 6,407 | 3,169 | |||||||||
| Insurance expenses | 1,598 | 1,598 | 1,598 | |||||||||
| Legal expenses | 4,855 | 4,744 | 4,855 | |||||||||
| Printing expenses | 1,032 | 1,192 | 1,208 | |||||||||
| Interest expenses | 1,377 | 2,544 | 299 | |||||||||
| Total expenses | 678,261 | 214,295 | 218,224 | |||||||||
Less: Fees waived by Advisor (a) | - | (69,739 | ) | (36,744 | ) | |||||||
| Net expenses | 678,261 | 144,556 | 181,480 | |||||||||
| Net Investment Income | 30,642 | 571,332 | 66,177 | |||||||||
| Realized and unrealized gain (loss) on investment securities and foreign currency: | ||||||||||||
| Net realized gain (loss) on investment securities and foreign currency | 4,666,957 | (2,499,792 | ) | (105,589 | ) | |||||||
| Change in unrealized appreciation (depreciation) on investment securities and foreign currency | (263,453 | ) | 1,764,764 | 1,500,916 | ||||||||
| Net realized and unrealized gain (loss) on investment securities and foreign currency | 4,403,504 | (735,028 | ) | 1,395,327 | ||||||||
| Net Increase (Decrease) in Net Assets Resulting from Operations | $ | 4,434,146 | $ | (163,696 | ) | $ | 1,461,504 | |||||
| (a) | See Note 4 in the Notes to Financial Statements. |
See accompanying notes which are an integral part of these financial statements.
24
IMS STRATEGIC INCOME FUND
STATEMENT OF CASH FLOWS
For the Year Ended June 30, 2017
| Increase (decrease) in cash: | ||||
| Cash flows from operating activities: | ||||
| Net decrease in net assets from operations | $ | (163,696 | ) | |
| Adjustments to reconcile net decrease in net assets from operations to net cash provided from operating activities: | ||||
| Return of capital dividends received | 35,832 | |||
| Accretion of discount/Amortization of premium, net | (72,913 | ) | ||
| Purchase of investment securities | (34,570,796 | ) | ||
| Proceeds from disposition of investment securities | 36,592,463 | |||
| Sales of short-term investment securities, net | 196,787 | |||
| Decrease in dividends and interest receivable | 113,079 | |||
| Increase in receivables for securities sold | (145,945 | ) | ||
| Decrease in prepaid expenses | 4,946 | |||
| Increase in payable for securities purchased | 555,728 | |||
| Decrease in accrued expenses | (12,792 | ) | ||
| Net unrealized depreciation on investment securities and foreign currency | (1,764,764 | ) | ||
| Net realized loss on investment securities | 2,520,482 | |||
| Net cash provided from operating activities | 3,288,411 | |||
| Cash flows from financing activities: | ||||
| Proceeds from loan | 3,696,000 | |||
| Payments on loan | (3,802,000 | ) | ||
| Proceeds from Fund shares sold | 369,436 | |||
| Payment on Fund shares redeemed | (3,477,202 | ) | ||
| Cash distributions paid | (74,645 | ) | ||
| Net cash used in financing activities | (3,288,411 | ) | ||
| Net increase in cash | $ | - | ||
| Cash: | ||||
| Beginning of year | $ | - | ||
| End of year | $ | - | ||
Supplemental disclosure of cash flow information:
Noncash financing activities not included herein consist of reinvestment of distributions of $546,339, a decrease in receivable for fund shares sold of $500 and a decrease in payable for Fund shares redeemed of $61,784.
Interest paid by the Fund for outstanding balances on the line of credit amounted to $2,544.
See accompanying notes which are an integral part of these financial statements.
25
IMS CAPITAL VALUE FUND
STATEMENTS OF CHANGES IN NET ASSETS
Year Ended June 30, 2017 | Year Ended June 30, 2016 | |||||||
| Increase (Decrease) in Net Assets due to: | ||||||||
| Operations: | ||||||||
| Net investment income (loss) | $ | 30,642 | $ | (75,693 | ) | |||
| Net realized gain (loss) on investment securities | 4,666,957 | (2,482,555 | ) | |||||
| Change in unrealized depreciation on investment securities | (263,453 | ) | (249,635 | ) | ||||
| Net increase (decrease) in net assets resulting from operations | 4,434,146 | (2,807,883 | ) | |||||
| Capital share transactions: | ||||||||
| Proceeds from shares purchased | 827,139 | 5,800,832 | ||||||
| Amount paid for shares redeemed | (3,237,867 | ) | (5,026,135 | ) | ||||
| Proceeds from redemption fees | 913 | 556 | ||||||
| Net increase (decrease) in net assets from share transactions | (2,409,815 | ) | 775,253 | |||||
| Total Increase (Decrease) in Net Assets | 2,024,331 | (2,032,630 | ) | |||||
| Net Assets: | ||||||||
| Beginning of year | 38,683,049 | 40,715,679 | ||||||
| End of year | $ | 40,707,380 | $ | 38,683,049 | ||||
| Accumulated undistributed net investment income (loss) included in net assets at end of year | $ | 9,376 | $ | (21,266 | ) | |||
| Capital Share Transactions | ||||||||
| Shares purchased | 36,042 | 277,553 | ||||||
| Shares issued in reinvestment of distributions | - | - | ||||||
| Shares redeemed | (141,039 | ) | (237,550 | ) | ||||
| Net increase (decrease) in capital shares | (104,997 | ) | 40,003 | |||||
See accompanying notes which are an integral part of these financial statements.
26
IMS STRATEGIC INCOME FUND
STATEMENTS OF CHANGES IN NET ASSETS
Year Ended June 30, 2017 | Year Ended June 30, 2016 | |||||||
| Increase (Decrease) in Net Assets due to: | ||||||||
| Operations: | ||||||||
| Net investment income | $ | 571,332 | $ | 1,205,697 | ||||
| Net realized loss on investment securities and foreign currency | (2,499,792 | ) | (3,585,379 | ) | ||||
| Change in unrealized appreciation (depreciation) on investment securities and foreign currency | 1,764,764 | (1,221,438 | ) | |||||
| Net decrease in net assets resulting from operations | (163,696 | ) | (3,601,120 | ) | ||||
| Distributions | ||||||||
| From net investment income | (620,984 | ) | (1,151,406 | ) | ||||
| Total distributions | (620,984 | ) | (1,151,406 | ) | ||||
| Capital share transactions: | ||||||||
| Proceeds from shares purchased | 368,936 | 533,027 | ||||||
| Reinvestment of distributions | 546,339 | 1,030,775 | ||||||
| Amount paid for shares redeemed | (3,415,589 | ) | (8,811,098 | ) | ||||
| Proceeds from redemption fees | 171 | 336 | ||||||
| Net decrease in net assets from share transactions | (2,500,143 | ) | (7,246,960 | ) | ||||
| Total Decrease in Net Assets | (3,284,823 | ) | (11,999,486 | ) | ||||
| Net Assets: | ||||||||
| Beginning of year | 8,865,221 | 20,864,707 | ||||||
| End of year | $ | 5,580,398 | $ | 8,865,221 | ||||
| Accumulated undistributed net investment income (loss) included in net assets at end of year | $ | (7,762 | ) | $ | 54,291 | |||
| Capital Share Transactions | ||||||||
| Shares purchased | 112,779 | 150,061 | ||||||
| Shares issued in reinvestment of distributions | 173,326 | 276,969 | ||||||
| Shares redeemed | (1,095,463 | ) | (2,322,167 | ) | ||||
| Net decrease in capital shares | (809,358 | ) | (1,895,137 | ) | ||||
See accompanying notes which are an integral part of these financial statements.
27
IMS DIVIDEND GROWTH FUND
STATEMENTS OF CHANGES IN NET ASSETS
Year Ended June 30, 2017 | Year Ended June 30, 2016 | |||||||
| Increase (Decrease) in Net Assets due to: | ||||||||
| Operations: | ||||||||
| Net investment income | $ | 66,177 | $ | 77,236 | ||||
| Net realized loss on investment securities | (105,589 | ) | (103,303 | ) | ||||
| Change in unrealized appreciation (depreciation) on investment securities | 1,500,916 | (252,790 | ) | |||||
| Net increase (decrease) in net assets resulting from operations | 1,461,504 | (278,857 | ) | |||||
| Distributions | ||||||||
| From net investment income | (60,595 | ) | (78,680 | ) | ||||
| Total distributions | (60,595 | ) | (78,680 | ) | ||||
| Capital share transactions: | ||||||||
| Proceeds from shares purchased | 894,876 | 540,706 | ||||||
| Reinvestment of distributions | 60,462 | 78,488 | ||||||
| Amount paid for shares redeemed | (1,034,806 | ) | (2,076,942 | ) | ||||
| Proceeds from redemption fees | 200 | 39 | ||||||
| Net decrease in net assets from share transactions | (79,268 | ) | (1,457,709 | ) | ||||
| Total Increase (Decrease) in Net Assets | 1,321,641 | (1,815,246 | ) | |||||
| Net Assets: | ||||||||
| Beginning of year | 8,475,508 | 10,290,754 | ||||||
| End of year | $ | 9,797,149 | $ | 8,475,508 | ||||
| Accumulated undistributed net investment income included in net assets at end of year | $ | 7,220 | $ | 1,638 | ||||
| Capital Share Transactions | ||||||||
| Shares purchased | 62,833 | 44,427 | ||||||
| Shares issued in reinvestment of distributions | 4,273 | 6,466 | ||||||
| Shares redeemed | (72,902 | ) | (169,365 | ) | ||||
| Net decrease in capital shares | (5,796 | ) | (118,472 | ) | ||||
See accompanying notes which are an integral part of these financial statements.
28
IMS CAPITAL VALUE FUND
FINANCIAL HIGHLIGHTS
For a Fund share outstanding throughout each year
| June 30, 2017 | June 30, 2016 | June 30, 2015 | June 30, 2014 | June 30, 2013 | ||||||||||||||||
| Net Asset Value, Beginning of Year | $ | 21.52 | $ | 23.16 | $ | 21.10 | $ | 17.62 | $ | 14.99 | ||||||||||
| Investment Operations: | ||||||||||||||||||||
| Net investment income (loss) | 0.02 | (0.04 | ) | (0.04 | ) | (0.10 | ) | 0.01 | ||||||||||||
| Net realized and unrealized gain (loss) on investments | 2.51 | (1.60 | ) | 2.10 | 3.58 | 2.62 | ||||||||||||||
| Total from investment operations | 2.53 | (1.64 | ) | 2.06 | 3.48 | 2.63 | ||||||||||||||
Paid in capital from redemption fees(a) | - | - | - | - | - | |||||||||||||||
| Net Asset Value, End of Year | $ | 24.05 | $ | 21.52 | $ | 23.16 | $ | 21.10 | $ | 17.62 | ||||||||||
Total Return (b) | 11.76 | % | (7.08 | )% | 9.76 | % | 19.75 | % | 17.54 | % | ||||||||||
| Ratios/Supplemental Data | ||||||||||||||||||||
| Net assets, end of year (in 000's) | $ | 40,707 | $ | 38,683 | $ | 40,716 | $ | 40,262 | $ | 35,031 | ||||||||||
| Ratio of expenses to average net assets: | 1.69 | % | 1.69 | % | 1.74 | % | 2.05 | % | 2.06 | % | ||||||||||
| Ratio of net investment income (loss) to average net assets: | 0.08 | % | (0.19 | )% | (0.17 | )% | (0.50 | )% | 0.12 | % | ||||||||||
| Portfolio turnover rate | 84.33 | % | 64.78 | % | 62.98 | % | 110.42 | % | 146.53 | % | ||||||||||
| (a) | Redemption fees resulted in less than $0.005 per share. |
| (b) | Total return in the above table represents the rate that the investor would have earned or lost on an investment in the Fund assuming reinvestment of dividends. |
See accompanying notes which are an integral part of these financial statements.
29
IMS STRATEGIC INCOME FUND
FINANCIAL HIGHLIGHTS
For a Fund share outstanding throughout each year
| June 30, 2017 | June 30, 2016 | June 30, 2015 | June 30, 2014 | June 30, 2013 | ||||||||||||||||
| Net Asset Value, Beginning of Year | $ | 3.27 | $ | 4.53 | $ | 5.95 | $ | 6.11 | $ | 6.08 | ||||||||||
| Investment Operations: | ||||||||||||||||||||
| Net investment income | 0.24 | 0.35 | 0.45 | 0.56 | 0.59 | |||||||||||||||
| Net realized and unrealized gain (loss) on investments and foreign currency | (0.32 | ) | (1.28 | ) | (1.37 | ) | (0.15 | ) | 0.01 | (a) | ||||||||||
| Total from investment operations | (0.08 | ) | (0.93 | ) | (0.92 | ) | 0.41 | 0.60 | ||||||||||||
| Less Distributions to shareholders: | ||||||||||||||||||||
| From net investment income | (0.26 | ) | (0.33 | ) | (0.39 | ) | (0.57 | ) | (0.56 | ) | ||||||||||
| Tax return of capital | - | - | (0.11 | ) | - | (0.01 | ) | |||||||||||||
| Total distributions | (0.26 | ) | (0.33 | ) | (0.50 | ) | (0.57 | ) | (0.57 | ) | ||||||||||
Paid in capital from redemption fees(b) | - | - | - | - | - | |||||||||||||||
| Net Asset Value, End of Year | $ | 2.93 | $ | 3.27 | $ | 4.53 | $ | 5.95 | $ | 6.11 | ||||||||||
Total Return (c) | (2.69 | )% | (20.99 | )% | (16.13 | )% | 7.00 | % | 10.02 | % | ||||||||||
| Ratios/Supplemental Data | ||||||||||||||||||||
| Net assets, end of year (in 000's) | $ | 5,580 | $ | 8,865 | $ | 20,865 | $ | 37,805 | $ | 38,945 | ||||||||||
| Ratio of expenses to average net assets: | 1.98 | %(h) | 1.98 | %(g) | 1.96 | %(f) | 1.94 | %(e) | 1.95 | %(d) | ||||||||||
| Ratio of expenses to average net assets before waiver & reimbursement: | 2.93 | %(h) | 2.25 | %(g) | 1.92 | %(f) | 2.12 | % | 2.06 | % | ||||||||||
| Ratio of net investment income to average net assets: | 7.83 | %(h) | 9.13 | %(g) | 8.94 | %(f) | 9.27 | %(e) | 9.27 | %(d) | ||||||||||
| Ratio of net investment income to average net assets before waiver & reimbursement: | 6.87 | %(h) | 8.85 | %(g) | 8.90 | %(f) | 9.08 | % | 9.16 | % | ||||||||||
| Portfolio turnover rate | 505.62 | % | 394.23 | % | 562.40 | % | 371.35 | % | 389.36 | % | ||||||||||
| (a) | Realized and unrealized gains and losses per share in this caption are balancing amounts necessary to reconcile the changes in net assets value per share for the period, and may not reconcile with the aggregate gains and losses in the statement of operations. |
| (b) | Redemption fees resulted in less than $0.005 per share. |
| (c) | Total return in the above table represents the rate that the investor would have earned or lost on an investment in the Fund assuming reinvestment of dividends. |
| (d) | Effective November 1, 2012, the Advisor agreed to waive fees to maintain Fund expenses at 1.89% (excluding brokerage fees and commissions; borrowing costs, such as (a) interest and (b) dividend expenses on securities sold short; taxes; any indirect expenses, such as acquired fund fees and expenses; any 12b-1 fees; and extraordinary litigation expenses). |
| (e) | Effective November 1, 2013, the Advisor agreed to waive fees to maintain Fund expenses at 1.95% (excluding brokerage fees and commissions; borrowing costs, such as (a) interest and (b) dividend expenses on securities sold short; taxes; any indirect expenses, such as acquired fund fees and expenses; any 12b-1 fees; and extraordinary litigation expenses). |
| (f) | The ratios include 0.01% of interest expense during the year ended June 30, 2015. |
| (g) | The ratios include 0.03% of interest expense during the year ended June 30, 2016. |
| (h) | The ratios include 0.04% of interest expense during the year ended June 30, 2017. |
See accompanying notes which are an integral part of these financial statements.
30
IMS DIVIDEND GROWTH FUND
FINANCIAL HIGHLIGHTS
For a Fund share outstanding throughout each year
| June 30, 2017 | June 30, 2016 | June 30, 2015 | June 30, 2014 | June 30, 2013 | ||||||||||||||||
| Net Asset Value, Beginning of Year | $ | 12.62 | $ | 13.03 | $ | 12.44 | $ | 10.96 | $ | 9.73 | ||||||||||
| Investment Operations: | ||||||||||||||||||||
| Net investment income | 0.10 | 0.11 | 0.09 | 0.16 | 0.30 | |||||||||||||||
| Net realized and unrealized gain (loss) on investments | 2.09 | (0.41 | ) | 0.59 | 1.46 | 1.44 | ||||||||||||||
| Total from investment operations | 2.19 | (0.30 | ) | 0.68 | 1.62 | 1.74 | ||||||||||||||
| Less Distributions to shareholders: | ||||||||||||||||||||
| From net investment income | (0.09 | ) | (0.11 | ) | (0.09 | ) | (0.14 | ) | (0.38 | ) | ||||||||||
| Tax return of capital | - | - | - | - | (0.13 | ) | ||||||||||||||
| Total distributions | (0.09 | ) | (0.11 | ) | (0.09 | ) | (0.14 | ) | (0.51 | ) | ||||||||||
Paid in capital from redemption fees(a) | - | - | - | - | - | |||||||||||||||
| Net Asset Value, End of Year | $ | 14.72 | $ | 12.62 | $ | 13.03 | $ | 12.44 | $ | 10.96 | ||||||||||
Total Return (b) | 17.38 | % | (2.27 | )% | 5.48 | % | 14.88 | % | 18.10 | % | ||||||||||
| Ratios/Supplemental Data | ||||||||||||||||||||
| Net assets, end of year (in 000's) | $ | 9,797 | $ | 8,476 | $ | 10,291 | $ | 8,670 | $ | 8,000 | ||||||||||
| Ratio of expenses to average net assets: | 1.95 | % | 1.96 | %(c) | 1.95 | % | 1.96 | % | 1.97 | % | ||||||||||
| Ratio of expenses to average net assets before waiver & reimbursement: | 2.34 | % | 2.37 | %(c) | 2.50 | % | 2.50 | % | 2.43 | % | ||||||||||
| Ratio of net investment income to average net assets: | 0.71 | % | 0.85 | %(c) | 0.69 | % | 1.39 | % | 2.85 | % | ||||||||||
| Ratio of net investment income to average net assets before waiver & reimbursement: | 0.32 | % | 0.44 | %(c) | 0.14 | % | 0.86 | % | 2.39 | % | ||||||||||
| Portfolio turnover rate | 32.76 | % | 6.63 | % | 86.92 | % | 240.61 | % | 97.55 | % | ||||||||||
| (a) | Redemption fees resulted in less than $0.005 per share. |
| (b) | Total return in the above table represents the rate that the investor would have earned or lost on an investment in the Fund assuming reinvestment of dividends. |
| (c) | The ratios include 0.01% of interest expense during the year ended June 30, 2016. |
See accompanying notes which are an integral part of these financial statements.
31
IMS FAMILY OF FUNDS
NOTES TO THE FINANCIAL STATEMENTS
June 30, 2017
NOTE 1. ORGANIZATION
The IMS Family of Funds (the “Funds”), comprising the IMS Capital Value Fund (the “Value Fund”), IMS Strategic Income Fund (the “Income Fund”) and IMS Dividend Growth Fund (the “Dividend Growth Fund”), were each organized as a diversified series of 360 Funds (the “Trust”) on June 20, 2014. The Trust was organized on February 24, 2005 as a Delaware statutory trust. The Trust is registered as an open-end management investment company under the Investment Company Act of 1940 (the “1940 Act”). The investment objective of the Value Fund is to provide long-term growth from capital appreciation and secondarily, income from dividends. The investment objective of the Income Fund is to provide current income and secondarily, capital appreciation. The investment objective of the Dividend Growth Fund is to provide long-term growth from capital appreciation and dividends. The investment advisor of each Fund is IMS Capital Management, Inc. (the “Advisor”). The Funds were established originally as series portfolios of another investment company (the "Predecessor Investment Company"). On June 20, 2014, the Funds reorganized into the Trust. Any financial information contained in this report for periods prior to June 20, 2014, represents operational results achieved while the Funds were a part of the Predecessor Investment Company.
NOTE 2. SIGNIFICANT ACCOUNTING POLICIES
The following is a summary of significant accounting policies followed by each Fund in the preparation of its financial statements. The Funds are investment companies and accordingly follow the investment company accounting and reporting guidance of the Financial Accounting Standards Board (“FASB”) Accounting Standards Codification Topic 946 applicable to investment companies.
Securities Valuations – All investments in securities are recorded at their estimated fair value as described in Note 3.
Foreign Currency – Investment securities denominated in foreign currencies are translated into U.S. dollar amounts at the date of valuation. Purchases and sales of investment securities and income and expense items denominated in foreign currencies are translated into U.S. dollar amounts on the respective dates of such transactions. Reported net realized foreign exchange gains or losses arise from currency gains or losses realized between the trade and settlement dates on securities transactions, and the difference between the amounts of dividends, interest and foreign withholding taxes recorded on the Funds’ books and the U.S. dollar equivalent of the amounts actually received or paid. The Funds do not isolate that portion of the results of operations resulting from changes in foreign exchange rates on investments from the fluctuations arising from changes in market prices of securities. Such fluctuations are included with the net realized and unrealized gain or loss from investments.
Reverse Convertible Bonds – The Funds may invest in reverse convertible notes, which are short-term notes (i.e., with maturities of one year or less) that are linked to individual equity securities. These notes make regular interest payments by the issuer, but also have a put option attached, giving the issuer the right to exercise that option only if the price of the related security drops below a stated price.
Structured notes, such as reverse convertible notes, are subject to a number of fixed income risks including general market risk, interest rate risk, as well as the risk that the issuer on the note may fail to make interest and/ or principal payments when due, or may default on its obligations entirely. In addition, as a result of imbedded derivative features in these securities, structured notes generally are subject to more risk than investing in a simple note or bond issued by the same issuer.
32
IMS FAMILY OF FUNDS
NOTES TO THE FINANCIAL STATEMENTS – (continued)
June 30, 2017
NOTE 2. SIGNIFICANT ACCOUNTING POLICIES (continued)
Federal Income Taxes – The Funds make no provision for federal income or excise tax. The Funds intend to qualify each year as regulated investment companies (“RICs”) under subchapter M of the Internal Revenue Code of 1986, as amended, by complying with the requirements applicable to RICs and by distributing substantially all of their taxable income. The Funds also intend to distribute sufficient net investment income and net capital gains, if any, so that they will not be subject to excise tax on undistributed income and gains. If the required amount of net investment income or gains is not distributed, the Funds could incur a tax expense.
As of and during the fiscal year ended June 30, 2017, the Funds did not have a liability for any unrecognized tax benefits. The Funds recognize interest and penalties, if any, related to unrecognized tax benefits as income tax expense in the statement of operations. During the fiscal year ended June 30, 2017, the Funds did not incur any interest or penalties. The Funds are not subject to examination by U.S. federal tax authorities for tax years prior to 2014.
Expenses – Expenses incurred by the Trust that do not relate to a specific fund of the Trust are allocated to the individual funds based on each Fund’s relative net assets or another appropriate basis (as determined by the Board of Trustees (the “Board”)).
Security Transactions and Related Income – Each Fund follows industry practice and records security transactions on the trade date for financial reporting purposes. The first in, first out method is used for determining gains or losses for financial statements and income tax purposes. Dividend income is recorded on the ex-dividend date and interest income is recorded on an accrual basis. Dividend income from real estate investment trusts (REITS) and distributions from limited partnerships are recognized on the ex-date and included in dividend income. The calendar year-end classification of distributions received from REITS during the fiscal year are reported subsequent to year end; accordingly, the Funds estimate the character of REIT distributions based on the most recent information available. Income or loss from limited partnerships is reclassified in the components of net assets upon receipt of K-1’s. Withholding taxes on foreign dividends have been provided for in accordance with each Fund’s understanding of the applicable country’s tax rules and rates. Discounts and premiums on securities purchased are amortized or accreted using the effective interest method. For bonds that miss a scheduled interest payment, after the grace period, all interest accrued on the bond is written off and no additional interest will be accrued. However, for illiquid bonds or those bonds fair valued by the Advisor, if the Advisor’s research indicates a high recovery rate in restructuring, and the Fund expects to hold the bond until the issue is restructured, past due interest may not be written off in its entirety. The ability of issuers of debt securities held by the Funds to meet their obligations may be affected by economic and political developments in a specific country or region.
Use of Estimates – The preparation of financial statements in conformity with U.S. generally accepted accounting principles (“GAAP”) requires management to make estimates and assumptions that affect the reported amounts of assets and liabilities and disclosure of contingent assets and liabilities at the date of the financial statements and the reported amounts of revenues and expenses during the reporting period. Actual results could differ from those estimates.
33
IMS FAMILY OF FUNDS
NOTES TO THE FINANCIAL STATEMENTS – (continued)
June 30, 2017
NOTE 2. SIGNIFICANT ACCOUNTING POLICIES (continued)
Dividends and Distributions – The Income Fund intends to distribute substantially all of its net investment income as dividends to its shareholders on a monthly basis. The Value Fund and Dividend Growth Fund intend to distribute substantially all of their net investment income as dividends to their shareholders on at least an annual basis. Each Fund intends to distribute its net realized long-term capital gains and its net realized short-term capital gains at least once a year. Dividends to shareholders, which are determined in accordance with income tax regulations, are recorded on the ex-dividend date. The treatment for financial reporting purposes of distributions made to shareholders during the year from net investment income or net realized capital gains may differ from their ultimate treatment for federal income tax purposes. These differences are caused primarily by differences in the timing of the recognition of certain components of income, expense or realized capital gain for federal income tax purposes. Where such differences are permanent in nature, they are reclassified in the components of the net assets based on their ultimate characterization for federal income tax purposes. Any such reclassifications will have no effect on net assets, results of operations or net asset values per share of the Funds. No such reclassifications were made during the year ended June 30, 2017.
For the year ended June 30, 2017 the Funds made the following reclassifications to increase (decrease) the components of net assets. The reclassifications are primarily attributable to the expiration of capital loss carryforwards and tax treatment of losses incurred on foreign currency transactions.
Fund | Paid in Capital | Accumulated Undistributed Net Investment Income (Loss) | Accumulated Net Realized Gain (Loss) on Investments | |||||||||
| Value Fund | $ | – | $ | – | $ | – | ||||||
| Income Fund | (7,045,965 | ) | (12,401 | ) | 7,058,366 | |||||||
| Dividend Growth Fund | – | – | – | |||||||||
NOTE 3. SECURITIES VALUATION AND FAIR VALUE MEASUREMENTS
Fair value is defined as the price that a Fund would receive upon selling an investment in an orderly transaction to an independent buyer in the principal or most advantageous market of the investment. GAAP establishes a three-tier hierarchy to maximize the use of observable market data and minimize the use of unobservable inputs and to establish classification of fair value measurements for disclosure purposes.
Inputs refer broadly to the assumptions that market participants would use in pricing the asset or liability, including assumptions about risk (the risk inherent in a particular valuation technique used to measure fair value such as a pricing model and/or the risk inherent in the inputs to the valuation technique). Inputs may be observable or unobservable. Observable inputs are inputs that reflect the assumptions market participants would use in pricing the asset or liability developed based on market data obtained from sources independent of the reporting entity. Unobservable inputs are inputs that reflect the reporting entity’s own assumptions about the assumptions market participants would use in pricing the asset or liability developed based on the best information available in the circumstances.
34
IMS FAMILY OF FUNDS
NOTES TO THE FINANCIAL STATEMENTS – (continued)
June 30, 2017
NOTE 3. SECURITIES VALUATION AND FAIR VALUE MEASUREMENTS (continued)
Various inputs are used in determining the value of each Fund’s investments. These inputs are summarized in the three broad levels listed below.
| • | Level 1 – quoted prices in active markets for identical securities |
| • | Level 2 – other significant observable inputs (including, but not limited to, quoted prices for an identical security in an inactive market, quoted prices for similar securities, interest rates, prepayment speeds, credit risk, etc.) |
| • | Level 3 – significant unobservable inputs (including each Fund’s own assumptions in determining fair value of investments based on the best information available) |
The inputs used to measure fair value may fall into different levels of the fair value hierarchy. In such cases, for disclosure purposes, the level in the fair value hierarchy within which the fair value measurement falls in its entirety, is determined based on the lowest level input that is significant to the fair value measurement in its entirety.
A description of the valuation techniques applied to each Fund’s major categories of assets measured at fair value on a recurring basis follows:
Equity securities, including common stock, real estate investment trusts, and preferred securities, are generally valued by using market quotations, but may be valued on the basis of prices furnished by a pricing service when the Advisor believes such prices more accurately reflect the fair value of such securities. Securities that are traded on any stock exchange are generally valued by the pricing service at the last quoted sale price. Lacking a last sale price, an exchange traded security is generally valued by the pricing service at its last bid price.
Securities traded in the NASDAQ over-the-counter market are generally valued by the pricing service at the NASDAQ Official Closing Price. When using the market quotations or close prices provided by the pricing service and when the market is considered active, the security will be classified as a Level 1 security. Sometimes, an equity security owned by a Fund will be valued by the pricing service with factors other than market quotations or when the market is considered inactive. When this happens, the security will be classified as a Level 2 security.
Investments in mutual funds, including money market mutual funds, are generally priced at the ending net asset value (NAV) provided by the service agent of the mutual funds. These securities will be categorized as Level 1 securities.
35
IMS FAMILY OF FUNDS
NOTES TO THE FINANCIAL STATEMENTS – (continued)
June 30, 2017
NOTE 3. SECURITIES VALUATION AND FAIR VALUE MEASUREMENTS (continued)
Fixed income securities such as corporate bonds, municipal bonds, reverse convertible bonds, and foreign bonds denominated in U.S. dollars, when valued using market quotations in an active market, will be categorized as Level 1 securities. However, they may be valued on the basis of prices furnished by a pricing service when the Advisor believes such prices more accurately reflect the fair value of such securities. A pricing service utilizes electronic data processing techniques based on yield spreads relating to securities with similar characteristics to determine prices for normal institutional-size trading units of debt securities without regard to sale or bid prices. These securities will generally be categorized as Level 2 securities. If the Advisor decides that a price provided by the pricing service does not accurately reflect the fair value of the securities, when prices are not readily available from a pricing service, or when certain restricted or illiquid securities are being valued, securities are valued at fair value as determined in good faith by the Advisor, in conformity with guidelines adopted by and subject to review of the Board and the Fair Valuation Committee. These securities will be categorized as Level 3 securities. See the chart on page 38 for more information on the inputs used by the Advisor in determining fair value of such Level 3 securities. The Advisor has used inputs such as evaluated broker quotes in inactive markets, actual trade prices in inactive markets, present value of expected future cash flows, terms of expected bond restructurings, and yields on similar securities in determining the fair value of such Level 3 securities.
Short-term investments in fixed income securities (those with maturities of less than 60 days when acquired) are valued by using the amortized cost method of valuation, which the Board has determined will represent fair value. These securities will be classified as Level 2 securities.
In accordance with the Trust’s good faith pricing guidelines, the Advisor is required to consider all appropriate factors relevant to the value of securities for which it has determined other pricing sources are not available or reliable as described above. No single standard exists for determining fair value, because fair value depends upon the circumstances of each individual case. As a general principle, the current fair value of an issue of securities being valued by the Advisor would appear to be the amount which the owner might reasonably expect to receive for them upon their current sale. Methods which are in accordance with this principle may, for example, be based on (i) a multiple of earnings; (ii) a discount from market of a similar freely traded security (including a derivative security or a basket of securities traded on other markets, exchanges or among dealers); or (iii) yield to maturity with respect to debt issues, or a combination of these and other methods. Good faith pricing is permitted if, in the Advisor’s opinion, the validity of market quotations appears to be questionable based on factors such as evidence of a thin market in the security based on a small number of quotations, a significant event occurs after the close of a market but before a Fund’s NAV calculation that may affect a security’s value, or the Advisor is aware of any other data that calls into question the reliability of market quotations. Good faith pricing may also be used in instances when the bonds in which the Funds invest may default or otherwise cease to have market quotations readily available.
The Trustees of the 360 Funds adopted the M3Sixty Consolidated Valuation Procedures on June 24, 2014, which established a Valuation Committee to work with the Advisor and report to the Board on securities being fair valued or manually priced. The Lead Chairman and Trustee for the 360 Funds, along with the Fund Principal Financial Officer and Chief Compliance Officer are members of the Valuation Committee which meets at least monthly or, as required, to review the interim actions and coordination with the Advisor in pricing fair valued securities, and consideration of any unresolved valuation issue or a request to change the methodology for manually pricing a security. In turn, the Lead Chairman provides updates to the Board at the regularly scheduled board meetings as well as interim updates to the board members on substantive changes in a daily valuation or methodology issue.
36
IMS FAMILY OF FUNDS
NOTES TO THE FINANCIAL STATEMENTS – (continued)
June 30, 2017
NOTE 3. SECURITIES VALUATION AND FAIR VALUE MEASUREMENTS (continued)
The following is a summary of the inputs used to value the Value Fund’s investments as of June 30, 2017:
| Valuation Inputs | ||||||||||||||||
| Investments | Level 1 – Quoted Prices in Active Markets | Level 2 – Other Significant Observable Inputs | Level 3 – Significant Unobservable Inputs | Total | ||||||||||||
| Common Stocks* | $ | 40,685,582 | $ | – | $ | – | $ | 40,685,582 | ||||||||
| Money Market Securities | 35,180 | – | – | 35,180 | ||||||||||||
| Total | $ | 40,720,762 | $ | – | $ | – | $ | 40,720,762 | ||||||||
| * | Refer to the Schedule of Investments for industry classifications. |
The Value Fund did not hold any investments at any time during the reporting period in which significant unobservable inputs were used in determining fair value; therefore, no reconciliation of Level 3 securities is included for this reporting period. The Value Fund did not hold any derivative instruments during the reporting period. During the year ended June 30, 2017, there were no transfers between levels. The Value Fund recognizes transfers between fair value hierarchy levels at the end of the reporting period.
The following is a summary of the inputs used to value the Income Fund’s investments as of June 30, 2017:
| Valuation Inputs | ||||||||||||||||
| Investments | Level 1 – Quoted Prices in Active Markets | Level 2 – Other Significant Observable Inputs | Level 3 – Significant Unobservable Inputs | Total | ||||||||||||
| Common Stocks* | $ | 1,776,316 | $ | – | $ | – | $ | 1,776,316 | ||||||||
| Corporate Bonds | – | 14 | 107,545 | 107,559 | ||||||||||||
| Foreign Bonds | – | 565,941 | 84,495 | 650,436 | ||||||||||||
| Structured Notes | – | 3,145,657 | – | 3,145,657 | ||||||||||||
| Promissory Notes | – | – | 75,000 | 75,000 | ||||||||||||
| Money Market Securities | 667 | – | – | 667 | ||||||||||||
| Total | $ | 1,776,983 | $ | 3,711,612 | $ | 267,040 | $ | 5,755,635 | ||||||||
37
IMS FAMILY OF FUNDS
NOTES TO THE FINANCIAL STATEMENTS – (continued)
June 30, 2017
NOTE 3. SECURITIES VALUATION AND FAIR VALUE MEASUREMENTS (continued)
Following is a reconciliation of investments in which significant unobservable inputs (Level 3) were used in determining fair value for the Income Fund:
| Balance as of June 30, 2016 | Realized gain (loss) | Amortization | Change in unrealized appreciation (depreciation) | Purchases | Sales | Transfers in to Level 3 | Transfers out of Level 3 | Balance as of June 30, 2017 | ||||||||||||||||||||||||||||
| Corporate Bonds | $ | 358,989 | $ | (1,287,140 | ) | $ | – | $ | 1,149,360 | $ | – | $ | (113,664 | ) | $ | – | $ | – | $ | 107,545 | ||||||||||||||||
| Foreign Bonds | 202,582 | (1,015,539 | ) | (48,232 | ) | 948,559 | – | (2,875 | ) | – | – | 84,495 | ||||||||||||||||||||||||
| Promissory Notes | 392,025 | – | – | (317,025 | ) | – | – | – | – | 75,000 | ||||||||||||||||||||||||||
| Total | $ | 953,596 | $ | (2,302,679 | ) | $ | (48,232 | ) | $ | 1,780,894 | $ | – | $ | (116,539 | ) | $ | – | $ | – | $ | 267,040 | |||||||||||||||
The following is a quantitative summary of the techniques and inputs used to fair value the Level 3 securities as of June 30, 2017:
Quantitative information about Level 3 fair value measurements
| Fair value at 06/30/2017 | Valuation technique(s) | Unobservable input | Range (Weighted Average) | ||||||
| Corporate Bonds | $ | 107,545 | Asset based | Estimated liquidation value of issuers underlying assets (1) | 22%-23% of outstanding debt | ||||
| Foreign Bonds | 84,495 | Asset based | Estimated liquidation value of issuers underlying assets (1) | 35%-37% of outstanding debt | |||||
| Marketability discount | 35% | ||||||||
| Promissory Notes | 75,000 | Asset based | Estimated liquidation value of issuers underlying assets (1) | 8%-12% of outstanding debt | |||||
| (1) | A significant increase in this input in isolation would result in a significantly higher fair value measurement. |
The total change in unrealized appreciation (depreciation) attributable to Level 3 investments still held at June 30, 2017 was $(411,582) as shown below.
| Total Change in Unrealized Appreciation (Depreciation) | ||||
| Corporate Bonds | $ | (47,702 | ) | |
| Foreign Bonds | (46,855 | ) | ||
| Promissory Notes | (317,025 | ) | ||
| Total | $ | (411,582 | ) | |
The Income Fund did not hold any derivative instruments during the year ended June 30, 2017. See reconciliation of investments for Level 3 securities in chart above. The Income Fund recognizes transfers between fair value hierarchy levels at the end of the reporting period.
There were no transfers of assets between levels during the year ended June 30, 2017 for the Income Fund.
38
IMS FAMILY OF FUNDS
NOTES TO THE FINANCIAL STATEMENTS – (continued)
June 30, 2017
NOTE 3. SECURITIES VALUATION AND FAIR VALUE MEASUREMENTS (continued)
The following is a summary of the inputs used to value the Dividend Growth Fund’s investments as of June 30, 2017:
| Valuation Inputs | ||||||||||||||||
| Investments | Level 1 – Quoted Prices in Active Markets | Level 2 – Other Significant Observable Inputs | Level 3 – Significant Unobservable Inputs | Total | ||||||||||||
| Common Stocks* | $ | 9,780,934 | $ | – | $ | – | $ | 9,780,934 | ||||||||
| Money Market Securities | 73,790 | – | – | 73,790 | ||||||||||||
| Total | $ | 9,854,724 | $ | – | $ | – | $ | 9,854,724 | ||||||||
| * | Refer to the Schedule of Investments for industry classifications. |
The Dividend Growth Fund did not hold any investments at any time during the reporting period in which significant unobservable inputs were used in determining fair value; therefore, no reconciliation of Level 3 securities is included for this reporting period. During the year ended June 30, 2017, there were no transfers between levels. The Dividend Growth Fund recognizes transfers between fair value hierarchy levels at the end of the reporting period.
NOTE 4. FEES AND OTHER TRANSACTIONS WITH AFFILIATES
The Advisor serves as investment advisor to the Funds pursuant to an Investment Advisory Agreement (the “Advisory Agreement”) with the Trust. Pursuant to the Advisory Agreement, the Advisor manages the operations of the Funds and manages the Funds’ investments in accordance with the stated policies of the Funds, subject to approval of the Board of Trustees.
In addition, the Funds have entered into an Expense Limitation Agreement under which the Advisor has agreed to waive or reduce its fees and to assume other expenses of the Funds, if necessary, in an amount that limits annual operating expenses (exclusive of interest, taxes, brokerage fees and commissions, acquired fund fees and expenses, shareholder servicing fees, extraordinary expenses, and, dividend and interest expenses in connection with securities sold short) to not more than 1.95% of the Funds’ average daily net assets through November 1, 2017, subject to the Advisor’s right to recoup payments on a rolling three-year basis, so long as the payments would not exceed the 1.95% expense cap.
39
IMS FAMILY OF FUNDS
NOTES TO THE FINANCIAL STATEMENTS – (continued)
June 30, 2017
Under the terms of the Advisory Agreement, the Funds are obligated to pay the Advisor a fee computed and accrued daily and paid monthly. Please see the chart below for information regarding the management fee rates, management fees earned, fee waivers and recoupments, and expenses reimbursed during the year ended June 30, 2017, as well as amounts due to the Advisor at June 30, 2017.
| Value Fund | Income Fund | Dividend Growth Fund | ||||||||||
| Management fee under Advisory Agreement (as a percentage of average net assets) | 1.21 | % | 1.26 | % | 1.26 | % | ||||||
| Expense limitation (as a percentage of average net assets) | 1.95 | % | 1.95 | % | 1.95 | % | ||||||
| Management fees earned | $ | 484,779 | $ | 92,013 | $ | 117,392 | ||||||
| Fees recouped (waived) and (expenses reimbursed) | $ | – | $ | (69,739 | ) | $ | (36,744 | ) | ||||
| Payable to Advisor | $ | 40,753 | $ | 723 | $ | 10,888 | ||||||
Each waiver or reimbursement by the Advisor is subject to repayment by the Funds within the three fiscal years following the fiscal year in which the particular expense was incurred, provided that the Funds are able to make the repayment without exceeding the expense limitations in effect at the time the expenses were waived or currently in effect, whichever is lower as described above.
The amounts subject to repayment by the Income Fund and Dividend Growth Fund, pursuant to the aforementioned conditions, at June are as follows:
| Fund | Amount | Expires June 30, | ||||||
| Income Fund | $ | 36,051 | 2019 | |||||
| Income Fund | $ | 69,739 | 2020 | |||||
| Dividend Growth Fund | $ | 52,469 | 2018 | |||||
| Dividend Growth Fund | $ | 37,010 | 2019 | |||||
| Dividend Growth Fund | $ | 36,744 | 2020 | |||||
There are no amounts subject to repayment by the Value Fund.
The Trust has entered into an Investment Company Services Agreement (the “Services Agreement”) with M3Sixty Administration, LLC (“M3Sixty”). Under the Services Agreement, M3Sixty is responsible for a wide variety of functions, including but not limited to: (a) Fund accounting services; (b) financial statement preparation; (c) valuation of the Funds’ portfolio securities; (d) pricing the Funds’ shares; (e) assistance in preparing tax returns; (f) preparation and filing of required regulatory reports; (g) communications with shareholders; (h) coordination of Board and shareholder meetings; (i) monitoring the Funds’ legal compliance; (j) maintaining shareholder account records.
40
IMS FAMILY OF FUNDS
NOTES TO THE FINANCIAL STATEMENTS – (continued)
June 30, 2017
For the year ended June 30, 2017, the Funds accrued servicing fees, including out of pocket expenses, as follows:
| Fund | Service Fees | |||
| Value Fund | $ | 111,148 | ||
| Income Fund | 33,625 | |||
| Dividend Growth Fund | 41,020 | |||
Certain officers and a Trustee of the Trust are also employees and/or officers of M3Sixty.
Matrix Capital Group, Inc. (the “Distributor”) acted as the principal distributor of the Funds. Pursuant to a New Distribution Agreement (“New Agreement”), Matrix 360 Distributors, LLC (the “M3SixtyD”) replaced Matrix Capital Group, Inc. as Distributor to the Funds effective March 3, 2017. Transition of the distribution services to M3SixtyD required an in-person meeting of the Board of Trustees to review and approve the New Agreement and M3SixtyD as the new Distributor. The approval of the New Agreement took place at the January 11, 2017 meeting of the Board of Trustees and became effective March 3, 2017. There were no payments made to the Distributor or M3Sixty D by the Funds for year ended June 30, 2017.
The Distributor and M3SixtyD are not affiliated with the Advisor. The Distributor and M3SixtyD are affiliates of M3Sixty. Officers of the Trust are also employees and/or officers of M3SixtyD.
NOTE 5. LINE OF CREDIT
During the year ended June 30, 2017, the IMS Funds each respectively entered into an agreement with The Huntington National Bank, the custodian of the Funds’ investments, to open secured lines of credit secured by the Funds’ investments. Borrowings under this agreement bear interest at LIBOR plus 1.500%. Maximum borrowings for each Fund are lesser of $1,500,000 or 10.000% of the Fund’s daily market value. Total borrowings for the Funds cannot exceed $1,500,000 at any time. The current agreement expires on June 11, 2018.
| Value Fund | Income Fund | Dividend Growth Fund | ||||||||||
| Maximum available bank line of credit as of June 30, 2017 | $ | 1,500,000 | $ | 575,564 | $ | 985,472 | ||||||
| Average borrowings for the year | $ | 40 726 | $ | 26,773 | $ | 4,611 | ||||||
| Average interest rate for the year | 2.218 | % | 2.218 | % | 2.218 | % | ||||||
| Highest balance drawn during the year | $ | 1,435,000 | $ | 515,000 | $ | 121,000 | ||||||
| Interest rate at June 30, 2017 | 2.576 | % | 2.576 | % | 2.576 | % | ||||||
| Line of credit borrowing at June 30, 2017 | $ | – | $ | 81,000 | $ | – | ||||||
41
IMS FAMILY OF FUNDS
NOTES TO THE FINANCIAL STATEMENTS – (continued)
June 30, 2017
For the year ended June 30, 2017, purchases and sales of investment securities, other than short-term investments and short-term U.S. government obligations were as follows:
| Value Fund | Income Fund | Dividend Growth Fund | ||||||||||
| Purchases | ||||||||||||
| U.S. Government Obligations | $ | – | $ | – | $ | – | ||||||
| Other | 33,190,211 | 34,570,796 | 3,033,003 | |||||||||
| Sales | ||||||||||||
| U.S. Government Obligations | $ | – | $ | – | $ | – | ||||||
| Other | 34,334,506 | 36,592,463 | 3,130,434 | |||||||||
As of June 30, 2017, the net unrealized appreciation (depreciation) of investments for tax purposes was as follows:
| Value Fund | Income Fund | Dividend Growth Fund | ||||||||||
| Gross Appreciation | $ | 8,213,333 | $ | 19,112 | $ | 1,629,729 | ||||||
| Gross (Depreciation) | (2,916,017 | ) | (4,761,046 | ) | (372,801 | ) | ||||||
| Net Appreciation (Depreciation) on Investments | $ | 5,297,316 | $ | (4,741,934 | ) | $ | 1,256,928 | |||||
| Tax Cost | $ | 35,423,446 | $ | 10,497,569 | $ | 8,597,796 | ||||||
For the Value Fund, the difference between book basis and tax basis unrealized appreciation (depreciation) of investments is primarily attributable to the tax deferral of losses on wash sales.
NOTE 7. ESTIMATES
The preparation of financial statements in conformity with GAAP requires management to make estimates and assumptions that affect the reported amounts of assets and liabilities and disclosure of contingent assets and liabilities at the date of the financial statements and the reported amounts of increases and decreases in net assets from operations during the reporting period. Actual results could differ from those estimates.
NOTE 8. BENEFICIAL OWNERSHIP
The beneficial ownership, either directly or indirectly, of more than 25% of the voting securities of a fund creates a presumption of control of the fund, under Section 2(a)(9) of the Investment Company Act of 1940. As of June 30, 2017, National Financial Securities Corp. (“National Financial”) held, for the benefit of its customers, 40.30% of the Value Fund, 30.10% of the Income Fund and 34.76% of the Dividend Growth Fund. As a result, National Financial may be deemed to control the Value Fund, Income Fund and Dividend Growth Fund. As of June 30, 2017, TD Ameritrade, Inc. (“Ameritrade”) held, for the benefit of its customers, 30.09% of the Value Fund and 51.25% of the Dividend Growth Fund. As a result, Ameritrade may be deemed to control the Value Fund and Dividend Growth Fund. It is not known whether Ameritrade or any of the underlying beneficial owners owned or controlled 25% or more of the voting securities of either the Value Fund or Dividend Growth Fund.
42
IMS FAMILY OF FUNDS
NOTES TO THE FINANCIAL STATEMENTS – (continued)
June 30, 2017
Value Fund – For the fiscal year ended June 30, 2017, the Value Fund did not pay a distribution.
The tax characterization of distributions for the fiscal years ended June 30, 2017 and 2016 was as follows:
| Distributions paid from: | Fiscal Year Ended June 30, 2017 | Fiscal Year Ended June 30, 2016 | ||||||
| Ordinary Income | $ | – | $ | – | ||||
| Total Distributions paid | $ | – | $ | – | ||||
Income Fund – For the fiscal year ended June 30, 2017, the Income Fund paid monthly distributions totaling $0.260 per share.
The tax characterization of distributions for the fiscal years ended June 30, 2017 and 2016 was as follows:
| Distributions paid from: | Fiscal Year Ended June 30, 2017 | Fiscal Year Ended June 30, 2016 | ||||||
| Ordinary Income | $ | 620,984 | $ | 1,151,406 | ||||
| Total Distributions paid | $ | 620,984 | $ | 1,151,406 | ||||
Dividend Growth Fund – For the fiscal year ended June 30, 2017, the Dividend Growth Fund paid distributions totaling $0.090 per share.
The tax characterization of distributions for the fiscal years ended June 30, 2017 and 2016 was as follows:
| Distributions paid from: | Fiscal Year Ended June 30, 2017 | Fiscal Year Ended June 30, 2016 | ||||||
| Ordinary Income | $ | 60,595 | $ | 78,680 | ||||
| Total Distributions paid | $ | 60,595 | $ | 78,680 | ||||
The Funds’ tax basis distributable earnings are determined only at the end of each fiscal year. As of June 30, 2017, the Funds’ most recent fiscal year end, the components of distributable earnings (accumulated losses) on a tax basis were as follows:
| Value Fund | Income Fund | Dividend Growth Fund | ||||||||||
| Undistributed ordinary income | $ | 9,376 | $ | 4,639 | $ | 7,220 | ||||||
| Accumulated capital gains (losses) | 743,240 | (45,283,585 | ) | (825,662 | ) | |||||||
| Net unrealized appreciation (depreciation) | 5,297,316 | (4,741,934 | ) | 1,256,928 | ||||||||
| $ | 6,049,932 | $ | (50,020,880 | ) | $ | 438,486 | ||||||
43
IMS FAMILY OF FUNDS
NOTES TO THE FINANCIAL STATEMENTS – (continued)
June 30, 2017
NOTE 9. DISTRIBUTIONS TO SHAREHOLDERS (continued)
Under current law, capital losses and specified gains realized after October 31, and net investment losses realized after December 31 of a Fund’s fiscal year may be deferred and treated as occurring on the first business day of the following fiscal year for tax purposes. For disclosure purposes, these deferrals are included in “accumulated capital gains (losses)” above.
As of June 30, 2017, accumulated capital and other losses noted above consist of:
| Capital Loss Carryforwards | Post-October Capital Losses | Late Year Ordinary Losses | ||||||||||
| Value Fund | $ | – | $ | – | $ | – | ||||||
| Income Fund | 42,993,155 | 2,290,430 | – | |||||||||
| Dividend Growth Fund | 716,719 | 108,943 | – | |||||||||
NOTE 10. CAPITAL LOSS CARRYFORWARDS
At June 30, 2017, for federal income tax purposes, the Funds have capital loss carryforwards, in the following amounts:
| Value Fund | Income Fund | Dividend Growth Fund | ||||||||||
| No expiration – short term | $ | – | $ | 8,152,455 | $ | 72,096 | ||||||
| No expiration – long term | – | 8,053,068 | 27,853 | |||||||||
| Expires on June 30, 2018 | – | 24,109,306 | 616,770 | |||||||||
| Expires on June 30, 2019 | – | 2,678,326 | – | |||||||||
| $ | – | $ | 42,993,155 | $ | 716,719 | |||||||
Capital loss carryforwards are available to offset future realized capital gains. To the extent that these carryforwards are used to offset future capital gains, it is probable that the amount offset will not be distributed to shareholders. Non-expiring carryforwards must be utilized prior to the utilization of carryforwards with expiration dates. During the year ended June 30, 2017, the Value Fund, Income Fund and Dividend Growth Fund utilized capital loss carryforwards of $798,596, $0 and $0, respectively. Capital loss carryforwards of $7,045,965 expired in the Income Fund.
NOTE 11. RESTRICTED SECURITIES
Restricted securities are securities that may only be resold upon registration under federal securities laws or in transactions exempt from such registration. In some cases, the issuer of restricted securities has agreed to register such securities for resale, at the issuer’s expense, either upon demand by a fund or in connection with another registered offering of the securities. Many restricted securities may be resold in the secondary market in transactions exempt from registration. Such restricted securities may be determined to be liquid. The Funds will not incur any registration costs upon such resale. The Income Fund’s restricted securities are valued at the price provided by pricing services or dealers in the secondary market or, if no market prices are available, at the fair value price as determined by the Fund’s Advisor or pursuant to the Fund’s fair value policy, subject to oversight by the Board of Trustees. The Income Fund has acquired securities, the sale of which is restricted under Rule 144A or Regulation S of the Securities Act of 1933. It is possible that the fair value price may differ significantly from the amount that may ultimately be realized in the near term, and the difference could be material.
44
IMS FAMILY OF FUNDS
NOTES TO THE FINANCIAL STATEMENTS – (continued)
June 30, 2017
NOTE 11. RESTRICTED SECURITIES (continued)
At June 30, 2017, the aggregate value of such securities amounted to $725,436 and the value amounts to 13.00% of the net assets of the Income Fund.
| Acquisition Date | Shares or Principal Amount | Amortized Cost | Fair Value | ||||||||||
| Aequitas Commercial Finance, LLC Secured Subordinated Promissory Note, 11.000%, 07/28/2019, 144A | 7/23/2015 | 750,000 | $ | 750,000 | $ | 75,000 | |||||||
| Cash Store Financial Services, Inc. 11.500%, 01/31/2017, 144A | 5/21/2012(a) | 1,289,000 | 1,120,977 | 84,495 | |||||||||
| Newland International Properties Corp., 9.500%, 07/03/2017, 144A | 6/3/2011 | 572,479 | 555,243 | 143,120 | |||||||||
| Newland International Properties Corp., 9.500%, 07/03/2017, Reg S | 6/3/2011 | 349,168 | 338,656 | 87,292 | |||||||||
| Panama Canal Railway Co., 7.000%, 11/01/2026, Reg S | 2/27/2013 | 328,950 | 319,931 | 335,529 | |||||||||
| $ | 3,084,807 | $ | 725,436 | ||||||||||
(a) | Purchased on various dates beginning 05/21/2012. |
NOTE 12. SUBSEQUENT EVENTS
On July 17, 2017, the Income Fund declared a dividend of $38,083, which was payable on July 17, 2017. On August 15, 2017, the Income Fund declared a dividend of $19,213, which was payable on August 15, 2017.
On August 4, 2017, the Income Fund received $107,641 as proceeds for the liquidation of Thornton Drilling Co., 5.000%, 06/15/2018 corporate bond (“Thornton”), resulting in a realized loss of $346,193. Thornton was categorized as a Level 3 investment at June 30, 2017 and was valued at $107,545, representing approximately 40.27% of the value of the Income Fund’s Level 3 investments and 1.93% of the Income Fund’s net assets.
Management has evaluated subsequent events through the issuance of the financial statements and has noted no other such events that would require disclosure.
NOTE 13. AEQUITAS COMMERCIAL FINANCE, LLC
On March 10, 2016, the SEC filed a complaint against, Aequitas Commercial Finance, LLC, an issuer of securities held by the Strategic Income Fund. Subsequently a receiver was appointed over this issuer and its related entities. Since the complaint was filed and the issuer defaulted on interest payments, the Fair Valuation Committee of the Fund, while performing its regular review of valuation, has concluded that reductions in the valuation of the security were warranted and has written off all accrued interest and has not accrued interest since February 17, 2016. The Board and Fair Valuation Committee are monitoring the securities and potential impact on valuation and income. As of June 30, 2017, the Fair Valuation Committee has determined the security is stated at the best estimate of fair value and actual results could differ from that estimate
45
IMS FAMILY OF FUNDS
NOTES TO THE FINANCIAL STATEMENTS – (continued)
June 30, 2017
NOTE 14. NEW ACOUNTING PROUNOUNCEMENT
In October 2016, the U.S. Securities and Exchange Commission (“SEC”) issued a new rule, Investment Company Reporting Modernization, which, among other provisions, amends Regulation S-X to require standardized, enhanced disclosures, particularly related to derivatives, in investment company financial statements. The compliance date for the amendments to Regulation S-X is August 1, 2017. Management has evaluated the impact that the adoption of the amendments to Regulation S-X will have on the Funds’ financial statements and related disclosures. Any required changes will be implemented for interim and annual periods after August 1, 2017.
46
REPORT OF INDEPENDENT REGISTERED PUBLIC ACCOUNTING FIRM
To the Shareholders and Board of Trustees of
IMS Family of Funds, each a Series of the 360 Funds
We have audited the accompanying statements of assets and liabilities of IMS Family of Funds, comprising of IMS Capital Value Fund, IMS Strategic Income Fund and IMS Dividend Growth Fund, (the “Funds”) each a series of the 360 Funds, including the schedules of investments, as of June 30, 2017 and the related statements of operations, the statement of cash flows for the IMS Strategic Income Fund, the statements of changes in net assets, and the financial highlights for the year then ended. The statement of changes in net assets for the year ended June 30, 2016 and the financial highlights for each of the four years in the period then ended, were audited by other auditors whose report dated August 29, 2016, contained an unmodified opinion on the financial statements and financial highlights. These financial statements and financial highlights are the responsibility of the Funds’ management. Our responsibility is to express an opinion on these financial statements and financial highlights based on our audits.
We conducted our audit in accordance with the standards of the Public Company Accounting Oversight Board (United States). Those standards require that we plan and perform the audit to obtain reasonable assurance about whether the financial statements and financial highlights are free of material misstatement. The Funds are not required to have, nor were we engaged to perform, an audit of its internal control over financial reporting. Our audit included consideration of internal control over financial reporting as a basis for designing audit procedures that are appropriate in the circumstances, but not for the purpose of expressing an opinion on the effectiveness of the Funds’ internal control over financial reporting. Accordingly, we express no such opinion. An audit also includes examining, on a test basis, evidence supporting the amounts and disclosures in the financial statements, assessing the accounting principles used and significant estimates made by management, as well as evaluating the overall financial statement presentation. Our procedures included confirmation of securities and cash owned as of June 30, 2017, by correspondence with the custodian and brokers. We believe that our audit provides a reasonable basis for our opinion.
In our opinion, the financial statements and financial highlights referred to above present fairly, in all material respects, the financial positions of the Funds as of June 30, 2017, the results of their operations for the year then ended, the cash flows for the IMS Strategic Income Fund, the changes in their net assets and the financial highlights for the year then ended, in conformity with accounting principles generally accepted in the United States of America.
Abington, Pennsylvania August 24, 2017 |  |
47
TRUSTEES AND OFFICERS – (Unaudited)
The Trustees are responsible for the management and supervision of the Funds. The Trustees approve all significant agreements between the Trust, on behalf of the Funds, and those companies that furnish services to the Funds; review performance of the Funds; and oversee activities of the Funds. This section provides information about the persons who serve as Trustees and Officers to the Trust and Funds, respectively. The Statement of Additional Information for each Fund includes additional information about the Trustees and officers and is available, without charge, upon request by calling the Funds toll-free at (800) 934-5550.
Trustees and Officers. Following are the Trustees and Officers of the Trust, their age and address, their present position with the Trust or the Funds, and their principal occupation during the past five years. As described above under “Description of the Trust”, each of the Trustees of the Trust will generally hold office indefinitely. The Officers of the Trust will hold office indefinitely, except that: (1) any Officer may resign or retire and (2) any Officer may be removed any time by written instrument signed by at least two-thirds of the number of Trustees prior to such removal. In case a vacancy or an anticipated vacancy on the Board of Trustees shall for any reason exist, the vacancy shall be filled by the affirmative vote of a majority of the remaining Trustees, subject to certain restrictions under the 1940 Act. Those Trustees who are “interested persons” (as defined in the 1940 Act) by virtue of their affiliation with either the Trust or the Advisor, are indicated in the table. The address of each trustee and officer is 4300 Shawnee Mission Parkway, Suite 100, Fairway, KS 66205.
| Name and Year of Birth | Position(s) Held with Trust | Length of Service | Principal Occupation(s) During Past 5 Years | Number of Series Overseen | Other Directorships During Past 5 Years |
| Independent Trustees | |||||
Art Falk 1937 | Trustee and Independent Chairman | Since 2011 | Retired. President, Murray Hill Financial Marketing, (financial marketing consultant) (1990–2012). | Seven | None |
Thomas Krausz 1944 | Trustee | Since 2011 | Mr. Krausz has been an independent management consultant to private enterprises since 2007. | Seven | None |
Tom M. Wirtshafter 1954 | Trustee | Since 2011 | Senior Vice President, American Portfolios Financial Services, (broker- dealer), American Portfolios Advisors (investment adviser) (2009–Present). | Seven | None |
Gary DiCenzo 1962 | Trustee | Since 2014 | Chief Executive Officer, Cognios Capital (investment management firm) (2015–present); President and CEO, IMC Group, LLC (asset management firm consultant) (2010–2015). | Seven | None |
48
TRUSTEES AND OFFICERS – (Unaudited)
Name, Address and Year of Birth | Position(s) Held with Trust | Length of Service | Principal Occupation(s) During Past 5 Years | Number of Series Overseen | Other Directorships During Past 5 Years |
| Interested Trustee* | |||||
Randall K. Linscott 1971 | President | Since 2013 | Chief Executive Officer, M3Sixty Administration, LLC (2013–present); Chief Operating Officer, M3Sixty Administration LLC (2011–2013); Division Vice President, Boston Financial Data Services, (2005–2011). | Seven | None |
| Officers | |||||
Andras P. Teleki 1971 | Chief Compliance Officer and Secretary | Since 2015 | Chief Legal Officer, M3Sixty Administration, LLC, M3Sixty Holdings, LLC, Matrix 360 Distributors, LLC and M3Sixty Advisors, LLC (2015–present); Chief Compliance Officer and Secretary, M3Sixty Funds Trust (2016–present); Chief Compliance Officer and Secretary, WP Trust (2016-present); Secretary and Assistant Treasurer, Capital Management Investment Trust (2015–present); Partner, K&L Gates, (2009–2015). | N/A | N/A |
Brandon Byrd 1981 | Assistant Secretary and AML Officer | Since 2013 | Chief Operating Officer, M3Sixty Administration, LLC (2013-present); Anti-Money Laundering Compliance Officer, Monteagle Funds (2015-2016); Division Manager - Client Service Officer, Boston Financial Data Services (mutual find service provider) (2010-2012). | N/A | N/A |
Larnell D. Smith 1980 | Treasurer | Since July 2017 | Director of Fund Accounting & Administration, M3Sixty Administration, LLC (2017 to present); Assistant Vice President, State Street Bank (2017 – 2012). | N/A | N/A |
Larry E. Beaver, Jr. 1969 | Assistant Treasurer | Since 2007 | Fund Accounting, Administration and Tax Officer, M3Sixty Administration, LLC (2017 to present); Director of Fund Accounting & Administration, M3Sixty Administration, LLC (2005-2017). Chief Accounting Officer, Amidex Funds, Inc. (2003-present); Treasurer and Assistant Secretary, Capital Management Investment Trust (2008-2017). Treasurer, 360 Funds (2007-2017); Treasurer, M3Sixty Funds Trust (2015-2017); Treasurer, WP Trust (2015-2017); Treasurer and Chief Financial Officer, Monteagle Funds (2008-2016). | N/A | N/A |
| John H. Lively 1969 | Assistant Secretary | Since July 2017 | Attorney, The Law Offices of John H. Lively & Associates, Inc. (law firm), (March 2010 to present). | N/A | N/A |
| * | The Interested Trustee is an Interested Trustee because he is an officer and employee of the Administrator. |
49
TRUSTEES AND OFFICERS – (Unaudited)
Remuneration Paid to Trustees and Officers - Officers of the Trust and Trustees who are "interested persons" of the Trust or the Advisor will receive no salary or fees from the Trust. Officers of the Trust and interested Trustees do receive compensation directly from certain service providers to the Trust, including Matrix 360 Distributors, LLC and M3Sixty Administration LLC. Each Trustee who is not an “interested person” receives a fee of $1,500 each year plus $200 per Board or committee meeting attended. The Trust reimburses each Trustee and officer for his or her travel and other expenses relating to attendance at such meetings.
Name of Trustee1 | Aggregate Compensation From the IMS Family of Funds2 | Pension or Retirement Benefits Accrued As Part of Portfolio Expenses | Estimated Annual Benefits Upon Retirement | Total Compensation From the IMS Family of Funds Paid to Trustees2 |
| Independent Trustees | ||||
| Art Falk | $ 9,900 | None | None | $ 9,900 |
| Thomas Krausz | $ 6,900 | None | None | $ 6,900 |
| Tom M. Wirtshafter | $ 6,900 | None | None | $ 6,900 |
| Gary DiCenzo | $ 6,900 | None | None | $ 6,900 |
| Interested Trustee | ||||
| Randall K. Linscott | None | None | None | None |
1 | Each of the Trustees serves as a Trustee to three (3) IMS Family of Funds of the Trust. The Trust currently offers seven (7) series of shares. |
2 | Figures are for the year ended June 30, 2017. |
50
OTHER INFORMATION (Unaudited)
The Funds’ Statement of Additional Information (“SAI”) includes additional information about the trustees and is available without charge, upon request. You may call toll-free at (800) 934-5550 to request a copy of the SAI or to make shareholder inquiries.
A description of the policies and procedures that the Funds use to determine how to vote proxies relating to portfolio securities is available without charge, upon request, by calling (800) 934-5550; and on the Commission’s website at http://www.sec.gov.
Information regarding how the Funds voted proxies relating to portfolio securities during the most recent 12-month period ended June 30th is available without charge, upon request, by calling (800) 934-5550; and on the Commission’s website at http://www.sec.gov.
Shareholder Tax Information - The Funds are required to advise you within 60 days of the Fund’s fiscal year end regarding the federal tax status of distributions received by shareholders during the fiscal year. For the year ended, June 30, 2017, certain distributions paid by the Funds may be subject to a maximum tax rate of 20%. The Income Fund and Dividend Growth Fund intend to designate up to a maximum amount of $620,984 and $60,595, respectively, as taxed at a maximum rate of 20%. There were no distributions paid by the Value Fund.
Tax information is reported from the Funds’ fiscal year and not calendar year, therefore, shareholders should refer to their Form 1099-DIV or other tax information which will be mailed in 2018 to determine the calendar year amounts to be included on their 2017 tax returns. Shareholders should consult their own tax advisors.
51
BOARD APPROVAL OF THE INVESTMENT ADVISORY AGREEMENT BY AND BETWEEN THE TRUST AND IMS CAPITAL MANAGEMENT, INC.
At a meeting held on April 27, 2017, the Board of Trustees (the “Board”) considered the approval of the Investment Advisory Agreement (collectively referred to herein as the “Agreements”) between the Trust and IMS Capital Management, Inc. (“Adviser”) in regard to each of the IMS Capital Value Fund, IMS Strategic Income Fund and IMS Dividend Growth Fund (each a “Fund” and collectively, the “IMS Funds”).
Counsel reviewed with the Board a memorandum from Counsel and addressed to the Trustees that summarized, among other things, the fiduciary duties and responsibilities of the Board in reviewing and approving the renewal of the Investment Advisory Agreement (the “Advisory Agreement”) between the Trust and IMS (the “Adviser,” solely for the purposes of this portion of the minutes of the Meeting) with respect to the IMS Funds. A copy of this memorandum was circulated to the Trustees in advance of the Meeting. Counsel discussed with the Trustees the types of information and factors that should be considered by the Board in order to make an informed decision regarding the approval of the continuation of the Advisory Agreement, including the following material factors: (i) the nature, extent and quality of the services provided by the Adviser; (ii) the investment performance of the IMS Funds; (iii) the costs of the services to be provided and profits to be realized by the Adviser from the relationship with the IMS Funds; (iv) the extent to which economies of scale would be realized if the IMS Funds grow and whether advisory fee levels reflect those economies of scale for the benefit of the IMS Funds’ investors; and (v) the Adviser’s practices regarding possible conflicts of interest and other benefits derived by the Adviser.
In assessing these factors and reaching its decisions, the Board took into consideration information furnished for the Board’s review and consideration throughout the year at regular Board meetings, as well as information specifically prepared and/or presented in connection with the annual renewal process, including information presented to the Board in the Adviser’s presentation earlier in the Meeting. The Board requested and was provided with information and reports relevant to the annual renewal of the Advisory Agreement, including: (i) reports regarding the services and support provided to the IMS Funds and their shareholders by the Adviser; (ii) quarterly assessments of the investment performance of the IMS Funds from the Adviser; (iii) periodic commentary on the reasons for the performance; (iv) presentations by IMS Funds’ management addressing the Adviser’s investment philosophy, investment strategy, personnel and operations; (v) compliance and audit reports concerning the IMS Funds and the Adviser; (vi) disclosure information contained in the registration statement of the Trust and the Form ADV of the Adviser; and (vii) a memorandum from Counsel, that summarized the fiduciary duties and responsibilities of the Board in reviewing and approving the Advisory Agreement, including the material factors set forth above and the types of information included in each factor that should be considered by the Board in order to make an informed decision.
The Board also requested and received various informational materials including, without limitation: (i) documents containing information about the Adviser, including financial information, a description of personnel and the services provided to the IMS Funds, information on investment advice, performance, summaries of IMS Funds’ expenses, compliance program, current legal matters and other general information; (ii) comparative expense and performance information for other mutual funds with strategies similar to the IMS Funds; (iii) the anticipated effect of size on the IMS Funds’ performance and expenses; and (iv) benefits to be realized by the Adviser from its relationship with the IMS Funds. The Board did not identify any particular information that was most relevant to its consideration to approve the Advisory Agreement and each Trustee may have afforded different weight to the various factors.
52
| (1) | The nature, extent and quality of the services to be provided by the Adviser. |
In this regard, the Board considered the responsibilities the Adviser would have under the Advisory Agreement with respect to each of the IMS Funds. The Board reviewed the services to be provided by the Adviser to the IMS Funds including, without limitation: the Adviser’s processes for formulating investment recommendations and assuring compliance with the IMS Funds’ investment objectives and limitations; its coordination of services for the IMS Funds among the IMS Funds’ service providers, and the anticipated efforts to promote the IMS Funds, grow assets and assist in the distribution of IMS Funds’ shares. The Board considered: the Adviser’s staffing, personnel and methods of operating; the education and experience of the Adviser’s personnel; and Adviser’s compliance program, policies and procedures. After reviewing the foregoing and further information from the Adviser, the Board concluded that the quality, extent and nature of the services to be provided by the Adviser was satisfactory and adequate for the IMS Funds.
| (2) | Investment Performance of the IMS Funds and the Adviser. |
In considering the investment performance of the IMS Funds and the Adviser, the Trustees compared the short- and long-term performance of each IMS Fund with the performance of its benchmark index, or indices, as applicable, comparable funds with similar objectives and size managed by other investment advisors and comparable peer group indices (e.g., Morningstar category medians). The Trustees also considered the consistency of the Adviser’s management of each IMS Fund with its investment objective and policies. With regard to the IMS Capital Value Fund, the Board noted that the Fund had underperformed its category mean for the 1-year, 3-year, 5-year and 10-years periods ended March 31, 2017. The Board also consider recent performance for shorter periods of time. The Board also considered the performance of the IMS Capital Value Fund’s relative to its standard benchmark (the S&P 500® TR USD) and its category benchmark (the Russell Mid Cap TR USD), and noted that the IMS Capital Value Fund had underperformed for the 1-year, 3-year, 5-year and 10-year as of February 28, 2017. With regard to the IMS Strategic Income Fund, the Board noted that the IMS Strategic Income Fund significantly underperformed its category average for the 1-year, 3-year, 5-year and 10-year periods ended March 31, 2017. The Board also consider recent performance for shorter periods of time. The Board also considered the performance of the IMS Strategic Income Fund relative to its standard benchmark (the Morningstar Mod Tgt Risk TR USD) and its category benchmark (the Morningstar Mod Agg Tgt Risk TR USD), and noted that the IMS Strategic Income Fund underperformed for the 1-year, 3-year, 5-year and 10-year periods ended February 28, 2017. With regard to the IMS Dividend Growth Fund, the Board noted that the IMS Dividend Growth Fund outperformed its category average for the most recent 1-year period ended March 31, 2017, but underperformed for the 3-year, 5-year and 10-year periods ended March 31, 2017. The Board also consider recent performance for shorter periods of time. The Board also considered the performance of the IMS Dividend Growth Fund relative to its standard benchmark (the S&P 500® TR USD) and its category benchmark (the Russell 1000 Value TR USD), and noted that the IMS Dividend Growth Fund underperformed for the 1-year, 3-year, 5-year and 10-year periods ended February 28, 2017 except for the 1-year performance relative to the standard benchmark. The Board considered the reasons for the underperformance of each of the IMS Funds, and discussed the same with the Adviser’s management extensively to understand the drivers of the performance. Based on the foregoing, the Board concluded that the investment performance information presented for each of the IMS Funds was acceptable at this time although it noted that it was important for it to continue to monitor the performance closely.
53
| (3) | The costs of the services to be provided and profits to be realized by the Adviser from the relationship with the IMS Funds. |
In considering the costs of the services to be provided and profits to be realized by the Adviser from the relationship with the IMS Funds, the Trustees considered: the Adviser’s staffing, personnel and methods of operating; the financial condition of the Adviser and the level of commitment to the Adviser by the Adviser and its principals; the expected asset levels of the IMS Funds; and the projected overall expenses of the IMS Funds. The Trustees considered financial statements of the Adviser and discussed the financial stability and productivity of the firm. The Trustees considered the fees and expenses of the IMS Capital Value Fund (including the management fee) relative to its category. The Trustees noted that the management fee for the IMS Capital Value Fund was above the category average, but well within the range for the category that was considered. The Trustees next considered the fees and expenses of the IMS Strategic Income Fund (including the management fee) relative to its category. The Trustees noted that the management fee for the IMS Strategic Income Fund was above the category average, but well within the range for the category that was considered. The Trustees then considered the fees and expenses of the IMS Dividend Growth Fund (including the management fee) relative to its category. The Trustees noted that the management fee for the IMS Dividend Growth Fund was above the category average, but well within the range for the category that was considered Following this analysis and upon further consideration and discussion of the foregoing, the Board concluded that the fees paid to the Adviser by each of the IMS Funds was fair and reasonable.
| (4) | The extent to which economies of scale would be realized as the IMS Funds grow and whether advisory fee levels reflect these economies of scale for the benefit of the IMS Funds’ investors. |
In this regard, the Board considered the IMS Funds’ fee arrangements with the Adviser. The Trustees determined that although the management fee would stay the same as asset levels increased, the shareholders of the IMS Dividend Growth Fund and the IMS Strategic Income Fund would benefit from the expense limitation arrangement for such IMS Funds. The Trustees noted that while a breakpoint schedule in an advisory agreement could be beneficial, such a feature to the fee schedule only had benefits if the particular fund’s assets were sufficient to realize the effect of the breakpoint. The Trustees noted that obtaining lower expenses for the shareholders of the IMS Dividend Growth Fund and the IMS Strategic Income Fund would be realized immediately with the expense limitation arrangements. The Trustees noted that the assurance that the expense limitation arrangements in place were of value to that IMS Funds. The Trustees noted that the assets of the IMS Dividend Growth Fund and of the IMS Strategic Income Fund were at such levels that the expense limitation arrangements currently were providing benefits to the respective Fund’s shareholders. The Trustees noted that the IMS Capital Value Fund was currently operating at an expense level that was below the contractual cap and, as a result, that Fund did not actually enjoy similar benefits to the other IMS Funds associated with the expense limitation arrangement; however, the Trustees noted that the assurance of having the expense arrangement in place provided value to the Fund. The Trustees also noted that the IMS Funds would benefit from economies of scale under its agreements with some of its service providers other than the Adviser as fees that were in place with those other service providers were either fixed or essentially semi-fixed, and the Board considered the Adviser’s efforts to work with M3Sixty to secure such arrangements for the IMS Funds. Following further discussion of the IMS Funds’ expected asset levels, expectations for growth and levels of fees, the Board determined that the IMS Funds’ fee arrangements, in light of all the facts and circumstances, were fair and reasonable and that the expense limitation arrangement provided potential savings or protection for the benefit of the IMS Dividend Growth Fund’s and the IMS Strategic Income Fund’s investors.
54
| (5) | Possible conflicts of interest and benefits derived by the Adviser. |
In considering the Adviser’s practices regarding conflicts of interest, the Trustees evaluated the potential for conflicts of interest and considered such matters as: the experience and ability of the advisory and compliance personnel assigned to the IMS Funds; the fact that the Adviser does utilize soft dollars; the basis of decisions to buy or sell securities for the IMS Funds; and the substance and administration of the Adviser’s code of ethics. Based on the foregoing, the Board determined that the Adviser’s standards and practices relating to the identification and mitigation of possible conflicts of interest were satisfactory. The Trustees note that there were no benefits identified by the Adviser to the Board other than the advisory fees received under the Advisory Agreement.
After additional consideration of the factors delineated in the memorandum provided by Counsel and further discussion among the Board, the Board determined that the compensation payable under the Agreements was fair, reasonable and within a range of what could have been negotiated at arms-length in light of all the surrounding circumstances, and they resolved to approve the Agreements for another one-year term.
55
360 FUNDS
4300 Shawnee Mission Parkway
Suite 100
Fairway, KS 66205
INVESTMENT ADVISOR
IMS Capital Management, Inc.
8995 S.E. Otty Road,
Portland, OR 97086
ADMINISTRATOR & TRANSFER AGENT
M3Sixty Administration, LLC
4300 Shawnee Mission Parkway
Suite 100
Fairway, KS 66205
DISTRIBUTOR
Matrix 360 Distributors, LLC
4300 Shawnee Mission Parkway
Suite 100
Fairway, KS 66205
INDEPENDENT REGISTERED PUBLIC ACCOUNTING FIRM
Sanville & Company
1514 Old York Road
Abington, PA 19001
LEGAL COUNSEL
The Law Offices of John H. Lively & Associates, Inc.
A member firm of The 1940 Act Law Group™
11300 Tomahawk Creek Parkway
Suite 310
Leawood, KS 66211
CUSTODIAN BANK
Huntington National Bank
41 South Street
Columbus, OH 43125
41 South Street
Columbus, OH 43125
This report is intended only for the information of shareholders or those who have received the Funds’ prospectus which contains information about each Fund’s management fee and expenses. Please read the prospectus carefully before investing.
| ITEM 2. | CODE OF ETHICS. |
| (a) | The registrant has, as of the end of the period covered by this report, adopted a code of ethics that applies to the registrant's principal executive officer, principal financial officer, and principal accounting officer or controller, or persons performing similar functions, regardless of whether these individuals are employed by the registrant or a third party. |
| (b) | During the period covered by this report, there were no amendments to any provision of the code of ethics. |
| (c) | During the period covered by this report, there were no waivers or implicit waivers of a provision of the code of ethics. |
| (d) | The registrant’s Code of Ethics is filed herewith. |
| ITEM 3. | AUDIT COMMITTEE FINANCIAL EXPERT. |
| The Registrant's Board of Trustees has determined that Tom Wirtshafter serves on its audit committee as the "audit committee financial expert" as defined in Item 3. |
| ITEM 4. | PRINCIPAL ACCOUNTANT FEES AND SERVICES. |
| (a) | Audit Fees. The aggregate fees billed for professional services rendered by the principal accountant for the audit of the registrant’s annual financial statements or for services that are normally provided by the accountant in connection with statutory and regulatory filings or engagements were $30,000 and $57,000 with respect to the registrant’s fiscal years ended June 30, 2017 and June 30, 2016, respectively. |
| (b) | Audit-Related Fees. There were no fees billed during the last two fiscal years for assurances and related services by the principal accountant that are reasonably related to the performance of the audit of the registrant’s financial statements and are not reported under paragraph (a) of this item. |
| (c) | Tax Fees. The aggregate fees billed in the last two fiscal years for professional services rendered by the principal accountant for tax compliance, tax advice and tax planning were $6,000 and $9,000 with respect to the registrant’s fiscal years ended June 30, 2017 and June 30, 2016, respectively. The services comprising these fees are the preparation of the registrant’s federal income and excise tax returns. |
| (d) | All Other Fees. The aggregate fees billed in last fiscal year for products and services provided by the registrant’s principal accountant, other than the services reported in paragraphs (a) through (c) of this item were $0 for the fiscal year ended June 30, 2017 and $1,200 for the fiscal year ended June 30, 2016 for the IMS Family of Funds, and were for the auditor's consent on the registration statement and the review of the semi-annual financial report. |
| (e)(1) | The audit committee does not have pre-approval policies and procedures. Instead, the audit committee or audit committee chairman approves on a case-by-case basis each audit or non-audit service before the principal accountant is engaged by the registrant. |
| (e)(2) | There were no services described in each of paragraphs (b) through (d) of this Item that were approved by the audit committee pursuant to paragraph (c)(7)(i)(C) of Rule 2-01 of Regulation S-X. |
| (f) | Not applicable. The percentage of hours expended on the principal accountant's engagement to audit the registrant's financial statements for the most recent fiscal year that were attributed to work performed by persons other than the principal accountant's full-time permanent employees was zero percent (0%). |
| (g) | All non-audit fees billed by the registrant's principal accountant for services rendered to the registrant for the last two fiscal years ended June 30, 2017 and June 30, 2016 are disclosed in (b)-(d) above. There were no audit or non-audit services performed by the registrant's principal accountant for the registrant's adviser. |
| (h) | There were no non-audit services rendered to the registrant’s investment adviser. |
| ITEM 5. | AUDIT COMMITTEE OF LISTED REGISTRANTS. |
Not applicable
| ITEM 6. | SCHEDULES OF INVESTMENTS |
Included in annual report to shareholders filed under item 1 of this form.
| ITEM 7. | DISCLOSURE OF PROXY VOTING POLICIES AND PROCEDURES FOR CLOSED-END MANAGEMENT INVESTMENT COMPANIES. |
Not applicable Fund is an open-end management investment company
| ITEM 8. | PORTFOLIO MANAGERS OF CLOSED-END MANAGEMENT INVESTMENT COMPANIES |
Not applicable Fund is an open-end management investment company
| ITEM 9. | PURCHASES OF EQUITY SECURITIES BY CLOSED-END MANAGEMENT INVESTMENT COMPANY AND AFFILIATED PURCHASERS. |
Not applicable Fund is an open-end management investment company
| ITEM 10. | SUBMISSION OF MATTERS TO A VOTE OF SECURITY HOLDERS. |
Not applicable at this time.
| ITEM 11. | CONTROLS AND PROCEDURES. |
| (a) | The registrant's principal executive and principal financial officers, or persons performing similar functions, have concluded that the registrant's disclosure controls and procedures (as defined in Rule 30a-3(c) under the 1940 Act, are effective, as of a date within 90 days of the filing date of this report, based on the evaluation of these controls and procedures required by Rule 30a-3(b) under the 1940 Act and Rule 15d-15(b) under the Securities Exchange Act of 1934, as amended. |
| (b) | There were no changes in the registrant's internal control over financial reporting (as defined in Rule 30a-3(d) under the 1940 Act) that occurred during the period covered by this report that have materially affected, or are reasonably likely to materially affect, the registrant's internal control over financial reporting. |
| ITEM 12. | EXHIBITS |
| (1) | Code of Ethics for Principal Executive and Senior Financial Officers is attached hereto. |
| (2) | Certifications pursuant to Section 302 of the Sarbanes-Oxley Act of 2002 are filed herewith. |
| (3) | Certifications pursuant to Section 906 of the Sarbanes-Oxley Act of 2002 are filed herewith. |
SIGNATURES
Pursuant to the requirements of the Securities Exchange Act of 1934 and the Investment Company Act of 1940, the registrant has duly caused this report to be signed on its behalf by the undersigned, thereunto duly authorized.
360 Funds
| By: Randy Linscott | /s/ Randy Linscott | |
| Principal Executive Officer, | ||
| Date: August 29, 2017 |
Pursuant to the requirements of the Securities Exchange Act of 1934 and the Investment Company Act of 1940, this report has been signed below by the following person on behalf of the registrant and in the capacities and on the date indicated.
| By Randy Linscott | /s/ Randy Linscott | |
| Principal Executive Officer | ||
| Date: August 29, 2017 |
Pursuant to the requirements of the Securities Exchange Act of 1934 and the Investment Company Act of 1940, this report has been signed below by the following person on behalf of the registrant and in the capacities and on the date indicated.
| By Larnell Smith | /s/ Larnell Smith | |
| Principal Financial Officer | ||
| Date: August 29, 2017 |