Exhibit 99.2

TransMontaigne Investor Presentation JANUARY 2025

TRANSMONTAIGNE PARTNE RS LLC PRIVATE & CONFIDENTIAL Disclaimer Confidentiality The information contained in this presentation (the “Presentation”) is strictly confidential and is provided by TransMontaigne Partners L.L.C. (the “Company”) for the exclusive use of the recipient for informational purposes only and may not be reproduced, provided or disclosed to others, or used for any purpose, whatsoever, without prior written authorization by the Company, and upon request, must be returned to the Company. The recipient shall not use this Presentation or any information contained herein in any way, directly or indirectly, that is in competition with or detrimental to the Company. By accepting this Presentation, the recipient agrees to comply with applicable securities laws and maintain the confidentiality of this Presentation and such information in accordance with such laws. This Presentation is for information purposes only and is incomplete without reference to, and should be viewed solely in conjunction with, the oral briefing provided by the Company. The information and opinions in this Presentation is provided as at the date hereof and subject to change without notice. It is not the intention to provide, and you may not rely on these materials as providing, a complete or comprehensive analysis of the Company’s financial or trading position or prospects. The information contained in the following Presentation is subject in all cases to the complete disclosure set out in the Preliminary Offering Memorandum relating to the proposed offering of the notes (the “Preliminary Offering Memorandum”), and in the event of a conflict between information in the following Presentation and the Preliminary Offering Memorandum, the Preliminary Offering Memorandum shall prevail. Any offers of the notes will be made only by means of the Preliminary Offering Memorandum. THIS PRESENTATION IS NOT INTENDED TO BE READ SEPARATELY FROM, OR IN LIEU OF, THE PRELIMINARY OFFERING MEMORANDUM WITH RESPECTTOTHE PROPOSED OFFERING OF NOTES. THIS PRESENTATION IS QUALIFIED IN ITS ENTIRETY BY REFERENCE TO THE PRELIMINARY OFFERING MEMORANDUM WITH RESPECT TO THE PROPOSED OFFERING OF NOTES. YOU SHOULD RELY ON THE INFORMATION CONTAINED IN THE PRELIMINARY OFFERING MEMORANDUM WITH RESPECT TO THE PROPOSED OFFERING OF NOTES. YOU MAY NOT DEAL IN, AND WILL INFORM YOUR REPRESENTATIVES OF THE RESTRICTION AGAINST INSIDER DEALING IN, ANY SECURITIES OF THE COMPANY IN BREACH OF ANY APPLICABLE LAWS. This Presentation does not constitute investment, legal, accounting, regulatory, taxation or other advice and does not take into account your investment objectives or legal, accounting, regulatory, taxation or financial situation or particular needs. You are solely responsible for forming your own opinions and conclusions on such matters and for making your own independent assessment of the Company. You are solely responsible for seeking independent professional advice in relation to the Company. No responsibility or liability is accepted by any person for any of the information or for any action taken by you or any of your officers, employees, agents or associates on the basis of such information. The Company’s independent public auditors have neither examined nor compiled this Presentation and, accordingly, do not provide any assurance with respect to any information included herein, including any information about the Company or comparable industry companies. In light of the risks and uncertainties described above, the future events and circumstances discussed in this Presentation might not occur and are not guarantees of future performance. No Representation or Warranty The information contained in this Presentation has been prepared by the Company as of the date hereof, and has not been independently verified and will not be updated. No representation, warranty or undertaking, express or implied, is made as to, and no reliance should be placed on, the fairness, accuracy, completeness or correctness of the information or opinions contained herein and nothing in this Presentation is, or shall be relied upon as, a promise or representation. None of the Company nor any of its affiliates, nor their respective employees, officers, directors, advisers, representatives or agents shall have any liability whatsoever (in negligence or otherwise, whether direct or indirect, in contract, tort or otherwise) for any loss howsoever arising from any use of this Presentation or its contents or otherwise arising in connection with this Presentation. This Presentation does not purport to be all inclusive, or to contain information that you may need and speaks as of the date hereof. 2
TRANSMONTAIGNE PARTNE RS LLC PRIVATE & CONFIDENTIAL Disclaimer Forward Looking Statements This Presentation and related discussions contain forward - looking statements as defined in the Private Securities Litigation Reform Act of 1995, Section 27A of the Securities Act of 1993, as amended, and Section 21E of the Securities Exchange Act of 1994, as amended. Forward - looking statements give our current expectations, contain projections of results of operations or of financial condition, or forecasts of future events. When used in this Presentation, the words “could,” “may,” “should,” “will,” “seek,” “believe,” “expect,” “anticipate,” “intend,” “continue,” “estimate,” “plan,” “target,” “predict,” “project,” “attempt,” “is scheduled,” “likely,” “forecast,” the negatives thereof and other similar expressions are used to identify forward - looking statements, although not all forward - looking statements contain such identifying words. These forward - looking statements include, but are not limited to, all statements other than statements of historical facts contained in this Presentation, including, without limitation, those regarding our future financial position and results of operations, our strategy, plans, objectives, goals, targets, and expectations regarding future developments in the markets in which we operate or are seeking to operate. Due to various risks and uncertainties, actual events or results or actual performance may differ materially from those reflected or contemplated in such forward - looking statements, and there can be no assurance that such “forward - looking statements” will ultimately transpire or that they will transpire to the extent or on the terms currently contemplated. You should review this Presentation completely and with the understanding that the Company’s actual future results may be materially different from what management expects and should not place undue reliance on the forward - looking statements, which speak only as of the date of this Presentation. Except as required by applicable law, the Company does not plan to publicly update or revise any forward - looking statements contained herein, whether as a result of any new information, future events, changed circumstances or otherwise. In particular, there can be no guarantee that the sale transactions described herein will be completed in accordance with the terms described in this Presentation or at all. Non - GAAP Financial Information This Presentation includes certain financial measures not presented in accordance with generally accepted accounting principles in the United States (“GAAP”), which are used by management as a supplemental measure, have certain limitations, and should not be construed as alternatives to financial measures determined in accordance with GAAP. The non - GAAP financial measures in this Presentation include Adjusted EBITDA, Consolidated EBITDA, Total EBITDA, Free Cash Flow, Net Leverage and Consolidated Free Cash Flow. The non - GAAP measures as defined by us may not be comparable to similar non - GAAP financial measures presented by other companies. Our presentation of such measures, which may include adjustments to exclude unusual or non - recurring items, should not be construed as an inference that our future results will be unaffected by other unusual or non - recurring items. A reconciliation of certain non - GAAP financial measures to the most directly comparable GAAP measures is provided in the Appendix to this Presentation. Market Data The market and industry data and forecasts included in this Presentation were obtained from internal surveys, estimates, experts and studies, where appropriate, as well as external market research, publicly available information, and industry publications. The Company, its affiliates, directors, officers, advisors, and employees have not independently verified the accuracy, completeness, or correctness of any such market and industry data and forecasts and make no representations or warranties in relation thereto. Such data and forecasts are included herein for information purposes only. Accordingly, undue reliance should not be placed on any of the industry or market data contained in this Presentation. This Presentation does not constitute or form part of, and should not be construed as, an offer to sell or issue, or the solicitation of an offer to purchase or acquire, any securities of the Company, nor shall there be any sale of securities in any state or other jurisdiction to any person or entity to which it is unlawful to make such offer, solicitation or sale in such state or jurisdiction. The notes referred to herein have not been and are not expected to be registered under the U.S. Securities Act of 1933, as amended, (the “Securities Act”). No securities of the Company may be sold in the United States without registration under the Securities Act or an exemption from such registration. Accordingly, the notes are being offered and sold only to (i) qualified institutional buyers (“QIBs”) as defined in, and in reliance on, Rule 144A under the Securities Act, and (ii) certain non - U.S. persons in transactions outside the United States in reliance on Regulation S under the Securities Act. This Presentation is being made only to participants that, by means of their attendance at this Presentation, represent that they are QIBs or non - U.S. persons. 3

Transaction Overview
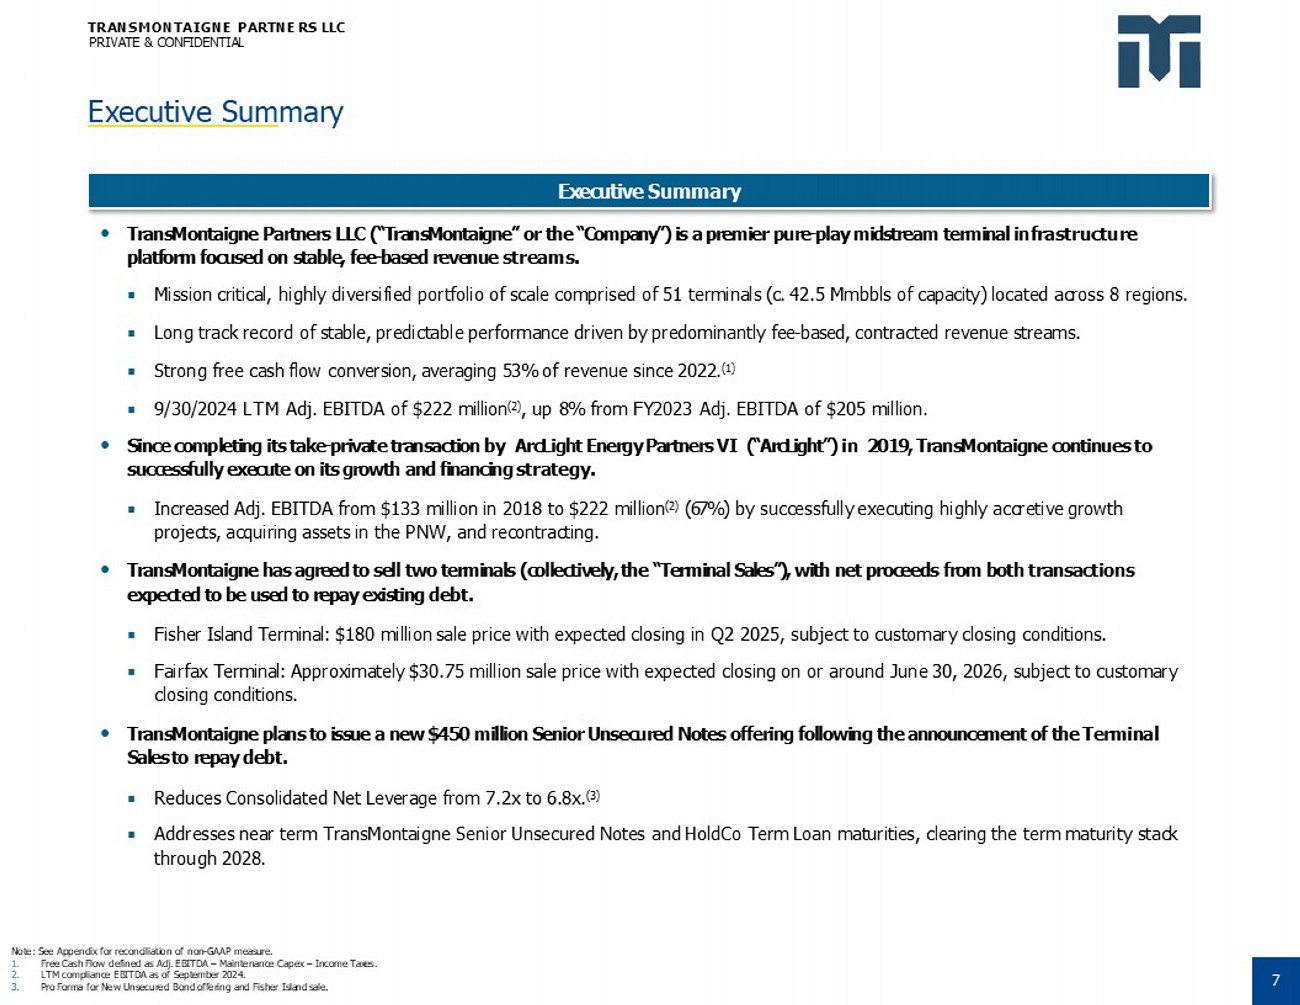
TRANSMONTAIGNE PARTNE RS LLC PRIVATE & CONFIDENTIAL Executive Sum mary Note: See Appendix for reconciliation of non - GAAP measure. 1. Free Cash Flow defined as Adj. EBITDA – Maintenance Capex – Income Taxes. 2. LTM compliance EBITDA as of September 2024. 3. Pro Forma for New Unsecured Bond offering and Fisher Island sale. Executive Summary TransMontaigne Partners LLC (“TransMontaigne” or the “Company”) is a premier pure - play midstream terminal infrastructure platform focused on stable, fee - based revenue streams. Mission critical, highly diversified portfolio of scale comprised of 51 terminals (c. 42.5 Mmbbls of capacity) located across 8 regions. Long track record of stable, predictable performance driven by predominantly fee - based, contracted revenue streams. Strong free cash flow conversion, averaging 53% of revenue since 2022. (1) 9/30/2024 LTM Adj. EBITDA of $222 million (2) , up 8% from FY2023 Adj. EBITDA of $205 million. Since completing its take - private transaction by ArcLight Energy Partners VI (“ArcLight”) in 2019, TransMontaigne continues to successfully execute on its growth and financing strategy. Increased Adj. EBITDA from $133 million in 2018 to $222 million (2) (67%) by successfully executing highly accretive growth projects, acquiring assets in the PNW, and recontracting. TransMontaigne has agreed to sell two terminals (collectively, the “Terminal Sales”), with net proceeds from both transactions expected to be used to repay existing debt. Fisher Island Terminal: $180 million sale price with expected closing in Q2 2025, subject to customary closing conditions. Fairfax Terminal: Approximately $30.75 million sale price with expected closing on or around June 30, 2026, subject to customary closing conditions. TransMontaigne plans to issue a new $450 million Senior Unsecured Notes offering following the announcement of the Terminal Sales to repay debt. Reduces Consolidated Net Leverage from 7.2x to 6.8x. (3) Addresses near term TransMontaigne Senior Unsecured Notes and HoldCo Term Loan maturities, clearing the term maturity stack through 2028. 7

TRANSMONTAIGNE PARTNE RS LLC PRIVATE & CONFIDENTIAL Transaction O verview 1. 2. 3. Estimated Q2 2025 closing, subject to customary closing conditions. Represents accrued interest on 6.125% notes. See appendix for reconciliation of non - GAAP measure. 8 The proposed bond and Fisher Island terminal sale will both significantly delever TransMontaigne and extend the company’s term maturity profile. Bond Offering Fisher Island Terminal Sale (1) Pro Forma Capitalization TransMontaigne PF 9/30/2024 M&A Adj. Prelim. TransMontaigne PF 9/30/2024 Trxn. Adj. TransMontaigne SQ 9/30/2024 ($ in millions) $24 - $24 $14 $11 Cash and Cash Equivalents - - - ($14) $14 RCF Facility ($150mm) 1,007 (115) 1,122 - 1,122 TransMontaigne TLB $1,007 ($115) $1,122 ($14) $1,136 Total TransMontaigne Secured Debt 983 (115) 1,098 (28) 1,125 TransMontaigne Secured Net Debt - - - ($300) $300 Existing 6.125% Notes 450 - 450 450 - New Unsecured Notes $1,457 ($115) $1,572 $136 $1,436 Total TransMontaigne Partners Debt 1,433 (115) 1,548 123 1,425 TransMontaigne Partners Net Debt - ($65) $65 ($105) $170 HoldCo TL $1,457 ($180) $1,637 $32 $1,605 Total Consolidated Debt 1,433 (180) 1,613 18 1,595 Consolidated Net Debt Operating Metrics $210 ($12) $222 - $222 LTM Adj. EBITDA (3) Credit & Coverage Statistics 4.7x 6.8x 6.8x 4.9x 7.0x 7.3x 5.1x 6.4x 7.2x Secured Debt / LTM Adj. EBITDA Partners Debt / LTM Adj. EBITDA Consolidated Debt / LTM Adj. EBITDA % $ Million Sources % $ Million Sources 100% $180 Proceeds from Fisher Island Sale 100% $450 New Unsecured Notes 100% $180 Total Sources 100% $450 Total Sources % $ Million Uses % $ Million Uses 36% $65 Repay HoldCo TL 67% $300 Repay Existing 6.125% Notes 64% 115 Repay TransMontaigne TLB 23% 105 Repay HoldCo TL 100% $180 Total Uses 3% 14 Repay RCF Facility 3% 14 Cash to Balance Sheet 2% 9 Accrued Interest (2) 2% 9 Fees and Expenses 100% $450 Total Uses

TRANSMONTAIGNE PARTNE RS LLC PRIVATE & CONFIDENTIAL Pro Forma Org anizational Structure (1) Significantly simplified debt structure following the proposed refinancing and Fisher Island terminal sale Note: Triangles reflect joint venture entities’; unless otherwise noted, reflects 100% ownership. 1. 2. Shown pro - forma for both the proposed financing and Fisher Island terminal sale. SeaPort Financing L.L.C. consists of TransMontaigne’s Tacoma Terminal, 51% ownership of SMP (which will be an unrestricted subsidiary of the Company and will not guarantee the New Unsecured Notes), and 30% ownership of Olympic Pipeline. Overview TransMontaigne Finance Holdings, L.L.C. (“TransMontaigne Finance” or “HoldCo”) TransMontaigne Operating GP L.L.C. TransMontaigne Operating Finance Corp. TransMontaigne Terminals L.L.C. Razorback L.L.C. TPSI Terminals L.L.C. TransMontaigne Finance Corp. TPME L.L.C. TransMontaigne Products Company L.L.C. SeaPort Financing L.L.C. (2) New $450mm Senior Notes (“New Unsecured Notes”) TransMontaigne Operating Company L.P. (the “OpCo”) Existing $150mm RCF Existing $1,007mm TLB (“TransMontaigne TLB”) Frontera Brownsville L.L.C. BOSTCO L.L.C. 42.5% 50% TransMontaigne Partners L.L.C. (the “Issuer” or “TransMontaigne Partners”) Issuer Guarantor Non - Guarantor ArcLight Energy Partners Fund VI L.P. and Affiliates Pike West Coast Holdings, LLC TransMontaigne Management Services L.L.C. 9

TRANSMONTAIGNE PARTNE RS LLC PRIVATE & CONFIDENTIAL Senior Unsecu red Notes Summary Terms 10 TransMontaigne Partners LLC Issuer $450 million Senior Unsecured Notes (the “Notes”) Issue All existing and future, direct and indirect domestic wholly owned material subsidiaries of the Issuer Guarantors To repay existing indebtedness and to pay related fees and expenses Use of Proceeds Pari passu with all future senior indebtedness and senior to all subordinated indebtedness Ranking 5.25 Years Tenor • Non - callable for 2 years • T + 50bps make - whole premium during non - call period • First call at par + 50% coupon, stepping down ratably to par in year 5 Call Protection 40% of aggregate principal amount Equity Clawback Usual and customary for Senior Unsecured Notes transactions of this nature Affirmative Covenants Usual and customary for Senior Unsecured Notes transactions of this nature Negative Covenants 101% Change of Control Put if Issue downgraded by at least two Rating Agencies Change of Control 144A / Reg S for life Distribution
Company Overview
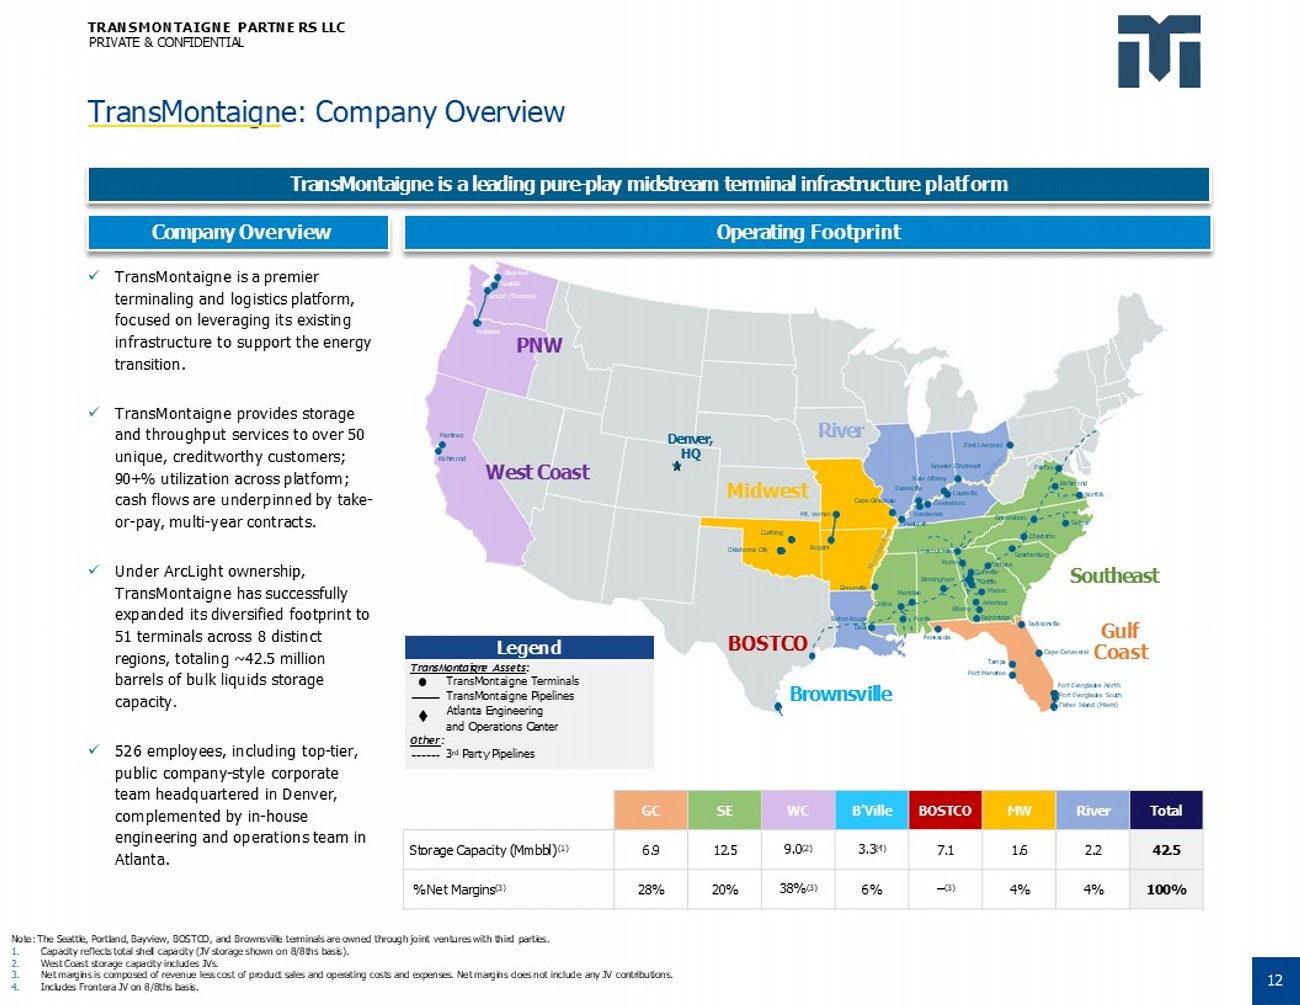
TRANSMONTAIGNE PARTNE RS LLC PRIVATE & CONFIDENTIAL TransMontaign e: Company Overview Note: The Seattle, Portland, Bayview, BOSTCO, and Brownsville terminals are owned through joint ventures with third parties. 1. 2. 3. 4. Capacity reflects total shell capacity (JV storage shown on 8/8ths basis). West Coast storage capacity includes JVs. Net margins is composed of revenue less cost of product sales and operating costs and expenses. Net margins does not include any JV contributions. Includes Frontera JV on 8/8ths basis. TransMontaigne is a leading pure - play midstream terminal infrastructure platform Company Overview Operating Footprint x TransMontaigne is a premier terminaling and logistics platform, focused on leveraging its existing infrastructure to support the energy transition. x TransMontaigne provides storage and throughput services to over 50 unique, creditworthy customers; 90+% utilization across platform; cash flows are underpinned by take - or - pay, multi - year contracts. x Under ArcLight ownership, TransMontaigne has successfully expanded its diversified footprint to 51 terminals across 8 distinct regions, totaling ~42.5 million barrels of bulk liquids storage capacity. x 526 employees, including top - tier, public company - style corporate team headquartered in Denver, complemented by in - house engineering and operations team in Atlanta. West Coast PNW River Southeast Gulf Brownsville BOSTCO Denver, HQ Oklahoma City Cushing Pensacola Tampa Port Manatee Jacksonville East Liverpool Greater Cincinnati New Albany Henderson Paducah Midwest Mt. Vernon Rogers Evansville Cape Giradeau Greenville Fairfax Richmond Norfolk Greensboro Selma Charlotte Spartanburg Bainbridge Purvis Martinez Richmond Bayview Seattle Sound (Tacoma) Portland Baton Rouge Dock Collins Louisville Owensboro Birmingham Meridian Athens Doraville Griffin Macon Americus Cape Canaveral Coast Port Everglades North Port Everglades South Fisher Island (Miami) Lookout Mtn. Rome Albany Total River MW BOSTCO B’Ville WC SE GC 42.5 2.2 1.6 7.1 3.3 (4) 9.0 (2) 12.5 6.9 Storage Capacity (Mmbbl) (1) 100% 4% 4% – (3) 6% 38% (3) 20% 28% % Net Margins (3) Legend TransMontaigne Assets : TransMontaigne Terminals TransMontaigne Pipelines Atlanta Engineering and Operations Center Other : 3 rd Party Pipelines 12
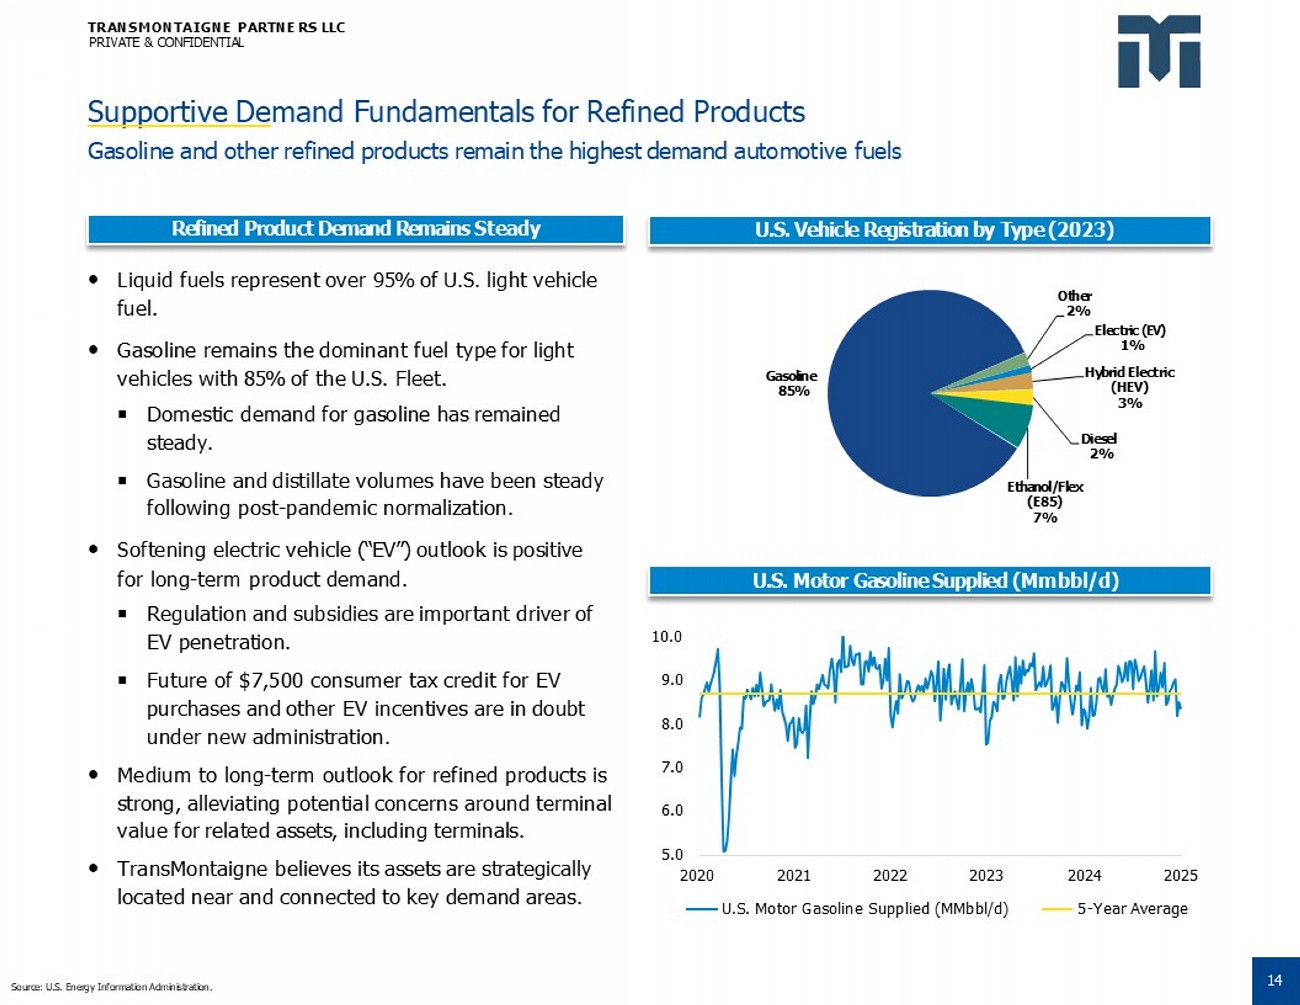
TRANSMONTAIGNE PARTNE RS LLC PRIVATE & CONFIDENTIAL Electric (EV) 1% Hybrid Electric (HEV) 3% Diesel 2% Ethanol/Flex (E85) 7% Gasoline 85% Other 2% U.S. Vehicle Registration by Type (2023) Supportive De mand Fundamentals for Refined Products Gasoline and other refined products remain the highest demand automotive fuels Source: U.S. Energy Information Administration. Liquid fuels represent over 95% of U.S. light vehicle fuel. Gasoline remains the dominant fuel type for light vehicles with 85% of the U.S. Fleet. Domestic demand for gasoline has remained steady. Gasoline and distillate volumes have been steady following post - pandemic normalization. Softening electric vehicle (“EV”) outlook is positive for long - term product demand. Regulation and subsidies are important driver of EV penetration. Future of $7,500 consumer tax credit for EV purchases and other EV incentives are in doubt under new administration. Medium to long - term outlook for refined products is strong, alleviating potential concerns around terminal value for related assets, including terminals. TransMontaigne believes its assets are strategically located near and connected to key demand areas. 14 U.S. Motor Gasoline Supplied (Mmbbl/d) 5.0 6.0 7.0 8.0 9.0 10.0 2020 2021 2022 2023 U.S. Motor Gasoline Supplied (MMbbl/d) 2024 2025 5 - Year Average Refined Product Demand Remains Steady

TRANSMONTAIGNE PARTNE RS LLC PRIVATE & CONFIDENTIAL Terminal Sales Overview Source: Company Website. TransMontaigne expected to unlock significant stakeholder value with strategic, high multiple asset sales Fisher Island Asset Sale Summary Fairfax Asset Sale Summary TransMontaigne entered into an agreement to sell the Fisher Island Terminal for approximately $180mm to an undisclosed buyer. Net proceeds to be used to retire HoldCo Term Loan and repay TransMontaigne TLB. Expected Q2’2025 closing. Asset Statistics • ECA Marine Diesel • No. 6 Fuel Oil High Sulfur • No. 6 Fuel Oil Low Sulfur Products 673 Mmbbl Storage Capacity Vessel Loading / Offloading Barge Loading / Offloading Services Marine Inbound Access Marine Outbound Access TransMontaigne entered into an agreement to sell the Fairfax Terminal for approximately $30.75mm to an undisclosed buyer. Net proceeds to be used to repay TransMontaigne TLB. Expected Q2’2026 closing. Asset Statistics • Lubricity • Gasoline Additive • Gasoline • Diesel • Ethanol • Red Dye Products 508 Mmbbl Storage Capacity Truck loading/offloading, Ethanol blending, additive injection Services Colonial Pipeline, Truck Inbound Access Truck Outbound Access Net proceeds from both asset sales will be used to repay debt 15

Key Credit Highlights
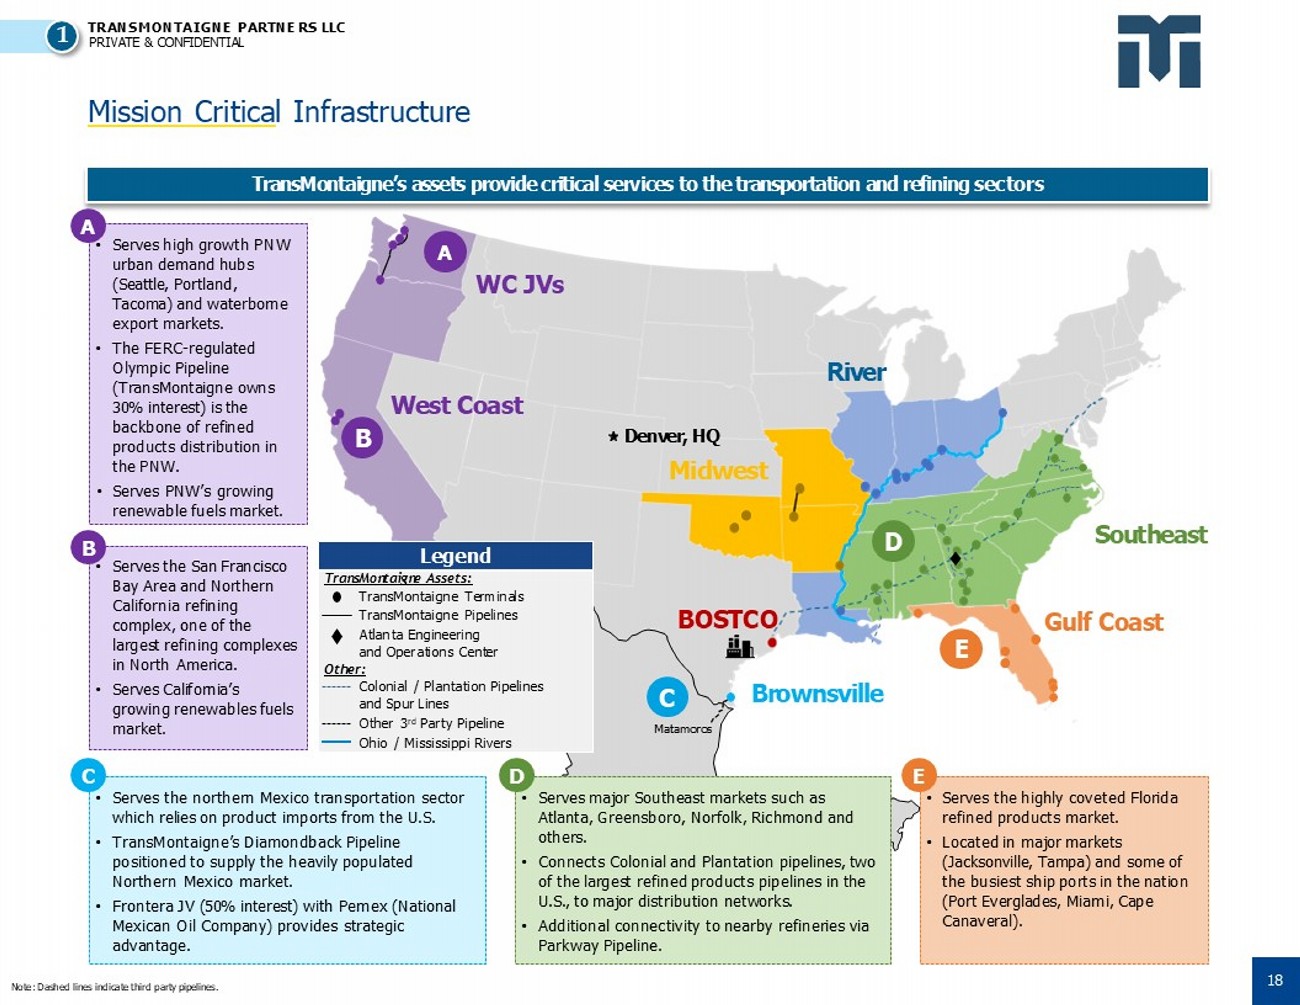
TRANSMONTAIGNE PARTNE RS LLC PRIVATE & CONFIDENTIAL Mission Critica l Infrastructure Note: Dashed lines indicate third party pipelines. TransMontaigne’s assets provide critical services to the transportation and refining sectors West Coast WC JVs Denver, HQ Midwest River Southeast Gulf Coast D E B A BOSTCO Brownsville C Matamoros • Serves the northern Mexico transportation sector which relies on product imports from the U.S. • TransMontaigne’s Diamondback Pipeline positioned to supply the heavily populated Northern Mexico market. • Frontera JV (50% interest) with Pemex (National Mexican Oil Company) provides strategic advantage. • Serves the San Francisco Bay Area and Northern California refining complex, one of the largest refining complexes in North America. • Serves California’s growing renewables fuels market. • Serves high growth PNW urban demand hubs (Seattle, Portland, Tacoma) and waterborne export markets. • The FERC - regulated Olympic Pipeline (TransMontaigne owns 30% interest) is the backbone of refined products distribution in the PNW. • Serves PNW’s growing renewable fuels market. Legend TransMontaigne Assets: TransMontaigne Terminals TransMontaigne Pipelines Atlanta Engineering and Operations Center Other: Colonial / Plantation Pipelines and Spur Lines Other 3 rd Party Pipeline Ohio / Mississippi Rivers • Serves the highly coveted Florida refined products market. • Located in major markets (Jacksonville, Tampa) and some of the busiest ship ports in the nation (Port Everglades, Miami, Cape Canaveral). E • Serves major Southeast markets such as Atlanta, Greensboro, Norfolk, Richmond and others. • Connects Colonial and Plantation pipelines, two of the largest refined products pipelines in the U.S., to major distribution networks. • Additional connectivity to nearby refineries via Parkway Pipeline. D C B A 1 18
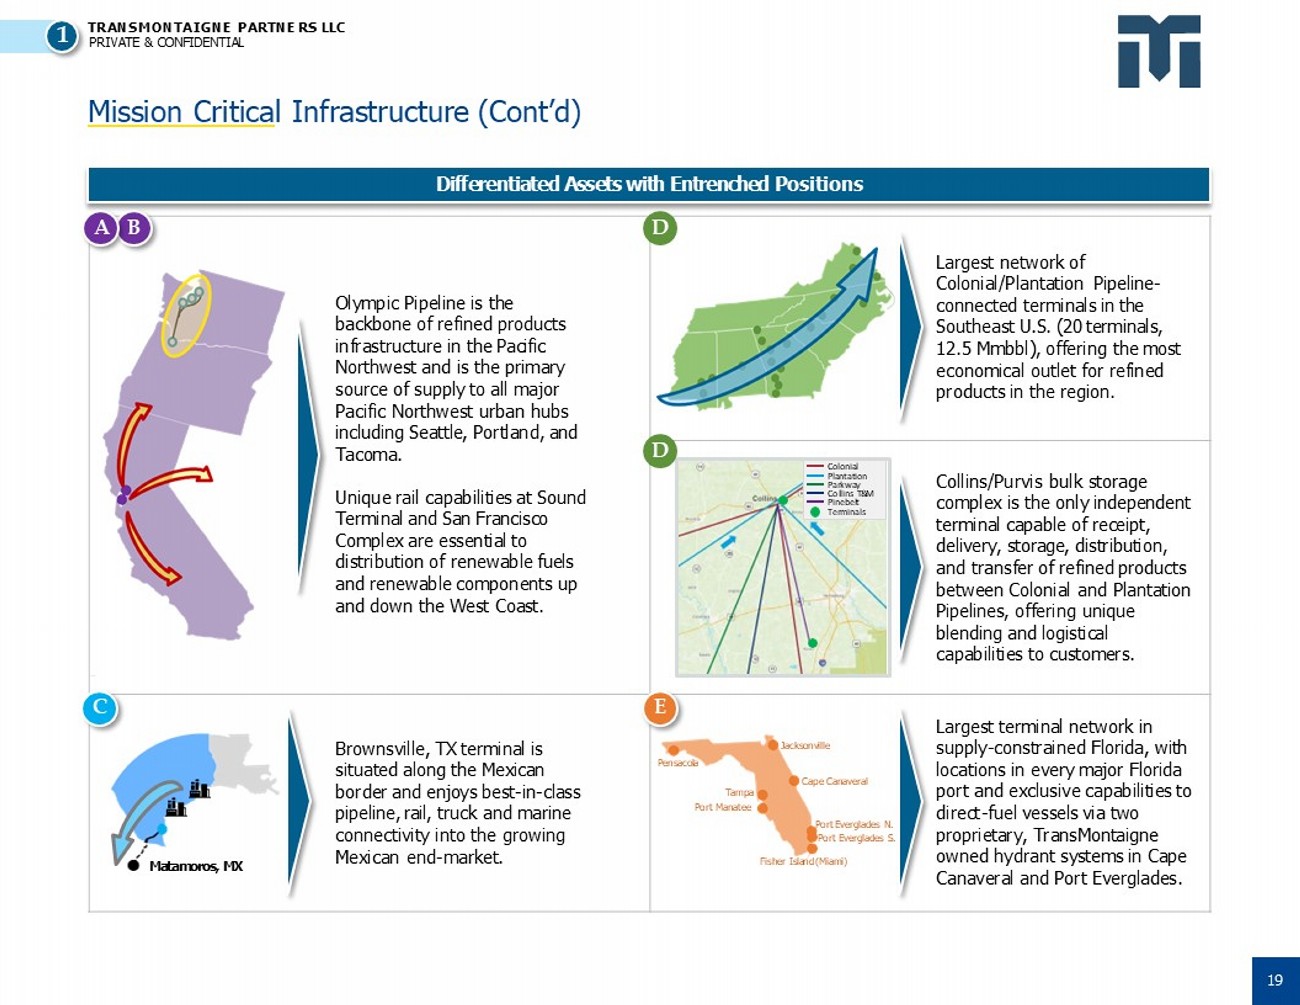
TRANSMONTAIGNE PARTNE RS LLC PRIVATE & CONFIDENTIAL Matamoros, MX Mission Critica l Infrastructure (Cont’d) Differentiated Assets with Entrenched Positions Brownsville, TX terminal is situated along the Mexican border and enjoys best - in - class pipeline, rail, truck and marine connectivity into the growing Mexican end - market. Olympic Pipeline is the backbone of refined products infrastructure in the Pacific Northwest and is the primary source of supply to all major Pacific Northwest urban hubs including Seattle, Portland, and Tacoma. Unique rail capabilities at Sound Terminal and San Francisco Complex are essential to distribution of renewable fuels and renewable components up and down the West Coast. C Largest terminal network in supply - constrained Florida, with locations in every major Florida port and exclusive capabilities to direct - fuel vessels via two proprietary, TransMontaigne owned hydrant systems in Cape Canaveral and Port Everglades. Largest network of Colonial/Plantation Pipeline - connected terminals in the Southeast U.S. (20 terminals, 12.5 Mmbbl), offering the most economical outlet for refined products in the region. A B D E D Colonial Plantation Parkway Collins T&M Pinebelt Terminals Cape Canaveral Fisher Island (Miami) Pensacola Tampa Port Manatee Jacksonville Port Everglades N. Port Everglades S. Collins/Purvis bulk storage complex is the only independent terminal capable of receipt, delivery, storage, distribution, and transfer of refined products between Colonial and Plantation Pipelines, offering unique blending and logistical capabilities to customers. 1 19
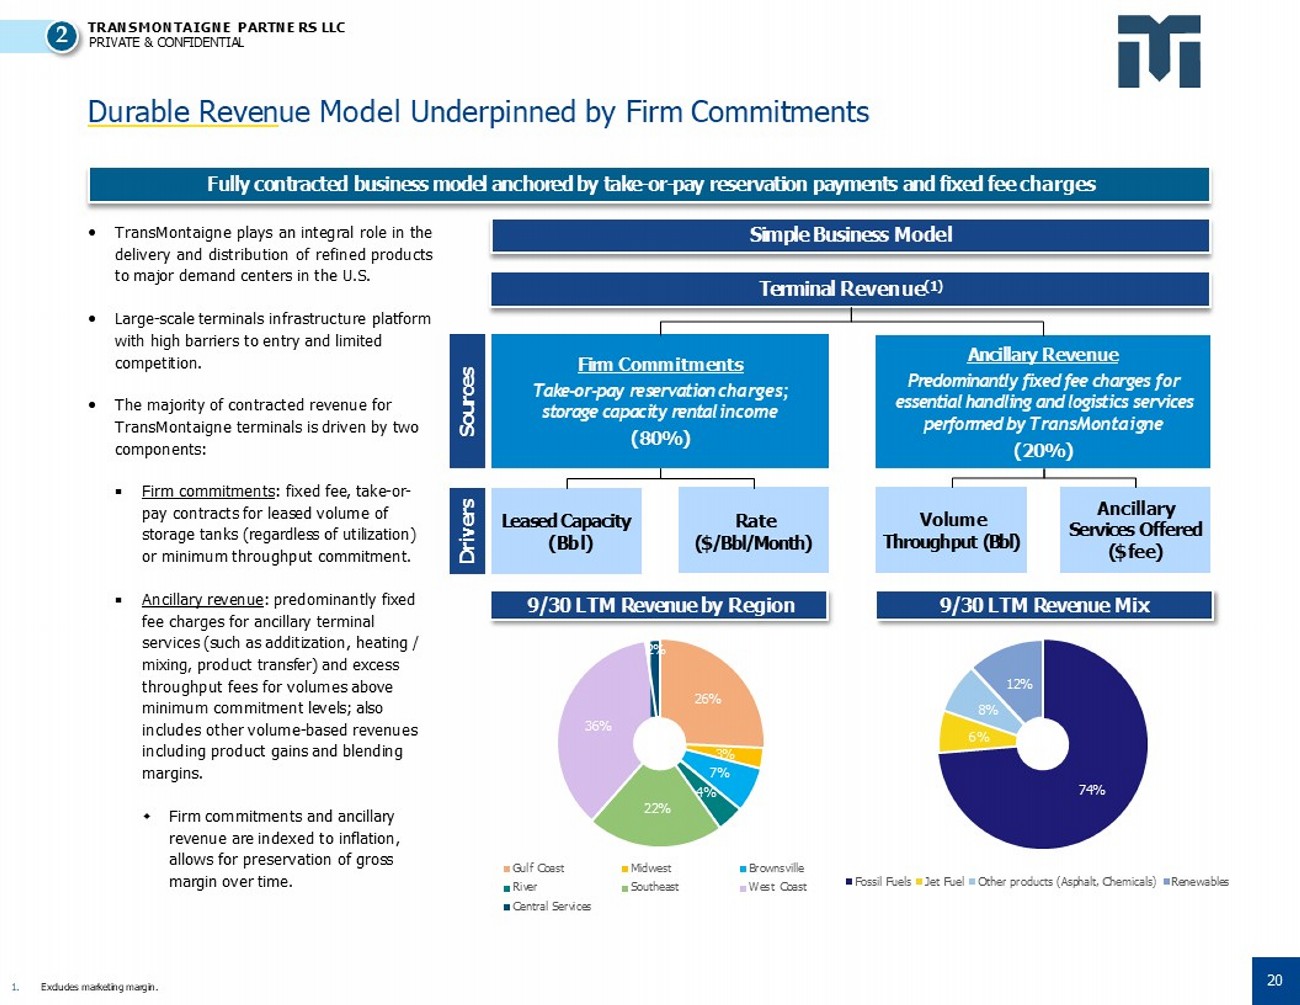
TRANSMONTAIGNE PARTNE RS LLC PRIVATE & CONFIDENTIAL 26% 3% 7% 4% 22% 36% 2% Gulf Coast River Central Services Midwest Southeast Brownsville West Coast Durable Reven ue Model Underpinned by Firm Commitments 1. Excludes marketing margin. Fully contracted business model anchored by take - or - pay reservation payments and fixed fee charges Simple Business Model TransMontaigne plays an integral role in the delivery and distribution of refined products to major demand centers in the U . S . Large - scale terminals infrastructure platform with high barriers to entry and limited competition. The majority of contracted revenue for TransMontaigne terminals is driven by two components: Firm commitments : fixed fee, take - or - pay contracts for leased volume of storage tanks (regardless of utilization) or minimum throughput commitment. Ancillary revenue : predominantly fixed fee charges for ancillary terminal services (such as additization, heating / mixing, product transfer) and excess throughput fees for volumes above minimum commitment levels; also includes other volume - based revenues including product gains and blending margins. Firm commitments and ancillary revenue are indexed to inflation, allows for preservation of gross margin over time. Terminal Revenue (1) Volume Throughput (Bbl) Ancillary Services Offered ($ fee) Leased Capacity (Bbl) Rate ($/Bbl/Month) Sources Drivers Ancillary Revenue Predominantly fixed fee charges for essential handling and logistics services performed by TransMontaigne (20%) Firm Commitments Take - or - pay reservation charges; storage capacity rental income (80%) 9/30 LTM Revenue by Region 9/30 LTM Revenue Mix 74% 8% 6% 12% Fossil Fuels Jet Fuel Other products (Asphalt, Chemicals) Renewables 2 20
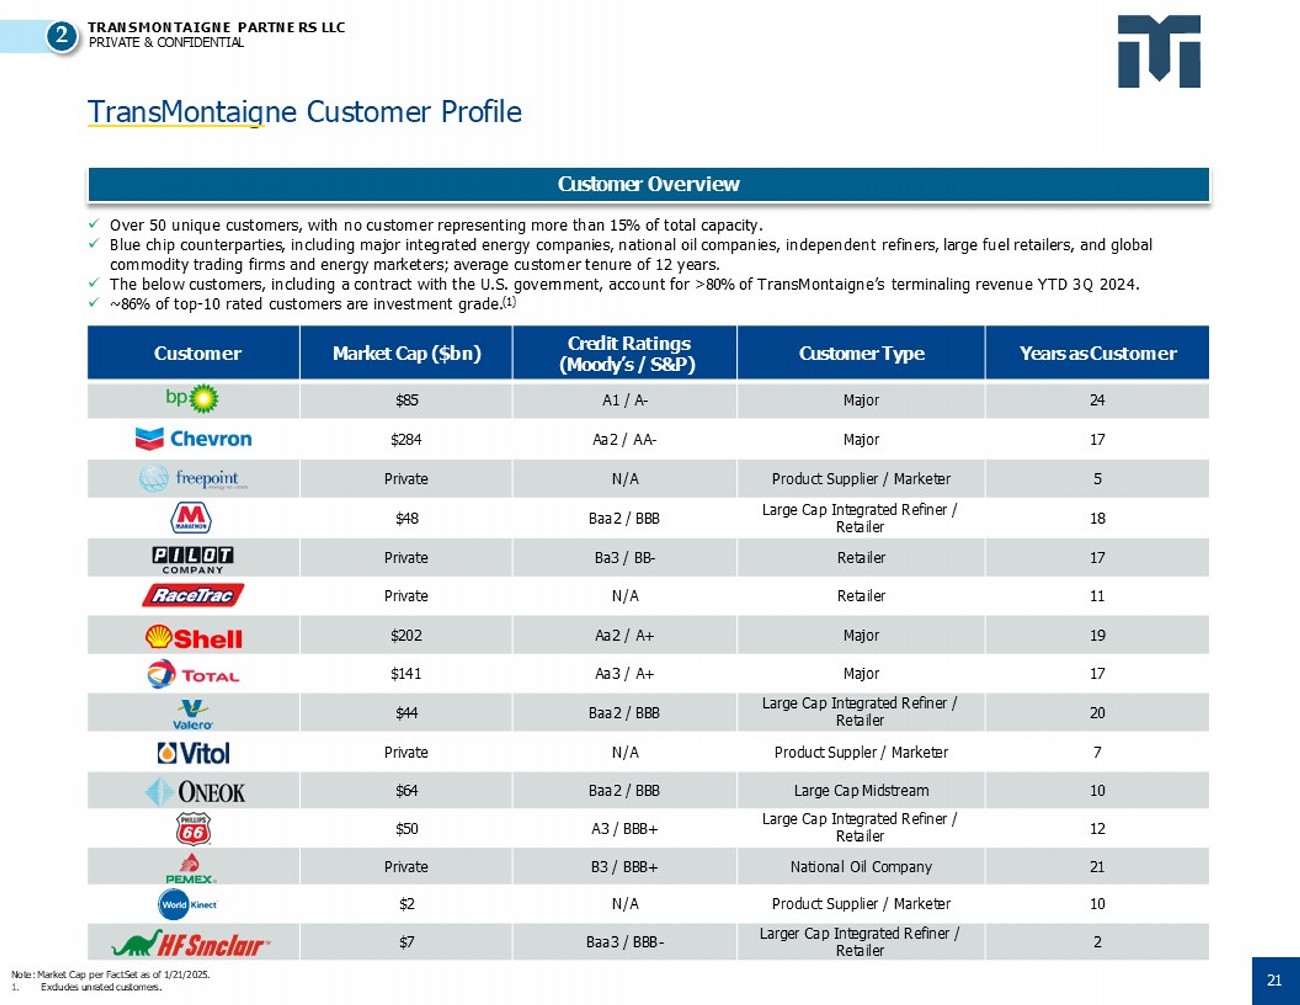
TRANSMONTAIGNE PARTNE RS LLC PRIVATE & CONFIDENTIAL Customer Overview TransMontaig ne Customer Profile Note: Market Cap per FactSet as of 1/21/2025. 1. Excludes unrated customers. x Over 50 unique customers, with no customer representing more than 15% of total capacity. x Blue chip counterparties, including major integrated energy companies, national oil companies, independent refiners, large fuel retailers, and global commodity trading firms and energy marketers; average customer tenure of 12 years. x The below customers, including a contract with the U.S. government, account for >80% of TransMontaigne’s terminaling revenue YTD 3Q 2024. x ~86% of top - 10 rated customers are investment grade. (1) Years as Customer Customer Type Credit Ratings (Moody’s / S&P) Market Cap ($bn) Customer 24 Major A1 / A - $85 17 Major Aa2 / AA - $284 5 Product Supplier / Marketer N/A Private 18 Large Cap Integrated Refiner / Retailer Baa2 / BBB $48 17 Retailer Ba3 / BB - Private 11 Retailer N/A Private 19 Major Aa2 / A+ $202 17 Major Aa3 / A+ $141 20 Large Cap Integrated Refiner / Retailer Baa2 / BBB $44 7 Product Suppler / Marketer N/A Private 10 Large Cap Midstream Baa2 / BBB $64 12 Large Cap Integrated Refiner / Retailer A3 / BBB+ $50 21 National Oil Company B3 / BBB+ Private 10 Product Supplier / Marketer N/A $2 2 Larger Cap Integrated Refiner / Retailer Baa3 / BBB - $7 2 21
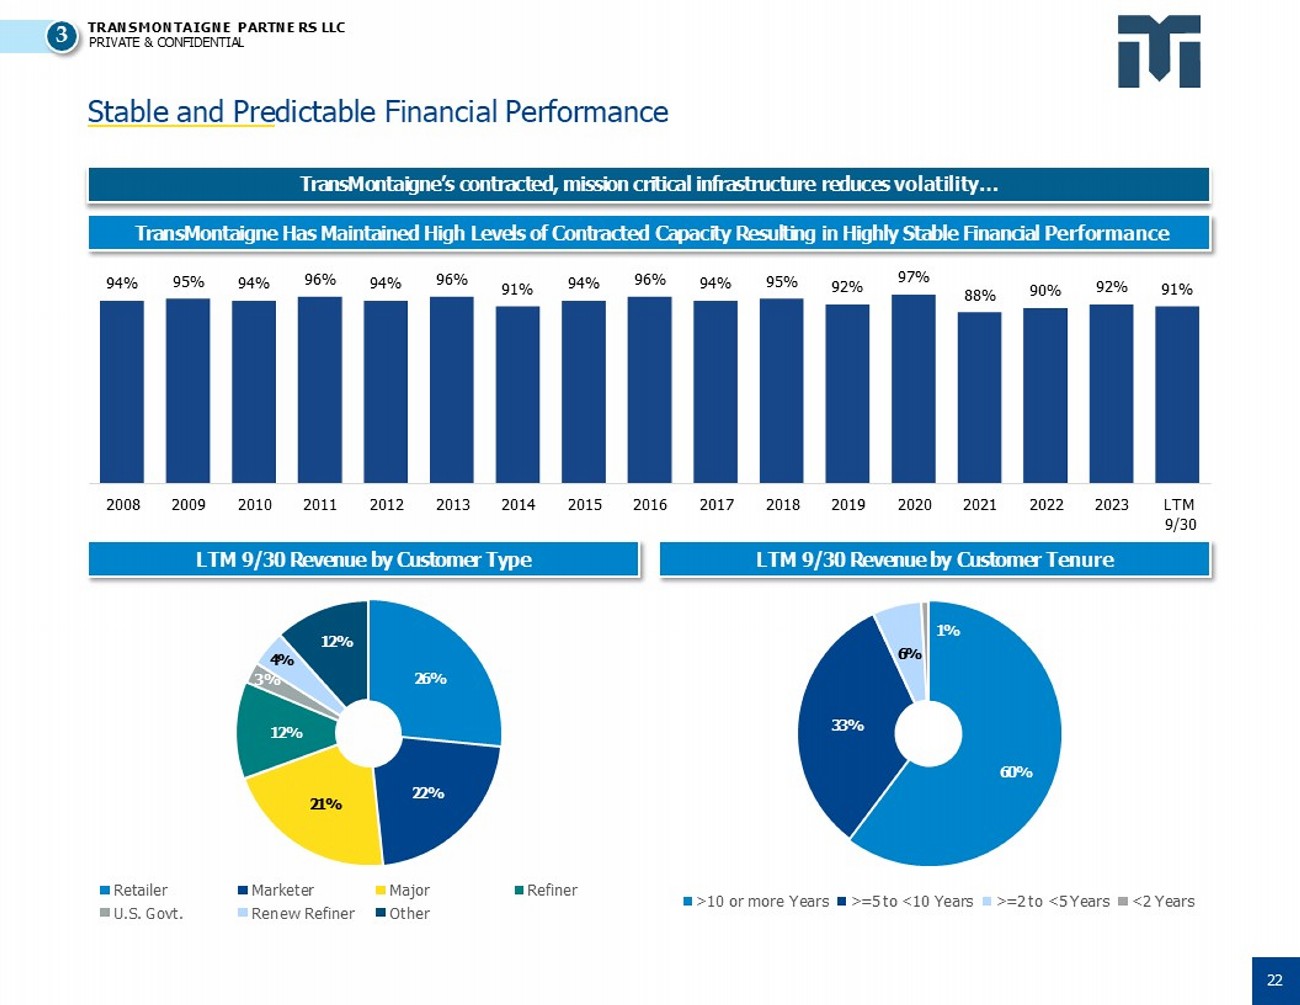
TRANSMONTAIGNE PARTNE RS LLC PRIVATE & CONFIDENTIAL Stable and Pre dictable Financial Performance TransMontaigne’s contracted, mission critical infrastructure reduces volatility… TransMontaigne Has Maintained High Levels of Contracted Capacity Resulting in Highly Stable Financial Performance LTM 9/30 Revenue by Customer Type 95% 91% 96% 96% 96% 94% 94% 94% 94% 94% 95% 92% 97% 88% 90% 92% 91% 2008 2009 2010 2011 2012 2013 2014 2015 2016 2017 2018 2019 2020 2021 2022 2023 LTM 9/30 LTM 9/30 Revenue by Customer Tenure 60% 33% 6% 1% >10 or more Years >=5 to <10 Years >=2 to <5 Years <2 Years 26% 22% 21% 12% 4% 3% 12% Retailer U.S. Govt. Marketer Renew Refiner Major Other Refiner 3 22
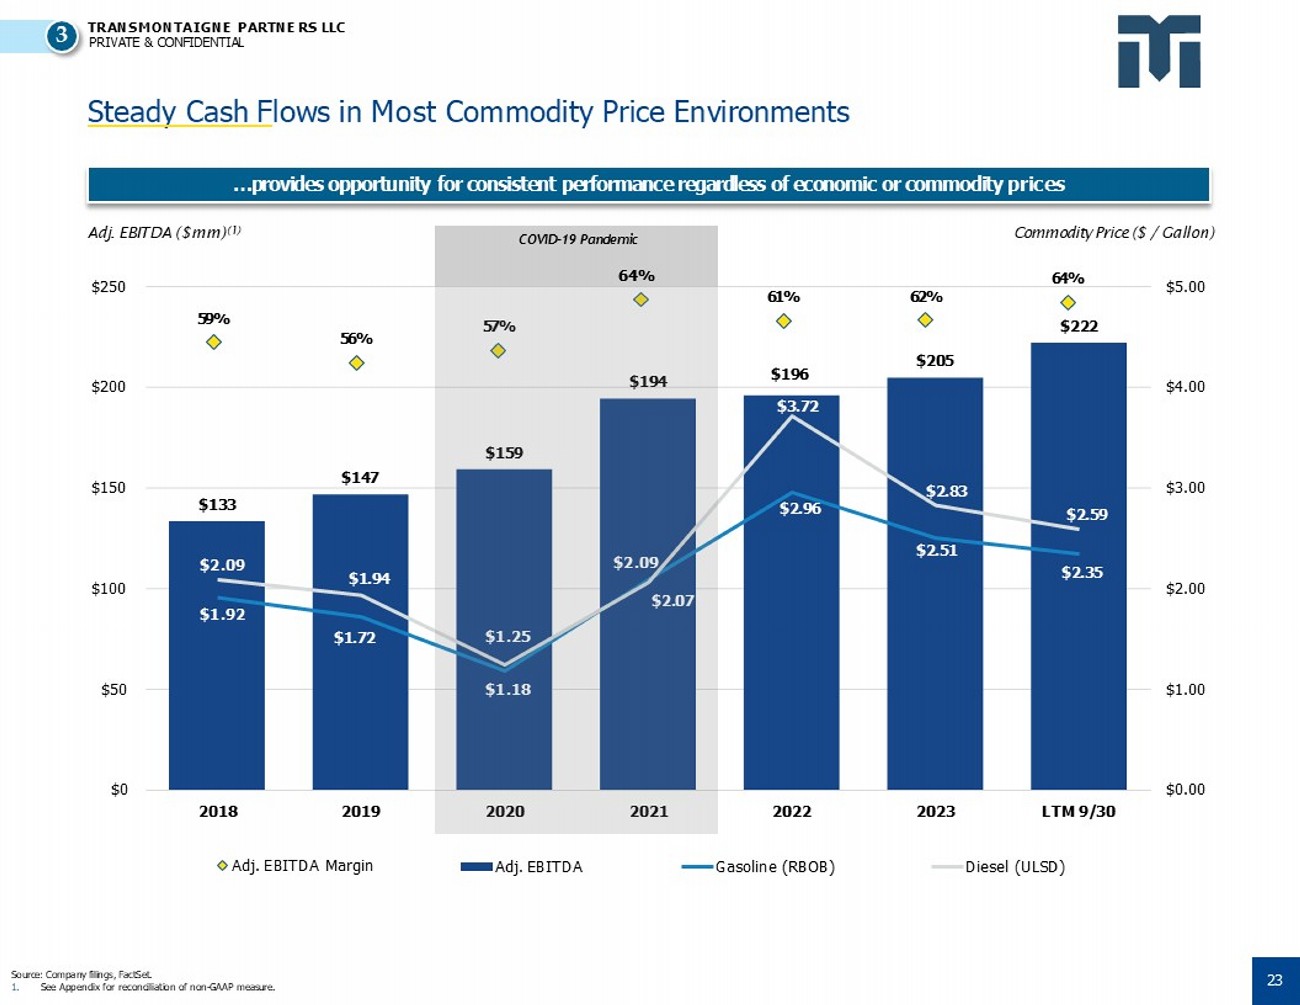
TRANSMONTAIGNE PARTNE RS LLC PRIVATE & CONFIDENTIAL 59% 56% 57% 61% 62% 64% Adj. EBITDA Margin $133 $147 $159 $194 $196 $205 $222 $1.72 $2.96 $2.51 $2.35 $2.09 $1.92 $1.94 $1.25 $1.18 $2.09 $2.07 $3.72 $2.83 $2.59 $0.00 $1.00 $2.00 $3.00 $4.00 $5.00 $0 $50 $100 $150 $200 $250 2018 2019 2020 2021 2022 2023 LTM 9/30 Adj. EBITDA Gasoline (RBOB) Diesel (ULSD) Steady Cash F lows in Most Commodity Price Environments Source: Company filings, FactSet. 1. See Appendix for reconciliation of non - GAAP measure. …provides opportunity for consistent performance regardless of economic or commodity prices COVID - 19 Pandemic 64% Adj. EBITDA ($mm) (1) Commodity Price ($ / Gallon) 3 23

TRANSMONTAIGNE PARTNE RS LLC PRIVATE & CONFIDENTIAL Management T eam Note: Not inclusive of all senior leaders. TransMontaigne’s leadership team is comprised of deeply experienced industry veterans Randy Maffett Chief Executive Officer • Served as CEO of TransMontaigne since 2023. • Previously the President and CEO of Sendero Capital Partners, CCO of Kinder Morgan Terminals and SVP Corporate Development of CVR Energy. • Over 45 years of energy industry experience. Rob Fuller Chief Financial Officer • Served as Chief Financial Officer, EVP and Treasurer since 2014. • Previously served as Assistant Treasurer starting in 2012 and VP Chief Accounting Officer in 2011. • Prior to TransMontaigne, spent 13 years at KPMG as a CPA. Matt White General Counsel & Secretary • Served as EVP General Counsel and Secretary since 2021. • Started as Assistant General Counsel in 2015 . • Prior experience as in - house counsel at Oracle and at the law firm Morrison & Foerster. Shawn Mongold Chief Operating Officer • Served as EVP COO since 2023. • Previously served as SVP of Engineering and Technical Services starting in 2017. • Began with a former affiliate of the company in 1996. • Prior experience at Mid - America Pipeline Company and OXY. Holly Kranzmann EVP, Business Development • Served as the EVP of Business Development since 2023. • Experience includes advisory and consulting services across the energy industry. • Previous experience includes VP of Logistics Development for Tesoro Logistics. TransMontaigne Management Team 4 24
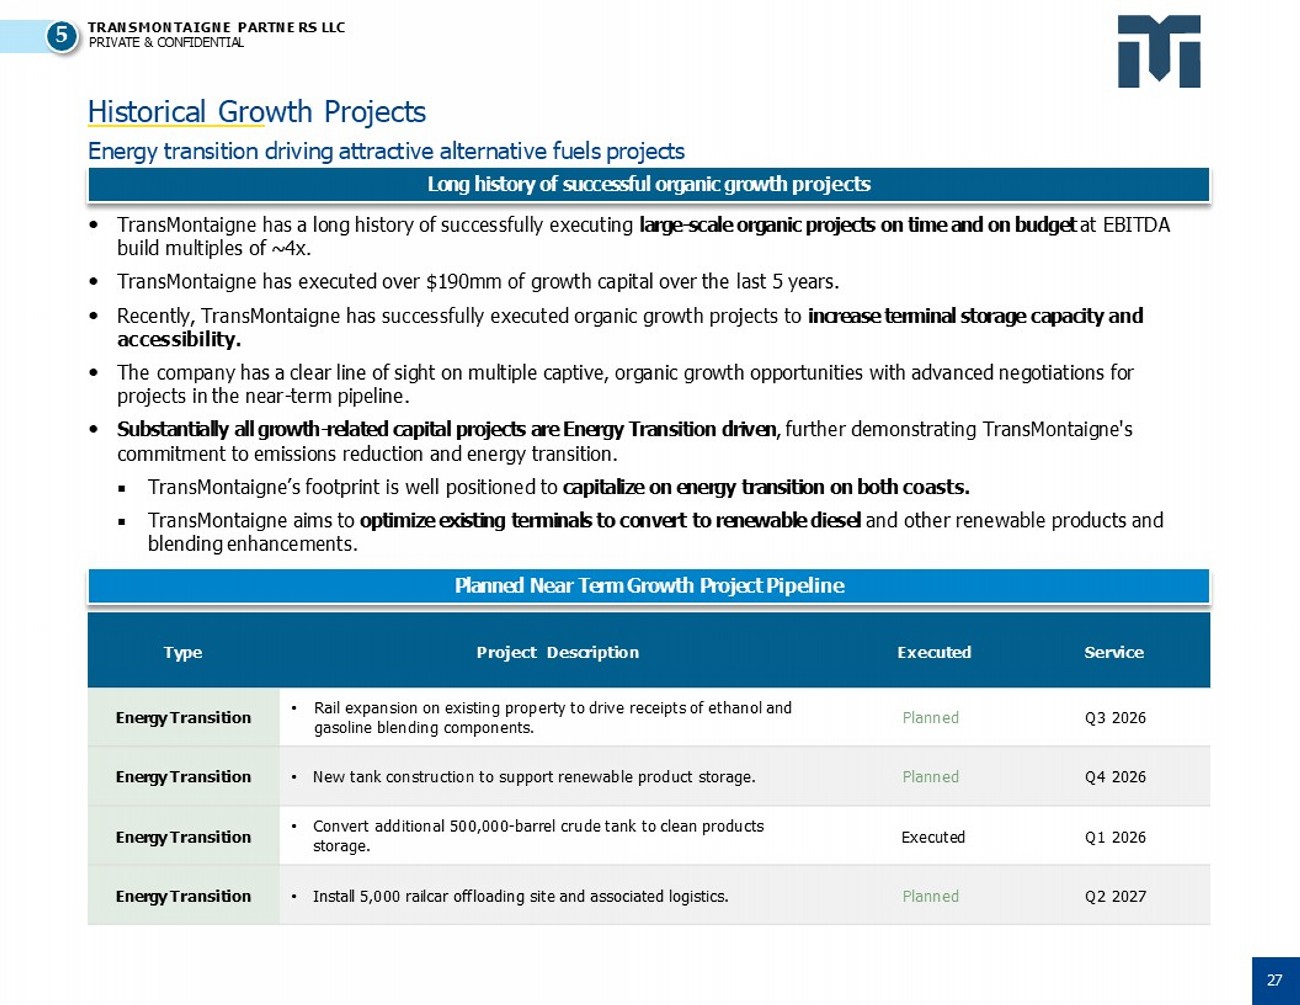
TRANSMONTAIGNE PARTNE RS LLC PRIVATE & CONFIDENTIAL Historical Gro wth Projects Energy transition driving attractive alternative fuels projects Long history of successful organic growth projects Planned Near Term Growth Project Pipeline TransMontaigne has a long history of successfully executing large - scale organic projects on time and on budget at EBITDA build multiples of ~4x. TransMontaigne has executed over $190mm of growth capital over the last 5 years. Recently, TransMontaigne has successfully executed organic growth projects to increase terminal storage capacity and accessibility. The company has a clear line of sight on multiple captive, organic growth opportunities with advanced negotiations for projects in the near - term pipeline. Substantially all growth - related capital projects are Energy Transition driven , further demonstrating TransMontaigne's commitment to emissions reduction and energy transition. TransMontaigne’s footprint is well positioned to capitalize on energy transition on both coasts. TransMontaigne aims to optimize existing terminals to convert to renewable diesel and other renewable products and blending enhancements. Service Executed Project Description Type Q3 2026 Planned • Rail expansion on existing property to drive receipts of ethanol and gasoline blending components. Energy Transition Q4 2026 Planned • New tank construction to support renewable product storage. Energy Transition Q1 2026 Executed • Convert additional 500,000 - barrel crude tank to clean products storage. Energy Transition Q2 2027 Planned • Install 5,000 railcar offloading site and associated logistics. Energy Transition 5 27

TRANSMONTAIGNE PARTNE RS LLC PRIVATE & CONFIDENTIAL Noteworthy U pdates and Initiatives Noteworthy 2024 Updates and 2025 Initiatives • TransMontaigne's assets in California and the Pacific Northwest are playing an integral role in the expansion of the domestic renewable fuels market. The Company continues to build out its presence in these markets in tandem with its investment - grade customer base. • Tacoma, WA terminal Adj. EBITDA has increased from $27 million in 2021 (time of the Tacoma terminal drop into TransMontaigne) to $44 million in LTM as of 9/30/2024. ▪ Since the 2023 inception of Washington CFS, Tacoma renewable revenue percentage has increased from 20% to 25%. • Richmond, CA terminal completed construction on a new renewable diesel tank in 2022. ▪ Renewables currently account for ~55% of Richmond’s throughput (compared to 48% in 2018). ▪ 75% of Richmond, CA revenue is attributable to renewable products. Renewable Fuels Expansion • Assets are considered essential infrastructure; terminals have continued to be contracted at high utilization rates. • The structure of the Company’s revenue contracts insulate the business from commodity price fluctuations. ▪ 80% of terminaling revenue derived from firmly committed, take - or - pay contracts. • TransMontaigne operates a small marketing business in Tacoma, utilizing ~200 Mbbls of comingled capacity. Continued Stable Financial Performance • Following a strategic review and competitive sales process, TransMontaigne has agreed to divest two terminals with expected proceeds totaling approximately $210.75 million. • The Fisher Island and Fairfax asset dispositions are expected to close in Q2’25 and Q2’26, respectively, subject to customary closing conditions. Strategic Asset Divestiture Program • Randy Maffett became the CEO of TransMontaigne at the start of Q4 2023. Mr. Maffett previously served as President and CEO of Sendero Capital Partners, Chief Commercial Officer of Kinder Morgan Terminals from 2014 to 2019, Senior Vice President Corporate Development of CVR Energy from 2011 to 2014, and in other roles in the energy industry dating back to 1979. • Fred Boutin, the previous CEO, has retired and remains on the Board of Managers. • TransMontaigne added two independent board members who are seasoned industry executives. CEO Succession / Independent BOM Members 5 28

Financial Overview

TRANSMONTAIGNE PARTNE RS LLC PRIVATE & CONFIDENTIAL $196 $205 $222 61% 62% 64% 45% 50% 55% 60% 65% 70% $0 $50 $100 $150 $200 $250 2022 2023 LTM 9/30 Adj. EBITDA Adj. EBITDA Margin Historical Fina ncial Performance TransMontaigne continues to demonstrate strong growth and robust cash flow generation Source: Company filings, TransMontaigne management. 1. Free Cash Flow defined as Adj. EBITDA – Maintenance Capex – Income Taxes. Free Cash Flow (1) ($mm) Capex ($mm) Revenue ($mm) Adj. EBITDA ($mm) $24 $30 $37 $30 $30 $27 $54 $60 $64 $0 $40 $80 $120 $160 $200 2022 Maintenance Capex 2023 LTM 9/30 Growth Capex $305 $312 $323 $14 $20 $25 $319 $333 $347 $0 $100 $200 $300 $400 $500 2022 LTM 9/30 Terminaling 2023 Marketing, net $170 $173 $183 $0 $40 $80 $120 $160 $200 2022 2023 LTM 9/30 Adj. EBITDA Margin 30
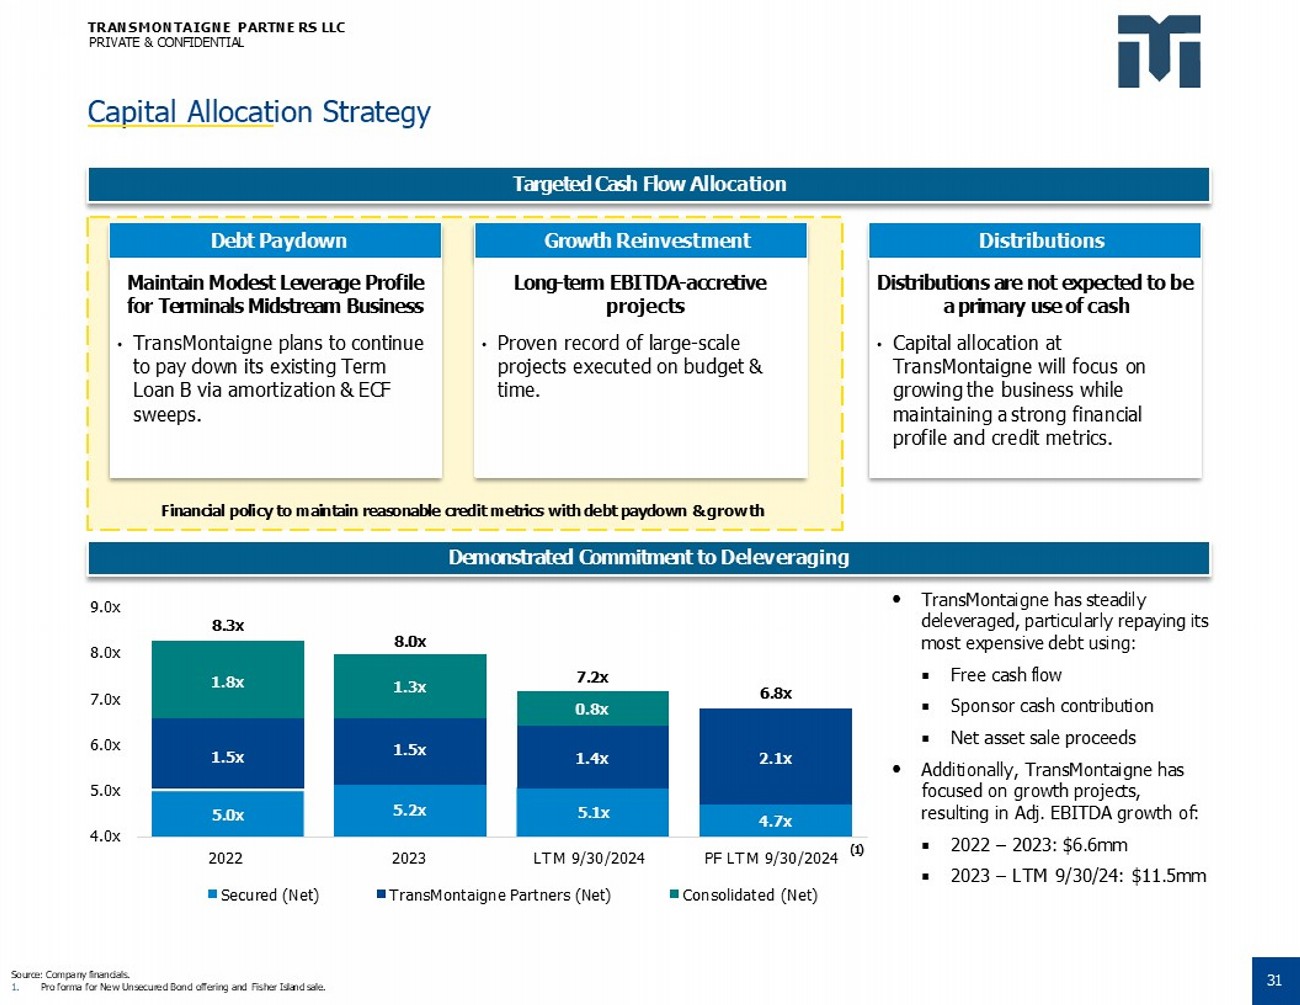
TRANSMONTAIGNE PARTNE RS LLC PRIVATE & CONFIDENTIAL Financial policy to maintain reasonable credit metrics with debt paydown & growth Capital Allocat ion Strategy Source: Company financials. 1. Pro forma for New Unsecured Bond offering and Fisher Island sale. Targeted Cash Flow Allocation Debt Paydown Growth Reinvestment Distributions Demonstrated Commitment to Deleveraging Maintain Modest Leverage Profile for Terminals Midstream Business • TransMontaigne plans to continue to pay down its existing Term Loan B via amortization & ECF sweeps. Long - term EBITDA - accretive projects • Proven record of large - scale projects executed on budget & time. Distributions are not expected to be a primary use of cash • Capital allocation at TransMontaigne will focus on growing the business while maintaining a strong financial profile and credit metrics. TransMontaigne has steadily deleveraged, particularly repaying its most expensive debt using: Free cash flow Sponsor cash contribution Net asset sale proceeds Additionally, TransMontaigne has focused on growth projects, resulting in Adj. EBITDA growth of: 2022 – 2023: $6.6mm 2023 – LTM 9/30/24: $11.5mm 5.0x 5.2x 5.1x 4.7x 1.5x 1.5x 1.4x 2.1x 1.8x 1.3x 0.8x 8.3x 8.0x 7.2x 6.8x 4.0x 5.0x 6.0x 7.0x 8.0x 9.0x 2023 LTM 9/30/2024 TransMontaigne Partners (Net) PF LTM 9/30/2024 Consolidated (Net) 2022 Secured (Net) (1) 31
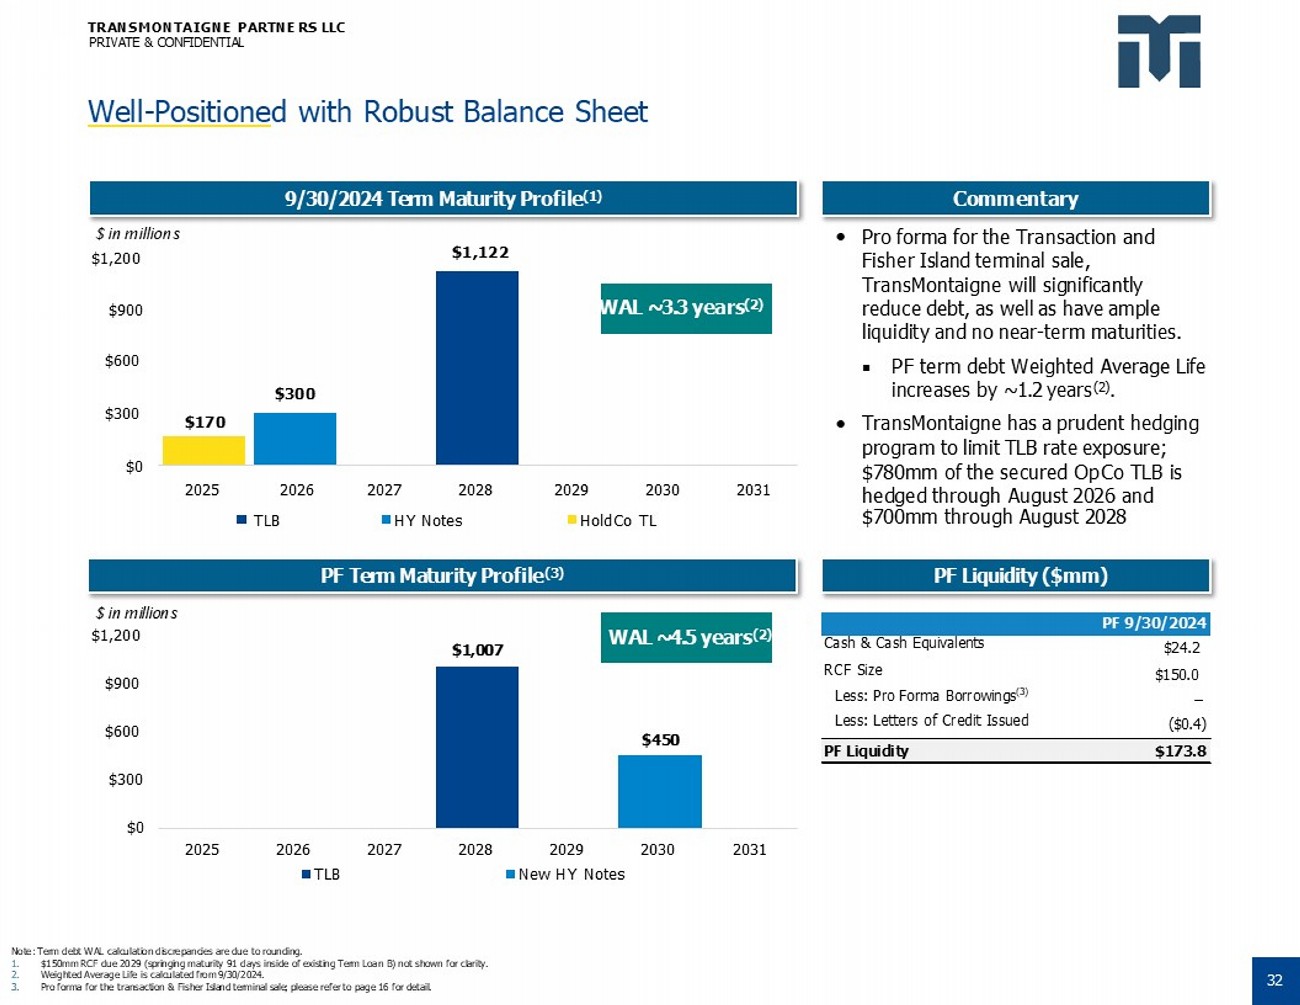
TRANSMONTAIGNE PARTNE RS LLC PRIVATE & CONFIDENTIAL Well - Positione d with Robust Balance Sheet Note: Term debt WAL calculation discrepancies are due to rounding. 1. $150mm RCF due 2029 (springing maturity 91 days inside of existing Term Loan B) not shown for clarity. 2. Weighted Average Life is calculated from 9/30/2024. 3. Pro forma for the transaction & Fisher Island terminal sale; please refer to page 16 for detail. PF Term Maturity Profile (3) PF Liquidity ($mm) 9/30/2024 Term Maturity Profile (1) Commentary Pro forma for the Transaction and Fisher Island terminal sale, $1,122 $ in millions $1,200 TransMontaigne will significantly reduce debt, as well as have ample WAL ~3.3 years (2) $900 liquidity and no near - term maturities. PF term debt Weighted Average Life increases by ~1.2 years (2) . TransMontaigne has a prudent hedging $300 $170 $600 $300 program to limit TLB rate exposure; $780mm of the secured OpCo TLB is hedged through August 2026 and 2029 2030 2031 2027 2028 2026 2025 $0 $700mm through August 2028 HoldCo TL HY Notes TLB $1,007 $450 $300 $0 $600 $900 $ in millions $1,200 2025 2026 2027 2028 2029 New HY Notes 2030 2031 TLB WAL ~4.5 years (2) PF 9/30/2024 $24.2 $150.0 Cash & Cash Equivalents RCF Size Less: Pro Forma Borrowings (3) Less: Letters of Credit Issued – ($0.4) PF Liquidity $173.8 32
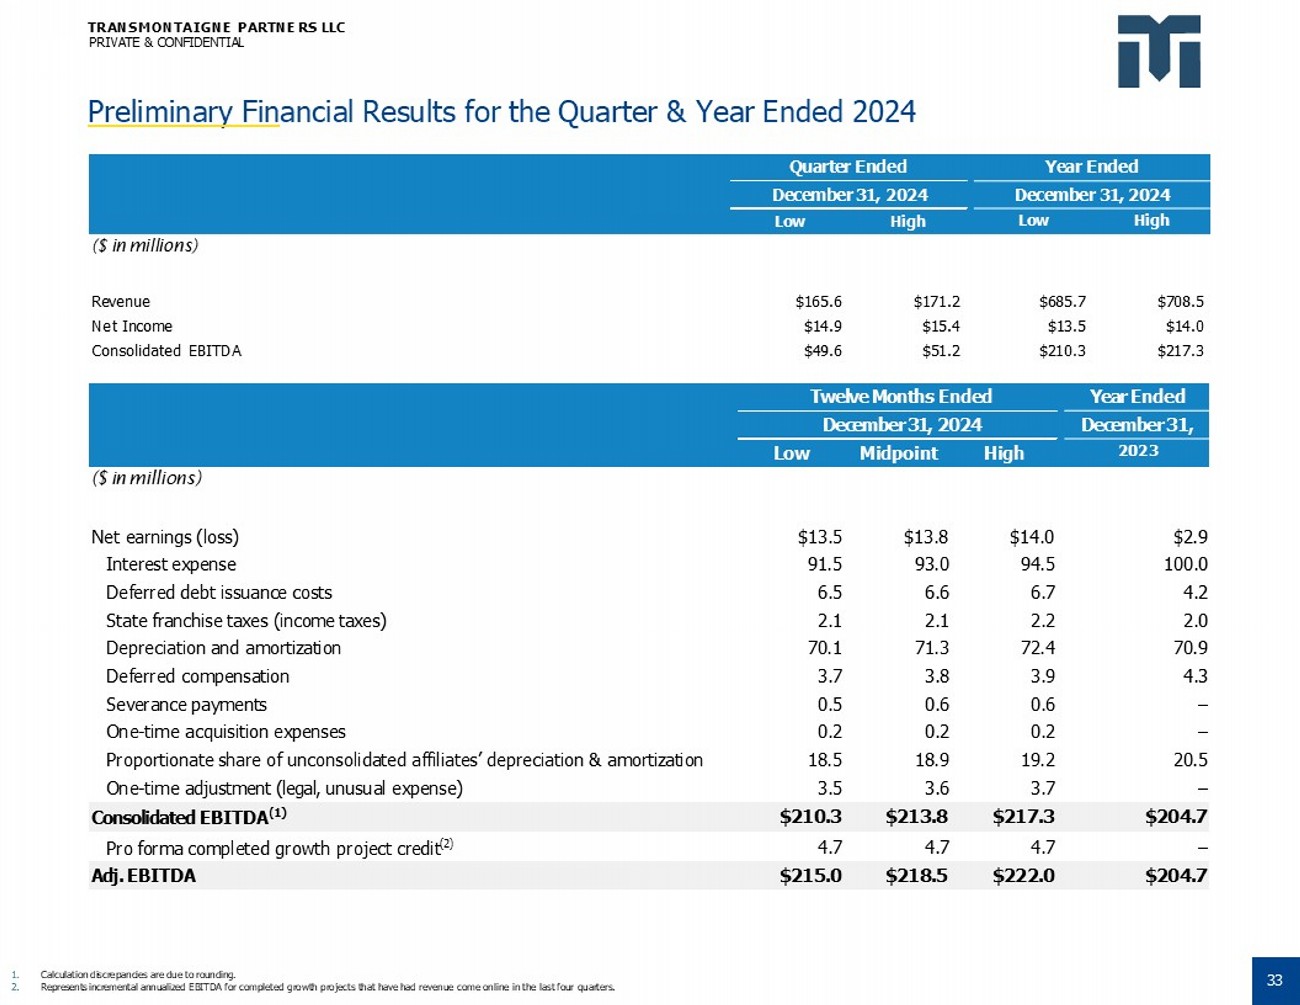
TRANSMONTAIGNE PARTNE RS LLC PRIVATE & CONFIDENTIAL Preliminary Fin ancial Results for the Quarter & Year Ended 2024 33 Year Ended Twelve Months Ended December 31, December 31, 2024 Low Midpoint High 2023 ($ in millions) $2.9 $14.0 $13.8 $13.5 Net earnings (loss) 100.0 94.5 93.0 91.5 Interest expense 4.2 6.7 6.6 6.5 Deferred debt issuance costs 2.0 2.2 2.1 2.1 State franchise taxes (income taxes) 70.9 72.4 71.3 70.1 Depreciation and amortization 4.3 3.9 3.8 3.7 Deferred compensation – 0.6 0.6 0.5 Severance payments – 0.2 0.2 0.2 One - time acquisition expenses 20.5 19.2 18.9 18.5 Proportionate share of unconsolidated affiliates’ depreciation & amortization – 3.7 3.6 3.5 One - time adjustment (legal, unusual expense) $204.7 $217.3 $213.8 $210.3 Consolidated EBITDA (1) – 4.7 4.7 4.7 Pro forma completed growth project credit (2) $204.7 $222.0 $218.5 $215.0 Adj. EBITDA 1. 2. Calculation discrepancies are due to rounding. Represents incremental annualized EBITDA for completed growth projects that have had revenue come online in the last four quarters. Year Ended Quarter Ended December 31, 2024 December 31, 2024 Low High Low High ($ in millions) $708.5 $685.7 $171.2 $165.6 Revenue $14.0 $13.5 $15.4 $14.9 Net Income $217.3 $210.3 $51.2 $49.6 Consolidated EBITDA

Appendices
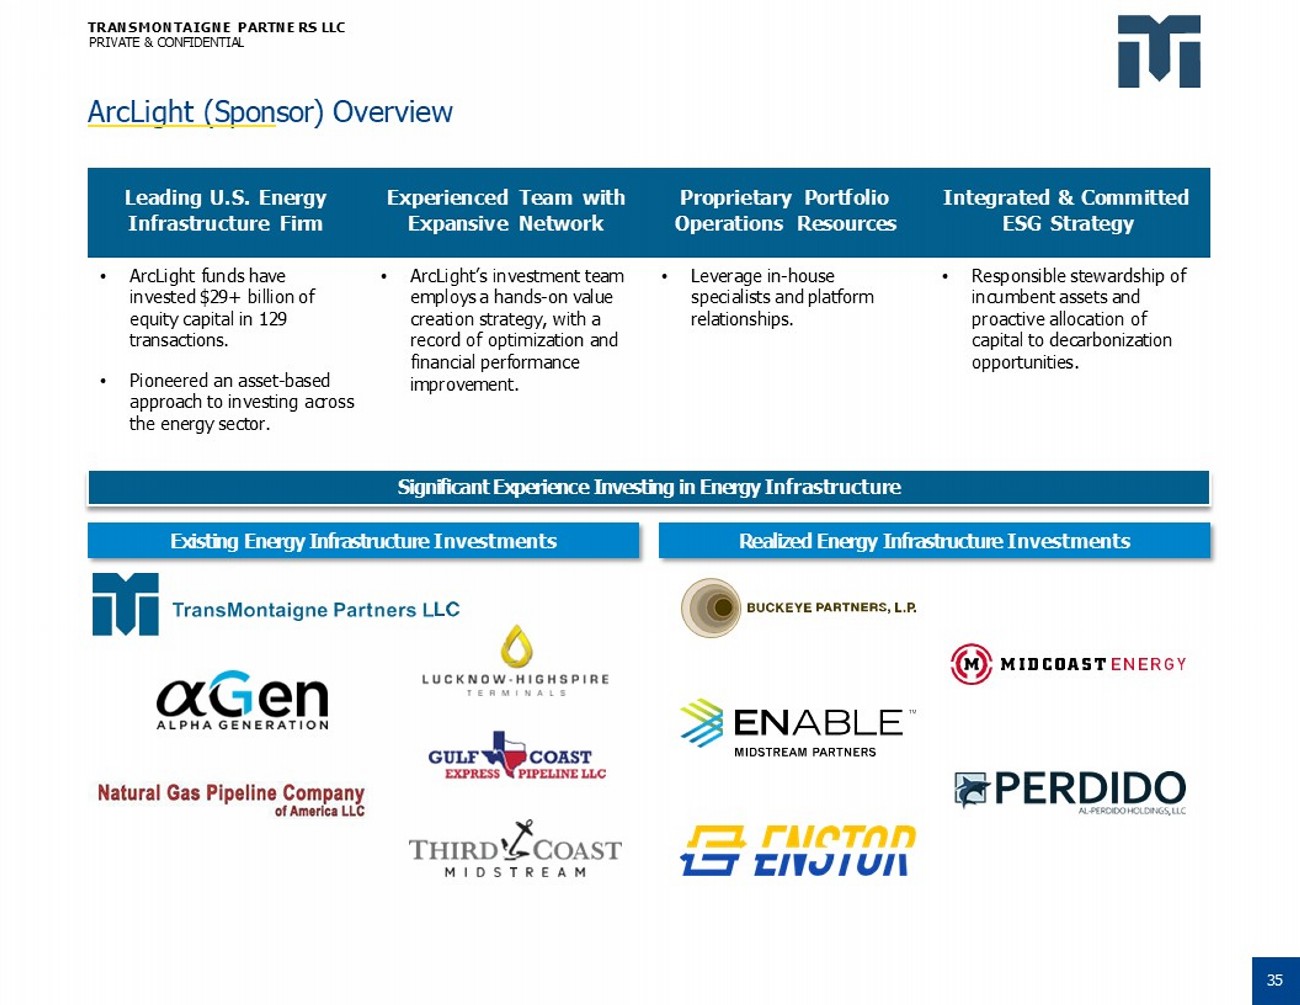
TRANSMONTAIGNE PARTNE RS LLC PRIVATE & CONFIDENTIAL ArcLight (Spon sor) Overview Integrated & Committed ESG Strategy Proprietary Portfolio Operations Resources Experienced Team with Expansive Network Leading U. S. Energy Infrastructure Firm • Responsible stewardship of incumbent assets and proactive allocation of capital to decarbonization opportunities. • Leverage in - house specialists and platform relationships. • ArcLight’s investment team employs a hands - on value creation strategy, with a record of optimization and financial performance improvement. • ArcLight funds have invested $29+ billion of equity capital in 129 transactions. • Pioneered an asset - based approach to investing across the energy sector. Significant Experience Investing in Energy Infrastructure Existing Energy Infrastructure Investments Realized Energy Infrastructure Investments 35
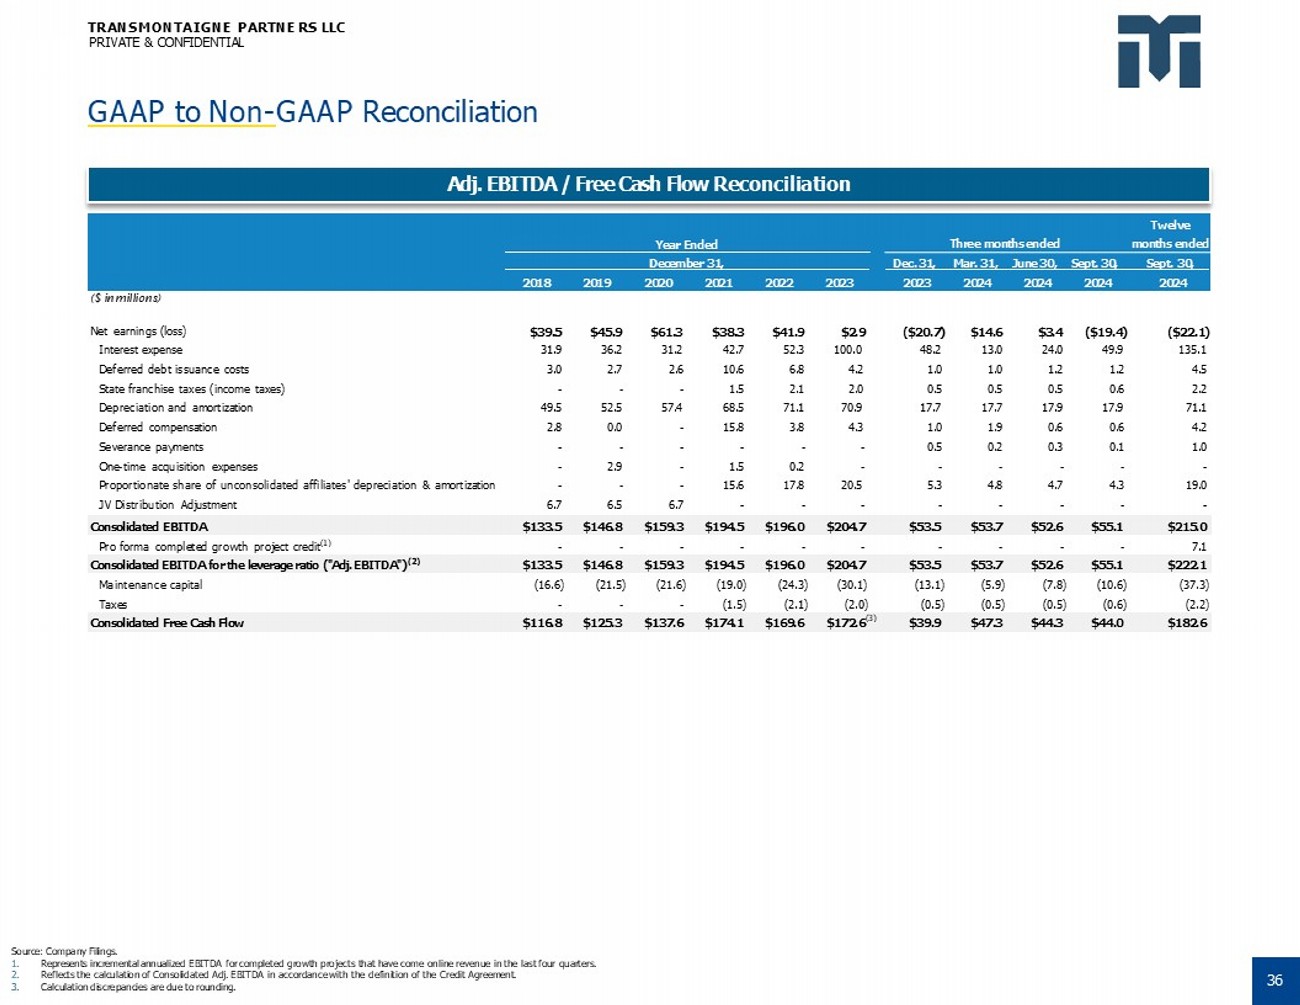
TRANSMONTAIGNE PARTNE RS LLC PRIVATE & CONFIDENTIAL GAAP to Non - GAAP Reconciliation Source: Company Filings. 1. Represents incremental annualized EBITDA for completed growth projects that have come online revenue in the last four quarters. 2. Reflects the calculation of Consolidated Adj. EBITDA in accordance with the definition of the Credit Agreement. 3. Calculation discrepancies are due to rounding. Adj. EBITDA / Free Cash Flow Reconciliation Twelve Three months ended months ended Year Ended Dec. 31, Mar. 31, June 30, Sept. 30, Sept. 30, December 31, 2023 2024 2024 2024 2024 2018 2019 2020 2021 2022 2023 ($22.1) ($19.4) $3.4 $14.6 ($20.7) $2.9 $41.9 $38.3 $61.3 $45.9 $39.5 ($ in millions) Net earnings (loss) 135.1 49.9 24.0 13.0 48.2 100.0 52.3 42.7 31.2 36.2 31.9 Interest expense 4.5 1.2 1.2 1.0 1.0 4.2 6.8 10.6 2.6 2.7 3.0 Deferred debt issuance costs 2.2 0.6 0.5 0.5 0.5 2.0 2.1 1.5 - - - State franchise taxes (income taxes) 71.1 17.9 17.9 17.7 17.7 70.9 71.1 68.5 57.4 52.5 49.5 Depreciation and amortization 4.2 0.6 0.6 1.9 1.0 4.3 3.8 15.8 - 0.0 2.8 Deferred compensation 1.0 0.1 0.3 0.2 0.5 - - - - - - Severance payments - - - - - - 0.2 1.5 - 2.9 - One - time acquisition expenses 19.0 4.3 4.7 4.8 5.3 20.5 17.8 15.6 - - - Proportionate share of unconsolidated affiliates' depreciation & amortization - - - - - - - - 6.7 6.5 6.7 JV Distribution Adjustment $215.0 $55.1 $52.6 $53.7 $53.5 $204.7 $196.0 $194.5 $159.3 $146.8 $133.5 Consolidated EBITDA 7.1 - - - - - - - - - - Pro forma completed growth project credit (1) $222.1 $55.1 $52.6 $53.7 $53.5 $204.7 $196.0 $194.5 $159.3 $146.8 $133.5 Consolidated EBITDA for the leverage ratio ("Adj. EBITDA") (2) (37.3) (10.6) (7.8) (5.9) (13.1) (30.1) (24.3) (19.0) (21.6) (21.5) (16.6) Maintenance capital (2.2) (0.6) (0.5) (0.5) (0.5) (2.0) (2.1) (1.5) - - - Taxes $182.6 $44.0 $44.3 $47.3 $39.9 $172.6 (3) $169.6 $174.1 $137.6 $125.3 $116.8 Consolidated Free Cash Flow 36