Exhibit 99.2
| |
| Technical Report on the |
| |
| Goldfield Bonanza Project |
| Esmeralda County, Nevada, U.S.A. |
| |
| |
 |
| |
| |
| |
| Prepared for |
| |
| Lode-Star Mining, Inc. |
| (LSMG : OTC) |
| |
| 1 E. Liberty Street - Suite 600, Reno, NV, 89501, USA |
| |
| |
| Report Date: January 15, 2020 |
| |
| |
| Robert M. Hatch |
| SME Registered Geologist |
| 80 Bitterbrush Road |
| Reno, Nevada 89523 |
| |
| |
| |
| |
| |
| |
| |
| |
| |
| |
TABLE OF CONTENTS
| 7.1 | Regional Geology (adapted from Seibel, et al., 2007) | 22 |
| 7.2 | Goldfield Mining District Geology (adapted from Seibel, et al., 2007) | 22 |
| 7.3 | Goldfield District Alteration and Mineralization | 25 |
| 7.4 | Goldfield Bonanza Project Geology | 28 |
| 7.5 | Goldfield Bonanza Project Mineralization | 28 |
| 7.6 | Geological and Mineralization Modeling on Goldfield Bonanza Property | 29 |
| 8.0 | DEPOSIT TYPE | 29 |
| 9.0 | EXPLORATION | 30 |
| 9.1 | Surface Mapping | 30 |
| 9.2 | Surface Sampling | 30 |
| 9.3 | Underground Rock Chip Sampling | 32 |
| 9.4 | Geophysics | 34 |
| 10.0 | DRILLING | 37 |
| 10.1 | Drill Hole Sampling Method and Approach | 37 |
| 10.1.1 | Conventional Rotary Drilling Sampling | 37 |
| 10.1.2 | Reverse Circulation Drilling Sampling | 38 |
| 10.1.3 | Core (Diamond Drill Hole) Sampling | 38 |
| 10.1.4 | Long Hole Drilling | 38 |
| 10.2 | Newmont Mining Co. Drilling | 39 |
| 10.3 | Trafalgar Mines Drilling | 39 |
| 10.4 | Westley Mines Drilling | 39 |
| 10.5 | Geochem Mines Drilling | 42 |
| 10.6 | Lode Star Gold, INC Drilling | 42 |
| 10.7 | ICN Resources Drilling | 46 |
| 10.8 | Lode-Star Mining, Inc. Drilling | 49 |
| 11.0 | SAMPLE PREPARATION, ANALYSIS, SECURITY and QUALITY ASSURANCE/QUALITY CONTROL (QA/QC) | 49 |
| 11.1 | Newmont Mining Co. Drilling | 49 |
| 11.2 | Trafalgar Mines Drilling 1979 - 1987 | 49 |
| 11.3 | Westley Mines Drilling 1985 | 50 |
| 11.4 | Geochem Mines Drilling 1990 | 50 |
| 11.5 | Lode Star Gold, INC Drilling 1998 - 2010 | 50 |
| 11.6 | ICN Resources Drilling | 50 |
| 11.7 | Lode-Star Mining, Inc. Drilling | 51 |
| 11.8 | Mine Development Associates Data Verification | 51 |
| 12.0 | DATA VERIFICATION | 52 |
| 13.0 | MINERAL PROCESSING AND METALLURGICAL TESTING | 53 |
| 13.1 | 2006 Kappes, Cassiday & Associates | 53 |
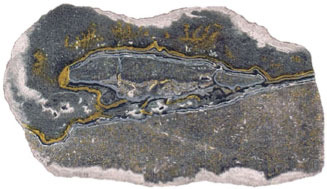
Picture on front page:
High grade gold ore from Engineers Lease on the Cornishman claim, which is immediately west and adjacent to that portion of the Cornishman controlled by Lode-Star Mining, Inc. See Figure 2.1 for location of Engineers Lease. Photograph is from Plate XXV of Ransome (2009).
TABLE OF FIGURES
TABLE OF TABLES
| Technical Report on the | 15 January 2020 |
| Goldfield Bonanza Project | |
The Goldfield Bonanza Project controlled by Lode-Star Mining, Inc. is a high-grade gold exploration and small mine development project located in the famous Goldfield Mining District in west-central Nevada. Historical production from the district is estimated to be 4.2 million ounces (130 t) of gold and included some of the highest-grade gold ores ever mined in the United States. Goldfield Bonanza consists of an historic group of patented mining claims located along the west and south sides of the “Goldfield Main District,” a small area that included the largest and richest past-producing mines at Goldfield.
The property controlled by Lode-Star Mining is the only large land position in the “Main District” not controlled by Waterton Global Resource Management, Inc. Waterton (as Gemfield Resources, LLC) is currently advancing their nearby Gemfield Project towards large scale, open pit, heap leach production with measured and indicated “mineral resources” of 600,000 ounces averaging 0.88 g/t. Waterton also has measured and indicated resources for an open pit on their Goldfield Main District property of 775,000 ounces gold averaging 1.12 g/t1.
Lode-Star Mining’s near-term objective is to develop and mine high-grade gold mineralization as was historically mined in the Goldfield Main District. Demonstrating that extraordinary grade mineralization still exists on the Goldfield Bonanza property are drill intercepts in core holes drilled in 2011 that returned 9.5 ft (2.9 m) averaging 40.8 oz/ton (1.56 kg/t) gold, 4.5 ft (1.37 m) averaging 51.46 oz/ton (1.76 kg/t), and 9.5 ft (2.9 m) averaging 26.8 oz/ton (918 g/t).
This technical report on the Goldfield Bonanza Project was prepared at the request of Lode-Star Mining, Inc., a publicly traded company (LSMG: OTC) domiciled in the State of Nevada. The report provides an updated summary of the project since the last technical report was written in 2014 and is written in compliance with disclosure and reporting requirements set forth in the Canadian Securities Administrators’ National Instrument 43-101, Companion Policy 43-101CP, and Form 43-101F1. Although not required for their OTC listing, Lode-Star Mining has had this report prepared under NI 43-101 guidelines to provide a summary of the Goldfield Bonanza Project that is consistent with reports by other listed issuers, and to be prepared for future possible business transactions or listings.
| 1.1 | Property Description and Ownership |
The Goldfield Bonanza Project is located in Esmeralda County, Nevada, approximately 180 air miles (290 km) northwest of Las Vegas, and 200 air miles (320 km) southeast of Reno.
The property includes 31 patented lode mining claims covering 440 acres (178 ha) that are subject to an Option Agreement dated October 14, 2014 between Lode-Star Mining, Inc. and Lode Star Gold, INC., a private Nevada Corporation that owns the patented claims. Lode-Star Mining has an option to acquire an 80% interest in the property after satisfying a series of work commitments and the payment of 35,000,000 shares of common stock and $10,000,000 in pre-production royalties. Certain amendments to this agreement, along with limitations to the ownership of the patented claims, are discussed in Section 4.2.
| 1 | Waterton resource numbers are from Gemfield Resources, LLC website 12-11-2019 (https://gemfieldresources.com/about-the-goldfield-project/) |
| Technical Report on the | 15 January 2020 |
| Goldfield Bonanza Project | |
| 1.2 | Geology and Mineralization |
The Goldfield District is situated in the Basin and Range Physiographic Province which is characterized by northerly-trending mountain ranges separated by gently-sloping, sediment-filled structural basins. Superimposed on the Basin and Range structure in western Nevada is the Walker Lane Structural Zone, roughly parallel to the California-Nevada state line. This is a series of northwest trending strike-slip faults and north to northeast striking oblique-slip and normal faults. The Walker Lane is host to several precious metal mining districts in addition to Goldfield, such as Tonopah, Divide, Rawhide and Klondyke to the northwest, Bullfrog, Rhyolite and Railroad Springs to the southeast.
The district is a classic example of a volcanic-hosted, epithermal gold deposit of the high-sulfidation, quartz-alunite type, some of which are extremely large. Other examples of this deposit type are Paradise Peak (Nevada), Summitville (Colorado), El Indio (Chile), Pascua-Lama, (Chile-Argentina), and Tambo (Chile). Mineralization in the Goldfield district is spatially and genetically related to a circular Tertiary intrusive and eruptive center and is dominantly hosted in Oligocene to Miocene volcanic rocks.
The Goldfield District is quite large, however most of the production of gold has come from high-grade bodies located in a relatively small area northeast of the Goldfield town site that is referred to as “the Main District.” Mineralization is generally localized in zones of strong silica-alunite alteration (“ledges”) surrounded by wider zones of clay alteration surrounded by a large area of propylitic alteration. The principal host rocks are a dacite and the Milltown Andesite. Higher gold grades are not distributed evenly throughout the altered host rocks and occur as asymmetrical sheets, blobs, pipes and shoots. Irregular breccia bodies associated with late stage silica and clays filling open spaces are usually present and gold mineralization is commonly associated with this late stage event. Mineralization at Goldfield consists of native gold with bismuth and copper-arsenic-antimony-bearing sulfides. For the most part the gold is present as tiny grains in sulfides and tellurides, or as disseminations in quartz.
What makes the Goldfield Bonanza project area unique from the rest of the “Main District,” is that approximately 75% of the project area is covered by gravels of the post-mineral Siebert Formation. The post-mineral nature of this unit was not recognized until the 1940’s, well after the major gold rush in the district.
| 1.3 | Mining and Exploration History |
The Goldfield district was discovered late in 1902 and the first significant production was late in 1903 from the Combination mine located within the outline of Lode-Star Mining’s claim group2. An estimated 4.2 million ounces (130 t) of gold were produced between 1903 and 1960, with more than 90% produced before 1919. Important producers in the “Main District” included the Mohawk, Combination, Florence, Jumbo, January (on Lode-Star property) and Red Top Mines. Some of the ore from these mines was incredibly rich, assaying pounds per ton gold. A famous example is production from the Hayes-Monette lease on the Mohawk claim, which, as of 1909, “produced in round figures $5,000,000 from ore averaging $400 a ton” (Ransome, 1909). At the prevailing price of gold of $20.67 per ounce, five million dollars equates to approximately 258,400 ounces (8,036 kg), and four hundred dollars a ton equates to 19.35 oz/ton (663.4 g/t) gold.
| 2 | Initial production was from the surface to the 380’ level on the south half of the Combination No. 1 claim and the north half of the Combination No. 2 claim; Lode-Star Mining’s control is below the 380’ level in this area. |
| Technical Report on the | 15 January 2020 |
| Goldfield Bonanza Project | |
Additional production from the Goldfield Bonanza property included that of high-grade ores from the Phelan Shaft in the northern part of the property and from several other shafts on the property. The last significant production was made by Newmont Mining in 1949-51 in the Newmont Lode and Red Hills areas.
The modern exploration history of the Goldfield Bonanza property is complex, with the property being explored by Trafalgar Mines from 1979 to 1984 and Westley Mines from 1984 to 1985. Exploration programs conducted by Trafalgar and Westley combined included drilling 37,000 ft (11,278 m) of exploration holes and seismic studies. From 1988 to 1997 Geochem Mines explored the property, with their principal contribution being rehabilitation of the February Premier Shaft. Lode Star Gold explored the property from 1998 to 2010, with efforts concentrated in the Newmont Lode and Red Hills areas. Their program included rehabilitation and sampling of old workings, and extensive surface and underground drilling that totaled 39,300 ft (11,979 m).
ICN Resources, Inc. completed an Option Agreement with Lode Star Gold in 2011 and carried out an extensive exploration program that included a biogeochemical study, a controlled source audio-frequency magnetotellurics (CSAMT) geophysics survey of the entire property, 8548 ft (2605 m) of core drilling in 26 holes and 27,400 ft (8354 m) of reverse circulation drilling in 63 RC holes. Highlights of the core drilling included 9.5 ft (2.9 m) averaging 40.8 oz/ton (1.56 kg/t) gold, 4.5 ft (1.37 m) averaging 51.46 oz/ton (1.76 kg), and 9.5 ft (2.9 m) averaging 26.8 oz/ton (918 g/t). ICN was acquired by Corazon Gold in October 2012, however, Corazon had to relinquish the property in September 2013 when it failed to meet the terms of the ICN Option Agreement.
Since 2013, Lode Star Gold has begun geological modeling of the high-grade gold zones, performed additional metallurgical work, and formulated a detailed plan for further development of the property. Lode Star Gold, and now Lode-Star Mining, have maintained the February Premier Shaft and hoist in working order for underground access for the purposes of sampling, drilling, geological mapping, bulk sample extraction, and future mining.
A total of 70,441 ft (21,470 m) of rotary drilling, and 41,595 ft (12,678 m) of core drilling has been completed at the Goldfield Bonanza Project between 1979 and 2011. The bulk of the drilling was done by Trafalgar from 1979 to 1982, by Lode Star Gold from 1999 to 2010 and by ICN Resources in 2011. Of the combined drilling total, just over 37.1% was core.
In 2018, Mine Development Associates of Reno, Nevada was engaged to audit existing drill data. That study verified the drill hole database and helped to indicate where in-fill drilling is needed to define resources.
| Technical Report on the | 15 January 2020 |
| Goldfield Bonanza Project | |
Lode Star Gold and Newmont Mining have conducted basic metallurgical work on mineralized rock from the property. Testing in 2006 by Kappes, Cassiday & Associates for Lode Star Gold indicated that agitated cyanide leaching worked well, with up to 96% recovery after 24 hours. Gravity concentration and flotation worked less effectively. In 2010 a test by Newmont showed that roasting followed by agitated cyanide leaching produced 97% recovery in 24 hours.
Some additional metallurgical testing was done in 2017 by Kappas, Cassiday & Associates. That work was specifically focused on gravity concentration and column leach testing in order to assess the potential for processing of Goldfield ores by a third party. Testing showed that gravity concentration alone was not a suitable method for treating those ores, however, column leach testing on concentrates from the gravity concentration tests and showed a 76% recovery. Since the tests were run on gravity concentrates rather than raw ore, and the results were not as good as expected, the application of column leach tests on gravity concentrates is uncertain.
Additional testing in 2019 by Kappes, Cassiday & Associates on 400 kg of raw ore was designed to provide further guidance regarding the processes necessary to achieve highest levels of extraction from a third-party mill. Although recovery from simple cyanide soluble metal extraction tests from pulverized material only averaged 59% for gold and <1% for silver, extractions of both gold and silver from bottle roll leach tests on gravity and flotation products exceed 97% on all samples. Kappes, Cassiday & Associates noted that milling size does not significantly affect the gold or silver extraction.
| 1.6 | Mineral Resource Estimate |
There are no gold-silver resources or reserves defined at the Goldfield Bonanza Project.
| 1.7 | Interpretation and Conclusions |
The Goldfield Bonanza property is geologically essentially a continuation of the “Goldfield Main District”, the difference being large areas of this property are covered by post-mineral Seibert Formation. The post-mineral nature of this unit was not recognized until the 1940’s, therefore the discovery potential beneath the Seibert Formation was not, and could not have been, heavily prospected during the gold rush years at Goldfield beginning in 1903. Accordingly, the Goldfield Bonanza Project area is the most under-explored part of the Goldfield Main District for bonanza gold and silver mineralization. High-grade drill intercepts from recent drilling on the property, some of which are noted above, demonstrate that bonanza grade mineralization for which the Goldfield District became famous remains to be found and mined from Goldfield Bonanza Project. Drilling on the Goldfield Bonanza Project also reveals the erratic and irregular distribution of gold within the mineralized ledges as is typical of Goldfield; extremely high grades may be found in close proximity (<1 meter) to low grade or unmineralized altered rock that essentially looks the same. Accordingly, conventional logic regarding “drilling out” or modeling gold/silver mineralization with wide-spaced drilling does not apply to the high grade, underground minable mineralization at Goldfield. Due to this, and the post-mineral cover, exploration of the project area must be accomplished with shafts and exploration drifts or tightly spaced drill holes.
| Technical Report on the | 15 January 2020 |
| Goldfield Bonanza Project | |
Exploration work conducted over the last 18 years by Lode Star Gold and others has identified at least 5 “ledges” which have been shown by drilling to contain bonanza-grade gold mineralization. Numerous intercepts with multi-ounce gold grades have been drilled in the Red Hills-Newmont Lode area, and four specific high-grade zones within the ledges have been identified. Additional silicified ledges have also been discovered in the Church Shaft area, and these too have yielded multi-ounce gold grades. Those ledges are geologically the same as those that historically yielded over 4 million ounces of gold from high grade ores in the Goldfield District, and thus contain discovery potential for significant high-grade gold-silver mineralization.
Lode-Star Mining’s immediate goal is to complete close-spaced drilling in the Church Shaft and Red Hills areas to further define the known pods of high-grade gold mineralization in preparation for development and mining.
Several other exploration targets are indicated by drilling results, geophysics and geochemistry, and future drilling of these targets may discover additional potentially minable, high-grade gold mineralization.
To achieve their goal of further defining the known high grade pods in the Church Shaft - Red Hills areas, Lode-Star Mining plans to continue geologic modeling of the mineralization followed by drilling 12,400 ft (3780 m) of infill and step-out holes. All drilling planned for this phase of exploration will be from the surface. The budget proposed by Lode-Star for this drilling program is $953,000. This author believes that the program planned by Lode-Star Mining is appropriate for the stated objectives and is recommended.
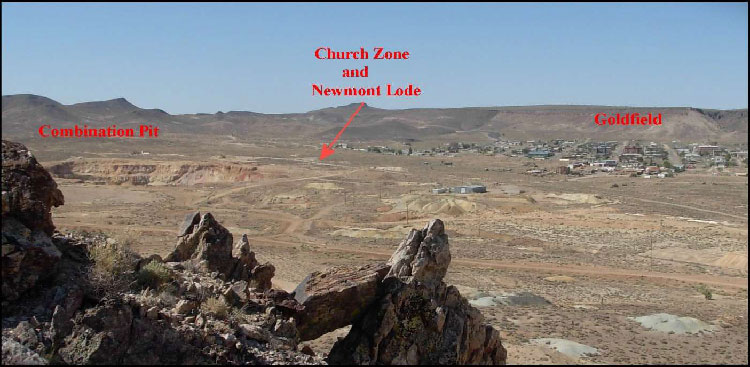
Figure 1.1 Goldfield from Columbia Mountain
| Technical Report on the | 15 January 2020 |
| Goldfield Bonanza Project | |
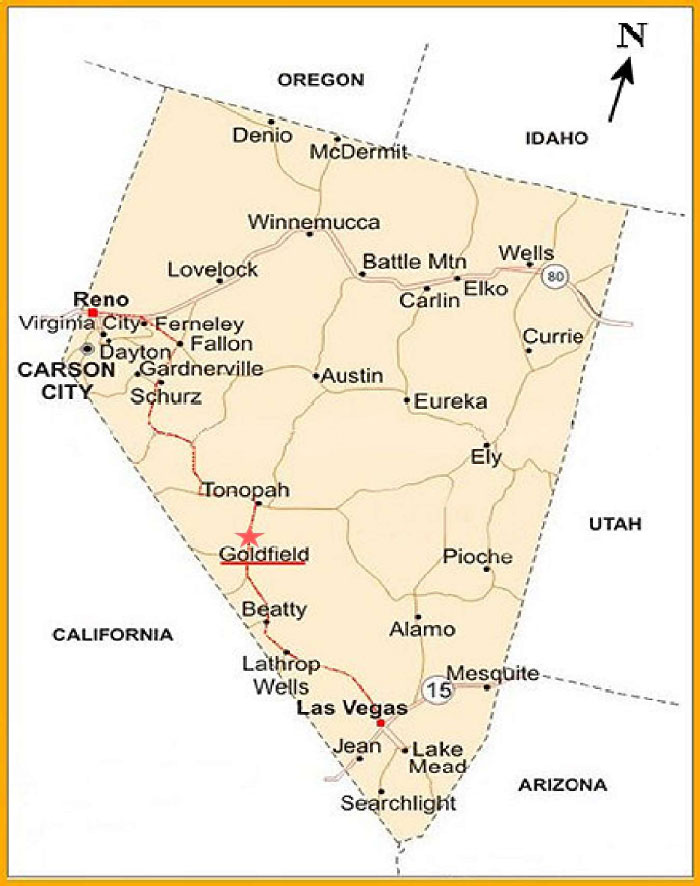
Figure 1.2 Goldfield Bonanza Project Location Map.
| Technical Report on the | 15 January 2020 |
| Goldfield Bonanza Project | |
| 2.0 | INTRODUCTION AND TERMS OF REFERENCE |
The author has prepared this technical report on the Goldfield Bonanza Project at the request of Lode-Star Mining, Inc. (LSMG : OTC). Prior to a name change in 2015, Lode-Star Mining was known as International Gold Corp.
This report provides an updated summary of the Goldfield Bonanza property since the last technical report was completed by Dana Durgin in 2014 (Durgin, 2014). Although not required for their OTC listing, Lode-Star Mining has had this report prepared under NI 43-101 guidelines to provide a summary of the project that is consistent with reports by other listed issuers, and to be prepared for future possible business transactions or listings.
This report additionally summarizes the results from metallurgical studies conducted by Kappes, Cassiday & Associates in 2017 and 2019 (Kappes, et al., 2017, 2019), as well as the results from an audit of selected drill data and a QA/QC check assay analysis on selected Lode Star Gold drilling samples by Mine Development Associates of Reno, Nevada in 2018 (Mijal and Gustin, 2018).
| 2.1 | Sources of Information |
In preparing this report the author has relied on geologic and historical information contained in reports listed in the References section of this report. He has not independently reviewed the land tenure and agreements, the historical drill hole database, nor all geologic details derived from these reports. All information in Section 4.3 “Land Ownership” was provided by Lode-Star Mining, Inc. The results and opinions expressed in this report are conditional on that data being current, accurate and complete.
This report relies heavily on the report titled “Updated Technical Report, Geology and Mineralization, Goldfield Bonanza Project, Esmeralda County, Nevada, USA” that was written by Dana C. Durgin and dated June 12, 2014 (Durgin, 2014), and some sections of this report are for the most part derived from that report.
Other important sources of information for regional and district geology include: 1. “Geology and mineral Deposits of Esmeralda County” (Albers et al., 1972); 2. “The Geology and Ore Deposits of Goldfield, Nevada” (Ransome, 1909); and 3. “Technical Report on the Goldfield Project, Esmeralda County, Nevada USA ” (Hardy, et al., 2002).
Lode-Star Mining geologist Tom Temkin has been the primary source of information on the Lode Star Gold, INC. and ICN Resources work programs, and on the activities of Lode-Star Mining, Inc.
JBA Works, Inc. of Reno, Nevada prepared the maps in this report from information provided by Lode-Star Mining, Inc.
| 2.2 | Personal Site Inspection |
The author was given an underground tour on April 13, 2015, and a surface tour on April 3, 2019. These site inspections allowed the author to confirm geological relationships and characterize alteration/mineralization types exposed in surface outcrops and mine workings at the project.
| Technical Report on the | 15 January 2020 |
| Goldfield Bonanza Project | |
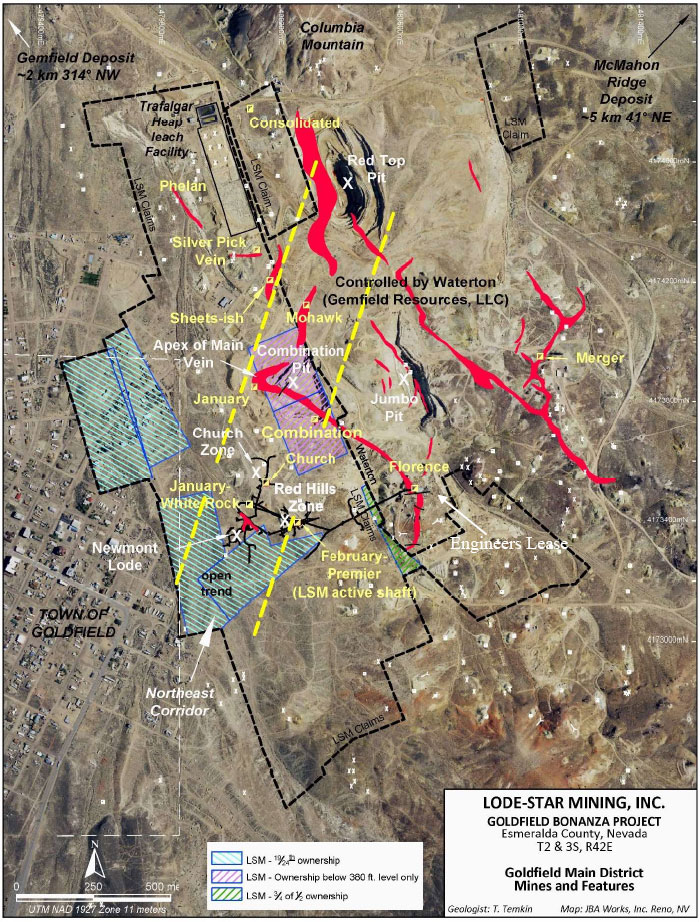
Figure 2.1 Goldfield Main District – Mines and Features
| Technical Report on the | 15 January 2020 |
| Goldfield Bonanza Project | |
| 2.3 | Units of Measure, Conversion Factors and Currency Used in this Report |
| | Linear Measure | |
| | 1 inch | = 2.54 centimeters (cm) = 254 millimeters (mm) |
| | 1 foot | = 0.3048 meter (m) |
| | 1 mile | = 1.6 kilometers (km) |
| | | |
| | Area Measure | |
| | 1 acre = 0.4047 hectare (ha) | 1 square mile = 640 acres, or 259 hectares |
| | | |
| | Capacity Measure (liquid) | |
| | 1 US gallon | = 4 quart or 3.785 liters (l) |
| | | |
| | Weight | |
| | 1 short ton | = 2000 pounds (lbs) = 0.907 tonne (t) |
| | 1 pound = 16 oz | = 0.454 kilogram (kg) = 14.5833 troy ounces (oz) |
| | | |
| | Analytical Values | |
| | Percent | Grams per Metric Tonne | Troy Oz per Short Ton |
| 1% | 1% | 10,000 | 291.667 |
| 1 gram/tonne | 0.0001% | 1 | 0.0291667 |
| 1 oz troy/ton | 0.003429% | 34.2857 | 1 |
| 100 ppb | | | 0.0029 |
| 100 ppm | | | 2.917 |
| | Commonly used abbreviations and acronyms |
| | |
| | AA | atomic absorption spectrometry |
| | Ag | silver |
| | Au | gold |
| | CIM | Canadian Institute of Mining, Metallurgical and Petroleum |
| | FA-AA | fire assay with an atomic absorption finish |
| | g/t Ag | grams of silver per metric tonne, equivalent to ppm |
| | g/t Au | grams of gold per metric tonne, equivalent to ppm |
| | kg/t Au | kilograms per metric tonne |
| | ICP | inductively coupled plasma mass spectrometry |
| | ft | feet | g | grams |
| | ha | hectares | ppm | parts per million |
| | m | meters | core | diamond drilling method |
| | mm | millimeters | RC | reverse circulation drilling method |
| | kg | kilogram | t | tonnes |
| | km | kilometers | tpd | tonnes per day |
| | Ma | million years ago | | |
| | | | | |
All monetary amounts are US Dollars.
| Technical Report on the | 15 January 2020 |
| Goldfield Bonanza Project | |
| 3.0 | RELIANCE ON OTHER EXPERTS |
The author did not take samples from outcrops, underground workings, or drill samples during his two site visits to the property to verify the presence or quantity of gold mineralization within the project area. Neither has he conducted a thorough examination of drill hole data from the property. Accordingly, the author relies on an audit of selected drill data and a QA/QC check assay analysis on selected Lode Star Gold drilling samples by Mine Development Associates of Reno, Nevada in 2018 for verification of project data (Mijal and Gustin, 2018).
| 4.0 | PROPERTY DESCRIPTION AND LOCATION |
The Goldfield Bonanza property consists of 31 patented lode mining claims covering a total of approximately 440 acres (178 ha).
The Goldfield Bonanza Project is located in Esmeralda County, Nevada, approximately 180 air miles (290 km) northwest of Las Vegas, or 200 air miles (320 km) southeast of Reno (Figure 1.2).
The main part of the Goldfield District is immediately east and north of town, at a latitude/longitude of 37 deg 42’50” North and 117 13’ 16” West. The property encompasses portions of sections 35 and 36 in T2S, R42E, and sections 1 and 2 in T3S, R42E, Mount Diablo Baseline and Meridian.
The property consists of 31 patented lode mining claims that are owned in fee by Lode Star Gold, INC., a private Nevada corporation (Figure 4.1), subject to a 1% NSR on future production to be paid to the Margraf Family Trust. Payment of annual property taxes totaling $15,500 to Esmeralda County are the only requirement to maintain ownership of the property. Certain limitations to Lode Star Gold’s ownership are shown onFigure 4.1 and described inTable 4.1and include: 1. Lode Star Gold’s interest in the south half of the Combination No. 1 claim and the north half of the Combination No. 2 claim is limited to the ground below the 380’ level where Lode Star Gold owns 100%; and 2. Lode Star Gold’s ownership is 19/24th of the total for five of the patented claims, and “3/4 of 1/2 ” for the OK Fraction claim. The effect on Lode Star Gold’s rights, responsibilities, and restrictions on activity on the claims with 19/24th ownership is a legal and land status issue and is not within the scope of this report nor the author’s expertise. In the case of the two Combination half claims, Gemfields Resources, LLC, managed by Waterton Global Resource Management, Inc., controls the surface down to the 380’ level. Gemfields Resources also controls the remaining interest in the OK Fraction not controlled by Lode Star Gold.
| Technical Report on the | 15 January 2020 |
| Goldfield Bonanza Project | |
Lode-Star Mining, Inc. (formerly International Gold Corp.), pursuant to an option agreement dated October 4, 2014 with Lode Star Gold, INC., acquired an initial 20% undivided interest in and to the mineral claims owned by Lode Star Gold, and an option to earn a further 60% interest in the claims. Lode Star Gold received 35,000,000 shares of Lode-Star Mining’s common stock and is its controlling shareholder. Until Lode-Star Mining has earned the additional 60% interest, net smelter returns on production will be split 79.2% to Lode Star Gold, 19.8% to Lode-Star Mining and 1% to the former property owner. To earn the additional 60% interest, Lode-Star Mining is required to fund all expenditures on the property and pay Lode Star Gold an aggregate of $5 million in cash in the form of net smelter returns commencing after December 11, 2014. If Lode-Star Mining failed to make any cash payments to LSG within one year of the date of the option agreement, it is required to pay Lode Star Gold an additional $100,000, and in any subsequent years in which Lode-Star Mining fails to complete the payment of the entire $5 million, it must make quarterly cash payments to Lode Star Gold of $25,000.
On January 11, 2017 Lode Star Gold agreed to defer payment of all amounts due in accordance with the mineral option agreement until further notice. On January 17, 2017, Lode-Star Mining and Lode Star Gold agreed that as of January 1, 2017, all outstanding balances shall carry a compound interest rate of 5% per annum. It was further agreed that the ongoing payment deferral shall apply to both interest and principal. The total amount of such fees due at March 31, 2019 was $448,889 (December 31, 2018: $423,913), with total interest due in the amount of $37,856 (December 31, 2018: $32,220).
On October 31, 2019 Lode Star Gold and Lode-Star Mining amended its October 4, 2014 Mineral Option Agreement by splitting the additional 60% interest into two 30% interests priced to Lode-Star Mining of $5,000,000 each for a combined total of $10,000,000. As of September 30, 2019, Lode-Star Mining owes to Lode Star Gold $517,838.39 in penalty payments and $974,047.99 in loans and advances.
Lode-Star Mining has agreed with Lode Star Gold that upon the successful completion of a toll milling agreement after permitting is achieved, it will have the basis to form a joint management committee to outline work programs and budgets, as contemplated in the option agreement, and for Lode-Star Mining to act as the operator of the property.
| 4.4 | Environmental Liabilities |
Lode-Star Mining states that it is not aware of any existing environmental liabilities on the property that they or Lode Star Gold are responsible for.
An historic heap leach operation of Trafalgar Mines, including agglomeration plant, heap leach pad and process ponds located in the north-central part of the property (Figure 2.1) are considered by Nevada Department of Environmental Protection (NDEP) to be abandoned. As Lode-Star Mining has not utilized or otherwise disturbed these facilities, NDEP considers the company exempt from any potential accountability if they do not disturb the site in the future.
| 4.5 | Limitation of Mining Within the Goldfield City Limits |
Underground mining is allowed on Lode-Star Mining’s claims that extend into the area of the town of Goldfield (Figures 2.1 and 4.1), however open pit mining, layback, or other significant surface disturbances are currently not allowed within town limits.
| Technical Report on the | 15 January 2020 |
| Goldfield Bonanza Project | |
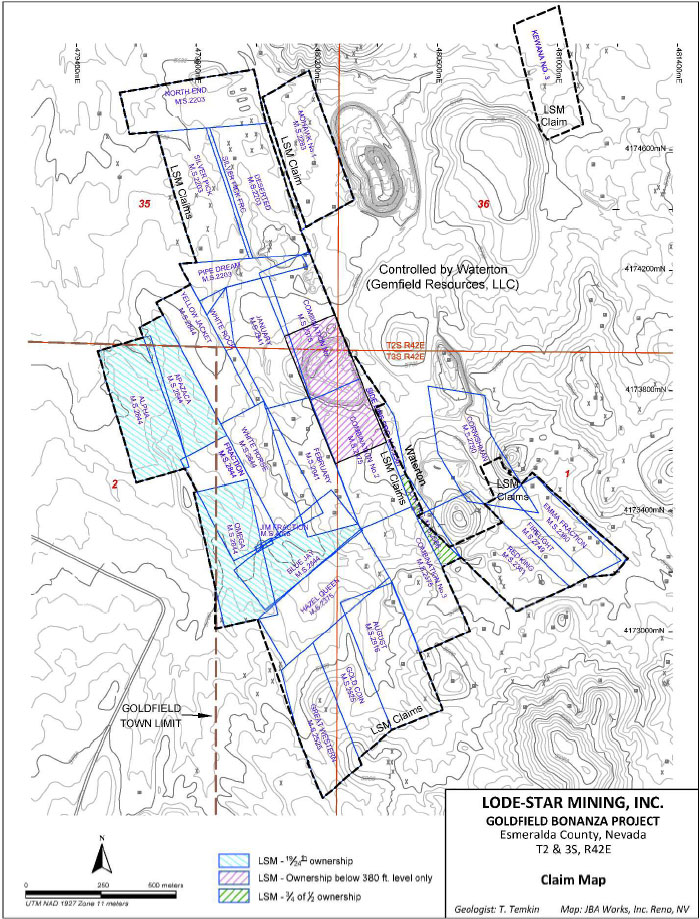
Figure 4.1 Goldfield Bonanza Claim Map
| Technical Report on the | 15 January 2020 |
| Goldfield Bonanza Project | |
Table 4.1 Goldfield Bonanza Project Claim Data
| Patented Claim Name | | U.S.
Survey No. | | Patented Claim Name | | U.S.
Survey No. |
| Combination No. 3 | | 2375 | | Deserted | | 2203 |
| August | | 2916 | | Pipe Dream | | 2203 |
| Great Western | | 2525 | | North End | | 2203 |
| Gold Coin | | 2525 | | Hazel Queen | | 2375 |
| February | | 2941 | | Fraction | | 2844 |
| Mohawk No. 1 | | 2283 | | White Horse | | 2844 |
| Side Line Fraction | | 2567 | | White Rock | | 2844 |
| January | | 2941 | | Yellow Jacket | | 2844 |
| Silver Pick | | 2203 | | Firelight | | 2749 |
| Silver Pick Fraction | | 2203 | | Emma Fraction | | 2360 |
| Red King - S.E. 2/3 (more or less) | | 2361 | | Kewana #3 | | 2565 |
| Cornishman – S.E. portion(1) | | 2750 | | | | |
| Combination No. 1 Claim(2) | | 2375 | | | | |
| Combination No 2 Claim(3) | | 2375 | | Notes | | |
| Blue Jay(4) | | 2844 | | 19/24th interest | | |
| Omega(4) | | 2844 | | 19/24th interest | | |
| Apazaca(4) | | 2844 | | 19/24th interest | | |
| Alpha(4) | | 2844 | | 19/24th interest | | |
| Jim Fraction(4) | | 4096 | | 19/24th interest | | |
| O.K. Fraction(5) | | 2566 | | ¾ of ½ interest | | |
Notes:
| (1) | Map depiction of Cornishman claim may need to be revised per further review. |
| (2) | Includes all of the north half of such claim, along with the ground below 380 feet on the south half of such claim. Surface to 380’ is owned by Gemfield Resources, LLC which is managed by Waterton Global Resource Management. |
| (3) | Includes all of the south half of such claim, along with the ground below 380 feet on the south half of such claim. Surface to 380’ is owned by Gemfield Resources, LLC. |
| (4) | As last recorded February 9, 1994, ownership of the 5/24th interests in the Omega, Blue Jay, Apazaca, Alpha, and Jim Fraction claims reside with the estates of two individuals. Lode-Star Mining is currently working to acquire those interests. |
| (5) | Remaining ownership interest is owned by Gemfield Resources, LLC. |
| Technical Report on the | 15 January 2020 |
| Goldfield Bonanza Project | |
All surface and underground exploration, and preparation for underground mining, has been conducted under an approved Notice of Disturbance, issued through the Nevada Department of Environmental Protection (NDEP), Mining Regulation and Reclamation Branch. This is a non-bonded permit allowing for up to five acres (2.0 ha) of surface disturbance. Currently the level of surface disturbance is under 2.0 acres (0.81 ha).
An air quality permit to allow for the operation of diesel equipment and the emission of expected fugitive dust resulting from the mining operations has been submitted and is currently under review by NDEP.
The mine is currently open and subject to inspection by both the federal Mine Safety and Health Administration (MSHA) and the Nevada Mine Safety and Training (MSATS) agency.
Lode-Star Mining was issued Water Pollution Control Permit (WPCP) NEV2017109 from the Nevada Department of Environmental Protection (NDEP) regarding production at the property effective November 20, 2018 and no compliance concerns were noted upon NDEPs site inspection on January 9, 2019. This Permit authorizes the construction, operation, and closure of approved mining facilities in Esmeralda County, Nevada, and allows for permanent storage of waste rock underground. The Permit is effective for 5 years until November 20, 2023 and authorizes the processing of 10,000 tons of ore (9,072 t) per year from Lode-Star’s underground operations. The property has two operating water monitoring wells (completed April 15, 2016) that are mandatory for water pollution control permitting. All permitting cost to date has been borne by Lode Star Gold, INC.
Lode-Star Mining is currently assessing how and where to dispose of mill tailings, with the preferred option to be offsite at the milling facility that will ultimately treat the ore.
Considering that the Goldfield Bonanza is an historical mining and exploration site, and with Waterton (operating as Gemfields Resources) recently completing the permitting process for a large open pit mining operation on their nearby Gemfields deposit, Lode-Star Mining does not anticipate any issues with future permitting on the property.
| 4.7 | Other Significant Factors or Risks |
Lode-Star Mining has advised this author that they are not aware of other significant factors and risks that may affect access, title, or the right or ability to perform work on the property.
| 5.0 | ACCESSIBILITY, CLIMATE, LOCAL RESOURCES, INFRASTRUCTURE AND PHYSIOGRAPHY |
Goldfield Bonanza is located 25 miles (40.2 km) south of Tonopah and one-half mile (0.8 km) immediately east of the town of Goldfield. It is reached by driving northwest from Las Vegas on Highway 95 for about 183 miles (295 km). From Reno, drive east on I-80 for 32 miles (51 km) to Fernley, then east for 30 miles (43 km) to Fallon. Then proceed south on highway 95 for 200 miles (322 km) to Goldfield (Figure 1.1). Driving time is about 4.5 hours from Reno and 2.5 hours from Las Vegas. Surface access on the property is excellent by graded gravel roads.
| Technical Report on the | 15 January 2020 |
| Goldfield Bonanza Project | |
The Goldfield area is in the high desert and typically has warm summers and generally mild winters. The mean annual temperature is 51.1 degrees Fahrenheit (10.6 ℃), however overnight freezing temperatures are common in the winter. Precipitation averages 5.8 inches (14.7 cm) of rain annually, most of which comes in the form of snow in the winter months or from infrequent summer thunderstorms. The property is at an elevation of approximately 6000 ft (1830 m) and topographic relief is low. Vegetation is sparse, consisting largely of sagebrush, rabbitbrush, Joshua trees and grasses.
Goldfield has been the Esmeralda County Seat since 1907. Esmeralda County covers an area of 3588.5 square miles (9294 sq km) of west-central Nevada and has a population of approximately 1000. Some staff personnel would be available from Goldfield, and additional personnel could be drawn from Tonopah 25 miles (40.2 km) to the north. The nearest railroads are in Fallon or Las Vegas. Site power is purchased from NV Energy, whereas power at the February Premier Shaft is provided by diesel generator. Water for drilling is purchased from the town of Goldfield at a cost of $2 per 1000 gallons. Other sundry needs such as restaurants, lodging, minor medical needs, fire station, and police, are available within 1 mile of the property.
All properties, claims, buildings, equipment, and supplies are owned by Lode-Star Mining’s largest shareholder, Lode Star Gold, INC. Lode-Star Mining has free access to utilize and manage all Lode Star Gold assets.
Lode-Star Mining manages operations from a 6,000 sq ft office and warehouse facility complete with showers and laundry amenities. Two residential trailer sites are immediately adjacent to this building for future crew needs.
| 6.1 | History of the Goldfield District |
| 6.1.1 | Early Discovery and Mining |
Goldfield was one of the last big mining boom towns in Nevada. Most of the production of gold and lesser amounts of silver and base metals at Goldfield has come from high grade bodies located in what is known as the “Main District”, a relatively small area of about 0.7 square miles (~1.8 km2) east and northeast of the Goldfield town site. An estimated 4.2 million ounces (131,600 kg) of gold were produced from the district between 1903 and 1960.
| Technical Report on the | 15 January 2020 |
| Goldfield Bonanza Project | |
Float gold was first found on Columbia Mountain by Harry Stimler and Willian Marsh in 1902 (Ransome, 1909). After prospecting without success for the source of this gold, Stimler and Marsh worked northward and staked the first 5 claims in December 1902 in the Sandstorm lode area (Figure 7.1). Other prospectors and claim stakers followed, but nothing of significance was found until May 24, 1903, when A.D. Meyers and R.C. Hart located speculative claims over ground south of Columbia Mountain. Hart soon sold his interest to T.D. Murphy, and it was Meyers and Murphy that ultimately found high-grade gold at what was to become the Combination Mine. Four months later, they sold their interests for $75,000 and the Goldfield “goldrush” was on. In December 1903 gold shipments from the Combination had begun and by mid-summer 1904 ore was also being shipped from the Jumbo, Florence and January mines (the Combination below the 380’ level and the January are on Goldfield Bonanza property). Total shipments by early in 1905 greatly exceeded $1,000,000 in value (Ransome, 1909). The ore was sometimes incredibly rich, one example being a block of about 4.5 tons of ore from the Florence mine valued at between $6000 and $7000 per ton. At the time the gold price was $20.67 per ounce, therefore this single block graded approximately 290 to 339 ounces per ton (9.9 to 11.6 kg/t) and represented a total of 1306 to 1524 ounces (40.6 to 47.4 kg) of gold. The town went from a few tents in the summer of 1903 to 8000 people early in 1905, and the Tonopah and Goldfield Railroad reached town in September of 1905.
Big discoveries continued to occur sporadically, with the Red Top discovery late in 1905, and then the fabulous discovery on the Hayes-Monette lease of the Mohawk claim beginning in April 1906. From Ransome: “By the end of the first week in June nearly 2,500 tons of sulphide ore averaging 2.7 ounces of gold per ton had been shipped”. And “In the early days of the Hayes-Monette lease considerable fruitless work had been done on the 150-foot level; and there, as later developments showed, the main drift missed the great ore shoot by a few feet only. In September the ore shoot, there very rich, was opened from that level, and this one lease block was soon shipping up to $60,000 worth of orea day from two shafts” (emphasis added). At a gold price of $20.67 per ounce, this equates to about 2,900 ounces (90.2 kg) per day if the value was all from gold. As of 1909, the Hayes-Monette lease had produced “in round figures $5,000,000 from ore averaging $400 a ton” (Ransome, 1909). Five million dollars equates to approximately 258,400 ounces (8,036 kg), and four hundred dollars a ton equates to 19.35 oz/ton (663.4 g/t) gold. Due to the extraordinary richness of its ore, the Mohawk became known as the richest gold property in the world (Hardy el al., 2002). In October 1906 there were 150 buildings under construction, and 56 mining companies in operation employing 2250 men. The population at the end of the year was estimated at 15,000.
Gold production in 1906 tripled over the previous year and production from 1906-1907 was estimated at over $15 million. At $20.67 per ounce that calculates to about 725,689 ounces (22,569 kg) of gold. George Winfield merged the Mohawk, Jumbo, Red Top and Laguna mines into the Goldfield Consolidated Mining Company (GCMC) in 1906, and later acquired the Combination and January mines. Late 1907 and early 1908 saw serious labor unrest and the depression of 1907, both of which slowed production significantly. GCMC constructed a 100 stamp mill in 1908 which operated until 1919. Goldfield had a peak population of perhaps 30,000 people depending on the data source, but it began to shrink after 1909. Late in 1910 the population was 10,000 people, and the mines produced $11,214,000 (539,000 ounces or 16,763 kg) worth of gold.
Ransome (1909) states that the total production during the boom years of 1903 to 1907 was 954,446 ounces (29,683 kg) of gold in 188,080 tons (170,588 t), valued at $19,730,150, plus 116,188 ounces (3613 kg) of silver valued at $74,530. The average ore value per ton was $105.29, or 5.09 ounces of gold per ton (175 g/t). This does not include the ore “high-graded” (stolen) by miners. It has been estimated that over $2 million in gold (approximately 10% of total production) was taken by employees between 1906 and 1907.
| Technical Report on the | 15 January 2020 |
| Goldfield Bonanza Project | |
The high-grade discoveries became fewer and smaller until the GCMC mill closed in 1918. Production continued on a limited basis from leasing operations until 1926. The town was partially destroyed by fires in 1923 and 1924. Between 1927 and 1937, 3.1 million tons (2.8 mt) of older tailings were reprocessed, yielding 160,800 ounces (5000 kg) of gold.
Although nearly all of the above described activity and production was from the Goldfield “Main District”, considerable prospecting and exploration extended to other parts of the district with similar geology, but with significantly less success. Notable areas include the Kendall-Sandstorm area north-northwest of Columbia Mountain, the McMahon Ridge area northeast of Goldfield, and a couple small areas about a mile east of the Main District (Figure 7.1).
Table 6.1 Goldfield District Production, 1903 – 1925
| Year | Ore Tons | Oz Gold | Oz Silver |
| 1903 | --- | 3,419 | 287 |
| 1904 | 8,000 | 113,293 | 19,954 |
| 1905 | --- | 91,088 | 8,589 |
| 1906 | 59,628 | 339,890 | 15,648 |
| 1907 | 101,136 | 406,756 | 71,710 |
| 1908 | 88,152 | 236,082 | 30,823 |
| 1909 | 297.199 | 453,915 | 33,164 |
| 1910 | 339,219 | 538,760 | 117,598 |
| 1911 | 390,431 | 497,637 | 126,406 |
| 1912 | 362,777 | 301,848 | 125,736 |
| 1913 | 364,785 | 242,815 | 153,984 |
| 1914 | 367,166 | 227,612 | 129,830 |
| 1915 | 418,935 | 212,337 | 165,306 |
| 1916 | 383,456 | 128,250 | 129,781 |
| 1917 | 339,488 | 91,917 | 78,184 |
| 1918* | 264,237 | 58,685 | 90,560 |
| 1919 | 16,435 | 35,810 | 39,912 |
| 1920 | 6,571 | 7,536 | 6,081 |
| 1921 | 1,903 | 7,101 | 1,761 |
| 1922 | 5,619 | 12,773 | 5,755 |
| 1923 | 3,137 | 4,471 | 3,613 |
| 1924 | 7,352 | 4,336 | 3,982 |
| 1925 | 2,773 | 5,053 | 2,369 |
| Totals | 3,531,497 | 4,021,384 | 1,361,033 |
Data from Albers and Stewart, 1972.* Combination Mill closed.
| Technical Report on the | 15 January 2020 |
| Goldfield Bonanza Project | |
| 6.1.2 | Later Years (1935 to recent) |
Several mining companies explored and worked at Goldfield during the period 1935-1951, including Calumet, Hecla, and Newmont Mining, but production was relatively minor. Newmont worked in both the northern and the southern parts of the Margraf claims (now Lode- Star) from 1947 to 1951 and also in the vicinity of the Florence Shaft. Their activity was largely on Lode-Star’s property and will be discussed in Section 6.2.1.
In 1939, Martin Duffy discovered an ore pillar near the Little Florence Shaft which is adjacent to the southeast border of the Lode-Star claims. This 17’ x 6’ x 40’ block contained about 4700 ounces (146 kg) of gold at an average grade of 15 oz Au/ton (514 g/t) (Duffy, 1973).
More recently (adapted from Hardy, 2002), work after 1951 in the Goldfield district has focused on exploration and on production from small oxide deposits using heap-leaching. Most of the production during this time has been from small open pits in the Red Top, Combination and Jumbo mine areas in the Main District. Very little production has come from other areas.
Starting in 1970, Blackhawk Mines leached 60,000 tons (54,420 t) of tailings grading 0.078 oz Au/t (2.67 g/t), recovering 3500 ounces (108.8 kg) of gold or 75% of the contained gold. Between 1979 and 1981, Blackhawk mined and heap-leached ore from the Adams pit and some of the Main District dumps.
Red Rock Mining commenced mining in 1989 of waste dumps and moved a total of 285,000 tons (258,500 t) to the crusher stockpile. However only about 60% of it was properly agglomerated and recoveries were 65%, for a total of 7,500 ounces (23.3 kg) produced. The operation was shut down, the company reorganized, and in 1992 the American Resource Corporation (ARC) made a joint venture with Red Rock. Rea Gold then acquired both parties and created American Pacific Minerals to work the property. A significant tonnage of heap leach ore was mined from the Combination, Red Hill and Jumbo pits. While totals are uncertain, a July 1995 report from American Pacific Minerals states that 532,379 tons (428,868 t) grading 0.044 oz Au/ton (1.51 g/t), or about 23,400 ounces (728 kg) were mined from the pits. In 1998, Rea Gold declared bankruptcy. All its assets passed to Decommissioning Services LLC, and in 1999 Romarco Nevada Goldfields obtained a lease and option to purchase the property.
Romarco carried out exploration on the property until March 2001 when Metallic Ventures, Inc (MVI) purchased Romarco’s interests. MVI then began exploration of the district, focusing primarily on the McMahon Ridge and Gemfield areas. They did do some drilling in the Main District that included 17 holes in 2002, and 12 deeper holes on the Jumbo Extension claim.
Metallic Ventures was acquired in 2009 by International Minerals Corporation (IMC). IMC began drilling the three main resource areas (Gemfield, Main District, and McMahon Ridge) in the spring of 2010 to expand and verify known gold resources. In a March 20, 2012 press release IMC announced that they had completed 244 RC holes and 46 core holes for a total of 56,842 meters (186,442 ft) of drilling. See Section 16.0 for resource and reserve numbers for the three resource areas that are now controlled by Waterton Global Resource Management, Inc.
| Technical Report on the | 15 January 2020 |
| Goldfield Bonanza Project | |
In 2013, Hochschild Mining plc acquired International Minerals primarily for International’s 40 per cent interest in their jointly owned Peruvian assets. The Goldfield assets were spun-out into a new company called Chaparral Gold that also had the Converse property in northern Nevada. In a 2013 43-101 report, total measured and indicated resource on Chaparral’s Goldfield properties totaled 38.66 Mt at 1.1 g/t, for a total of 1,340,000 ounces (41.7 t) gold (Shoemaker, et al, 2013). Chaparral continued the permitting process for open-pit mining of the Gemfield deposit, which was a new, “blind” discovery made in the 1980s that straddles Highway 95 just northwest of the Lode-Star Mining property (Figure 7.1).
In 2015, Chaparral Gold was bought by Waterton Precious Metals Bid Corp. In July 2019 Waterton Global Resource Management, Inc. announced receipt through Waterton’s portfolio company, Gemfield Resources, LLC, of permission to advance the Gemfield deposit to production from the Bureau of Land Management with the July 26, 2019 Record of Decision for the Final Environmental Impact Statement. In August 2019, Gemfield Resources began relocating Highway 95 and utilities to the west to make room for the mining operation.
| 6.2 | Goldfield Bonanza Property History |
As noted in Section 6.1.1, some of the first significant high-grade production in the district was from the Combination and January Mines, both of which lie within the Goldfield Bonanza claim block. The Combination Mine is located in and around the common boundary of the Combination #1 claim and the Combination #2 claim (Figure 4.1), where Lode-Star Mining’s interest is limited to the ground below the 380’ level.
Other historical mention of mining on the Lode-Star property includes production of an unknown quantity of ore grading up to 3.5 oz Au/ton (120 g/t) on the 132-foot level of the Phelan Shaft, located in the northern portion of the Lode-Star claim block (Anon, 1988). The Phelan ledge was similar in dip and strike to those found in the Mohawk and Combination veins, indicating high grade potential in this area.
Newmont Mining worked in both the northern and the southern parts of what were then the Margraf claims (now Lode-Star’s) from 1947 to 1951. The Seibert Formation was considered to be a poor host and barren of gold, so prior to 1940 shallow exploration shafts yielded nothing of interest. In the 1940’s, USGS data revealed that the Siebert Formation was younger than the mineralizing phase (post-mineral), thus Newmont began exploring for mineralization beneath the Siebert in this under-explored area. They first rehabilitated the Silver Pick Shaft and found low grade mineralization beneath Seibert rocks on the 500-foot (152m) level (Searls, 1948). Although then considered un-minable, significant amounts of vein material grading from 0.028 to 0.14 oz au/ton were identified which followed the southern continuation of the South Columbia Mountain Fault (Searls, 1948). In 1947, Newmont rehabilitated and extended a 2500-foot (762m) crosscut westward from the Florence Shaft (near the south-eastern corner of the Lode Star property) on the 300-foot (91m) level. The objective was to explore the southern continuation of the mineralized Columbia Mountain Fault that had been inferred from magnetometer surveys. Several mineralized veins were encountered, and high-grade ore (up to 14 oz Au/ton (480 g/t) was found near the projected fault. Approximately 20,000 ounces (622 kg) of gold, 4,123 ounces (128 kg) of silver and 5,200 pounds (2364 kg) of copper were recovered from what is now called the Newmont Lode (Anon, 1966). This mining operation ceased early in 1951. Subsequently, Newmont leased a separate vein occurrence in the Red Hills area, a short distance to the east. Production data are not available, but maps of the Red Hills Stope indicate face assays up to 170 oz Au/ton (5.29 kg/t).
| Technical Report on the | 15 January 2020 |
| Goldfield Bonanza Project | |
Trafalgar Mines (a subsidiary of Transwestern Mining Company) leased the Margraf claim block from 1980 to 1988. A 4-line refraction seismic survey done by Cooksley Geophysics (Simms, 1981), generated several shallow anomalies interpreted as silica-bearing fault zones. Subsequent drilling confirmed this interpretation. Trafalgar drilled 29,450 ft (8,979m) in 132 vertical holes. This program discovered two gold occurrences, the Church vein zone and the January target area, with grades up to 0.38 oz Au/ton (13 g/t). Additional holes in the Newmont Lode and Silver Pick areas yielded encouraging gold values. Their drilling also indicated the presence of a low grade and not well-defined body of mineralization in silicified ledges in the Sheets-Ish area. Trafalgar sampled all the dumps and mill tailings on the Margraf claims and moved approximately 200,000 tons (181,400 t) to a stockpile for which sampling yielded an average grade of 0.045 oz Au/ton (1.54 g/t). From June 1982 to March 1983 Trafalgar crushed, agglomerated and leached 63,000 tons (57,140 t) of this material and recovered approximately 1700 ounces (52.9 kg) of gold.
| 6.2.3 | Westley Explorations Inc. |
Westley Explorations Inc. sub-leased the Margraf Claims from Trafalgar early in 1985 and terminated the agreement on January 1, 1986. Refraction seismic surveys were conducted to locate quartz veining and silicified zones. Westley used this information to drill 11 reverse circulation holes for a total of 8000 ft (2439m). While all holes cut interesting alteration, only one cut good gold values – a 5-foot (1.52m) intercept grading 0.46 oz Au/ton (15.9 g/t) – near the projected intersection of the Church and Red Hills Decline zones.
The Margraf property was leased by Geochem Mines, Inc in 1988. Their principal contribution to the property was rehabilitating the February Premier Shaft to a depth of 300 ft (91m) and rehabilitating 1500 ft (457m) of drift on the 300-foot (91m) level SW toward the Newmont lode and Church Shaft. For the first time in 50 years, access to the underground workings was available. Geochem also drilled a 380-foot (116 m) surface reverse circulation hole.
| 6.2.5 | Lode Star Gold, INC. |
R.H. Lawe & Associates acquired the Margraf property in 1997, formed Lode Star Gold, INC., and placed the property in that company. Lode Star undertook considerable exploration of its own from 1999 through 2010. Their activity included re-conditioning of the February Premier Shaft, additional rehabilitation of underground workings, surface and underground geologic mapping, 3,500 ft (167m) of surface reverse circulation drilling, 23,000 ft (7012 m) of underground core drilling in 152 holes, 10,400 ft (3170 m) of surface core drilling in 22 holes, and a CSAMT geophysical survey test. The underground rehabilitation consisted of approximately 1/2 mile of drift (0.8 km) at the 300 ft sub-surface level (91 m). In total, Lode Star Gold has spent nearly $7.0 million on exploration and development on the property.
| Technical Report on the | 15 January 2020 |
| Goldfield Bonanza Project | |
Lode Star personnel initially obtained copies of Newmont Mining’s geologic and sampling maps of the underground workings from the Mackay School of Mines archives as well as the results of several Newmont underground drill holes. After rehabilitating the February-Premier Shaft and workings on the 300 level to the Newmont Lode and the Church Zone, Lode Star Gold selectively sampled several of the vein occurrences. This sampling, along with geologic mapping, led to the identification of several gold-bearing quartz vein zones and the subsequent design of both surface and underground drilling programs to test them. Results are summarized in Section 10 of this report. This data was also used in the recent geologic modeling in that area.
The first drilling program in 1999 consisted of 3500 ft (1067 m) in 7 surface RC holes and 2400 ft (732 m) of underground jack-leg drilling. The objective was to verify the presence of gold mineralization and extend it along strike and down dip and to better define the vein geometry. The Red Hills and Church zones were the primary focus of the work.
Between 2000 and 2008 a total of 23,000 ft (7012 m) of underground core was drilled in 152 holes. These were focused on the Red Hills and Church zones with some holes in the Newmont Lode area.
In 2007, a total of 10,400 ft (3170 m) of surface core drilling was done in 23 holes largely in the Red Hills area. This program yielded encouraging results with several multi-ounce gold intercepts, with a high value of 75 oz Au/ton (2.57 kg/t).
| 6.2.6 | ICN Resources / Corazon Gold Corp. (2011 – 2013) |
In March 2011 ICN Resources (ICN) entered into an agreement with Lode Star Gold to acquire an 80% interest in the property. During 2011 ICN contracted Zonge Geophysics to complete a CSAMT geophysical survey over the entire property. ICN also drilled 5600 ft (1767 meters) in 26 core holes, largely in the Church Zone, and 27,470 ft (8375 m) in 63 reverse circulation holes throughout the property. Highlights of the core drilling included 9.5 ft (2.9 m) averaging 40.8 oz/ton (1.56 kg/t) gold, 4.5 ft (1.37 m) averaging 51.46 oz/ton (1.76 kg/t), and 9.5 ft (2.9 m) averaging 26.8 oz/ton (918 g/t).
Geologist/Geochemist Shea Clark Smith supervised a biogeochemical orientation survey over portions of the property in 2011 (Smith, 2912). ICN expended approximately $2,500,000 on exploration, well in excess of the initial requirements, but could not continue exploring the property due to financial difficulties.
ICN was subsequently acquired by Corazon Gold Corp. in October 2012. Corazon conducted only underground mapping and sampling before defaulting on the terms of the ICN/Lode Star agreement. On September 16, 2013 Lode Star Gold sent a Notice of Termination to Corazon, and Corazon subsequently agreed to the termination.
The February Premier Shaft provides access to approximately 1/2-mile (0.8 km) of ventilated drift on the 300 ft (91 m) level. The property is permitted for small scale production of up to 10,000 tons of ore per annum (9,072 t) and is mine-ready.
| Technical Report on the | 15 January 2020 |
| Goldfield Bonanza Project | |
| 6.3 | Historical Resource Estimates |
There are no historical resources which would conform to the CIM definitions of either resources or reserves.
The only resource figures quoted in past reports are based on drilling by Trafalgar Resources in the early 1980’s. The Geochem Mines 1988 summary reports says that, based on drilling by Trafalgar, there were three small bodies of “reserves” (not reserves under current CIM definitions) based on drilling and cross-sectional calculations. These are the February-Whiterock body (now called the Church body), the Sheets-Ish body and the January body (Figure 2.1). At least part of the January body was subsequently mined in the Combination pit. There were also resource figures quoted for various mine dumps on the property, much of which was moved to a leach pad by Trafalgar in the early 1980’s. Should a new heap-leach operation begin, there will possibly be additional “leachable grade material” available from an ore stockpile near the Trafalgar leach pad, old tailings, and other broken rock on waste dumps.
| 7.0 | GEOLOGICAL SETTING AND MINERALIZATION |
| 7.1 | Regional Geology (adapted from Seibel, et al., 2007) |
The Goldfield Mining District is located in the Basin and Range Physiographic Province, characterized by north- and south-trending ranges separated by gently sloping sediment-filled structural basins. This appearance is the result of large-scale extensional tectonics during the late Tertiary. Superimposed on the Basin and Range is the Walker Lane Structural Zone, roughly parallel to the California-Nevada state line. This is a series of west-northwest strike-slip faults and north to northeast striking oblique-slip and normal faults. The Walker Lane is host to several precious metal mining districts in addition to Goldfield, such as Tonopah, Divide, Rawhide and Klondyke to the northwest, Bullfrog, Rhyolite and Railroad Springs to the southeast.
The rocks in the region are Paleozoic marine sedimentary and metamorphic rocks which have been intruded by or are overlain by younger igneous rocks of Mesozoic and Tertiary age. Mineralization in the region is interpreted to be spatially and perhaps genetically related to Tertiary intrusive rocks, dominantly hosted in Oligocene to Miocene volcanic rocks and is primarily epithermal in nature.
| 7.2 | Goldfield Mining District Geology (adapted from Seibel, et al., 2007) |
The Goldfield Mining District is closely related to a complex and long-lived volcanic center defined by a thick series of tuffs, domes, and flows. A 4.4 mile (7km) diameter circular ring-fracture zone is outlined by a series of curved faults, eruptive vents, doming and intense alteration (Figure 7.1). The volcanic rocks of this feature range in age from Oligocene to Miocene. The high-sulfidation, quartz-alunite hydrothermal alteration and widespread gold-enargite mineralization appear to be related to the emplacement of a 20-23 Ma Miocene igneous intrusive complex. Intersections of northwest-striking right-lateral strike-slip faults and north to northeast striking normal faults appear to have localized both volcanic activity and gold-enargite mineral deposits. The general sequence of mineralization-related events in the Goldfield Mining District is as follows:
| Technical Report on the | 15 January 2020 |
| Goldfield Bonanza Project | |
| 1. | Development of the East Goldfield structural zone and subsequent development of a major northwest-striking right lateral shear zone along the south edge of the present location of the Goldfield Main district. |
| 2. | Eruption of an early rhyolite and latitic volcanic sequence and possible initial development of a ring fracture system (33-30 Ma). |
| 3. | Deposition of the sediments included in the Diamondfield Formation and the Sandstorm Rhyolite (28 Ma). |
| 4. | Resurgence, uplift and eruption of the Milltown Andesite, Main District Rhyodacite, and probably emplacement of a central intrusive complex in the deeper core of the District (23-20 Ma). |
| 5. | Continued development of the controlling right-lateral strike-slip fault system, including development of a right stepping releasing bend on the Columbia Mountain Fault and the development of a zig-zag pattern of fractures and shears in the Main District area (20-21 Ma). |
| 6a. | Initiation of the hydrothermal system. This event produced intense silicification, formation of multiple silica ledge zones, and propylitically altered the adjacent rhyodacite, dacite and Milltown andesite wall rocks (20.5 Ma). |
| 6b. | Stage 2 structural development, continued intrusions, uplift and hydrothermal fracturing and local brecciation of silica ledge zones and adjacent wall rocks. |
| 6c. | Pre-gold acid leach event. |
| 6d. | Intense argillic alteration of wallrock/ledge contacts. |
| 6e. | Main stage gold deposition. |
| 6f. | Barren, open space filling translucent quartz vein emplacement. |
| 7. | Post-mineral faulting, deposition of post-mineral volcanic and sedimentary units and erosion of the Goldfield volcanic center (20 Ma to present). |
| Technical Report on the | 15 January 2020 |
| Goldfield Bonanza Project | |
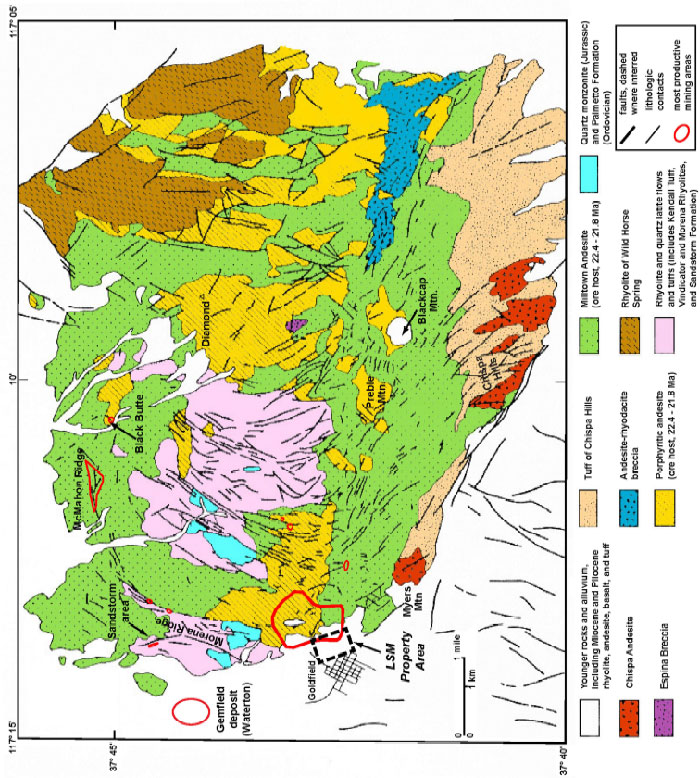
Figure 7.1 Goldfield District Geology
Adapted from John, et al., 2018
| Technical Report on the | 15 January 2020 |
| Goldfield Bonanza Project | |
| 7.3 | Goldfield District Alteration and Mineralization |
As was previously noted, most of the production of gold and lesser amounts of silver and base metals at Goldfield has come from high grade bodies located in the “Main District”, a relatively small area of about 0.7 square miles (~1.8 km2) east and northeast of the Goldfield town site. The discussion in this section will be limited to alteration and mineralization in that area. Mineralization is generally present in zones of strong silica-alunite alteration surrounded by wider zones of clay alteration set in a large area of propylitic alteration. High grade bodies may be connected by narrow structures or splays defined by alteration, quartz veinlets and low-grade mineralization within the larger clay alteration envelope. The principal host rocks are a dacite, the Milltown Andesite, and the Sandstorm Rhyolite. The older rocks of the Palmetto Formation and the Jurassic intrusive rocks may locally host mineralization. In the Main District, historically mined gold ores occurred in northwesterly trending and easterly dipping zones as well as northeasterly trending southeasterly dipping zones. Dips often became shallower with depth. The known mineralized area has a strike length of 5000 ft (1550 m), a maximum width of 4000 ft (1220 m) and extends down dip to over 1700 ft (520 m) below the surface.
The irregular intensely silicified zones which contain the major ore bodies were historically named “ledges” by the miners. Mineable gold grades within the ledges decrease outward to low grade or barren silicified rocks over distances of often less than a meter. This gradation is seldom obvious, so that ore boundaries are rarely sharp and usually not visually apparent. Higher gold grades are not distributed evenly throughout the ledges and occur as irregular sheets, blobs, pipes and shoots throughout the ledge. Irregular breccia bodies are usually present, associated with late stage silica and clays filling open spaces. Gold mineralization is often associated with this late stage event. The ore at Goldfield consists of native gold with bismuth and copper-arsenic-antimony-bearing sulfides and tellurides including bismuthinite, famatinite, enargite and goldfieldite (first identified in Goldfield ores). Gold is usually present as tiny grains in these sulfides and tellurides, or as disseminations in quartz. In the “rich ores” native gold is often visible in high grade bands, however there was very little coarse gold reported in Goldfield ores.
Understanding the nature of the ore deposits in the Main District is critical to effective exploration for new deposits in that area, which includes the Goldfield Bonanza Project area. U.S. Geological Survey Professional Paper 66 by F.L. Ransome (Ransome, 1909) provides some succinct descriptions that are included here on the following page to further explain the occurrence of these deposits.
| Technical Report on the | 15 January 2020 |
| Goldfield Bonanza Project | |
According to Ransome, ledges are “masses of silicified or otherwise altered rock in which the ore bodies are found. The actual ore bodies or pay shoots occur within but are seldom coextensive with the ledges (p. 150).” “Most of the productive ledges near Goldfield have a north to northwest strike… probably most of the ledges have nearly vertical dips (p. 152).” “Quite independently of the ore and value, then, the ledges, as structures differentiated from the country rock by silicification, tend to become narrower, simpler and more rectilinear in plan with increase in depth (p. 154).” “They range from roughly equidimensional, irregular masses to nearly vertical or inclined, undulating lodelike plates or sheets (p. 153).” “In general the pay shoots are fully as irregular as the ledges with which they are associated. Some of them are roughly equidimensional masses, while others are lenticular, some are spindle shaped, with the long axis nearly vertical, while still others are tabular or platelike, although such sheets of ore are often curiously twisted or warped. While many of the pay shoots conform to the trend of the enclosing ledge, others do not. The pay shoots have nothing to distinguish them from barren ledge matter. They have no boundaries other than the invisible limits beyond which the assayer’s returns show stoping to be unprofitable. The change from rich ore to barren ledge matter may take place within a short distance (p. 158).” | 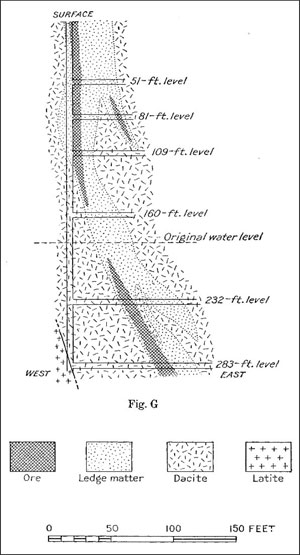
Figure 7.2 January Mine Cross Section
(Ransome, 1909) |
| | |
Ransome also had this to say (p. 160) about “fissuring” (now called fracturing or faulting). “…fissuring, not relative solubility or chemical instability of the country rock, has determined the shape of the deposits. The irregularity of the ore bodies, like that of the ledges, is consequent upon the unusual complexity of the fissuring.” “In many places there appears to be a close connection between ore deposition and the intersections or junctions of divergent zones of fissuring.”
| Technical Report on the | 15 January 2020 |
| Goldfield Bonanza Project | |
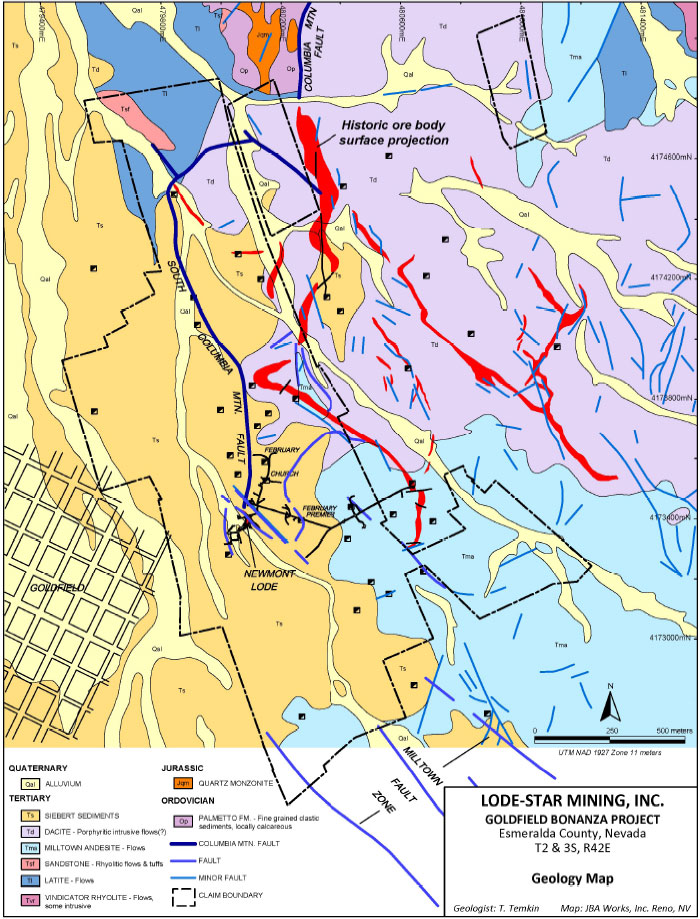
Figure 7.3 Goldfield Bonanza Property Geology Map
| Technical Report on the | 15 January 2020 |
| Goldfield Bonanza Project | |
| 7.4 | Goldfield Bonanza Project Geology |
The Lode-Star property is located along the southwestern margin of the Goldfield ring-fracture zone, an area of very strong alteration and strong fracturing or faulting in north-northwest (NNW) and northeast directions. The largest through-going structure is the NNW trending South Columbia Mountain Fault, thought by Searls (1948) to be an important control of the localization of gold mineralization (Figure 7.2).
The oldest geologic unit in the area is the Ordovician Palmetto Formation, which consists largely of fine-grained clastic sediments, including local calcareous sediments. It is present only near the northern margin of the property, along with small Jurassic quartz monzonite intrusive bodies and small amounts of early Tertiary latite flows and rhyolitic sandstones.
The principal host rocks of the property and the Main District are andesitic flows of the Milltown andesite and a large dacite porphyry intrusive body. These are overlain by post-mineral, later Tertiary age, coarse clastic sediments of the Siebert Formation. Elsewhere the Siebert contains interbeds of tuffaceceous rocks, but such tuffs have not been observed in mapping or drilling on the Goldfield Bonanza property. Based on drill hole logging, thickness of Seibert on Goldfield Bonanza property varies from 0 to approximately 60 m (197 ft). Exploration by Lode Star Gold, ICN and their predecessors since the 1930’s has become focused in the south-central portion of Lode-Star Mining’s project area. The most prospective ground includes the February, Church, Newmont, and Red Hills areas immediately east of Goldfield and southwest of the Combination Pit. This area has become known as the NE corridor (Figures 7.3 and 9.3). Silicified ledges and small bodies of gold mineralization were also identified in the northern part, near the Phelan and Sheets-Ish shafts, however these are currently lesser priority than the NE corridor areas.
| 7.5 | Goldfield Bonanza Project Mineralization |
This discussion will focus on the NE Corridor, where gold mineralization appears to be associated on a larger scale with the southern extension of the South Columbia Mountain Fault (trending north-south in this area), and its intersections with more northwesterly trending structures. Newmont mined small, very high grade zones (grades up to 14 oz/ton gold, or 480 g/t) in the southwestern part of this area in 1947 to 1951 in both the Newmont Lode and the Red Hills area, from lodes along both structural trends, and also some northeast trending structures. Drilling and underground geologic mapping by ICN Resources and Lode Star Gold in both areas, as well as in the Church Zone, have demonstrated that these mineralized structural zones are persistent over a strike length of at least 1500 ft (457 m) (Figure 9.1). Many drill intercepts returned gold grades greater than 1 oz/ton gold (34.3 g/t). These zones are interpreted to dip nearly vertically and to have potentially minable widths of several feet or a few meters.
Analysis of drilling done on the Goldfield Bonanza property to date indicates that 5 mineralized “ledges” have been defined by drilling. Logging of high-grade intercepts of up to 75 oz/ton Au (2.57 kg/t) indicate that these ledges are mineralogically the same as “ledges” that produced millions of ounces of high-grade gold from within the Goldfield Main District.
| Technical Report on the | 15 January 2020 |
| Goldfield Bonanza Project | |
Gangue mineralogy is primarily fine-grained quartz with lesser amounts of several clay minerals. Specimens from two RC holes were analyzed for clay mineral content using a hand-held TerraSpec near infra-red spectral analyzer. This machine analyzes the reflectance spectrum of the minerals in the near infra-red range to determine the mineral species based on that reflectance signature. The results show that in the intensely silicified and advanced argillic alteration near better gold grades, the dominant clay minerals are illite with lesser amounts of dickite and kaolinite. In the less intensely altered material peripheral to the mineralization, the clay is predominantly montmorillonite with some kaolinite.
| 7.6 | Geological and Mineralization Modeling on Goldfield Bonanza Property |
To optimize future exploration and definition drilling and underground development, Lode Star Gold initiated two- and three-dimensional modeling of the geology and mineralization in the Church and Red Hills areas. The creation of a geologic model of the silicified ledges and gold mineralization in these areas is complicated by the irregular geometry of the structurally controlled ledges themselves, along with the erratic distribution of gold within those ledges (see quotes by Ransome (1909) in Section 7.3 above). With current higher gold prices and improved mining technology, the gold grade defining the boundary of “pay shoots” would now be lower than in Ransome’s time. This may decrease the irregularity of the shapes of “pay shoots” somewhat and increase tonnages of potentially mineable material. The modelling has been conducted by Tom Temkin, Lode Star Gold’s project geologist, and will be discussed later in Section 18 “Interpretations and Conclusions.”
The Goldfield district is a classic example of a structurally controlled, volcanic-hosted, epithermal gold deposit of the high-sulfidation, quartz-alunite type. Other examples of this deposit type are Paradise Peak (Nevada), Summitville (Colorado), El Indio (Chile), Pierina (Peru), Pascua-Lama (Chile, Argentina), Rodalquilar (Spain) and Lepanto (Philippines).
These hydrothermal systems commonly develop in extensional or trans-tensional settings. They commonly occur in zones where high level magmatic intrusives are emplaced below volcanic edifices which are constructed above plutons. These systems are thought to overlie and be genetically related to deeper porphyry copper systems. The most common geologic settings are calderas, and flow-dome complexes, often associated with sub-volcanic intrusive bodies and breccias. Host rocks are typically volcanic flows and pyroclastics, largely of andesite-dacite-rhyodacite composition. Permeable intercalated sedimentary units are often hosts for mineralization (e.g. Diamondfield sediments at Goldfield).
Mineralization typically forms in veins and massive sulfide replacement pods and lenses, stockworks and breccias. Deposit shapes are commonly irregular and are determined by a combination of host rock permeability and the geometry of ore-controlling structures. The most common minerals within the quartz veins are pyrite, enargite, famatinite, chalcocite, covellite, bornite, gold and electrum. Tellurides and silver sulfo-salt minerals are often present as well. The two common types of gold ore are massive enargite+pyrite, and quartz+alunite.
| Technical Report on the | 15 January 2020 |
| Goldfield Bonanza Project | |
Lode-Star Mining has not conducted exploration on the Goldfield Bonanza property. The company did assay samples taken during the drilling of two water quality monitoring wells drilled in 2016, and the assay results are discussed in Section 10.7.
This section will briefly summarize the significant historic exploration on the property and focus largely on work done by Lode Star Gold and ICN Resources (ICN).
Perhaps 75% of the Goldfield Bonanza property is covered by the post-mineral Siebert Formation. In much of the remainder, bedrock is poorly exposed due to tailings, waste dumps and road construction. The Combination Pit in the east-central portion of the claim block exposes alteration and mineralization largely in the dacite, however the pit area is controlled by Waterton Global Resources since they control the surface to the 380 ft level in this area. Due to these factors surface mapping is not very useful in exploring the property.
Conventional surface sampling of outcrops and soils is not useful due to poor exposures and contamination by waste dumps and tailings. However, biogeochemical sampling has been shown to be effective in indicating areas of anomalous gold and other trace metal values.
In August 2011, ICN personnel sampled rabbit brush in an area measuring approximately 4000 ft (1200 m) by 2000 ft (600 m) in the northern and central portions of the property, including in the Silver Pick Shaft area and in the NE Corridor target area. The program was designed, and the data interpreted by Shea Clark Smith of Minerals Exploration & Environmental Geochemistry (Smith, 2012). Large areas that are defined by gold concentrations from 2 – 60 ppb are significant and attest to the volume (and possibly grade) of mineralized rock in contact with groundwater in these areas. Smith states that metal uptake in rabbit brush is not overwhelmed by mineralized dust that might have masked the metal concentrations in plant tissues of less well endowed (by gold) areas.
Gold-mineralized areas indicated by the biogeochemical data are depicted inFigure 9.1. The anomalies cluster in areas of known mineralization near the Phelan, Sheets-Ish and Silver Pick shafts, and in the NE Corridor area, which includes the Newmont Lode and especially the Church Zone. Thus, the biogeochemical data apparently confirms the conclusions from drilling and underground geologic work. In addition, biogeochemical anomalies were found in four areas of the property that have had no drilling. These are: 1) the area immediately east of the Church Zone coinciding with a CSAMT anomaly, 2) several grouped anomalies immediately northwest of the Newmont Lode and the January-Whiterock Shaft, 3) a northwest trending series of anomalies extending 400 meters to the northwest of the Church discovery zone, and 4) three separate anomalies located to the west of the Silver Pick Shaft and to the east of the Phelan Shaft in the northern portion of the claim group. In general, all of the drill holes with anomalous gold values fall within biogeochemical anomalies and all those holes with no significant gold intercepts are outside the biogeochemical anomalies.
| Technical Report on the | 15 January 2020 |
| Goldfield Bonanza Project | |
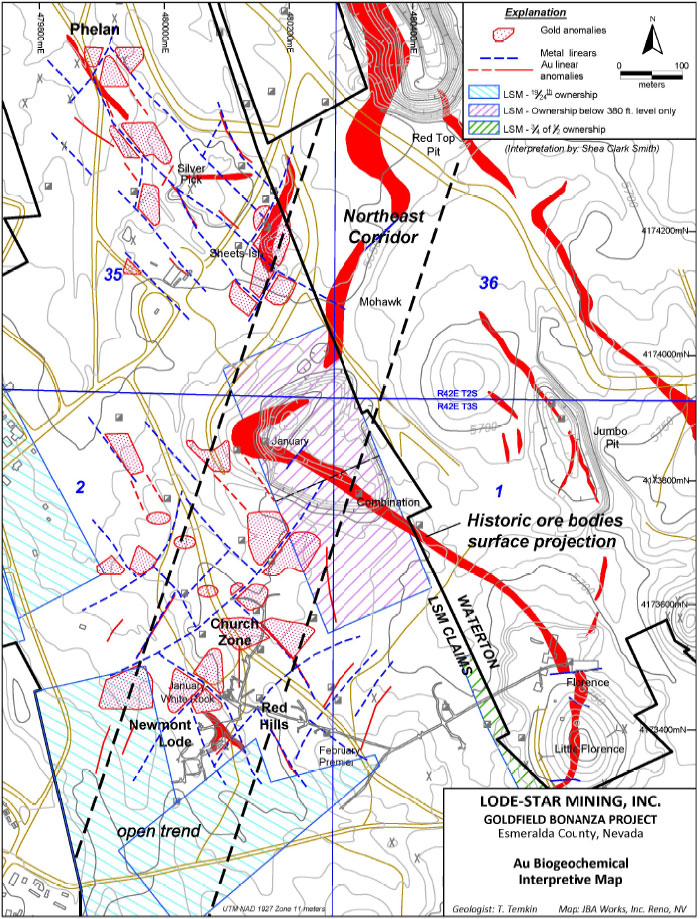
Figure 9.1 Biogechemical Anomaly Map
| Technical Report on the | 15 January 2020 |
| Goldfield Bonanza Project | |
Pathfinder elements also show an interesting pattern. The northern area is dominated by enrichment of Zn, Se, Bi and Cu, while in the south Bi, Hg, As, Sb, REE, Pd and Fe form halos around gold anomalies. In the south there is a somewhat higher correlation of Bi with gold. Smith felt that the cluster of anomalies in the NE Corridor was the most attractive for exploration, confirming conclusions reached by examining other lines of evidence.
| 9.3 | Underground Rock Chip Sampling |
One hundred and ninety-nine underground rock chip samples were collected by Corazon Gold in 2013. From brief descriptions, these were generally channel samples selected to be representative of something specific at each site, such as a vein or silicified zone, thus they were selectively collected rather than randomly collected. Some were selected high-grade specimens, but most were composed of chip-channels of rock over a specific area, generally perpendicularly across the zone, to represent an average value for that exposure. Locations were noted on a map and marked in the field with a tag. Lode-Star Mining has a digital database of the samples that includes locations, descriptions, and gold assays. All samples contain gold; 27 assayed between 0.010 g/t and 0.099 gold, 147 assayed between 0.100 and 0.999 g/t, 19 assayed between 1.0 and 4.0 g/t, and the highest values were 7.02 g/t, 8.6 g/t, 13 g/t, and 19.33 g/t.Figure 9.2 is a map of the samples with gold assays posted.
| Technical Report on the | 15 January 2020 |
| Goldfield Bonanza Project | |
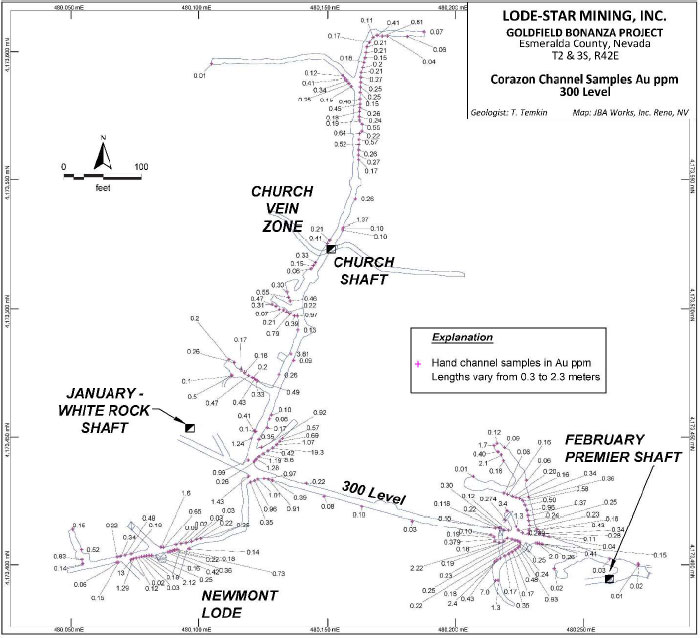
Figure 9.2 Corazon Gold Underground Samples
| Technical Report on the | 15 January 2020 |
| Goldfield Bonanza Project | |
The first geophysical work on the property was done by Newmont Mining about 1949. According to a 1988 report by Geochem Mines, a magnetometer survey was used to define the South Columbia Mountain Fault and its extensions toward the south. This data is no longer available.
In 1980 Trafalgar Mines contracted Cooksley Geophysics to conduct a refraction seismic survey over a small area. No data or maps are available for this survey.
Westley Mines leased the property during 1985. They contracted Dr. McWilliams, a professor at Stanford University, to conduct a more extensive refraction seismic survey. Thirteen east-west lines were run at approximately a 400-foot (122 m) spacing covering an area from about 600 ft 183 m) south of the Silver Pick Shaft to 2000 ft (610 m) south of the January-Whiterock Shaft. This work delineated silicified zones and ledges which have horizontal widths of up to 200 ft (61m) and varying lengths. These are shown onFigure 9.2, modified from the 1988 Geochem Mines report. The anomalies also seem to trace the South Columbia Mountain Fault – if it dips to the east – or another structure parallel to it.
In 2008, Lode Star Gold contracted Zonge Geophysics to carry out an orientation CSAMT (controlled source, audio-frequency magneto-telluric) survey. The objective was to determine the effectiveness of this technique in detecting resistivity variations that correlate with known gold-bearing quartz vein zones. Five east-west lines were run across the Church-Red Hills-Newmont Zone area for a total of 1.7 line miles (2.7 km) of coverage. The results clearly defined several pronounced resistivity gradients associated with the areas of known quartz-alunite ledges and gold mineralization.
In February 2012, ICN contracted Zonge Geophysics to carry out a property wide CSAMT survey which covered nearly all of the Goldfield Bonanza property (Figure 9.3). It included 32 lines for a total of 17 line-kilometers (10.6 line-miles). The survey data was acquired using 30-meter (100 ft) receiver dipoles in spreads of six down-line electric field dipoles with two magnetic field measurements taken per spread in the broadside mode of operation. The signal source was a Zonge GGT-30 constant current transmitter. Survey control was maintained using a Trimble PRO-XRS GPS receiver. The results reportedly correlate to known gold zones, but a final report has yet to be prepared for the survey.
OnFigure 9.3 anomalies from the biogeochemical survey anomalies are overlain on the CSAMT results. The main NE Corridor lies above a major break in the CSAMT data. This break is suggestive of significant northwest and northeast oriented structures at depth. The potential significance of the CSAMT break is demonstrated by the drill holes in and around the Newmont Lode in the southern portion of the grid. Holes in this area are weakly to strongly mineralized, suggesting that further testing southwest along this break is warranted.
Mineralization aligned northwesterly in the Sheets-Ish, Silver Pick, Phelan area is shown to be coincident with the sharp northwest trending break in the CSAMT response. This is one of the dominant trends for gold mineralization in the Main District.
| Technical Report on the | 15 January 2020 |
| Goldfield Bonanza Project | |
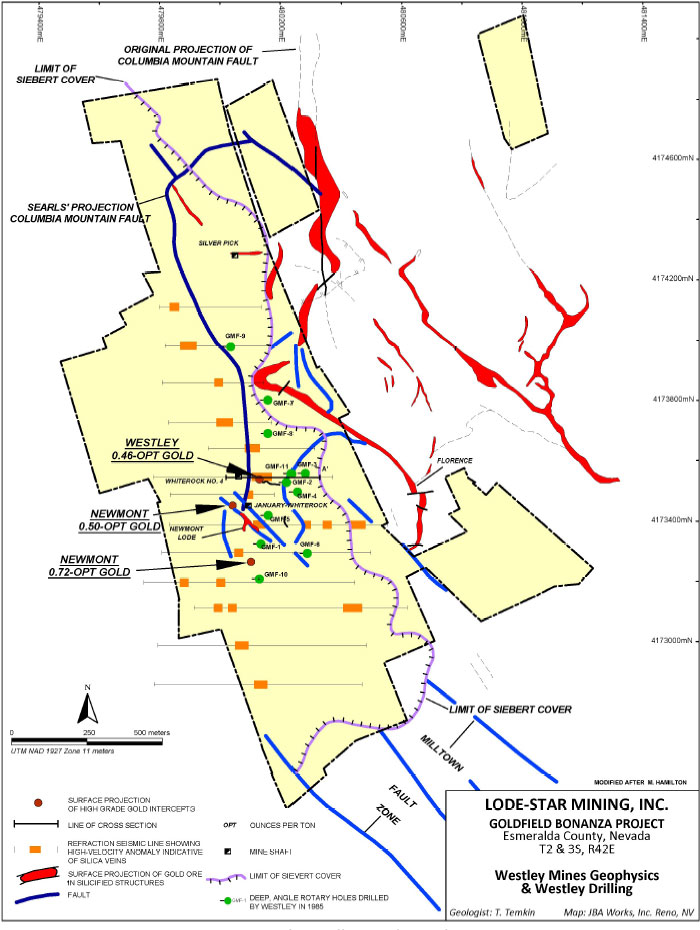
Figure 9.3 Westley Drilling and Geophysics, 1985
| Technical Report on the | 15 January 2020 |
| Goldfield Bonanza Project | |
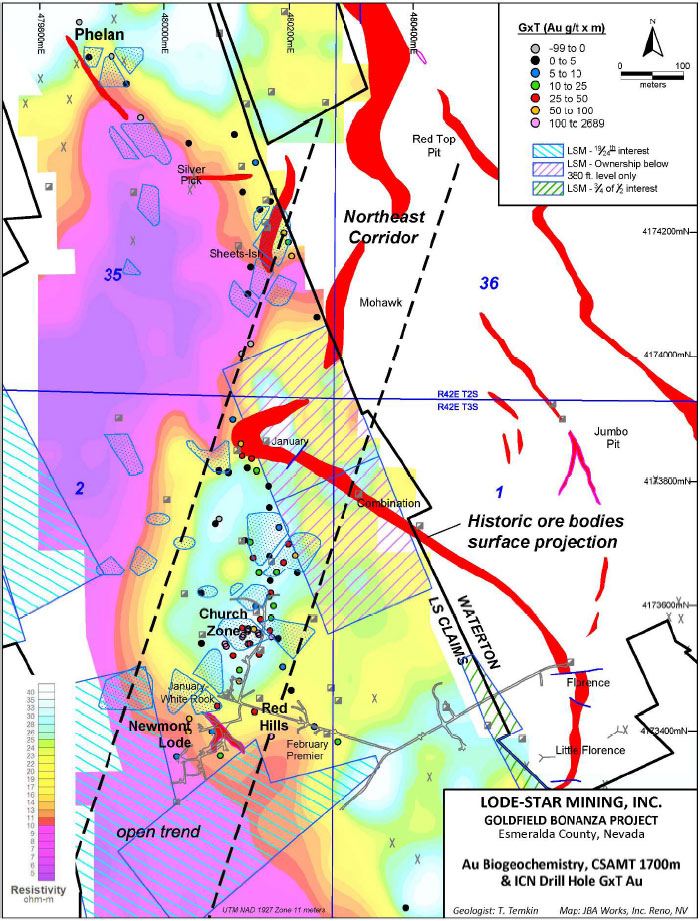
Figure 9.4 Zonge CSAMT Plot with Biogeochem and ICN Drilling
| Technical Report on the | 15 January 2020 |
| Goldfield Bonanza Project | |
Lode-Star Mining, Inc. has not conducted any exploration drilling on the property but did sample two water quality monitoring wells drilled in 2016. These are discussed in Section 10.7 below.
Total footage of historical drilling on the property is approximately 112,036 ft (34,149 m) (Table 11.1). Of this total, 41,595 ft (12,678 m) was core drilling (37.1% of total drilling), and 70,441 (21,470 m) was rotary or rotary reverse circulation. A large portion of the core was drilled by Lode Star Gold. Underground core was generally BQ-size (1.43 inches or 3.63cm) in diameter. Most of the core drilled from the surface was NQ-size (1.87 in, or 4.75cm). All historic drill hole collars were surveyed as completed and are referenced to the same survey grid. Down-hole surveys were performed for the ICN Resources core holes only.
Drill logs, assay sheets, coordinates, elevations, depths, azimuths and inclinations from all the drilling programs except that of Geochem Mines and Newmont are well preserved. The entire drilling database has been compiled into a digital format.
Table 10.1 Summary of Goldfield Bonanza Project Drilling
| Year | Company | Hole Type | #
holes | Total Feet | Total
Meters | Contractor |
| 1950 | Newmont | UG Longhole | 2+ | ? | ? | Newmont? |
| 1980 - 82 | Trafalgar | Conv Rotary | 116 | 25,456 | 7,759 | Pollock |
| 1980 - 82 | Trafalgar | Rev Circ | 16 | 4,000 | 1,219 | Pollock |
| 1985 | Westley | Rev Circ | 11 | 8,885 | 2,708 | Lang |
| 1990 | Geochem Mines | Rev Circ | 1 | 380 | 116 | Lang |
| 1999 | Lode Star Gold | Rev Circ Surf | 7 | 3,500 | 1,067 | Lang |
| 1999 | Lode Star Gold | UG Longhole | 67 | 2,400 | 732 | Lode Star |
| 2000 - 09 | Lode Star Gold | UG Core | 152 | 23,000 | 7,010 | Lode Star |
| 2007 | Lode Star Gold | Core Surf | 22 | 10,400 | 3,170 | Lode Star |
| 2011 | ICN Resources | Core Surf | 26 | 5,795 | 1,766 | Redcore |
| 2011 | ICN Resources | Rev Circ | 63 | 27,400 | 8,352 | DeLong |
| 2016 | Lode-Star Mining | Water well | 2 | 820 | 250 | Boart-Longyear |
| 10.1 | Drill Hole Sampling Method and Approach |
| 10.1.1 | Conventional Rotary Drilling Sampling |
In conventional rotary drilling the drill cuttings ascend up the outside of the drill pipe between it and the wall of the hole. The sample passed through a cyclone splitter, and the interval was always 5 ft (1.52 m). Samples are placed in cloth bags labeled with the footage or sample number and placed in the sun to drain and dry. In that era, a second duplicate sample was generally collected and retained for check assaying later if needed. Due to the nature of the movement of the drill cuttings between the pipe and the hole, some material was lost into cracks in the rock, and it is possible to dilute a drilled interval with material from the wall of the hole above the interval. This method tended to spread and dilute higher-grade intercepts over longer sample intervals.
| Technical Report on the | 15 January 2020 |
| Goldfield Bonanza Project | |
| 10.1.2 | Reverse Circulation Drilling Sampling |
With reverse circulation drilling, the cuttings are passed from the drill bit upward through an inlet into the space between an inner tube and the drill pipe. The cuttings are blown with either compressed air or an air-water-mud mixture through a cyclone cylinder and dumped into a rotary sample splitting device which can be adjusted to capture the desired amount of sample material. This style of drilling produces a sample which is much more representative of the interval drilled. At the time of the Westley Mines reverse circulation drilling done in 1985, reverse circulation holes were commonly drilled dry using compressed air (no drilling fluids added) to as great a depth as possible, until the water table was reached, or often below it. The area drilled by Westley is above the water table, except for the bottom of a few holes. An exception to drilling dry was that in areas of badly broken rock with poor sample return, it became necessary to either stop the hole or continue it by using drilling fluids. The fluid was occasionally just water, but usually included mud additives (e.g. bentonite).
When drilling dry, sampling was quite simple. The drill cuttings for each 5-foot (1.52 m) interval were allowed to accumulate in the cyclone with some fine dust blowing out the stack. At the end of every 5 ft (1.52 m), the sample was dumped from the cyclone through a riffle splitter set up so that two samples were collected about 5 pounds (2.3 kg) in weight. The second sample was kept as a reference sample or to be sent to the lab as a duplicate. The cyclone and splitter were blown clean with compressed air between samples.
The reverse circulation drilling done by Lode Star Gold in 1998 was nearly always drilled wet, with water and drilling mud injected to cool and lubricate the bit and flush drill cuttings up the drill pipe. During wet drilling, the sample passed from the cyclone to a rotary wet splitter in which the sample material was distributed over a series of slots. These slots divided the sample material such that ideally about 25% of the sample was captured and the excess was discharged. It was important to thoroughly rinse the cyclone and splitter with water between samples. Sample bags were marked as in dry sampling.
| 10.1.3 | Core (Diamond Drill Hole) Sampling |
The usual practice is to wash the core, then carefully re-aligned it in the core box and mark a center line on the core. Core was then carefully marked into sampling intervals by the geologist. Except for the Lode Star Gold core, which was not split, each interval was split (as well as possible) into equal halves using a hydraulic splitter in softer zones or sawed in silicified areas. Half of each core interval was bagged in carefully labeled cloth bags with a sample tag inside. The second half was retained in the core box for reference.
Long hole drilling can produce surprisingly reliable samples if it is done properly. In the long hole drilling done by Lode Star Gold, the sampling procedures were rigorous and good samples were the result. In this drilling, after the first several inches were drilled, a stuffing box was used for sample collection. This is a steel tube slightly larger than the drill bit which is inserted firmly into the hole. The tube has steel tube branching downward to which a hose is attached. The hose leads to a cloth sample bag which sits in a 5-gallon (22 l) bucket. The drill sludge and cuttings from each sample are discharged directly into the labeled sample bag with little or no sample loss. Samples were collected for each 1-foot (30cm) interval and allowed to dry near the drill.
| Technical Report on the | 15 January 2020 |
| Goldfield Bonanza Project | |
| 10.2 | Newmont Mining Co. Drilling |
The first known drilling on the property was done by Newmont Mining in approximately 1950. Fragmentary records found by Geochem Mines in the Mackay Library at the University of Nevada-Reno indicated that Newmont drilled several underground long-holes in the vicinity of the Newmont Lode pursuing extensions of the lodes being mined. DH-1, which was drilled about 200 ft (61m) NW of the Lode, intersected 10 ft (3 m) grading 0.5 oz Au/t (17.1 g/t) and the subsequent 10 ft (3 m) grades 0.25 oz Au/t (8.6 g/t). A second hole located near the southern limit of the Newmont workings intersected 10 ft (3 m) grading 0.72 oz Au/t (24.7 g/t) followed by 10 ft (3 m) grading 0.36 oz Au/t (12.3 g/t). All of these were drill sludge samples which generally do not give an accurate sample of the grade. At best they indicate that high grade material is present in those sample intervals.
| 10.3 | Trafalgar Mines Drilling |
The next known drilling campaign was that of Trafalgar Mines, Ltd, in 1980 to 1982. Trafalgar drilled 132 vertical exploration holes for a total of 29,456 ft (8980 m) (Figure 10.1). Drilling was largely done using conventional rotary techniques (not reverse circulation) using both hammer and tri-cone bits, although the last 16 holes were done using reverse circulation (RC). Conventional rotary drilling produces somewhat less accurate sampling than RC and tends to spread and dilute gold values over longer intervals than are actually intersected, thus the specific intervals and values derived from this drilling are somewhat suspect. This drilling discovered two significant gold occurrences immediately beneath the Siebert formation sediments that came to be known as the Church Vein and the January Target. Multiple gold zones were identified with values up to 0.38 oz Au/t (13.4 g/t) in the Church vein zone. Drilling also indicated a quartz-alunite alteration zone up to 40 ft (12.2 m) wide that strikes generally north-south and appears to converge with the high-grade gold veins of the January Mine located 700 ft (213 m) to the north. Other holes in the Newmont Lode area and near the Silver Pick Shaft yielded several good gold intercepts including a 0.48 oz Au/ton (16.4 g/t) intercept in vein zones adjacent to old Newmont mine workings.
| 10.4 | Westley Mines Drilling |
In 1985, Westley carried out seismic surveys and drilled some of the seismic anomalies, completing eleven angled reverse circulation holes for a total of approximately 8,885 ft (2708 m) of drilling (Figure 10.2). Each hole intersected encouraging hydrothermal alteration associated with low-grade gold-bearing veins. The best hole, GMF03 penetrated a 5-foot (1.5 m) zone, 510 ft (155 m) vertically below the surface that assayed 0.46 oz Au/ton (15.8 g/t). This intercept appears to be the down-dip extension of the westerly-dipping Red Hills Decline vein, near its projected intersection with the Church Vein zone. Another possibility is that it is the down-dip extension of the steeply dipping Church Vein.
| Technical Report on the | 15 January 2020 |
| Goldfield Bonanza Project | |
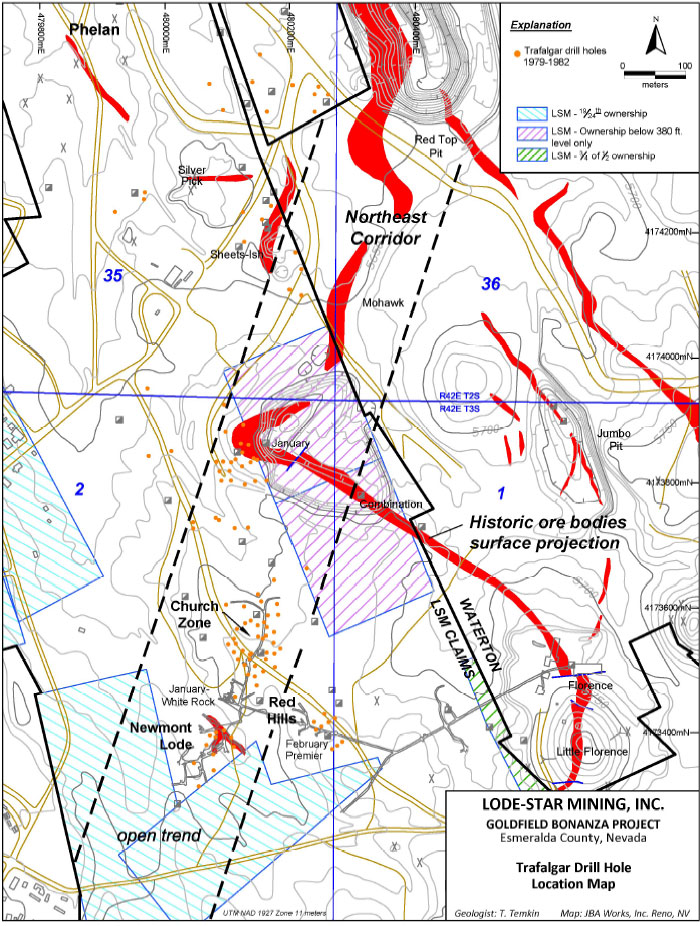
Figure 10.1 Trafalgar Mines Drilling
| Technical Report on the | 15 January 2020 |
| Goldfield Bonanza Project | |
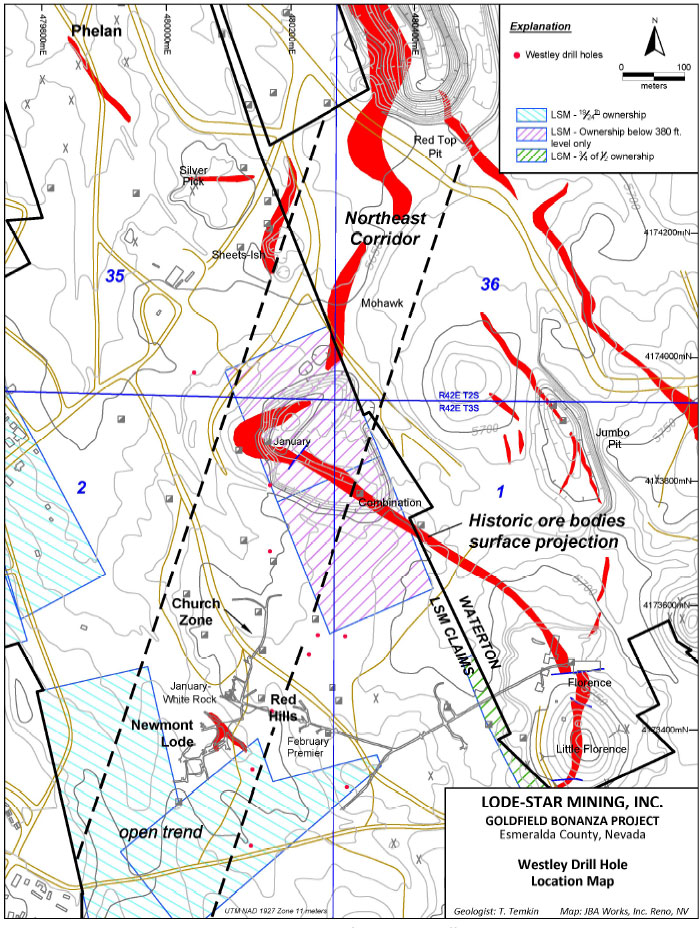
Figure 10.2 Westley Mines Drilling
| Technical Report on the | 15 January 2020 |
| Goldfield Bonanza Project | |
| 10.5 | Geochem Mines Drilling |
In 1990, Geochem Mines acquired the property and carried out a substantial amount of work, including data compilation and rehabilitation of underground workings. Only one drill hole was drilled, an RC hole to a depth of 380 ft (116 m), for which there is no available collar data.
| 10.6 | Lode Star Gold, INC Drilling |
After acquiring the property in 1998, Lode Star Gold began an extensive drilling program both from surface and from rehabilitated underground workings. Designed to improve the understanding of the gold intercepts from prior work, the initial phase consisted of 3500 ft (1067 m) of reverse circulation drilling in seven angled RC holes (Figure 10.3). This program verified the presence of significant gold mineralization (with intercepts up to 0.4 oz Au/t (13.7 g/t) occurring within known vein zones extending beyond the limits of areas previously mined. See Table 10.2 for intervals that assayed 0.5 oz/ton (17.14 g/t) and higher.
In an effort to better define the orientation of the vein zones and better understand the distribution of gold grades within this veining, a program of jack-leg or long-hole drilling was conducted from the rehabilitated underground workings (Figure 10.4). In 1999, sixty-three of these holes were completed for a total of 2,400 ft (732 m) of drilling (32 ft or 9.6 m average length). Sludge samples were collected at 1-foot (30.5 cm) intervals for gold analysis. The short sample interval combined with cleaning the hole between samples gave more representative results than longer intervals. This work verified the two primary targets, the Red Hills vein system and the Church Vein Zone, with numerous indications of high-grade gold, including assays as high as 5.3 oz Au/ton (181.7 g/t) in the Church vein.
In 2000 an underground core drilling program consisting of a total of 23,000 ft (7010 m) of core drilling in 152 holes was completed (Figure 10.4). Most were short holes, with an average length of 151 ft (495 m). Many of them encountered high grade gold values - up to 52 oz Au/ton (1.783 kg/t) in the Red Hills area. The work was largely focused on the Red Hills and Church Vein zones, but some holes were drilled in the Newmont Lode area as well.
To better define the limits of the gold mineralization in the Stope Vein zone within the Red Hills area, a surface core drilling program began in the spring of 2007. Step-out holes were designed to test both the down-dip and strike extension of each of the vein’s zones in the Red Hills Stope area. The program was completed in 2009 with a total of 10,400 ft (3,170 m) of drilling in 22 holes. Several high-grade intercepts were encountered, the highest being 75 oz/ton (2.57 kg/t).
| Technical Report on the | 15 January 2020 |
| Goldfield Bonanza Project | |
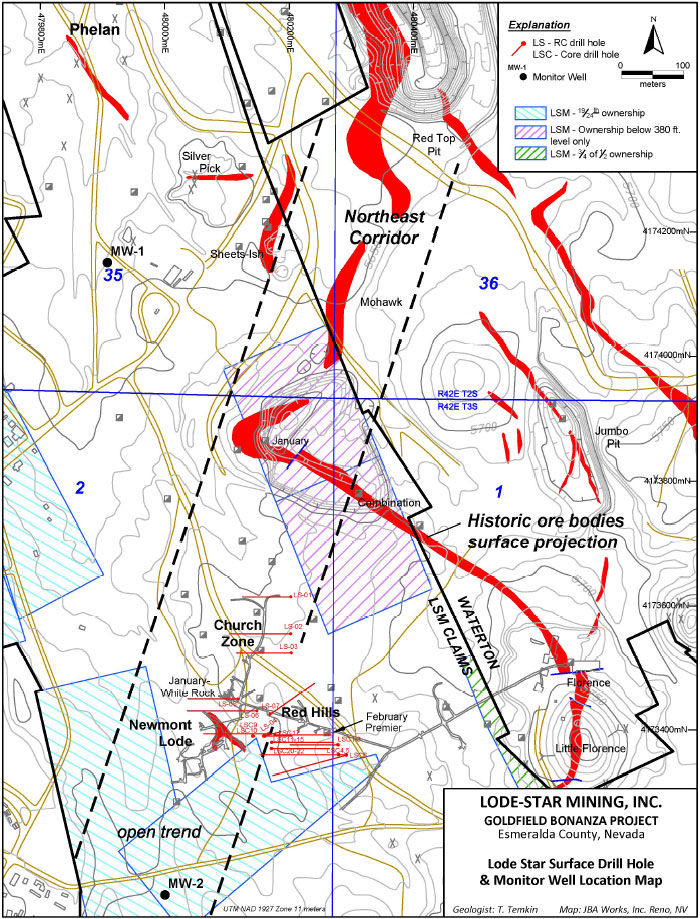
Figure 10.3 Lode Star Gold, INC Surface Drilling
| Technical Report on the | 15 January 2020 |
| Goldfield Bonanza Project | |
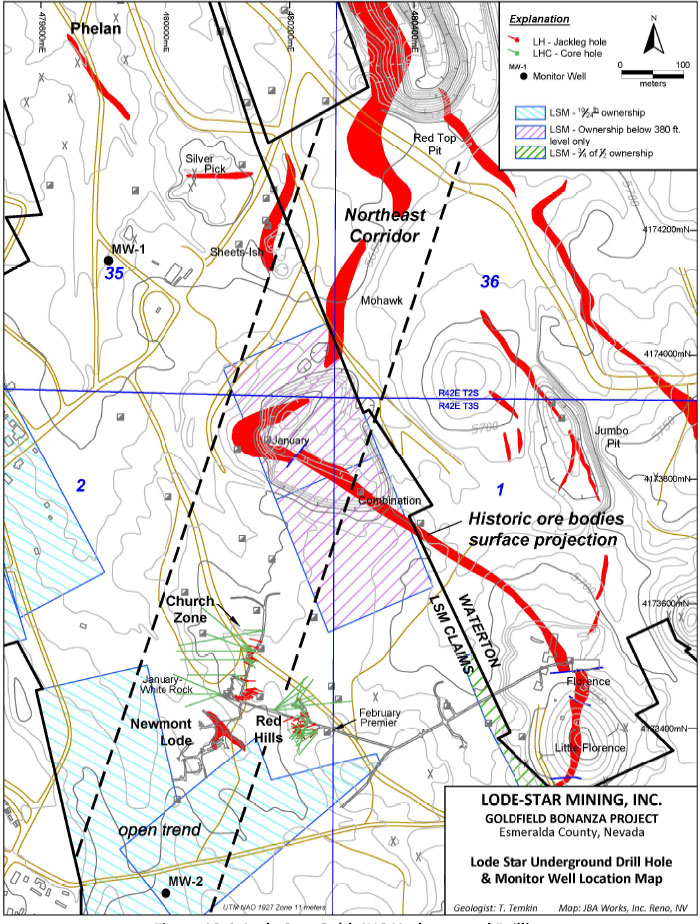
Figure 10.4 Lode Star Gold, INC Underground Drilling
| Technical Report on the | 15 January 2020 |
| Goldfield Bonanza Project | |
Table 10.2 Lode Star Gold, INC Core Intercepts Greater or Equal To 0.5 oz/ton (17.14 g/t)
Lode Star Gold underground core
| Hole ID | From m | To m | From ft | To ft | Length ft | Au g/t | Au oz/ton |
| LHC010 | 11.3 | 11.6 | 37.0 | 38.0 | 1.0 | 30.2 | 0.880 |
| LHC013 | 13.4 | 14.0 | 44.0 | 46.0 | 2 | 40.3 | 1.176 |
| LHC017 | 13.1 | 13.4 | 43.0 | 44.0 | 1.0 | 22.7 | 0.663 |
| LHC018 | 16.8 | 17.1 | 55.0 | 56.0 | 1.0 | 120.6 | 3.518 |
| LHC037 | 7.0 | 7.6 | 23.0 | 25.0 | 2.0 | 91.6 | 2.672 |
| LHC040 | 6.7 | 7.3 | 22.0 | 24.0 | 2.0 | 42.6 | 1.243 |
| LHC041 | 5.8 | 6.4 | 19 | 21 | 2 | 1093.9 | 31.906 |
| LHC045 | 12.8 | 14.0 | 42 | 46 | 4.0 | 57.7 | 1.683 |
| LHC045 | 18.0 | 19.2 | 59.0 | 63.0 | 4.0 | 164.3 | 4.800 |
| LHC047 | 4.3 | 4.6 | 14.0 | 15.0 | 1.0 | 120.3 | 3.510 |
| LHC049 | 6.7 | 7.0 | 22.0 | 23.0 | 1.0 | 95.5 | 2.786 |
| LHC049 | 11.3 | 11.9 | 37.0 | 39.0 | 2.0 | 69.4 | 2.025 |
| LHC049 | 12.5 | 12.8 | 41.0 | 42.0 | 1.0 | 31.1 | 0.906 |
| LHC051 | 5.2 | 5.5 | 17.0 | 18.0 | 1.0 | 34.6 | 1.009 |
| LHC066 | 22.6 | 22.9 | 74.0 | 75.0 | 1.0 | 30.3 | 0.885 |
| LHC067 | 24.4 | 24.7 | 80.0 | 81.0 | 1.0 | 72.1 | 2.102 |
| LHC069 | 29.0 | 29.6 | 95.0 | 97 | 2.0 | 199.7 | 5.825 |
| LHC099 | 40.8 | 41.1 | 134.0 | 135.0 | 1.0 | 29.1 | 0.848 |
Intervals greater than 1.0 oz/ton (34.29 g/t) are in bold.
Lode Star Gold surface core
| Hole ID | From m | To m | From ft | To ft | Length ft | Au g/t | Au oz/ton |
| LSC012 | 99.7 | 100.6 | 327 | 330 | 3.0 | 85.43 | 2.492 |
| LSC012 | 148.1 | 149 | 486 | 489 | 3.0 | 1297.2 | 37.835 |
| incl. | 148.4 | 148.7 | 487.0 | 488.0 | 1.0 | 2,571.4 | 75.000 |
| LSC013 | 94.5 | 94.8 | 310.0 | 311.0 | 1.0 | 72.0 | 2.100 |
| LSC013 | 101.2 | 102.1 | 332.0 | 335.0 | 3.0 | 223.3 | 6.512 |
| LSC017 | 86.9 | 87.5 | 285.0 | 287.0 | 2.0 | 73.2 | 2.135 |
| LSC017 | 91.4 | 91.7 | 300.0 | 301.0 | 1.0 | 47.7 | 1.390 |
| | | | | | | | |
Intervals greater than 1.0 oz/ton (34.29 g/t) are in bold.
| Technical Report on the | 15 January 2020 |
| Goldfield Bonanza Project | |
| 10.7 | ICN Resources Drilling |
ICN Resources acquired control of the property in March 2011. During that year ICN drilled 26 core holes for a total of 5,795 ft (1,767 m) and an additional 63 RC holes for a total of 27,470 ft (8,375 m) (Figure 10.5). The core holes (hole ID prefixed with “ICN-”) were drilled largely in the Church Zone and the RC holes (hole ID prefixed with “ICR-”) were utilized to test other exploration targets throughout the property.
The third core hole, ICN-003, returned a weighted-average intercept of 9.5 ft (2.90 m) that assayed 40.8 oz/ton (1.4 kg/t) gold. Eleven holes were then drilled around the ICN-003 discovery hole within a 100 meter by 150-meter area. Additional extraordinary high-grade intercepts included 4.5 ft (1.37 m) in ICN-013 that assayed 51.46 oz/ton (1.76 kg) gold, and a weighted average of 9.5 ft (2.9 m) in ICN-014 that averaged 26.8 oz/ton (918.0 g/t) gold. The next highest grade intervals are 4 ft (1.22 m) in ICN-023 that averaged 1.46 oz/ton (50 g/t) and 3 ft (.91 m) in ICN-024 that assayed .802 oz/ton (27.5 g/t). All of these high-grade intercepts lie along the same north-northeast structural trend, which also falls in the broader NE corridor of mineralization. See Table 10.3 for drill hole intercepts greater or equal to 0.5 oz/ton (17.14 g/t).
ICN’s core drilling showed that the Church Zone is covered by as little as 55 ft (16.9 m) of post-mineral cover. The zone remains open along strike and down-dip and falls within the NE Corridor as defined by mineralization and geophysics.
The RC drilling program was designed to test four areas. Most of the work was focused on the 600-foot (183 m) strike length of the NE Corridor between the Church Zone and the Combination Pit. Six holes were drilled to test the January area, immediately west of the Combination Pit. An additional 19 holes were drilled to test mineralized zones noted by prior exploration programs in the northeastern portion of the claim block, including the Sheets-Ish Silver Pick and Phelan Shaft areas. Five holes were located in the Newmont Lode area to test extensions of known mineralization.
Drilling in the NE Corridor (away from the Church Zone) showed that the structure and alteration persist throughout, and that attractive gold mineralization is present. Numerous lower grade intercepts were encountered, which contained shorter high-grade intervals. The degree of silicification, quartz veining and fracturing in these intercepts indicates that the lower grade intercepts may represent halos to higher grade mineralization. Additional drilling will be required to better delineate these mineralized zones.
| Technical Report on the | 15 January 2020 |
| Goldfield Bonanza Project | |
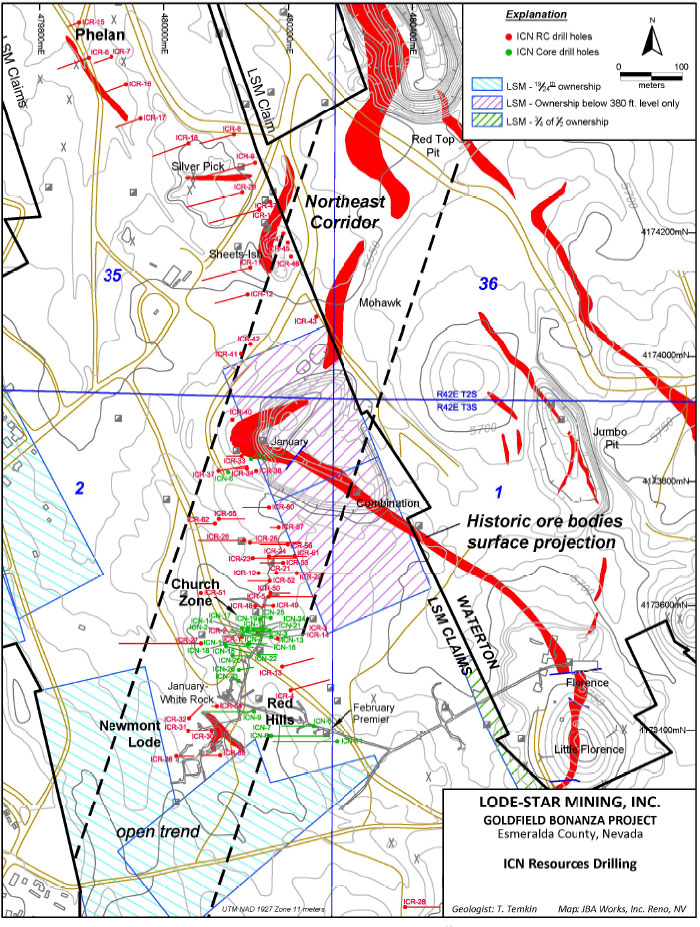
Figure 10.5 ICN Resources Drilling
| Technical Report on the | 15 January 2020 |
| Goldfield Bonanza Project | |
Table 10.3 ICN Resources Drill Intercepts Greater or Equal To 0.5 oz/ton (17.14 g/t)
ICN Resources core
| Hole ID | From m | To m | From ft | To ft | Length ft | Au g/t | Au oz/ton |
| ICN-001 | 59.7 | 60.7 | 196.0 | 199.0 | 3.0 | 23.2 | 0.677 |
| ICN-001 | 60.7 | 61.6 | 199.0 | 202.0 | 3.0 | 215.7 | 6.290 |
| ICN-003 | 16.9 | 19.8 | 55.5 | 65.0 | 9.5 | 1398.6 | 40.793 |
| Incl. | 16.9 | 18.6 | 55.5 | 61.0 | 5.5 | 547.3 | 15.963 |
| Incl. | 18.6 | 19.8 | 61.0 | 65.0 | 4.0 | 2569.2 | 74.935 |
| ICN-003 | 24.8 | 26.8 | 81.5 | 88.0 | 6.5 | 57.1 | 1.665 |
| ICN-008 | 94.5 | 95.3 | 310.0 | 312.5 | 2.5 | 183.6 | 5.355 |
| ICN-013 | 28.0 | 29.4 | 92.0 | 96.5 | 4.5 | 1,764.2 | 51.455 |
| ICN-014 | 25.1 | 26.1 | 82.5 | 85.5 | 3.0 | 181.9 | 5.306 |
| ICN-014 | 27.0 | 28.0 | 88.5 | 92.0 | 3.5 | 2,332.0 | 68.018 |
| ICN-015 | 66.4 | 67.2 | 218.0 | 220.5 | 2.5 | 24.5 | 0.714 |
| ICN-018 | 57.9 | 59.4 | 190.0 | 195.0 | 5.0 | 23.5 | 0.684 |
| ICN-023 | 64.3 | 64.9 | 211.0 | 213.0 | 2.0 | 61.6 | 1.798 |
| ICN-023 | 64.9 | 65.5 | 213.0 | 215.0 | 2.0 | 37.1 | 1.081 |
| ICN-024 | 24.1 | 25.0 | 79.0 | 82.0 | 3.0 | 27.6 | 0.805 |
| | | | | | | | |
| ICN Resources rotary-reverse circulation |
| |
| ICR-003 | 18.3 | 19.8 | 60.0 | 65.0 | 5.0 | 39.0 | 1.138 |
| ICR-003 | 19.8 | 21.3 | 65.0 | 70.0 | 5.0 | 21.7 | 0.633 |
| ICR-003 | 39.6 | 41.1 | 130.0 | 135.0 | 5.0 | 17.2 | 0.502 |
| ICR-003 | 59.4 | 61.0 | 195.0 | 200.0 | 5.0 | 19.0 | 0.554 |
| ICR-031 | 105.2 | 106.7 | 345.0 | 350.0 | 5.0 | 17.3 | 0.505 |
| ICR-032 | 64.0 | 65.5 | 210.0 | 215.0 | 5.0 | 18.2 | 0.530 |
| ICR-044 | 12.2 | 13.7 | 40.0 | 45.0 | 5.0 | 28.3 | 0.826 |
| | | | | | | | |
Intervals greater than 1.0 oz/ton (34.29 g/t) are in bold.
| Technical Report on the | 15 January 2020 |
| Goldfield Bonanza Project | |
| 10.8 | Lode-Star Mining, Inc. Drilling |
Lode-Star Mining has not conducted any exploration drilling on the property but did sample two water quality monitoring wells drilled in 2016. Locations are shown onFigure 10.3. The holes were specifically sited for water quality monitoring and not for finding mineralization, therefore the lack of significant results is unsurprising. MW-1, drilled to a depth of 400 ft (122 m) was essentially barren except for an intercept of 0.0395 oz/ton gold (1.35 g/t) from 315 to 320 ft (96.0 to 97.5 m). MW-2, drilled to a depth of 420 ft (128.0 m) had two notable intercepts, otherwise being essentially barren; 0.0344 oz/ton (1.18 g/t) from 270 to 275 ft (82.3 to 83.8 m), and 0.0178 oz/ton (0.61 g/t) from 415 to 420 ft (126.5 to 128 m).
| 11.0 | SAMPLE PREPARATION, ANALYSIS, SECURITY AND QUALITY ASSURANCE/QUALITY CONTROL (QA/QC) |
As is common with properties with a long history of exploration, the further back in time, the less well preserved is the information regarding laboratories used and sample preparation and analytical techniques employed.
With the exception of the in-house laboratory used toward the end of the Trafalgar program, all of the laboratories named below are (or were at the time) considered to be reputable with modern facilities, using quality control and assay procedures that were consistent with best practices at the time of the drilling.
Security protocols used by operators of the property prior to Lode Star Gold are not available. None of the operators of the property before Lode Star Gold discussed quality control procedures in their reports. It may be possible to acquire information on in-lab QA/QC procedures at the time the exploration programs were done by contacting those labs that still exist, or personnel who worked on the project.
| 11.1 | Newmont Mining Co. Drilling |
Information regarding the laboratory, sample preparation, analysis, security, or QA/QC used by Newmont Mining in the 1940’s and 1950’s is not available.
| 11.2 | Trafalgar Mines Drilling 1979 - 1987 |
Between 1979 and 1987 Trafalgar used Hunter Laboratories in Sparks, Nevada and Rocky Mountain Geochemical Laboratory most of the time. Toward the end they had their own lab on site and did their own fire assays. It is unclear which laboratory performed the assays for many of the holes due to the lack of assay certificates in some of the drilling files.
The procedures for sample preparation, analysis, and security for samples submitted by Trafalgar Mines to Hunter Laboratory, Rocky Mountain Geochemical or their in-house laboratory are not documented in the available files. Due to these deficiencies in the documentation of the drilling and sampling methods and laboratories used, Trafalgar’s drilling results are less verifiable than those of Lode Star Gold and ICN Resources.
| Technical Report on the | 15 January 2020 |
| Goldfield Bonanza Project | |
| 11.3 | Westley Mines Drilling 1985 |
Information regarding the laboratory, sample preparation, analysis, security, or QA/QC used by Westley Mines in 1985 is not available.
| 11.4 | Geochem Mines Drilling 1990 |
In 1990, Geochem Mines used Barringer Laboratories for their assay work, both for drilling and rock samples. Sample preparation, analytical techniques, QA/QC and sample security are not known.
| 11.5 | Lode Star Gold, INC Drilling 1998 - 2010 |
From 1998 to 2010, Lode Star Gold used Chemex Laboratories (now ALS Chemex) for nearly all assay work, with some check assaying done by American Assay Laboratories.
The analytical work done for Lode Star Gold at ALS Chemex is well documented. Core samples were crushed to 70% minus 2 mm. A 250-gram split was taken and pulverized to 85% passing a 75 micron screen. RC samples were dried, then crushed, screened, spit and pulverized as core samples were. The assay technique used was fire assay with an AA finish for all samples. Any assay results over 30 grams per ton were re-analyzed using a one-ton fire assay with a gravimetric finish.
Lode Star Gold geologist Tom Temkin, QP supervised the drilling program and has stated that the company was careful regarding sample security during both the underground and the surface drilling. At the end of each shift drill cutting samples and core boxes were placed in a locked building until they were prepared for shipment. Samples were taken directly to the lab by company personnel or were picked up at the site by representatives of the assay lab.
Lode Star Gold did not insert blank, standard or duplicate samples for quality control purposes, but instead relied on the internal quality control program at ALS Chemex Laboratory. ALS Chemex is ISO9001:2008 registered and accredited to ISO/IEC 17025 standards. Quality control samples, including blanks, standards and duplicates, are inserted by Chemex in each analytical run. Any data for these samples that falls outside of control limits is assessed by laboratory personnel and re-assayed if necessary.
Subsequent QA/QC work on a portion of Lode Star Gold drilling samples and data is discussed in Section 11.8 below.
| 11.6 | ICN Resources Drilling |
The RC drilling program by ICN Resources was done in two campaigns by Delong Drilling based in Winnemucca, Nevada. Samples were collected in 5-foot (1.52 m) intervals with cuttings passed through a cyclone sample splitter and captured in woven bags which allowed drainage while retaining fines. Samples were sent to ALS Chemex or American Assay Lab, both in Reno/Sparks.
ICN used both ALS Chemex Laboratory and American Assay Laboratory for assaying. Core holes ICN-001 through ICN-007 and RC holes ICR-001 through ICR-011 were prepped and assayed at Chemex, while all remaining holes were prepped and assayed at American Assay.
| Technical Report on the | 15 January 2020 |
| Goldfield Bonanza Project | |
The samples from ICN’s reverse circulation drilling of holes ICR-001 to 011 were sent to ALS Chemex for analysis, and the same sample preparation and analytical procedures were used, as described in the paragraph above. ICN changed to American Assay Laboratory after hole ICR-11. Holes ICR-011 to ICR-063 and ICN core holes ICN-008 to ICN-26 were sent to American Assay Laboratory. The sample preparation and analytical procedures were virtually identical to those described in the paragraph above – except that a 1000 gram pulp was made and a sand wash was used between samples in the pulverizer. ICN’s analytical work is well documented and assay certificates are in the files.
Sample security for the ICN Resources drilling was as follows: After stapling on a barcode tag, reverse circulation drilling samples were placed on a trailer and moved at the end of the shift inside a chain-link fenced area with a locked gate. Boxes of core were placed in a locked building. Cuttings or split core samples were picked up by the laboratory personnel and transported to the laboratory.
QA/QC data from the ICN drill assays were analyzed and plotted by Keith Blair of Applied Geosciences, LLC and was thoroughly discussed by Durgan in his 2013 report. This complete discussion is available from Lode-Star Mining if desired.
In summary, the assay quality assurance and quality control program used by ICN met industry standards. During the ICN drilling programs, QA/QC samples were inserted into the sample sequence. For each 92 samples, there were 8 blind control samples; three standards, three blanks and two duplicates. One of the duplicates is a duplicate pulp and the other was taken from the crushed coarse rejects. In addition, the laboratories inserted their own quality control samples.
Reference sample assays from both Chemex and American Assay are acceptable with few anomalous standard instances. Systematic bias is not apparent in the reference sample assays at any grade range. Field duplicate assays agree well with the original sample with few outlier pairs. Internal laboratory check assays at AAL also show few anomalous assay pairs with no significant bias. There are relatively few check assays at a secondary laboratory; however, the existing check assay data agree well with the original assays.
| 11.7 | Lode-Star Mining, Inc. Drilling |
For the two water-quality monitoring holes drilled by Lode-Star Mining in 2016, sample collection, security, QA/QC, and transportation were treated the same as for the Lode Star Gold drilling discussed in paragraph 11.5 above. All samples were submitted to American Assay Laboratories in Sparks Nevada for sample preparation and analysis. Gold was assayed by fire assay on a 30 g charge with an inductively coupled plasma mass spectrometry (ICP) finish, and twelve other elements were determined by ICP.
| 11.8 | Mine Development Associates Data Verification |
In 2018 Mine Development Associates (MDA) completed a data verification program that included an audit of Red Hills area drill hole data and a comparative QA/QC check assay analysis on selected Lode Star Gold drilling (Mijal and Gustin, 2018).
| Technical Report on the | 15 January 2020 |
| Goldfield Bonanza Project | |
Conclusions of that work were that data generated during the drill hole database audit suggest that collar (excluding underground drilling collars) and survey data for the Red Hills area is reliable and accurate to historical records, with an error rate of less than 1%. The sub-set of drill holes from areas outside of the Red Hills shows similar reliability and accuracy. When deemed appropriate by Lode-Star Mining, additional auditing is recommended for future work outside of the Red Hills area, since the audited sub-set does not represent the entirety of the area outside of the Red Hills area. Rather, this sub-set represents drill data near the periphery of the Red Hills area only.
Regarding drill series, data entry for both ICN and ICR series can be considered accurate and valid, as the data for 23% of all ICN and 18% of all ICR drill holes and 20% of the ICN and 15% of the ICR series assays were audited. Less than 1% error was observed in both collar and assay entry for these series. The remaining drill hole series located outside of the Red Hills area require additional auditing to validate entered data within the database.
Although Real-Time Kinematic (RTK) GPS survey equipment was used to capture relatively accurate surface collar locations, MDA recommends that additional survey precision and reliability (particularly in the vertical dimension) be gained by installation of a permanent surface control point that has a highly accurate position. A properly defined control point (e.g., RTK GPS base-station set-up point), complete with documented coordinates, projection, and vertical datum, will ensure that future surveys are conducted with the same coordinate definition and that surveys conducted with differing survey instruments will be relatable to each other. Coordinates can be carried from this surface control point to install underground control stations. MDA recommends establishing underground survey control to allow for all underground workings and drill hole collar locations to be re-surveyed.
MDA also recommends re-entering a selected group of drill holes with proper down-hole surveying equipment (if drill holes are still accessible) or performing down-hole surveys in future drilling campaigns. This would give greater confidence in actual downhole sample location, which would test the adequacy of the use of collar azimuth, dip, and length as a survey substitute.
For the comparative QA/QC check assay analysis, a total of 86 pulps from 23 holes drilled in the Red Hills area were randomly chosen by MDA and sent by Lode Star to American Assay Laboratories in Reno, Nevada (“AAL”) for check assaying. Analytical results from this pulp-check analyses compared well with the original database gold analyses at grades relevant to the potential underground mining scenario at Red Hills.
The author did not take samples from outcrops, underground workings, or drill samples during his two site visits to the property to verify the presence or quantity of gold mineralization within the project area. Neither has he conducted a thorough examination of drill hole data from the property. Accordingly, the author relies on the audit of selected drill data and a QA/QC check assay analysis on selected Lode Star Gold drilling samples by Mine Development Associates of Reno, Nevada in 2018 (Mijal and Gustin, 2018) for verification of project data.
| Technical Report on the | 15 January 2020 |
| Goldfield Bonanza Project | |
| 13.0 | MINERAL PROCESSING AND METALLURGICAL TESTING |
| 13.1 | 2006 Kappes, Cassiday & Associates |
In 2006 four 5-gallon (22 lt) buckets of mineralized rock with a total weight of 163 pounds (74 kg) with pieces up to 3 inches (7.6 cm) in diameter were delivered to Kappes, Cassiday & Associates in Reno for metallurgical testing.
The four buckets of material were combined and crushed to 0.5-inch (1.27 cm) size. A 10 kg split was crushed to 10 mesh (Tyler). From this material two 500 gram and four 1000 gram pulps were split from the total. Each split was pulverized to 80% minus 150 mesh (Tyler). Each of the 500 gram pulps were assayed for gold, silver, total sulfur and sulfide sulfur. The four 1000 gram pulps were used for testing of direct cyanide leach, a gravity separation test, a flotation test and a water sulfur extraction.
The standard bottle roll test (see Difilippi, 2006 for test details) yielded a gold extraction of 91% based on a calculated head grade of 0.866 oz Au/ton (29.7 g/t) after 96 hours of leaching. Sodium cyanide consumption was 10.09 pounds (4.58 kg) per ton. To maintain an alkaline pH, 60 pounds (27.3 kg) of Ca(OH)2 and 12 pounds (5.45 kg) of NaOH were required.
For the gravity test, a 1000-gram split placed in a Falcon concentrator was used. The sample was passed through the concentrator in a series of tests to produce three separate products (the concentrate fractions produced were hand panned to produce three final “concentrates”. The hand panned tailings material was then cycled back to the concentrator for cycles one and two and kept as a separate “middlings” fraction following cycle three). The final concentrate products were dried, weighed and then assayed for gold and silver by fire assay. The middling fraction was also dried, and fire assayed. The tailings were dried, weighed and then fire assayed for gold and silver. This testing indicated that 37% of the contained gold and 30% of the contained silver could be concentrated into 26% of the weight of the feed material.
A third 1000 gram split was floated using a flotation machine and Reno tap water at 25% solids. The concentrate and tails were dried, weighed and assayed. This testing indicated that 44% of the gold and 34% of the contained silver could be recovered in a portion weighing 15.2% of the weight of the feed material.
| 13.2 | 2010 Newmont Mining Co. |
In January 2010 Lode Star Gold delivered an ore sample to Newmont Mining for a test of its amenability to roast-CIL (roasting followed by carbon-in-leach) processing. Results were as follows (Arthur, 2010): “The sample assayed as a high grade (2.2 oz Au/ton), sulfide sulfur, refractory ore and responded very well to the typical roast-CIL amenability test used to predict performance at Newmont’s Mill 6. The CIL recovery after roasting at 500 deg C for 90 minutes was 94% with a 10 hour CIL bottle roll test, and 97% with a 24 hour bottle roll test. NaCN consumption was a bit higher than normal (2.0 lb/ton vs 1 lb/ton) and lime demands were quite high (100 lb/ton compared to about 25 lb/ton). With minimal blending efforts the reagent additions could be managed at Mill 6.”
| Technical Report on the | 15 January 2020 |
| Goldfield Bonanza Project | |
| 13.3 | 2017 Kappes, Cassiday & Associates |
In May 2017, Kappes, Cassiday & Associates completed a metallurgical study on a 111 kg mineralized composite sample from Lode Star Gold. As received, the composite sample assayed 0.2933 oz/ton Au (10.06 g/t) and 0.145 oz/ton Ag (4.97 g/t). This work was primarily directed to investigate ore characteristics that may be amenable to processing by a certain third-party.
The general conclusions of the 2017 metallurgical work are that stand-alone gravity methods will not be suitable for recovery of gold from Goldfield ores (Kappes, et al., 2017). Indications are that either flotation or agitated cyanide leach processes will be the preferred processes, but that considerable additional testing will be necessary to determine the particulars of those methods.
| 13.4 | 2019 Kappes, Cassiday & Associates |
Additional testing in 2019 by Kappes, Cassiday & Associates on 400 kg of raw ore was designed to provide further guidance regarding the processes necessary to achieve highest levels of extraction from a third-party mill. The sample consisted of sixteen cloth bags of crushed rock that were combined into a single test composite that was utilized for head analyses and gravity/flotation/bottle roll leach test work. Averages of two assays of the head material returned 1.5125 oz Au/ton (51.86 g/t) by standard fire assay with a flame atomic absorption spectrophotometric (FAAS) finish, and 0.505 oz Ag/ton (17.31 g/t) by 4-acid digestion followed by an FAAS finish. Head material was also assayed for carbon, sulfur, mercury, and copper, and semi-quantitatively for an additional series of elements and for whole rock constituents
Cyanide shake tests were conducted utilizing portions of the pulverized head material. These tests provided preliminary indications of cyanide soluble metal extractions from pulverized material. Average extractions from two samples are 59% for gold and <1% for silver.
Extractions of both gold and silver from bottle roll leach tests on gravity and flotation products exceed 97% on all samples. Kappes, Cassiday & Associates noted that milling size does not significantly affect the gold or silver extraction. See Table 13.1 for a summary of the test data and refer to Kappes, Cassiday & Associates (2019) for the full report.
Table 13.1 Kappes, Cassiday & Associates, 2019 Table 3.1
Extraction Summary of Gravity and Flotation Testing
KCA
Sample No. | Description | Target
Milled Size,
mesh Tyler | Knelson Stage | Flotation Stage | Leach Stage | Overall Extractions |
Grav. Con.,
Stage % Au | Grav, Tail,
Stage% Au | Flot. Con.,
Stage % Au | Flot, Tail,
Stage % Au | Leach Ext.,
Stage % Au | Leach Tail,
Stage % Au | Extracted in
Gravity,
% Au | Extracted in
Flot., % Au | Extracted in
Leach,
% Au | Overall
Extraction,
% Au |
| 85411 A | Fresh Rock 2019 | p80 = 65 | 16.0 | 84.0 | 82.0 | 18.0 | 89 | 11 | 16.0 | 68.9 | 13.5 | 98.3 |
| 85411 A | Fresh Rock 2019 | p80 = 100 | 14.8 | 85.2 | 81.0 | 19.0 | 90 | 10 | 14.8 | 69.0 | 14.6 | 98.4 |
| | | | | | | | | | | | | |
| 85411 A | Fresh Rock 2019 | p80 = 200 | 17.6 | 82.4 | 84.0 | 16.0 | 90 | 10 | 17.6 | 69.2 | 11.9 | 98.7 |
| | | | | | | | | | | | | |
KCA
Sample No. | Description | Target
Milled Size,
mesh Tyler | Knelson Stage | Flotation Stage | Leach Stage | Overall Extractions |
Grav. Con.,
Stage % Ag | Grav. Tail,
Stage % Ag | Flot. Con.,
Stage % Ag | Flot. Tail,
Stage% Ag | Leach Ext.,
Stage% Ag | Leach Tail.
Stage % Ag | Extracted in
Gravity,
% Ag | Fxtracted in
Flot., % Au | Extracted in
Leach.
% Ag | Overall
Extraction,
% Ag |
| 85411 A | Fresh Rock 2019 | p80 = 65 | 5.4 | 94.6 | 67.0 | 33.0 | 92 | 8 | 5.4 | 63.4 | 28.7 | 97.5 |
| 85411 A | Fresh Rock 2019 | p80 = 100 | 7.0 | 93.0 | 67.0 | 33.0 | 91 | 9 | 7.0 | 62.3 | 27.9 | 97.2 |
| 85411 A | Fresh Rock 2019 | p80 = 200 | 8.7 | 91.3 | 67.0 | 33.0 | 90 | 10 | 8.7 | 61.2 | 27.1 | 97.0 |
| Technical Report on the | 15 January 2020 |
| Goldfield Bonanza Project | |
| 14.0 | MINERAL RESOURCE ESTIMATE |
No mineral resources have been calculated for the Goldfield Bonanza property.
| 15.0 | MINERAL RESERVE ESTIMATE |
No mineral reserves have been calculated for the Goldfield Bonanza property.
Nearly all of the remainder of the Goldfield District on the north, northwest, northeast and east sides of Lode-Star’s claim boundary is currently controlled by Waterton Global Resource Management under Gemfield Resources, LLC. Prior owner International Minerals Corp. had developed measured and indicated resources in three areas in the district; the Gemfields Deposit, the Main District, and the McMahon Ridge deposits. Resources totals for these three areas are shown in Table 16.1 below, which was copied from the website of Gemfields Resources, LLC in December, 2019 (https://gemfieldresources.com/about-the-goldfield-project/). The Gemfield Deposit is currently permitted and is being developed for an open pit – heap leach operation. The Main District deposit is partially on the south half of the Combination #1 claim and the north half of the Combination #2 claim where Waterton owns the surface to 380’ level, and Lode-Star Mining controls the ground below that. Waterton will likely need to control the Goldfield Bonanza property for pit layback in order to advance this deposit to production.
Table 16.1 Gemfields Resources, LLC Mineral Resources
| | Tonnage | Grade (Au) | Contained (Au) |
| | MTonnes | grams/tonne | koz |
| Gemfield |
| Measured & Indicated | 21.2 | 0.88 | 600 |
| Inferred | 1.2 | 0.33 | 13 |
| McMahon Ridge |
| Measured & Indicated | 4.6 | 1.36 | 199 |
| Inferred | 0.9 | 0.87 | 25 |
| Goldfield Main |
| Measured & Indicated | 21.6 | 1.12 | 775 |
| Inferred | 4.0 | 0.94 | 119 |
| Total Measured & Indicated* | 47.3 | 1.03 | 1,574 |
| Total Inferred* | 6.0 | 0.81 | 157 |
| 17.0 | OTHER RELEVANT DATA AND INFORMATION |
The author is unaware of additional information concerning the Goldfield Bonanza Project that is pertinent to this technical report.
| Technical Report on the | 15 January 2020 |
| Goldfield Bonanza Project | |
| 18.0 | INTERPRETATIONS AND CONCLUSIONS |
The Goldfield Bonanza Project is situated along the west and south sides of the Goldfield “Main District”, from which the majority of approximately 4.2 million ounces of gold (130.6 t) were historically produced at Goldfield. The individual deposits from which a large portion of those ounces were mined were small, erratically distributed, and very high grade. What is different about the Goldfield Bonanza property from the rest of the “Main District” is large areas of this property are covered by coarse clastic sediments of the post-mineral Seibert Formation; the post-mineral nature of this unit was not recognized until the 1940’s. Therefore, the discovery potential beneath the Seibert was not, and could not have been, heavily prospected during the gold rush years at Goldfield beginning in 1903. Accordingly, the Goldfield Bonanza project area is the most under-explored part of the Goldfield Main District for bonanza gold and silver mineralization. These very high grade deposits can be small in size but contain significant amounts of gold. As noted in Section 6.1.1, the Hayes-Monette lease on the Mohawk claim produced up to $60,000 worth of ore a day from an ore body that earlier underground development previously missed by a few feet. At a gold price of $20.67 per ounce, this equates to about 2,900 ounces (90.2 kg) per day if the value was all from gold. Two other examples include the early-mined block of about 4.5 tons of ore from the adjacent Florence mine that contained between 1306 to 1524 ounces (40.6 to 47.4 kg) of gold, and the 17 ft x 6 ft x 40 ft block (5.2 m x 1.8 m x 12.2 m) mined by Martin Duffy in 1939 near the Little Florence Shaft that contained about 4700 ounces (146 kg) of gold at an average grade of 15 oz Au/ton (514 g/t) (Duffy, 1973).
High-grade drill intercepts from recent drilling on the Goldfield Bonanza property demonstrate that bonanza grade mineralization for which the Goldfield District became famous remains to be found and mined from Goldfield Bonanza. High grade ore in the Goldfield “Main District” occurs in silicified “ledges” that consist of strongly silicified masses of rock contained within large volumes of argillized rock. Exploration work conducted on the Goldfield Bonanza property over the last 18 years by Lode Star Gold and others has identified at least 5 “ledges” beneath post-mineral Seibert tuff which have been shown by drilling to contain bonanza-grade gold mineralization. Many intercepts with multi-ounce gold grades have been drilled in the Church, Red Hills, and Newmont Lode areas, indicating potential for discovery of high-grade gold mineralization amenable to underground mining. Due to the small size, irregular shape, and unpredictable distribution of the high-grade ore zones at Goldfield, they can be missed even by underground development and close-spaced drilling. Accordingly, conventional logic regarding “drilling out” or modeling gold/silver mineralization with wide-spaced drilling does not apply to the high grade, underground minable mineralization at Goldfield. Future exploration must be accomplished with underground drifting and tightly spaced drill holes guided by detailed geological modeling of the known mineralization.
Lode-Star Mining’s immediate goal is to complete close-spaced drilling in the Church Zone and Red Hills areas to further define the known pods of high-grade gold mineralization in preparation for development and mining. These two areas will be further discussed in the following sections, andFigure 18.1 shows the relative locations of these zones of interest.
| Technical Report on the | 15 January 2020 |
| Goldfield Bonanza Project | |
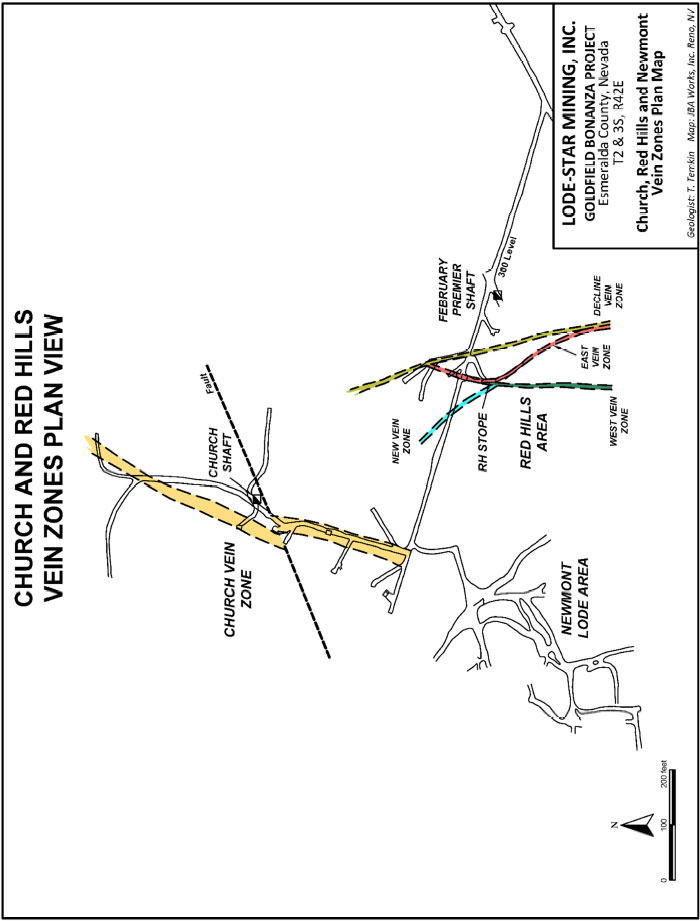
Figure 18.1 Plan View of Church and Red Hills Zones
| Technical Report on the | 15 January 2020 |
| Goldfield Bonanza Project | |
| 18.2 | Church Area: Geologic Modeling and Targeting |
Drilling conducted by Trafalgar in 1979 to 1982, Westley in 1985, Lode Star Gold from 1999 through 2010, and ICN Resources in 2011 has helped to define the “Church Vein Zone” (“Church Ledge” in Ransome, 1909) which is located immediately west of the historic Church Shaft (Lode-Star uses the term “vein zone” to denote linear gold mineralized structures within ledges that are comprised of thin ribbon-style quartz veins separated by host). Defined by a series of 70 holes drilled from both surface and underground, preliminary geological modelling by Lode Star Gold suggests this zone strikes approximately N20E, dips 80 degrees to the west, is at least 600 ft (183 m) long and is roughly 40 ft (12.2 m) wide (Figure 18.2). Within this structurally controlled “ledge,” drilling clearly indicates the presence of a higher-grade pod (or “pay shoot” per Ransome, 1909) at the 100 ft level. Extraordinary drill intercepts shown on X-Section N 4,173,555 (Figure 18.3) include 4.0 ft (1.22 m) assaying 74.93 oz/ton (2.57 kg/t) and 5.5 ft (1.68 m) assaying 15.96 oz/ton (547 g/t) in ICN-003, and 4.5 ft (1.37 m) assaying 51.46 oz/ton (1.76 kg/t) in ICN-0133. Also shown on this section is a poorly defined narrow sub-parallel zone a short distance to the west that contains significant intervals of 0.1 to 0.5 oz/ton material that may contain higher grades close by. Additional drilling and modeling will be necessary to help establish the geometry of this zone prior to development for mining. Lode-Star Mining believes that the lack of high grade mineralization in the tight pattern of drill holes collared underground on the 300 ft level (middle ofFigure 18.3) represents a gap in strong gold mineralization within ledges which is typical at Goldfield (Figure 7.2). The presence of a wide “ledge” in hole GMF03 with gold values up to 0.46 oz/ton (15.8 g/t) supports the idea that minable high grade may be found below the 300 ft level and above GMF03, and possibly below GMF03.
Accordingly, modelling based on drilling, underground mapping and sampling in the Church area has shown that the most important target areas for additional drilling is the nearly 200-foot vertical space between the 100 and 300 levels, as are extensions to the northeast and southwest along strike from this and down dip from the 300 level workings. Lode-Star Mining proposes to drill these targets in the recommended definition drilling campaign from surface drill sites after conducting additional three-dimensional modelling to precisely determine the locations of drill penetrations.
| 3 | Figures 18.2 and 18.3 provide highlights of drill hole data used for modeling and planning only, and do not represent all available data in the area. |
| Technical Report on the | 15 January 2020 |
| Goldfield Bonanza Project | |
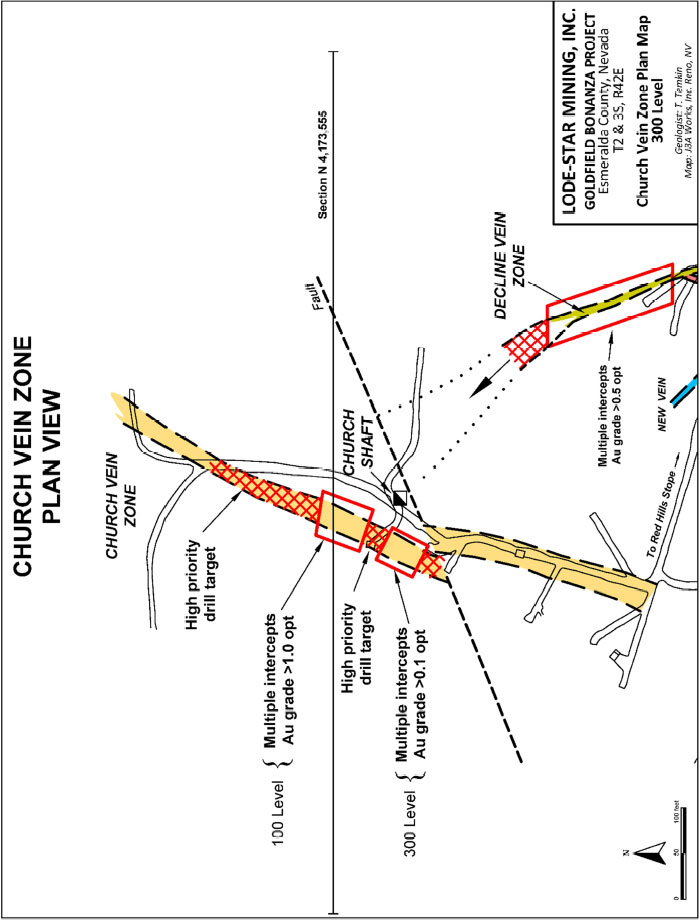
Figure 18.2 Church Mineralization and Drill Targets
| Technical Report on the | 15 January 2020 |
| Goldfield Bonanza Project | |

Figure 18.3 Drill Hole Cross Section of Church Vein Zone
| Technical Report on the | 15 January 2020 |
| Goldfield Bonanza Project | |
| 18.3 | Red Hills Area: Geologic Modeling and Targeting |
The Red Hills Vein Zone is located approximately 600 ft (183 m)southeast of the Church Vein Zone and consists of four veins zones, the West Vein, the East Vein (collectively the “Stope Veins”), the New Vein, and the Decline Vein (Figure 18.4). The Red Hills Zone is much more structurally complex than the Church Zone; while the geometry seems relatively simple on the 300-level map, it becomes more complex in three dimensions. All of these zones, particularly the Decline Vein appear to be open to the north and south.
As further defined by Lode Star Gold drilling, the area referred to as the Stope veins is comprised of two intersecting vein-filled faults - the West Vein Zone and the East Vein Zone. Average width of each of these vein zones is approximately three feet (1 m). Drilling to date suggests the West vein zone to be essentially vertical and near parallel to the East Vein Zone. The East Vein Zone bifurcates to the southeast from the Stope area (Figure 18.4) and has had drill intercepts up to 75.0 oz/ton (2569 g/t) gold. The Decline Vein Zone is north-northwest trending, with a generally westerly dip and an average width of several feet. High-grade intercepts exceeding 1.0 oz/ton (34.3 g/t) gold have been drilled on this structure. The New Vein is believed to be a northwest-striking splay of the East Vein Zone. Here too several high-grade gold intercepts in excess of 1.0 oz/ton have been encountered, with values up to 52.0 oz/ton (1.788 kg/t) gold. Drilling indicates each of these vein zones to be open along strike and at depth.
Vein zone polygons depicted on cross-section N 4,173,395 (Figure 18.5) are based on the interpretation of underground geologic mapping, underground sampling of the workings, and plotting of the 58 drill holes in the area in three dimensions, and not just from the data on that section alone. Due to the erratic distribution of high grade gold within the mineralized zones, not all drill hole intercepts will contain high grade gold, but the same zone a few feet (or meters) away may do so. To get a better understanding of the 3-dimensional geometry of the Red Hills mineralization in preparation for development and mining, Lode Star Gold created the model depicted inFigure 18.6 (drill holes have been omitted for the sake of clarity). It is apparent that the vein components within the zone have different orientations, and two of them are curved, rather than planar as the Church Vein Zone is. The “New Vein” has been identified since this model was created and is therefore not shown in the model.
In the Goldfield district as a whole, the localization of ore zones is strongly controlled by structural intersections (Ransome (1910). The complex intersection of three vein components of the Red Hills Zone provides several places where higher grade “pay shoots” may be present. An example is the previously mined RH Stope (Figures 18.4 and 18.6) at the intersection of the north end of the East vein and the Decline Vein. Another possible example is where the West Vein and the East Vein intersect near the 300 level; drilling has intersected multiple intercepts with grades in excess of 1.0 oz/ton (34.3 g/t) gold in this area.
Lode-Star has three high priority drill targets in the Red Hills area: 1. the extension to the south along the West Vein from the area of multiple high-grade gold intercepts at the West/East Vein intersection (Lode-Star believes all three veins may intersect in this area); 2. Along the southern portion of the Decline Vein Zone where it will intersect the East Vein a short distance below the 300 level, and: 3. The Decline Vein north along its extension toward the Church Zone.
| Technical Report on the | 15 January 2020 |
| Goldfield Bonanza Project | |
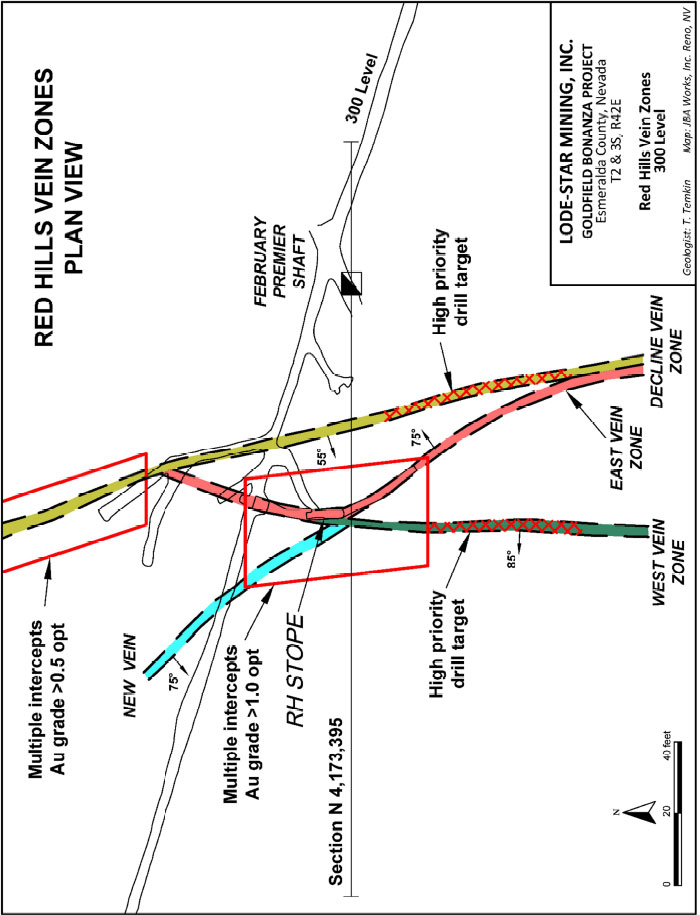
Figure 18.4 Red Hills Vein Zone Drill Targets
| Technical Report on the | 15 January 2020 |
| Goldfield Bonanza Project | |
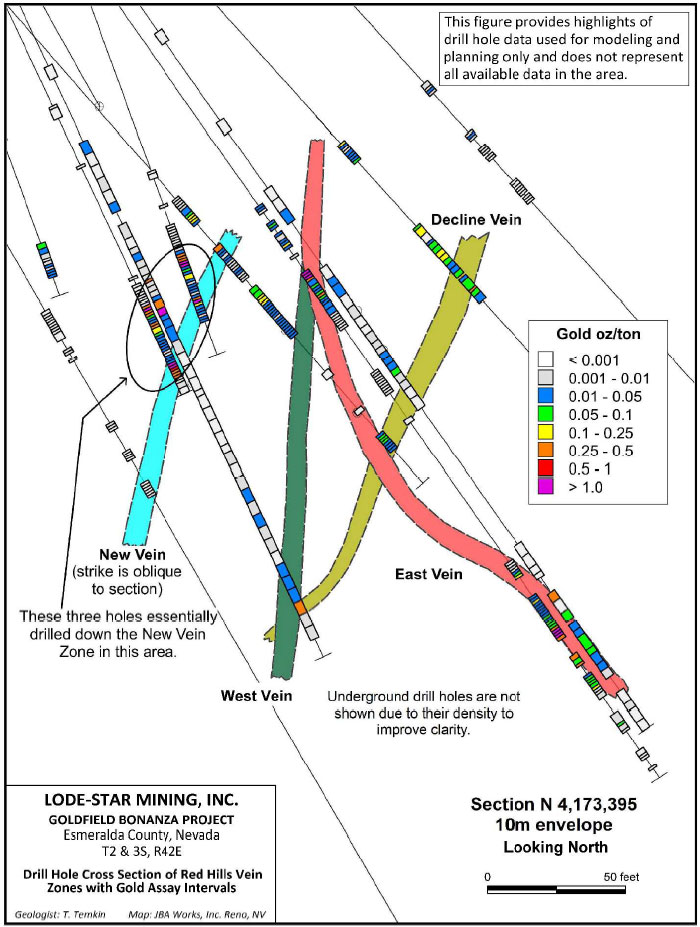
Figure 18.5 Red Hills Area X-Section
| Technical Report on the | 15 January 2020 |
| Goldfield Bonanza Project | |
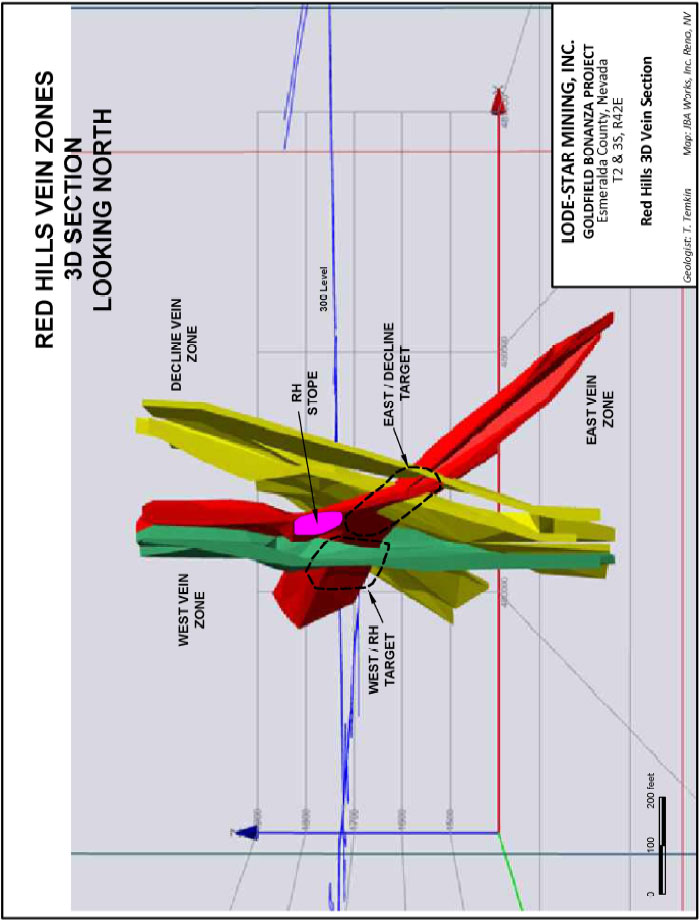
Figure 18.6 Red Hills Vein Zone 3D Section
| Technical Report on the | 15 January 2020 |
| Goldfield Bonanza Project | |
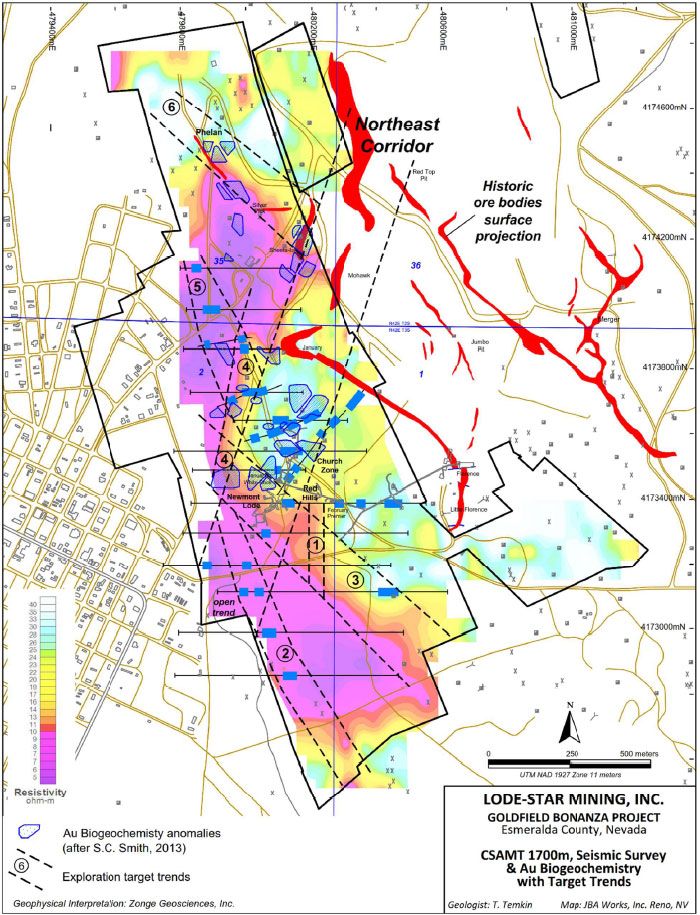
Figure 18.7 CSAMT, Seismic Survey, Biogeochemistry with Target Trends
| Technical Report on the | 15 January 2020 |
| Goldfield Bonanza Project | |
In addition to the Church-Red Hills area, Lode-Star Mining has identified several other exploration target trends based on drilling, geophysics and biogeochemical sampling (Figure 18.7). These are worthy of additional future drilling but are not intended to be drilled during the recommended drilling program.
Lode-Star Mining’s immediate goal at the Goldfield Bonanza project is to further define the known high grade pods in the Church Shaft and Red Hills areas in preparation for development and mining. To achieve that goal, Lode-Star Mining plans to drill an additional 12,400 ft (3780 m) of infill and step-out drilling in these areas. Results from the proposed holes will be used to advance the geologic modeling in these areas in preparation for mining.
All drilling planned for this phase of exploration will be surface drilling. An RTK GPS base station set-up point is recommended to be established at surface within or very near the proposed drill area to allow accurate locations of drill holes and their collar elevations.
Additional expenses are anticipated for establishing and implementing a strict QA/QC protocol for the drilling program as well as incidental expenses related to the drilling program, such as data processing. It is recommended that Lode-Star Mining use the opportunity of this drill program to establish elements of an accurate and reliable grade control program. Any future production at Goldfield will be very much dependent on a good grade control protocol.
The budget for this drilling program, itemized in Table19.1 below, is $950,000.
This author believes that the program proposed by Lode-Star Mining is appropriate for the stated objectives and is recommended.
Table 19.1 Goldfield Bonanza Project Proposed Budget
| 1. | Establishment of an RTK GPS base station | 2,500 |
| 2. | Complete the design of a drill program QA/QC system | 2,500 |
| 3. | Three-dimensional modeling for drill hole planning | 12,000 |
| 4. | Drill site selection and preparation | 5,000 |
| 5. | Permitting and base-line environmental studies | 10,000 |
| 6. | Red Hills drilling (6000 ft) | 425,000 |
| 7. | Church Shaft area drilling (6400 ft) | 450,000 |
| 8. | Post-drilling data processing | 2,000 |
| 9. | Establish grade control protocol | 15,000 |
| 10. | Contingency | 26,000 |
| | Total (USD) | $950,000 |
| | | |
| Technical Report on the | 15 January 2020 |
| Goldfield Bonanza Project | |
Albers, J.P., and Stewart, J.H., 1972, Geology and Mineral Deposits of Esmeralda County, Nevada; Nevada Bureau of Mines Bulletin 78.
Anon, 1988, Second Goldfield Bonanza Prospect, Esmeralda County, Nevada – Project Overview, unpublished report for Geochem Mines, Inc.
Arnhart, T.R., 2009, Goldfield Bonanza Property Title Report; by Cow Country Title Company, for Lode Star Gold.
Arthur, B., 2010, Lode Star Ores Metallurgical Testing; Newmont Mining Corporation memo.
Caton, C., 2011, CSAMT Survey on the Goldfield Bonanza Project, Esmeralda County, Nevada for ICN Resources, Data Acquisition Report; report by Zonge Geosciences, Inc.
Defilippi, J.W., 2006, GF Project, Report on Cyanide Leach, Gravity and Flotation Tests; report by Kappes, Cassiday & Associates for Lode Star Gold.
Duffy, M.C., 1973, Goldfield’s Glorious Past; published by Ruth Duffy, 83 p.
Durgan, D.C., 2014, Updated Technical Report, Geology and Mineralization, Goldfield Bonanza Project, Esmeralda County, Nevada, USA; report for Lode-Star (sic) Gold, Inc.
Hardy, S., Prenn, N. and Ristorcelli, S., 2002, Technical Report on the Goldfield Project, Esmeralda County, Nevada USA; Mine Development Associates report for Metallic Ventures Inc.
John, D.A., Vikre, P.G., du Bray, E.A., Blakely, R.J., Fey, D.L., Rockwell, B.W., Mauk, J.L., Anderson, E.D., and Graybeal, F.T., 2018, Descriptive models for epithermal gold-silver deposits: U.S. Geological Survey Scientific Investigations Report 2010–5070–Q, 247 p., https://doi.org/10.3133/sir20105070Q
Kappes, Cassiday and Associates, 2017, Lode-Star Project, Last Chance and Lode-Star Ore Composites, Gravity and Column Leach Testing, Report of Metallurgical Test Work. Report for Lode-Star Gold by Kappes, Cassiday and Associates.
Kappes, Cassiday & Associates, 2019, Lode-Star Gold, Inc. Fresh Rock 2019 Report of Metallurgical Test Work September 2019; Proprietary Report for Lode-Star Gold by Kappes, Cassiday & Associates.
McWilliams, M., 1987, Seismic Refraction and Total Field Magnetic Data from Goldfield, Nevada; unpublished report for Geochem Mines, Inc.
Mijal, Brandon, and Gustin, Michael M., June 2018, Data Verification Undertaken on Goldfield Bonanza Project, Esmeralda County, Nevada USA; Mine Development Associates Report for Lode-Star Mining Inc.
Ransome, F.L. 1909, The Geology and Ore Deposits of Goldfield, Nevada; US Geological Survey Professional Paper 66, 258 p.
Searls, F. Jr. (1948) A contribution to the published information on the geology and ore deposits of Goldfield, Nevada: Univ. Nevada Bull. no. 5, v. 42, Geol. and Min. series no. 48, p. 24.
| Technical Report on the | 15 January 2020 |
| Goldfield Bonanza Project | |
Seibel, G.E., Long, S.D., Kennedy, B.D., Carew, T.J., and Barnes, T., 2007, Amended Preliminary Assessment Gemfield and Mc Mahon Ridge Deposits, Goldfield District, Nevada; report by AMEC for Metallic Ventures Gold, Inc.
Simms, S.C., 1981, Cooksley Geophysics unpublished letter to Galli Mineral Associates (related to Trafalgar Mines) January 28, 1981.
Shoemaker, S., Gowans, R., Jacobs, C., and Srivastava, M.R., 2013, Update to Feasibility Study on the Goldfield Property, Nevada, USA, 43-101 Technical Report for International Minerals Corporation, 177 p.
Smith, S.C., 2012, Goldfield Phytogeochemical Report; unpublished report for ICN Resources.
Temkin, Tom, 2009, The Goldfield Bonanza Project, Esmeralda County, Nevada – Project Overview; unpublished report for Lode Star Gold, INC.
| Technical Report on the | 15 January 2020 |
| Goldfield Bonanza Project | |
| 21.0 | CERTIFICATE OF QUALIFIED PERSON |
To accompany the report entitled “Technical Report on the Goldfield Bonanza Project, Esmeralda County, Nevada, U.S.A.”, dated January 15, 2020 for Lode-Star Mining, Inc.
I, Robert M. Hatch, do hereby certify that:
| 1. | I am currently an independent consulting geologist, residing at 80 Bitterbrush Road, Reno, Nevada 89523. |
| 2. | I am a graduate of the California State University at Fullerton with a B.A. degree in Earth Sciences (1976). |
| 3. | I am a Licensed Geologist (LG) in the State of Washington, USA (LG #2050), and an SME Registered Geologist with the Society for Mining, Metallurgy, and Exploration (SME). |
| 4. | I have practiced my profession as a mining and exploration geologist continuously since 1977, with an emphasis on volcanic-related epithermal gold/silver deposits. |
| 5. | I have read the definition of “qualified person” in National Instrument 43-101 (NI 43-101) and Form 43-101F1 and certify that by reason of my education and past relevant work experience, I fulfill the requirements to be a “qualified person” for the purposes of NI 43-101 and Form 43-101F1. |
| 6. | I am independent of Lode-Star Mining, Inc. as defined in Section 1.5 of NI 43-101 and in Section 3.5 of the Companion Policy to NI 43-101. |
| 7. | This Report is based on my personal review of information provided by the issuer and on discussions with the issuer’s representatives. |
| 8. | I am the person responsible for the content of the Technical Report. |
| 9. | As of the date of the certificate, to best of my knowledge, information and belief, the technical report contains all scientific and technical information that is required to be disclosed to make the technical report not misleading. |
Dated this 15th day of January 2020,
 | |
| Signature of Qualified Person | |
| Robert M. Hatch | |