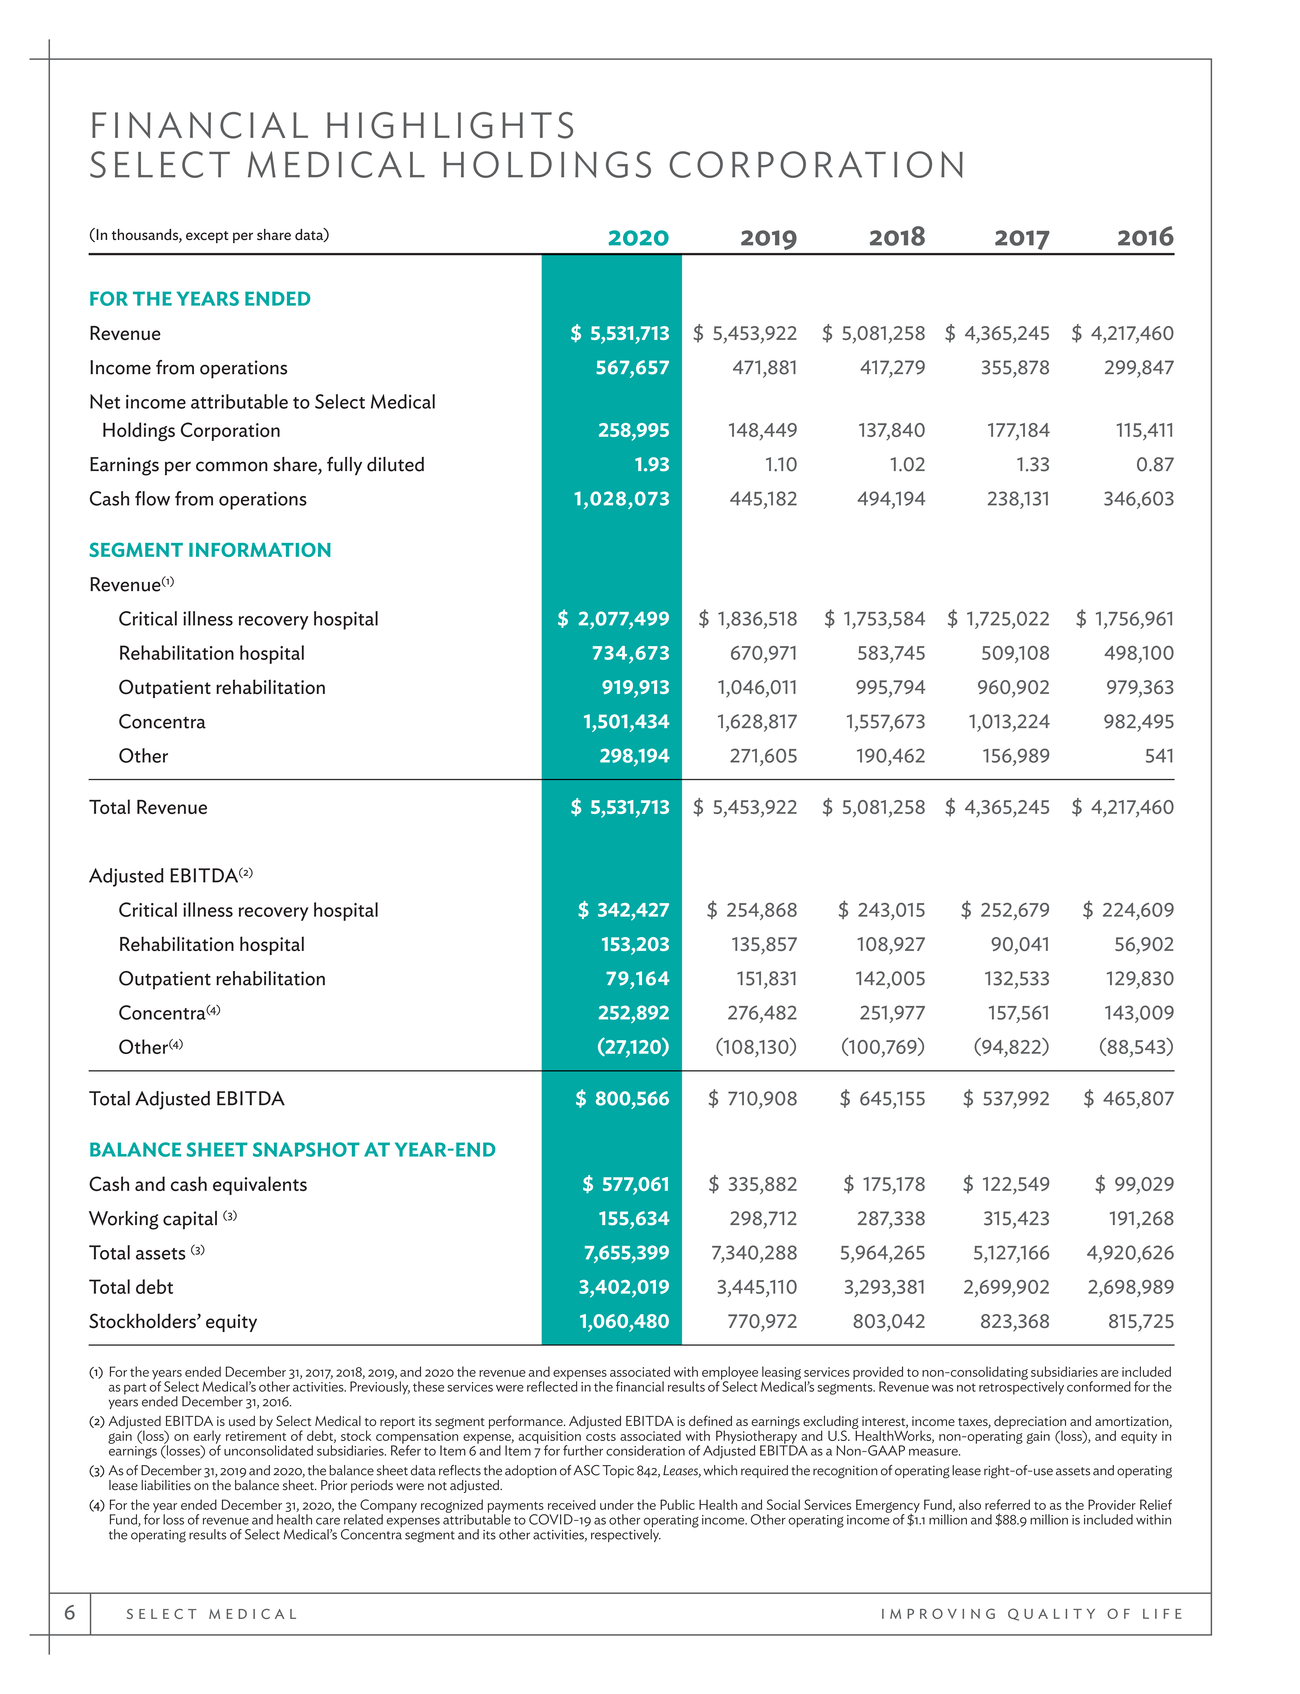
 | FOR THE YEARS ENDED Revenue Income from operations Net income attributable to Select Medical Holdings Corporation Earnings per common share, fully diluted Cash flow from operations SEGMENT INFORMATION Revenue(1) Critical illness recovery hospital Rehabilitation hospital Outpatient rehabilitation Concentra Other $ 5,531,713 567,657 258,995 1.93 1,028,073 $ 2,077,499 734,673 919,913 1,501,434 298,194 $ 5,453,922 471,881 148,449 1.10 445,182 $ 1,836,518 670,971 1,046,011 1,628,817 271,605 $ 5,081,258 417,279 137,840 1.02 494,194 $ 1,753,584 583,745 995,794 1,557,673 190,462 $ 4,365,245 355,878 177,184 1.33 238,131 $ 1,725,022 509,108 960,902 1,013,224 156,989 $ 4,217,460 299,847 115,411 0.87 346,603 $ 1,756,961 498,100 979,363 982,495 541 Total Revenue $ 5,531,713 $ 5,453,922 $ 5,081,258 $ 4,365,245 $ 4,217,460 Adjusted EBITDA(2) Critical illness recovery hospital $ 342,427 $ 254,868 $ 243,015 $ 252,679 $ 224,609 Rehabilitation hospital 153,203 135,857 108,927 90,041 56,902 Outpatient rehabilitation 79,164 151,831 142,005 132,533 129,830 Concentra(4) 252,892 276,482 251,977 157,561 143,009 Other(4) (27,120) (108,130) (100,769) (94,822) (88,543) Total Adjusted EBITDA $ 800,566 $ 710,908 $ 645,155 $ 537,992 $ 465,807 BALANCE SHEET SNAPSHOT AT YEAR-END Cash and cash equivalents $ 577,061 $ 335,882 $ 175,178 $ 122,549 $ 99,029 Working capital (3) 155,634 298,712 287,338 315,423 191,268 Total assets (3) 7,655,399 7,340,288 5,964,265 5,127,166 4,920,626 Total debt 3,402,019 3,445,110 3,293,381 2,699,902 2,698,989 Stockholders’ equity 1,060,480 770,972 803,042 823,368 815,725 |