Exhibit 99.1
J.P. Morgan
Global High Yield & Leveraged Finance Conference
February 2012
Allen Campbell
Chief Financial Officer CooperStandard
Helen Yantz
VP & Corporate Controller
Safe harbor In addition to historical information, certain statements contained herein are forward-looking statements within the meaning of federal securities laws, and Cooper-Standard Holdings, Inc. (Cooper Standard) intends that such forward-looking statements be subject to the safe-harbor created thereby. These forward-looking statements include statements concerning the company’s plans, objectives goals strategies events performance expenditures needs intentions relating to acquisitions trends impact objectives, goals, strategies, future events, future revenue or performance, capital expenditures, financing needs, plans or acquisitions, business trends, the of “freshstart” accounting, the impact of the company’s bankruptcy on its future performance and other information that is not historical information. When used herein, the words “estimates,” “expects,” “anticipates,” “projects,” “plans,” “intends,” “believes,” “forecasts,” or future or conditional verbs, such as “will,” “should,” “could,” or “may,” and variations of such words or similar expressions are intended to identify forward-looking statements. All forward-looking statements, including, without limitation, management’s examination of historical operating trends and data, are based upon Cooper Standard’s current expectations and various assumptions. Cooper Standard’s expectations, beliefs and projections are expressed in good faith and Cooper Standard believes there is a reasonable basis for them. However, no assurances can be made that these expectations, beliefs and projections will be achieved. Forward-looking statements are not guarantees of future performance and are subject to significant risks and uncertainties that may cause actual results or achievements to be materially different from the future results or achievements expressed or implied by the forward-looking statements. This presentation includes forward-looking statements, reflecting current analysis and expectations, based on what are believed to be reasonable assumptions. Forward-looking statements may involve known and unknown risks, uncertainties and other factors, which may cause actual results to differ materially from those projected, stated or implied, depending on many factors, including, without limitation: the inability to compare the company’s financial condition or results historically due to fresh start accounting; the ability to maintain contracts and suppliers and customer relationships; limitations on flexibility in operating our business contained in our debt agreements; our dependence on the automotive industry; availability and cost of raw materials; our exposure to natural disasters; our dependence on certain major customers; competition in the automotive industry; sovereign and other risks related to our conducting operations outside the United States; the uncertainty of our ability to achieve expected cost reduction savings; our exposure to product liability and warranty claims; labor conditions; our vulnerability to changes in interest rates; our ability to meet customers’ needs for new and improved products in a timely manner; our ability to attract and retain key personnel; potential conflicts of interest between our owners and us; our legal rights to our intellectual property portfolio; our pension plans; and environmental and other regulations. There may be other factors that may cause the company’s actual results to differ materially from those projected in any forward-looking statement. Accordingly, there can be no assurance that Cooper Standard will meet future results, performance or achievements expressed or implied by such forward-looking statements. This paragraph is included to provide a safe harbor for forward-looking statements, which are not generally required to be publicly revised as circumstances change and which Cooper Standard does not intend to update. This presentation includes certain statements, estimates and forecasts of Cooper Standard with respect to the anticipated future performance of Cooper Standard that involve significant elements of subjective judgment and analysis that may or may not prove to be accurate or correct. There can be no assurance that these statements, estimates and forecasts will be attained and actual outcomes and results may differ materially from what is estimated or forecast herein. Cooper Standard undertakes no obligation to update any statement, estimate or forecast, whether as a result of new information, future events or otherwise. This presentation has been prepared to assist interested parties in making their own evaluation of Cooper Standard and does not purport to be all-inclusive or to contain all the information that a interested parties may desire. In all cases, interested parties should conduct their own independent investigations and analyses of Cooper Standard. Interested parties can only rely on the results of their own investigations and the representations and warranties made in any definitive agreement that may be executed. cooperstandard 2
Cooper Standard
Company Overview
Allen Campbell
Chief Financial Officer
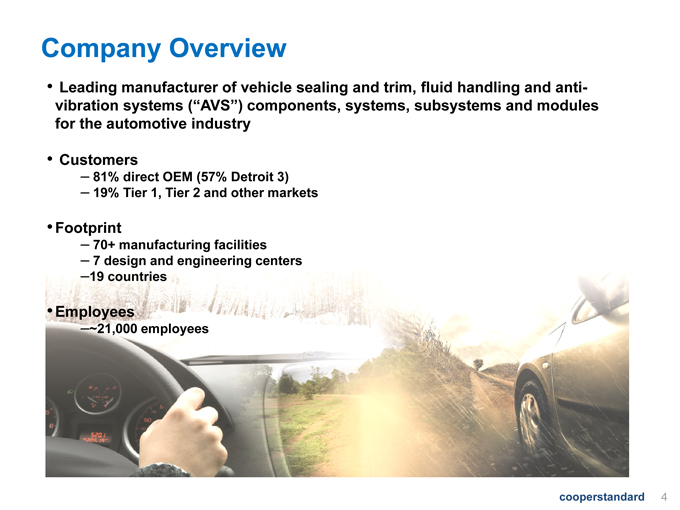
Company Overview Leading manufacturer of vehicle sealing and trim, fluid handling and antivibration systems (“AVS”) components, systems, subsystems and modules for the automotive industry Customers – 81% direct OEM (57% Detroit 3) – 19% Tier 1, Tier 2 and other markets Footprint – 70+ manufacturing facilities – 7 design and engineering centers –19 countries Employees –~21,000 employees cooperstandard 4
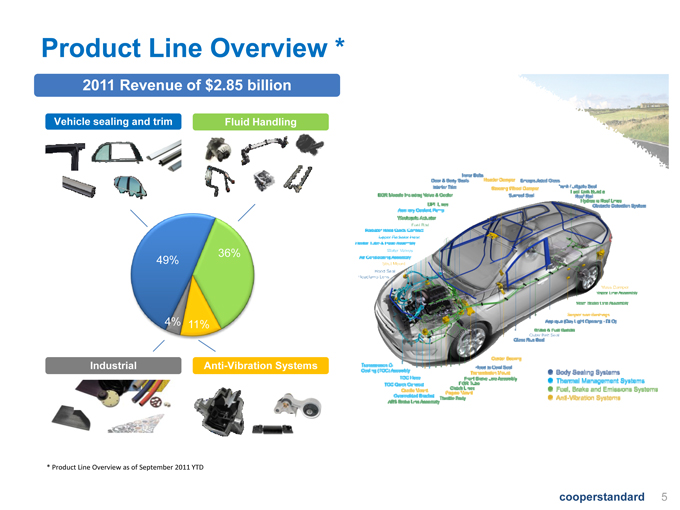
Product Line Overview * 2011 Revenue of $2.85 billion Vehicle sealing and trim Fluid Handling 49% 36% 4% 11% Industrial Anti-Vibration Systems cooperstandard 5 * Product Line Overview as of September 2011 YTD
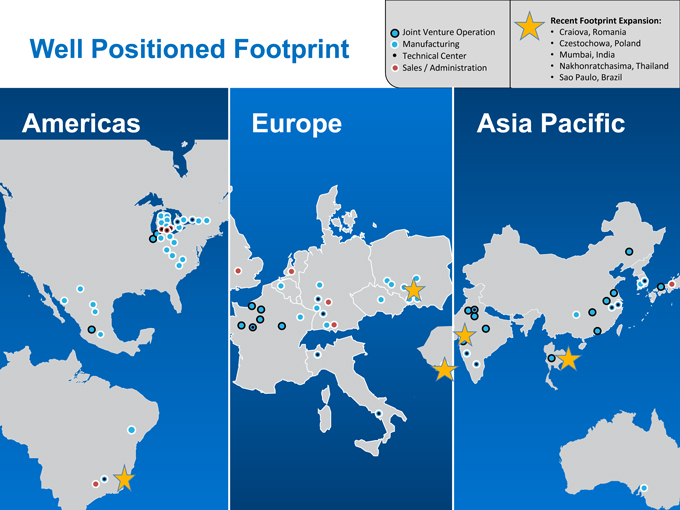
Well Positioned Footprint Recent Footprint Expansion: Craiova, Romania Czestochowa, Poland Mumbai, India Nakhonratchasima, Thailand Joint Venture Operation Manufacturing Technical Center Sales / Administration Americas Europe Asia Pacific Sao Paulo, Brazil cooperstandard 6
1111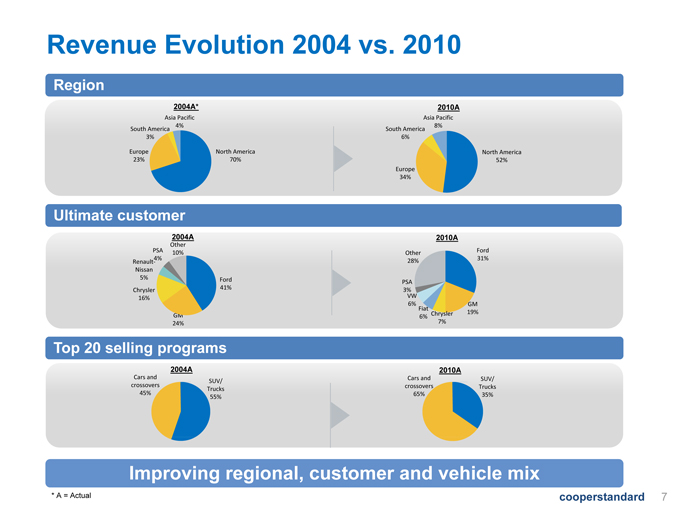
Revenue Evolution 2004 vs. 2010 2004A* Region South America 6% 2010A Asia Pacific South America 8% 3% Asia Pacific 4% Ultimate customer North America 52% Europe 34% North America 70% Europe 23% 2004A Other 10% Ford Chrysler 41% Renault- Nissan 5% PSA 4% Other 28% Ford 31% 2010A PSA 3% GM 24% 16% GM Fiat 19% 6% VW 6% Chrysler 7% Top 20 selling programs 2004A 2010A Cars and crossovers 45% SUV/ Trucks 55% Cars and crossovers 65% SUV/ Trucks 35% cooperstandard 7 Improving regional, customer and vehicle mix * A = Actual
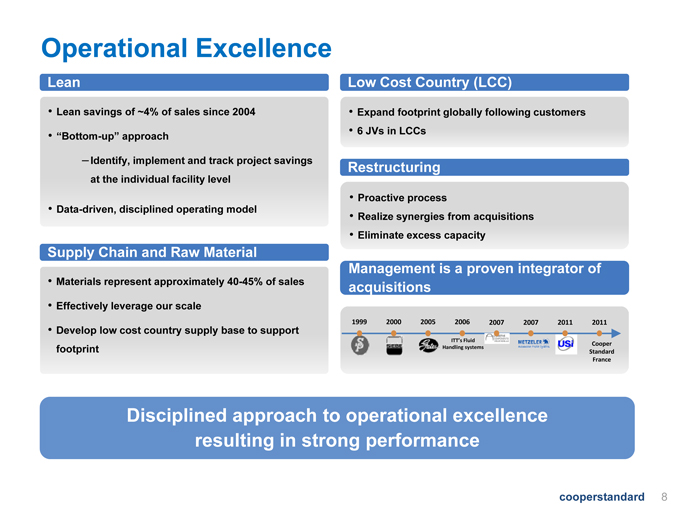
Operational Excellence Lean Low Cost Country (LCC) Expand footprint globally following customers 6 JVs in LCCs Lean savings of ~4% of sales since 2004 “Bottom-up” approach Restructuring Proactive process from –Identify, implement and track project savings at the individual facility level Data-driven, disciplined operating model Realize synergies acquisitions Eliminate excess capacity Management is a proven integrator of Supply Chain and Raw Material Materials represent approximately 40-45% of sales acquisitions ITT’s Fluid Handling systems 1999 2000 2005 2006 2007 2007 2011 2011 Cooper Standard France Effectively leverage our scale Develop low cost country supply base to support footprint Disciplined approach to operational excellence cooperstandard resulting in strong performance 8
Cooper Standard Avenues for Growth Leading technology & engineering 1 g gy g g capabilities 2 Developed market recovery 3 Long-term growth in emerging markets 4 Trends towards global platforms 5 Opportunities in adjacent markets g cooperstandard 9
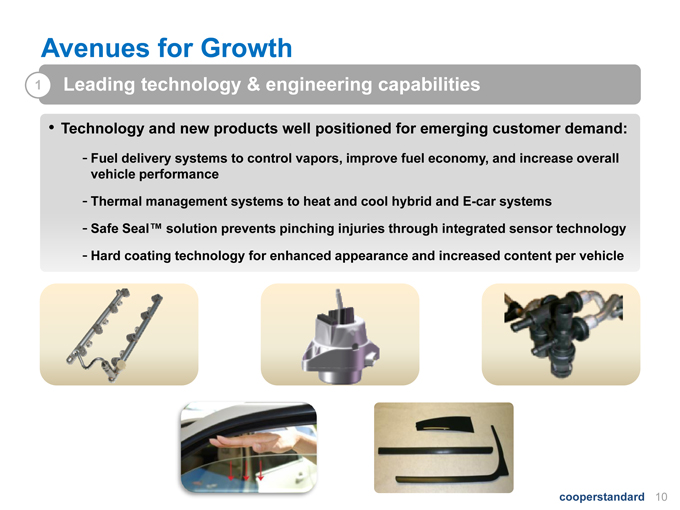
Avenues for Growth 1 Leading technology & engineering capabilities Technology and new products well positioned for emerging customer demand: - Fuel delivery systems to control vapors, improve fuel economy, and increase overall vehicle performance - Thermal management systems to heat and cool hybrid and E-car systems - Safe Seal™ solution prevents pinching injuries through integrated sensor technology - Hard coating technology for enhanced appearance and increased content per vehicle cooperstandard 10
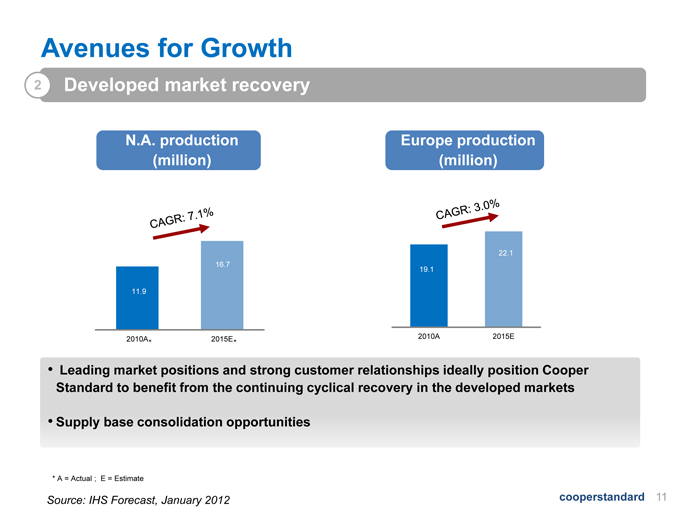
Avenues for Growth 2 Developed market recovery N.A. production Europe production (million) p p (million) 11 9 16.7 19.1 22.1 11.9 2010A 2015E 2010A 2015E * * Leading market positions and strong customer relationships ideally position Cooper Standard to benefit from the continuing cyclical recovery in the developed markets Supply base consolidation opportunities Source: IHS Forecast, January 2012 cooperstandard 11 * A = Actual ; E = Estimate
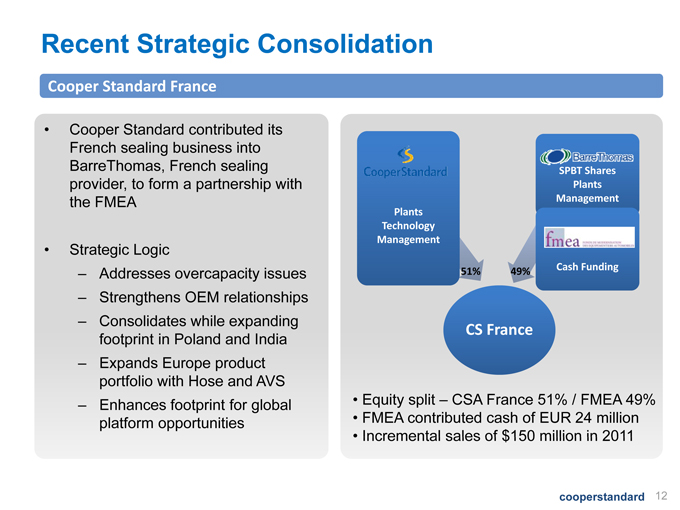
Recent Strategic Consolidation Cooper Standard contributed its sealing Cooper Standard France French business into BarreThomas, French sealing provider, to form a partnership with the FMEA Plants SPBT Shares Plants Management Strategic Logic – Addresses overcapacity issues S O Technology Management 51% 49% Cash Funding – Strengthens OEM relationships – Consolidates while expanding footprint in Poland and India – Expands Europe CS France product portfolio with Hose and AVS – Enhances footprint for global platform opportunities Equity split – CSA France 51% / FMEA 49% FMEA contributed cash of EUR 24 million cooperstandard 12 Incremental sales of $150 million in 2011
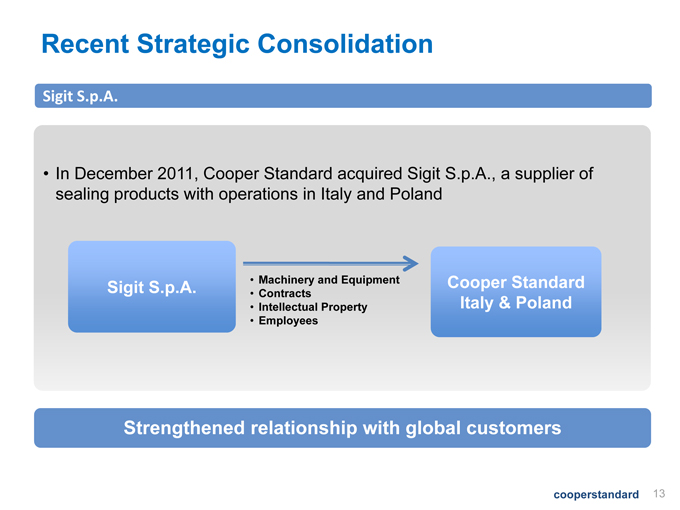
Recent Strategic Consolidation Sigit S.p.A. In December 2011, Cooper Standard acquired Sigit S.p.A., a supplier of sealing products with operations in Italy and Poland Sigit S.p.A. Machinery and Equipment Cooper Standard Contracts Italy & Poland Intellectual Property Employees Strengthened relationship with global customers cooperstandard 13 g p g
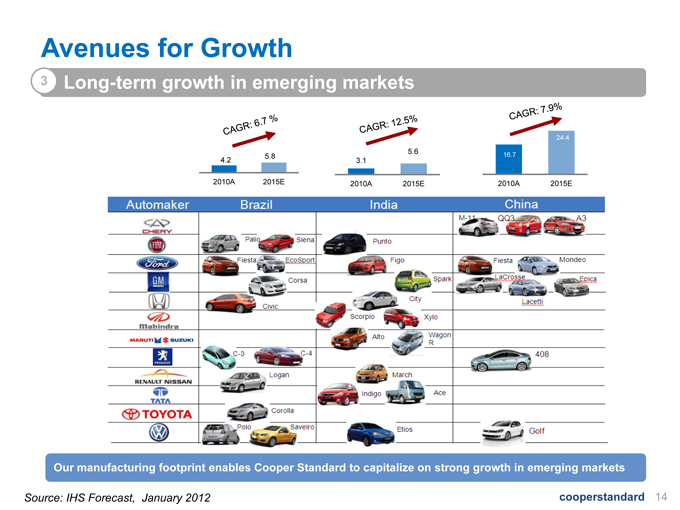
Avenues for Growth 3 Long-term growth in emerging markets 24.4 16.7 2010A 2015E TOYOTA Brazil India Automaker China 3.1 5.6 2010A 2015E 4.2 5.8 2010A 2015E Source: IHS Forecast, January 2012 cooperstandard 14 Our manufacturing footprint enables Cooper Standard to capitalize on strong growth in emerging markets
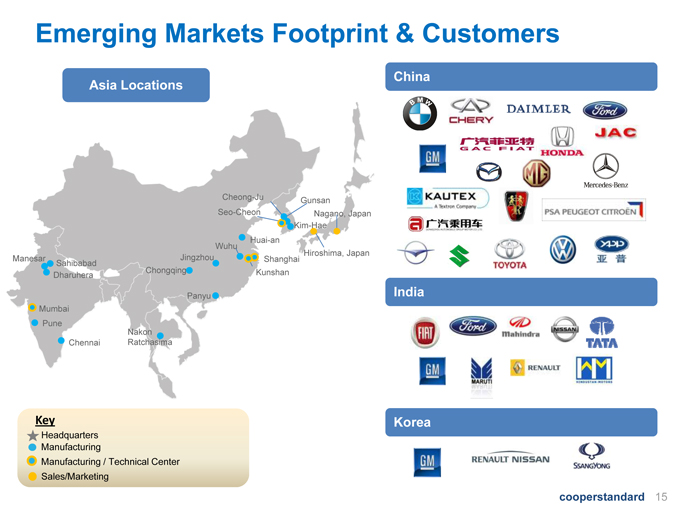
Emerging Markets Footprint & Customers Asia Locations China Seo-Cheon Gunsan Nagano, Japan Cheong-Ju Dharuhera Manesar Sahibabad Huai-an Kunshan Shanghai Wuhu Chongqing Jingzhou Hiroshima, Japan Kim-Hae India Chennai Pune Panyu Mumbai Nakon Ratchasima Headquarters Key Korea cooperstandard 15 Manufacturing Manufacturing / Technical Center Sales/Marketing
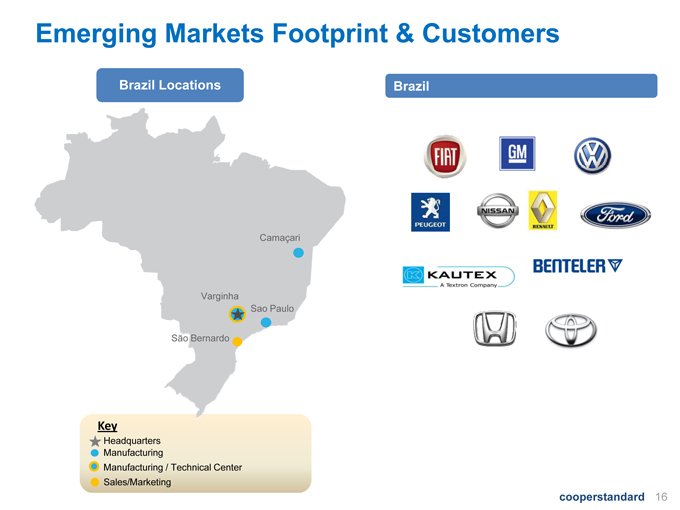
Emerging Markets Footprint & Customers Brazil Locations Brazil Camaçari Varginha São Bernardo Sao Paulo Key cooperstandard 16 Headquarters Manufacturing Manufacturing / Technical Center Sales/Marketing
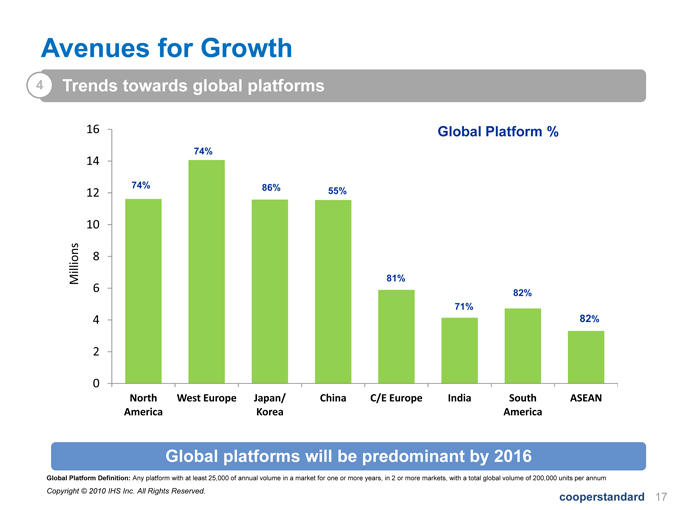
Avenues for Growth 4 Trends towards global platforms 16 Global Platform % 74% 74% 12 86% 55% 14 81% 6 8 10 Millions 82% 71% 2 4 82% 0 North America West Europe Japan/ Korea China C/E Europe India South America ASEAN cooperstandard 17 Global Platform Definition: Any platform with at least 25,000 of annual volume in a market for one or more years, in 2 or more markets, with a total global volume of 200,000 units per annum Global platforms will be predominant by 2016 Copyright © 2010 IHS Inc. All Rights Reserved.
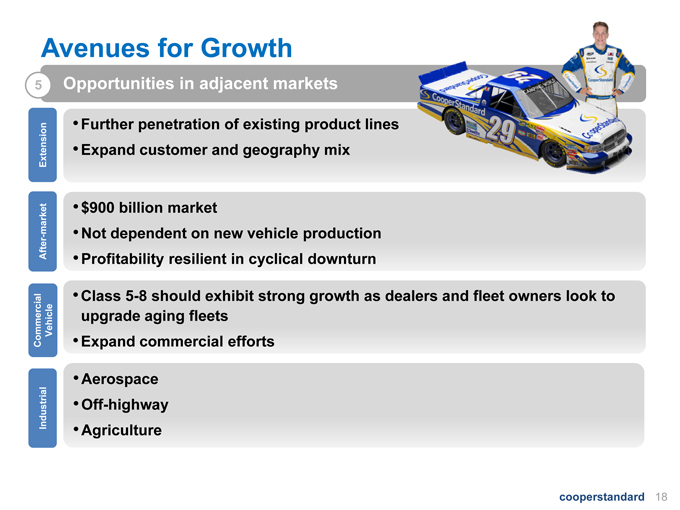
Avenues for Growth Opportunities in adjacent markets nsion Further penetration of existing product lines E d t d h i 5 rket Exten Expand customer and geography mix $900 billion market After-mar Cl 5 8 h ld hibit t th d l d fl t l k t Not dependent on new vehicle production Profitability resilient in cyclical downturn Class 5-should exhibit strong growth as dealers and fleet owners look to upgrade aging fleets Expand commercial efforts Commercial Vehicle Aerospace Off-highway Agriculture Industrial cooperstandard 18 g
Cooper Standard Financials
Helen Yantz
VP & Corporate Controller
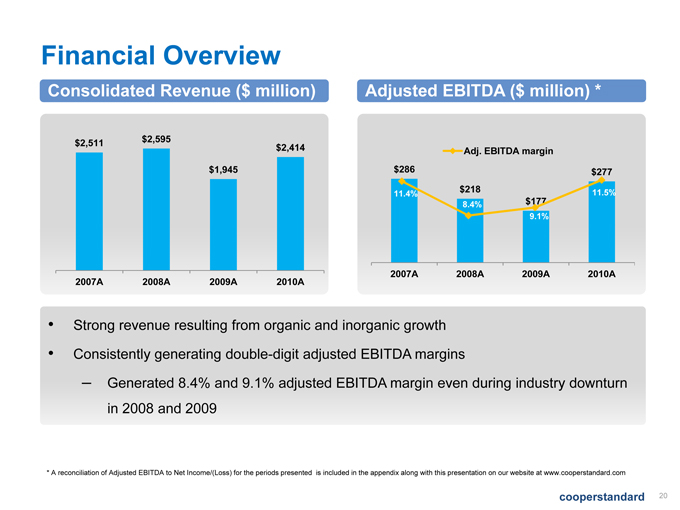
Financial Overview $2,511 $2,595 $2 414 Consolidated Revenue ($ million) Adjusted EBITDA ($ million) * $286 $218 $177 $277 11.4% 8.4% 9.1% 11.5% Adj. EBITDA margin $1,945 2,414 2007A 2008A 2009A 2010A 2007A 2008A 2009A 2010A Strong revenue resulting from organic and inorganic growth Consistently generating double-digit adjusted EBITDA margins – Generated 8.4% and 9.1% adjusted EBITDA margin even during industry downturn in 2008 and 2009 cooperstandard 20 * A reconciliation of Adjusted EBITDA to Net Income/(Loss) for the periods presented is included in the appendix along with this presentation on our website at www.cooperstandard.com
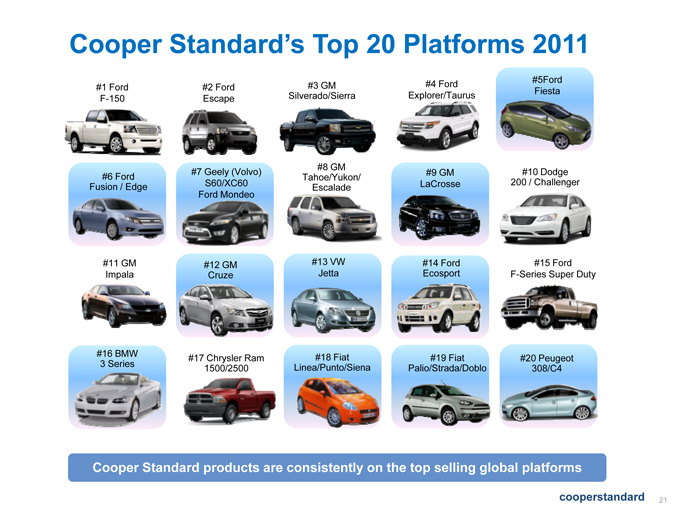
Cooper Standard’s Top 20 Platforms 2011 #2 Ford Escape #1 Ford F-150 #4 Ford Explorer/Taurus #3 GM Silverado/Sierra #5Ford Fiesta #9 GM LaCrosse #8 GM Tahoe/Yukon/ Escalade #6 Ford Fusion / Edge #7 Geely (Volvo) S60/XC60 Ford Mondeo #10 Dodge 200 / Challenger #12 GM Cruze #11 GM Impala #14 Ford Ecosport #15 Ford F-Series Super Duty #13 VW Jetta #20 #18 Fiat Peugeot Li /P t /Si #16 BMW #17 Chrysler Ram #19 Fiat 3 Series 1500/2500 Linea/Punto/Siena Palio/Strada/Doblo 308/C4 cooperstandard 21 Cooper Standard products are consistently on the top selling global platforms
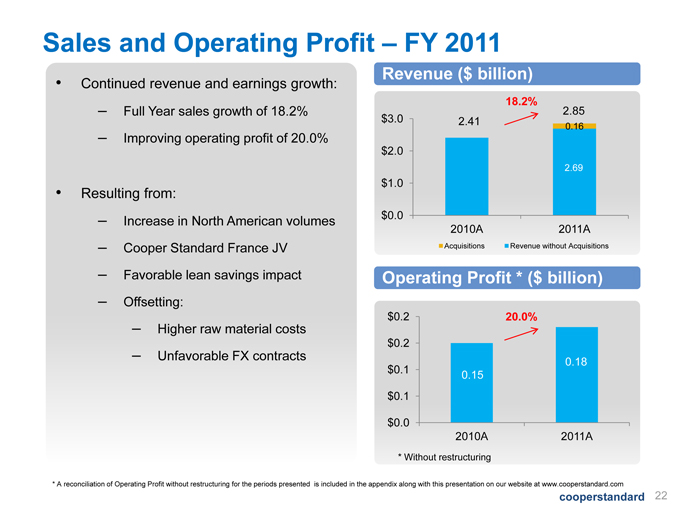
Sales and Operating Profit – FY 2011 Continued revenue and earnings growth: – Full Year sales growth of 18.2% – Improving operating profit of 20.0% Revenue ($ billion) 18.2% 2.41 0.16 2.85 $3.0 Resulting from: Increase in North American ol mes 2.69 $0.0 $1.0 $2.0 – volumes – Cooper Standard France JV – Favorable lean savings impact Operating Profit * ($ billion) 2010A 2011A Acquisitions Revenue without Acquisitions – Offsetting: – Higher raw material costs – Unfavorable FX contracts 52% 50% 50% 0 18 $0.2 $0.2 20.0% 48% 50% 52% 48% 50% 0.15 0.18 $0.0 $0.1 $0.1 2010A 2011A cooperstandard 22 * Without restructuring * A reconciliation of Operating Profit without restructuring for the periods presented is included in the appendix along with this presentation on our website at www.cooperstandard.com
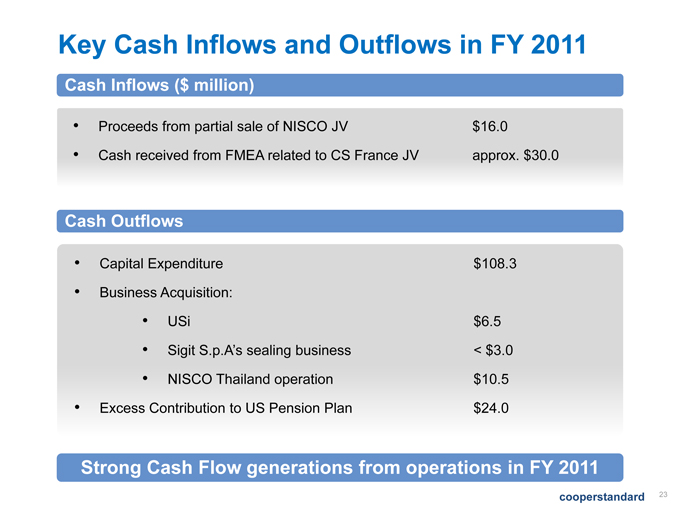
Key Cash Inflows and Outflows in FY 2011 Proceeds from partial sale of NISCO JV $16.0 Cash Inflows ($ million) Cash received from FMEA related to CS France JV approx. $30.0 Outflows Capital Expenditure $108.3 Business Cash Acquisition: USi $6.5 Sigit S.p.A’s sealing business < $3.0 NISCO Thailand operation $10.5 Excess Contribution to US Pension Plan $24.0 cooperstandard 23 Strong Cash Flow generations from operations in FY 2011
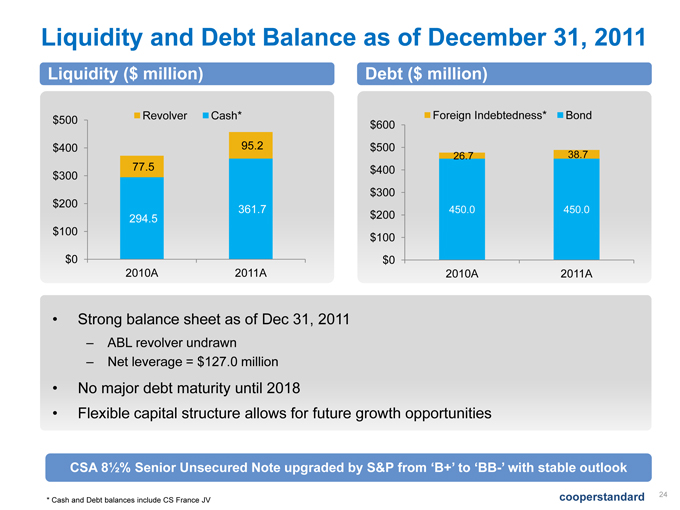
Liquidity and Debt Balance as of December 31, 2011 Liquidity ($ million) Debt ($ million) $500 $600 Foreign Indebtedness* Bond $400 95 2 $500 Revolver Cash* 450.0 450.0 26.7 38.7 $200 $300 $400 294 5 361.7 77.5 95.2 $200 $300 $0 $100 2010A 2011A 294.5 $0 $100 2010A 2011A Strong balance sheet as of Dec 31, 2011 – ABL revolver undrawn – Net leverage = $127.0 million No major debt maturity until 2018 Flexible capital structure allows for future growth opportunities cooperstandard 24 * Cash and Debt balances include CS France JV CSA 8½% Senior Unsecured Note upgraded by S&P from ‘B+’ to ‘BB-’ with stable outlook
CSA Value Proposition Leading market positions Well positioned footprint Operational excellence Multiple options for growth Strong balance sheet Proven business model of delivering high cash flow cooperstandard 25
Cooper Standard Appendix
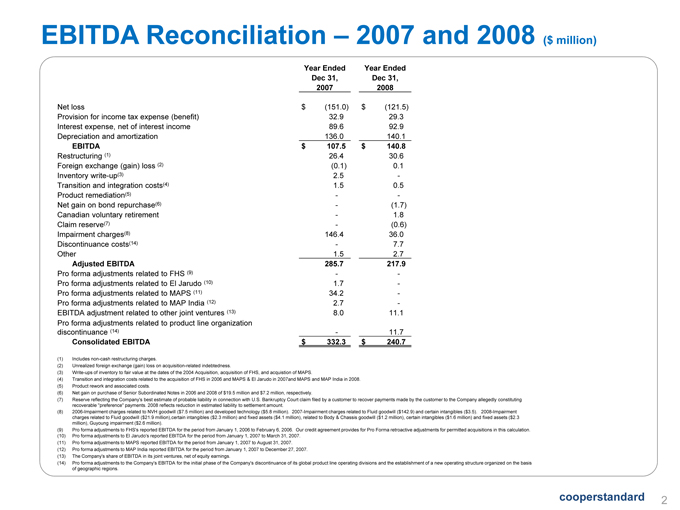
EBITDA Reconciliation – 2007 and 2008 ($ million) Year Ended Year Ended Dec 31, Dec 31, 2007 2008 Net loss $ (151.0) $ (121.5) Provision for income tax expense (benefit) 32.9 29.3 Interest expense, net of interest income 89.6 92.9 Depreciation and amortization 136.0 140.1 EBITDA $ 107 5 107.5 $ 140.8 Restructuring (1) 26.4 30.6 Foreign exchange (gain) loss (2) (0.1) 0.1 Inventory write-up(3) 2.5 - Transition and integration costs(4) 1.5 0.5 Product remediation(5) - - Net gain on bond repurchase(6) - (1.7) Canadian voluntary retirement - 1.8 Claim reserve(7) - (0.6) Impairment charges(8) 146.4 36.0 Discontinuance costs(14) - 7.7 Other 1.5 2.7 Adjusted EBITDA 285.7 217.9 Pro forma adjustments related to FHS (9) - - Pro forma adjustments related to El Jarudo (10) 1.7 - Pro forma adjustments related to MAPS (11) 34.2 - Pro forma adjustments related to MAP India (12) 2.7 - EBITDA adjustment related to other joint ventures (13) 8.0 11.1 Pro forma adjustments related to product line organization discontinuance (14) - 11.7 Consolidated EBITDA $ 332.3 $ 240.7 (1) Includes non-cash restructuring charges. (2) Unrealized foreign exchange (gain) loss on acquisition-related indebtedness. (3) Write-ups of inventory to fair value at the dates of the 2004 Acquisition, acquisition of FHS, and acquistion of MAPS. (4) Transition and integration costs related to the acquisition of FHS in 2006 and MAPS & El Jarudo in 2007and MAPS and MAP India in 2008. (5) Product rework and associated costs. (6) Net gain on purchase of Senior Subordinated Notes in 2006 and 2008 of $19.5 million and $7.2 million, respectively. (7) Reserve reflecting the Company’s best estimate of probable liability in connection with U.S. Bankruptcy Court claim filed by a customer to recover payments made by the customer to the Company allegedly constituting recoverable “preference” payments. 2008 reflects reduction in estimated liability to settlement amount. (8) 2006-Impairment charges related to NVH goodwill ($7.5 million) and developed technology ($5.8 million). 2007-Impairment charges related to Fluid goodwill ($142.9) and certain intangibles ($3.5). 2008-Impairment charges related to Fluid goodwill ($21.9 million),certain intangibles ($2.3 million) and fixed assets ($4.1 million), related to Body & Chassis goodwill ($1.2 million), certain intangibles ($1.6 million) and fixed assets ($2.3 million), Guyoung impairment ($2.6 million). (9) Pro forma adjustments to FHS’s reported EBITDA for the period from January 1, 2006 to February 6, 2006. Our credit agreement provides for Pro Forma retroactive adjustments for permitted acquisitions in this calculation. (10) Pro forma Jarudo’s EBITDA for period from January 1, 2007 cooperstandard 2 adjustments to El Jarudo s reported the to March 31, 2007. (11) Pro forma adjustments to MAPS reported EBITDA for the period from January 1, 2007 to August 31, 2007. (12) Pro forma adjustments to MAP India reported EBITDA for the period from January 1, 2007 to December 27, 2007. (13) The Company’s share of EBITDA in its joint ventures, net of equity earnings. (14) Pro forma adjustments to the Company’s EBITDA for the initial phase of the Company’s discontinuance of its global product line operating divisions and the establishment of a new operating structure organized on the basis of geographic regions.
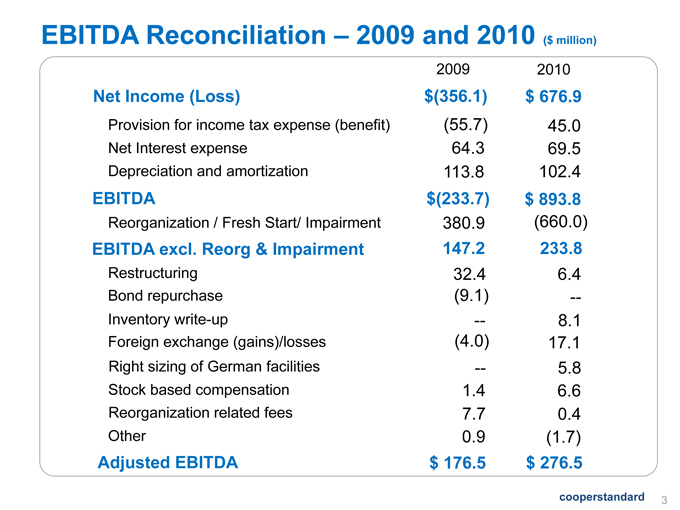
EBITDA Reconciliation – 2009 and 2010 ($ million) 2009 2010 Net Income (Loss) $(356.1) $ 676.9 Provision for income tax expense (benefit) (55.7) 45.0 Net expense 64 3 69 5 EBITDA $(233.7) $ 893.8 Interest 64.3 69.5 Depreciation and amortization 113.8 102.4 R i ti F hSt t/I i t 380 9 (660 0) Restructuring 32.4 6.4 B d h (9 1) Reorganization / Fresh Start/ Impairment 660.0) EBITDA excl. Reorg & Impairment 147.2 233.8 380.9 Bond repurchase 9.1) Foreign exchange (gains)/losses (4.0) -- 17.1 Inventory write-up -- 8.1 Right 5 8 Reorganization related fees 7.7 0.4 Other 0 9 (1 7) sizing of German facilities -- 5.8 Stock based compensation 1.4 6.6 cooperstandard 3 Adjusted EBITDA $ 176.5 $ 276.5 0.9 1.7)
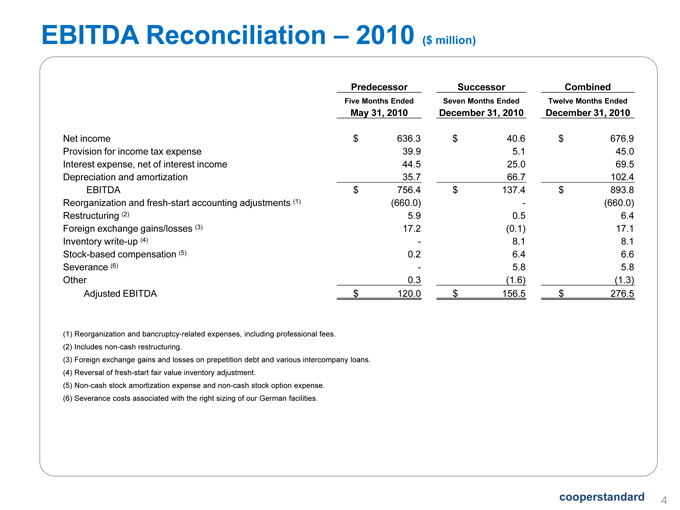
EBITDA Reconciliation – 2010 ($ million) Predecessor Successor Combined Five Months Ended Seven Months Ended Twelve Months Ended May 31, 2010 December 31, 2010 December 31, 2010 Net income $ 636.3 $ 40.6 $ 676.9 Provision for income tax expense 39.9 5.1 45.0 Interest expense, net of interest income 44.5 25.0 69.5 Depreciation and amortization 35.7 66.7 102.4 EBITDA $ 756.4 $ 137.4 $ 893.8 Reorganization and fresh-start accounting adjustments (1) (660.0) - (660.0) Restructuring (2) 5.9 0.5 6.4 Foreign exchange gains/losses (3) 17.2 (0.1) 17.1 Inventory write-up (4) - 8.1 8.1 Stock-based compensation (5) 0.2 6.4 6.6 Severance (6) - 5.8 5.8 Other 0.3 (1.6) (1.3) Adjusted EBITDA $ 120.0 $ 156.5 $ 276.5 (1) Reorganization and bancruptcy-related expenses, including professional fees. (2) Includes non-cash restructuring. (3) Foreign exchange gains and losses on prepetition debt and various intercompany loans. (4) Reversal of fresh-start fair value inventory adjustment. (5) Non-cash stock amortization expense and non-cash stock option expense. (6) Severance costs associated with the right sizing of our German facilities. cooperstandard 4
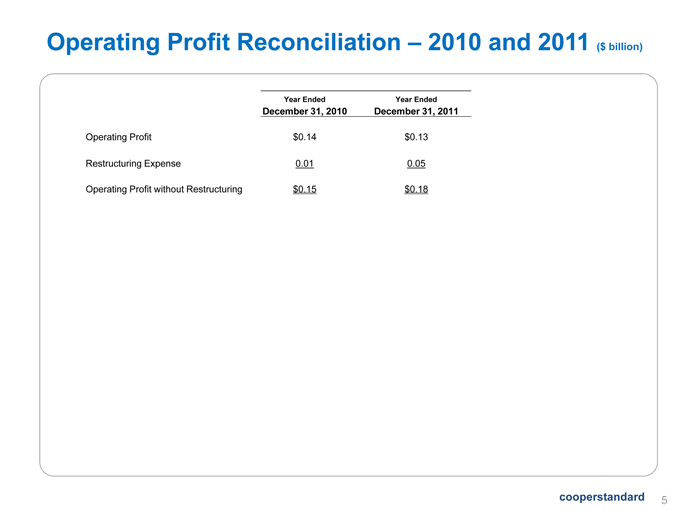
Operating Profit Reconciliation – 2010 and 2011 ($ billion) Year Ended Year Ended December 31, 2010 December 31, 2011 Operating Profit $0.14 $0.13 Restructuring Expense 0.01 0.05 Operating Profit without Restructuring $0.15 $0.18 cooperstandard 5