 Cooper Standard Second Quarter Earnings Call August 9, 2013 Exhibit 99.1 |
 2 Passion for Performance Safe Harbor This presentation includes “forward-looking statements” within the meaning of U.S. federal securities laws, and we intend that such forward-looking statements be subject to the safe harbor created thereby. We make forward-looking statements in this presentation and may make such statements in future filings with the SEC. We may also make forward-looking statements in our press releases or other public or stockholder communications. These forward-looking statements include statements concerning our plans, objectives, goals, strategies, future events, future revenue or performance, capital expenditures, financing needs, plans or intentions relating to acquisitions, business trends, and other information that is not historical information. When used in this presentation, the words “estimates,” “expects,” “anticipates,” “projects,” “plans,” “intends,” “believes,” “forecasts,” or future or conditional verbs, such as “will,” “should,” “could,” or “may,” and variations of such words or similar expressions are intended to identify forward-looking statements. All forward-looking statements, including, without limitation, management’s examination of historical operating trends and data are based upon our current expectations and various assumptions. Our expectations, beliefs, and projections are expressed in good faith and we believe there is a reasonable basis for them. However, no assurances can be made that these expectations, beliefs and projections will be achieved. Forward-looking statements are not guarantees of future performance and are subject to significant risks and uncertainties that may cause actual results or achievements to be materially different from the future results or achievements expressed or implied by the forward-looking statements. There are a number of risks and uncertainties that could cause our actual results to differ materially from the forward-looking statements contained in this presentation. Important factors that could cause our actual results to differ materially from the forward-looking statements we make herein include, but are not limited to: cyclicality of the automotive industry with the possibility of further material contractions in automotive sales and production effecting the viability of our customers and financial condition of our customers; global economic uncertainty, particularly in Europe; loss of large customers or significant platforms; supply shortages; escalating pricing pressures and decline of volume requirements from our customers; our ability to meet significant increases in demand; availability and increasing volatility in cost of raw materials or manufactured components; our ability to continue to compete successfully in the highly competitive automotive parts industry; risks associated with our non-U.S. operations; foreign currency exchange rate fluctuations; our ability to control the operations of joint ventures for our benefit; the effectiveness of our lean manufacturing and other cost savings plans; product liability and warranty and recall claims that may be brought against us; work stoppages or other labor conditions; natural disasters; our ability attract and retain key personnel; our ability to meet our customers’ needs for new and improved products in a timely manner or cost-effective basis; the possibility that our acquisition strategy may not be successful; our legal rights to our intellectual property portfolio; environmental and other regulations; legal proceedings or commercial and contractual disputes that we may be involved in; the possible volatility of our annual effective tax rate; our ability to generate sufficient cash to service our indebtedness, obtain future financing, and meet dividend obligations on our 7% preferred stock; our underfunded pension plans; significant changes in discount rates and the actual return on pension assets; the possibility of future impairment charges to our goodwill and long-lived assets; and operating and financial restrictions imposed on us by our bond indentures and credit agreement. There may be other factors that may cause our actual results to differ materially from the forward-looking statements. All forward-looking statements attributable to us or persons acting on our behalf apply only as of the date of this presentation and are expressly qualified in their entirety by the cautionary statements included herein. We undertake no obligation to update or revise forward-looking statements to reflect events or circumstances that arise after the date made or to reflect the occurrence of unanticipated events. |
 Jeff Edwards Chairman and Chief Executive Officer Executive Overview Second Quarter 2013 |
 4 Passion for Performance Executive Overview Industry Landscape: • North America vehicle production remains strong • Europe headwinds remain, performing as expected • China still growing, some softening taking place • Brazil volatility continues |
 5 Passion for Performance Executive Overview • Successful capital market transactions – $200 million equity self-tender – $200 million bond offering • Continued double-digit Adjusted EBITDA margins Second Quarter Financial Highlights: • Sales trajectory on-track and on-pace with industry – Consolidated sales of $784.7 million – 6.8% increase over same quarter 2012 |
 6 Passion for Performance Executive Overview Second Quarter Operational Highlights: • Completed staffing of Global Leadership Team • Celebrated groundbreaking for new manufacturing facility in Serbia • Acquired automotive sealing business of Jyco Sealing Technologies with manufacturing locations in Canada, Mexico and China • Reached preliminary agreement to expand Nishikawa global alliance to Brazil • Received continued customer recognition: – Ford Go Further Award, PSA Peugeot Citroen Global VA/VE, GM Quality Certification and Nissan Quality Performance |
 7 Passion for Performance Drive for Profitable Growth • Expanding customer relationships Long-Term Objective: Top 30 automotive supplier in revenue and top 5 for ROIC Committed to Enhanced Stakeholder Communication • Targeting new markets • High performing engaged employees • Leveraging product leadership positions • Investing in innovation • Advantaged global footprint and world-class operations Avenues for Success |
 Financial Overview Second Quarter 2013 Allen Campbell Chief Financial Officer |
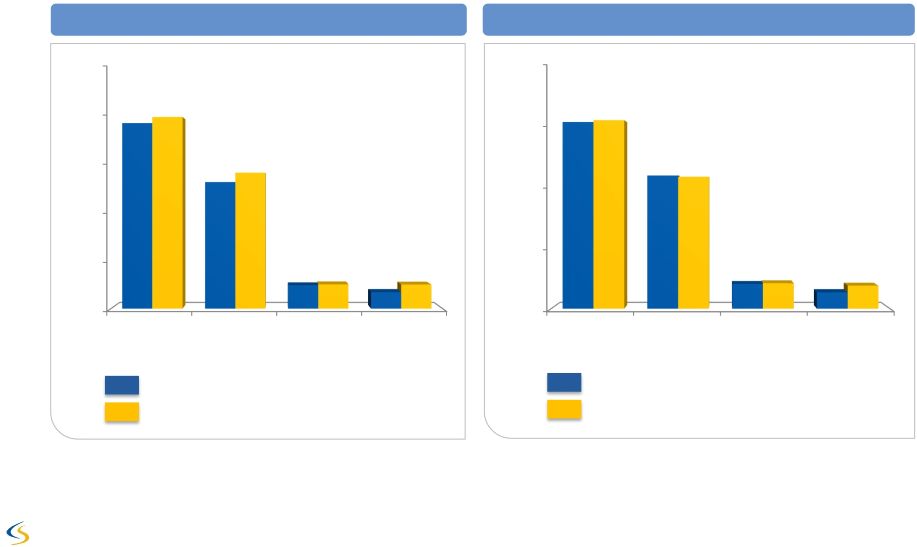 9 Passion for Performance Q2 and Year-to-Date 2013 Revenue $ USD Millions Note: Numbers subject to rounding Year-to-Date Second Quarter Q2 2012 - $735 Q2 2013 - $785 YTD 2012 - $1,500 YTD 2013 - $1,532 $387 $400 $264 $284 $49 $51 $34 $50 $500 $400 $300 $200 $100 $0 North America Europe Asia Pacific South America $1,000 $750 $500 $250 $0 North America Europe Asia Pacific South America $775 $783 $553 $548 $103 $105 $68 $96 |
 10 Passion for Performance Q2 and Year-to-Date 2013 Performance $ USD Millions, except EPS / % Note: Numbers subject to rounding Second Quarter Year-to-Date 2012 2013 2012 2013 $734.5 $784.7 Sales $1,499.8 $1,532.3 114.4 132.3 Gross Profit 236.1 252.6 15.6% 16.9% % Margin 15.7% 16.5% 69.0 72.7 SGA 141.0 147.8 42.1 54.6 Operating Profit 81.8 91.1 5.7% 7.0% % Margin 5.5% 5.9% $75.8 $26.1 Net Income $99.9 $46.0 $3.28 $1.34 Fully Diluted EPS $4.15 $2.19 $74.1 $82.5 Adjusted EBITDA $157.3 $159.2 10.1% 10.5% % Margin 10.5% 10.4% |
 11 Passion for Performance EBITDA and Adjusted EBITDA Reconciliation $ USD Millions 2012 2013 Net income Income tax expense (benefit) EBITDA Restructuring, net of noncontrolling interest Adjusted EBITDA Six Months Ended June 30, Net interest expense Depreciation and amortization EBITDA and Adjusted EBITDA are Non-GAAP measures. See appendix. $ 101.1 (38.2) 20.1 22.0 24.8 62.1 58.0 $ 147.0 $ 151.0 5.3 5.0 $ 157.3 $ 159.2 $ 48.1 Note: Numbers subject to rounding Stock based compensation 5.0 3.2 LTM Adjusted EBITDA $ 299.9 $ 297.3 |
 12 Passion for Performance Q2 and Year-to-Date 2013 Cash Flow Note: Numbers subject to rounding ($ USD Millions) Q2 2013 YTD 2013 Cash from business $67.3 $121.2 Pension funding - US (7.1) (7.1) Changes in operating assets & liabilities (74.4) (141.6) Cash used in operations (14.2) (27.5) Capital expenditures (35.8) (70.1) Cash used in operations and CAPEX (50.0) (97.6) Excess dividend over earnings on joint venture - 2.1 Proceeds from sale of fixed assets 0.1 0.3 Proceeds from issuance of senior PIK toggle notes 194.9 194.9 Financing activities (1.4) 1.7 Preferred stock cash dividends paid - (1.7) Purchase of non controlling interest - (1.9) Repurchase of common securities (206.1) (217.2) Proceeds from exercise of warrants 11.3 11.3 Foreign exchange and others (5.1) (2.0) Net cash used $(56.3) $(110.1) |
 13 Passion for Performance Other Financial Highlights • Completed a $200 million equity self-tender on May 2 – 4.7 million shares purchased at $43 per share • Issued $200 million 7 3/8% Senior PIK Toggle Notes due April 2018 • Net leverage: $ 519.4 M • Net leverage ratio: 1.7 • Interest coverage ratio: 6.4 x Capitalization Table ($ USD Millions) Key Financial Ratios Cash & equivalents $160.5 Total Debt Capital leases & other 33.8 Revolving Credit Facility - Total Secured Debt 33.8 Senior Unsecured Notes 450.0 Senior PIK Toggle Notes (1) 200.0 Total Debt 683.8 Convertible Preferred Stock 103.5 Equity 461.8 Total Capitalization $ 1,409.6 (1) Before OID and underwriting fees Liquidity Cash Balance as of June 30, 2013 $ 160.5 ABL Revolver 150.0 Letters of Credit (26.0) Total Liquidity $ 284.5 nd |
 14 Passion for Performance Full Year 2013 Financial Outlook • Sales growth 5 to 6% over 2012 • Capital expenditures $165 to $175 million • Cash restructuring $25 to $30 million • Cash taxes $15 to $20 million • Key Assumptions: - North American production 16.2 million - Europe (including Russia) production 18.7 million - Average full year exchange rate $1.32/Euro |
 15 Passion for Performance Summary • Strategy gaining traction • Solid second quarter earnings results • Continuing to position Company for profitable growth • Right people, product portfolio and resources to achieve business objectives Focused on exceeding customer expectations, enhancing operational execution and achieving profitable growth |
 Questions & Answers |
 Appendix |
 18 Passion for Performance Note: Numbers subject to rounding (1) Includes cash and noncash restructuring. (2) Proportionate share of restructuring costs related to Cooper Standard France joint venture. (3) Non-cash stock amortization expense and non-cash stock option expense for grants issued at time of the Company’s 2010 reorganization. EBITDA and Adjusted EBITDA – Six Months Ended June 30, 2012 ($ USD Millions) Three Months Ended Six Months Ended Mar 31, 2012 Jun 30, 2012 Jun 30, 2012 Net income $ 23.8 $ 77.3 $ 101.1 Income tax expense (benefit) 8.1 (46.2) (38.2) Interest expense, net of interest income 11.2 10.8 22.0 Depreciation and amortization 31.6 30.5 62.1 EBITDA $ 74.7 $ 72.4 $ 147.0 Restructuring (1) 6.1 (0.5) 5.6 Noncontrolling interest restructuring (2) (0.3) - (0.3) Stock-based compensation (3) 2.7 2.2 5.0 Adjusted EBITDA $ 83.2 $ 74.1 $ 157.3 Sales 765.3 734.5 $ 1,499.8 Adjusted EBITDA as a percent of Sales 10.9% 10.1% 10.5% |
 19 Passion for Performance Note: Numbers subject to rounding (1) Includes noncash restructuring. (2) Proportionate share of restructuring costs related to Cooper Standard France joint venture. (3) Non-cash stock amortization expense and non-cash stock option expense for grants issued at time of the Company’s 2010 reorganization. EBITDA and Adjusted EBITDA – Six Months Ended June 30, 2013 ($ USD Millions) Three Months Ended Six Months Ended Mar 31, 2013 Jun 30, 2013 Jun 30, 2013 Net income $ 20.7 $ 27.4 $ 48.1 Income tax expense 7.9 12.2 20.1 Interest expense, net of interest income 11.2 13.6 24.8 Depreciation and amortization 29.8 28.2 58.0 EBITDA $ 69.6 $ 81.4 $ 151.0 Restructuring (1) 4.8 1.0 5.8 Noncontrolling interest restructuring (2) (0.7) (0.1) (0.8) Stock-based compensation (3) 2.7 0.5 3.2 Others 0.3 (0.3) - Adjusted EBITDA $ 76.7 $ 82.5 $ 159.2 Sales 747.6 784.7 1,532.3 Adjusted EBITDA as a percent of Sales 10.3% 10.5% 10.4% |
 20 Passion for Performance LTM EBITDA and Adjusted EBITDA as of June 30, 2012 ($ USD Millions) Three Months Ended Twelve Months Ended Sep 30, 2011 Dec 31, 2011 Mar 31, 2012 Jun 30, 2012 Jun 30, 2012 Net income $ 15.7 $ 23.2 $ 23.8 $ 77.3 $ 140.0 Income tax expense (benefit) 8.0 (6.0) 8.1 (46.2) (36.1) Interest expense, net of interest income 9.6 10.3 11.2 10.8 41.9 Depreciation and amortization 31.7 32.1 31.6 30.5 125.9 EBITDA $ 65.0 $ 59.6 $ 74.7 $ 72.4 $ 271.7 Restructuring (1) 6.5 4.1 6.1 (0.5) 16.2 Noncontrolling interest restructuring (2) (1.3) (0.9) (0.3) - (2.5) Stock-based compensation (3) 3.0 2.5 2.7 2.2 10.4 Acquisition costs (4) 0.2 - - - 0.2 Other (5) - 1.3 - - 1.3 Adjusted EBITDA $ 73.4 $ 66.6 $ 83.2 $ 74.1 $ 297.3 Sales 708.5 695.7 765.3 734.5 2,904.0 Adjusted EBITDA as a percent of Sales 10.4% 9.6% 10.9% 10.1% 10.2% Note: Numbers subject to rounding (1) Includes noncash restructuring. (2) Proportionate share of restructuring costs related to Cooper Standard France joint venture. (3) Non-cash stock amortization expense and non-cash stock option expense for grants issued at time of the Company’s 2010 reorganization. (4) Costs incurred in relationship to the Cooper Standard France joint venture agreement. (5) Costs related to corporate development activities. |
 21 Passion for Performance Net Leverage Ratio and Adj. EBITDA % Margin as of June 30, 2013 (1) Includes noncash restructuring. (2) Proportionate share of restructuring costs related to Cooper Standard France joint venture. (3) Non-cash stock amortization expense and non-cash stock option expense for grants issued at time of the Company's 2010 reorganization. (4) Impairment charges related to goodwill ($2.8 million) and fixed assets ($7.3 million) (5) Executive compensation for retired CEO and costs related to search for new CEO (6) Noncontrolling interest deferred tax valuation reversal Note: Numbers subject to rounding ($ USD Millions) Three Months Ended Twelve Months Ended Sep 30, 2012 Dec 31, 2012 Mar 31, 2013 Jun 30, 2013 Jun 30, 2013 Net income $ 11.6 $ (9.9) $ 20.7 $ 27.4 $ 49.8 Income tax expense 5.4 1.2 7.9 12.2 26.7 Interest expense, net of interest income 11.3 11.5 11.2 13.6 47.6 Depreciation and amortization 29.1 31.5 29.8 28.2 118.6 EBITDA $ 57.4 $ 34.3 $ 69.6 $ 81.4 $ 242.7 Restructuring (1) 10.2 13.0 4.8 1.0 29.0 Noncontrolling interest restructuring (2) (0.2) (2.5) (0.7) (0.1) (3.5) Stock-based compensation (3) 2.4 2.5 2.7 0.5 8.1 Impairment charges (4) - 10.1 - - 10.1 Payment to former CEO and transition cost (5) - 11.5 - - 11.5 Noncontrolling deferred tax valuation reversal (6) - 2.0 - - 2.0 Others - - 0.3 (0.3) - Adjusted EBITDA $ 69.8 $ 70.9 $ 76.7 $ 82.5 $ 299.9 Net Leverage Debt payable within one year 33.0 Long-term debt 646.9 Less: cash and cash equivalents (160.5) Net Leverage $ 519.4 Net Leverage Ratio 1.7 Sales 684.0 697.1 747.6 784.7 2,913.4 Adjusted EBITDA as a percent of Sales 10.2% 10.2% 10.3% 10.5% 10.3% |
 22 Passion for Performance Non-GAAP Financial Measures EBITDA and adjusted EBITDA are measures not recognized under Generally Accepted Accounting Principles (GAAP) which exclude certain non-cash and non- recurring items. When analyzing the company’s operating performance, investors should use EBITDA and adjusted EBITDA in addition to, and not as alternatives for, net income (loss), operating income, or any other performance measure derived in accordance with GAAP, or as an alternative to cash flow from operating activities as a measure of the company’s performance. EBITDA and adjusted EBITDA have limitations as analytical tools and should not be considered in isolation or as substitutes for analysis of the company’s results of operations as reported under GAAP. Other companies may report EBITDA and adjusted EBITDA differently and therefore Cooper Standard’s results may not be comparable to other similarly titled measures of other companies. |