Exhibit 99.1

DRIVE
FOR PROFITABLE
GROWTH
Deutsche Bank
2014 Global Auto Industry Conference
January 2014
CooperStandard
PASSION FOR PERFORMANCE
Forward-Looking Statements
This presentation includes “forward-looking statements” within the meaning of U.S. federal securities laws, and we intend that such forward-looking statements be subject to the safe harbor created thereby. We make forward-looking statements in this presentation and may make such statements in future filings with the SEC. We may also make forward-looking statements in our press releases or other public or stockholder communications. These forward-looking statements include statements concerning our plans, objectives, goals, strategies, future events, future revenue or performance, capital expenditures, financing needs, plans or intentions relating to acquisitions, business trends, and other information that is not historical information. When used in this presentation, the words “estimates,” “expects,” “anticipates,” “projects,” “plans,” “intends,” “believes,” “forecasts,” or future or conditional verbs, such as “will,” “should,” “could,” or “may,” and variations of such words or similar expressions are intended to identify forward-looking statements. All forward-looking statements, including, without limitation, management’s examination of historical operating trends and data are based upon our current expectations and various assumptions. Our expectations, beliefs, and projections are expressed in good faith and we believe there is a reasonable basis for them. However, no assurances can be made that these expectations, beliefs and projections will be achieved. Forward-looking statements are not guarantees of future performance and are subject to significant risks and uncertainties that may cause actual results or achievements to be materially different from the future results or achievements expressed or implied by the forward-looking statements.
There are a number of risks and uncertainties that could cause our actual results to differ materially from the forward-looking statements contained in this presentation. Important factors that could cause our actual results to differ materially from the forward-looking statements we make herein include, but are not limited to: cyclicality of the automotive industry with the possibility of further material contractions in automotive sales and production effecting the viability of our customers and financial condition of our customers; global economic uncertainty, particularly in Europe; loss of large customers or significant platforms; supply shortages; escalating pricing pressures and decline of volume requirements from our customers; our ability to meet significant increases in demand; availability and increasing volatility in cost of raw materials or manufactured components; our ability to continue to compete successfully in the highly competitive automotive parts industry; risks associated with our non-U.S. operations; foreign currency exchange rate fluctuations; our ability to control the operations of joint ventures for our benefit; the effectiveness of our lean manufacturing and other cost savings plans; product liability and warranty and recall claims that may be brought against us; work stoppages or other labor conditions; natural disasters; our ability to attract and retain key personnel; our ability to meet our customers’ needs for new and improved products in a timely manner or cost-effective basis; the possibility that our acquisition strategy may not be successful; our legal rights to our intellectual property portfolio; environmental and other regulations; legal proceedings or commercial and contractual disputes that we may be involved in; the possible volatility of our annual effective tax rate; our ability to generate sufficient cash to service our indebtedness, and obtain future financing; our underfunded pension plans; significant changes in discount rates and the actual return on pension assets; the possibility of future impairment charges to our goodwill and long-lived assets; and operating and financial restrictions imposed on us by our bond indentures and credit agreement.
There may be other factors that may cause our actual results to differ materially from the forward-looking statements. All forward-looking statements attributable to us or persons acting on our behalf apply only as of the date of this presentation and are expressly qualified in their entirety by the cautionary statements included herein. We undertake no obligation to update or revise forward-looking statements to reflect events or circumstances that arise after the date made or to reflect the occurrence of unanticipated events.
TOP 30 / TOP 5
2
PASSION FOR PERFORMANCE

Jeff Edwards
Chairman and Chief Executive Officer
3
PASSION FOR PERFORMANCE
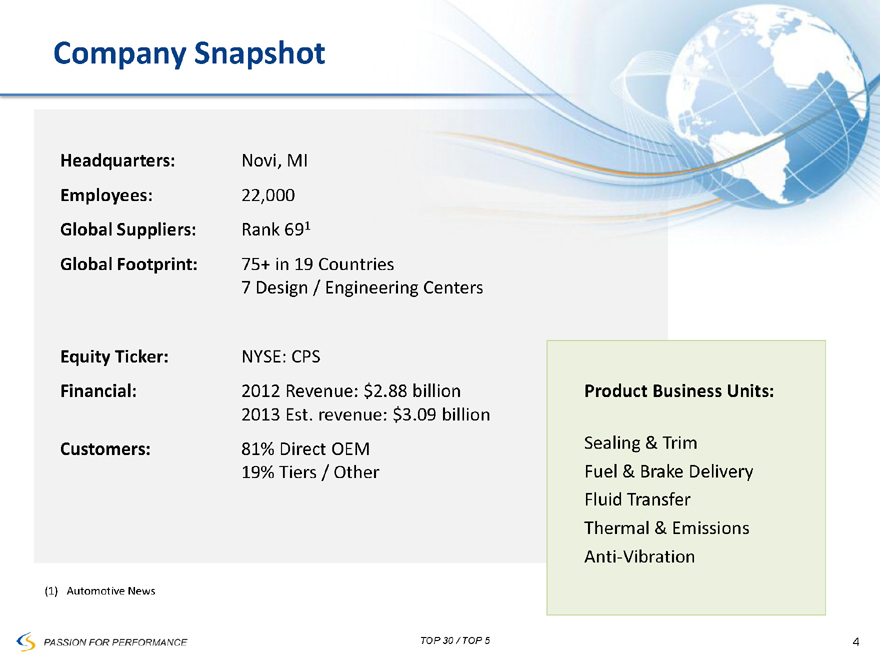
Company Snapshot
Headquarters: Novi, MI
Employees: 22,000
Global Suppliers: Rank 691
Global Footprint: 75+ in 19 Countries
7 Design / Engineering Centers
Equity Ticker: NYSE: CPS
Financial: 2012 Revenue: $2.88 billion
2013 Est. revenue: $3.09 billion
Customers: 81% Direct OEM
19% Tiers / Other
(1) Automotive News
Product Business Units:
Sealing & Trim
Fuel & Brake Delivery
Fluid Transfer
Thermal & Emissions
Anti-Vibration
TOP 30 / TOP 5
4
PASSION FOR PERFORMANCE
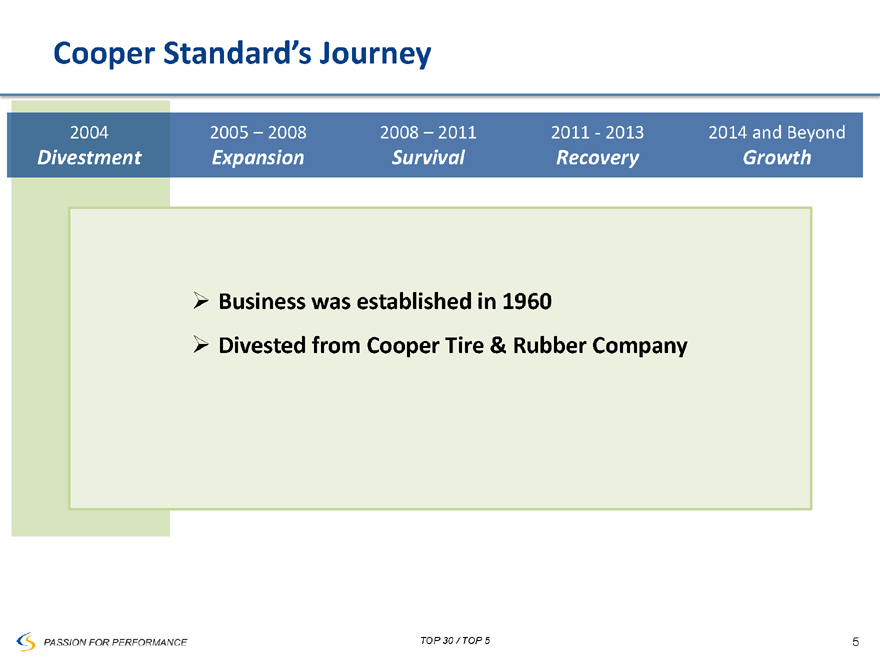
Cooper Standard’s Journey
2004 2005 – 2008 2008 – 2011 2011 - 2013 2014 and Beyond
Divestment Expansion Survival Recovery Growth
Business was established in 1960
Divested from Cooper Tire & Rubber Company
TOP 30 / TOP 5
5
PASSION FOR PERFORMANCE
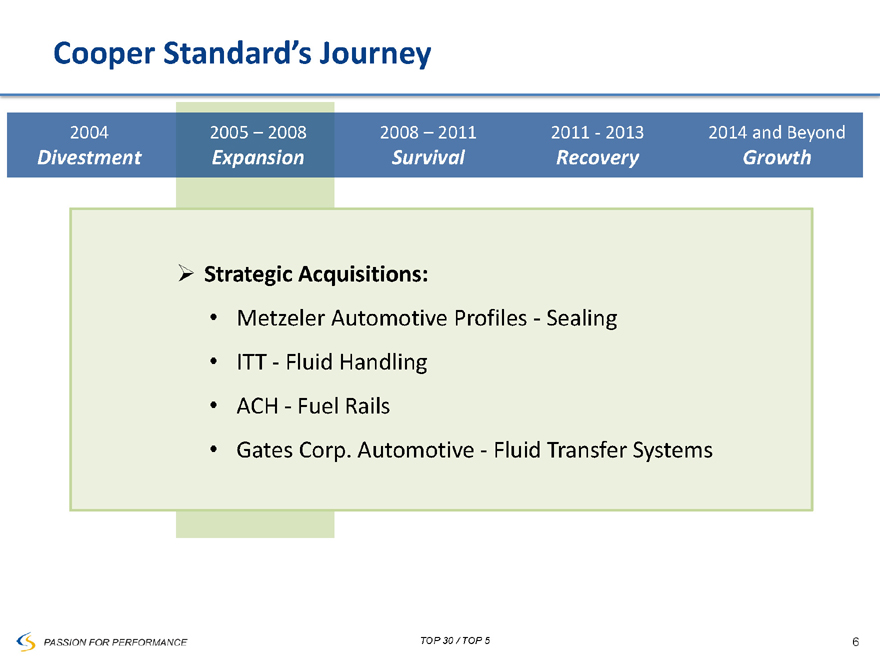
Cooper Standard’s Journey
2004 2005 – 2008 2008 – 2011 2011 - 2013 2014 and Beyond
Divestment Expansion Survival Recovery Growth
Strategic Acquisitions:
Metzeler Automotive Profiles - Sealing
ITT - Fluid Handling
ACH - Fuel Rails
Gates Corp. Automotive - Fluid Transfer Systems
TOP 30 / TOP 5
6
PASSION FOR PERFORMANCE
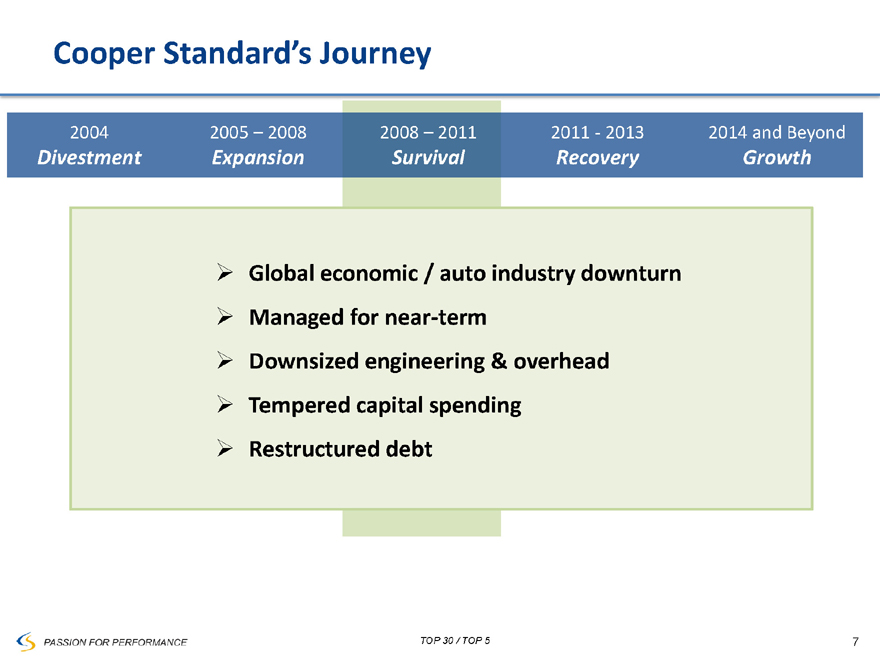
Cooper Standard’s Journey
2004 2005 – 2008 2008 – 2011 2011 - 2013 2014 and Beyond
Divestment Expansion Survival Recovery Growth
Global economic / auto industry downturn Managed for near-term Downsized engineering & overhead Tempered capital spending Restructured debt
TOP 30 / TOP 5
7
PASSION FOR PERFORMANCE
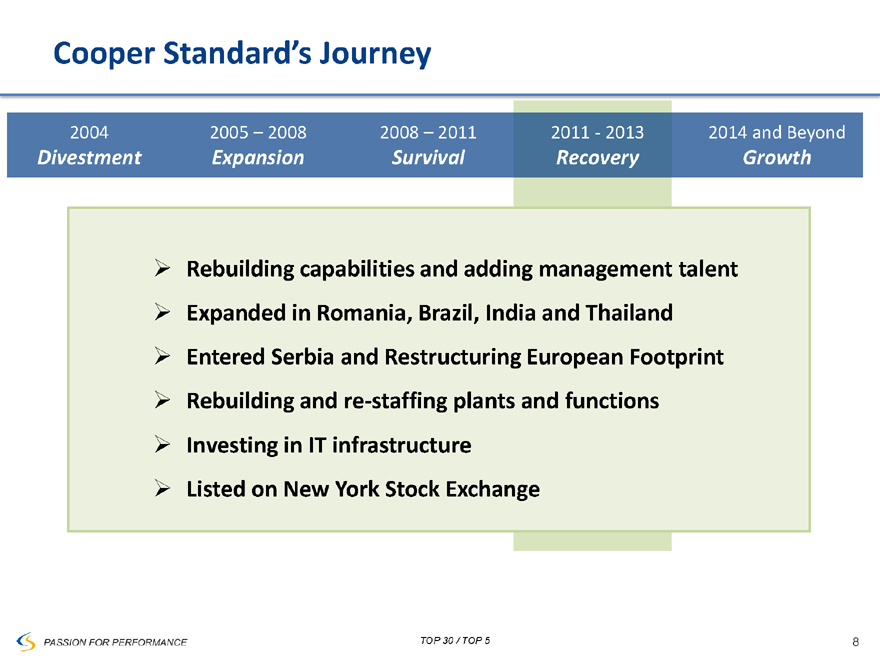
Cooper Standard’s Journey
2004 2005 – 2008 2008 – 2011 2011 - 2013 2014 and Beyond
Divestment Expansion Survival Recovery Growth
Rebuilding capabilities and adding management talent
Expanded in Romania, Brazil, India and Thailand
Entered Serbia and Restructuring European Footprint
Rebuilding and re-staffing plants and functions
Investing in IT infrastructure
Listed on New York Stock Exchange
TOP 30 / TOP 5
8
PASSION FOR PERFORMANCE
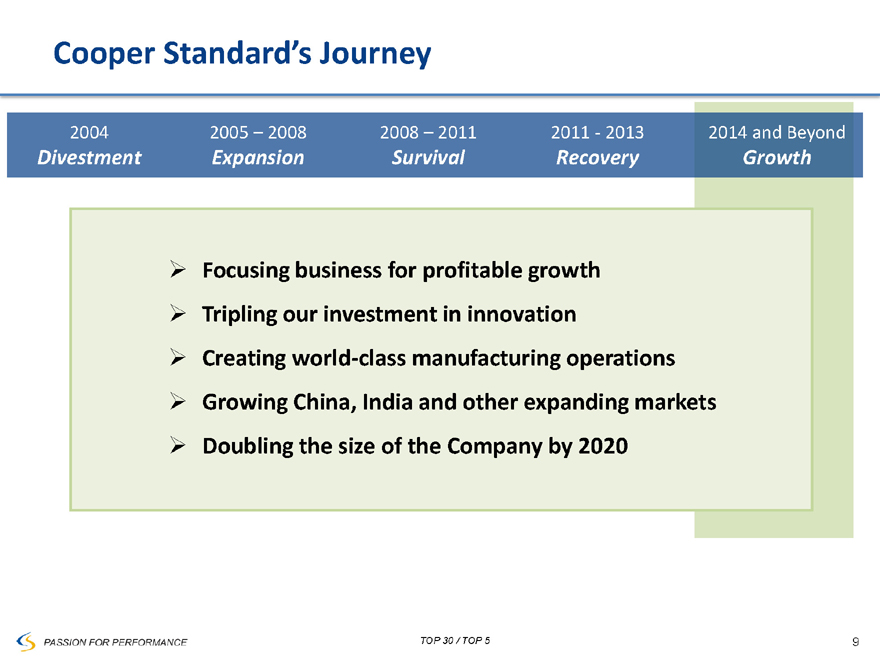
Cooper Standard’s Journey
2004 2005 – 2008 2008 – 2011 2011 - 2013 2014 and Beyond
Divestment Expansion Survival Recovery Growth
Focusing business for profitable growth
Tripling our investment in innovation
Creating world-class manufacturing operations
Growing China, India and other expanding markets
Doubling the size of the Company by 2020
TOP 30 / TOP 5
9
PASSION FOR PERFORMANCE
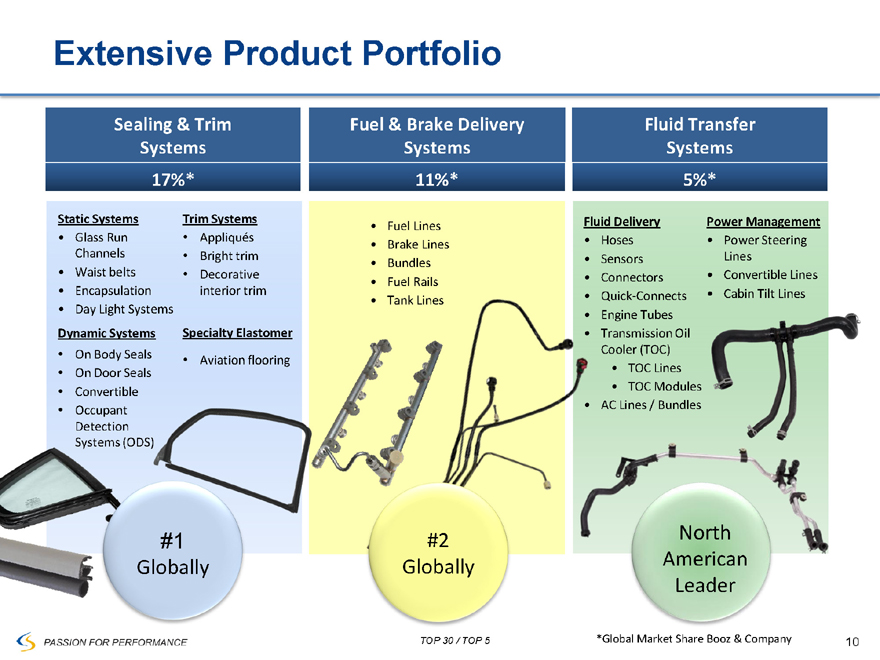
Extensive Product Portfolio
Sealing & Trim Systems 17%*
Static Systems
Glass Run Channels
Waist belts
Encapsulation
Day Light Systems
Trim Systems
Appliqués
Bright trim
Decorative interior trim
Dynamic Systems
On Body Seals
On Door Seals
Convertible
Occupant Detection
Systems (ODS)
Specialty Elastomer
Aviation flooring
Fuel & Brake Delivery Systems 11%*
Fuel Lines
Brake Lines
Bundles
Fuel Rails
Tank Lines
Fluid Transfer Systems 5%*
Fluid Delivery
Hoses
Sensors
Connectors
Quick-Connects
Engine Tubes
Transmission Oil
Cooler (TOC)
TOC Lines
TOC Modules
AC Lines / Bundles
Power Management
Power Steering Lines
Convertible Lines
Cabin Tilt Lines
#1
Globally
#2 Globally
North American Leader
TOP 30 / TOP 5
*Global Market Share Booz & Company
10
PASSION FOR PERFORMANCE

VISION
Drive for Profitable Growth
TOP 30 * TOP 5
* Top 30 automotive suppliers for sales, Top 5% ROIC
CooperStandard
PASSION FOR PERFORMANCE
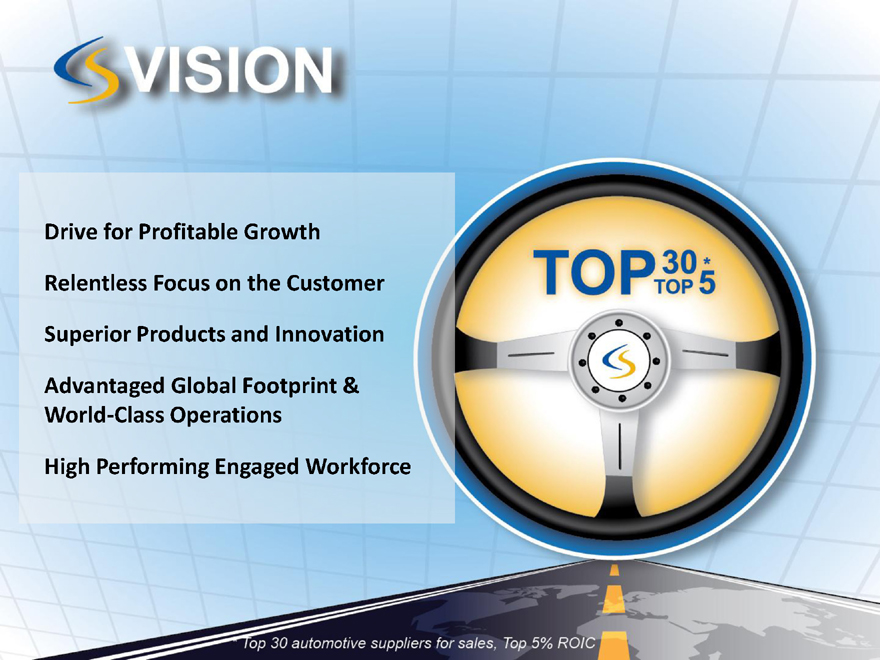
VISION
Drive for Profitable Growth
Relentless Focus on the Customer
Superior Products and Innovation
Advantaged Global Footprint & World-Class Operations
High Performing Engaged Workforce
* Top 30 automotive suppliers for sales, Top 5% ROIC
TOP 30 * TOP 5
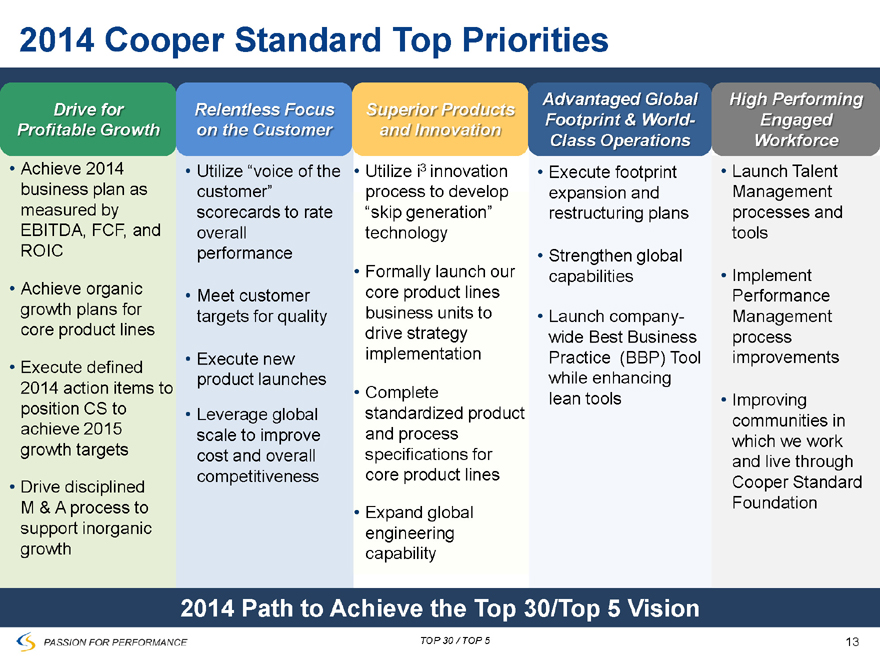
2014 Cooper Standard Top Priorities
Drive for Profitable Growth
Achieve 2014 business plan as measured by EBITDA, FCF, and ROIC
Achieve organic growth plans for core product lines
Execute defined 2014 action items to position CS to achieve 2015 growth targets
Drive disciplined M & A process to support inorganic growth Relentless Focus on the Customer
Utilize “voice of the customer” scorecards to rate overall performance
Meet customer targets for quality
Execute new product launches
Leverage global scale to improve cost and overall competitiveness Superior Products and Innovation
Utilize i3 innovation process to develop “skip generation” technology
Formally launch our core product lines business units to drive strategy implementation
Complete standardized product and process specifications for core product lines
Expand global engineering capability Advantaged Global Footprint & World-Class Operations
Execute footprint expansion and restructuring plans
Strengthen global capabilities
Launch company-wide Best Business Practice (BBP) Tool while enhancing lean tools
High Performing Engaged Workforce
Launch Talent Management processes and tools
Implement Performance Management process improvements
Improving communities in which we work and live through Cooper Standard Foundation
2014 Path to Achieve the Top 30/Top 5 Vision
TOP 30 / TOP 5
13
PASSION FOR PERFORMANCE
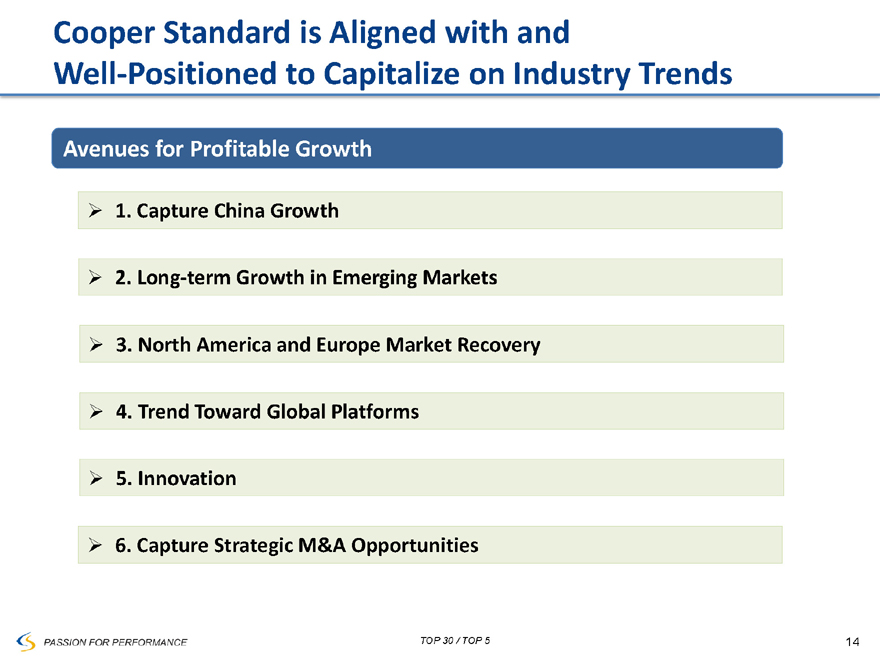
Cooper Standard is Aligned with and
Well-Positioned to Capitalize on Industry Trends
Avenues for Profitable Growth
1. Capture China Growth
2. Long-term Growth in Emerging Markets
3. North America and Europe Market Recovery
4. Trend Toward Global Platforms
5. Innovation
6. Capture Strategic M&A Opportunities
TOP 30 / TOP 5
14
PASSION FOR PERFORMANCE
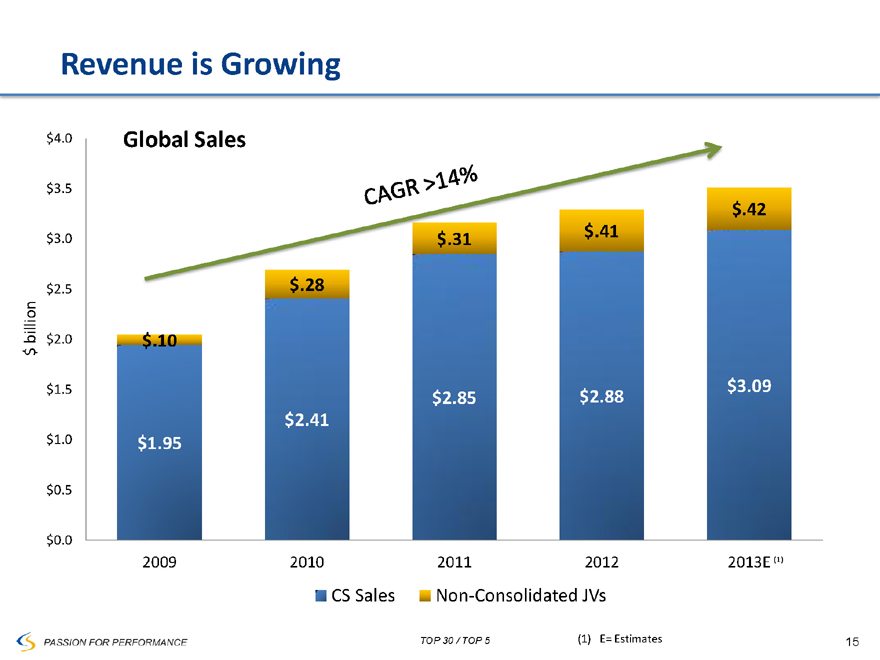
Revenue is Growing
Global Sales
CAGR >14%
$ billion
$4.0
$3.5
$3.0
$2.5
$2.0
$1.5
$1.0
$0.5
$0.0
$.10
$1.95
$.28
$2.41
$.31
$2.85
$.41
$.42
$2.88
$3.09
2009
2010
2011
2012
2013E (1)
CS Sales
Non-Consolidated JVs
TOP 30 / TOP 5
(1) E= Estimates
15
PASSION FOR PERFORMANCE
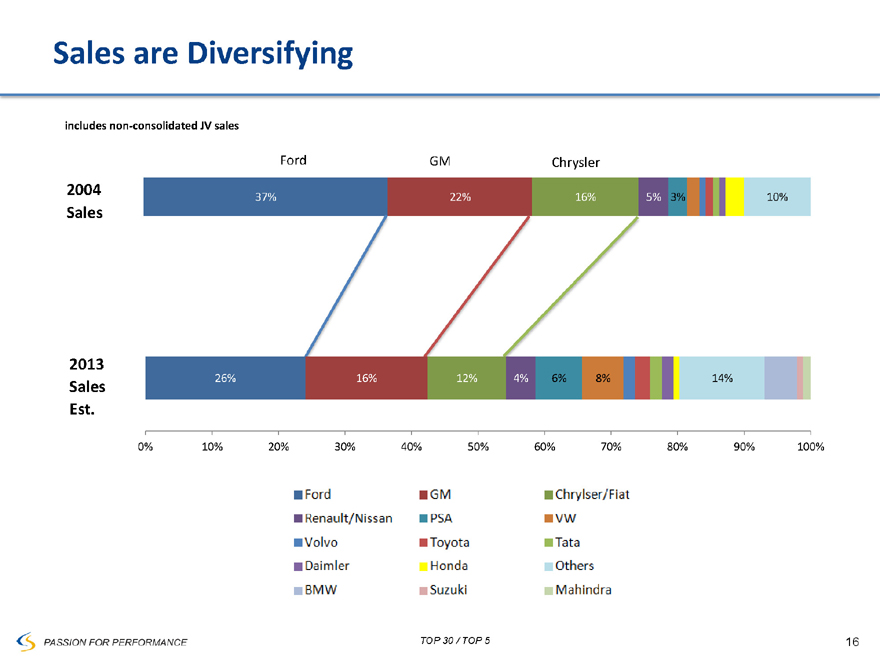
Sales are Diversifying
includes non-consolidated JV sales
2004 Sales
Ford GM Chrysler
37% 22% 16% 5% 3% 10%
2013 Sales Est.
26% 16% 12% 4% 6% 8% 14%
0% 10% 20% 30% 40% 50% 60% 70% 80% 90% 100%
Ford
Renault/Nissan
Volvo
Daimler
BMW
GM
PSA
Toyota
Honda
Suzuki
Chrysler/Fiat
VW
Tata
Others
Mahindra
TOP 30 / TOP 5
16
PASSION FOR PERFORMANCE
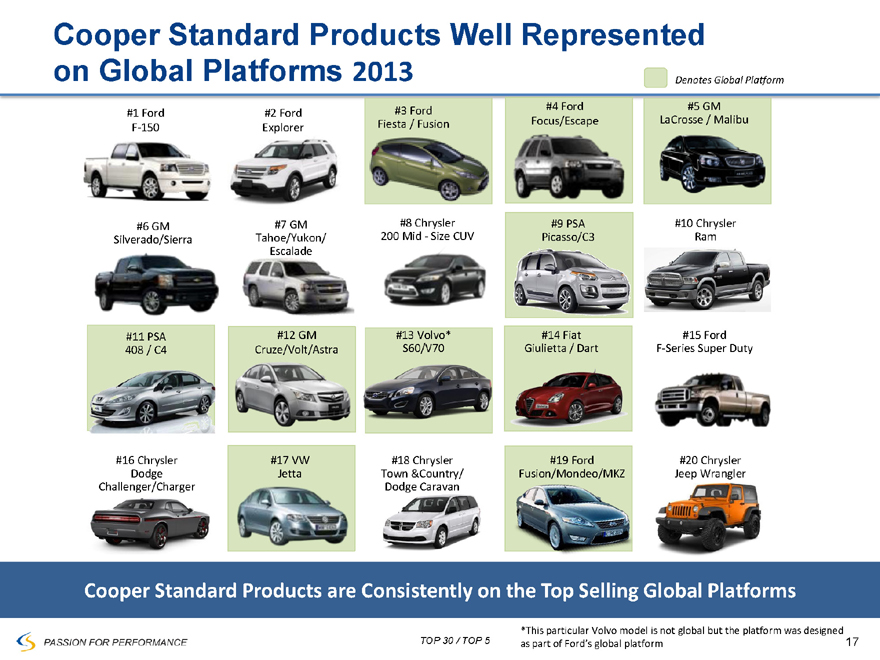
Cooper Standard Products Well Represented on Global Platforms 2013
Denotes Global Platform
#1 Ford F-150
#2 Ford Explorer
#3 Ford Fiesta / Fusion
#4 Ford Focus/Escape
#5 GM LaCrosse / Malibu
#6 GM Silverado/Sierra
#7 GM Tahoe/Yukon/ Escalade
#8 Chrysler 200 Mid - Size CUV
#9 PSA Picasso/C3
#10 Chrysler Ram
#11 PSA 408 / C4
#12 GM Cruze/Volt/Astra
#13 Volvo* S60/V70
#14 Fiat Giulietta / Dart
#15 Ford F-Series Super Duty
#16 Chrysler Dodge Challenger/Charger
#17 VW Jetta
#18 Chrysler Town &Country/ Dodge Caravan
#19 Ford Fusion/Mondeo/MKZ
#20 Chrysler Jeep Wrangler
Cooper Standard Products are Consistently on the Top Selling Global Platforms
TOP 30 / TOP 5
*This particular Volvo model is not global but the platform was designed as part of Ford’s global platform
17
PASSION FOR PERFORMANCE
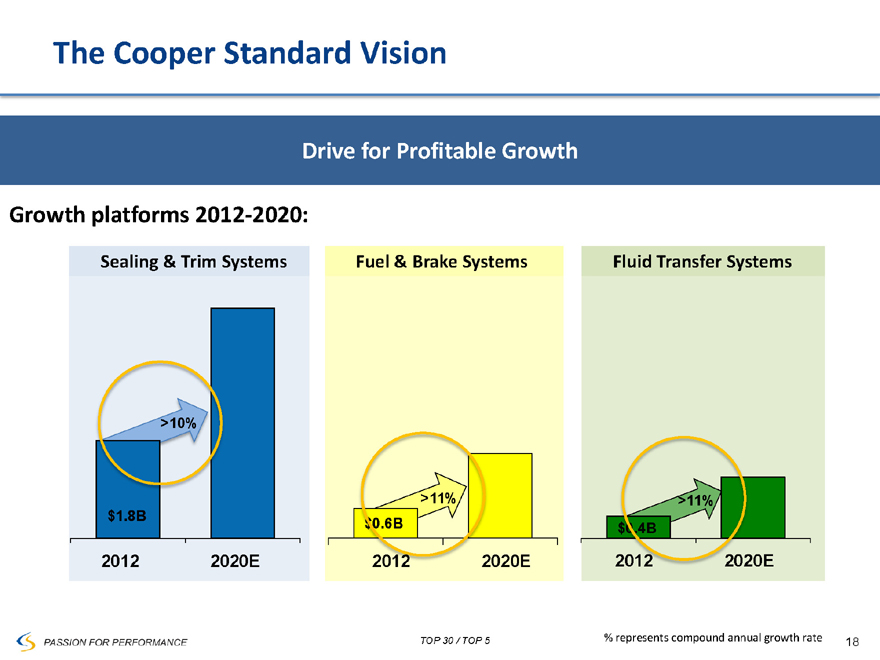
The Cooper Standard Vision
Drive for Profitable Growth
Growth platforms 2012-2020:
Sealing & Trim Systems
$1.8B
>10%
2012
2020E
Fuel & Brake Systems
$0.6B >11%
2012
2020E
Fluid Transfer Systems
$6.4B >11%
2012
2020E
TOP 30 / TOP 5
% represents compound annual growth rate
18
PASSION FOR PERFORMANCE
Drive for Profitable Growth
Strategic plan focuses on core product segments
– Sealing & Trim Systems
– Fluid Transfer Systems
– Fuel & Brake Delivery
Investing in breakthrough technologies
Building company-wide capabilities to support growth, optimize returns and deliver higher ROIC (BBP, program management, product engineering, innovation management, purchasing and IT systems)
Divesting non-core product segments when lack capability to achieve leading market position
TOP 30 / TOP 5
19
PASSION FOR PERFORMANCE
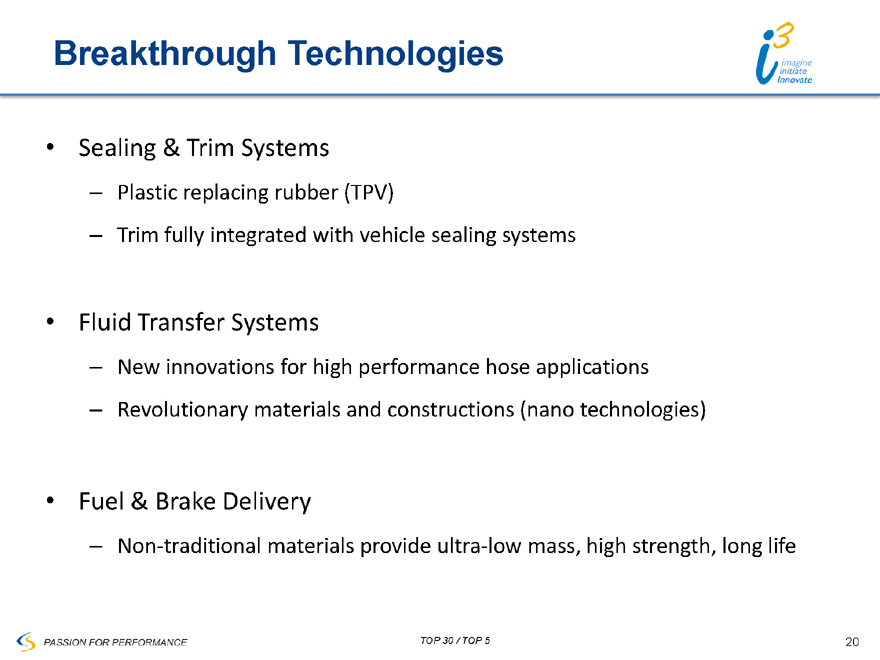
Breakthrough Technologies
Sealing & Trim Systems
– Plastic replacing rubber (TPV)
– Trim fully integrated with vehicle sealing systems
Fluid Transfer Systems
– New innovations for high performance hose applications
– Revolutionary materials and constructions (nano technologies)
Fuel & Brake Delivery
– Non-traditional materials provide ultra-low mass, high strength, long life
TOP 30 / TOP 5
20
PASSION FOR PERFORMANCE
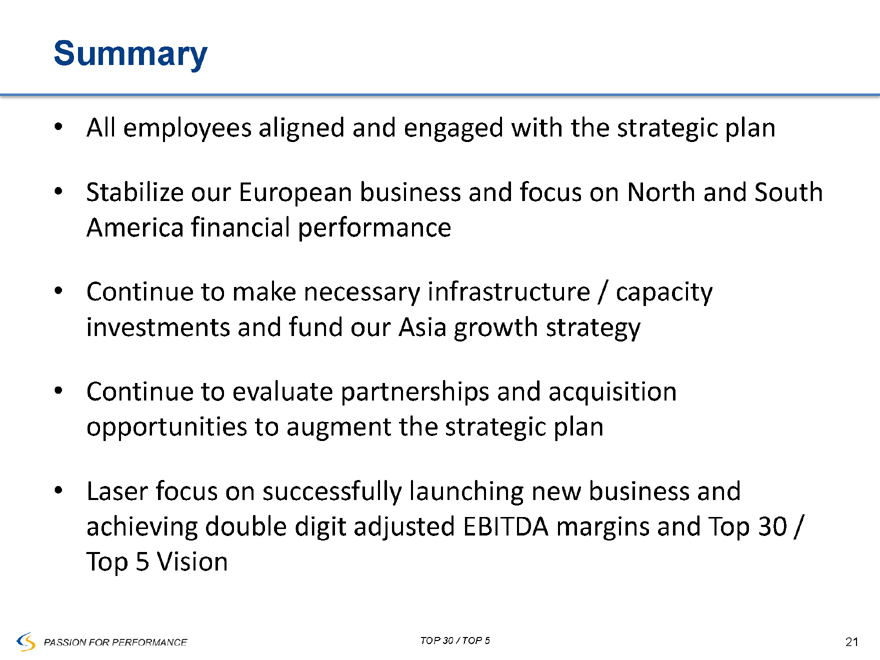
Summary
All employees aligned and engaged with the strategic plan
Stabilize our European business and focus on North and South
America financial performance
Continue to make necessary infrastructure / capacity investments and fund our Asia growth strategy
Continue to evaluate partnerships and acquisition opportunities to augment the strategic plan
Laser focus on successfully launching new business and achieving double digit adjusted EBITDA margins and Top 30 / Top 5 Vision
TOP 30 / TOP 5
21
PASSION FOR PERFORMANCE
Allen Campbell
Executive Vice President and
Chief Financial Officer
22
PASSION FOR PERFORMANCE
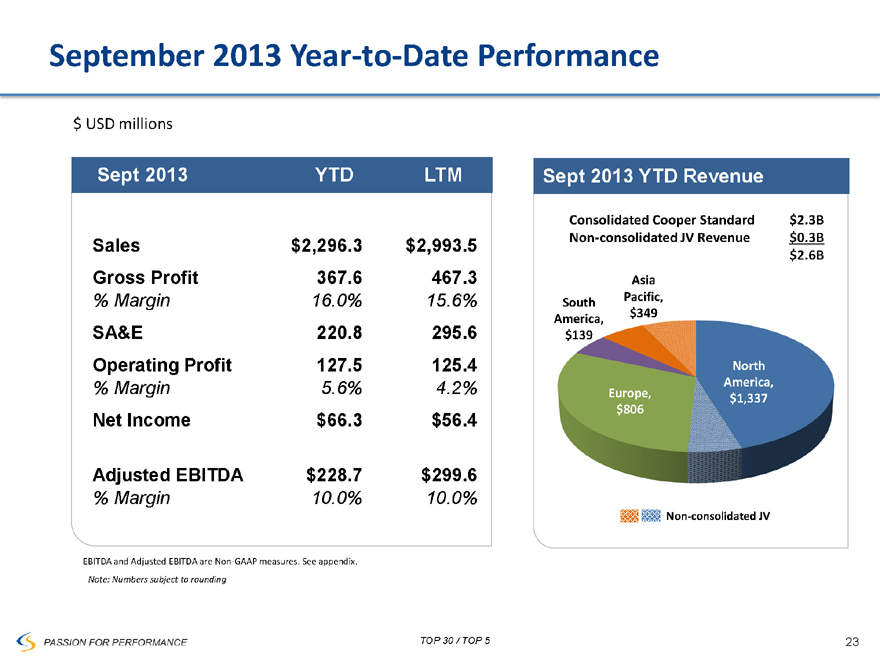
September 2013 Year-to-Date Performance
$ USD millions
Sept 2013 YTD LTM
Sales $2,296.3 $2,993.5
Gross Profit 367.6 467.3
% Margin 16.0% 15.6%
SA&E 220.8 295.6
Operating Profit 127.5 125.4
% Margin 5.6% 4.2%
Net Income $66.3 $56.4
Adjusted EBITDA $228.7 $299.6
% Margin 10.0% 10.0%
EBITDA and Adjusted EBITDA are Non-GAAP measures. See appendix.
Note: Numbers subject to rounding
Sept 2013 YTD Revenue
Consolidated Cooper Standard $ 2.3B
Non-consolidated JV Revenue $ 0.3B
$ 2.6B
South America, $139
Asia Pacific, $349
Europe, $806
North America, $1,337
Non-consolidated JV
TOP 30 / TOP 5
23
PASSION FOR PERFORMANCE
Period of Transition
North America recovery
Investing in regional management talent
Capacity and footprint optimization
Investments in technologies to improve competitiveness
Short-term challenges associated with product complexities
TOP 30 / TOP 5
24
PASSION FOR PERFORMANCE
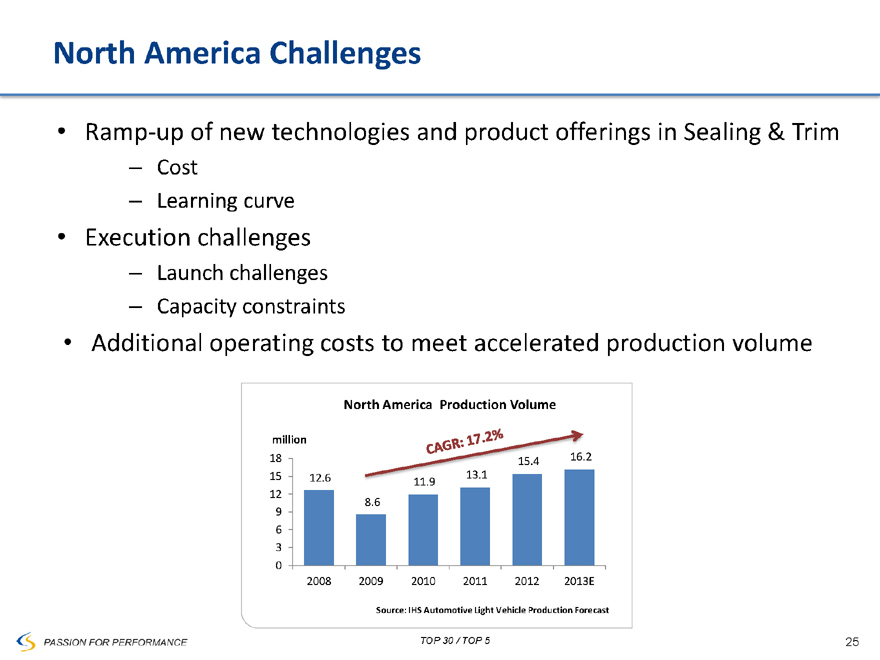
North America Challenges
Ramp-up of new technologies and product offerings in Sealing & Trim
– Cost
– Learning curve
Execution challenges
– Launch challenges
– Capacity constraints
Additional operating costs to meet accelerated production volume
North America Production Volume
million
18 15 12 9 6 3 0
12.6
8.6
11.9
13.1
15.4
16.2
CAGR: 17.2%
2008
2009
2010
2011
2012
2013E
Source: IHS Automotive Light Vehicle Production Forecast
TOP 30 / TOP 5
25+
PASSION FOR PERFORMANCE
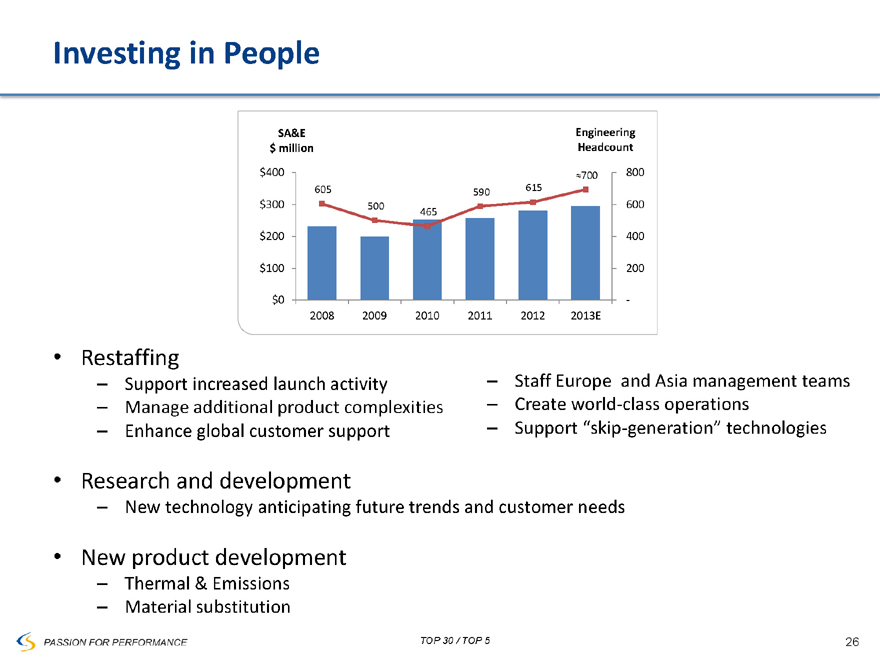
Investing in People
SA&E $ million
Engineering Headcount
$400
$300
$200
$100
$0
2008
2009
2010
2011
2012
2013E
605
500
465
590
615
»700
800 600 400 200 -
Restaffing
– Support increased launch activity
– Manage additional product complexities
– Enhance global customer support
– Staff Europe and Asia management teams
– Create world-class operations
– Support “skip-generation” technologies
Research and development
– New technology anticipating future trends and customer needs
New product development
– Thermal & Emissions
– Material substitution
TOP 30 / TOP 5
26
PASSION FOR PERFORMANCE
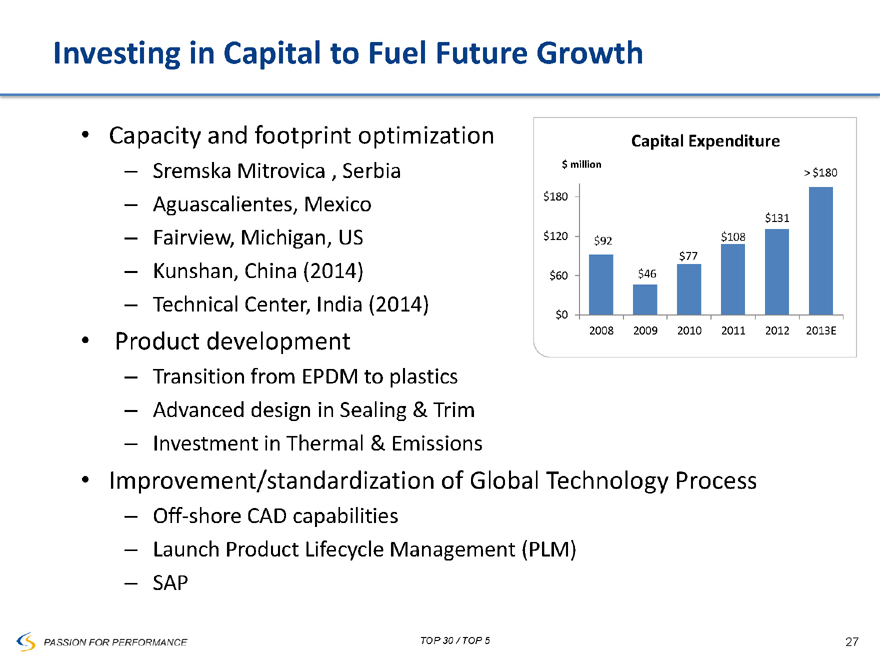
Investing in Capital to Fuel Future Growth
Capacity and footprint optimization
– Sremska Mitrovica , Serbia
– Aguascalientes, Mexico
– Fairview, Michigan, US
– Kunshan, China (2014)
– Technical Center, India (2014)
Product development
– Transition from EPDM to plastics
– Advanced design in Sealing & Trim
– Investment in Thermal & Emissions
Improvement/standardization of Global Technology Process
– Off-shore CAD capabilities
– Launch Product Lifecycle Management (PLM)
– SAP
TOP 30 / TOP 5
Capital Expenditure
$ million
$180 $120 $60 $0
2008 2009 2010 2011 2012 2013E
$92
$46
$77
$108
$131
> $180
27
PASSION FOR PERFORMANCE
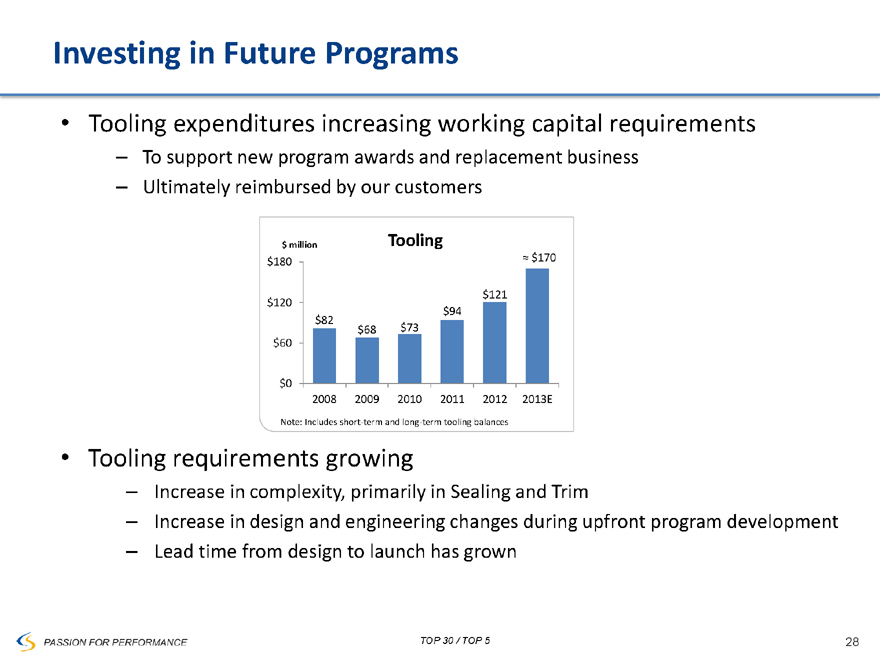
Investing in Future Programs
Tooling expenditures increasing working capital requirements
– To support new program awards and replacement business
– Ultimately reimbursed by our customers
Tooling
$ million
$180
$120
$60
$0
2008 2009 2010 2011 2012 2013E
$82
$68
$73
$94
$121
» $170
Note: Includes short-term and long-term tooling balances
Tooling requirements growing
– Increase in complexity, primarily in Sealing and Trim
– Increase in design and engineering changes during upfront program development
– Lead time from design to launch has grown
TOP 30 / TOP 5
28
PASSION FOR PERFORMANCE
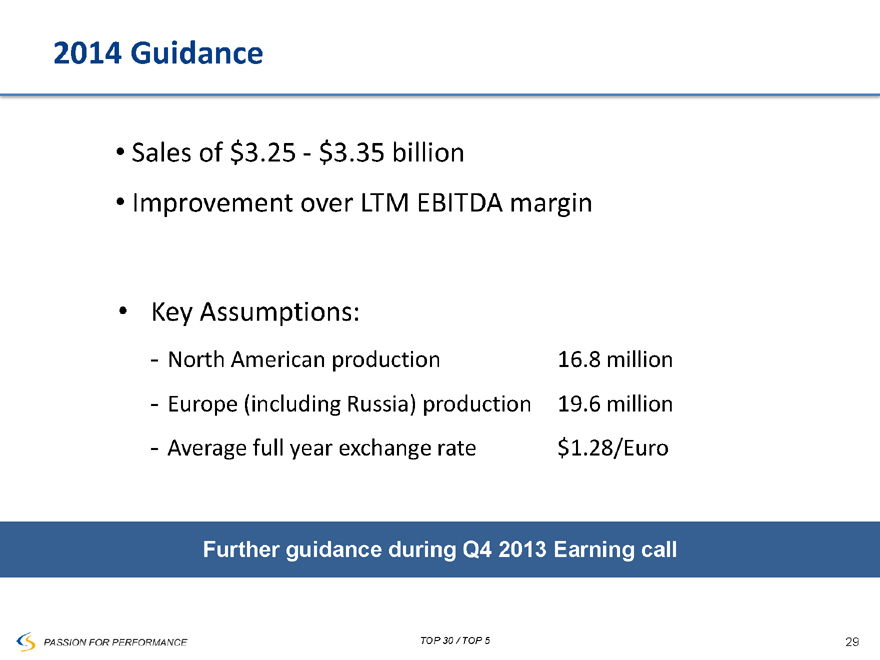
2014 Guidance
Sales of $3.25 - $3.35 billion
Improvement over LTM EBITDA margin
Key Assumptions:
- North American production 16.8 million
- Europe (including Russia) production 19.6 million
- Average full year exchange rate $1.28/Euro
Further guidance during Q4 2013 Earning call
TOP 30 / TOP 5
29
PASSION FOR PERFORMANCE

Appendix
30
PASSION FOR PERFORMANCE
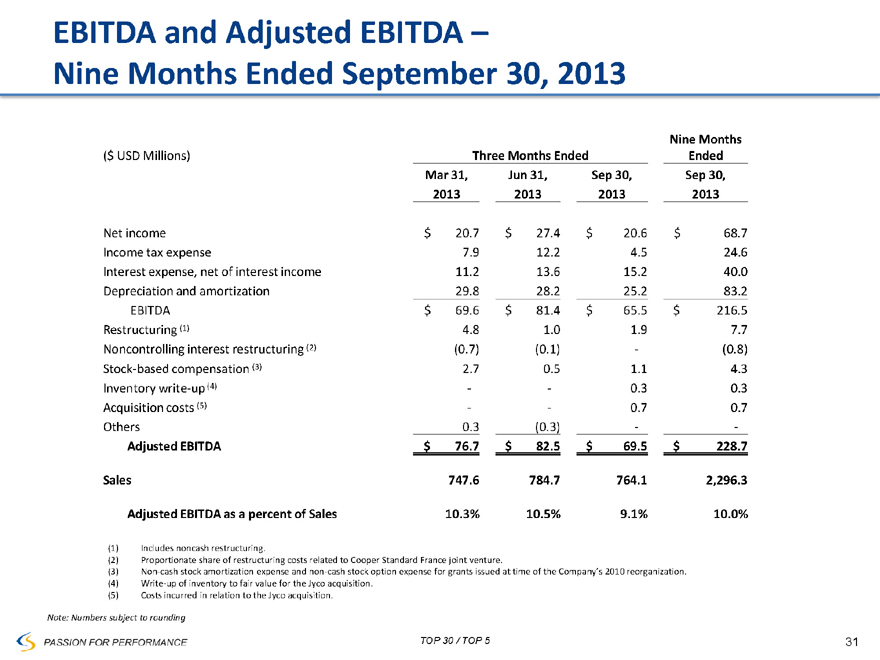
EBITDA and Adjusted EBITDA –
Nine Months Ended September 30, 2013
Nine Months
($ USD Millions) Three Months Ended Ended
Mar 31, Jun 31, Sep 30, Sep 30,
2013 2013 2013 2013
Net income $ 20.7 $ 27.4 $ 20.6 $ 68.7
Income tax expense 7.9 12.2 4.5 24.6
Interest expense, net of interest income 11.2 13.6 15.2 40.0
Depreciation and amortization 29.8 28.2 25.2 83.2
EBITDA $ 69.6 $ 81.4 $ 65.5 $ 216.5
Restructuring (1) 4.8 1.0 1.9 7.7
Noncontrolling interest restructuring (2) (0.7) (0.1) - (0.8)
Stock-based compensation (3) 2.7 0.5 1.1 4.3
Inventory write-up (4) - - 0.3 0.3
Acquisition costs (5) - - 0.7 0.7
Others 0.3 (0.3) - -
Adjusted EBITDA $ 76.7 $ 82.5 $ 69.5 $ 228.7
Sales 747.6 784.7 764.1 2,296.3
Adjusted EBITDA as a percent of Sales 10.3% 10.5% 9.1% 10.0%
(1) Includes noncash restructuring.
(2) Proportionate share of restructuring costs related to Cooper Standard France joint venture.
(3) Non-cash stock amortization expense and non-cash stock option expense for grants issued at time of the Company’s 2010 reorganization.
(4) Write-up of inventory to fair value for the Jyco acquisition. (5) Costs incurred in relation to the Jyco acquisition.
Note: Numbers subject to rounding
TOP 30 / TOP 5
31
PASSION FOR PERFORMANCE
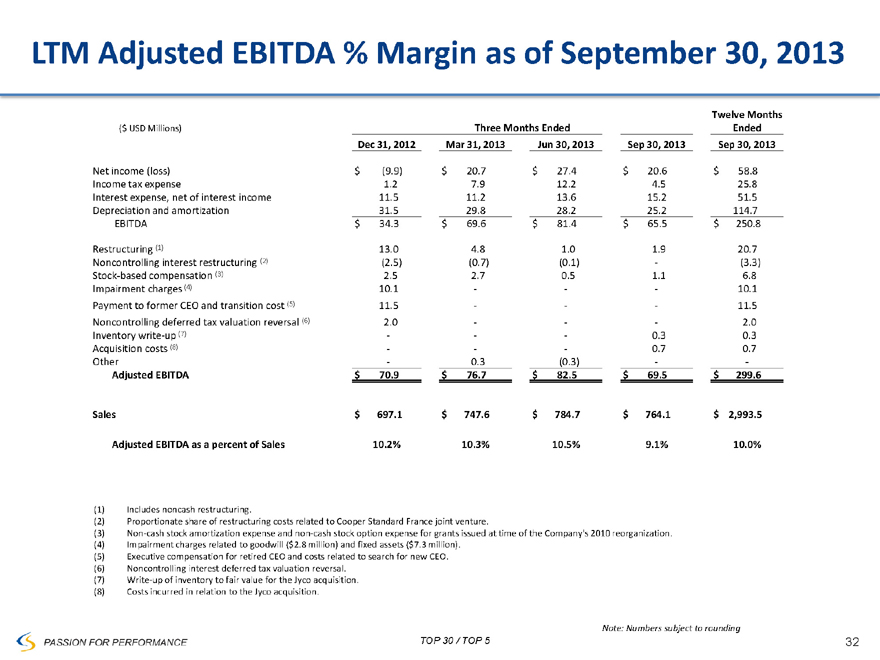
LTM Adjusted EBITDA % Margin as of September 30, 2013
Twelve Months
($ USD Millions) Three Months Ended Ended
Dec 31, 2012 Mar 31, 2013 Jun 30, 2013 Sep 30, 2013 Sep 30, 2013
Net income (loss) $ (9.9) $ 20.7 $ 27.4 $ 20.6 $ 58.8
Income tax expense 1.2 7.9 12.2 4.5 25.8
Interest expense, net of interest income 11.5 11.2 13.6 15.2 51.5
Depreciation and amortization 31.5 29.8 28.2 25.2 114.7
EBITDA $ 34.3 $ 69.6 $ 81.4 $ 65.5 $ 250.8
Restructuring (1) 13.0 4.8 1.0 1.9 20.7
Noncontrolling interest restructuring (2) (2.5) (0.7) (0.1) - (3.3)
Stock-based compensation (3) 2.5 2.7 0.5 1.1 6.8
Impairment charges (4) 10.1 - - - 10.1
Payment to former CEO and transition cost (5) 11.5 - - - 11.5
Noncontrolling deferred tax valuation reversal (6) 2.0 - - - 2.0
Inventory write-up (7) - - - 0.3 0.3
Acquisition costs (8) - - - 0.7 0.7
Other - 0.3 (0.3) - -
Adjusted EBITDA $ 70.9 $ 76.7 $ 82.5 $ 69.5 $ 299.6
Sales $ 697.1 $ 747.6 $ 784.7 $ 764.1 $ 2,993.5
Adjusted EBITDA as a percent of Sales 10.2% 10.3% 10.5% 9.1% 10.0%
(1) Includes noncash restructuring.
(2) Proportionate share of restructuring costs related to Cooper Standard France joint venture.
(3) Non-cash stock amortization expense and non-cash stock option expense for grants issued at time of the Company’s 2010 reorganization. (4) Impairment charges related to goodwill ($2.8 million) and fixed assets ($7.3 million).
(5) Executive compensation for retired CEO and costs related to search for new CEO. (6) Noncontrolling interest deferred tax valuation reversal.
(7) Write-up of inventory to fair value for the Jyco acquisition. (8) Costs incurred in relation to the Jyco acquisition.
TOP 30 / TOP 5
Note: Numbers subject to rounding
32
PASSION FOR PERFORMANCE
Non-GAAP Financial Measures
EBITDA and adjusted EBITDA are measures not recognized under Generally Accepted Accounting Principles (GAAP) which exclude certain non-cash and non-recurring items.
When analyzing the company’s operating performance, investors should use EBITDA and adjusted EBITDA in addition to, and not as alternatives for, net income (loss), operating income, or any other performance measure derived in accordance with GAAP, or as an alternative to cash flow from operating activities as a measure of the company’s performance. EBITDA and adjusted EBITDA have limitations as analytical tools and should not be considered in isolation or as substitutes for analysis of the company’s results of operations as reported under GAAP. Other companies may report EBITDA and adjusted
EBITDA differently and therefore Cooper Standard’s results may not be comparable to other similarly titled measures of other companies.
TOP 30 / TOP 5
33
PASSION FOR PERFORMANCE