Exhibit 99.1

Public Lender Presentation
March 18, 2014
CooperStandard
PASSION FOR PERFORMANCE
Forward-Looking Statements
This presentation includes “forward-looking statements” within the meaning of U.S. federal securities laws, and we intend that such forward-looking statements be subject to the safe harbor created thereby. We make forward-looking statements in this presentation and may make such statements in future filings with the SEC. We may also make forward-looking statements in our press releases or other public or stockholder communications. These forward-looking statements include statements concerning our plans, objectives, goals, strategies, future events, future revenue or performance, capital expenditures, financing needs, plans or intentions relating to acquisitions, business trends, and other information that is not historical information. When used in this presentation, the words “estimates,” “expects,” “anticipates,” “projects,” “plans,” “intends,” “believes,” “forecasts,” or future or conditional verbs, such as “will,” “should,” “could,” or “may,” and variations of such words or similar expressions are intended to identify forward-looking statements. All forward-looking statements, including, without limitation, management’s examination of historical operating trends and data are based upon our current expectations and various assumptions. Our expectations, beliefs, and projections are expressed in good faith and we believe there is a reasonable basis for them. However, no assurances can be made that these expectations, beliefs and projections will be achieved. Forward-looking statements are not guarantees of future performance and are subject to significant risks and uncertainties that may cause actual results or achievements to be materially different from the future results or achievements expressed or implied by the forward-looking statements.
There are a number of risks and uncertainties that could cause our actual results to differ materially from the forward-looking statements contained in this presentation. Important factors that could cause our actual results to differ materially from the forward-looking statements we make herein include, but are not limited to: cyclicality of the automotive industry with the possibility of further material contractions in automotive sales and production effecting the viability of our customers and financial condition of our customers; global economic uncertainty, particularly in Europe; loss of large customers or significant platforms; our ability to generate sufficient cash to service our indebtedness, and obtain future financing; operating and financial restrictions imposed on us by our bond indentures and credit agreement; our underfunded pension plans; supply shortages; escalating pricing pressures and decline of volume requirements from our customers; our ability to meet significant increases in demand; availability and increasing volatility in cost of raw materials or manufactured components; our ability to continue to compete successfully in the highly competitive automotive parts industry; risks associated with our non-U.S. operations; foreign currency exchange rate fluctuations; our ability to control the operations of joint ventures for our benefit; the effectiveness of our continuous improvement program and other cost savings plans; product liability and warranty and recall claims that may be brought against us; work stoppages or other labor conditions; natural disasters; our ability to meet our customers’ needs for new and improved products in a timely manner or cost-effective basis; the possibility that our acquisition strategy may not be successful; our legal rights to our intellectual property portfolio; environmental and other regulations; the possible volatility of our annual effective tax rate; significant changes in discount rates and the actual return on pension assets; the possibility of future impairment charges to our goodwill and long-lived assets; and the interests of our major stockholders may conflict with our interests.
There may be other factors that may cause our actual results to differ materially from the forward-looking statements. All forward-looking statements attributable to us or persons acting on our behalf apply only as of the date of this presentation and are expressly qualified in their entirety by the cautionary statements included herein. We undertake no obligation to update or revise forward-looking statements to reflect events or circumstances that arise after the date made or to reflect the occurrence of unanticipated events.
PASSION FOR PERFORMANCE 2
Today’s Presentation
Transaction Overview
- Deutsche Bank
Cooper Standard Overview
- Jeff Edwards, Chairman and Chief Executive Officer, Cooper Standard
Financial Overview and Guidance
- Allen Campbell, Executive Vice President and Chief Financial Officer, Cooper Standard
Syndication Overview
- Deutsche Bank
PASSION FOR PERFORMANCE 3
Transaction Overview
Deutsche Bank
PASSION FOR PERFORMANCE 4
Transaction Overview
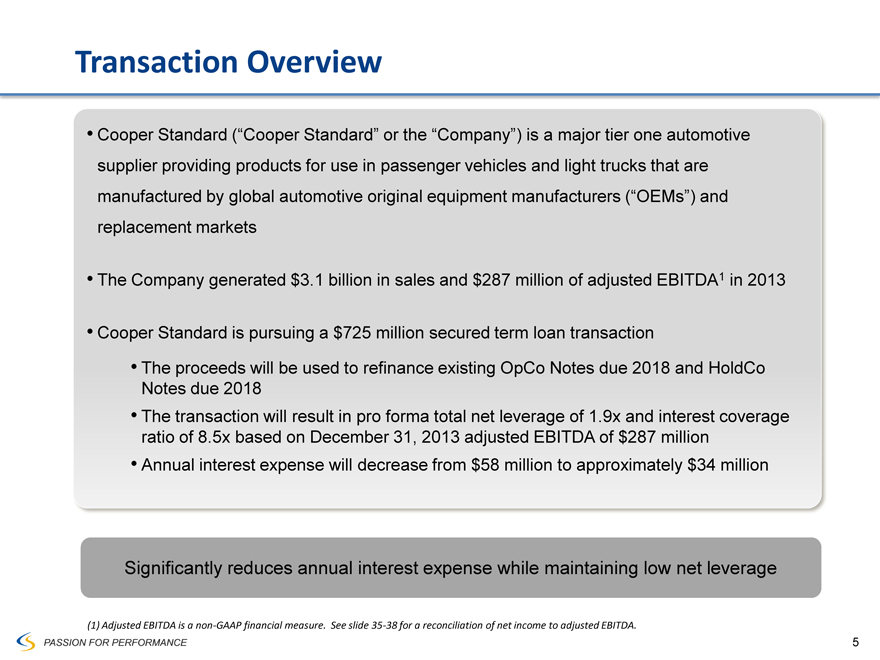
Cooper Standard (“Cooper Standard” or the “Company”) is a major tier one automotive supplier providing products for use in passenger vehicles and light trucks that are manufactured by global automotive original equipment manufacturers (“OEMs”) and replacement markets
The Company generated $3.1 billion in sales and $287 million of adjusted EBITDA1 in 2013
Cooper Standard is pursuing a $725 million secured term loan transaction
The proceeds will be used to refinance existing OpCo Notes due 2018 and HoldCo Notes due 2018
The transaction will result in pro forma total net leverage of 1.9x and interest coverage ratio of 8.5x based on December 31, 2013 adjusted EBITDA of $287 million
Annual interest expense will decrease from $58 million to approximately $34 million
Significantly reduces annual interest expense while maintaining low net leverage
(1) Adjusted EBITDA is a non-GAAP financial measure. See slide 35-38 for a reconciliation of net income to adjusted EBITDA.
PASSION FOR PERFORMANCE 5
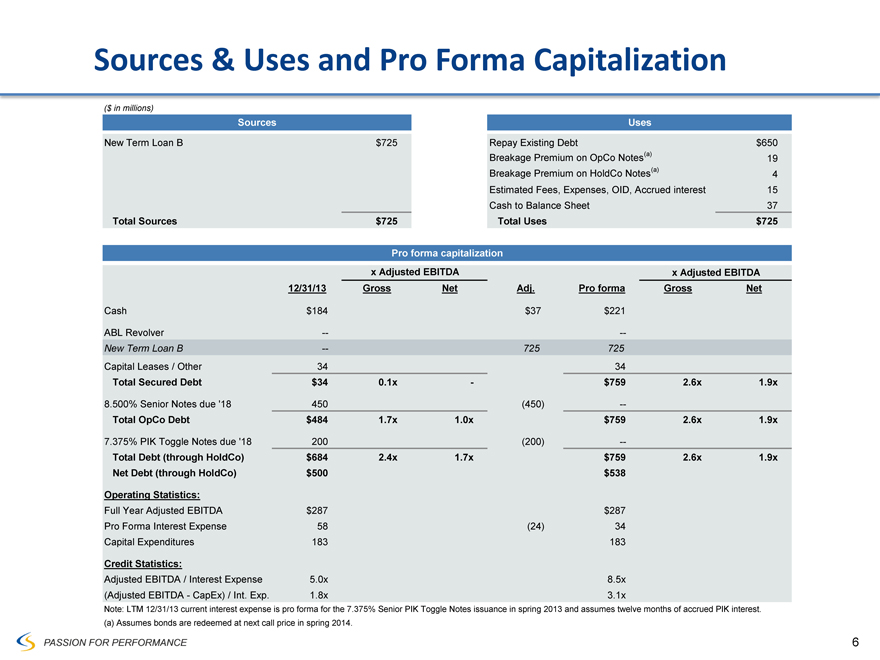
Sources & Uses and Pro Forma Capitalization
($ in millions)
Sources
New Term Loan B $725
Total Sources $725
Uses
Repay Existing Debt $650
Breakage Premium on OpCo Notes(a) 19
Breakage Premium on HoldCo Notes(a) 4
Estimated Fees, Expenses, OID, Accrued interest 15
Cash to Balance Sheet 37
Total Uses $725
Pro forma capitalization
x Adjusted EBITDA x Adjusted EBITDA
12/31/13 Gross Net Adj. Pro forma Gross Net
Cash $184 $37 $221
ABL Revolver -- --
New Term Loan B -- 725 725
Capital Leases / Other 34 34
Total Secured Debt $34 0.1x - $759 2.6x 1.9x
8.500% Senior Notes due ‘18 450 (450) --
Total OpCo Debt $484 1.7x 1.0x $759 2.6x 1.9x
7.375% PIK Toggle Notes due ‘18 200 (200) --
Total Debt (through HoldCo) $684 2.4x 1.7x $759 2.6x 1.9x
Net Debt (through HoldCo) $500 $538
Operating Statistics:
Full Year Adjusted EBITDA $287 $287
Pro Forma Interest Expense 58 (24) 34
Capital Expenditures 183 183
Credit Statistics:
Adjusted EBITDA / Interest Expense 5.0x 8.5x
(Adjusted EBITDA - CapEx) / Int. Exp. 1.8x 3.1x
Note: LTM 12/31/13 current interest expense is pro forma for the 7.375% Senior PIK Toggle Notes issuance in spring 2013 and assumes twelve months of accrued PIK interest. (a) Assumes bonds are redeemed at next call price in spring 2014.
PASSION FOR PERFORMANCE 6
Jeff Edwards
Chairman and Chief Executive Officer
Cooper Standard Overview
PASSION FOR PERFORMANCE 7
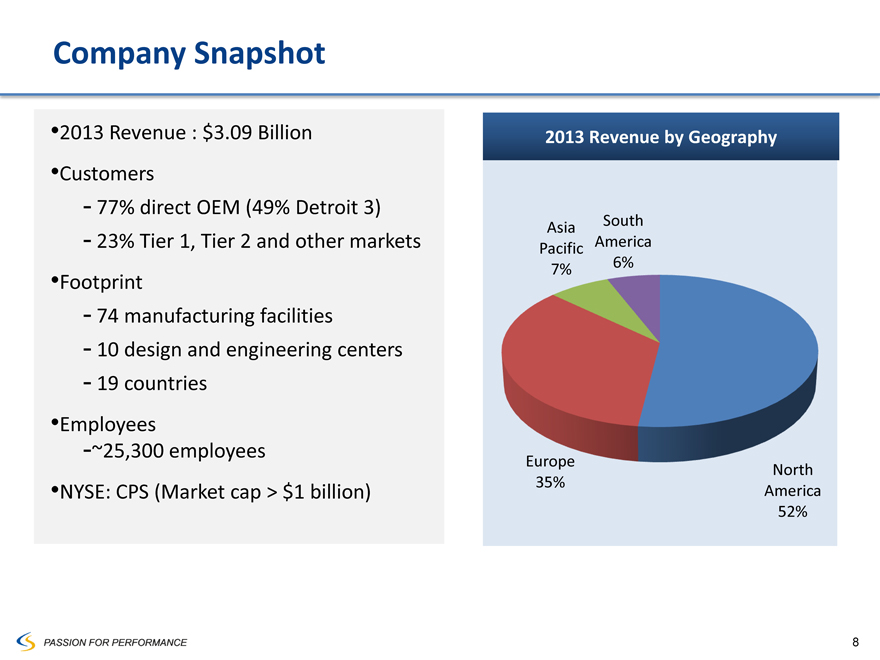
Company Snapshot
2013 Revenue : $3.09 Billion
Customers
- 77% direct OEM (49% Detroit 3)
- 23% Tier 1, Tier 2 and other markets
Footprint
- 74 manufacturing facilities
- 10 design and engineering centers
- 19 countries
Employees -~25,300 employees
NYSE: CPS (Market cap > $1 billion)
2013 Revenue by Geography
Asia Pacific 7%
South America 6%
Europe 35%
North America 52%
PASSION FOR PERFORMANCE 8
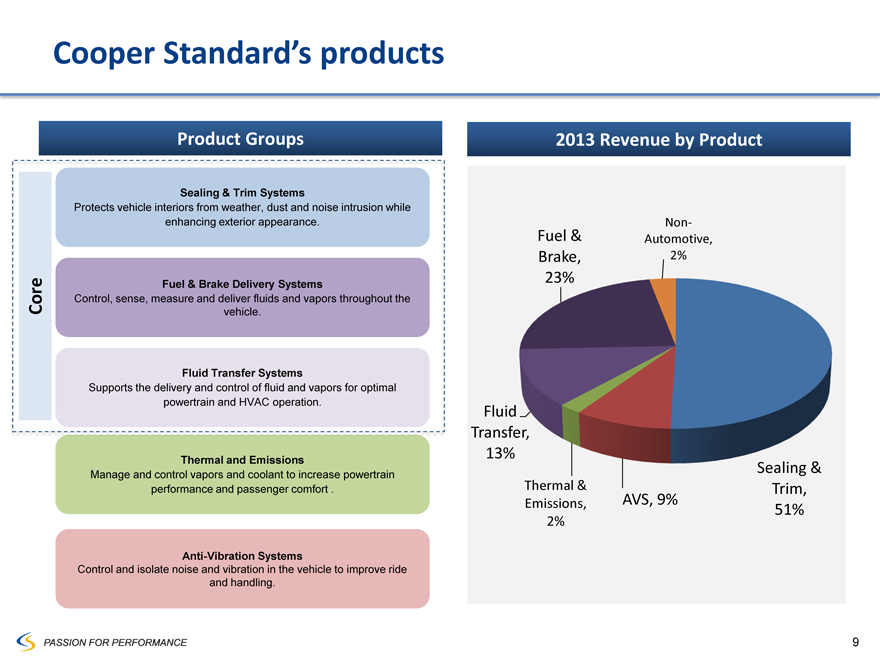
Cooper Standard’s products
Core
Product Groups
Sealing & Trim Systems
Protects vehicle interiors from weather, dust and noise intrusion while enhancing exterior appearance.
Fuel & Brake Delivery Systems
Control, sense, measure and deliver fluids and vapors throughout the vehicle.
Fluid Transfer Systems
Supports the delivery and control of fluid and vapors for optimal powertrain and HVAC operation.
Thermal and Emissions
Manage and control vapors and coolant to increase powertrain performance and passenger comfort .
Anti-Vibration Systems
Control and isolate noise and vibration in the vehicle to improve ride and handling.
2013 Revenue by Product
Fuel & Brake, 23%
Non-Automotive, 2%
Fluid Transfer, 13%
Thermal & Emissions, 2%
AVS, 9%
Sealing & Trim, 51%
PASSION FOR PERFORMANCE 9
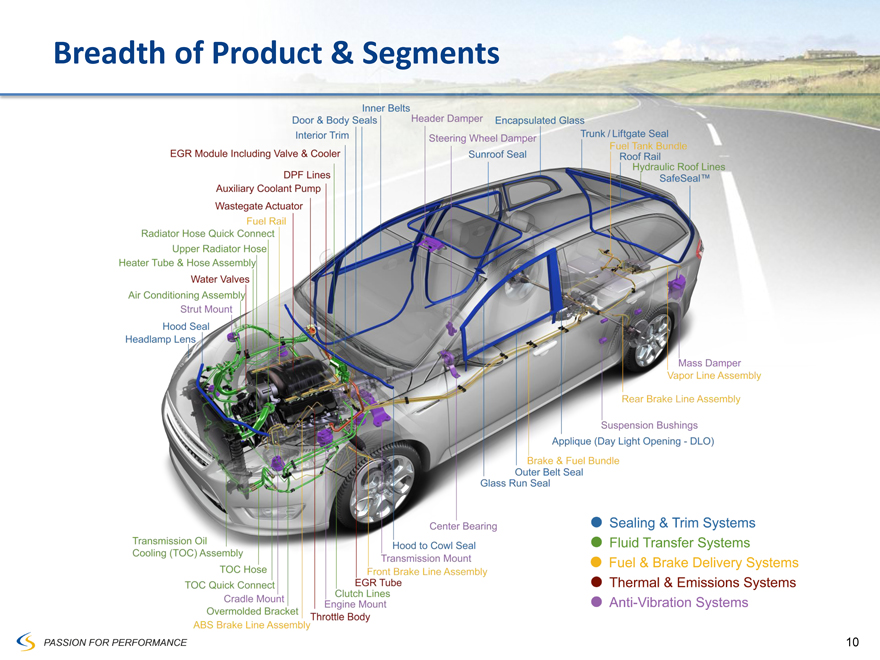
Breadth of Product & Segments
Inner Belts
Door & Body Seals
Interior Trim
EGR Module Including Valve & Cooler
DPF Lines
Auxiliary Coolant Pump
Wastegate Actuator
Fuel Rail
Radiator Hose Quick Connect
Upper Radiator Hose
Heater Tube & Hose Assembly
Water Valves
Air Conditioning Assembly
Strut Mount
Hood seal
Headlamp Lens
Transmission Oil
Cooling (TOC) Assembly
TOC Hose
TOC Quick Connect
Cradle Mount
Overmolded Bracket
ABS Brake Line Assembly
Throttle Body
Engine Mount
Clutch Lines
EGR Tube
Front Brake Line Assembly
Transmission Mount
Hood to Cowl Seal
Center Bearing
Glass Run Seal
Outer Belt Seal
Brake & Fuel Bundle
Applique (Day Light Opening - DLO)
Suspension Bushings
Rear Brake Line Assembly
Vapor Line Assembly
Mass Damper
SafeSealTM
Hydraulic Roof Lines
Roof Tail
Fuel Tank Bundle
Trunk / Liftgate Seal
Encapsulated Glass
Sunroof Seal
Steering Wheel Damper
Header Damper
Sealing & Trim Systems
Fluid Transfer Systems
Fuel & Brake Delivery Systems
Thermal & Emissions Systems
Anti-Vibration Systems
PASSION FOR PERFORMANCE 10
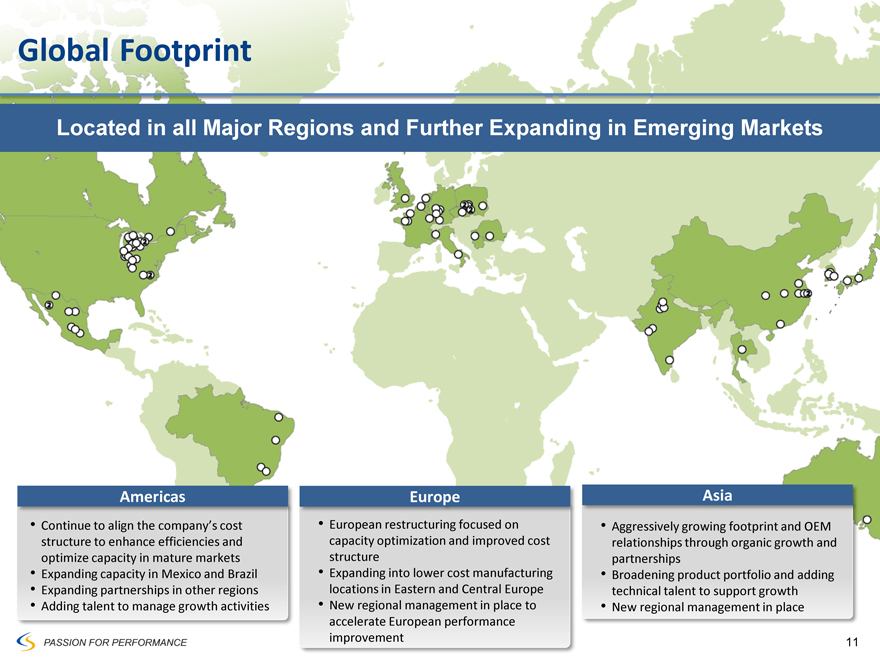
Global Footprint
Located in all Major Regions and Further Expanding in Emerging Markets
Americas
Continue to align the company’s cost structure to enhance efficiencies and optimize capacity in mature markets
Expanding capacity in Mexico and Brazil
Expanding partnerships in other regions
Adding talent to manage growth activities
Europe
European restructuring focused on capacity optimization and improved cost structure
Expanding into lower cost manufacturing locations in Eastern and Central Europe
New regional management in place to accelerate European performance improvement
Asia
Aggressively growing footprint and OEM relationships through organic growth and partnerships
Broadening product portfolio and adding technical talent to support growth
New regional management in place
PASSION FOR PERFORMANCE 11
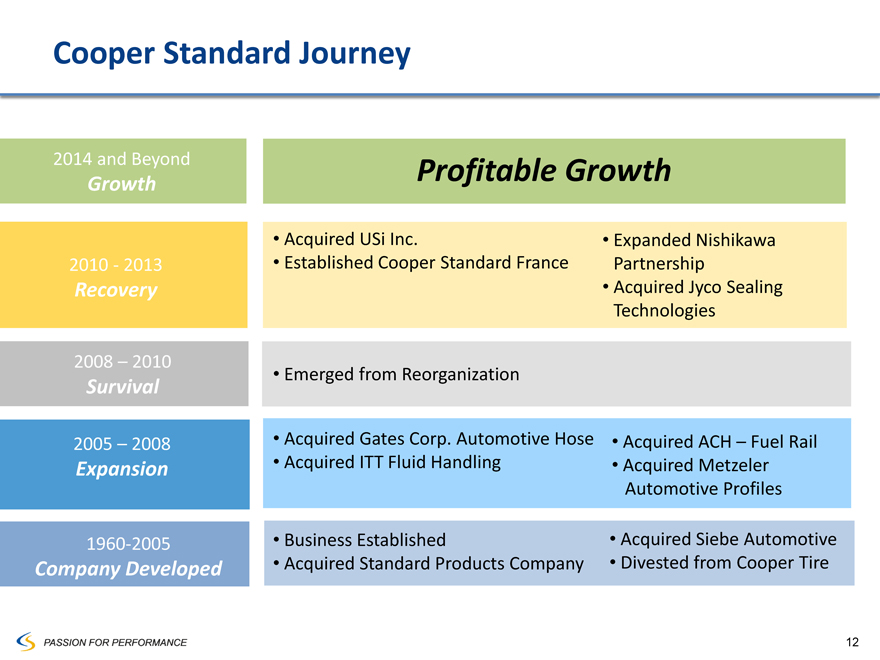
Cooper Standard Journey
2014 and Beyond Growth Profitable Growth
2010 - 2013 Recovery
Acquired USi Inc.
Expanded Nishikawa Partnership
Established Cooper Standard France
Acquired Jyco Sealing Technologies
2008 – 2010 Survival
Emerged from Reorganization
2005 – 2008 Expansion
Acquired Gates Corp. Automotive Hose
Acquired ACH – Fuel Rail
Acquired ITT Fluid Handling
Acquired Metzeler Automotive Profiles
1960-2005 Company Developed
Business Established
Acquired Siebe Automotive
Acquired Standard Products Company
Divested from Cooper Tire
PASSION FOR PERFORMANCE 12
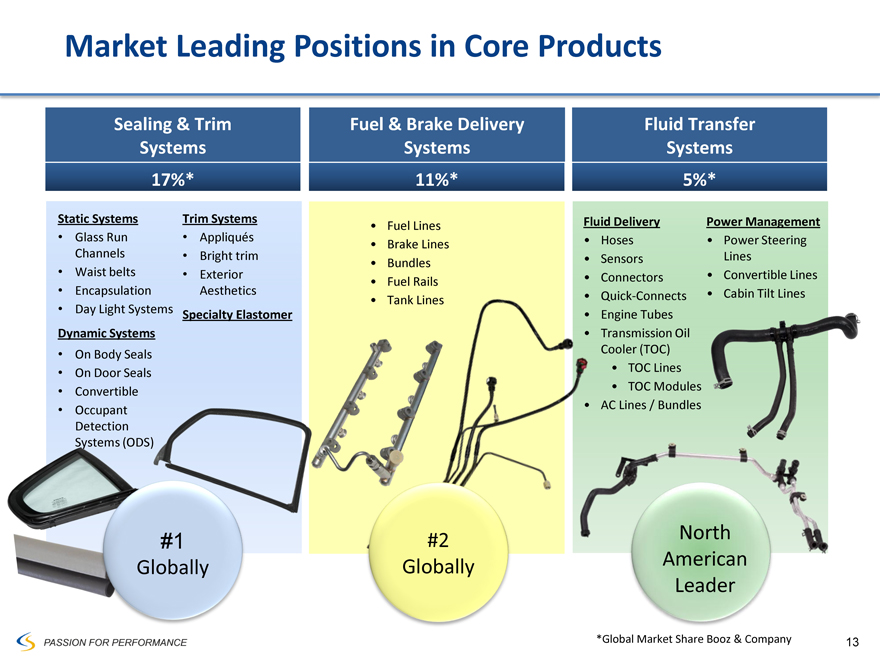
Market Leading Positions in Core Products
Sealing & Trim Systems 17%*
Static Systems
Glass Run Channels
Waist belts
Encapsulation
Day Light Systems
Dynamic Systems
On Body Seals
On Door Seals
Convertible
Occupant Detection Systems (ODS)
Trim Systems
Appliqués
Bright trim
Exterior Aesthetics
Specialty Elastomer
#1
Globally
Fuel & Brake Delivery Systems 11%*
Fuel Lines
Brake Lines
Bundles
Fuel Rails
Tank Lines
#2 Globally
Fluid Transfer Systems 5%*
Fluid Delivery
Hoses
Sensors
Connectors
Quick-Connects Engine Tubes Transmission Oil Cooler (TOC)
TOC Lines
TOC Modules
AC Lines / Bundles
Power Management
Power Steering Lines
Convertible Lines
Cabin Tilt Lines
North
American Leader
PASSION FOR PERFORMANCE *Global Market Share Booz & Company 13
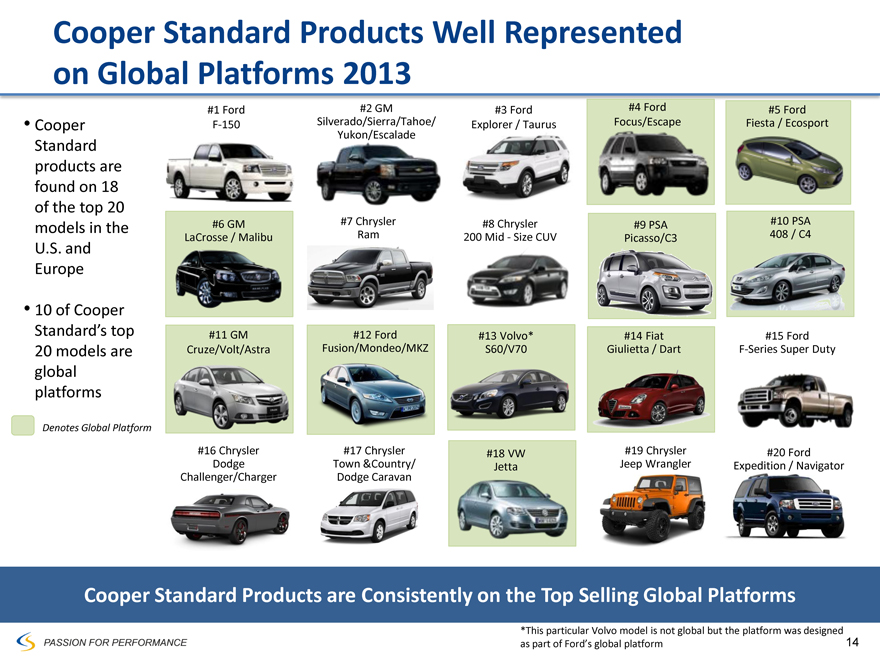
Cooper Standard Products Well Represented on Global Platforms 2013
Cooper Standard products are found on 18 of the top 20 models in the U.S. and Europe
10 of Cooper Standard’s top 20 models are global platforms
Denotes Global Platform
#1 Ford #2 GM #3 Ford #4 Ford #5 Ford
F-150 Silverado/Sierra/Tahoe Explorer /Taurus Focus/Escape Fiesta /Ecosport
Yukon/Escalade
#6 GM #7 Chrysler #8 Chrysler #9 PSA #10 PSA
LaCrosse / Malibu Ram 200 Mid - Size CUV Picasso/C3 408 / C4
#11 GM #12 Ford #13 Volvo* #14 Fiat #15 Ford
Cruze/Volt/Astra Fusion/Mondeo/MKZ S60/V70 Giulietta / Dart F-Series Super Duty
#16 Chrysler #17 Chrysler #18 VW #19 Chrysler #20 Ford
Dodge Town &Country/Jetta Jeep Wrangler Expedition /Navigator
Challenger/Charger Dodge Caravan
Cooper Standard Products are Consistently on the Top Selling Global Platforms
| | |
PASSION FOR PERFORMANCE | | *This particular Volvo model is not global but the platform was designed |
| | | as part of Ford’s global platform |
14
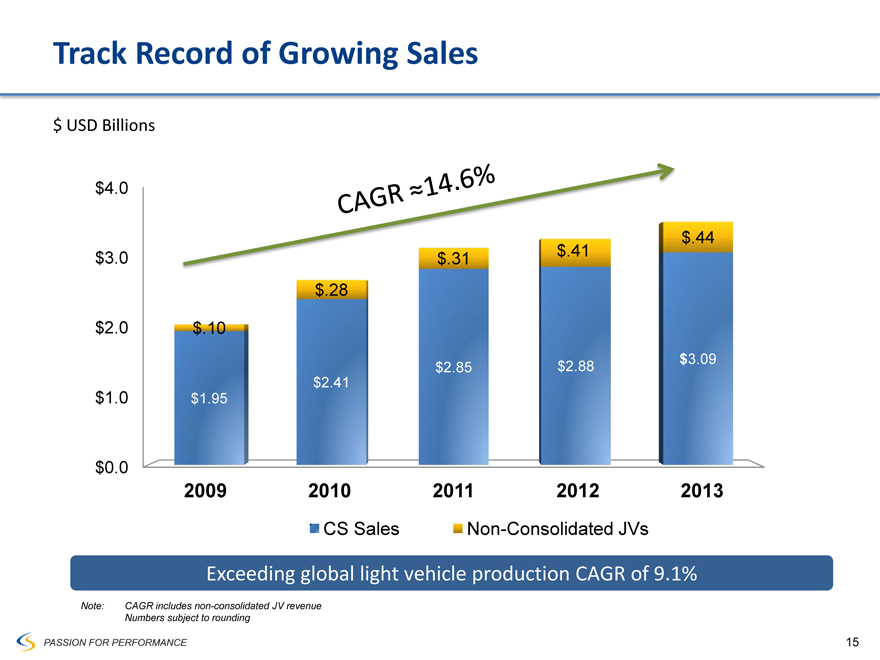
Track Record of Growing Sales
CAGR=14.6%
$ USD Billions
$4.0
$3.0
$2.0
$1.0
$0.0
$.44 $.41 $.31 $.28
$.10
$3.09
$2.85 $2.88
$2.41
$1.95
2009 2010 2011 2012 2013
CS Sales Non-Consolidated JVs
Exceeding global light vehicle production CAGR of 9.1%
Note: CAGR includes non-consolidated JV revenue Numbers subject to rounding
15
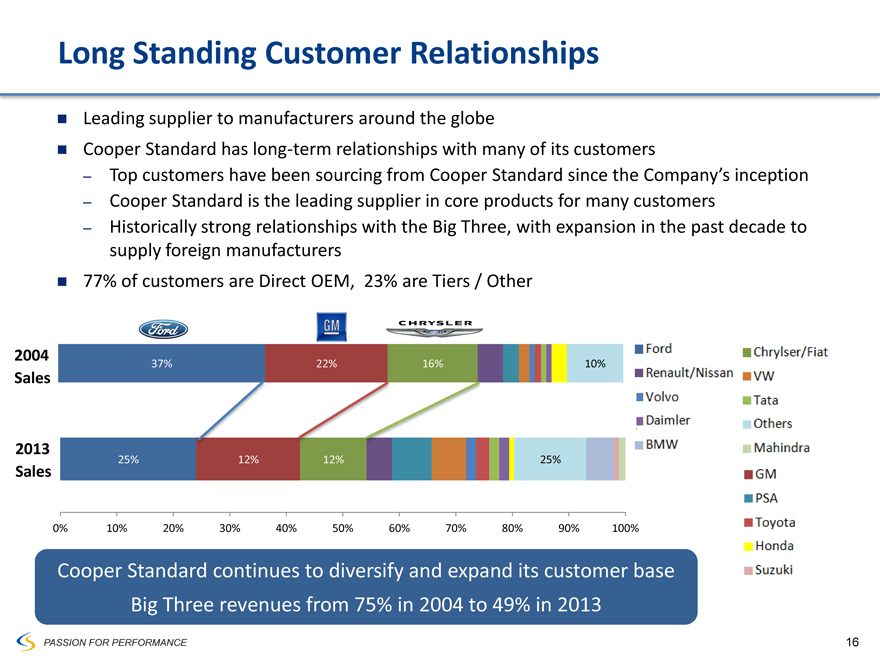
Long Standing Customer Relationships
Leading supplier to manufacturers around the globe
Cooper Standard has long-term relationships with many of its customers
– Top customers have been sourcing from Cooper Standard since the Company’s inception
– Cooper Standard is the leading supplier in core products for many customers
– Historically strong relationships with the Big Three, with expansion in the past decade to supply foreign manufacturers
77% of customers are Direct OEM, 23% are Tiers / Other
| | | | | | | | |
2004 | | 37% | | 22% | | 16% | | 10% |
Sales | | | | | | | | |
2013 | | | | | | | | |
| | | 25% | | 12% | | 12% | | 25% |
Sales | | | | | | | | |
0% 10% 20% 30% 40% 50% 60% 70% 80% 90% 100%
Ford
Renault/Nissan
Volvo
Daimler
BMW
Chrysler
VW
Tata
Others
Mahindra
GM
PSA
Toyota
Honda
Suzuki
Cooper Standard continues to diversify and expand its customer base Big Three revenues from 75% in 2004 to 49% in 2013
PASSION FOR PERFORMANCE
16
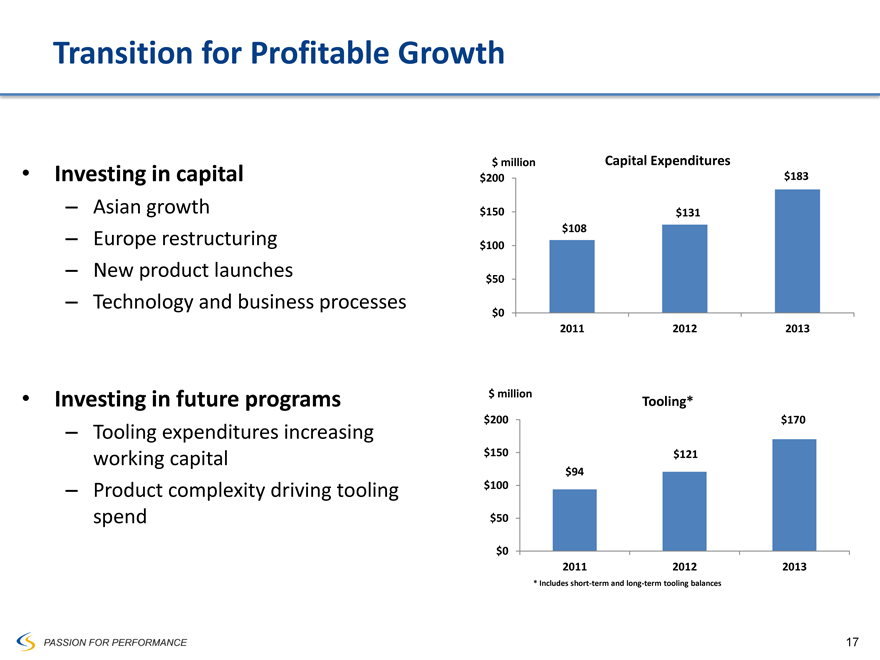
Transition for Profitable Growth
Investing in capital
– Asian growth
– Europe restructuring
– New product launches
– Technology and business processes
Investing in future programs
– Tooling expenditures increasing working capital
– Product complexity driving tooling spend
$ million Capital Expenditures $200 $183
$150 $131 $108 $100
$50
$0
2011 2012 2013
$ million
Tooling* $200 $170
$150 $121 $94 $100
$50
$0
2011 2012 2013
* Includes short-term and long-term tooling balances
PASSION FOR PERFORMANCE
17
Transition for Profitable Growth
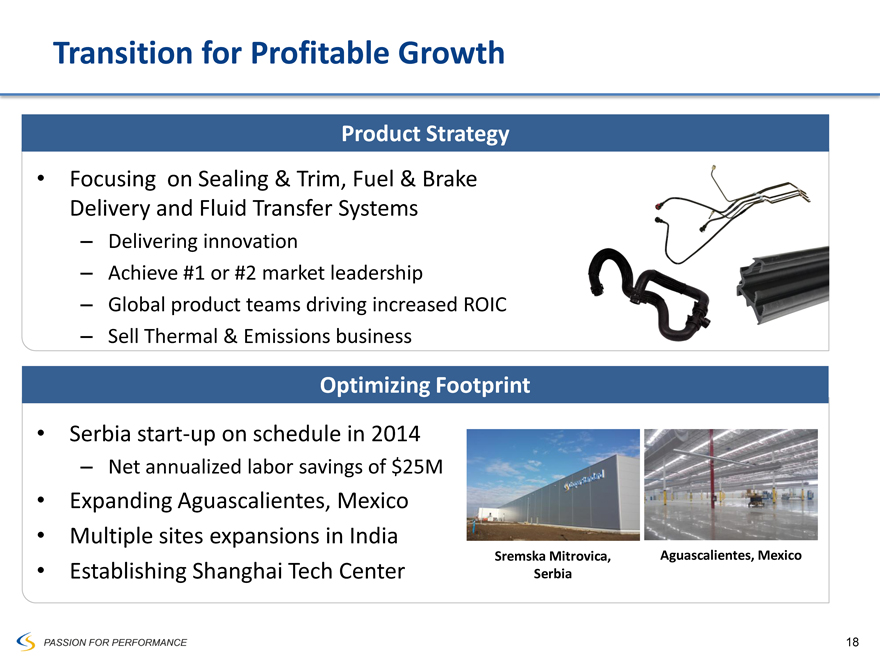
Product Strategy
Focusing on Sealing & Trim, Fuel & Brake Delivery and Fluid Transfer Systems
– Delivering innovation
– Achieve #1 or #2 market leadership
– Global product teams driving increased ROIC
– Sell Thermal & Emissions business
Optimizing Footprint
Serbia start-up on schedule in 2014
– Net annualized labor savings of $25M
Expanding Aguascalientes, Mexico
Multiple sites expansions in India
Establishing Shanghai Tech Center
Sremska Mitrovica,
Aguascalientes, Mexico
Serbia
PASSION FOR PERFORMANCE
18
Allen Campbell
Executive Vice President and
Chief Financial Officer
Financial Overview and Guidance
PASSION FOR PERFORMANCE
19
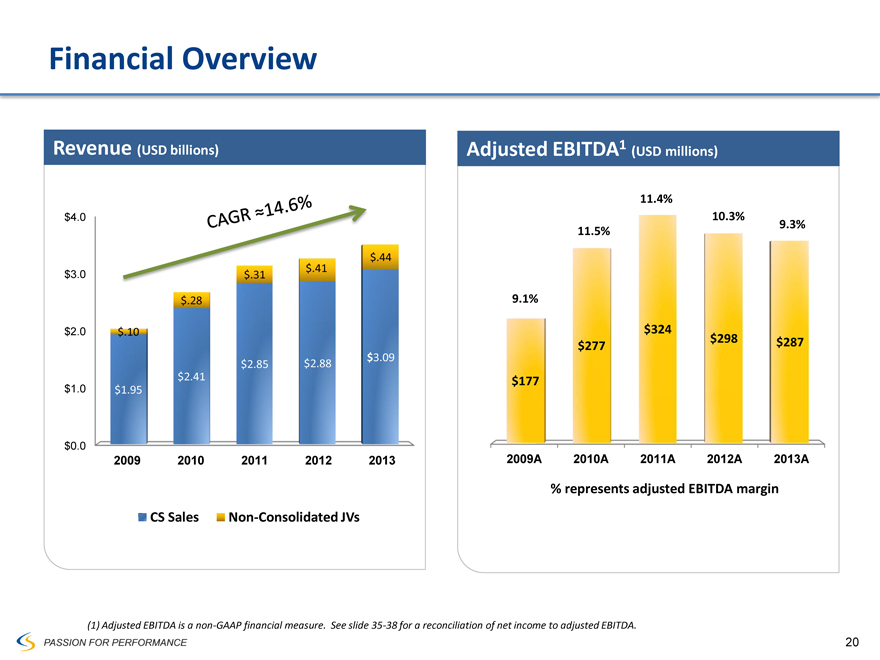
Financial Overview
Revenue (USD billions)
CAGR=14.6%
$4.0
$3.0
$2.0
$1.0
$0.0
$.44
$.31 $.41
$.28
$.10
$2.85 $2.88 $3.09
$2.41
$1.95
2009 2010 2011 2012 2013
CS Sales Non-Consolidated JVs
Adjusted EBITDA1
(USD millions)
11.4%
10.3%
9.3%
11.5%
9.1%
$324 $298 $287 $277
$177
2009A 2010A 2011A 2012A 2013A
% represents adjusted EBITDA margin
(1) Adjusted EBITDA is a non-GAAP financial measure. See slide 35-38 for a reconciliation of net income to adjusted EBITDA.
20 PASSION FOR PERFORMANCE
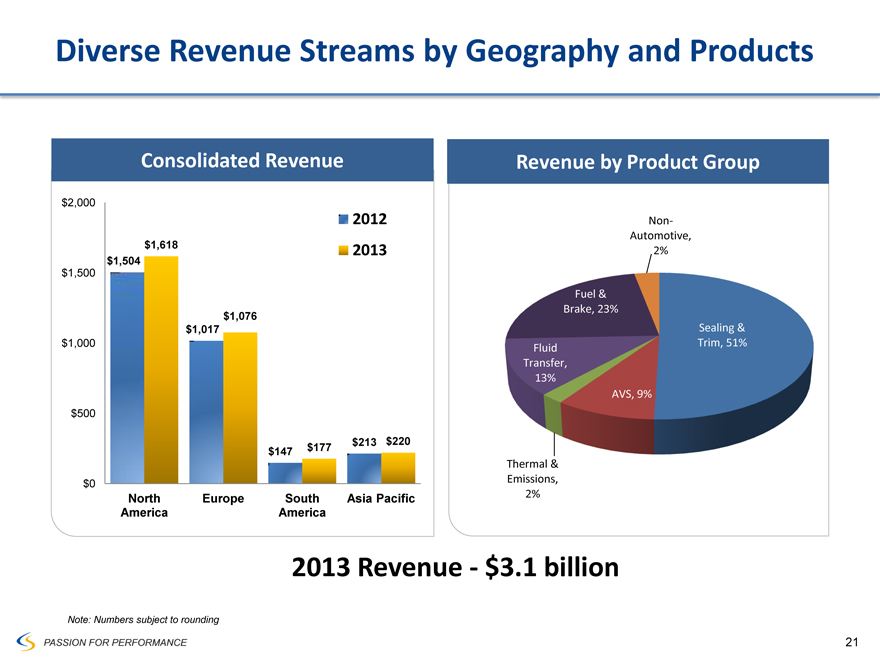
Diverse Revenue Streams by Geography and Products
Consolidated Revenue
2012
2013
$2,000 $1,500 $1,000 $500 $0
$1,618 $1,504
$1,076 $1,017
$213 $220 $147 $177
North Europe South America Asia Pacific America
Revenue by Product Group
Non-Automotive, 2%
Fuel & Brake, 23%
Sealing & Trim, 51% Fluid Transfer, 13% AVS, 9%
Thermal & Emissions, 2%
2013 Revenue - $3.1 billion
Note: Numbers subject to rounding
PASSION FOR PERFORMANCE
21
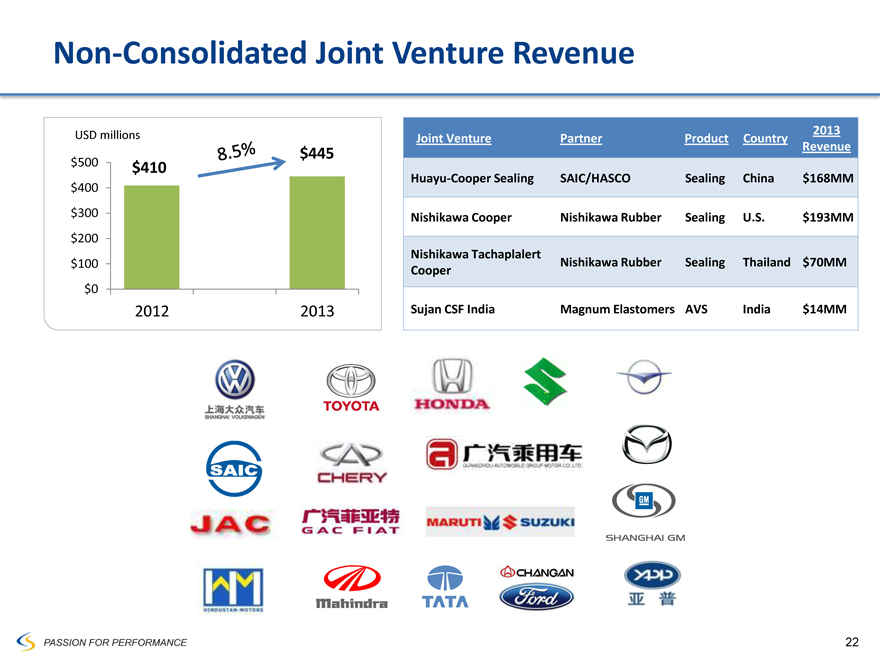
Non-Consolidated Joint Venture Revenue
8.5%
USD millions
$445
$500 $410 $400
$300 $200 $100
$0
2012 2013
Joint Venture
Partner
Product
Country
2013 Revenue
Huayu-Cooper Sealing
SAIC/HASCO
Sealing
China
$168MM
Nishikawa Cooper
Nishikawa Rubber
Sealing
U.S.
$193MM
Nishikawa Tachaplalert Cooper
Nishikawa Rubber
Sealing
Thailand
$70MM
Sujan CSF India
Magnum Elastomers
AVS
India
$14MM
SHANGHAI VOLKSWAGEN
TOYOTA
HONDA
SAIC
CHERY
JAC
GAC FIAT
MARUTI SUZUKI
SHANGHAI GM
HINDUSTAN-MOTORS
Mahindra
TATA
CHANGAN Ford
PASSION FOR PERFORMANCE
22
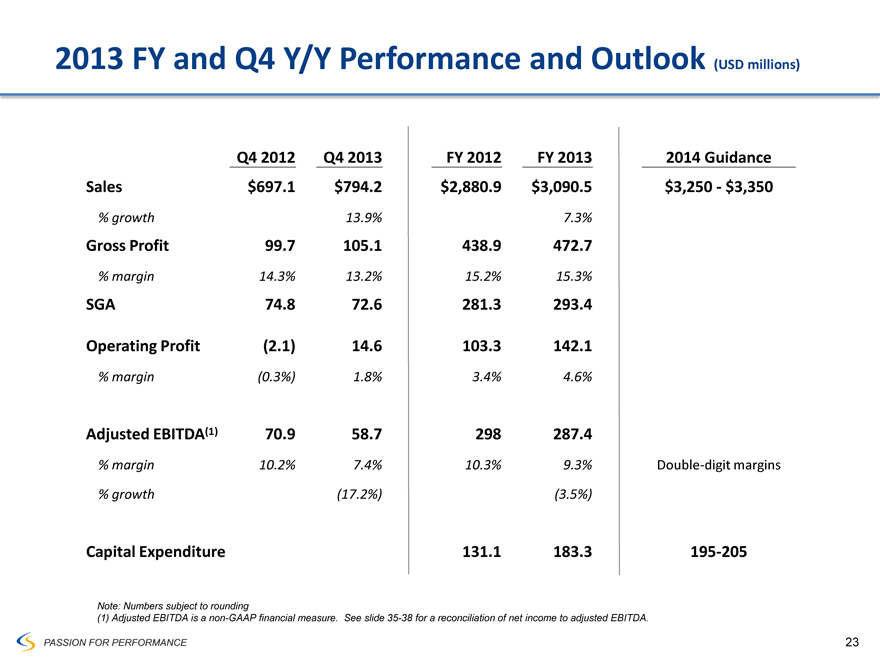
2013 FY and Q4 Y/Y Performance and Outlook (USD millions)
Q4 2012 Q4 2013 FY 2012 FY 2013 2014 Guidance
Sales $697.1 $794.2 $2,880.9 $3,090.5 $3,250 - $3,350
% growth 13.9% 7.3%
Gross Profit 99.7 105.1 438.9 472.7
% margin 14.3% 13.2% 15.2% 15.3%
SGA 74.8 72.6 281.3 293.4
Operating Profit (2.1) 14.6 103.3 142.1
% margin (0.3%) 1.8% 3.4% 4.6%
Adjusted EBITDA(1) 70.9 58.7 298 287.4
% margin 10.2% 7.4% 10.3% 9.3%Double-digit margins
% growth (17.2%) (3.5%)
Capital Expenditure 131.1 183.3 195-205
Note: Numbers subject to rounding
(1) Adjusted EBITDA is a non-GAAP financial measure. See slide 35-38 for a reconciliation of net income to adjusted EBITDA.
PASSION FOR PERFORMANCE
23
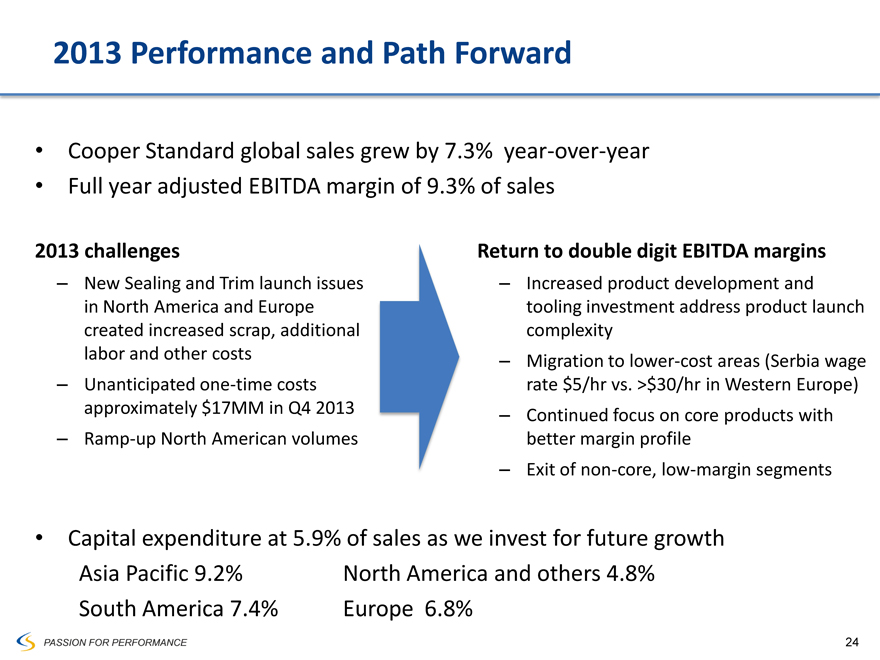
2013 Performance and Path Forward
Cooper Standard global sales grew by 7.3% year-over-year
Full year adjusted EBITDA margin of 9.3% of sales
2013 challenges
– New Sealing and Trim launch issues in North America and Europe created increased scrap, additional labor and other costs
– Unanticipated one-time costs approximately $17MM in Q4 2013
– Ramp-up North American volumes
Return to double digit EBITDA margins
– Increased product development and tooling investment address product launch complexity
– Migration to lower-cost areas (Serbia wage rate $5/hr vs. >$30/hr in Western Europe)
– Continued focus on core products with better margin profile
– Exit of non-core, low-margin segments
Capital expenditure at 5.9% of sales as we invest for future growth
Asia Pacific 9.2% North America and others 4.8% South America 7.4% Europe 6.8%
PASSION FOR PERFORMANCE
24
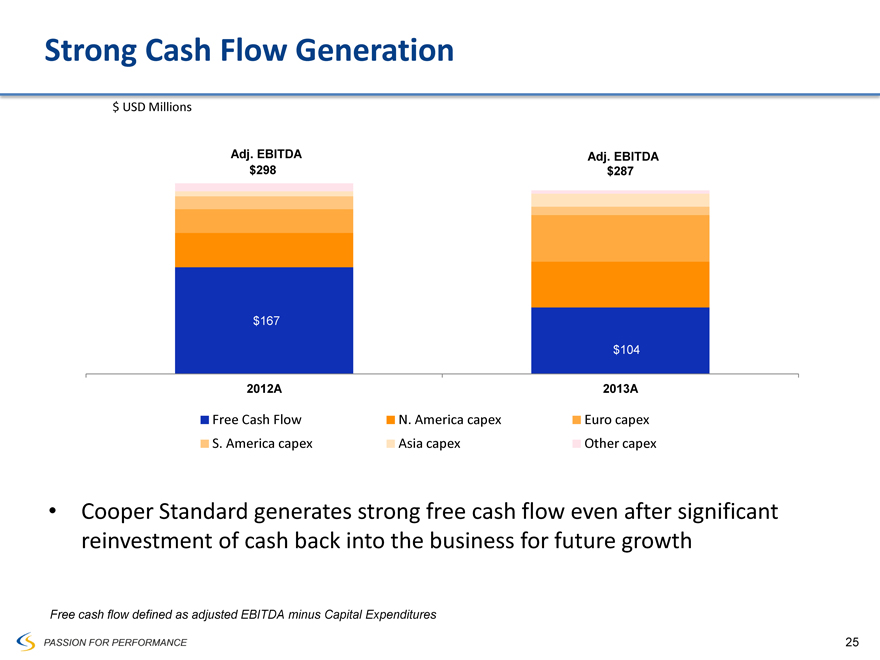
Strong Cash Flow Generation
$ USD Millions
Adj. EBITDA $298
$167
2012A
Adj. EBITDA $287
$104
2013A
Free Cash Flow N. America capex Euro capex S. America capex Asia capex Other capex
Cooper Standard generates strong free cash flow even after significant reinvestment of cash back into the business for future growth
Free cash flow defined as adjusted EBITDA minus Capital Expenditures
PASSION FOR PERFORMANCE
25
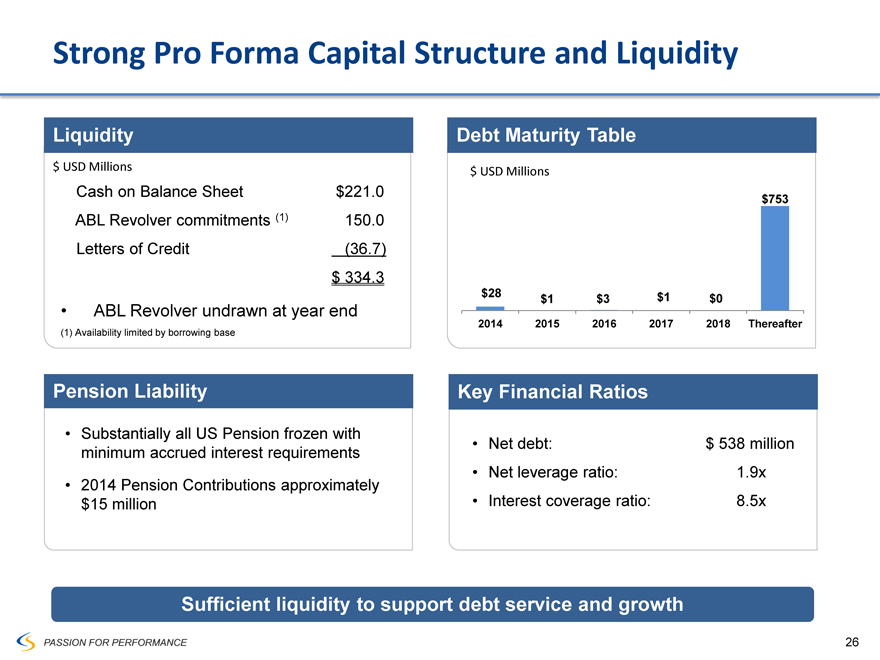
Strong Pro Forma Capital Structure and Liquidity
Liquidity
$ USD Millions
Cash on Balance Sheet
$221.0
ABL Revolver commitments (1)
150.0
Letters of Credit
(36.7)
$334.3
ABL Revolver undrawn at year end
(1) Availability limited by borrowing base
Debt Maturity Table
$ USD Millions
$753
$28 $1 $0
$1 $3
2014 2015 2016 2017 2018 Thereafter
Pension Liability
Substantially all US Pension frozen with minimum accrued interest requirements
2014 Pension Contributions approximately $15 million
Key Financial Ratios
Net debt: $ 538 million
Net leverage ratio: 1.9x
Interest coverage ratio: 8.5x
Sufficient liquidity to support debt service and growth
PASSION FOR PERFORMANCE
26
Summary
Focused on our customers to win global platform via footprint and technical center alignment
– Building centers of excellence
Stabilization of North America and Europe businesses performance
– Addressing launch and product complexity in Sealing & Trim business
– Successfully executing new launches
Continue to make necessary infrastructure / capacity investments
– Asia production strategy (China, India, SE Asia)
– Serbia expansion and optimizing European manufacturing footprint (Romania and Poland)
Evaluate partnerships, especially in Asia, to advance our strategic plan
Focused on returning to double-digit adjusted EBITDA margins
PASSION FOR PERFORMANCE 27
Cooper Standard Strengths
1 Market leading positions in primary products
2 Extensive global footprint
3 Strong cash flow generation
4 Diverse revenue streams by geography, customers and product
5 Long standing customer relationships
6 Experienced and disciplined management team
CooperStandard
PASSION FOR PERFORMANCE 28

Syndication Overview
Deutsche Bank
29
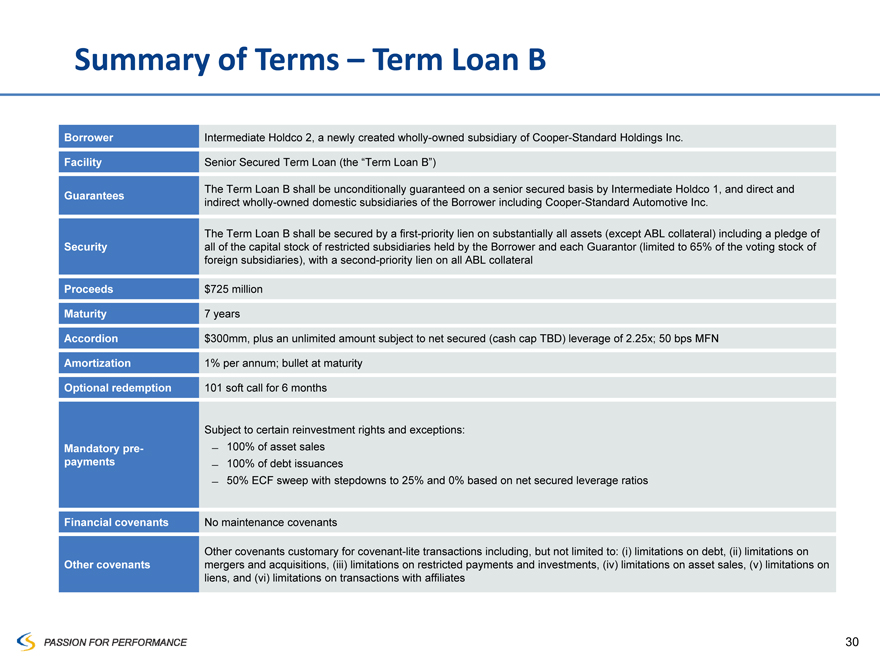
Summary of Terms – Term Loan B
Borrower Intermediate Holdco 2, a newly created wholly-owned subsidiary of Cooper-Standard Holdings Inc.
Facility Senior Secured Term Loan (the “Term Loan B”)
The Term Loan B shall be unconditionally guaranteed on a senior secured basis by Intermediate Holdco 1, and direct and
Guarantees indirect wholly-owned domestic subsidiaries of the Borrower including Cooper-Standard Automotive Inc.
The Term Loan B shall be secured by a first-priority lien on substantially all assets (except ABL collateral) including a pledge of
Security all of the capital stock of restricted subsidiaries held by the Borrower and each Guarantor (limited to 65% of the voting stock of foreign subsidiaries), with a second-priority lien on all ABL collateral
Proceeds $725 million
Maturity 7 years
Accordion $300mm, plus an unlimited amount subject to net secured (cash cap TBD) leverage of 2.25x; 50 bps MFN
Amortization 1% per annum; bullet at maturity
Optional redemption 101 soft call for 6 months
Subject to certain reinvestment rights and exceptions:
Mandatory pre- 100% of asset sales
payments 100% of debt issuances
50% ECF sweep with stepdowns to 25% and 0% based on net secured leverage ratios
Financial covenants No maintenance covenants
Other covenants customary for covenant-lite transactions including, but not limited to: (i) limitations on debt, (ii) limitations on
Other covenants mergers and acquisitions, (iii) limitations on restricted payments and investments, (iv) limitations on asset sales, (v) limitations on liens, and (vi) limitations on transactions with affiliates
30
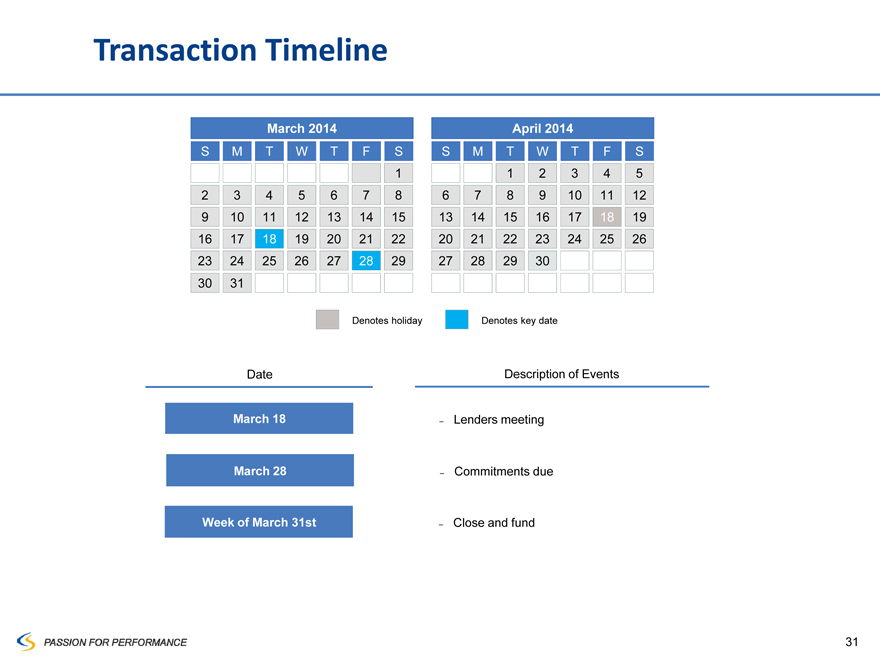
Transaction Timeline
March 2014
S M T W T F S 1
2 3 4 5 6 7 8
9 10 11 12 13 14 15
16 17 18 19 20 21 22
23 24 25 26 27 28 29
30 31
April 2014
S M T W T F S
1 2 3 4 5
6 7 8 9 10 11 12
13 14 15 16 17 18 19
20 21 22 23 24 25 26
27 28 29 30
Denotes holiday Denotes key date
Date
March 18 March 28 Week of March 31st
Description of Events
– Lenders meeting
– Commitments due
– Close and fund
31

Q&A
32

Appendix
PASSION FOR PERFORMANCE 33
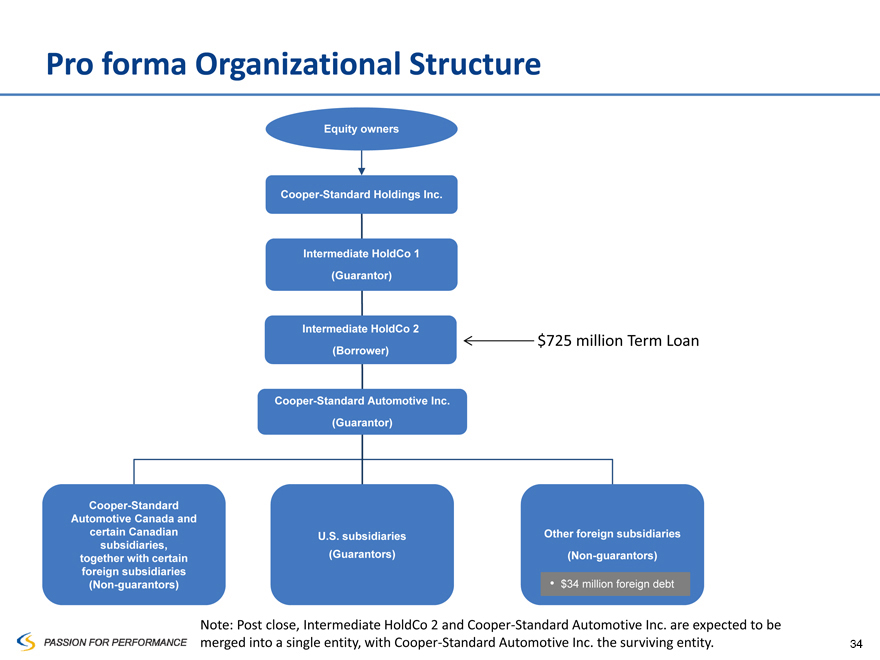
Pro forma Organizational Structure
Equity owners
Cooper-Standard Holdings Inc.
Intermediate HoldCo 1 (Guarantor)
Intermediate HoldCo 2 $725 million Term Loan
(Borrower)
Cooper-Standard Automotive Inc. (Guarantor)
Cooper-Standard Automotive Canada and certain Canadian U.S. subsidiaries Other foreign subsidiaries subsidiaries, together with certain (Guarantors) (Non-guarantors) foreign subsidiaries (Non-guarantors) $34 million foreign debt
Note: Post close, Intermediate HoldCo 2 and Cooper-Standard Automotive Inc. are expected to be merged into a single entity, with Cooper-Standard Automotive Inc. the surviving entity.
33
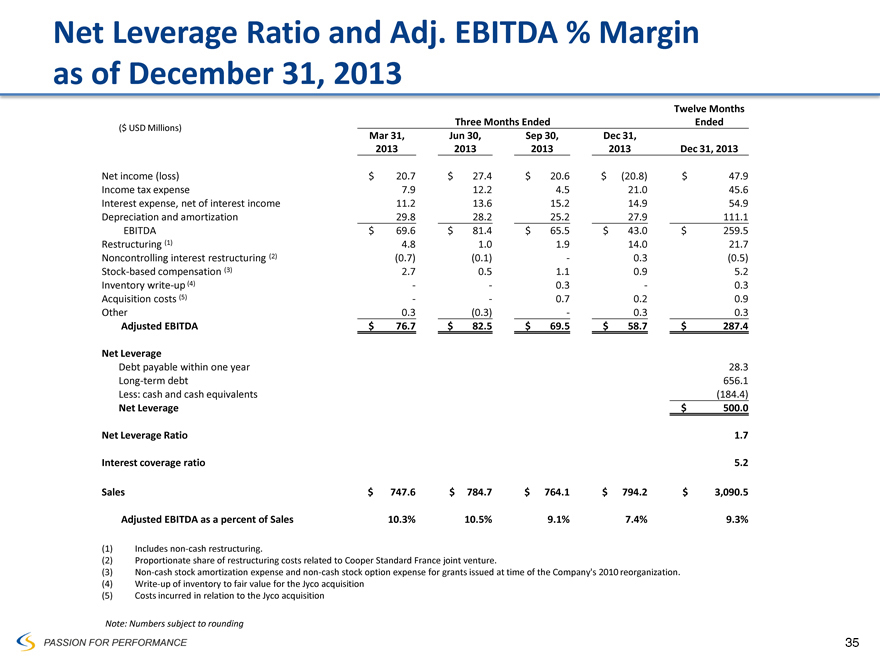
Net Leverage Ratio and Adj. EBITDA % Margin as of December 31, 2013
Three Months Ended Twelve Months Ended
($ USD Millions)
Mar 31, 2013 Jun 30, 2013 Sep 30, 2013 Dec 31, 2013 Dec 31, 2013
Net income (loss) $ 20.7 $ 27.4 $ 20.6 $ (20.8) $ 47.9
Income tax expense 7.9 12.2 4.5 21.0 45.6
Interest expense, net of interest income 11.2 13.6 15.2 14.9 54.9
Depreciation and amortization 29.8 28.2 25.2 27.9 111.1
EBITDA $ 69.6 $ 81.4 $ 65.5 $ 43.0 $ 259.5
Restructuring (1) 4.8 1.0 1.9 14.0 21.7
Noncontrolling interest restructuring (2) (0.7) (0.1) - 0.3 (0.5)
Stock-based compensation (3) 2.7 0.5 1.1 0.9 5.2
Inventory write-up (4) - - 0.3 - 0.3
Acquisition costs (5) - - 0.7 0.2 0.9
Other 0.3 (0.3) - 0.3 0.3
Adjusted EBITDA $ 76.7 $ 82.5 $ 69.5 $ 58.7 $ 287.4
Net Leverage
Debt payable within one year 28.3
Long-term debt 656.1
Less: cash and cash equivalents (184.4)
Net Leverage $ 500.0
Net Leverage Ratio 1.7
Interest coverage ratio 5.2
Sales $ 747.6 $ 784.7 $ 764.1 $ 794.2 $ 3,090.5
Adjusted EBITDA as a percent of Sales 10.3% 10.5% 9.1% 7.4% 9.3%
(1) Includes non-cash restructuring.
(2) Proportionate share of restructuring costs related to Cooper Standard France joint venture.
(3) Non-cash stock amortization expense and non-cash stock option expense for grants issued at time of the Company’s 2010 reorganization.
(4) Write-up of inventory to fair value for the Jyco acquisition
(5) Costs incurred in relation to the Jyco acquisition
Note: Numbers subject to rounding
PASSION FOR PERFORMANCE 34
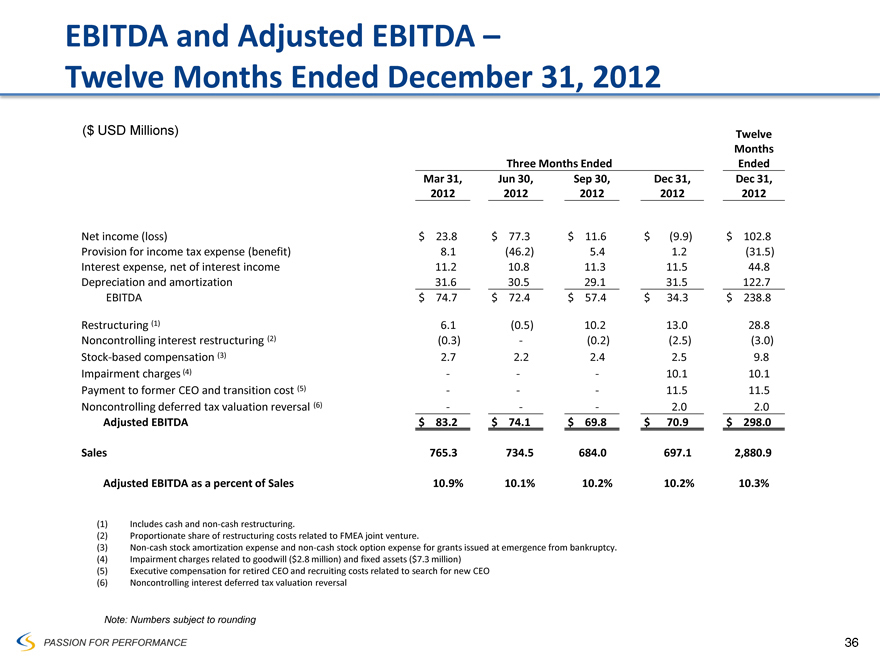
EBITDA and Adjusted EBITDA –
Twelve Months Ended December 31, 2012
($ USD Millions) Three Months Ended Twelve Months Ended
Mar 31, 2012 Jun 30, 2012 Sep 30, 2012 Dec 31, 2012 Dec 31, 2012
Net income (loss) $ 23.8 $ 77.3 $ 11.6 $ (9.9) $ 102.8
Provision for income tax expense (benefit) 8.1 (46.2) 5.4 1.2 (31.5)
Interest expense, net of interest income 11.2 10.8 11.3 11.5 44.8
Depreciation and amortization 31.6 30.5 29.1 31.5 122.7
EBITDA $ 74.7 $ 72.4 $ 57.4 $ 34.3 $ 238.8
Restructuring (1) 6.1 (0.5) 10.2 13.0 28.8
Noncontrolling interest restructuring (2) (0.3) - (0.2) (2.5) (3.0)
Stock-based compensation (3) 2.7 2.2 2.4 2.5 9.8
Impairment charges (4) - - - 10.1 10.1
Payment to former CEO and transition cost (5) - - - 11.5 11.5
Noncontrolling deferred tax valuation reversal (6) - - - 2.0 2.0
Adjusted EBITDA $ 83.2 $ 74.1 $ 69.8 $ 70.9 $ 298.0
Sales 765.3 734.5 684.0 697.1 2,880.9
Adjusted EBITDA as a percent of Sales 10.9% 10.1% 10.2% 10.2% 10.3%
(1) Includes cash and non-cash restructuring.
(2) Proportionate share of restructuring costs related to FMEA joint venture.
(3) Non-cash stock amortization expense and non-cash stock option expense for grants issued at emergence from bankruptcy. (4) Impairment charges related to goodwill ($2.8 million) and fixed assets ($7.3 million) (5) Executive compensation for retired CEO and recruiting costs related to search for new CEO
(6) Noncontrolling interest deferred tax valuation reversal
Note: Numbers subject to rounding
PASSION FOR PERFORMANCE 36
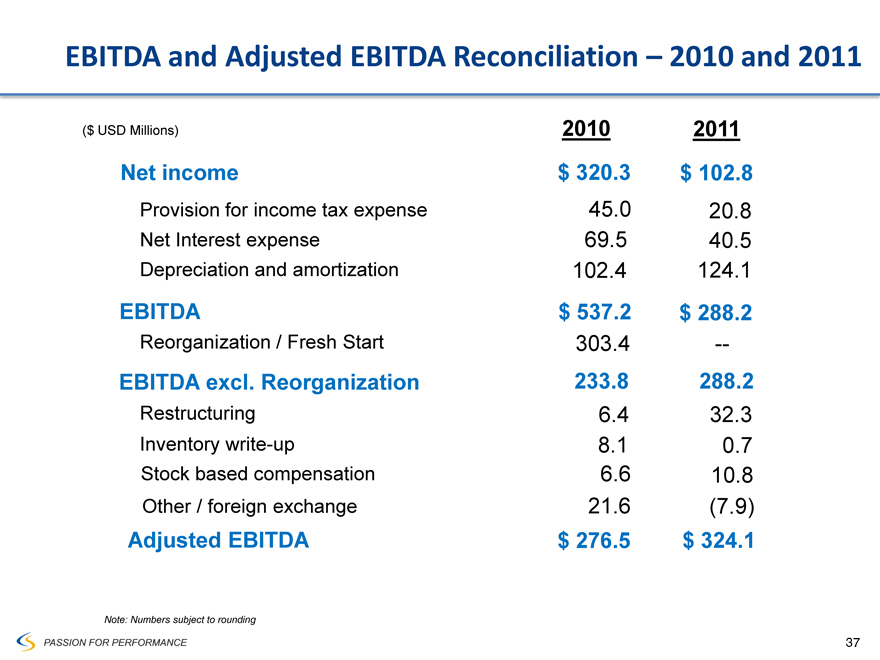
EBITDA and Adjusted EBITDA Reconciliation – 2010 and 2011
($ USD Millions) 2010 2011
Net income $ 320.3 $ 102.8
Provision for income tax expense 45.0 20.8
Net Interest expense 69.5 40.5
Depreciation and amortization 102.4 124.1
EBITDA $ 537.2 $ 288.2
Reorganization / Fresh Start 303.4 -
EBITDA excl. Reorganization 233.8 288.2
Restructuring 6.4 32.3
Inventory write-up 8.1 0.7
Stock based compensation 6.6 10.8
Other / foreign exchange 21.6 (7.9)
Adjusted EBITDA $ 276.5 $ 324.1
Note: Numbers subject to rounding
PASSION FOR PERFORMANCE 37
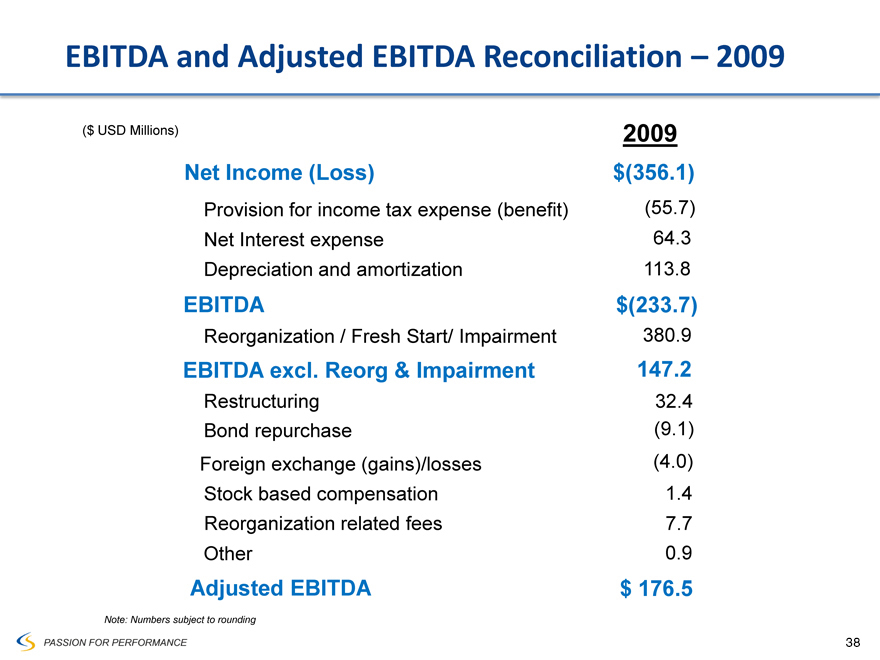
EBITDA and Adjusted EBITDA Reconciliation – 2009
($ USD Millions) 2009
Net Income (Loss) $(356.1)
Provision for income tax expense (benefit) (55.7)
Net Interest expense 64.3
Depreciation and amortization 113.8
EBITDA $(233.7)
Reorganization / Fresh Start/ Impairment 380.9
EBITDA excl. Reorg & Impairment 147.2
Restructuring 32.4
Bond repurchase (9.1)
Foreign exchange (gains)/losses (4.0)
Stock based compensation 1.4
Reorganization related fees 7.7
Other 0.9
Adjusted EBITDA $ 176.5
Note: Numbers subject to rounding
PASSION FOR PERFORMANCE 38

Non-GAAP Financial Measures
EBITDA and adjusted EBITDA are measures not recognized under Generally Accepted Accounting Principles (GAAP) which exclude certain non-cash and non-recurring items.
When analyzing the company’s operating performance, investors should use EBITDA and adjusted EBITDA in addition to, and not as alternatives for, net income (loss), operating income, or any other performance measure derived in accordance with GAAP, or as an alternative to cash flow from operating activities as a measure of the company’s performance. EBITDA and adjusted EBITDA have limitations as analytical tools and should not be considered in isolation or as substitutes for analysis of the company’s results of operations as reported under GAAP. Other companies may report EBITDA and adjusted EBITDA differently and therefore Cooper Standard’s results may not be comparable to other similarly titled measures of other companies.
PASSION FOR PERFORMANCE 39