UNITED STATES
SECURITIES AND EXCHANGE COMMISSION
Washington, D.C. 20549
FORM N-CSR
CERTIFIED SHAREHOLDER REPORT OF REGISTERED
MANAGEMENT INVESTMENT COMPANIES
Investment Company Act file number | 811-21731 | |||||
| ||||||
Nuveen Equity Premium Advantage Fund | ||||||
(Exact name of registrant as specified in charter) | ||||||
| ||||||
Nuveen Investments 333 West Wacker Drive Chicago, IL 60606 | ||||||
(Address of principal executive offices) (Zip code) | ||||||
| ||||||
Kevin J. McCarthy Nuveen Investments 333 West Wacker Drive Chicago, IL 60606 | ||||||
(Name and address of agent for service) | ||||||
| ||||||
Registrant’s telephone number, including area code: | (312) 917-7700 |
| ||||
| ||||||
Date of fiscal year end: | December 31 |
| ||||
| ||||||
Date of reporting period: | June 30, 2011 |
| ||||
Form N-CSR is to be used by management investment companies to file reports with the Commission not later than 10 days after the transmission to stockholders of any report that is required to be transmitted to stockholders under Rule 30e-1 under the Investment Company Act of 1940 (17 CFR 270.30e-1). The Commission may use the information provided on Form N-CSR in its regulatory, disclosure review, inspection, and policymaking roles.
A registrant is required to disclose the information specified by Form N-CSR, and the Commission will make this information public. A registrant is not required to respond to the collection of information contained in Form N-CSR unless the Form displays a currently valid Office of Management and Budget ("OMB") control number. Please direct comments concerning the accuracy of the information collection burden estimate and any suggestions for reducing the burden to Secretary, Securities and Exchange Commission, 450 Fifth Street, NW, Washington, DC 20549-0609. The OMB has reviewed this collection of information under the clearance requirements of 44 U.S.C. SS. 3507.
ITEM 1. REPORTS TO STOCKHOLDERS.

Closed-End Funds
Nuveen Investments
Closed-End Funds
Seeks Attractive Quarterly Distributions from an Integrated Index Option and Equity Strategy
Semi-Annual Report
June 30, 2011

Nuveen Equity Premium Income Fund
JPZ
Nuveen Equity Premium Opportunity Fund
JSN
Nuveen Equity Premium Advantage Fund
JLA
Nuveen Equity Premium and Growth Fund
JPG

LIFE IS COMPLEX.
Nuveen makes things e-simple.
It only takes a minute to sign up for e-Reports. Once enrolled, you'll receive an e-mail as soon as your Nuveen Fund information is ready. No more waiting for delivery by regular mail. Just click on the link within the e-mail to see the report and save it on your computer if you wish.
Free e-Reports right to your e-mail!
www.investordelivery.com
If you receive your Nuveen Fund dividends and statements from your financial advisor or brokerage account.
OR
www.nuveen.com/accountaccess
If you receive your Nuveen Fund dividends and statements directly from Nuveen.

Table of Contents
| Chairman's Letter to Shareholders | 4 | ||||||
| Portfolio Managers' Comments | 5 | ||||||
| Distribution and Share Price Information | 8 | ||||||
| Performance Overviews | 10 | ||||||
| Shareholder Meeting Report | 14 | ||||||
| Portfolios of Investments | 15 | ||||||
| Statement of Assets & Liabilities | 48 | ||||||
| Statement of Operations | 49 | ||||||
| Statement of Changes in Net Assets | 50 | ||||||
| Financial Highlights | 52 | ||||||
| Notes to Financial Statements | 54 | ||||||
| Annual Investment Management Agreement Approval Process | 65 | ||||||
| Reinvest Automatically Easily and Conveniently | 73 | ||||||
| Glossary of Terms Used in this Report | 75 | ||||||
| Other Useful Information | 78 | ||||||
Chairman's
Letter to Shareholders

Dear Shareholders,
The global economy continues to be weighed down by an unusual combination of pressures facing the larger developed economies. Japanese leaders continue to work through the economic aftereffects of the March 2011 earthquake and tsunami. Political leaders in Europe and the U.S. have resolved some of the near term fiscal problems, but the financial markets are not convinced that these leaders are able to address more complex longer term fiscal issues. Despite improved earnings and capital increases, the largest banks in these countries continue to be vulnerable to deteriorating mortgage portfolios and sovereign credit exposure, adding another source of uncertainty to the global financial system.
In the U.S., recent economic statistics indicate that the economic recovery may be losing momentum. Consumption, which represents about 70% of the gross domestic product, faces an array of challenges from seemingly intractable declines in housing values, increased energy costs and limited growth in the job market. The failure of Congress and the administration to agree on the debt ceiling increase on a timely basis and the deep divisions between the political parties over fashioning a balanced program to address growing fiscal imbalances that led to the recent S&P ratings downgrade add considerable uncertainty to the domestic economic picture.
On a more positive note, corporate earnings continue to hold up well and the municipal bond market is recovering from recent weakness as states and municipalities implement various programs to reduce their budgetary deficits. In addition, the Federal Reserve System has made it clear that it stands ready to take additional steps should the economic recovery falter. However, there are concerns that the Fed is approaching the limits of its resources to intervene in the economy.
These perplexing times highlight the importance of professional investment management. Your Nuveen investment team is working hard to develop an appropriate response to increased risk, and they continue to seek opportunities created by stressful markets using proven investment disciplines designed to help your Fund achieve its investment objectives. On your behalf, we monitor their activities to assure that they maintain their investment disciplines.
As always, I encourage you to contact your financial consultant if you have any questions about your investment in a Nuveen Fund. On behalf of the other members of your Fund Board, we look forward to continuing to earn your trust in the months and years ahead.
Sincerely,

Robert P. Bremner
Chairman of the Board
August 23, 2011
Nuveen Investments
4
Portfolio Managers' Comments
Certain statements in this report are forward-looking statements. Discussions of specific investments are for illustration only and are not intended as recommendations of individual investments. The forward-looking statements and other views expressed herein are those of the portfolio managers as of the date of this report. Actual future results or occurrences may differ significantly from those anticipated in any forward-looking statements and the views expressed herein are subject to change at any time, due to numerous market and other factors. The Funds disclaim any obligation to update publicly or revise any forward-looking statements or views expressed herein.
Nuveen Equity Premium Income Fund (JPZ)
Nuveen Equity Premium Opportunity Fund (JSN)
Nuveen Equity Premium Advantage Fund (JLA)
Nuveen Equity Premium and Growth Fund (JPG)
These Funds feature portfolio management by Gateway Investment Advisers, LLC. J. Patrick Rogers and Kenneth H. Toft serve as co-portfolio managers for JSN and JLA; Patrick and Michael T. Buckius are co-portfolio managers for JPZ and JPG. Patrick joined Gateway in 1989. He has been President and a Director of Gateway since 1995 and is the firm's Chief Executive Officer. Ken joined Gateway in 1992 and has been a Vice President and Portfolio Manager since 1997. Mike joined Gateway in 1999 and is currently Senior Vice President and Portfolio Manager. Here they talk about their management strategies and the performance of the Funds for the six-months ended June 30, 2011.
Over this period, what key strategies were used to manage the Funds?
The core strategy employed in each Fund consists of an investment in a broadly diversified portfolio of equity securities that seeks to substantially track the price movement of a stock market index or a custom blend of stock market indexes. The primary purpose of each equity portfolio is to support the index option-based risk management strategy employed by each Fund. These strategies remained consistent in each Fund throughout the period.
For JPZ and JPG, the equity portfolio seeks to track the price movements of the S&P 500 Index. The JSN equity portfolio is invested to replicate the price performance of a custom index consisting of 75% S&P 500 Index and 25% NASDAQ-100 Index. JLA seeks to replicate a 50/50 blend of the S&P 500 and NASDAQ-100 Indexes. JPZ, JSN and JLA actively write (sell) listed index call options against their entire stock portfolios. JPG differs in that its index option hedging activity is applied to 80% of the value of the equity portfolio.
Nuveen Investments
5
Past performance is not predictive of future results. Current performance may be higher or lower than the data shown. Returns do not reflect the deduction of taxes that shareholders may have to pay on Fund distributions or upon the sale of Fund shares.
For additional information, see the individual Performance Overview for your Fund in this report.
* Six-month returns are cumulative; all other returns are annualized.
1 The S&P 500 Index is an unmanaged Index generally considered representative of the U.S. Stock Market.
2 JSN's comparative index performance is a blended return consisting of: 1) 75% of the return of the S&P 500 Index, and 2) 25% of the NASDAQ-100 Index, which includes 100 of the largest domestic and international non-financial companies listed on The NASDAQ Stock Market based on market capitalization. The NASDAQ-100 Index reflects companies across major industry groups including computer hardware and software, telecommunications, retail/wholesale trade and biotechnology.
3 JLA's comparative index performance is a blended return consisting of: 1) 50% of the return of the S&P 500 Index, and 2) 50% of the NASDAQ-100 Index.
How did the Funds perform over this period?
The performance of JPZ, JSN, JLA and JPG, as well as comparative indexes, is presented in the accompanying table.
Average Annual Total Returns on Net Asset Value*
For periods ended 6/30/11
| 6-Month | 1-Year | 5 Year | |||||||||||||
| JPZ | 4.78 | % | 21.21 | % | 3.25 | % | |||||||||
| S&P 500 Index1 | 6.02 | % | 30.69 | % | 2.94 | % | |||||||||
| JSN | 4.88 | % | 20.97 | % | 3.81 | % | |||||||||
| Comparative Index2 | 5.73 | % | 31.44 | % | 4.23 | % | |||||||||
| JLA | 4.01 | % | 19.50 | % | 3.91 | % | |||||||||
| Comparative Index3 | 5.43 | % | 32.19 | % | 5.52 | % | |||||||||
| JPG | 4.52 | % | 22.09 | % | 2.98 | % | |||||||||
| S&P 500 Index1 | 6.02 | % | 30.69 | % | 2.94 | % | |||||||||
For the six-month period ending June 30, 2011, each Fund underperformed its respective comparative equity index. Since each Fund, in general terms, employs a hedged-equity strategy, these Funds are likely to underperform their comparative indexes in the event that the unhedged stock indexes post especially strong returns. This can be seen in the returns of the Funds and their comparative indexes over the six-month and one-year periods. In a bear market, conversely, the call-writing portion of the strategy may help to mitigate the effect of a downturn felt by the underlying stocks.
This effect can clearly be seen in the peak-to-trough net asset value (NAV) performance of these Funds from April 29, 2011, to June 15, 2011, during which time the S&P 500 Index posted a negative return of 6.91%; the Nasdaq was likewise down 7.93%. During this time JPZ, JSN, JLA and JPG posted negative returns of only 3.11%, 3.09%, 3.09% and 3.88% respectively. The sale, or writing, of index call options contributed to this risk-mitigating benefit.
The Funds' positive performance resulted from a generally rising stock market that persisted especially during the first three months of the period. As stock markets rebounded, the Funds also benefited from rising implied volatility levels, particularly in March and June. This is because the premiums the Funds receive from writing call options tend to increase as the volatility of the underlying stock markets increase.
Nuveen Investments
6
RISK CONSIDERATIONS
Fund shares are not guaranteed or endorsed by any bank or other insured depository institution, and are not federally insured by the Federal Deposit Insurance Corporation. Past performance is no guarantee of future results. Fund common shares are subject to a variety of risks, including:
Investment Risk. The possible loss of the entire principal amount that you invest.
Price Risk. Shares of closed-end investment companies like the Funds frequently trade at a discount to their net asset value (NAV). Your common shares at any point in time may be worth less than your original investment, even after taking into account the reinvestment of Fund dividends and distributions.
Tax Risk. The tax treatment of Fund distributions may be affected by new IRS interpretations of the Internal Revenue Code and future changes in tax laws and regulations. This is particularly true for funds employing a managed distribution program.
Common Stock Risk. Common stocks returns often have experienced significant volatility.
Call Option Risks. The value of call options sold (written) by the Funds will fluctuate. The Funds may not participate in any appreciation of its equity portfolio as fully as it would if the Funds did not sell call options. In addition, the Funds will continue to bear the risk of declines in the value of the equity portfolio.
Derivatives Strategy Risk. Derivative securities, such as calls, puts, warrants, swaps and forwards, carry risks different from, and possibly greater than, the risks associated with the underlying investments.
Index Call Option Risk. Because index options are settled in cash, sellers of index call options, such as the Funds, cannot provide in advance for their potential settlement obligations by acquiring and holding the underlying securities.
Nuveen Investments
7
Distribution and
Share Price Information
The following information regarding your Fund's distributions is current as of June 30, 2011, and likely will vary over time based on the Fund's investment activities and portfolio investment value changes.
During the six-month reporting period, the Funds did not make any changes to their quarterly distributions to shareholders. Some of the important factors affecting the amount and composition of these distributions are summarized below.
Each Fund has a managed distribution program. The goal of this program is to provide shareholders with relatively consistent and predictable cash flow by systematically converting the Fund's expected long-term return potential into regular distributions. As a result, regular distributions throughout the year are likely to include a portion of expected long-term gains (both realized and unrealized), along with net investment income.
Important points to understand about the managed distribution program are:
• Each Fund seeks to establish a relatively stable distribution rate that roughly corresponds to the projected total return from its investment strategy over an extended period of time. However, you should not draw any conclusions about a Fund's past or future investment performance from its current distribution rate.
• Actual returns will differ from projected long-term returns (and therefore a Fund's distribution rate), at least over shorter time periods. Over a specific timeframe, the difference between actual returns and total distributions will be reflected in an increasing (returns exceed distributions) or a decreasing (distributions exceed returns) Fund net asset value.
• Each distribution is expected to be paid from some or all of the following sources:
• net investment income (regular interest and dividends),
• realized capital gains, and
• unrealized gains, or, in certain cases, a return of principal (non-taxable distributions).
• A non-taxable distribution is a payment of a portion of a Fund's capital. When a Fund's returns exceed distributions, it may represent portfolio gains generated, but not realized as a taxable capital gain. In periods when a Fund's return falls short of distributions, the shortfall will represent a portion of your original principal, unless the shortfall is offset during other time periods over the life of your investment (previous or subsequent) when a Fund's total return exceeds distributions.
• Because distribution source estimates are updated during the year based on a Fund's performance and forecast for its current fiscal year (which is the calendar year for each Fund), estimates on the nature of your distributions provided at the time distributions are paid may differ from both the tax information reported to you in your Fund's IRS
Nuveen Investments
8
Form 1099 statement provided at year end, as well as the ultimate economic sources of distributions over the life of your investment.
The following table provides estimated information regarding each Fund's distributions and total return performance for the six months ended June 30, 2011. This information is presented on a tax basis rather than a generally accepted accounting principles (GAAP) basis. This information is intended to help you better understand whether the Fund's returns for the specified time period were sufficient to meet each Fund's distributions.
| As of 6/30/11 | JPZ | JSN | JLA | JPG | |||||||||||||||
| Inception date | 10/26/04 | 1/26/05 | 5/25/05 | 11/22/05 | |||||||||||||||
| Six months ended June 30, 2011: | |||||||||||||||||||
| Per share distribution: | |||||||||||||||||||
| From net investment income | $ | 0.11 | $ | 0.09 | $ | 0.05 | $ | 0.11 | |||||||||||
| From realized capital gains | 0.11 | 0.30 | 0.58 | 0.00 | |||||||||||||||
| Return of capital | 0.39 | 0.24 | 0.00 | 0.45 | |||||||||||||||
| Total per share distribution | $ | 0.61 | $ | 0.63 | $ | 0.63 | $ | 0.56 | |||||||||||
| Annualized distribution rate on NAV | 9.12 | % | 9.40 | % | 9.31 | % | 7.72 | % | |||||||||||
| Average annual total returns: | |||||||||||||||||||
| Six-Month (Cumulative) on NAV | 4.78 | % | 4.88 | % | 4.01 | % | 4.52 | % | |||||||||||
| 1-Year on NAV | 21.21 | % | 20.97 | % | 19.50 | % | 22.09 | % | |||||||||||
| 5-Year on NAV | 3.25 | % | 3.81 | % | 3.91 | % | 2.98 | % | |||||||||||
| Since inception on NAV | 4.01 | % | 4.20 | % | 4.07 | % | 3.33 | % | |||||||||||
Share Repurchases and Share Price Information
As of June 30, 2011, and since the inception of the Funds' repurchase program, the Funds have cumulatively repurchased and retired their outstanding shares as shown in the accompanying table.
| Fund | Shares Repurchased and Retired | % of Outstanding Shares | |||||||||
| JPZ | 264,200 | 0.7 | % | ||||||||
| JSN | 479,300 | 0.7 | % | ||||||||
| JLA | 268,050 | 1.0 | % | ||||||||
| JPG | 224,700 | 1.4 | % | ||||||||
During the six-month reporting period, the Funds did not repurchase and retire any of their outstanding shares.
As of June 30, 2011, the Funds' share prices were trading at (-) discounts relative to their NAVs as shown in the accompanying table.
| Fund | 6/30/11 (-) Discount | Six-Month Average (-) Discount | |||||||||
| JPZ | (- | )6.88% | (- | )7.02% | |||||||
| JSN | (- | )7.38% | (- | )7.19% | |||||||
| JLA | (- | )7.24% | (- | )7.60% | |||||||
| JPG | (- | )8.48% | (- | )7.77% | |||||||
Nuveen Investments
9
Fund Snapshot
| Share Price | $ | 12.45 | |||||
| Net Asset Value (NAV) | $ | 13.37 | |||||
| Premium/(Discount) to NAV | -6.88 | % | |||||
| Current Distribution Rate1 | 9.73 | % | |||||
| Net Assets ($000) | $ | 516,846 | |||||
Average Annual Total Return
(Inception 10/26/04)
| On Share Price | On NAV | ||||||||||
| 6-Month (Cumulative) | 2.33 | % | 4.78 | % | |||||||
| 1-Year | 13.15 | % | 21.21 | % | |||||||
| 5-Year | 3.68 | % | 3.25 | % | |||||||
| Since Inception | 2.72 | % | 4.01 | % | |||||||
Portfolio Composition3
(as a % of total common stocks)
| Oil, Gas & Consumable Fuels | 10.2 | % | |||||
| Pharmaceuticals | 7.1 | % | |||||
| Diversified Telecommunication Services | 4.2 | % | |||||
| Diversified Financial Services | 3.9 | % | |||||
| Software | 3.6 | % | |||||
| IT Services | 3.4 | % | |||||
| Computers & Peripherals | 3.2 | % | |||||
| Machinery | 2.9 | % | |||||
| Commercial Banks | 2.8 | % | |||||
| Energy Equipment & Services | 2.8 | % | |||||
| Industrial Conglomerates | 2.7 | % | |||||
| Aerospace & Defense | 2.6 | % | |||||
| Real Estate Investment Trust | 2.6 | % | |||||
| Semiconductors & Equipment | 2.5 | % | |||||
| Media | 2.5 | % | |||||
| Beverages | 2.5 | % | |||||
| Specialty Retail | 2.4 | % | |||||
| Chemicals | 2.4 | % | |||||
| Insurance | 2.3 | % | |||||
| Health Care Providers & Services | 2.3 | % | |||||
| Multi-Utilities | 2.1 | % | |||||
| Communications Equipment | 2.1 | % | |||||
| Tobacco | 2.0 | % | |||||
| Capital Markets | 1.9 | % | |||||
| Household Products | 1.8 | % | |||||
| Internet Software & Services | 1.8 | % | |||||
| Other | 19.4 | % | |||||
JPZ
Performance
OVERVIEW
Nuveen Equity Premium Income Fund
as of June 30, 2011
Fund Allocation (as a % of total net assets)3

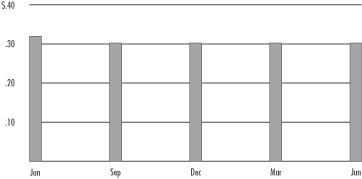
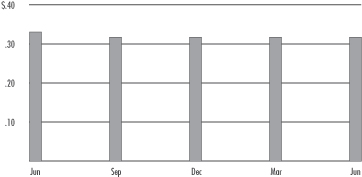
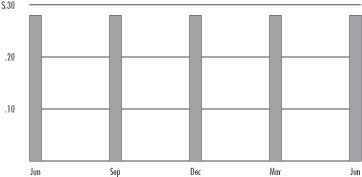
2010-2011 Quarterly Distributions Per Share
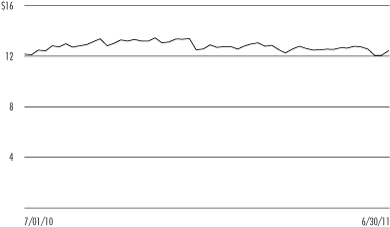
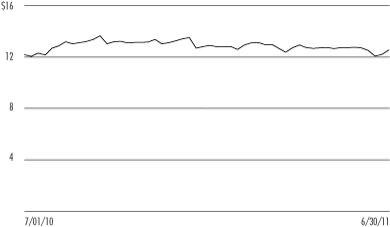
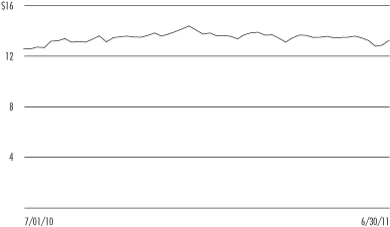
Share Price Performance — Weekly Closing Price

Refer to the Glossary of Terms Used in this Report for further definition of the terms used within this Fund's Performance Overview page.
1 Current Distribution Rate is based on the Fund's current annualized quarterly distribution divided by the Fund's current market price. The Fund's quarterly distributions to its shareholders may be comprised of ordinary income, net realized capital gains and, if at the end of the calendar year the Fund's cumulative net ordinary income and net realized gains are less than the amount of the Fund's distributions, a return of capital for tax purposes.
2 Other assets less liabilities.
3 Holdings are subject to change.
Nuveen Investments
10
JSN
Performance
OVERVIEW
Nuveen Equity Premium Opportunity Fund
as of June 30, 2011
Fund Allocation (as a % of total net assets)3

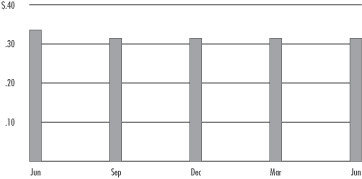
2010-2011 Quarterly Distributions Per Share
Share Price Performance — Weekly Closing Price
Refer to the Glossary of Terms Used in this Report for further definition of the terms used within this Fund's Performance Overview page.
1 Current Distribution Rate is based on the Fund's current annualized quarterly distribution divided by the Fund's current market price. The Fund's quarterly distributions to its shareholders may be comprised of ordinary income, net realized capital gains and, if at the end of the calendar year the Fund's cumulative net ordinary income and net realized gains are less than the amount of the Fund's distributions, a return of capital for tax purposes.
2 Other assets less liabilities.
3 Holdings are subject to change.
Fund Snapshot
| Share Price | $ | 12.42 | |||||
| Net Asset Value (NAV) | $ | 13.41 | |||||
| Premium/(Discount) to NAV | -7.38 | % | |||||
| Current Distribution Rate1 | 10.14 | % | |||||
| Net Assets ($000) | $ | 892,250 | |||||
Average Annual Total Return
(Inception 1/26/05)
| On Share Price | On NAV | ||||||||||
| 6-Month (Cumulative) | 1.32 | % | 4.88 | % | |||||||
| 1-Year | 13.54 | % | 20.97 | % | |||||||
| 5-Year | 3.14 | % | 3.81 | % | |||||||
| Since Inception | 2.78 | % | 4.20 | % | |||||||
Portfolio Composition3
(as a % of total common stocks)
| Computers & Peripherals | 7.9 | % | |||||
| Oil, Gas & Consumable Fuels | 7.1 | % | |||||
| Software | 6.3 | % | |||||
| Pharmaceuticals | 5.8 | % | |||||
| Internet Software & Services | 4.1 | % | |||||
| Communications Equipment | 3.9 | % | |||||
| Semiconductors & Equipment | 3.8 | % | |||||
| Media | 3.4 | % | |||||
| Diversified Financial Services | 2.9 | % | |||||
| IT Services | 2.8 | % | |||||
| Diversified Telecommunication Services | 2.7 | % | |||||
| Machinery | 2.3 | % | |||||
| Energy Equipment & Services | 2.3 | % | |||||
| Beverages | 2.2 | % | |||||
| Health Care Providers & Services | 2.1 | % | |||||
| Commercial Banks | 2.1 | % | |||||
| Specialty Retail | 2.0 | % | |||||
| Food & Staples Retailing | 1.9 | % | |||||
| Gas Utilities | 1.9 | % | |||||
| Chemicals | 1.9 | % | |||||
| Aerospace & Defense | 1.8 | % | |||||
| Capital Markets | 1.8 | % | |||||
| Hotels, Restaurants & Leisure | 1.7 | % | |||||
| Real Estate Investment Trust | 1.6 | % | |||||
| Health Care Equipment & Supplies | 1.6 | % | |||||
| Industrial Conglomerates | 1.6 | % | |||||
| Household Products | 1.5 | % | |||||
| Other | 19.0 | % | |||||
Nuveen Investments
11
Fund Snapshot
| Share Price | $ | 12.55 | |||||
| Net Asset Value (NAV) | $ | 13.53 | |||||
| Premium/(Discount) to NAV | -7.24 | % | |||||
| Current Distribution Rate1 | 10.10 | % | |||||
| Net Assets ($000) | $ | 349,992 | |||||
Average Annual Total Return
(Inception 5/25/05)
| On Share Price | On NAV | ||||||||||
| 6-Month (Cumulative) | 2.19 | % | 4.01 | % | |||||||
| 1-Year | 13.56 | % | 19.50 | % | |||||||
| 5-Year | 3.23 | % | 3.91 | % | |||||||
| Since Inception | 2.64 | % | 4.07 | % | |||||||
Portfolio Composition3
(as a % of total common stocks)
| Software | 10.2 | % | |||||
| Computers & Peripherals | 9.3 | % | |||||
| Semiconductors & Equipment | 6.0 | % | |||||
| Internet Software & Services | 5.9 | % | |||||
| Oil, Gas & Consumable Fuels | 5.2 | % | |||||
| Communications Equipment | 5.1 | % | |||||
| Pharmaceuticals | 4.7 | % | |||||
| Media | 3.7 | % | |||||
| IT Services | 3.4 | % | |||||
| Biotechnology | 3.0 | % | |||||
| Hotels, Restaurants & Leisure | 2.7 | % | |||||
| Diversified Telecommunication Services | 2.4 | % | |||||
| Internet & Catalog Retail | 2.3 | % | |||||
| Machinery | 2.0 | % | |||||
| Diversified Financial Services | 1.8 | % | |||||
| Specialty Retail | 1.8 | % | |||||
| Health Care Providers & Services | 1.7 | % | |||||
| Electrical Equipment | 1.6 | % | |||||
| Energy Equipment & Services | 1.5 | % | |||||
| Industrial Conglomerates | 1.4 | % | |||||
| Commercial Banks | 1.4 | % | |||||
| Insurance | 1.3 | % | |||||
| Aerospace & Defense | 1.3 | % | |||||
| Beverages | 1.3 | % | |||||
| Other | 19.0 | % | |||||
JLA
Performance
OVERVIEW
Nuveen Equity Premium Advantage Fund
as of June 30, 2011
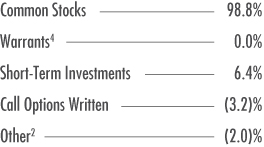
Fund Allocation (as a % of total net assets)3
2010-2011 Quarterly Distributions Per Share
Share Price Performance — Weekly Closing Price
Refer to the Glossary of Terms Used in this Report for further definition of the terms used within this Fund's Performance Overview page.
1 Current Distribution Rate is based on the Fund's current annualized quarterly distribution divided by the Fund's current market price. The Fund's quarterly distributions to its shareholders may be comprised of ordinary income, net realized capital gains and, if at the end of the calendar year the Fund's cumulative net ordinary income and net realized gains are less than the amount of the Fund's distributions, a return of capital for tax purposes.
2 Other assets less liabilities.
3 Holdings are subject to change.
4 Rounds to less than 0.1%.
Nuveen Investments
12
JPG
Performance
OVERVIEW
Nuveen Equity Premium and Growth Fund
as of June 30, 2011
Fund Allocation (as a % of total net assets)3

2010-2011 Quarterly Distributions Per Share
Share Price Performance — Weekly Closing Price
Refer to the Glossary of Terms Used in this Report for further definition of the terms used within this Fund's Performance Overview page.
1 Current Distribution Rate is based on the Fund's current annualized quarterly distribution divided by the Fund's current market price. The Fund's quarterly distributions to its shareholders may be comprised of ordinary income, net realized capital gains and, if at the end of the calendar year the Fund's cumulative net ordinary income and net realized gains are less than the amount of the Fund's distributions, a return of capital for tax purposes.
2 Other assets less liabilities.
3 Holdings are subject to change.
Fund Snapshot
| Share Price | $ | 13.27 | |||||
| Net Asset Value (NAV) | $ | 14.50 | |||||
| Premium/(Discount) to NAV | -8.48 | % | |||||
| Current Distribution Rate1 | 8.44 | % | |||||
| Net Assets ($000) | $ | 236,501 | |||||
Average Annual Total Return
(Inception 11/22/05)
| On Share Price | On NAV | ||||||||||
| 6-Month (Cumulative) | -0.16 | % | 4.52 | % | |||||||
| 1-Year | 13.47 | % | 22.09 | % | |||||||
| 5-Year | 3.57 | % | 2.98 | % | |||||||
| Since Inception | 1.59 | % | 3.33 | % | |||||||
Portfolio Composition3
(as a % of total common stocks)
| Oil, Gas & Consumable Fuels | 10.8 | % | |||||
| Pharmaceuticals | 7.3 | % | |||||
| Diversified Financial Services | 4.0 | % | |||||
| Diversified Telecommunication Services | 3.9 | % | |||||
| Software | 3.9 | % | |||||
| Computers & Peripherals | 3.5 | % | |||||
| IT Services | 3.4 | % | |||||
| Machinery | 3.0 | % | |||||
| Energy Equipment & Services | 2.9 | % | |||||
| Specialty Retail | 2.8 | % | |||||
| Aerospace & Defense | 2.8 | % | |||||
| Semiconductors & Equipment | 2.7 | % | |||||
| Insurance | 2.6 | % | |||||
| Commercial Banks | 2.5 | % | |||||
| Industrial Conglomerates | 2.5 | % | |||||
| Chemicals | 2.5 | % | |||||
| Multi-Utilities | 2.4 | % | |||||
| Beverages | 2.3 | % | |||||
| Health Care Providers & Services | 2.3 | % | |||||
| Real Estate Investment Trust | 2.2 | % | |||||
| Communications Equipment | 2.1 | % | |||||
| Internet Software & Services | 1.9 | % | |||||
| Household Products | 1.9 | % | |||||
| Tobacco | 1.9 | % | |||||
| Media | 1.9 | % | |||||
| Other | 20.0 | % | |||||
Nuveen Investments
13
JPZ
JSN
JLA
JPG
Shareholder MEETING REPORT
The annual meeting of shareholders was held in the offices of Nuveen Investments on May 6, 2011; at this meeting the shareholders were asked to vote on the election of Board Members.
| JPZ | JSN | JLA | JPG | ||||||||||||||||
| Common Shares | Common Shares | Common Shares | Common Shares | ||||||||||||||||
| Approval of the Board Members was reached as follows: | |||||||||||||||||||
| John P. Amboian | |||||||||||||||||||
| For | 34,082,494 | 57,772,610 | 23,137,198 | 15,370,667 | |||||||||||||||
| Withhold | 902,941 | 1,258,199 | 630,884 | 218,827 | |||||||||||||||
| Total | 34,985,435 | 59,030,809 | 23,768,082 | 15,589,494 | |||||||||||||||
| David J. Kundert | |||||||||||||||||||
| For | 34,068,560 | 57,723,070 | 23,120,982 | 15,366,645 | |||||||||||||||
| Withhold | 916,875 | 1,307,739 | 647,100 | 222,849 | |||||||||||||||
| Total | 34,985,435 | 59,030,809 | 23,768,082 | 15,589,494 | |||||||||||||||
| Terence J. Toth | |||||||||||||||||||
| For | 34,101,721 | 57,765,425 | 23,134,869 | 15,369,426 | |||||||||||||||
| Withhold | 883,714 | 1,265,384 | 633,213 | 220,068 | |||||||||||||||
| Total | 34,985,435 | 59,030,809 | 23,768,082 | 15,589,494 | |||||||||||||||
Nuveen Investments
14
JPZ
Nuveen Equity Premium Income Fund
Portfolio of INVESTMENTS
June 30, 2011 (Unaudited)
| Shares | Description (1) | Value | |||||||||
| Common Stocks – 97.9% | |||||||||||
| Aerospace & Defense – 2.5% | |||||||||||
| 43,045 | Boeing Company | $ | 3,182,317 | ||||||||
| 74,036 | Honeywell International Inc. | 4,411,805 | |||||||||
| 29,605 | Raytheon Company | 1,475,809 | |||||||||
| 47,624 | United Technologies Corporation | 4,215,200 | |||||||||
| Total Aerospace & Defense | 13,285,131 | ||||||||||
| Air Freight & Logistics – 0.8% | |||||||||||
| 55,663 | United Parcel Service, Inc., Class B | 4,059,503 | |||||||||
| Airlines – 0.1% | |||||||||||
| 37,484 | AMR Corporation, (2) | 202,414 | |||||||||
| 3,957 | United Continental Holdings Inc., (2) | 89,547 | |||||||||
| Total Airlines | 291,961 | ||||||||||
| Auto Components – 0.1% | |||||||||||
| 30,296 | Cooper Tire & Rubber | 599,558 | |||||||||
| Automobiles – 0.8% | |||||||||||
| 195,811 | Ford Motor Company, (2) | 2,700,234 | |||||||||
| 37,905 | Harley-Davidson, Inc. | 1,552,968 | |||||||||
| Total Automobiles | 4,253,202 | ||||||||||
| Beverages – 2.4% | |||||||||||
| 104,562 | Coca-Cola Company | 7,035,977 | |||||||||
| 76,815 | PepsiCo, Inc. | 5,410,080 | |||||||||
| Total Beverages | 12,446,057 | ||||||||||
| Biotechnology – 0.9% | |||||||||||
| 41,504 | Amgen Inc., (2) | 2,421,758 | |||||||||
| 18,099 | Celgene Corporation, (2) | 1,091,732 | |||||||||
| 23,687 | Gilead Sciences, Inc., (2) | 980,879 | |||||||||
| Total Biotechnology | 4,494,369 | ||||||||||
| Building Products – 0.1% | |||||||||||
| 42,748 | Masco Corporation | 514,258 | |||||||||
| Capital Markets – 1.8% | |||||||||||
| 109,476 | Charles Schwab Corporation | 1,800,880 | |||||||||
| 9,291 | Goldman Sachs Group, Inc. | 1,236,539 | |||||||||
| 48,534 | Jefferies Group, Inc. | 990,094 | |||||||||
| 40,593 | Legg Mason, Inc. | 1,329,827 | |||||||||
| 113,376 | Morgan Stanley | 2,608,782 | |||||||||
| 38,635 | Waddell & Reed Financial, Inc., Class A | 1,404,382 | |||||||||
| Total Capital Markets | 9,370,504 | ||||||||||
Nuveen Investments
15
JPZ
Nuveen Equity Premium Income Fund (continued)
Portfolio of INVESTMENTS June 30, 2011 (Unaudited)
| Shares | Description (1) | Value | |||||||||
| Chemicals – 2.3% | |||||||||||
| 47,248 | Dow Chemical Company | $ | 1,700,928 | ||||||||
| 61,358 | E.I. Du Pont de Nemours and Company | 3,316,400 | |||||||||
| 24,527 | Eastman Chemical Company | 2,503,471 | |||||||||
| 22,053 | Monsanto Company | 1,599,725 | |||||||||
| 16,700 | NL Industries Inc. | 306,612 | |||||||||
| 53,293 | Olin Corporation | 1,207,619 | |||||||||
| 60,403 | RPM International, Inc. | 1,390,477 | |||||||||
| Total Chemicals | 12,025,232 | ||||||||||
| Commercial Banks – 2.8% | |||||||||||
| 33,724 | Comerica Incorporated | 1,165,839 | |||||||||
| 22,855 | HSBC Holdings PLC, Sponsored ADR | 1,134,065 | |||||||||
| 6,525 | PNC Financial Services Group, Inc. | 388,955 | |||||||||
| 2,869 | Toronto-Dominion Bank | 243,578 | |||||||||
| 171,091 | U.S. Bancorp | 4,364,531 | |||||||||
| 252,313 | Wells Fargo & Company | 7,079,903 | |||||||||
| Total Commercial Banks | 14,376,871 | ||||||||||
| Commercial Services & Supplies – 0.8% | |||||||||||
| 3,177 | Avery Dennison Corporation | 122,728 | |||||||||
| 56,149 | Deluxe Corporation | 1,387,442 | |||||||||
| 40,642 | Pitney Bowes Inc. | 934,360 | |||||||||
| 16,031 | R.R. Donnelley & Sons Company | 314,368 | |||||||||
| 24,100 | Standard Register Company | 75,915 | |||||||||
| 39,903 | Waste Management, Inc. | 1,487,185 | |||||||||
| Total Commercial Services & Supplies | 4,321,998 | ||||||||||
| Communications Equipment – 2.0% | |||||||||||
| 14,156 | ADTRAN, Inc. | 547,979 | |||||||||
| 3,408 | Ciena Corporation, (2) | 62,639 | |||||||||
| 234,237 | Cisco Systems, Inc. | 3,656,440 | |||||||||
| 11,034 | JDS Uniphase Corporation, (2) | 183,826 | |||||||||
| 21,878 | Motorola Mobility Holdings Inc., (2) | 482,191 | |||||||||
| 28,890 | Motorola Solutions Inc. | 1,330,096 | |||||||||
| 73,002 | QUALCOMM, Inc. | 4,145,784 | |||||||||
| Total Communications Equipment | 10,408,955 | ||||||||||
| Computers & Peripherals – 3.1% | |||||||||||
| 34,840 | Apple, Inc., (2) | 11,694,742 | |||||||||
| 67,332 | Dell Inc., (2) | 1,122,424 | |||||||||
| 119,293 | EMC Corporation, (2) | 3,286,522 | |||||||||
| Total Computers & Peripherals | 16,103,688 | ||||||||||
| Consumer Finance – 0.2% | |||||||||||
| 36,733 | Discover Financial Services | 982,608 | |||||||||
| Containers & Packaging – 0.3% | |||||||||||
| 43,759 | Packaging Corp. of America | 1,224,814 | |||||||||
| 5,718 | Sonoco Products Company | 203,218 | |||||||||
| Total Containers & Packaging | 1,428,032 | ||||||||||
| Distributors – 0.4% | |||||||||||
| 35,933 | Genuine Parts Company | 1,954,755 | |||||||||
| Diversified Consumer Services – 0.1% | |||||||||||
| 7,623 | Apollo Group, Inc., Class A, (2) | 332,973 | |||||||||
Nuveen Investments
16
| Shares | Description (1) | Value | |||||||||
| Diversified Financial Services – 3.8% | |||||||||||
| 431,400 | Bank of America Corporation | $ | 4,728,144 | ||||||||
| 59,984 | Citigroup Inc. | 2,497,734 | |||||||||
| 6,790 | CME Group, Inc. | 1,979,896 | |||||||||
| 221,884 | JP Morgan Chase & Co. | 9,083,931 | |||||||||
| 47,644 | New York Stock Exchange Euronext | 1,632,760 | |||||||||
| Total Diversified Financial Services | 19,922,465 | ||||||||||
| Diversified Telecommunication Services – 4.1% | |||||||||||
| 369,433 | AT&T Inc. | 11,603,890 | |||||||||
| 21,268 | CenturyLink Inc. | 859,865 | |||||||||
| 250,097 | Frontier Communications Corporation | 2,018,283 | |||||||||
| 171,164 | Verizon Communications Inc. | 6,372,436 | |||||||||
| 18,198 | Windstream Corporation | 235,846 | |||||||||
| Total Diversified Telecommunication Services | 21,090,320 | ||||||||||
| Electric Utilities – 1.6% | |||||||||||
| 3,600 | DPL Inc. | 108,576 | |||||||||
| 117,418 | Duke Energy Corporation | 2,210,981 | |||||||||
| 7,571 | Exelon Corporation | 324,342 | |||||||||
| 27,323 | Great Plains Energy Incorporated | 566,406 | |||||||||
| 80,800 | Pepco Holdings, Inc. | 1,586,104 | |||||||||
| 29,370 | Progress Energy, Inc. | 1,410,054 | |||||||||
| 49,446 | Southern Company | 1,996,629 | |||||||||
| Total Electric Utilities | 8,203,092 | ||||||||||
| Electrical Equipment – 0.9% | |||||||||||
| 56,514 | Emerson Electric Company | 3,178,913 | |||||||||
| 14,553 | Rockwell Automation, Inc. | 1,262,618 | |||||||||
| Total Electrical Equipment | 4,441,531 | ||||||||||
| Electronic Equipment & Instruments – 0.4% | |||||||||||
| 118,215 | Corning Incorporated | 2,145,602 | |||||||||
| Energy Equipment & Services – 2.7% | |||||||||||
| 6,964 | Diamond Offshore Drilling, Inc. | 490,335 | |||||||||
| 18,452 | ENSCO International PLC, Sponsored ADR | 983,492 | |||||||||
| 94,619 | Halliburton Company | 4,825,569 | |||||||||
| 7,759 | Patterson-UTI Energy, Inc. | 245,262 | |||||||||
| 77,647 | Schlumberger Limited | 6,708,701 | |||||||||
| 16,157 | Tidewater Inc. | 869,408 | |||||||||
| Total Energy Equipment & Services | 14,122,767 | ||||||||||
| Food & Staples Retailing – 1.5% | |||||||||||
| 78,752 | CVS Caremark Corporation | 2,959,500 | |||||||||
| 38,696 | SUPERVALU INC. | 364,129 | |||||||||
| 89,624 | Wal-Mart Stores, Inc. | 4,762,619 | |||||||||
| Total Food & Staples Retailing | 8,086,248 | ||||||||||
| Food Products – 1.1% | |||||||||||
| 138,885 | Kraft Foods Inc., Class A | 4,892,919 | |||||||||
| 57,000 | Sara Lee Corporation | 1,082,430 | |||||||||
| Total Food Products | 5,975,349 | ||||||||||
Nuveen Investments
17
JPZ
Nuveen Equity Premium Income Fund (continued)
Portfolio of INVESTMENTS June 30, 2011 (Unaudited)
| Shares | Description (1) | Value | |||||||||
| Gas Utilities – 1.2% | |||||||||||
| 14,837 | AGL Resources Inc. | $ | 604,014 | ||||||||
| 28,666 | Atmos Energy Corporation | 953,145 | |||||||||
| 22,995 | National Fuel Gas Company | 1,674,036 | |||||||||
| 25,417 | Nicor Inc. | 1,391,327 | |||||||||
| 23,291 | ONEOK, Inc. | 1,723,767 | |||||||||
| Total Gas Utilities | 6,346,289 | ||||||||||
| Health Care Equipment & Supplies – 0.8% | |||||||||||
| 4,460 | Hologic Inc., (2) | 89,958 | |||||||||
| 3,518 | Intuitive Surgical, Inc., (2) | 1,309,083 | |||||||||
| 70,006 | Medtronic, Inc. | 2,697,331 | |||||||||
| Total Health Care Equipment & Supplies | 4,096,372 | ||||||||||
| Health Care Providers & Services – 2.2% | |||||||||||
| 6,901 | Brookdale Senior Living Inc., (2) | 167,349 | |||||||||
| 15,450 | Coventry Health Care, Inc., (2) | 563,462 | |||||||||
| 35,037 | Express Scripts, Inc., (2) | 1,891,297 | |||||||||
| 1,116 | Henry Schein Inc., (2) | 79,894 | |||||||||
| 39,267 | Kindred Healthcare Inc., (2) | 843,062 | |||||||||
| 30,795 | Medco Health Solutions, Inc., (2) | 1,740,533 | |||||||||
| 81,792 | UnitedHealth Group Incorporated | 4,218,831 | |||||||||
| 25,221 | Wellpoint Inc. | 1,986,658 | |||||||||
| Total Health Care Providers & Services | 11,491,086 | ||||||||||
| Health Care Technology – 0.0% | |||||||||||
| 114 | Cerner Corporation, (2) | 6,967 | |||||||||
| Hotels, Restaurants & Leisure – 1.3% | |||||||||||
| 17,800 | Carnival Corporation | 669,814 | |||||||||
| 42,761 | International Game Technology | 751,738 | |||||||||
| 2,272 | Interval Leisure Group Inc., (2) | 31,104 | |||||||||
| 65,173 | McDonald's Corporation | 5,495,387 | |||||||||
| Total Hotels, Restaurants & Leisure | 6,948,043 | ||||||||||
| Household Durables – 0.8% | |||||||||||
| 9,688 | Garmin Limited | 319,995 | |||||||||
| 64,653 | Newell Rubbermaid Inc. | 1,020,224 | |||||||||
| 22,404 | Tupperware Corporation | 1,511,150 | |||||||||
| 13,735 | Whirlpool Corporation | 1,116,930 | |||||||||
| Total Household Durables | 3,968,299 | ||||||||||
| Household Products – 1.8% | |||||||||||
| 17,806 | Colgate-Palmolive Company | 1,556,422 | |||||||||
| 9,545 | Kimberly-Clark Corporation | 635,315 | |||||||||
| 111,556 | Procter & Gamble Company | 7,091,615 | |||||||||
| Total Household Products | 9,283,352 | ||||||||||
| Industrial Conglomerates – 2.6% | |||||||||||
| 21,942 | 3M Co. | 2,081,199 | |||||||||
| 602,889 | General Electric Company | 11,370,486 | |||||||||
| 57 | Siemens AG, Sponsored ADR | 7,839 | |||||||||
| Total Industrial Conglomerates | 13,459,524 | ||||||||||
Nuveen Investments
18
| Shares | Description (1) | Value | |||||||||
| Insurance – 2.3% | |||||||||||
| 53,219 | Allstate Corporation | $ | 1,624,776 | ||||||||
| 11,874 | Arthur J. Gallagher & Co. | 338,884 | |||||||||
| 46,985 | Fidelity National Title Group Inc., Class A | 739,544 | |||||||||
| 26,683 | Hartford Financial Services Group, Inc. | 703,631 | |||||||||
| 72,716 | Lincoln National Corporation | 2,071,679 | |||||||||
| 72,500 | Marsh & McLennan Companies, Inc. | 2,261,275 | |||||||||
| 41,050 | Travelers Companies, Inc. | 2,396,499 | |||||||||
| 52,700 | Unitrin, Inc. | 1,563,609 | |||||||||
| Total Insurance | 11,699,897 | ||||||||||
| Internet & Catalog Retail – 0.9% | |||||||||||
| 15,029 | Amazon.com, Inc., (2) | 3,073,280 | |||||||||
| 3,103 | HSN, Inc., (2) | 102,151 | |||||||||
| 2,786 | Priceline.com Incorporated, (2) | 1,426,237 | |||||||||
| Total Internet & Catalog Retail | 4,601,668 | ||||||||||
| Internet Software & Services – 1.8% | |||||||||||
| 10,937 | Akamai Technologies, Inc., (2) | 344,187 | |||||||||
| 54,590 | eBay Inc., (2) | 1,761,619 | |||||||||
| 10,444 | Google Inc., Class A, (2) | 5,288,633 | |||||||||
| 44,605 | United Online, Inc. | 268,968 | |||||||||
| 5,616 | ValueClick, Inc., (2) | 93,226 | |||||||||
| 10,122 | VeriSign, Inc. | 338,682 | |||||||||
| 72,091 | Yahoo! Inc., (2) | 1,084,249 | |||||||||
| Total Internet Software & Services | 9,179,564 | ||||||||||
| IT Services – 3.3% | |||||||||||
| 34,420 | Automatic Data Processing, Inc. | 1,813,246 | |||||||||
| 17,199 | Cognizant Technology Solutions Corporation, Class A, (2) | 1,261,375 | |||||||||
| 32,696 | Fidelity National Information Services | 1,006,710 | |||||||||
| 52,863 | International Business Machines Corporation (IBM) | 9,068,648 | |||||||||
| 3,197 | Lender Processing Services Inc. | 66,849 | |||||||||
| 6,331 | MasterCard, Inc. | 1,907,784 | |||||||||
| 37,571 | Paychex, Inc. | 1,154,181 | |||||||||
| 9,906 | Visa Inc. | 834,680 | |||||||||
| Total IT Services | 17,113,473 | ||||||||||
| Leisure Equipment & Products – 0.3% | |||||||||||
| 39,513 | Eastman Kodak Company, (2) | 141,457 | |||||||||
| 11,848 | Polaris Industries Inc. | 1,317,142 | |||||||||
| Total Leisure Equipment & Products | 1,458,599 | ||||||||||
| Machinery – 2.9% | |||||||||||
| 27,218 | Caterpillar Inc. | 2,897,628 | |||||||||
| 21,029 | Cummins Inc. | 2,176,291 | |||||||||
| 20,249 | Deere & Company | 1,669,530 | |||||||||
| 13,600 | Graco Inc. | 688,976 | |||||||||
| 4,107 | Ingersoll Rand Company Limited, Class A | 186,499 | |||||||||
| 16,893 | Parker Hannifin Corporation | 1,515,978 | |||||||||
| 11,767 | Snap-on Incorporated | 735,202 | |||||||||
| 25,530 | SPX Corporation | 2,110,310 | |||||||||
| 31,571 | Stanley Black & Decker Inc. | 2,274,691 | |||||||||
| 12,000 | Timken Company | 604,800 | |||||||||
| Total Machinery | 14,859,905 | ||||||||||
Nuveen Investments
19
JPZ
Nuveen Equity Premium Income Fund (continued)
Portfolio of INVESTMENTS June 30, 2011 (Unaudited)
| Shares | Description (1) | Value | |||||||||
| Media – 2.4% | |||||||||||
| 60,282 | CBS Corporation, Class B | $ | 1,717,434 | ||||||||
| 111,049 | Comcast Corporation, Class A | 2,813,982 | |||||||||
| 39,613 | New York Times, Class A, (2) | 345,425 | |||||||||
| 35,396 | Omnicom Group, Inc. | 1,704,671 | |||||||||
| 114,479 | Regal Entertainment Group, Class A | 1,413,816 | |||||||||
| 116,789 | Walt Disney Company | 4,559,443 | |||||||||
| Total Media | 12,554,771 | ||||||||||
| Metals & Mining – 0.9% | |||||||||||
| 73,484 | Alcoa Inc. | 1,165,456 | |||||||||
| 15,746 | Freeport-McMoRan Copper & Gold, Inc. | 832,963 | |||||||||
| 3,526 | Newmont Mining Corporation | 190,298 | |||||||||
| 27,262 | Nucor Corporation | 1,123,740 | |||||||||
| 35,874 | Southern Copper Corporation | 1,179,178 | |||||||||
| Total Metals & Mining | 4,491,635 | ||||||||||
| Multiline Retail – 1.1% | |||||||||||
| 10 | Dollar Tree Stores Inc., (2) | 666 | |||||||||
| 4,000 | Family Dollar Stores, Inc. | 210,240 | |||||||||
| 41,402 | Macy's, Inc. | 1,210,594 | |||||||||
| 43,705 | Nordstrom, Inc. | 2,051,513 | |||||||||
| 8,076 | Sears Holding Corporation, (2) | 576,949 | |||||||||
| 39,261 | Target Corporation | 1,841,734 | |||||||||
| Total Multiline Retail | 5,891,696 | ||||||||||
| Multi-Utilities – 2.1% | |||||||||||
| 40,360 | Ameren Corporation | 1,163,982 | |||||||||
| 31,482 | Consolidated Edison, Inc. | 1,676,102 | |||||||||
| 71,595 | Integrys Energy Group, Inc. | 3,711,485 | |||||||||
| 15,861 | Northwestern Corporation | 525,158 | |||||||||
| 29,588 | OGE Energy Corp. | 1,488,868 | |||||||||
| 66,981 | Public Service Enterprise Group Incorporated | 2,186,260 | |||||||||
| Total Multi-Utilities | 10,751,855 | ||||||||||
| Oil, Gas & Consumable Fuels – 10.0% | |||||||||||
| 9,051 | Cenovus Energy Inc. | 340,861 | |||||||||
| 103,947 | Chevron Corporation | 10,689,908 | |||||||||
| 87,085 | ConocoPhillips | 6,547,921 | |||||||||
| 42,389 | CONSOL Energy Inc. | 2,055,019 | |||||||||
| 27,271 | Continental Resources Inc., (2) | 1,770,161 | |||||||||
| 9,051 | EnCana Corporation | 278,680 | |||||||||
| 32,690 | EOG Resources, Inc. | 3,417,740 | |||||||||
| 235,849 | Exxon Mobil Corporation | 19,193,390 | |||||||||
| 46,328 | Occidental Petroleum Corporation | 4,819,965 | |||||||||
| 9,397 | Total SA, Sponsored ADR | 543,522 | |||||||||
| 81,049 | Valero Energy Corporation | 2,072,423 | |||||||||
| Total Oil, Gas & Consumable Fuels | 51,729,590 | ||||||||||
| Pharmaceuticals – 7.0% | |||||||||||
| 95,715 | Abbott Laboratories | 5,036,523 | |||||||||
| 135,808 | Bristol-Myers Squibb Company | 3,933,000 | |||||||||
| 61,545 | Eli Lilly and Company | 2,309,784 | |||||||||
| 129,853 | Johnson & Johnson | 8,637,822 | |||||||||
| 180,077 | Merck & Company Inc. | 6,354,917 | |||||||||
| 448,586 | Pfizer Inc. | 9,240,872 | |||||||||
| 14,222 | Sanofi-Aventis, Sponsored ADR | 571,298 | |||||||||
| Total Pharmaceuticals | 36,084,216 | ||||||||||
Nuveen Investments
20
| Shares | Description (1) | Value | |||||||||
| Professional Services – 0.1% | |||||||||||
| 3,665 | Manpower Inc. | $ | 196,627 | ||||||||
| 20,209 | Resources Connection, Inc. | 243,316 | |||||||||
| Total Professional Services | 439,943 | ||||||||||
| Real Estate Investment Trust – 2.6% | |||||||||||
| 67,906 | Annaly Capital Management Inc. | 1,225,024 | |||||||||
| 46,493 | Brandywine Realty Trust | 538,854 | |||||||||
| 54,183 | CapLease Inc. | 266,039 | |||||||||
| 29,228 | CommonWealth REIT | 755,252 | |||||||||
| 24,662 | Health Care REIT, Inc. | 1,293,029 | |||||||||
| 49,625 | Healthcare Realty Trust, Inc. | 1,023,764 | |||||||||
| 45,684 | Hospitality Properties Trust | 1,107,837 | |||||||||
| 88,469 | Lexington Corporate Properties Trust | 807,722 | |||||||||
| 30,821 | Liberty Property Trust | 1,004,148 | |||||||||
| 17,263 | Medical Properties Trust Inc. | 198,525 | |||||||||
| 28,311 | MFA Mortgage Investments, Inc. | 227,620 | |||||||||
| 35,994 | Nationwide Health Properties, Inc. | 1,490,512 | |||||||||
| 30,300 | Senior Housing Properties Trust | 709,323 | |||||||||
| 11,215 | Sun Communities Inc. | 418,432 | |||||||||
| 61,650 | U-Store-It Trust | 648,558 | |||||||||
| 71,406 | Weyerhaeuser Company | 1,560,935 | |||||||||
| Total Real Estate Investment Trust | 13,275,574 | ||||||||||
| Road & Rail – 0.7% | |||||||||||
| 14,565 | Norfolk Southern Corporation | 1,091,355 | |||||||||
| 22,275 | Union Pacific Corporation | 2,325,510 | |||||||||
| Total Road & Rail | 3,416,865 | ||||||||||
| Semiconductors & Equipment – 2.5% | |||||||||||
| 27,457 | Analog Devices, Inc. | 1,074,667 | |||||||||
| 96,369 | Applied Materials, Inc. | 1,253,761 | |||||||||
| 21,444 | Broadcom Corporation, Class A | 721,376 | |||||||||
| 276,007 | Intel Corporation | 6,116,315 | |||||||||
| 12,846 | Intersil Holding Corporation, Class A | 165,071 | |||||||||
| 3,087 | Lam Research Corporation, (2) | 136,692 | |||||||||
| 20,476 | Microchip Technology Incorporated | 776,245 | |||||||||
| 24,800 | National Semiconductor Corporation | 610,328 | |||||||||
| 27,856 | NVIDIA Corporation, (2) | 443,885 | |||||||||
| 46,579 | Texas Instruments Incorporated | 1,529,189 | |||||||||
| Total Semiconductors & Equipment | 12,827,529 | ||||||||||
| Software – 3.6% | |||||||||||
| 23,572 | Adobe Systems Incorporated, (2) | 741,339 | |||||||||
| 18,599 | Autodesk, Inc., (2) | 717,921 | |||||||||
| 365,455 | Microsoft Corporation | 9,501,830 | |||||||||
| 184,533 | Oracle Corporation | 6,072,981 | |||||||||
| 9,475 | Salesforce.com, Inc., (2) | 1,411,586 | |||||||||
| Total Software | 18,445,657 | ||||||||||
| Specialty Retail – 2.4% | |||||||||||
| 23,495 | Abercrombie & Fitch Co., Class A | 1,572,285 | |||||||||
| 46,762 | American Eagle Outfitters, Inc. | 596,216 | |||||||||
| 27,081 | Best Buy Co., Inc. | 850,614 | |||||||||
| 98,969 | Home Depot, Inc. | 3,584,657 | |||||||||
| 43,580 | Limited Brands, Inc. | 1,675,651 | |||||||||
| 81,590 | Lowe's Companies, Inc. | 1,901,863 | |||||||||
| 236 | Ross Stores, Inc. | 18,908 | |||||||||
Nuveen Investments
21
JPZ
Nuveen Equity Premium Income Fund (continued)
Portfolio of INVESTMENTS June 30, 2011 (Unaudited)
| Shares | Description (1) | Value | |||||||||
| Specialty Retail (continued) | |||||||||||
| 13,465 | Tiffany & Co. | $ | 1,057,272 | ||||||||
| 21,015 | TJX Companies, Inc. | 1,103,918 | |||||||||
| Total Specialty Retail | 12,361,384 | ||||||||||
| Textiles, Apparel & Luxury Goods – 0.4% | |||||||||||
| 7,159 | Cherokee Inc. | 122,848 | |||||||||
| 17,298 | VF Corporation | 1,877,871 | |||||||||
| Total Textiles, Apparel & Luxury Goods | 2,000,719 | ||||||||||
| Thrifts & Mortgage Finance – 0.3% | |||||||||||
| 36,703 | Hudson City Bancorp, Inc. | 300,598 | |||||||||
| 60,610 | New York Community Bancorp Inc. | 908,544 | |||||||||
| 38,788 | TrustCo Bank Corporation NY | 190,061 | |||||||||
| Total Thrifts & Mortgage Finance | 1,399,203 | ||||||||||
| Tobacco – 2.0% | |||||||||||
| 128,746 | Altria Group, Inc. | 3,400,182 | |||||||||
| 90,579 | Philip Morris International | 6,047,960 | |||||||||
| 21,468 | Reynolds American Inc. | 795,389 | |||||||||
| 1 | Vector Group Ltd. | 18 | |||||||||
| Total Tobacco | 10,243,549 | ||||||||||
| Wireless Telecommunication Services – 0.0% | |||||||||||
| 5,500 | USA Mobility Inc. | 83,930 | |||||||||
| Total Common Stocks (cost $415,711,876) | 505,748,183 | ||||||||||
| Principal Amount (000) | Description | Coupon | Maturity | Value | |||||||||||||||
| Short-Term Investments – 6.9% | |||||||||||||||||||
| $ | 35,715 | Repurchase Agreement with Fixed Income Clearing Corporation, dated 6/30/11, repurchase price | 0.010 | % | 7/01/11 | $ | 35,715,353 | ||||||||||||
| $35,715,363, collateralized by $6,245,000 U.S. Treasury Notes, 0.625%, due 1/31/13, value $6,284,031, | |||||||||||||||||||
| and $30,000,000 U.S. Treasury Notes, 0.625%, due 2/28/13, value $30,150,000 | |||||||||||||||||||
| Total Short-Term Investments (cost $35,715,353) | 35,715,353 | ||||||||||||||||||
| Total Investments (cost $451,427,229) – 104.8% | 541,463,536 | ||||||||||||||||||
| Other Assets Less Liabilities – (4.8)% (5) | (24,617,307 | ) | |||||||||||||||||
| Net Assets – 100% | $ | 516,846,229 | |||||||||||||||||
Nuveen Investments
22
Investments in Derivatives
Call Options Written at June 30, 2011:
| Number of Contracts | Type | Notional Amount (3) | Expiration Date | Strike Price | Value | ||||||||||||||||||
| Call Options Written – (3.1)% (4) | |||||||||||||||||||||||
| (479 | ) | S&P 500 INDEX | $ | (60,593,500 | ) | 7/16/11 | 1,265 | $ | (2,756,645 | ) | |||||||||||||
| (473 | ) | S&P 500 INDEX | (60,307,500 | ) | 7/16/11 | 1,275 | (2,289,320 | ) | |||||||||||||||
| (455 | ) | S&P 500 INDEX | (59,150,000 | ) | 7/16/11 | 1,300 | (1,242,150 | ) | |||||||||||||||
| (488 | ) | S&P 500 INDEX | (64,660,000 | ) | 7/16/11 | 1,325 | (531,920 | ) | |||||||||||||||
| (505 | ) | S&P 500 INDEX | (64,387,500 | ) | 8/20/11 | 1,275 | (2,926,475 | ) | |||||||||||||||
| (478 | ) | S&P 500 INDEX | (61,423,000 | ) | 8/20/11 | 1,285 | (2,401,950 | ) | |||||||||||||||
| (461 | ) | S&P 500 INDEX | (59,930,000 | ) | 8/20/11 | 1,300 | (1,823,255 | ) | |||||||||||||||
| (475 | ) | S&P 500 INDEX | (61,750,000 | ) | 9/17/11 | 1,300 | (2,249,125 | ) | |||||||||||||||
| (3,814 | ) | Total Call Options Written (premiums received $13,822,570) | $ | (492,201,500 | ) | $ | (16,220,840 | ) | |||||||||||||||
For Fund portfolio compliance purposes, the Fund's industry classifications refer to any one or more of the industry sub-classifications used by one or more widely recognized market indexes or ratings group indexes, and/or as defined by Fund management. This definition may not apply for purposes of this report, which may combine industry sub-classifications into sectors for reporting ease.
(1) All percentages in the Portfolio of Investments are based on net assets.
(2) Non-income producing; issuer has not declared a dividend within the past twelve months.
(3) For disclosure purposes, Notional Amount is calculated by multiplying the Number of Contracts by the Strike Price by 100.
(4) The Fund may designate up to 100% of its common stock investments to cover outstanding call options written.
(5) Other Assets Less Liabilities includes the Value of derivative instruments as noted in the Investments in Derivatives.
ADR American Depositary Receipt.
See accompanying notes to financial statements.
Nuveen Investments
23
JSN
Nuveen Equity Premium Opportunity Fund
Portfolio of INVESTMENTS
June 30, 2011 (Unaudited)
| Shares | Description (1) | Value | |||||||||
| Common Stocks – 99.9% | |||||||||||
| Aerospace & Defense – 1.8% | |||||||||||
| 55,435 | Boeing Company | $ | 4,098,310 | ||||||||
| 58,489 | Honeywell International Inc. | 3,485,360 | |||||||||
| 5,228 | Huntington Ingalls Industries Inc., (2) | 180,366 | |||||||||
| 21,464 | Lockheed Martin Corporation | 1,737,940 | |||||||||
| 34,529 | Northrop Grumman Corporation | 2,394,586 | |||||||||
| 32,796 | Raytheon Company | 1,634,881 | |||||||||
| 32,442 | United Technologies Corporation | 2,871,441 | |||||||||
| Total Aerospace & Defense | 16,402,884 | ||||||||||
| Air Freight & Logistics – 0.9% | |||||||||||
| 106,694 | United Parcel Service, Inc., Class B | 7,781,193 | |||||||||
| Airlines – 0.1% | |||||||||||
| 138,259 | AMR Corporation, (2) | 746,599 | |||||||||
| Auto Components – 0.4% | |||||||||||
| 127,177 | Gentex Corporation | 3,844,561 | |||||||||
| Automobiles – 0.4% | |||||||||||
| 168,773 | Ford Motor Company, (2) | 2,327,380 | |||||||||
| 33,442 | Harley-Davidson, Inc. | 1,370,119 | |||||||||
| Total Automobiles | 3,697,499 | ||||||||||
| Beverages – 2.2% | |||||||||||
| 153,332 | Coca-Cola Company | 10,317,710 | |||||||||
| 128,840 | PepsiCo, Inc. | 9,074,201 | |||||||||
| Total Beverages | 19,391,911 | ||||||||||
| Biotechnology – 1.4% | |||||||||||
| 106,815 | Celgene Corporation, (2) | 6,443,081 | |||||||||
| 152,557 | Gilead Sciences, Inc., (2) | 6,317,385 | |||||||||
| Total Biotechnology | 12,760,466 | ||||||||||
| Capital Markets – 1.8% | |||||||||||
| 159,239 | Charles Schwab Corporation | 2,619,482 | |||||||||
| 48,725 | Eaton Vance Corporation | 1,472,957 | |||||||||
| 29,329 | Goldman Sachs Group, Inc. | 3,903,397 | |||||||||
| 43,099 | Legg Mason, Inc. | 1,411,923 | |||||||||
| 129,834 | Morgan Stanley | 2,987,480 | |||||||||
| 93,004 | Waddell & Reed Financial, Inc., Class A | 3,380,695 | |||||||||
| Total Capital Markets | 15,775,934 | ||||||||||
| Chemicals – 1.9% | |||||||||||
| 53,576 | Dow Chemical Company | 1,928,736 | |||||||||
| 49,591 | E.I. Du Pont de Nemours and Company | 2,680,394 | |||||||||
| 35,463 | Eastman Chemical Company | 3,619,708 | |||||||||
| 22,467 | Lubrizol Corporation | 3,016,644 | |||||||||
Nuveen Investments
24
| Shares | Description (1) | Value | |||||||||
| Chemicals (continued) | |||||||||||
| 42,416 | Monsanto Company | $ | 3,076,857 | ||||||||
| 2,617 | Potash Corporation of Saskatchewan | 149,143 | |||||||||
| 103,452 | RPM International, Inc. | 2,381,465 | |||||||||
| Total Chemicals | 16,852,947 | ||||||||||
| Commercial Banks – 2.1% | |||||||||||
| 65,480 | Fifth Third Bancorp. | 834,870 | |||||||||
| 86,613 | First Horizon National Corporation | 826,288 | |||||||||
| 2,289 | HSBC Holdings PLC, Sponsored ADR | 113,580 | |||||||||
| 6 | Lloyds Banking Group PLC, Sponsored ADR, (2) | 19 | |||||||||
| 43,429 | Toronto-Dominion Bank | 3,687,122 | |||||||||
| 197,603 | U.S. Bancorp | 5,040,853 | |||||||||
| 293,001 | Wells Fargo & Company | 8,221,608 | |||||||||
| Total Commercial Banks | 18,724,340 | ||||||||||
| Commercial Services & Supplies – 0.7% | |||||||||||
| 81,168 | Deluxe Corporation | 2,005,661 | |||||||||
| 49,936 | R.R. Donnelley & Sons Company | 979,245 | |||||||||
| 77,545 | Waste Management, Inc. | 2,890,102 | |||||||||
| Total Commercial Services & Supplies | 5,875,008 | ||||||||||
| Communications Equipment – 3.9% | |||||||||||
| 49,954 | ADTRAN, Inc. | 1,933,719 | |||||||||
| 13,861 | Aviat Networks Inc., (2) | 54,612 | |||||||||
| 608,076 | Cisco Systems, Inc. | 9,492,066 | |||||||||
| 41,824 | Harris Corporation | 1,884,589 | |||||||||
| 2,683 | Motorola Mobility Holdings Inc., (2) | 59,133 | |||||||||
| 11,914 | Motorola Solutions Inc. | 548,521 | |||||||||
| 328,059 | QUALCOMM, Inc. | 18,630,471 | |||||||||
| 60,051 | Research In Motion Limited, (2) | 1,732,471 | |||||||||
| Total Communications Equipment | 34,335,582 | ||||||||||
| Computers & Peripherals – 7.9% | |||||||||||
| 167,062 | Apple, Inc., (2) | 56,077,705 | |||||||||
| 155,158 | Dell Inc., (2) | 2,586,484 | |||||||||
| 157,114 | EMC Corporation, (2) | 4,328,491 | |||||||||
| 125,310 | Hewlett-Packard Company | 4,561,284 | |||||||||
| 53,163 | NetApp Inc., (2) | 2,805,943 | |||||||||
| Total Computers & Peripherals | 70,359,907 | ||||||||||
| Consumer Finance – 0.8% | |||||||||||
| 69,503 | American Express Company | 3,593,305 | |||||||||
| 72,637 | Discover Financial Services | 1,943,040 | |||||||||
| 77,393 | SLM Corporation | 1,300,976 | |||||||||
| Total Consumer Finance | 6,837,321 | ||||||||||
| Containers & Packaging – 0.5% | |||||||||||
| 78,989 | Packaging Corp. of America | 2,210,902 | |||||||||
| 50,628 | Sonoco Products Company | 1,799,319 | |||||||||
| Total Containers & Packaging | 4,010,221 | ||||||||||
| Distributors – 0.3% | |||||||||||
| 55,680 | Genuine Parts Company | 3,028,992 | |||||||||
| Diversified Consumer Services – 0.1% | |||||||||||
| 35,953 | Hillenbrand Inc. | 850,288 | |||||||||
Nuveen Investments
25
JSN
Nuveen Equity Premium Opportunity Fund (continued)
Portfolio of INVESTMENTS June 30, 2011 (Unaudited)
| Shares | Description (1) | Value | |||||||||
| Diversified Financial Services – 2.9% | |||||||||||
| 559,959 | Bank of America Corporation | $ | 6,137,151 | ||||||||
| 96,477 | Citigroup Inc. | 4,017,302 | |||||||||
| 11,226 | CME Group, Inc. | 3,273,389 | |||||||||
| 110,655 | ING Groep N.V, Sponsored ADR, (2) | 1,368,802 | |||||||||
| 267,870 | JP Morgan Chase & Co. | 10,966,598 | |||||||||
| Total Diversified Financial Services | 25,763,242 | ||||||||||
| Diversified Telecommunication Services – 2.7% | |||||||||||
| 518,103 | AT&T Inc. | 16,273,615 | |||||||||
| 44,021 | Frontier Communications Corporation | 355,249 | |||||||||
| 190,640 | Verizon Communications Inc. | 7,097,527 | |||||||||
| Total Diversified Telecommunication Services | 23,726,391 | ||||||||||
| Electric Utilities – 1.4% | |||||||||||
| 128,436 | Companhia Energetica de Minas Gerais, Sponsored ADR | 2,650,919 | |||||||||
| 193,791 | Duke Energy Corporation | 3,649,085 | |||||||||
| 112,676 | Great Plains Energy Incorporated | 2,335,773 | |||||||||
| 129,707 | Pepco Holdings, Inc. | 2,546,148 | |||||||||
| 25,438 | Pinnacle West Capital Corporation | 1,134,026 | |||||||||
| Total Electric Utilities | 12,315,951 | ||||||||||
| Electrical Equipment – 1.5% | |||||||||||
| 23,275 | Cooper Industries Inc. | 1,388,819 | |||||||||
| 69,498 | Emerson Electric Company | 3,909,263 | |||||||||
| 11,240 | Hubbell Incorporated, Class B | 730,038 | |||||||||
| 31,575 | Rockwell Automation, Inc. | 2,739,447 | |||||||||
| 49,398 | Roper Industries Inc. | 4,114,853 | |||||||||
| Total Electrical Equipment | 12,882,420 | ||||||||||
| Electronic Equipment & Instruments – 0.3% | |||||||||||
| 131,698 | Corning Incorporated | 2,390,319 | |||||||||
| Energy Equipment & Services – 2.3% | |||||||||||
| 25,308 | Diamond Offshore Drilling, Inc. | 1,781,936 | |||||||||
| 36,079 | ENSCO International PLC, Sponsored ADR | 1,923,011 | |||||||||
| 139,359 | Halliburton Company | 7,107,309 | |||||||||
| 54,107 | Patterson-UTI Energy, Inc. | 1,710,322 | |||||||||
| 77,123 | Schlumberger Limited | 6,663,427 | |||||||||
| 17,510 | Tidewater Inc. | 942,213 | |||||||||
| Total Energy Equipment & Services | 20,128,218 | ||||||||||
| Food & Staples Retailing – 1.9% | |||||||||||
| 102,543 | CVS Caremark Corporation | 3,853,566 | |||||||||
| 82,219 | Kroger Co. | 2,039,031 | |||||||||
| 38,974 | SUPERVALU INC. | 366,745 | |||||||||
| 64,547 | Walgreen Co. | 2,740,666 | |||||||||
| 154,012 | Wal-Mart Stores, Inc. | 8,184,198 | |||||||||
| Total Food & Staples Retailing | 17,184,206 | ||||||||||
| Food Products – 0.8% | |||||||||||
| 148,933 | Kraft Foods Inc., Class A | 5,246,910 | |||||||||
| 109,395 | Sara Lee Corporation | 2,077,411 | |||||||||
| Total Food Products | 7,324,321 | ||||||||||
Nuveen Investments
26
| Shares | Description (1) | Value | |||||||||
| Gas Utilities – 1.9% | |||||||||||
| 23,164 | AGL Resources Inc. | $ | 943,006 | ||||||||
| 100,700 | Atmos Energy Corporation | 3,348,275 | |||||||||
| 75,051 | National Fuel Gas Company | 5,463,713 | |||||||||
| 62,725 | Nicor Inc. | 3,433,567 | |||||||||
| 49,805 | ONEOK, Inc. | 3,686,068 | |||||||||
| Total Gas Utilities | 16,874,629 | ||||||||||
| Health Care Equipment & Supplies – 1.6% | |||||||||||
| 65,107 | Baxter International, Inc. | 3,886,237 | |||||||||
| 36,821 | Hill Rom Holdings Inc. | 1,695,239 | |||||||||
| 106,091 | Hologic Inc., (2) | 2,139,855 | |||||||||
| 12,205 | Intuitive Surgical, Inc., (2) | 4,541,603 | |||||||||
| 55,838 | Medtronic, Inc. | 2,151,438 | |||||||||
| Total Health Care Equipment & Supplies | 14,414,372 | ||||||||||
| Health Care Providers & Services – 2.1% | |||||||||||
| 39,994 | Aetna Inc. | 1,763,335 | |||||||||
| 62,293 | Brookdale Senior Living Inc., (2) | 1,510,605 | |||||||||
| 27,564 | Coventry Health Care, Inc., (2) | 1,005,259 | |||||||||
| 125,773 | Express Scripts, Inc., (2) | 6,789,227 | |||||||||
| 90,568 | UnitedHealth Group Incorporated | 4,671,497 | |||||||||
| 42,124 | Wellpoint Inc. | 3,318,107 | |||||||||
| Total Health Care Providers & Services | 19,058,030 | ||||||||||
| Hotels, Restaurants & Leisure – 1.7% | |||||||||||
| 51,390 | International Game Technology | 903,436 | |||||||||
| 1,237 | Las Vegas Sands, (2) | 52,214 | |||||||||
| 107,409 | McDonald's Corporation | 9,056,727 | |||||||||
| 21,179 | Starwood Hotels & Resorts Worldwide, Inc. | 1,186,871 | |||||||||
| 28,492 | Wynn Resorts Ltd | 4,089,742 | |||||||||
| Total Hotels, Restaurants & Leisure | 15,288,990 | ||||||||||
| Household Durables – 0.4% | |||||||||||
| 97,917 | KB Home | 957,628 | |||||||||
| 54,753 | Newell Rubbermaid Inc. | 864,002 | |||||||||
| 19,851 | Whirlpool Corporation | 1,614,283 | |||||||||
| Total Household Durables | 3,435,913 | ||||||||||
| Household Products – 1.4% | |||||||||||
| 37,780 | Colgate-Palmolive Company | 3,302,350 | |||||||||
| 151,333 | Procter & Gamble Company | 9,620,239 | |||||||||
| Total Household Products | 12,922,589 | ||||||||||
| Industrial Conglomerates – 1.6% | |||||||||||
| 21,069 | 3M Co. | 1,998,395 | |||||||||
| 654,736 | General Electric Company | 12,348,321 | |||||||||
| Total Industrial Conglomerates | 14,346,716 | ||||||||||
| Insurance – 1.4% | |||||||||||
| 69,792 | Allstate Corporation | 2,130,750 | |||||||||
| 10,390 | American International Group, (2) | 304,635 | |||||||||
| 26,066 | Arthur J. Gallagher & Co. | 743,924 | |||||||||
| 92,800 | CNO Financial Group Inc., (2) | 734,048 | |||||||||
| 189,397 | Fidelity National Title Group Inc., Class A | 2,981,109 | |||||||||
| 50,700 | Genworth Financial Inc., Class A, (2) | 521,196 | |||||||||
| 13,651 | Hartford Financial Services Group, Inc. | 359,977 | |||||||||
Nuveen Investments
27
JSN
Nuveen Equity Premium Opportunity Fund (continued)
Portfolio of INVESTMENTS June 30, 2011 (Unaudited)
| Shares | Description (1) | Value | |||||||||
| Insurance (continued) | |||||||||||
| 35,717 | Lincoln National Corporation | $ | 1,017,577 | ||||||||
| 103,489 | Marsh & McLennan Companies, Inc. | 3,227,822 | |||||||||
| 13,952 | Unitrin, Inc. | 413,956 | |||||||||
| Total Insurance | 12,434,994 | ||||||||||
| Internet & Catalog Retail – 1.4% | |||||||||||
| 59,852 | Amazon.com, Inc., (2) | 12,239,135 | |||||||||
| 13,070 | HSN, Inc., (2) | 430,264 | |||||||||
| Total Internet & Catalog Retail | 12,669,399 | ||||||||||
| Internet Software & Services – 4.1% | |||||||||||
| 39,603 | Akamai Technologies, Inc., (2) | 1,246,306 | |||||||||
| 35,740 | Baidu.com, Inc., Sponsored ADR, (2) | 5,008,246 | |||||||||
| 58,343 | Earthlink, Inc. | 448,949 | |||||||||
| 199,069 | eBay Inc., (2) | 6,423,957 | |||||||||
| 34,784 | Google Inc., Class A, (2) | 17,613,922 | |||||||||
| 22,576 | IAC/InterActiveCorp., (2) | 861,726 | |||||||||
| 30,343 | United Online, Inc. | 182,968 | |||||||||
| 83,134 | VeriSign, Inc. | 2,781,664 | |||||||||
| 152,916 | Yahoo! Inc., (2) | 2,299,857 | |||||||||
| Total Internet Software & Services | 36,867,595 | ||||||||||
| IT Services – 2.8% | |||||||||||
| 113,754 | Automatic Data Processing, Inc. | 5,992,561 | |||||||||
| 61,069 | Fidelity National Information Services | 1,880,315 | |||||||||
| 78,819 | International Business Machines Corporation (IBM) | 13,521,399 | |||||||||
| 14,762 | Lender Processing Services Inc. | 308,673 | |||||||||
| 108,876 | Paychex, Inc. | 3,344,671 | |||||||||
| Total IT Services | 25,047,619 | ||||||||||
| Leisure Equipment & Products – 0.4% | |||||||||||
| 77,138 | Mattel, Inc. | 2,120,524 | |||||||||
| 14,833 | Polaris Industries Inc. | 1,648,985 | |||||||||
| Total Leisure Equipment & Products | 3,769,509 | ||||||||||
| Machinery – 2.3% | |||||||||||
| 34,885 | Caterpillar Inc. | 3,713,857 | |||||||||
| 14,525 | Deere & Company | 1,197,586 | |||||||||
| 43,913 | Graco Inc. | 2,224,633 | |||||||||
| 27,670 | Joy Global Inc. | 2,635,291 | |||||||||
| 53,447 | SPX Corporation | 4,417,929 | |||||||||
| 40,513 | Stanley Black & Decker Inc. | 2,918,962 | |||||||||
| 67,275 | Timken Company | 3,390,660 | |||||||||
| Total Machinery | 20,498,918 | ||||||||||
| Media – 3.4% | |||||||||||
| 322,788 | Comcast Corporation, Special Class A | 7,821,153 | |||||||||
| 97,817 | New York Times, Class A, (2) | 852,964 | |||||||||
| 309,975 | News Corporation, Class A | 5,486,558 | |||||||||
| 58,689 | Omnicom Group, Inc. | 2,826,462 | |||||||||
| 118,487 | Regal Entertainment Group, Class A | 1,463,314 | |||||||||
| 355,542 | Sirius XM Radio Inc., (2) | 778,637 | |||||||||
| 44,293 | Viacom Inc., Class B | 2,258,943 | |||||||||
| 188,861 | Walt Disney Company | 7,373,133 | |||||||||
| 149,513 | Warner Music Group Corporation, (2) | 1,228,997 | |||||||||
| Total Media | 30,090,161 | ||||||||||
Nuveen Investments
28
| Shares | Description (1) | Value | |||||||||
| Metals & Mining – 0.9% | |||||||||||
| 74,680 | Alcoa Inc. | $ | 1,184,425 | ||||||||
| 6,261 | Barrick Gold Corporation | 283,561 | |||||||||
| 40,405 | Freeport-McMoRan Copper & Gold, Inc. | 2,137,425 | |||||||||
| 78,900 | Hecla Mining Company, (2) | 606,741 | |||||||||
| 110,872 | Southern Copper Corporation | 3,644,363 | |||||||||
| Total Metals & Mining | 7,856,515 | ||||||||||
| Multiline Retail – 1.2% | |||||||||||
| 63,332 | Macy's, Inc. | 1,851,828 | |||||||||
| 54,585 | Nordstrom, Inc. | 2,562,220 | |||||||||
| 35,573 | Sears Holding Corporation, (2) | 2,541,335 | |||||||||
| 78,189 | Target Corporation | 3,667,846 | |||||||||
| Total Multiline Retail | 10,623,229 | ||||||||||
| Multi-Utilities – 0.9% | |||||||||||
| 62,041 | Ameren Corporation | 1,789,262 | |||||||||
| 57,468 | OGE Energy Corp. | 2,891,790 | |||||||||
| 97,043 | Public Service Enterprise Group Incorporated | 3,167,484 | |||||||||
| Total Multi-Utilities | 7,848,536 | ||||||||||
| Oil, Gas & Consumable Fuels – 7.1% | |||||||||||
| 140,047 | Chevron Corporation | 14,402,433 | |||||||||
| 2,747 | CNOOC Limited, Sponsored ADR | 648,100 | |||||||||
| 116,652 | ConocoPhillips | 8,771,064 | |||||||||
| 358,957 | Exxon Mobil Corporation | 29,211,921 | |||||||||
| 24,173 | Hess Corporation | 1,807,173 | |||||||||
| 58,407 | Occidental Petroleum Corporation | 6,076,664 | |||||||||
| 3,274 | PetroChina Company Limited, Sponsored ADR | 478,102 | |||||||||
| 8,201 | Royal Dutch Shell PLC, Class A, Sponsored ADR | 583,337 | |||||||||
| 40,039 | SandRidge Energy Inc., (2) | 426,816 | |||||||||
| 39,133 | StatoilHydro ASA, Sponsored ADR | 995,935 | |||||||||
| 558 | Suncor Energy, Inc. | 21,818 | |||||||||
| Total Oil, Gas & Consumable Fuels | 63,423,363 | ||||||||||
| Pharmaceuticals – 5.8% | |||||||||||
| 147,092 | Abbott Laboratories | 7,739,981 | |||||||||
| 148,380 | Bristol-Myers Squibb Company | 4,297,085 | |||||||||
| 89,491 | Eli Lilly and Company | 3,358,597 | |||||||||
| 13,432 | GlaxoSmithKline PLC, Sponsored ADR | 576,233 | |||||||||
| 191,724 | Johnson & Johnson | 12,753,480 | |||||||||
| 270,798 | Merck & Company Inc. | 9,556,461 | |||||||||
| 658,432 | Pfizer Inc. | 13,563,699 | |||||||||
| Total Pharmaceuticals | 51,845,536 | ||||||||||
| Professional Services – 0.4% | |||||||||||
| 56,869 | Manpower Inc. | 3,051,022 | |||||||||
| 66,137 | Resources Connection, Inc. | 796,289 | |||||||||
| Total Professional Services | 3,847,311 | ||||||||||
| Real Estate Investment Trust – 1.6% | |||||||||||
| 66,093 | Apartment Investment & Management Company, Class A | 1,687,354 | |||||||||
| 69,975 | Brandywine Realty Trust | 811,010 | |||||||||
| 34,687 | CBL & Associates Properties Inc. | 628,875 | |||||||||
| 114,294 | DCT Industrial Trust Inc. | 597,758 | |||||||||
| 49,733 | Health Care REIT, Inc. | 2,607,501 | |||||||||
| 100,726 | Lexington Corporate Properties Trust | 919,628 | |||||||||
| 46,608 | Liberty Property Trust | 1,518,489 | |||||||||
Nuveen Investments
29
JSN
Nuveen Equity Premium Opportunity Fund (continued)
Portfolio of INVESTMENTS June 30, 2011 (Unaudited)
| Shares | Description (1) | Value | |||||||||
| Real Estate Investment Trust (continued) | |||||||||||
| 105,344 | Nationwide Health Properties, Inc. | $ | 4,362,295 | ||||||||
| 129,993 | U-Store-It Trust | 1,367,526 | |||||||||
| Total Real Estate Investment Trust | 14,500,436 | ||||||||||
| Road & Rail – 0.5% | |||||||||||
| 4,035 | Dollas Thrifty Automotive Group Inc., (2) | 297,541 | |||||||||
| 41,968 | Union Pacific Corporation | 4,381,459 | |||||||||
| Total Road & Rail | 4,679,000 | ||||||||||
| Semiconductors & Equipment – 3.8% | |||||||||||
| 88,865 | Altera Corporation | 4,118,893 | |||||||||
| 74,829 | Analog Devices, Inc. | 2,928,807 | |||||||||
| 103,217 | Broadcom Corporation, Class A | 3,472,220 | |||||||||
| 9,350 | First Solar Inc., (2) | 1,236,725 | |||||||||
| 579,674 | Intel Corporation | 12,845,576 | |||||||||
| 26,060 | Intersil Holding Corporation, Class A | 334,871 | |||||||||
| 78,287 | Linear Technology Corporation | 2,585,037 | |||||||||
| 109,468 | National Semiconductor Corporation | 2,694,007 | |||||||||
| 121,022 | Texas Instruments Incorporated | 3,973,152 | |||||||||
| Total Semiconductors & Equipment | 34,189,288 | ||||||||||
| Software – 6.3% | |||||||||||
| 296,620 | Activision Blizzard Inc. | 3,464,522 | |||||||||
| 154,969 | Adobe Systems Incorporated, (2) | 4,873,775 | |||||||||
| 79,219 | Autodesk, Inc., (2) | 3,057,853 | |||||||||
| 970,861 | Microsoft Corporation | 25,242,386 | |||||||||
| 600,395 | Oracle Corporation | 19,758,999 | |||||||||
| Total Software | 56,397,535 | ||||||||||
| Specialty Retail – 2.0% | |||||||||||
| 20,823 | Abercrombie & Fitch Co., Class A | 1,393,475 | |||||||||
| 59,432 | American Eagle Outfitters, Inc. | 757,758 | |||||||||
| 51,495 | Best Buy Co., Inc. | 1,617,458 | |||||||||
| 70,360 | CarMax, Inc., (2) | 2,326,805 | |||||||||
| 79,661 | Gap, Inc. | 1,441,864 | |||||||||
| 118,879 | Home Depot, Inc. | 4,305,797 | |||||||||
| 94,934 | Limited Brands, Inc. | 3,650,212 | |||||||||
| 118,515 | Lowe's Companies, Inc. | 2,762,585 | |||||||||
| Total Specialty Retail | 18,255,954 | ||||||||||
| Thrifts & Mortgage Finance – 0.3% | |||||||||||
| 40,800 | MGIC Investment Corporation, (2) | 242,760 | |||||||||
| 180,604 | New York Community Bancorp Inc. | 2,707,254 | |||||||||
| Total Thrifts & Mortgage Finance | 2,950,014 | ||||||||||
| Tobacco – 1.3% | |||||||||||
| 21,988 | Altria Group, Inc. | 580,703 | |||||||||
| 147,699 | Philip Morris International | 9,861,862 | |||||||||
| 36,132 | Reynolds American Inc. | 1,338,691 | |||||||||
| Total Tobacco | 11,781,256 | ||||||||||
| Wireless Telecommunication Services – 0.3% | |||||||||||
| 27,792 | China Mobile Hong Kong Limited, Sponsored ADR | 1,300,110 | |||||||||
| 161,500 | Sprint Nextel Corporation, (2) | 870,485 | |||||||||
| Total Wireless Telecommunication Services | 2,170,595 | ||||||||||
| Total Common Stocks (cost $681,355,490) | 891,078,723 | ||||||||||
Nuveen Investments
30
| Principal Amount (000) | Description (1) | Coupon | Maturity | Value | |||||||||||||||
| Short-Term Investments – 5.0% | |||||||||||||||||||
| $ | 45,233 | Repurchase Agreement with Fixed Income Clearing Corporation, dated 6/30/11, repurchase price | 0.010 | % | 7/01/11 | $ | 45,233,097 | ||||||||||||
| $45,233,110, collateralized by $45,125,000 U.S. Treasury Notes, 1.500%, due 12/31/13, | |||||||||||||||||||
| value $46,140,313 | |||||||||||||||||||
| Total Short-Term Investments (cost $45,233,097) | 45,233,097 | ||||||||||||||||||
| Total Investments (cost $726,588,587) – 104.9% | 936,311,820 | ||||||||||||||||||
| Other Assets Less Liabilities – (4.9)% (5) | (44,061,868 | ) | |||||||||||||||||
| Net Assets – 100% | $ | 892,249,952 | |||||||||||||||||
Investments in Derivatives
Call Options Written at June 30, 2011:
| Number of Contracts | Type | Notional Amount (3) | Expiration Date | Strike Price | Value | ||||||||||||||||||
| Call Options Written – (3.2)% (4) | |||||||||||||||||||||||
| (1,306 | ) | MINI-NDX 100 INDEX | $ | (29,058,500 | ) | 7/16/11 | $ | 222.5 | $ | (1,397,420 | ) | ||||||||||||
| (1,102 | ) | MINI-NDX 100 INDEX | (24,795,000 | ) | 7/16/11 | 225.0 | (928,435 | ) | |||||||||||||||
| (1,529 | ) | MINI-NDX 100 INDEX | (34,784,750 | ) | 7/16/11 | 227.5 | (967,093 | ) | |||||||||||||||
| (1,101 | ) | MINI-NDX 100 INDEX | (25,323,000 | ) | 7/16/11 | 230.0 | (445,905 | ) | |||||||||||||||
| (1,316 | ) | MINI-NDX 100 INDEX | (30,597,000 | ) | 7/16/11 | 232.5 | (323,078 | ) | |||||||||||||||
| (1,152 | ) | MINI-NDX 100 INDEX | (25,632,000 | ) | 8/20/11 | 222.5 | (1,437,120 | ) | |||||||||||||||
| (839 | ) | MINI-NDX 100 INDEX | (18,877,500 | ) | 8/20/11 | 225.0 | (866,268 | ) | |||||||||||||||
| (1,211 | ) | MINI-NDX 100 INDEX | (27,550,250 | ) | 8/20/11 | 227.5 | (1,026,322 | ) | |||||||||||||||
| (627 | ) | S&P 500 INDEX | (79,315,500 | ) | 7/16/11 | 1,265.0 | (3,608,385 | ) | |||||||||||||||
| (614 | ) | S&P 500 INDEX | (78,285,000 | ) | 7/16/11 | 1,275.0 | (2,971,760 | ) | |||||||||||||||
| (608 | ) | S&P 500 INDEX | (79,040,000 | ) | 7/16/11 | 1,300.0 | (1,659,840 | ) | |||||||||||||||
| (656 | ) | S&P 500 INDEX | (86,920,000 | ) | 7/16/11 | 1,325.0 | (715,040 | ) | |||||||||||||||
| (654 | ) | S&P 500 INDEX | (83,385,000 | ) | 8/20/11 | 1,275.0 | (3,789,930 | ) | |||||||||||||||
| (620 | ) | S&P 500 INDEX | (79,670,000 | ) | 8/20/11 | 1,285.0 | (3,115,500 | ) | |||||||||||||||
| (634 | ) | S&P 500 INDEX | (82,420,000 | ) | 8/20/11 | 1,300.0 | (2,507,470 | ) | |||||||||||||||
| (622 | ) | S&P 500 INDEX | (80,860,000 | ) | 9/17/11 | 1,300.0 | (2,945,170 | ) | |||||||||||||||
| (14,591 | ) | Total Call Options Written (premiums received $23,160,713) | $ | (866,513,500 | ) | $ | (28,704,736 | ) | |||||||||||||||
For Fund portfolio compliance purposes, the Fund's industry classifications refer to any one or more of the industry sub-classifications used by one or more widely recognized market indexes or ratings group indexes, and/or as defined by Fund management. This definition may not apply for purposes of this report, which may combine industry sub-classifications into sectors for reporting ease.
(1) All percentages in the Portfolio of Investments are based on net assets.
(2) Non-income producing; issuer has not declared a dividend within the past twelve months.
(3) For disclosure purposes, Notional Amount is calculated by multiplying the Number of Contracts by the Strike Price by 100.
(4) The Fund may designate up to 100% of its common stock investments to cover outstanding call options written.
(5) Other Assets Less Liabilities includes the Value of derivative instruments as noted in Investments in Derivatives
ADR American Depositary Receipt.
See accompanying notes to financial statements.
Nuveen Investments
31
JLA
Nuveen Equity Premium Advantage Fund
Portfolio of INVESTMENTS
June 30, 2011 (Unaudited)
| Shares | Description (1) | Value | |||||||||
| Common Stocks – 98.8% | |||||||||||
| Aerospace & Defense – 1.3% | |||||||||||
| 14,980 | Boeing Company | $ | 1,107,471 | ||||||||
| 29,354 | Honeywell International Inc. | 1,749,205 | |||||||||
| 19,850 | United Technologies Corporation | 1,756,924 | |||||||||
| Total Aerospace & Defense | 4,613,600 | ||||||||||
| Air Freight & Logistics – 1.0% | |||||||||||
| 47,270 | United Parcel Service, Inc., Class B | 3,447,401 | |||||||||
| Airlines – 0.3% | |||||||||||
| 5,693 | Delta Air Lines, Inc., (2) | 52,205 | |||||||||
| 27,885 | Lan Airlines S.A., Sponsored ADR | 795,280 | |||||||||
| 26,363 | Southwest Airlines Co. | 301,065 | |||||||||
| Total Airlines | 1,148,550 | ||||||||||
| Auto Components – 0.5% | |||||||||||
| 10,102 | American Axle and Manufacturing Holdings Inc., (2) | 114,961 | |||||||||
| 28,366 | Cooper Tire & Rubber | 561,363 | |||||||||
| 35,760 | Gentex Corporation | 1,081,025 | |||||||||
| Total Auto Components | 1,757,349 | ||||||||||
| Automobiles – 0.4% | |||||||||||
| 51,547 | Ford Motor Company, (2) | 710,833 | |||||||||
| 14,597 | Harley-Davidson, Inc. | 598,039 | |||||||||
| Total Automobiles | 1,308,872 | ||||||||||
| Beverages – 1.3% | |||||||||||
| 41,011 | Coca-Cola Company | 2,759,630 | |||||||||
| 26,085 | PepsiCo, Inc. | 1,837,167 | |||||||||
| Total Beverages | 4,596,797 | ||||||||||
| Biotechnology – 2.9% | |||||||||||
| 39,420 | Amgen Inc., (2) | 2,300,157 | |||||||||
| 65,264 | Celgene Corporation, (2) | 3,936,724 | |||||||||
| 87,365 | Gilead Sciences, Inc., (2) | 3,617,785 | |||||||||
| 14,383 | Human Genome Sciences, Inc., (2) | 352,959 | |||||||||
| Total Biotechnology | 10,207,625 | ||||||||||
| Capital Markets – 0.9% | |||||||||||
| 15,156 | Bank of New York Company, Inc. | 388,297 | |||||||||
| 46,966 | Charles Schwab Corporation | 772,591 | |||||||||
| 7,871 | Goldman Sachs Group, Inc. | 1,047,551 | |||||||||
| 19,032 | Morgan Stanley | 437,926 | |||||||||
| 17,346 | Waddell & Reed Financial, Inc., Class A | 630,527 | |||||||||
| Total Capital Markets | 3,276,892 | ||||||||||
Nuveen Investments
32
| Shares | Description (1) | Value | |||||||||
| Chemicals – 1.0% | |||||||||||
| 30,982 | Dow Chemical Company | $ | 1,115,352 | ||||||||
| 35,575 | E.I. Du Pont de Nemours and Company | 1,922,829 | |||||||||
| 6,185 | Monsanto Company | 448,660 | |||||||||
| Total Chemicals | 3,486,841 | ||||||||||
| Commercial Banks – 1.4% | |||||||||||
| 31,331 | FirstMerit Corporation | 517,275 | |||||||||
| 9,487 | Toronto-Dominion Bank | 805,446 | |||||||||
| 65,040 | U.S. Bancorp | 1,659,170 | |||||||||
| 70,518 | Wells Fargo & Company | 1,978,735 | |||||||||
| Total Commercial Banks | 4,960,626 | ||||||||||
| Commercial Services & Supplies – 0.4% | |||||||||||
| 29,414 | Covanta Holding Corporation | 485,037 | |||||||||
| 13,828 | Deluxe Corporation | 341,690 | |||||||||
| 26,895 | R.R. Donnelley & Sons Company | 527,411 | |||||||||
| Total Commercial Services & Supplies | 1,354,138 | ||||||||||
| Communications Equipment – 5.1% | |||||||||||
| 6,820 | Aviat Networks Inc., (2) | 26,871 | |||||||||
| 389,076 | Cisco Systems, Inc. | 6,073,476 | |||||||||
| 17,501 | Harris Corporation | 788,595 | |||||||||
| 167,854 | QUALCOMM, Inc. | 9,532,429 | |||||||||
| 44,852 | Research In Motion Limited, (2) | 1,293,980 | |||||||||
| Total Communications Equipment | 17,715,351 | ||||||||||
| Computers & Peripherals – 9.1% | |||||||||||
| 88,843 | Apple, Inc., (2) | 29,821,930 | |||||||||
| 49,264 | EMC Corporation, (2) | 1,357,223 | |||||||||
| 21,986 | Hewlett-Packard Company | 800,290 | |||||||||
| Total Computers & Peripherals | 31,979,443 | ||||||||||
| Consumer Finance – 0.5% | |||||||||||
| 24,868 | American Express Company | 1,285,676 | |||||||||
| 23,560 | SLM Corporation | 396,044 | |||||||||
| Total Consumer Finance | 1,681,720 | ||||||||||
| Containers & Packaging – 0.2% | |||||||||||
| 19,780 | Packaging Corp. of America | 553,642 | |||||||||
| 4,824 | Sonoco Products Company | 171,445 | |||||||||
| Total Containers & Packaging | 725,087 | ||||||||||
| Distributors – 0.0% | |||||||||||
| 2,607 | Genuine Parts Company | 141,821 | |||||||||
| Diversified Consumer Services – 0.3% | |||||||||||
| 4,119 | ITT Educational Services, Inc., (2) | 322,271 | |||||||||
| 63,150 | Service Corporation International | 737,592 | |||||||||
| Total Diversified Consumer Services | 1,059,863 | ||||||||||
| Diversified Financial Services – 1.8% | |||||||||||
| 146,487 | Bank of America Corporation | 1,605,498 | |||||||||
| 12,073 | Citigroup Inc. | 502,720 | |||||||||
| 3,262 | CME Group, Inc. | 951,167 | |||||||||
| 66,759 | JP Morgan Chase & Co. | 2,733,113 | |||||||||
| 13,902 | Moody's Corporation | 533,142 | |||||||||
| Total Diversified Financial Services | 6,325,640 | ||||||||||
Nuveen Investments
33
JLA
Nuveen Equity Premium Advantage Fund (continued)
Portfolio of INVESTMENTS June 30, 2011 (Unaudited)
| Shares | Description (1) | Value | |||||||||
| Diversified Telecommunication Services – 2.3% | |||||||||||
| 137,927 | AT&T Inc. | $ | 4,332,287 | ||||||||
| 20,606 | Chunghwa Telecom Co., Ltd, Sponsored ADR | 711,937 | |||||||||
| 118,721 | Frontier Communications Corporation | 958,078 | |||||||||
| 59,238 | Verizon Communications Inc. | 2,205,431 | |||||||||
| Total Diversified Telecommunication Services | 8,207,733 | ||||||||||
| Electric Utilities – 1.1% | |||||||||||
| 86,906 | Duke Energy Corporation | 1,636,440 | |||||||||
| 48,358 | Great Plains Energy Incorporated | 1,002,461 | |||||||||
| 28,722 | Pinnacle West Capital Corporation | 1,280,427 | |||||||||
| Total Electric Utilities | 3,919,328 | ||||||||||
| Electrical Equipment – 1.6% | |||||||||||
| 14,543 | Cooper Industries Inc. | 867,781 | |||||||||
| 29,749 | Emerson Electric Company | 1,673,381 | |||||||||
| 11,238 | Hubbell Incorporated, Class B | 729,908 | |||||||||
| 14,562 | Rockwell Automation, Inc. | 1,263,399 | |||||||||
| 13,012 | Roper Industries Inc. | 1,083,900 | |||||||||
| Total Electrical Equipment | 5,618,369 | ||||||||||
| Electronic Equipment & Instruments – 0.6% | |||||||||||
| 24,324 | Amphenol Corporation, Class A | 1,313,253 | |||||||||
| 50,810 | Corning Incorporated | 922,202 | |||||||||
| Total Electronic Equipment & Instruments | 2,235,455 | ||||||||||
| Energy Equipment & Services – 1.5% | |||||||||||
| 26,765 | Cameron Cameron Corporation, (2) | 1,346,012 | |||||||||
| 9,396 | Diamond Offshore Drilling, Inc. | 661,572 | |||||||||
| 31,791 | Halliburton Company | 1,621,341 | |||||||||
| 17,559 | Schlumberger Limited | 1,517,098 | |||||||||
| Total Energy Equipment & Services | 5,146,023 | ||||||||||
| Food & Staples Retailing – 1.2% | |||||||||||
| 30,104 | CVS Caremark Corporation | 1,131,308 | |||||||||
| 22,982 | Kroger Co. | 569,954 | |||||||||
| 23,034 | SUPERVALU INC. | 216,750 | |||||||||
| 27,047 | Walgreen Co. | 1,148,416 | |||||||||
| 23,831 | Wal-Mart Stores, Inc. | 1,266,379 | |||||||||
| Total Food & Staples Retailing | 4,332,807 | ||||||||||
| Food Products – 0.9% | |||||||||||
| 15,578 | Archer-Daniels-Midland Company | 469,677 | |||||||||
| 42,081 | Kraft Foods Inc. | 1,482,514 | |||||||||
| 63,041 | Sara Lee Corporation | 1,197,149 | |||||||||
| Total Food Products | 3,149,340 | ||||||||||
| Gas Utilities – 0.6% | |||||||||||
| 25,741 | Nicor Inc. | 1,409,062 | |||||||||
| 26,900 | Piedmont Natural Gas Company | 813,994 | |||||||||
| Total Gas Utilities | 2,223,056 | ||||||||||
| Health Care Equipment & Supplies – 0.9% | |||||||||||
| 35,925 | Accuray, Inc., (2) | 287,759 | |||||||||
| 13,283 | Baxter International, Inc. | 792,862 | |||||||||
| 37,622 | Boston Scientific Corporation, (2) | 259,968 | |||||||||
| 9,327 | CareFusion Corporation, (2) | 253,415 | |||||||||
Nuveen Investments
34
| Shares | Description (1) | Value | |||||||||
| Health Care Equipment & Supplies (continued) | |||||||||||
| 898 | Covidien PLC | $ | 47,801 | ||||||||
| 12,334 | Hill Rom Holdings Inc. | 567,857 | |||||||||
| 3,871 | Medtronic, Inc. | 149,150 | |||||||||
| 7,109 | Saint Jude Medical Inc. | 338,957 | |||||||||
| 7,586 | Zimmer Holdings, Inc., (2) | 479,435 | |||||||||
| Total Health Care Equipment & Supplies | 3,177,204 | ||||||||||
| Health Care Providers & Services – 1.7% | |||||||||||
| 13,759 | Brookdale Senior Living Inc., (2) | 333,656 | |||||||||
| 22,283 | Cardinal Health, Inc. | 1,012,094 | |||||||||
| 25,434 | Lincare Holdings | 744,453 | |||||||||
| 10,768 | Medco Health Solutions, Inc., (2) | 608,607 | |||||||||
| 10,000 | Omnicare, Inc. | 318,900 | |||||||||
| 48,700 | Tenet Healthcare Corporation, (2) | 303,888 | |||||||||
| 19,747 | UnitedHealth Group Incorporated | 1,018,550 | |||||||||
| 20,106 | Universal Health Services, Inc., Class B | 1,036,062 | |||||||||
| 5,168 | Wellpoint Inc. | 407,083 | |||||||||
| Total Health Care Providers & Services | 5,783,293 | ||||||||||
| Hotels, Restaurants & Leisure – 2.7% | |||||||||||
| 9,772 | Carnival Corporation | 367,720 | |||||||||
| 21,506 | International Game Technology | 378,075 | |||||||||
| 10,272 | Interval Leisure Group Inc., (2) | 140,624 | |||||||||
| 9,229 | McDonald's Corporation | 778,189 | |||||||||
| 121,034 | Starbucks Corporation | 4,779,633 | |||||||||
| 27,378 | Starwood Hotels & Resorts Worldwide, Inc. | 1,534,263 | |||||||||
| 19,573 | Tim Hortons Inc. | 955,358 | |||||||||
| 84,855 | Wendy's International, Inc. | 430,215 | |||||||||
| Total Hotels, Restaurants & Leisure | 9,364,077 | ||||||||||
| Household Durables – 0.3% | |||||||||||
| 13,979 | KB Home | 136,715 | |||||||||
| 36,936 | Newell Rubbermaid Inc. | 582,850 | |||||||||
| 4,344 | Whirlpool Corporation | 353,254 | |||||||||
| Total Household Durables | 1,072,819 | ||||||||||
| Household Products – 0.7% | |||||||||||
| 35,948 | Procter & Gamble Company | 2,285,214 | |||||||||
| Industrial Conglomerates – 1.4% | |||||||||||
| 12,690 | 3M Co. | 1,203,647 | |||||||||
| 8,652 | Danaher Corporation | 458,469 | |||||||||
| 177,574 | General Electric Company | 3,349,046 | |||||||||
| Total Industrial Conglomerates | 5,011,162 | ||||||||||
| Insurance – 1.3% | |||||||||||
| 17,619 | AFLAC Incorporated | 822,455 | |||||||||
| 3,318 | Arch Capital Group Limited, (2) | 105,911 | |||||||||
| 26,516 | Fidelity National Title Group Inc., Class A | 417,362 | |||||||||
| 30,409 | Marsh & McLennan Companies, Inc. | 948,457 | |||||||||
| 14,446 | Prudential Financial, Inc. | 918,621 | |||||||||
| 24,701 | Travelers Companies, Inc. | 1,442,044 | |||||||||
| Total Insurance | 4,654,850 | ||||||||||
| Internet & Catalog Retail – 2.2% | |||||||||||
| 36,658 | Amazon.com, Inc., (2) | 7,496,194 | |||||||||
| 10,391 | HSN, Inc., (2) | 342,072 | |||||||||
| Total Internet & Catalog Retail | 7,838,266 | ||||||||||
Nuveen Investments
35
JLA
Nuveen Equity Premium Advantage Fund (continued)
Portfolio of INVESTMENTS June 30, 2011 (Unaudited)
| Shares | Description (1) | Value | |||||||||
| Internet Software & Services – 5.8% | |||||||||||
| 26,494 | Akamai Technologies, Inc., (2) | $ | 833,766 | ||||||||
| 2,017 | AOL Inc., (2) | 40,058 | |||||||||
| 15,994 | Baidu.com, Inc., Sponsored ADR, (2) | 2,241,239 | |||||||||
| 127,178 | eBay Inc., (2) | 4,104,034 | |||||||||
| 21,043 | Google Inc., Class A, (2) | 10,655,754 | |||||||||
| 20,300 | IAC/InterActiveCorp., (2) | 774,851 | |||||||||
| 43,598 | United Online, Inc. | 262,896 | |||||||||
| 96,953 | Yahoo! Inc., (2) | 1,458,173 | |||||||||
| Total Internet Software & Services | 20,370,771 | ||||||||||
| IT Services – 3.3% | |||||||||||
| 61,947 | Automatic Data Processing, Inc. | 3,263,368 | |||||||||
| 23,280 | Fidelity National Information Services | 716,791 | |||||||||
| 8,158 | Global Payments Inc. | 416,058 | |||||||||
| 25,920 | Infosys Technologies Limited, Sponsored ADR | 1,690,762 | |||||||||
| 17,695 | International Business Machines Corporation (IBM) | 3,035,577 | |||||||||
| 9,443 | Lender Processing Services Inc. | 197,453 | |||||||||
| 63,148 | Paychex, Inc. | 1,939,907 | |||||||||
| 4,985 | Visa Inc. | 420,036 | |||||||||
| Total IT Services | 11,679,952 | ||||||||||
| Life Sciences Tools & Services – 0.8% | |||||||||||
| 15,384 | Agilent Technologies, Inc., (2) | 786,276 | |||||||||
| 36,905 | Life Technologies Corporation, (2) | 1,921,643 | |||||||||
| Total Life Sciences Tools & Services | 2,707,919 | ||||||||||
| Machinery – 2.0% | |||||||||||
| 21,893 | Caterpillar Inc. | 2,330,729 | |||||||||
| 16,763 | Deere & Company | 1,382,109 | |||||||||
| 14,654 | Eaton Corporation | 753,948 | |||||||||
| 22,531 | Graco Inc. | 1,141,420 | |||||||||
| 15,335 | SPX Corporation | 1,267,591 | |||||||||
| Total Machinery | 6,875,797 | ||||||||||
| Media – 3.7% | |||||||||||
| 19,588 | CBS Corporation, Class B | 558,062 | |||||||||
| 167,768 | Comcast Corporation, Special Class A | 4,065,019 | |||||||||
| 75,269 | DIRECTV Group, Inc., (2) | 3,825,171 | |||||||||
| 3,122 | Liberty Media Starz, (2) | 234,899 | |||||||||
| 12,927 | Live Nation Inc., (2) | 148,273 | |||||||||
| 47,728 | News Corporation, Class B | 862,922 | |||||||||
| 18,938 | Omnicom Group, Inc. | 912,054 | |||||||||
| 17,377 | Regal Entertainment Group, Class A | 214,606 | |||||||||
| 5,992 | Time Warner Cable, Class A | 467,616 | |||||||||
| 6,115 | Time Warner Inc. | 222,403 | |||||||||
| 32,124 | Walt Disney Company | 1,254,121 | |||||||||
| Total Media | 12,765,146 | ||||||||||
| Metals & Mining – 0.6% | |||||||||||
| 8,735 | AngloGold Ashanti Limited, Sponsored ADR | 367,656 | |||||||||
| 54,923 | Companhia Siderurgica Nacional S.A., Sponsored ADR | 684,341 | |||||||||
| 5,526 | Freeport-McMoRan Copper & Gold, Inc. | 292,325 | |||||||||
| 22,917 | Southern Copper Corporation | 753,282 | |||||||||
| Total Metals & Mining | 2,097,604 | ||||||||||
Nuveen Investments
36
| Shares | Description (1) | Value | |||||||||
| Multiline Retail – 1.1% | |||||||||||
| 10,865 | Family Dollar Stores, Inc. | $ | 571,064 | ||||||||
| 10,883 | J.C. Penney Company, Inc. | 375,899 | |||||||||
| 1,308 | Kohl's Corporation | 65,413 | |||||||||
| 26,822 | Macy's, Inc. | 784,275 | |||||||||
| 18,036 | Sears Holding Corporation, (2) | 1,288,492 | |||||||||
| 15,596 | Target Corporation | 731,608 | |||||||||
| Total Multiline Retail | 3,816,751 | ||||||||||
| Multi-Utilities – 0.7% | |||||||||||
| 21,316 | Integrys Energy Group, Inc. | 1,105,021 | |||||||||
| 25,517 | OGE Energy Corp. | 1,284,015 | |||||||||
| Total Multi-Utilities | 2,389,036 | ||||||||||
| Oil, Gas & Consumable Fuels – 5.2% | |||||||||||
| 54,479 | Chevron Corporation | 5,602,620 | |||||||||
| 51,533 | ConocoPhillips | 3,874,766 | |||||||||
| 12,007 | Delta Petroleum Corporation, (2) | 5,955 | |||||||||
| 101,449 | Exxon Mobil Corporation | 8,255,920 | |||||||||
| 5,224 | Royal Dutch Shell PLC, Class A, Sponsored ADR | 371,583 | |||||||||
| Total Oil, Gas & Consumable Fuels | 18,110,844 | ||||||||||
| Paper & Forest Products – 0.2% | |||||||||||
| 17,300 | International Paper Company | 515,886 | |||||||||
| Pharmaceuticals – 4.7% | |||||||||||
| 26,860 | Abbott Laboratories | 1,413,373 | |||||||||
| 13,538 | Allergan, Inc. | 1,127,039 | |||||||||
| 59,703 | Bristol-Myers Squibb Company | 1,728,999 | |||||||||
| 25,114 | Eli Lilly and Company | 942,528 | |||||||||
| 16,092 | Forest Laboratories, Inc., (2) | 633,059 | |||||||||
| 16,139 | GlaxoSmithKline PLC, Sponsored ADR | 692,363 | |||||||||
| 39,866 | Johnson & Johnson | 2,651,886 | |||||||||
| 87,471 | Merck & Company Inc. | 3,086,852 | |||||||||
| 6,190 | Novartis AG, Sponsored ADR | 378,271 | |||||||||
| 179,032 | Pfizer Inc. | 3,688,059 | |||||||||
| Total Pharmaceuticals | 16,342,429 | ||||||||||
| Professional Services – 0.6% | |||||||||||
| 17,552 | Manpower Inc. | 941,665 | |||||||||
| 21,473 | Resources Connection, Inc. | 258,535 | |||||||||
| 30,314 | Robert Half International Inc. | 819,387 | |||||||||
| Total Professional Services | 2,019,587 | ||||||||||
| Real Estate Investment Trust – 1.0% | |||||||||||
| 18,413 | Apartment Investment & Management Company, Class A | 470,084 | |||||||||
| 49,000 | DCT Industrial Trust Inc. | 256,270 | |||||||||
| 4,590 | Developers Diversified Realty Corporation | 64,719 | |||||||||
| 31,254 | Nationwide Health Properties, Inc. | 1,294,228 | |||||||||
| 40,126 | Senior Housing Properties Trust | 939,350 | |||||||||
| 28,958 | U-Store-It Trust | 304,638 | |||||||||
| Total Real Estate Investment Trust | 3,329,289 | ||||||||||
| Semiconductors & Equipment – 5.9% | |||||||||||
| 54,140 | Advanced Micro Devices, Inc., (2) | 378,439 | |||||||||
| 54,207 | Altera Corporation | 2,512,494 | |||||||||
| 9,099 | Analog Devices, Inc. | 356,135 | |||||||||
| 89,246 | Applied Materials, Inc. | 1,161,090 | |||||||||
Nuveen Investments
37
JLA
Nuveen Equity Premium Advantage Fund (continued)
Portfolio of INVESTMENTS June 30, 2011 (Unaudited)
| Shares | Description (1) | Value | |||||||||
| Semiconductors & Equipment (continued) | |||||||||||
| 93,518 | Atmel Corporation, (2) | $ | 1,315,798 | ||||||||
| 50,380 | Broadcom Corporation, Class A | 1,694,783 | |||||||||
| 1,449 | Cree, Inc., (2) | 48,672 | |||||||||
| 1,090 | Cymer, Inc., (2) | 53,966 | |||||||||
| 11,761 | Cypress Semiconductor Corporation, (2) | 248,628 | |||||||||
| 28,948 | Fairchild Semiconductor International Inc., Class A, (2) | 483,721 | |||||||||
| 17,789 | Integrated Device Technology, Inc., (2) | 139,822 | |||||||||
| 287,599 | Intel Corporation | 6,373,194 | |||||||||
| 2,596 | Intersil Holding Corporation, Class A | 33,359 | |||||||||
| 42,987 | Linear Technology Corporation | 1,419,431 | |||||||||
| 95,908 | LSI Logic Corporation, (2) | 682,865 | |||||||||
| 5,819 | MEMC Electronic Materials, (2) | 49,636 | |||||||||
| 24,328 | National Semiconductor Corporation | 598,712 | |||||||||
| 4,888 | Novellus Systems, Inc., (2) | 176,652 | |||||||||
| 81,538 | NVIDIA Corporation, (2) | 1,299,308 | |||||||||
| 26,885 | Taiwan Semiconductor Manufacturing Company Ltd., Sponsored ADR | 339,020 | |||||||||
| 9,244 | Texas Instruments Incorporated | 303,481 | |||||||||
| 15,725 | Varian Semiconductor Equipment Associate, (2) | 966,144 | |||||||||
| Total Semiconductors & Equipment | 20,635,350 | ||||||||||
| Software – 10.1% | |||||||||||
| 171,474 | Activision Blizzard Inc. | 2,002,816 | |||||||||
| 67,370 | Adobe Systems Incorporated, (2) | 2,118,787 | |||||||||
| 43,406 | Autodesk, Inc., (2) | 1,675,472 | |||||||||
| 61,242 | CA Inc. | 1,398,767 | |||||||||
| 33,659 | Cadence Design Systems, Inc., (2) | 355,439 | |||||||||
| 605,251 | Microsoft Corporation | 15,736,526 | |||||||||
| 359,597 | Oracle Corporation | 11,834,337 | |||||||||
| 2,118 | SAP AG, Sponsored ADR | 128,457 | |||||||||
| Total Software | 35,250,601 | ||||||||||
| Specialty Retail – 1.8% | |||||||||||
| 16,694 | Best Buy Co., Inc. | 524,359 | |||||||||
| 14,338 | Gap, Inc. | 259,518 | |||||||||
| 41,949 | Home Depot, Inc. | 1,519,393 | |||||||||
| 30,941 | Limited Brands, Inc. | 1,189,681 | |||||||||
| 34,823 | Lowe's Companies, Inc. | 811,724 | |||||||||
| 17,774 | TJX Companies, Inc. | 933,668 | |||||||||
| 35,381 | Urban Outfitters, Inc., (2) | 995,975 | |||||||||
| Total Specialty Retail | 6,234,318 | ||||||||||
| Textiles, Apparel & Luxury Goods – 0.2% | |||||||||||
| 12,633 | Coach, Inc. | 807,628 | |||||||||
| Thrifts & Mortgage Finance – 0.0% | |||||||||||
| 6,252 | Capitol Federal Financial Inc. | 73,524 | |||||||||
| 1,712 | Tree.com Inc., (2) | 8,765 | |||||||||
| Total Thrifts & Mortgage Finance | 82,289 | ||||||||||
| Tobacco – 1.1% | |||||||||||
| 51,573 | Altria Group, Inc. | 1,362,043 | |||||||||
| 35,651 | Philip Morris International | 2,380,417 | |||||||||
| Total Tobacco | 3,742,460 | ||||||||||
Nuveen Investments
38
| Shares | Description (1) | Value | |||||||||
| Wireless Telecommunication Services – 0.6% | |||||||||||
| 7,886 | China Mobile Hong Kong Limited, Sponsored ADR | $ | 368,907 | ||||||||
| 9,319 | Crown Castle International Corporation, (2) | 380,122 | |||||||||
| 50,371 | Vodafone Group PLC, Sponsored ADR | 1,345,913 | |||||||||
| Total Wireless Telecommunication Services | 2,094,942 | ||||||||||
| Total Common Stocks (cost $251,065,943) | 345,675,211 | ||||||||||
| Shares | Description (1) | Value | |||||||||
| Warrants – 0.0% | |||||||||||
| 37,664 | Sanofi-Aventis SA Stock Rights | 90,770 | |||||||||
| Total Warrants (cost $88,661) | 90,770 | ||||||||||
| Principal Amount (000) | Description (1) | Coupon | Maturity | Value | |||||||||||||||
| Short-Term Investments – 6.4% | |||||||||||||||||||
| $ | 22,427 | Repurchase Agreement with Fixed Income Clearing Corporation, dated | 0.010 | % | 7/01/11 | $ | 22,427,356 | ||||||||||||
| 6/30/11, repurchase price $22,427,362, collateralized by $22,375,000 | |||||||||||||||||||
| U.S. Treasury Notes, 1.500%, due 12/13/13, value 22,878,438 | |||||||||||||||||||
| Total Short-Term Investments (cost $22,427,356) | 22,427,356 | ||||||||||||||||||
| Total Investments (cost $273,581,960) – 105.2% | 368,193,337 | ||||||||||||||||||
| Other Assets Less Liabilities – (5.2)% (5) | (18,200,880 | ) | |||||||||||||||||
| Net Assets – 100% | $ | 349,992,457 | |||||||||||||||||
Investments in Derivatives
Call Options Written at June 30, 2011:
| Contracts | Type | Notional Amount (3) | Expiration Date | Strike Price | Value | ||||||||||||||||||
| Call Options – (3.2)% (4) | |||||||||||||||||||||||
| (978 | ) | MINI-NDX 100 INDEX | $ | (21,760,500 | ) | 7/16/11 | $ | 222.5 | $ | (1,046,460 | ) | ||||||||||||
| (827 | ) | MINI-NDX 100 INDEX | (18,607,500 | ) | 7/16/11 | 225.0 | (696,748 | ) | |||||||||||||||
| (922 | ) | MINI-NDX 100 INDEX | (20,975,500 | ) | 7/16/11 | 227.5 | (583,165 | ) | |||||||||||||||
| (828 | ) | MINI-NDX 100 INDEX | (19,044,000 | ) | 7/16/11 | 230.0 | (335,340 | ) | |||||||||||||||
| (1,045 | ) | MINI-NDX 100 INDEX | (24,296,250 | ) | 7/16/11 | 232.5 | (256,548 | ) | |||||||||||||||
| (921 | ) | MINI-NDX 100 INDEX | (20,492,250 | ) | 8/20/11 | 222.5 | (1,148,948 | ) | |||||||||||||||
| (921 | ) | MINI-NDX 100 INDEX | (20,722,500 | ) | 8/20/11 | 225.0 | (950,933 | ) | |||||||||||||||
| (905 | ) | MINI-NDX 100 INDEX | (20,588,750 | ) | 8/20/11 | 227.5 | (766,988 | ) | |||||||||||||||
| (162 | ) | S&P 500 INDEX | (20,493,000 | ) | 7/16/11 | 1,265.0 | (932,308 | ) | |||||||||||||||
| (161 | ) | S&P 500 INDEX | (20,527,500 | ) | 7/16/11 | 1,275.0 | (779,240 | ) | |||||||||||||||
| (159 | ) | S&P 500 INDEX | (20,670,000 | ) | 7/16/11 | 1,300.0 | (434,070 | ) | |||||||||||||||
| (173 | ) | S&P 500 INDEX | (22,922,500 | ) | 7/16/11 | 1,325.0 | (188,570 | ) | |||||||||||||||
| (170 | ) | S&P 500 INDEX | (21,675,000 | ) | 8/20/11 | 1,275.0 | (985,150 | ) | |||||||||||||||
| (143 | ) | S&P 500 INDEX | (18,375,500 | ) | 8/20/11 | 1,285.0 | (718,575 | ) | |||||||||||||||
| (166 | ) | S&P 500 INDEX | (21,580,000 | ) | 8/20/11 | 1,300.0 | (656,530 | ) | |||||||||||||||
| (160 | ) | S&P 500 INDEX | (20,800,000 | ) | 9/17/11 | 1,300.0 | (757,600 | ) | |||||||||||||||
| (8,641 | ) | Total Call Options (premiums received $8,501,048) | $ | (333,530,750 | ) | $ | (11,237,173 | ) | |||||||||||||||
For Fund portfolio compliance purposes, the Fund's industry classifications refer to any one or more of the industry sub-classifications used by one or more widely recognized market indexes or ratings group indexes, and/or as defined by Fund management. This definition may not apply for purposes of this report, which may combine industry sub-classifications into sectors for reporting ease.
(1) All percentages in the Portfolio of Investments are based on net assets.
(2) Non-income producing; issuer has not declared a dividend within the past twelve months.
(3) For disclosure purposes, Notional Amount is calculated by multiplying the Number of Contracts by the Strike Price by 100.
(4) The Fund may designate up to 100% of its common stock investments to cover outstanding call options written.
(5) Other Assets Less Liabilities includes the Value of derivative instruments as noted in Investments in Derivatives.
ADR American Depositary Receipt.
See accompanying notes to financial statements.
Nuveen Investments
39
JPG
Nuveen Equity Premium and Growth Fund
Portfolio of Investments
June 30, 2011 (Unaudited)
| Shares | Description (1) | Value | |||||||||
| Common Stocks – 100.2% | |||||||||||
| Aerospace & Defense – 2.8% | |||||||||||
| 22,742 | Boeing Company | $ | 1,681,316 | ||||||||
| 6,100 | Goodrich Corporation | 582,550 | |||||||||
| 26,927 | Honeywell International Inc. | 1,604,580 | |||||||||
| 14,434 | Raytheon Company | 719,535 | |||||||||
| 22,344 | United Technologies Corporation | 1,977,667 | |||||||||
| Total Aerospace & Defense | 6,565,648 | ||||||||||
| Air Freight & Logistics – 0.9% | |||||||||||
| 30,261 | United Parcel Service, Inc., Class B | 2,206,935 | |||||||||
| Airlines – 0.2% | |||||||||||
| 13,335 | Lan Airlines S.A., Sponsored ADR | 380,314 | |||||||||
| Auto Components – 0.1% | |||||||||||
| 9,310 | Cooper Tire & Rubber | 184,245 | |||||||||
| 5,700 | Dana Holding Corporation, (2) | 104,310 | |||||||||
| Total Auto Components | 288,555 | ||||||||||
| Automobiles – 0.5% | |||||||||||
| 92,502 | Ford Motor Company, (2) | 1,275,603 | |||||||||
| Beverages – 2.3% | |||||||||||
| 46,685 | Coca-Cola Company | 3,141,434 | |||||||||
| 33,632 | PepsiCo, Inc. | 2,368,702 | |||||||||
| Total Beverages | 5,510,136 | ||||||||||
| Biotechnology – 0.8% | |||||||||||
| 11,997 | Celgene Corporation, (2) | 723,659 | |||||||||
| 1,860 | Cephalon, Inc., (2) | 148,614 | |||||||||
| 20,945 | Gilead Sciences, Inc., (2) | 867,332 | |||||||||
| 10,546 | PDL Biopahrma Inc. | 61,905 | |||||||||
| Total Biotechnology | 1,801,510 | ||||||||||
| Capital Markets – 1.9% | |||||||||||
| 53,257 | Charles Schwab Corporation | 876,078 | |||||||||
| 24,627 | Federated Investors Inc. | 587,108 | |||||||||
| 11,495 | Goldman Sachs Group, Inc. | 1,529,870 | |||||||||
| 38,506 | Morgan Stanley | 886,023 | |||||||||
| 14,786 | Waddell & Reed Financial, Inc., Class A | 537,471 | |||||||||
| Total Capital Markets | 4,416,550 | ||||||||||
| Chemicals – 2.5% | |||||||||||
| 29,838 | Dow Chemical Company | 1,074,168 | |||||||||
| 25,969 | E.I. Du Pont de Nemours and Company | 1,403,624 | |||||||||
| 7,200 | Eastman Chemical Company | 734,904 | |||||||||
| 11,108 | Monsanto Company | 805,774 | |||||||||
| 27,935 | Olin Corporation | 633,007 | |||||||||
Nuveen Investments
40
| Shares | Description (1) | Value | |||||||||
| Chemicals (continued) | |||||||||||
| 8,609 | PPG Industries, Inc. | $ | 781,611 | ||||||||
| 16,530 | RPM International, Inc. | 380,521 | |||||||||
| Total Chemicals | 5,813,609 | ||||||||||
| Commercial Banks – 2.6% | |||||||||||
| 12,408 | Comerica Incorporated | 428,945 | |||||||||
| 11,483 | Fifth Third Bancorp. | 146,408 | |||||||||
| 11,582 | First Horizon National Corporation | 110,492 | |||||||||
| 8,574 | FirstMerit Corporation | 141,557 | |||||||||
| 49,105 | Huntington BancShares Inc. | 322,129 | |||||||||
| 33,673 | Regions Financial Corporation | 208,773 | |||||||||
| 59,561 | U.S. Bancorp | 1,519,401 | |||||||||
| 112,687 | Wells Fargo & Company | 3,161,997 | |||||||||
| Total Commercial Banks | 6,039,702 | ||||||||||
| Commercial Services & Supplies – 0.3% | |||||||||||
| 5,330 | Avery Dennison Corporation | 205,898 | |||||||||
| 14,872 | Deluxe Corporation | 367,487 | |||||||||
| 8,400 | Kimball International Inc., Class B | 54,012 | |||||||||
| 11,117 | Standard Register Company | 35,019 | |||||||||
| Total Commercial Services & Supplies | 662,416 | ||||||||||
| Communications Equipment – 2.2% | |||||||||||
| 125,480 | Cisco Systems, Inc. | 1,958,743 | |||||||||
| 13,015 | Motorola Mobility Holdings Inc., (2) | 286,851 | |||||||||
| 14,874 | Motorola Solutions Inc. | 684,799 | |||||||||
| 37,088 | QUALCOMM, Inc. | 2,106,228 | |||||||||
| 1,784 | Research In Motion Limited, (2) | 51,468 | |||||||||
| Total Communications Equipment | 5,088,089 | ||||||||||
| Computers & Peripherals – 3.6% | |||||||||||
| 18,716 | Apple, Inc., (2) | 6,282,399 | |||||||||
| 30,455 | Dell Inc., (2) | 507,685 | |||||||||
| 58,861 | EMC Corporation, (2) | 1,621,621 | |||||||||
| Total Computers & Peripherals | 8,411,705 | ||||||||||
| Consumer Finance – 0.5% | |||||||||||
| 23,649 | American Express Company | 1,222,653 | |||||||||
| Containers & Packaging – 0.2% | |||||||||||
| 19,132 | Packaging Corp. of America | 535,505 | |||||||||
| Distributors – 0.5% | |||||||||||
| 21,089 | Genuine Parts Company | 1,147,242 | |||||||||
| Diversified Consumer Services – 0.1% | |||||||||||
| 5,562 | Apollo Group, Inc., (2) | 242,948 | |||||||||
| Diversified Financial Services – 4.0% | |||||||||||
| 206,045 | Bank of America Corporation | 2,258,253 | |||||||||
| 41,817 | Citigroup Inc. | 1,741,260 | |||||||||
| 2,592 | CME Group, Inc. | 755,801 | |||||||||
| 4,327 | Intercontinental Exchange, Inc., (2) | 539,620 | |||||||||
| 89,275 | JP Morgan Chase & Co. | 3,654,919 | |||||||||
| 17,015 | New York Stock Exchange Euronext | 583,104 | |||||||||
| Total Diversified Financial Services | 9,532,957 | ||||||||||
Nuveen Investments
41
JPG
Nuveen Equity Premium and Growth Fund (continued)
Portfolio of Investments June 30, 2011 (Unaudited)
| Shares | Description (1) | Value | |||||||||
| Diversified Telecommunication Services – 3.9% | |||||||||||
| 4,000 | Alaska Communications Systems Group Inc. | $ | 35,480 | ||||||||
| 158,502 | AT&T Inc. | 4,978,547 | |||||||||
| 111,815 | Frontier Communications Corporation | 902,347 | |||||||||
| 89,819 | Verizon Communications Inc. | 3,343,961 | |||||||||
| Total Diversified Telecommunication Services | 9,260,335 | ||||||||||
| Electric Utilities – 1.6% | |||||||||||
| 73,406 | Duke Energy Corporation | 1,382,235 | |||||||||
| 61,212 | Great Plains Energy Incorporated | 1,268,925 | |||||||||
| 23,442 | Progress Energy, Inc. | 1,125,450 | |||||||||
| Total Electric Utilities | 3,776,610 | ||||||||||
| Electrical Equipment – 1.0% | |||||||||||
| 5,127 | Cooper Industries Inc. | 305,928 | |||||||||
| 26,811 | Emerson Electric Company | 1,508,119 | |||||||||
| 6,854 | Rockwell Automation, Inc. | 594,653 | |||||||||
| Total Electrical Equipment | 2,408,700 | ||||||||||
| Electronic Equipment & Instruments – 0.4% | |||||||||||
| 48,583 | Corning Incorporated | 881,781 | |||||||||
| Energy Equipment & Services – 2.9% | |||||||||||
| 12,531 | Baker Hughes Incorporated | 909,249 | |||||||||
| 2,246 | Carbo Ceramics Inc. | 365,986 | |||||||||
| 32,012 | Halliburton Company | 1,632,612 | |||||||||
| 9,961 | National-Oilwell Varco Inc. | 779,050 | |||||||||
| 2,835 | Noble Corporation | 111,727 | |||||||||
| 34,398 | Schlumberger Limited | 2,971,987 | |||||||||
| 1,869 | Tidewater Inc. | 100,571 | |||||||||
| Total Energy Equipment & Services | 6,871,182 | ||||||||||
| Food & Staples Retailing – 1.8% | |||||||||||
| 29,038 | CVS Caremark Corporation | 1,091,248 | |||||||||
| 23,426 | SUPERVALU INC. | 220,439 | |||||||||
| 48,455 | Wal-Mart Stores, Inc. | 2,574,899 | |||||||||
| 6,512 | Whole Foods Market, Inc. | 413,186 | |||||||||
| Total Food & Staples Retailing | 4,299,772 | ||||||||||
| Food Products – 1.3% | |||||||||||
| 13,960 | Archer-Daniels-Midland Company | 420,894 | |||||||||
| 33,806 | ConAgra Foods, Inc. | 872,533 | |||||||||
| 47,796 | Kraft Foods Inc. | 1,683,853 | |||||||||
| Total Food Products | 2,977,280 | ||||||||||
| Gas Utilities – 0.6% | |||||||||||
| 16,735 | Nicor Inc. | 916,074 | |||||||||
| 7,318 | ONEOK, Inc. | 541,605 | |||||||||
| Total Gas Utilities | 1,457,679 | ||||||||||
| Health Care Equipment & Supplies – 0.6% | |||||||||||
| 28,854 | Boston Scientific Corporation, (2) | 199,381 | |||||||||
| 3,976 | Hologic Inc., (2) | 80,196 | |||||||||
| 31,998 | Medtronic, Inc. | 1,232,883 | |||||||||
| Total Health Care Equipment & Supplies | 1,512,460 | ||||||||||
Nuveen Investments
42
| Shares | Description (1) | Value | |||||||||
| Health Care Providers & Services – 2.3% | |||||||||||
| 13,746 | Aetna Inc. | $ | 606,061 | ||||||||
| 1,637 | Brookdale Senior Living Inc., (2) | 39,697 | |||||||||
| 15,874 | Express Scripts, Inc., (2) | 856,879 | |||||||||
| 5,614 | Humana Inc. | 452,152 | |||||||||
| 3,420 | Lincare Holdings | 100,103 | |||||||||
| 14,052 | Medco Health Solutions, Inc., (2) | 794,219 | |||||||||
| 24,649 | Tenet Healthcare Corporation, (2) | 153,810 | |||||||||
| 28,715 | UnitedHealth Group Incorporated | 1,481,120 | |||||||||
| 11,994 | Wellpoint Inc. | 944,767 | |||||||||
| Total Health Care Providers & Services | 5,428,808 | ||||||||||
| Hotels, Restaurants & Leisure – 1.4% | |||||||||||
| 9,393 | International Game Technology | 165,129 | |||||||||
| 28,384 | McDonald's Corporation | 2,393,339 | |||||||||
| 11,488 | MGM Mirage Inc., (2) | 151,756 | |||||||||
| 4,557 | Tim Hortons Inc. | 222,427 | |||||||||
| 43,350 | Wendy's International, Inc. | 219,785 | |||||||||
| 5,549 | Wyndham Worldwide Corporation | 186,724 | |||||||||
| Total Hotels, Restaurants & Leisure | 3,339,160 | ||||||||||
| Household Durables – 0.3% | |||||||||||
| 9,110 | KB Home | 89,096 | |||||||||
| 7,125 | Lennar Corporation, Class A | 129,319 | |||||||||
| 16,964 | Newell Rubbermaid Inc. | 267,692 | |||||||||
| 2,527 | Whirlpool Corporation | 205,496 | |||||||||
| Total Household Durables | 691,603 | ||||||||||
| Household Products – 1.9% | |||||||||||
| 5,926 | Colgate-Palmolive Company | 517,992 | |||||||||
| 10,769 | Kimberly-Clark Corporation | 716,785 | |||||||||
| 52,867 | Procter & Gamble Company | 3,360,755 | |||||||||
| Total Household Products | 4,595,532 | ||||||||||
| Industrial Conglomerates – 2.5% | |||||||||||
| 16,204 | 3M Co. | 1,536,949 | |||||||||
| 230,736 | General Electric Company | 4,351,681 | |||||||||
| Total Industrial Conglomerates | 5,888,630 | ||||||||||
| Insurance – 2.6% | |||||||||||
| 22,025 | Arthur J. Gallagher & Co. | 628,594 | |||||||||
| 8,480 | Berkshire Hathaway Inc., Class B, (2) | 656,267 | |||||||||
| 16,883 | Fidelity National Title Group Inc., Class A | 265,738 | |||||||||
| 19,830 | Genworth Financial Inc., Class A, (2) | 203,852 | |||||||||
| 29,671 | Lincoln National Corporation | 845,327 | |||||||||
| 27,861 | Marsh & McLennan Companies, Inc. | 868,985 | |||||||||
| 16,648 | Mercury General Corporation | 657,430 | |||||||||
| 14,413 | Prudential Financial, Inc. | 916,523 | |||||||||
| 14,123 | Travelers Companies, Inc. | 824,501 | |||||||||
| 12,560 | Unitrin, Inc. | 372,655 | |||||||||
| Total Insurance | 6,239,872 | ||||||||||
| Internet & Catalog Retail – 0.7% | |||||||||||
| 8,655 | Amazon.com, Inc., (2) | 1,769,861 | |||||||||
Nuveen Investments
43
JPG
Nuveen Equity Premium and Growth Fund (continued)
Portfolio of Investments June 30, 2011 (Unaudited)
| Shares | Description (1) | Value | |||||||||
| Internet Software & Services – 1.9% | |||||||||||
| 3,480 | Akamai Technologies, Inc., (2) | $ | 109,516 | ||||||||
| 27,399 | eBay Inc., (2) | 884,166 | |||||||||
| 5,599 | Google Inc., Class A, (2) | 2,835,222 | |||||||||
| 22,961 | United Online, Inc. | 138,455 | |||||||||
| 6,548 | VeriSign, Inc. | 219,096 | |||||||||
| 27,685 | Yahoo! Inc., (2) | 416,382 | |||||||||
| Total Internet Software & Services | 4,602,837 | ||||||||||
| IT Services – 3.5% | |||||||||||
| 35,988 | Automatic Data Processing, Inc. | 1,895,848 | |||||||||
| 9,387 | Cognizant Technology Solutions Corporation, Class A, (2) | 688,443 | |||||||||
| 11,474 | Fidelity National Information Services | 353,284 | |||||||||
| 28,182 | International Business Machines Corporation (IBM) | 4,834,621 | |||||||||
| 2,687 | Lender Processing Services Inc. | 56,185 | |||||||||
| 4,147 | Visa Inc. | 349,426 | |||||||||
| Total IT Services | 8,177,807 | ||||||||||
| Leisure Equipment & Products – 0.7% | |||||||||||
| 21,491 | Eastman Kodak Company, (2) | 76,938 | |||||||||
| 28,977 | Mattel, Inc. | 796,578 | |||||||||
| 7,861 | Polaris Industries Inc. | 873,907 | |||||||||
| Total Leisure Equipment & Products | 1,747,423 | ||||||||||
| Life Sciences Tools & Services – 0.1% | |||||||||||
| 1,370 | Covance, Inc., (2) | 81,337 | |||||||||
| 4,213 | Life Technologies Corporation, (2) | 219,371 | |||||||||
| Total Life Sciences Tools & Services | 300,708 | ||||||||||
| Machinery – 3.0% | |||||||||||
| 3,706 | Briggs & Stratton Corporation | 73,601 | |||||||||
| 15,883 | Caterpillar Inc. | 1,690,904 | |||||||||
| 7,899 | Cummins Inc. | 817,468 | |||||||||
| 12,856 | Deere & Company | 1,059,977 | |||||||||
| 16,689 | Illinois Tool Works, Inc. | 942,762 | |||||||||
| 5,351 | Pentair, Inc. | 215,966 | |||||||||
| 11,866 | Snap-on Incorporated | 741,388 | |||||||||
| 20,591 | Stanley Black & Decker Inc. | 1,483,582 | |||||||||
| Total Machinery | 7,025,648 | ||||||||||
| Media – 1.9% | |||||||||||
| 8,069 | CBS Corporation, Class B | 229,886 | |||||||||
| 96,336 | Comcast Corporation, Class A | 2,441,154 | |||||||||
| 7,731 | DIRECTV Group, Inc., (2) | 392,889 | |||||||||
| 7,926 | Gannett Company Inc. | 113,500 | |||||||||
| 5,070 | Lamar Advertising Company, (2) | 138,766 | |||||||||
| 28,121 | New York Times, Class A, (2) | 245,215 | |||||||||
| 51,141 | Regal Entertainment Group, Class A | 631,591 | |||||||||
| 45,144 | Sirius XM Radio Inc., (2) | 98,865 | |||||||||
| 24,892 | World Wrestling Entertainment Inc. | 237,221 | |||||||||
| Total Media | 4,529,087 | ||||||||||
| Metals & Mining – 0.9% | |||||||||||
| 4,770 | Companhia Siderurgica Nacional S.A., Sponsored ADR | 59,434 | |||||||||
| 26,472 | Freeport-McMoRan Copper & Gold, Inc. | 1,400,369 | |||||||||
| 11,444 | Southern Copper Corporation | 376,164 | |||||||||
| 6,989 | United States Steel Corporation | 321,774 | |||||||||
| Total Metals & Mining | 2,157,741 | ||||||||||
Nuveen Investments
44
| Shares | Description (1) | Value | |||||||||
| Multiline Retail – 0.6% | |||||||||||
| 10,381 | Nordstrom, Inc. | $ | 487,284 | ||||||||
| 20,830 | Target Corporation | 977,135 | |||||||||
| Total Multiline Retail | 1,464,419 | ||||||||||
| Multi-Utilities – 2.4% | |||||||||||
| 41,360 | Ameren Corporation | 1,192,822 | |||||||||
| 56,900 | CenterPoint Energy, Inc. | 1,101,015 | |||||||||
| 11,644 | Consolidated Edison, Inc. | 619,927 | |||||||||
| 27,088 | Dominion Resources, Inc. | 1,307,538 | |||||||||
| 29,895 | Integrys Energy Group, Inc. | 1,549,757 | |||||||||
| Total Multi-Utilities | 5,771,059 | ||||||||||
| Oil, Gas & Consumable Fuels – 10.8% | |||||||||||
| 20,360 | Chesapeake Energy Corporation | 604,488 | |||||||||
| 46,645 | Chevron Corporation | 4,796,972 | |||||||||
| 44,500 | ConocoPhillips | 3,345,955 | |||||||||
| 11,317 | CONSOL Energy Inc. | 548,648 | |||||||||
| 6,936 | EOG Resources, Inc. | 725,159 | |||||||||
| 110,180 | Exxon Mobil Corporation | 8,966,447 | |||||||||
| 7,395 | Hess Corporation | 552,850 | |||||||||
| 20,568 | Marathon Oil Corporation | 1,083,522 | |||||||||
| 22,300 | Occidental Petroleum Corporation | 2,320,092 | |||||||||
| 13,666 | Peabody Energy Corporation | 805,064 | |||||||||
| 24,031 | Ship Financial International Limited | 433,039 | |||||||||
| 7,634 | Southwestern Energy Company, (2) | 327,346 | |||||||||
| 23,750 | StatoilHydro ASA, Sponsored ADR | 604,438 | |||||||||
| 18,401 | Valero Energy Corporation | 470,514 | |||||||||
| Total Oil, Gas & Consumable Fuels | 25,584,534 | ||||||||||
| Personal Products – 0.3% | |||||||||||
| 21,857 | Avon Products, Inc. | 611,996 | |||||||||
| Pharmaceuticals – 7.3% | |||||||||||
| 48,352 | Abbott Laboratories | 2,544,282 | |||||||||
| 818 | AstraZeneca PLC, Sponsored ADR | 40,957 | |||||||||
| 73,334 | Bristol-Myers Squibb Company | 2,123,753 | |||||||||
| 34,215 | Eli Lilly and Company | 1,284,089 | |||||||||
| 59,691 | Johnson & Johnson | 3,970,645 | |||||||||
| 86,133 | Merck & Company Inc. | 3,039,634 | |||||||||
| 199,357 | Pfizer Inc. | 4,106,754 | |||||||||
| 5,634 | Sanofi-Aventis, Sponsored ADR | 226,318 | |||||||||
| Total Pharmaceuticals | 17,336,432 | ||||||||||
| Real Estate Investment Trust – 2.2% | |||||||||||
| 28,349 | Annaly Capital Management Inc. | 511,416 | |||||||||
| 35,857 | Brandywine Realty Trust | 415,583 | |||||||||
| 16,606 | Hospitality Properties Trust | 402,696 | |||||||||
| 54,457 | Lexington Corporate Properties Trust | 497,192 | |||||||||
| 37,984 | Nationwide Health Properties, Inc. | 1,572,917 | |||||||||
| 49,474 | Senior Housing Properties Trust | 1,158,186 | |||||||||
| 14,334 | U-Store-It Trust | 150,794 | |||||||||
| 19,112 | Weyerhaeuser Company | 417,788 | |||||||||
| Total Real Estate Investment Trust | 5,126,572 | ||||||||||
| Road & Rail – 0.2% | |||||||||||
| 5,161 | Union Pacific Corporation | 538,808 | |||||||||
Nuveen Investments
45
JPG
Nuveen Equity Premium and Growth Fund (continued)
Portfolio of Investments June 30, 2011 (Unaudited)
| Shares | Description (1) | Value | |||||||||
| Semiconductors & Equipment – 2.7% | |||||||||||
| 21,688 | Analog Devices, Inc. | $ | 848,868 | ||||||||
| 35,188 | Applied Materials, Inc. | 457,796 | |||||||||
| 759 | First Solar Inc., (2) | 100,393 | |||||||||
| 128,901 | Intel Corporation | 2,856,446 | |||||||||
| 19,731 | Microchip Technology Incorporated | 748,002 | |||||||||
| 19,215 | NVIDIA Corporation, (2) | 306,191 | |||||||||
| 29,694 | Texas Instruments Incorporated | 974,854 | |||||||||
| Total Semiconductors & Equipment | 6,292,550 | ||||||||||
| Software – 3.9% | |||||||||||
| 16,744 | Adobe Systems Incorporated, (2) | 526,599 | |||||||||
| 8,286 | Autodesk, Inc., (2) | 319,840 | |||||||||
| 186,325 | Microsoft Corporation | 4,844,449 | |||||||||
| 82,298 | Oracle Corporation | 2,708,427 | |||||||||
| 5,607 | Salesforce.com, Inc., (2) | 835,331 | |||||||||
| Total Software | 9,234,646 | ||||||||||
| Specialty Retail – 2.8% | |||||||||||
| 6,646 | Abercrombie & Fitch Co., Class A | 444,750 | |||||||||
| 22,224 | American Eagle Outfitters, Inc. | 283,356 | |||||||||
| 9,556 | Best Buy Co., Inc. | 300,154 | |||||||||
| 17,720 | Gap, Inc. | 320,732 | |||||||||
| 48,631 | Home Depot, Inc. | 1,761,415 | |||||||||
| 26,215 | Limited Brands, Inc. | 1,007,967 | |||||||||
| 46,378 | Lowe's Companies, Inc. | 1,081,071 | |||||||||
| 7,793 | Tiffany & Co. | 611,906 | |||||||||
| 14,738 | TJX Companies, Inc. | 774,187 | |||||||||
| Total Specialty Retail | 6,585,538 | ||||||||||
| Textiles, Apparel & Luxury Goods – 0.5% | |||||||||||
| 10,506 | VF Corporation | 1,140,531 | |||||||||
| Thrifts & Mortgage Finance – 0.4% | |||||||||||
| 57,748 | New York Community Bancorp Inc. | 865,643 | |||||||||
| Tobacco – 1.9% | |||||||||||
| 63,669 | Altria Group, Inc. | 1,681,498 | |||||||||
| 31,284 | Philip Morris International | 2,088,833 | |||||||||
| 21,266 | Reynolds American Inc. | 787,905 | |||||||||
| Total Tobacco | 4,558,236 | ||||||||||
| Trading Companies & Distributors – 0.2% | |||||||||||
| 3,200 | W.W. Grainger, Inc. | 491,680 | |||||||||
| Wireless Telecommunication Services – 0.2% | |||||||||||
| 54,217 | Sprint Nextel Corporation, (2) | 292,230 | |||||||||
| 3,446 | Vodafone Group PLC, Sponsored ADR | 92,077 | |||||||||
| Total Wireless Telecommunication Services | 384,307 | ||||||||||
| Total Common Stocks (cost $206,979,900) | 237,069,544 | ||||||||||
Nuveen Investments
46
| Principal Amount (000) | Description (1) | Coupon | Maturity | Value | |||||||||||||||
| Short-Term Investments – 3.8% | |||||||||||||||||||
| $ | 8,886 | Repurchase Agreement with Fixed Income Clearing Corporation, dated 6/30/11, | 0.010 | % | 7/01/11 | $ | 8,885,535 | ||||||||||||
| repurchase price $8,885,537, collateralized by $9,045,000 U.S. Treasury Notes, | |||||||||||||||||||
| 0.500%, due 11/30/12, value $9,067,613 | |||||||||||||||||||
| Total Short-Term Investments (cost $8,885,535) | 8,885,535 | ||||||||||||||||||
| Total Investments (cost $215,865,435) – 104.0% | 245,955,079 | ||||||||||||||||||
| Other Assets Less Liabilities – (4.0)% (5) | (9,454,560 | ) | |||||||||||||||||
| Net Assets – 100% | $ | 236,500,519 | |||||||||||||||||
Investments in Derivatives
Call Options Written at June 30, 2011:
| Number of Contracts | Type | Notional Amount (3) | Expiration Date | Strike Price | Value | ||||||||||||||||||
| Call Options Written – (2.6)% (4) | |||||||||||||||||||||||
| (174 | ) | S&P 500 INDEX | $ | (22,011,000 | ) | 7/16/11 | $ | 1,265 | $ | (1,001,370 | ) | ||||||||||||
| (177 | ) | S&P 500 INDEX | (22,567,500 | ) | 7/16/11 | 1,275 | (856,680 | ) | |||||||||||||||
| (173 | ) | S&P 500 INDEX | (22,490,000 | ) | 7/16/11 | 1,300 | (472,290 | ) | |||||||||||||||
| (187 | ) | S&P 500 INDEX | (24,777,500 | ) | 7/16/11 | 1,325 | (203,830 | ) | |||||||||||||||
| (188 | ) | S&P 500 INDEX | (23,970,000 | ) | 8/20/11 | 1,275 | (1,089,460 | ) | |||||||||||||||
| (179 | ) | S&P 500 INDEX | (23,001,500 | ) | 8/20/11 | 1,285 | (899,475 | ) | |||||||||||||||
| (172 | ) | S&P 500 INDEX | (22,360,000 | ) | 8/20/11 | 1,300 | (680,260 | ) | |||||||||||||||
| (178 | ) | S&P 500 INDEX | (23,140,000 | ) | 9/17/11 | 1,300 | (842,830 | ) | |||||||||||||||
| (1,428 | ) | Total Call Options Written (premiums received $5,154,580) | $ | (184,317,500 | ) | $ | (6,046,195 | ) | |||||||||||||||
For Fund portfolio compliance purposes, the Fund's industry classifications refer to any one or more of the industry sub-classifications used by one or more widely recognized market indexes or ratings group indexes, and/or as defined by Fund management. This definition may not apply for purposes of this report, which may combine industry sub-classifications into sectors for reporting ease.
(1) All percentages in the Portfolio of Investments are based on net assets.
(2) Non-income producing; issuer has not declared a dividend within the past twelve months.
(3) For disclosure purposes, Notional Amount is calculated by multiplying the Number of Contracts by the Strike Price by 100.
(4) The Fund may designate up to 100% of its common stock investments to cover outstanding call options written.
(5) Other Assets Less Liabilities includes the Value of derivative instruments as noted in Investments in Derivatives.
ADR American Depositary Receipt.
See accompanying notes to financial statements.
Nuveen Investments
47
Statement of
ASSETS & LIABILITIES
June 30, 2011 (Unaudited)
| Equity Premium Income (JPZ) | Equity Premium Opportunity (JSN) | Equity Premium Advantage (JLA) | Equity Premium and Growth (JPG) | ||||||||||||||||
| Assets | |||||||||||||||||||
| Investments, at value (cost $451,427,229, $726,588,587, $273,581,960 and $215,865,435, respectively) | $ | 541,463,536 | $ | 936,311,820 | $ | 368,193,337 | $ | 245,955,079 | |||||||||||
| Cash denominated in foreign currencies (cost $1,595, $3,088, $— and $—, respectively) | 1,595 | 3,048 | — | — | |||||||||||||||
| Receivables: | |||||||||||||||||||
| Dividends and interest | 813,559 | 1,217,938 | 385,764 | 357,401 | |||||||||||||||
| Investments sold | — | — | 1,058 | — | |||||||||||||||
| Premiums for call options written | 1,718,313 | 2,250,085 | 535,390 | 643,915 | |||||||||||||||
| Reclaims | 1,550 | — | 396 | — | |||||||||||||||
| Other assets | 54,849 | 86,962 | 34,413 | 22,643 | |||||||||||||||
| Total assets | 544,053,402 | 939,869,853 | 369,150,358 | 246,979,038 | |||||||||||||||
| Liabilities | |||||||||||||||||||
| Call options written, at value (premiums received $13,822,570, $23,160,713, $8,501,048 and $5,154,580, respectively) | 16,220,840 | 28,704,736 | 11,237,173 | 6,046,195 | |||||||||||||||
| Dividends payable | 10,482,315 | 18,047,689 | 7,532,897 | 4,172,954 | |||||||||||||||
| Accrued expenses: | |||||||||||||||||||
| Management fees | 311,939 | 531,086 | 251,754 | 165,460 | |||||||||||||||
| Other | 192,079 | 336,390 | 136,077 | 93,910 | |||||||||||||||
| Total liabilities | 27,207,173 | 47,619,901 | 19,157,901 | 10,478,519 | |||||||||||||||
| Net assets | $ | 516,846,229 | $ | 892,249,952 | $ | 349,992,457 | $ | 236,500,519 | |||||||||||
| Shares outstanding | 38,661,011 | 66,559,044 | 25,874,000 | 16,311,642 | |||||||||||||||
| Net asset value per share outstanding | $ | 13.37 | $ | 13.41 | $ | 13.53 | $ | 14.50 | |||||||||||
| Net assets consist of: | |||||||||||||||||||
| Shares, $.01 par value per share | $ | 386,610 | $ | 665,590 | $ | 258,740 | $ | 163,116 | |||||||||||
| Paid-in surplus | 522,191,922 | 841,527,636 | 313,638,365 | 255,146,611 | |||||||||||||||
| Undistributed (Over-distribution of) net investment income | (19,325,369 | ) | (36,246,934 | ) | (14,995,858 | ) | (7,285,870 | ) | |||||||||||
| Accumulated net realized gain (loss) | (74,044,971 | ) | (117,875,510 | ) | (40,784,042 | ) | (40,721,367 | ) | |||||||||||
| Net unrealized appreciation (depreciation) | 87,638,037 | 204,179,170 | 91,875,252 | 29,198,029 | |||||||||||||||
| Net assets | $ | 516,846,229 | $ | 892,249,952 | $ | 349,992,457 | $ | 236,500,519 | |||||||||||
| Authorized shares | Unlimited | Unlimited | Unlimited | Unlimited | |||||||||||||||
See accompanying notes to financial statements.
Nuveen Investments
48
Statement of
OPERATIONS
Six Months Ended June 30, 2011 (Unaudited)
| Equity Premium Income (JPZ) | Equity Premium Opportunity (JSN) | Equity Premium Advantage (JLA) | Equity Premium and Growth (JPG) | ||||||||||||||||
| Investment Income | |||||||||||||||||||
| Dividends (net of foreign tax withheld of $10,776, $26,235, $15,662 and $10,552, respectively) | $ | 6,249,666 | $ | 9,293,221 | $ | 3,007,562 | $ | 2,991,107 | |||||||||||
| Interest | 1,200 | 2,024 | 798 | 399 | |||||||||||||||
| Total investment income | 6,250,866 | 9,295,245 | 3,008,360 | 2,991,506 | |||||||||||||||
| Expenses | |||||||||||||||||||
| Management fees | 2,278,944 | 3,893,996 | 1,554,673 | 1,017,816 | |||||||||||||||
| Shareholders' servicing agent fees and expenses | 549 | 906 | 223 | 157 | |||||||||||||||
| Custodian's fees and expenses | 51,134 | 85,782 | 42,403 | 28,513 | |||||||||||||||
| Trustees' fees and expenses | 7,382 | 12,760 | 5,034 | 3,377 | |||||||||||||||
| Professional fees | 11,415 | 8,786 | 12,293 | 13,393 | |||||||||||||||
| Shareholders' reports — printing and mailing expenses | 63,728 | 108,338 | 37,601 | 28,226 | |||||||||||||||
| Stock exchange listing fees | 6,361 | 10,986 | 4,422 | 4,422 | |||||||||||||||
| Investor relations expense | 58,157 | 99,642 | 33,639 | 24,532 | |||||||||||||||
| Other expenses | 33,465 | 78,165 | 58,095 | 22,534 | |||||||||||||||
| Total expenses before custodian fee credit and expense reimbursement | 2,511,135 | 4,299,361 | 1,748,383 | 1,142,970 | |||||||||||||||
| Custodian fee credit | (304 | ) | (510 | ) | (220 | ) | (114 | ) | |||||||||||
| Expense reimbursement | (363,169 | ) | (688,870 | ) | (148,061 | ) | — | ||||||||||||
| Net expenses | 2,147,662 | 3,609,981 | 1,600,102 | 1,142,856 | |||||||||||||||
| Net investment income (loss) | 4,103,204 | 5,685,264 | 1,408,258 | 1,848,650 | |||||||||||||||
| Realized and Unrealized Gain (Loss) | |||||||||||||||||||
| Net realized gain (loss) from: | |||||||||||||||||||
| Investments and foreign currency | 16,322,819 | 28,253,942 | 19,027,054 | 3,434,809 | |||||||||||||||
| Call options written | (6,837,242 | ) | (6,216,933 | ) | (172,860 | ) | (2,470,804 | ) | |||||||||||
| Change in net unrealized appreciation (depreciation) of: | |||||||||||||||||||
| Investments and foreign currency | 9,358,453 | 15,370,113 | (4,756,641 | ) | 7,104,760 | ||||||||||||||
| Call options written | 1,738,050 | (427,620 | ) | (1,540,164 | ) | 622,662 | |||||||||||||
| Net realized and unrealized gain (loss) | 20,582,080 | 36,979,502 | 12,557,389 | 8,691,427 | |||||||||||||||
| Net increase (decrease) in net assets from operations | $ | 24,685,284 | $ | 42,664,766 | $ | 13,965,647 | $ | 10,540,077 | |||||||||||
See accompanying notes to financial statements.
Nuveen Investments
49
Statement of
CHANGES in NET ASSETS (Unaudited)
| Equity Premium Income (JPZ) | Equity Premium Opportunity (JSN) | ||||||||||||||||||
| Six Months Ended 6/30/11 | Year Ended 12/31/10 | Six Months Ended 6/30/11 | Year Ended 12/31/10 | ||||||||||||||||
| Operations | |||||||||||||||||||
| Net investment income (loss) | $ | 4,103,204 | $ | 9,954,273 | $ | 5,685,264 | $ | 11,966,027 | |||||||||||
| Net realized gain (loss) from: | |||||||||||||||||||
| Investments and foreign currency | 16,322,819 | 9,503,305 | 28,253,942 | 21,515,009 | |||||||||||||||
| Call options written | (6,837,242 | ) | (7,825,685 | ) | (6,216,933 | ) | (29,954,329 | ) | |||||||||||
| Change in net unrealized appreciation (depreciation) of: | |||||||||||||||||||
| Investments and foreign currency | 9,358,453 | 53,153,395 | 15,370,113 | 93,964,137 | |||||||||||||||
| Call options written | 1,738,050 | (6,791,153 | ) | (427,620 | ) | (4,554,496 | ) | ||||||||||||
| Net increase (decrease) in net assets from operations | 24,685,284 | 57,994,135 | 42,664,766 | 92,936,348 | |||||||||||||||
| Distributions to Shareholders | |||||||||||||||||||
| From and in excess of net investment income | (23,428,573 | ) | — | (41,932,198 | ) | — | |||||||||||||
| From net investment income | — | (10,215,397 | ) | — | (11,928,197 | ) | |||||||||||||
| From accumulated net realized gains | — | — | — | — | |||||||||||||||
| Return of capital | — | (37,794,887 | ) | — | (74,396,142 | ) | |||||||||||||
| Decrease in net assets from distributions to shareholders | (23,428,573 | ) | (48,010,284 | ) | (41,932,198 | ) | (86,324,339 | ) | |||||||||||
| Capital Share Transactions | |||||||||||||||||||
| Net proceeds from shares issued to shareholders due to reinvestment of distributions | — | 3,117,564 | — | 6,583,916 | |||||||||||||||
| Net increase (decrease) in net assets from capital share transactions | — | 3,117,564 | — | 6,583,916 | |||||||||||||||
| Net increase (decrease) in net assets | 1,256,711 | 13,101,415 | 732,568 | 13,195,925 | |||||||||||||||
| Net assets at the beginning of period | 515,589,518 | 502,488,103 | 891,517,384 | 878,321,459 | |||||||||||||||
| Net assets at the end of period | $ | 516,846,229 | $ | 515,589,518 | $ | 892,249,952 | $ | 891,517,384 | |||||||||||
| Undistributed (Over-distribution of) net investment income at the end of period | $ | (19,325,369 | ) | $ | — | $ | (36,246,934 | ) | $ | — | |||||||||
See accompanying notes to financial statements.
Nuveen Investments
50
| Equity Premium Advantage (JLA) | Equity Premium and Growth (JPG) | ||||||||||||||||||
| Six Months Ended 6/30/11 | Year Ended 12/31/10 | Six Months Ended 6/30/11 | Year Ended 12/31/10 | ||||||||||||||||
| Operations | |||||||||||||||||||
| Net investment income (loss) | $ | 1,408,258 | $ | 2,772,387 | $ | 1,848,650 | $ | 3,951,510 | |||||||||||
| Net realized gain (loss) from: | |||||||||||||||||||
| Investments and foreign currency | 19,027,054 | 17,270,754 | 3,434,809 | (946,336 | ) | ||||||||||||||
| Call options written | (172,860 | ) | (18,924,466 | ) | (2,470,804 | ) | (3,090,095 | ) | |||||||||||
| Change in net unrealized appreciation (depreciation) of: | |||||||||||||||||||
| Investments and foreign currency | (4,756,641 | ) | 33,445,516 | 7,104,760 | 29,743,368 | ||||||||||||||
| Call options written | (1,540,164 | ) | 1,116,328 | 622,662 | (2,481,607 | ) | |||||||||||||
| Net increase (decrease) in net assets from operations | 13,965,647 | 35,680,519 | 10,540,077 | 27,176,840 | |||||||||||||||
| Distributions to Shareholders | |||||||||||||||||||
| From and in excess of net investment income | (16,404,116 | ) | — | (9,134,520 | ) | — | |||||||||||||
| From net investment income | — | (2,769,975 | ) | — | (3,953,391 | ) | |||||||||||||
| From accumulated net realized gains | — | — | — | — | |||||||||||||||
| Return of capital | — | (30,753,623 | ) | — | (14,315,648 | ) | |||||||||||||
| Decrease in net assets from distributions to shareholders | (16,404,116 | ) | (33,523,598 | ) | (9,134,520 | ) | (18,269,039 | ) | |||||||||||
| Capital Share Transactions | |||||||||||||||||||
| Net proceeds from shares issued to shareholders due to reinvestment of distributions | — | 375,777 | — | — | |||||||||||||||
| Net increase (decrease) in net assets from capital share transactions | — | 375,777 | — | — | |||||||||||||||
| Net increase (decrease) in net assets | (2,438,469 | ) | 2,532,698 | 1,405,557 | 8,907,801 | ||||||||||||||
| Net assets at the beginning of period | 352,430,926 | 349,898,228 | 235,094,962 | 226,187,161 | |||||||||||||||
| Net assets at the end of period | $ | 349,992,457 | $ | 352,430,926 | $ | 236,500,519 | $ | 235,094,962 | |||||||||||
| Undistributed (Over-distribution of) net investment income at the end of period | $ | (14,995,858 | ) | $ | — | $ | (7,285,870 | ) | $ | — | |||||||||
See accompanying notes to financial statements.
Nuveen Investments
51
Financial
HIGHLIGHTS (Unaudited)
Selected data for a share outstanding throughout each period:
| Investment Operations | Less Distributions | ||||||||||||||||||||||||||||||||||||||||||||||||||
| Beginning Net Asset Value | Net Investment Income (Loss) (a) | Net Realized/ Unrealized Gain (Loss) | Total | Net Investment Income | Capital Gains | Return of Capital | Total | Offering Costs | Discount From Shares Repurchased and Retired | Ending Net Asset Value | Ending Market Value | ||||||||||||||||||||||||||||||||||||||||
| Equity Premium Income (JPZ) | |||||||||||||||||||||||||||||||||||||||||||||||||||
| Year Ended 12/31: | |||||||||||||||||||||||||||||||||||||||||||||||||||
| 2011 | (d) | $ | 13.34 | $ | .11 | $ | .53 | $ | 0.64 | $ | (.61 | )**** | $ | — | $ | — | $ | (.61 | ) | $ | — | $ | — | $ | 13.37 | $ | 12.45 | ||||||||||||||||||||||||
| 2010 | 13.08 | .26 | 1.25 | 1.51 | (.27 | ) | — | (.98 | ) | (1.25 | ) | — | — | 13.34 | 12.76 | ||||||||||||||||||||||||||||||||||||
| 2009 | 12.75 | .27 | 1.35 | 1.62 | (.28 | ) | (.24 | ) | (.77 | ) | (1.29 | ) | — | — | ** | 13.08 | 13.00 | ||||||||||||||||||||||||||||||||||
| 2008 | 18.30 | .39 | (4.41 | ) | (4.02 | ) | (.39 | ) | (1.14 | ) | — | (1.53 | ) | — | — | ** | 12.75 | 10.74 | |||||||||||||||||||||||||||||||||
| 2007 | 18.59 | .44 | .98 | 1.42 | (.54 | ) | — | (1.17 | ) | (1.71 | ) | — | — | 18.30 | 16.41 | ||||||||||||||||||||||||||||||||||||
| 2006 | 18.48 | .43 | 1.39 | 1.82 | (.43 | ) | — | (1.28 | ) | (1.71 | ) | — | ** | — | 18.59 | 19.22 | |||||||||||||||||||||||||||||||||||
| Equity Premium Opportunity (JSN) | |||||||||||||||||||||||||||||||||||||||||||||||||||
| Year Ended 12/31: | |||||||||||||||||||||||||||||||||||||||||||||||||||
| 2011 | (d) | 13.39 | .09 | .56 | .65 | (.63 | )**** | — | — | (.63 | ) | — | — | 13.41 | $ | 12.42 | |||||||||||||||||||||||||||||||||||
| 2010 | 13.30 | .18 | 1.21 | 1.39 | (.18 | ) | — | (1.12 | ) | (1.30 | ) | — | — | 13.39 | 12.88 | ||||||||||||||||||||||||||||||||||||
| 2009 | 12.69 | .21 | 1.73 | 1.94 | (.22 | ) | — | (1.12 | ) | (1.34 | ) | — | .01 | 13.30 | 13.20 | ||||||||||||||||||||||||||||||||||||
| 2008 | 18.60 | .30 | (4.62 | ) | (4.32 | ) | (.62 | ) | (.97 | ) | — | (1.59 | ) | — | — | ** | 12.69 | 10.68 | |||||||||||||||||||||||||||||||||
| 2007 | 18.36 | .36 | 1.66 | 2.02 | (.35 | ) | — | (1.43 | ) | (1.78 | ) | — | — | 18.60 | 16.34 | ||||||||||||||||||||||||||||||||||||
| 2006 | 18.66 | .32 | 1.16 | 1.48 | (.32 | ) | — | (1.46 | ) | (1.78 | ) | — | ** | — | 18.36 | 18.62 | |||||||||||||||||||||||||||||||||||
| Equity Premium Advantage (JLA) | |||||||||||||||||||||||||||||||||||||||||||||||||||
| Year Ended 12/31: | |||||||||||||||||||||||||||||||||||||||||||||||||||
| 2011 | (d) | 13.62 | .05 | .49 | .54 | (.63 | )**** | — | — | (.63 | ) | — | — | 13.53 | $ | 12.55 | |||||||||||||||||||||||||||||||||||
| 2010 | 13.54 | .11 | 1.27 | 1.38 | (.11 | ) | — | (1.19 | ) | (1.30 | ) | — | — | 13.62 | 12.90 | ||||||||||||||||||||||||||||||||||||
| 2009 | 12.47 | .13 | 2.25 | 2.38 | (.14 | ) | — | (1.18 | ) | (1.32 | ) | — | .01 | 13.54 | 13.07 | ||||||||||||||||||||||||||||||||||||
| 2008 | 18.57 | .17 | (4.67 | ) | (4.50 | ) | (.92 | ) | (.69 | ) | — | (1.61 | ) | — | .01 | 12.47 | 10.34 | ||||||||||||||||||||||||||||||||||
| 2007 | 18.35 | .22 | 1.82 | 2.04 | (.21 | ) | — | (1.61 | ) | (1.82 | ) | — | — | 18.57 | 16.45 | ||||||||||||||||||||||||||||||||||||
| 2006 | 18.84 | .20 | 1.13 | 1.33 | (.20 | ) | — | (1.62 | ) | (1.82 | ) | — | ** | — | 18.35 | 19.20 | |||||||||||||||||||||||||||||||||||
| Equity Premium and Growth (JPG) | |||||||||||||||||||||||||||||||||||||||||||||||||||
| Year Ended 12/31: | |||||||||||||||||||||||||||||||||||||||||||||||||||
| 2011 | (d) | 14.41 | .11 | .54 | .65 | (.56 | )**** | — | — | (.56 | ) | — | — | 14.50 | $ | 13.27 | |||||||||||||||||||||||||||||||||||
| 2010 | 13.87 | .24 | 1.42 | 1.66 | (.24 | ) | — | (.88 | ) | (1.12 | ) | — | — | 14.41 | 13.85 | ||||||||||||||||||||||||||||||||||||
| 2009 | 13.17 | .26 | 1.55 | 1.81 | (.27 | ) | (.21 | ) | (.64 | ) | (1.12 | ) | — | .01 | 13.87 | 13.09 | |||||||||||||||||||||||||||||||||||
| 2008 | 19.31 | .36 | (5.02 | ) | (4.66 | ) | (.40 | ) | (1.09 | ) | — | (1.49 | ) | — | .01 | 13.17 | 10.77 | ||||||||||||||||||||||||||||||||||
| 2007 | 19.60 | .68 | .65 | 1.33 | (.79 | ) | — | (.83 | ) | (1.62 | ) | — | ** | — | 19.31 | 17.13 | |||||||||||||||||||||||||||||||||||
| 2006 | 19.04 | .46 | 1.72 | 2.18 | (.49 | ) | (.14 | ) | (.99 | ) | (1.62 | ) | — | — | 19.60 | 19.38 | |||||||||||||||||||||||||||||||||||
Nuveen Investments
52
| Ratios/Supplemental Data | |||||||||||||||||||||||||||||||||||
| Total Returns | Ratios to Average Net Assets Before Reimbursement | Ratios to Average Net Assets After Reimbursement(c) | |||||||||||||||||||||||||||||||||
| Based on Market Value(b) | Based on Net Asset Value(b) | Ending Net Assets (000) | Expenses | Net Investment Income | Expenses | Net Investment Income | Portfolio Turnover Rate | ||||||||||||||||||||||||||||
| Equity Premium Income (JPZ) | |||||||||||||||||||||||||||||||||||
| Year Ended 12/31: | |||||||||||||||||||||||||||||||||||
| 2011 | (d) | 2.33 | % | 4.78 | % | $ | 516,846 | .97 | %* | 1.44 | %* | .83 | %* | 1.58 | %* | — | %*** | ||||||||||||||||||
| 2010 | 8.10 | 12.22 | 515,590 | .98 | 1.78 | .77 | 1.99 | 3 | |||||||||||||||||||||||||||
| 2009 | 35.46 | 13.74 | 502,488 | .99 | 1.93 | .71 | 2.21 | 9 | |||||||||||||||||||||||||||
| 2008 | (26.73 | ) | (23.27 | ) | 491,706 | .97 | 2.08 | .67 | 2.39 | 6 | |||||||||||||||||||||||||
| 2007 | (6.07 | ) | 7.80 | 707,933 | .95 | 2.05 | .65 | 2.35 | 7 | ||||||||||||||||||||||||||
| 2006 | 21.30 | 10.22 | 715,680 | .96 | 1.99 | .66 | 2.30 | 23 | |||||||||||||||||||||||||||
| Equity Premium Opportunity (JSN) | |||||||||||||||||||||||||||||||||||
| Year Ended 12/31: | |||||||||||||||||||||||||||||||||||
| 2011 | (d) | 1.32 | % | 4.88 | % | 892,250 | .96 | * | 1.11 | * | .81 | * | 1.27 | * | 3 | ||||||||||||||||||||
| 2010 | 7.85 | 11.17 | 891,517 | .97 | 1.15 | .75 | 1.37 | 3 | |||||||||||||||||||||||||||
| 2009 | 38.49 | 16.39 | 878,321 | .98 | 1.35 | .68 | 1.65 | 4 | |||||||||||||||||||||||||||
| 2008 | (26.64 | ) | (24.65 | ) | 841,579 | .96 | 1.52 | .66 | 1.82 | 8 | |||||||||||||||||||||||||
| 2007 | (3.03 | ) | 11.35 | 1,237,527 | .94 | 1.62 | .64 | 1.93 | 4 | ||||||||||||||||||||||||||
| 2006 | 17.86 | 8.28 | 1,214,721 | .95 | 1.41 | .66 | 1.71 | 8 | |||||||||||||||||||||||||||
| Equity Premium Advantage (JLA) | |||||||||||||||||||||||||||||||||||
| Year Ended 12/31: | |||||||||||||||||||||||||||||||||||
| 2011 | (d) | 2.19 | % | 4.01 | % | 349,992 | .99 | * | .71 | * | .91 | * | .80 | * | 5 | ||||||||||||||||||||
| 2010 | 8.95 | 10.83 | 352,431 | 1.00 | .66 | .85 | .80 | 5 | |||||||||||||||||||||||||||
| 2009 | 41.37 | 20.21 | 349,898 | 1.01 | .82 | .81 | 1.02 | 10 | |||||||||||||||||||||||||||
| 2008 | (29.22 | ) | (25.63 | ) | 323,971 | .99 | .88 | .79 | 1.08 | 12 | |||||||||||||||||||||||||
| 2007 | (5.15 | ) | 11.50 | 484,998 | .98 | .99 | .78 | 1.19 | 3 | ||||||||||||||||||||||||||
| 2006 | 20.52 | 7.35 | 474,781 | .99 | .85 | .79 | 1.05 | 26 | |||||||||||||||||||||||||||
| Equity Premium and Growth (JPG) | |||||||||||||||||||||||||||||||||||
| Year Ended 12/31: | |||||||||||||||||||||||||||||||||||
| 2011 | (d) | (.16 | )% | 4.52 | % | 236,501 | .97 | * | 1.56 | * | N/A | N/A | — | *** | |||||||||||||||||||||
| 2010 | 14.90 | 12.60 | 235,095 | .98 | 1.75 | N/A | N/A | 3 | |||||||||||||||||||||||||||
| 2009 | 33.63 | 14.77 | 226,187 | .98 | 1.99 | N/A | N/A | 6 | |||||||||||||||||||||||||||
| 2008 | (30.09 | ) | (25.38 | ) | 216,044 | .96 | 2.13 | N/A | N/A | 12 | |||||||||||||||||||||||||
| 2007 | (3.55 | ) | 6.86 | 319,300 | .95 | 3.40 | N/A | N/A | 26 | ||||||||||||||||||||||||||
| 2006 | 22.68 | 11.90 | 323,569 | .96 | 2.34 | N/A | N/A | 37 | |||||||||||||||||||||||||||
(a) Per share Net Investment Income (Loss) is calculated using the average daily shares method.
(b) Total Return Based on Market Value is the combination of changes in the market price per share and the effect of reinvested dividend income and reinvested capital gains distributions, if any, at the average price paid per share at the time of reinvestment. The last dividend declared in the period, which is typically paid on the first business day of the following month, is assumed to be reinvested at the ending market price. The actual reinvestment for the last dividend declared in the period may take place over several days, and in some instances may not be based on the market price, so the actual reinvestment price may be different from the price used in the calculation. Total returns are not annualized.
Total Return Based on Net Asset Value is the combination of changes in net asset value, reinvested dividend income at net asset value and reinvested capital gains distributions at net asset value, if any. The last dividend declared in the period, which is typically paid on the first business day of the following month, is assumed to be reinvested at the ending net asset value. The actual reinvest price for the last dividend declared in the period may often be based on the Fund's market price (and not its net asset value), and therefore may be different from the price used in the calculation. Total returns are not annualized.
(c) After expense reimbursement from Adviser, where applicable. Ratios do not reflect the effect of custodian fee credits earned on the Fund's net cash on deposit with the custodian bank, where applicable. As of May 31, 2011, the Advisor is no longer reimbursing Equity Premium Advantage (JLA) for any fees or expenses.
(d) For the six months ended June 30, 2011.
N/A Fund does not have a contractual reimbursement with the Adviser.
* Annualized.
** Rounds to less than $.01 per share.
*** Rounds to less than 1%.
**** Represents distributions paid "From and in excess of net investment income" for the six months ended June 30, 2011.
See accompanying notes to financial statements.
Nuveen Investments
53
Notes to
FINANCIAL STATEMENTS (Unaudited)
1. General Information and Significant Accounting Policies
General Information
The funds covered in this report and their corresponding NYSE Amex symbols are Nuveen Equity Premium Income Fund (JPZ), Nuveen Equity Premium Opportunity Fund (JSN), Nuveen Equity Premium Advantage Fund (JLA) and Nuveen Equity Premium and Growth Fund (JPG) (each a "Fund" and collectively, the "Funds"). The Funds are registered under the Investment Company Act of 1940, as amended, as closed-end registered investment companies.
Equity Premium Income's (JPZ) investment objective is to provide a high level of current income and gains. The Fund invests its managed assets in a diversified equity portfolio that seeks to substantially replicate price movements of the Standard & Poor's ("S&P") 500 Stock Index. The Fund also uses an index option strategy of selling index call options in seeking to moderate the volatility of returns relative to an all equity portfolio.
Equity Premium Opportunity's (JSN) primary investment objective is to provide a high level of current income and gains from net index option premiums. The Fund's secondary investment objective is to seek capital appreciation consistent with the Fund's strategy and its primary objective. The Fund invests its managed assets in a diversified equity portfolio that seeks to substantially replicate price movements of a 75% / 25% combination of the S&P 500 Stock Index and the NASDAQ-100 Stock Index, respectively. The Fund also uses an index option strategy of selling S&P 500 and NASDAQ Index call options in seeking to moderate the volatility of returns relative to an all equity portfolio.
Equity Premium Advantage's (JLA) primary investment objective is to provide a high level of current income and gains from net index option premiums. The Fund's secondary investment objective is to seek capital appreciation consistent with the Fund's strategy and its primary objective. The Fund invests its managed assets in a diversified equity portfolio that seeks to substantially replicate price movements of a 50% / 50% combination of the S&P 500 Stock Index and the NASDAQ-100 Stock Index, respectively. The Fund also uses an index option strategy of selling S&P 500 and NASDAQ Index call options in seeking to moderate the volatility of returns relative to an all equity portfolio.
Equity Premium and Growth's (JPG) primary investment objective is to provide a high level of current income and gains from net index option premiums. The Fund's secondary investment objective is to seek capital appreciation consistent with the Fund's strategy and its primary objective. The Fund invests its managed assets in a diversified equity portfolio that seeks to substantially replicate price movements of the S&P 500 Stock Index. The Fund also uses an index option strategy of selling index call options covering approximately 80% of the value of the Fund's equity portfolio in seeking to moderate the volatility of returns relative to an all equity portfolio.
Effective January 1, 2011, Nuveen Asset Management (the "Adviser"), a wholly-owned subsidiary of Nuveen Investments, Inc. ("Nuveen") changed its name to Nuveen Fund Advisors, Inc.
Significant Accounting Policies
The following is a summary of significant accounting policies followed by the Funds in the preparation of their financial statements in accordance with accounting principles generally accepted in the United States ("U.S. GAAP").
Investment Valuation
Common stocks and other equity-type securities are valued at the last sales price on the securities exchange on which such securities are primarily traded and are generally classified as Level 1. Securities primarily traded on the NASDAQ National Market ("NASDAQ") are valued, except as indicated below, at the NASDAQ Official Closing Price and are generally classified as Level 1. However, securities traded on a securities exchange or NASDAQ for which there were no transactions on a given day or securities not listed on a securities exchange or NASDAQ are valued at the quoted bid price. Prices of certain American Depository Receipts ("ADR") held by the Funds that trade in only limited volume in the United States are valued based on the last traded price, official closing price, or the most recent bid price of the underlying non-U.S.-traded stock, adjusted as appropriate for the underlying-to-ADR conversion ratio and foreign exchange rate, and from time-to-time may also be adjusted further to take into account material
Nuveen Investments
54
events that may take place after the close of the NYSE. These securities generally represent a transfer from a Level 1 to a Level 2 security.
Index options are valued at the average of the closing bid and asked quotations. The close of trading of index options traded on the Chicago Board Options Exchange normally occurs at 4:15 Eastern Time (ET), which is different from the normal 4:00 ET close of the NYSE (the time of day as of which each Fund's NAV is calculated). Under normal market circumstances, closing index option quotations are considered to reflect the index option contract values as of the close of the NYSE and will be used to value the option contracts. However, a significant change in the S&P 500 or NASDAQ-100 futures contracts between the NYSE close and the options market close will be considered as an indication that closing market quotations for index options do not reflect the value of the contracts as of the stock market close. In the event of such a significant change, the Fund's Board of Trustees or its designee will determine a value for the options. Any such valuation will likely take into account any information that may be available about the actual trading price of the affected option as of 4:00 ET, and if no such information is reliably available, the valuation of the option may take into account various option pricing methodologies, as determined to be appropriate under the circumstances. Index options are generally classified as Level 1.
Repurchase agreements are valued at contract amount plus accrued interest, which approximates market value. These securities are generally classified as Level 2.
Certain securities may not be able to be priced by the pre-established pricing methods as described above. Such securities may be valued by the Funds' Board of Trustees or its designee at fair value. These securities generally include, but are not limited to, restricted securities (securities which may not be publicly sold without registration under the Securities Act of 1933, as amended) for which a pricing service is unable to provide a market price; securities whose trading has been formally suspended; debt securities that have gone into default and for which there is no current market quotation; a security whose market price is not available from a pre-established pricing source; a security with respect to which an event has occurred that is likely to materially affect the value of the security after the market has closed but before the calculation of a Fund's net asset value (as may be the case in non-U.S. markets on which the security is primarily traded) or make it difficult or impossible to obtain a reliable market quotation; and a security whose price, as provided by the pricing service, is not deemed to reflect the security's fair value. As a general principle, the fair value of a security would appear to be the amount that the owner might reasonably expect to receive for it in a current sale. A variety of factors may be considered in determining the fair value of such securities, which may include consideration of the following: yields or prices of investments of comparable quality, type of issue, coupon, maturity and rating, market quotes or indications of value from security dealers, evaluations of anticipated cash flows or collateral, general market conditions and other information and analysis, including the obligor's credit characteristics considered relevant. These securities are generally classified as Level 2 or Level 3 depending on the priority of the significant inputs. Regardless of the method employed to value a particular security, all valuations are subject to review by the Funds' Board of Trustees or its designee.
Refer to Footnote 2—Fair Value Measurements for further details on the leveling of securities held by the Funds as of the end of the reporting period.
Investment Transactions
Investment transactions are recorded on a trade date basis. Realized gains and losses from investment transactions are determined on the specific identification method, which is the same basis used for federal income tax purposes.
Investment Income
Dividend income is recorded on the ex-dividend date or, for foreign securities, when information is available. Interest income is recorded on an accrual basis.
Income Taxes
Each Fund is a separate taxpayer for federal income tax purposes. Each Fund intends to comply with the requirements of Subchapter M of the Internal Revenue Code applicable to regulated investment companies. Each Fund intends to distribute substantially all of its investment company taxable income to shareholders. In any year when the Funds realize net capital gains, each Fund may choose to distribute all or a portion of its net capital gains to shareholders, or alternatively, to retain all or a portion of its net capital gains and pay federal corporate income taxes on such retained gains.
For all open tax years and all major taxing jurisdictions, management of the Funds has concluded that there are no significant uncertain tax positions that would require recognition in the financial statements. Open tax years are those that are open for examination by taxing authorities (i.e., generally the last four tax year ends and the interim tax period since then). Furthermore, management of the Funds is also not aware of any tax positions for which it is reasonably possible that the total amounts of unrecognized tax benefits will significantly change in the next twelve months.
Dividends and Distributions to Common Shareholders
Each Fund makes quarterly cash distributions to shareholders of a stated dollar amount per share. Subject to approval and oversight by the Funds' Board of Trustees, each Fund seeks to maintain a stable distribution level designed to deliver the long-term return potential of each Fund's investment strategy through regular quarterly distributions (a "Managed Distribution Program"). Total distributions during a calendar year generally will be made from each Fund's net investment income, net realized capital gains and
Nuveen Investments
55
Notes to
FINANCIAL STATEMENTS (Unaudited) (continued)
net unrealized capital gains in the Fund's portfolio, if any. The portion of distributions paid attributed to net unrealized gains, if any, is distributed from the Fund's assets and is treated by shareholders as a non-taxable distribution ("Return of Capital") for tax purposes. In the event that total distributions during a calendar year exceed a Fund's total return on net asset value, the difference will reduce net asset value per share. If a Fund's total return on net asset value exceeds total distributions during a calendar year, the excess will be reflected as an increase in net asset value per share. The final determination of the source and character of all distributions for the fiscal year are made after the end of the fiscal year and are reflected in the financial statements contained in the annual report as of December 31 each year.
The actual character of distributions made by the Funds during the fiscal year ended December 31, 2010, is reflected in the accompanying financial statements.
The distributions made by the Funds during the six months ended June 30, 2011, are provisionally classified as being "From and in excess of net investment income," and those distributions will be classified as being from net investment income, net realized capital gains and/or a return of capital for tax purposes after the fiscal year end. For purposes of calculating "Undistributed (Over-distribution of) net investment income" as of June 30, 2011, the distribution amounts provisionally classified as "From and in excess of net investment income" were treated as being entirely from net investment income. Consequently, the financial statements at June 30, 2011, reflect an over-distribution of net investment income.
Foreign Currency Transactions
Each Fund is authorized to engage in foreign currency exchange transactions, including foreign currency forward, futures, options and swap contracts. To the extent that the Funds invest in securities and/or contracts that are denominated in a currency other than U.S. dollars, the Funds will be subject to currency risk, which is the risk that an increase in the U.S. dollar relative to the foreign currency will reduce returns or portfolio value. Generally, when the U.S. dollar rises in value against a foreign currency, the Fund's investments denominated in that currency will lose value because its currency is worth fewer U.S. dollars; the opposite effect occurs if the U.S. dollar falls in relative value. Investments and other assets and liabilities denominated in foreign currencies are converted into U.S. dollars on a spot (i.e. cash) basis at the spot rate prevailing in the foreign currency exchange market at the time of valuation. Purchases and sales of investments and income denominated in foreign currencies are translated into U.S. dollars on the respective dates of such transactions.
The books and records of the Funds are maintained in U.S. dollars. Foreign currencies, investments and other assets and liabilities are translated into U.S. dollars at 4:00 p.m. ET. Investments, income and expenses are translated on the respective dates of such transactions. Net realized foreign currency gains and losses resulting from changes in exchange rates include foreign currency gains and losses between trade date and settlement date of the transactions, foreign currency transactions, and the difference between the amounts of interest and dividends recorded on the books of the Funds and the amounts actually received.
The realized gains and losses resulting from changes in foreign currency exchange rates and changes in foreign exchange rates associated with other assets and liabilities on investments are recognized as a component of "Net realized gain (loss) from investments and foreign currency," on the Statement of Operations, when applicable.
The unrealized gains and losses resulting from changes in foreign currency exchange rates and changes in foreign exchange rates associated with other assets and liabilities on investments are recognized as a component of "Change in net unrealized appreciation (depreciation) of investments and foreign currency," on the Statement of Operations, when applicable.
Options Transactions
Each Fund is subject to equity price risk in the normal course of pursuing its investment objectives and is authorized to write (sell) call options, in an attempt to manage such risk. When the Fund writes an option, an amount equal to the net premium received (the premium less commission) is recognized as a component of "Call options written, at value" on the Statement of Assets and Liabilities and is subsequently adjusted to reflect the current value of the written option until the option is exercised or expires or the Fund enters into a closing purchase transaction. The changes in the value of options written during the fiscal period are recognized as a component of "Change in net unrealized appreciation (depreciation) of call options written" on the Statement of Operations.
Nuveen Investments
56
When an option is exercised or expires or a Fund enters into a closing purchase transaction, the difference between the net premium received and any amount paid at expiration or on executing a closing purchase transaction, including commission, is recognized as a component of "Net realized gain (loss) from options written " on the Statement of Operations. The Fund, as a writer of an option, has no control over whether the underlying instrument may be sold (called) or purchased (put) and as a result bears the risk of an unfavorable change in the market value of the instrument underlying the written option. There is also the risk the Fund may not be able to enter into a closing transaction because of an illiquid market.
During six months ended June 30, 2010, each Fund wrote call options on a broad equity index, while investing in a portfolio of equities, to enhance returns while foregoing some upside potential.
The average notional amount of call options written during the six months ended June 30, 2010, for each Fund was as follows:
| Equity Premium Income (JPZ) | Equity Premium Opportunity (JSN) | Equity Premium Advantage (JLA) | Equity Premium and Growth (JPG) | ||||||||||||||||
| Average notional amount of call options written* | $ | (499,510,500 | ) | $ | (866,507,167 | ) | $ | (340,517,500 | ) | $ | (183,496,000 | ) | |||||||
* The average notional amount is calculated based on the outstanding balance at the beginning of the fiscal year and at the end of each fiscal quarter within the current fiscal year.
Refer to Footnote 3—Derivative Instruments and Hedging Activities and Footnote 5 — Investment Transactions for further details on call options written.
Market and Counterparty Credit Risk
In the normal course of business each Fund may invest in financial instruments and enter into financial transactions where risk of potential loss exists due to changes in the market (market risk) or failure of the other party to the transaction to perform (counterparty credit risk). The potential loss could exceed the value of the financial assets recorded on the financial statements. Financial assets, which potentially expose each Fund to counterparty credit risk, consist principally of cash due from counterparties on forward, option and swap transactions, when applicable. The extent of each Fund's exposure to counterparty credit risk in respect to these financial assets approximates their carrying value as recorded on the Statement of Assets and Liabilities. Futures contracts, when applicable, expose a Fund to minimal counterparty credit risk as they are exchange traded and the exchange's clearinghouse, which is counterparty to all exchange traded futures, guarantees the futures contracts against default.
Each Fund helps manage counterparty credit risk by entering into agreements only with counterparties the Adviser believes have the financial resources to honor their obligations and by having the Adviser monitor the financial stability of the counterparties. Additionally, counterparties may be required to pledge collateral daily (based on the daily valuation of the financial asset) on behalf of each Fund with a value approximately equal to the amount of any unrealized gain above a pre-determined threshold. Reciprocally, when each Fund has an unrealized loss, the Funds have instructed the custodian to pledge assets of the Funds as collateral with a value approximately equal to the amount of the unrealized loss above a pre-determined threshold. Collateral pledges are monitored and subsequently adjusted if and when the valuations fluctuate, either up or down, by at least the pre-determined threshold amount.
Repurchase Agreements
In connection with transactions in repurchase agreements, it is each Fund's policy that its custodian take possession of the underlying collateral securities, the fair value of which exceeds the principal amount of the repurchase transaction, including accrued interest, at all times. If the counterparty defaults, and the fair value of the collateral declines, realization of the collateral may be delayed or limited.
Custodian Fee Credit
Each Fund has an arrangement with the custodian bank whereby certain custodian fees and expenses are reduced by net credits earned on each Fund's cash on deposit with the bank. Such deposit arrangements are an alternative to overnight investments. Credits for cash balances may be offset by charges for any days on which a Fund overdraws its account at the custodian bank.
Indemnifications
Under the Funds' organizational documents, their officers and trustees are indemnified against certain liabilities arising out of the performance of their duties to the Funds. In addition, in the normal course of business, the Funds enter into contracts that provide general indemnifications to other parties. The Funds' maximum exposure under these arrangements is unknown as this would involve future claims that may be made against the Funds that have not yet occurred. However, the Funds have not had prior claims or losses pursuant to these contracts and expect the risk of loss to be remote.
Use of Estimates
The preparation of financial statements in conformity with U.S. GAAP requires management to make estimates and assumptions that affect the reported amounts of assets and liabilities at the date of the financial statements and the reported amounts of increases and decreases in net assets from operations during the reporting period. Actual results may differ from those estimates.
Nuveen Investments
57
Notes to
FINANCIAL STATEMENTS (Unaudited) (continued)
2. Fair Value Measurements
Fair value is defined as the price that the Funds would receive upon selling an investment or transferring a liability in an orderly transaction to an independent buyer in the principal or most advantageous market for the investment. A three-tier hierarchy is used to maximize the use of observable market data and minimize the use of unobservable inputs and to establish classification of fair value measurements for disclosure purposes. Observable inputs reflect the assumptions market participants would use in pricing the asset or liability. Observable inputs are based on market data obtained from sources independent of the reporting entity. Unobservable inputs reflect the reporting entity's own assumptions about the assumptions market participants would use in pricing the asset or liability. Unobservable inputs are based on the best information available in the circumstances. The three-tier hierarchy of inputs is summarized in the three broad levels listed below:
Level 1 – Quoted prices in active markets for identical securities.
Level 2 – Other significant observable inputs (including quoted prices for similar securities, interest rates, prepayment speeds, credit risk, etc.).
Level 3 – Significant unobservable inputs (including management's assumptions in determining the fair value of investments).
The inputs or methodologies used for valuing securities are not an indication of the risk associated with investing in those securities. The following is a summary of each Fund's fair value measurements as of June 30, 2011:
| Equity Premium Income (JPZ) | Level 1 | Level 2 | Level 3 | Total | |||||||||||||||
| Investments: | |||||||||||||||||||
| Common Stocks | $ | 505,748,183 | $ | — | $ | — | $ | 505,748,183 | |||||||||||
| Short-Term Investments | — | 35,715,353 | — | 35,715,353 | |||||||||||||||
| Derivatives: | |||||||||||||||||||
| Call Options Written | (16,220,840 | ) | — | — | (16,220,840 | ) | |||||||||||||
| Total | $ | 489,527,343 | $ | 35,715,353 | $ | — | $ | 525,242,696 | |||||||||||
| Equity Premium Opportunity (JSN) | Level 1 | Level 2 | Level 3 | Total | |||||||||||||||
| Investments: | |||||||||||||||||||
| Common Stocks | $ | 891,078,723 | $ | — | $ | — | $ | 891,078,723 | |||||||||||
| Short-Term Investments | — | 45,233,097 | — | 45,233,097 | |||||||||||||||
| Derivatives: | |||||||||||||||||||
| Call Options Written | (28,704,736 | ) | — | — | (28,704,736 | ) | |||||||||||||
| Total | $ | 862,373,987 | $ | 45,233,097 | $ | — | $ | 907,607,084 | |||||||||||
| Equity Premium Advantage (JLA) | Level 1 | Level 2 | Level 3 | Total | |||||||||||||||
| Investments: | |||||||||||||||||||
| Common Stocks | $ | 345,675,211 | $ | — | $ | — | $ | 345,675,211 | |||||||||||
| Warrants | 90,770 | — | — | 90,770 | |||||||||||||||
| Short-Term Investments | — | 22,427,356 | — | 22,427,356 | |||||||||||||||
| Derivatives: | |||||||||||||||||||
| Call Options Written | (11,237,173 | ) | — | — | (11,237,173 | ) | |||||||||||||
| Total | $ | 334,528,808 | $ | 22,427,356 | $ | — | $ | 356,956,164 | |||||||||||
| Equity Premium and Growth (JPG) | Level 1 | Level 2 | Level 3 | Total | |||||||||||||||
| Investments: | |||||||||||||||||||
| Common Stocks | $ | 237,069,544 | $ | — | $ | — | $ | 237,069,544 | |||||||||||
| Short-Term Investments | — | 8,885,535 | — | 8,885,535 | |||||||||||||||
| Derivatives: | |||||||||||||||||||
| Call Options Written | (6,046,195 | ) | — | — | (6,046,195 | ) | |||||||||||||
| Total | $ | 231,023,349 | $ | 8,885,535 | $ | — | $ | 239,908,884 | |||||||||||
Nuveen Investments
58
During the six months ended June 30, 2011, the Funds recognized no significant transfers to or from Level 1, Level 2 or Level 3.
3. Derivative Instruments and Hedging Activities
The Funds record derivative instruments at fair value, with changes in fair value recognized on the Statement of Operations, when applicable. Even though the Funds' investments in derivatives may represent economic hedges, they are not considered to be hedge transactions for financial reporting purposes. For additional information on the derivative instruments in which each Fund was invested during and at the end of the reporting period, refer to the Portfolios of Investments, Financial Statements and Footnote 1—General Information and Significant Accounting Policies.
The following tables present the fair value of all derivative instruments held by the Funds as of June 30, 2011, the location of these instruments on the Statement of Assets and Liabilities, and the primary underlying risk exposure.
Equity Premium Income (JPZ)
| Location on the Statement of Assets and Liabilities | |||||||||||||||||||||||
| Underlying | Derivative | Asset Derivatives | Liability Derivatives | ||||||||||||||||||||
| Risk Exposure | Instrument | Location | Value | Location | Value | ||||||||||||||||||
| Equity Price | Options | — | $ | — | Call options written, at value | $ | 16,220,840 | ||||||||||||||||
Equity Premium Opportunity (JSN)
| Location on the Statement of Assets and Liabilities | |||||||||||||||||||||||
| Underlying | Derivative | Asset Derivatives | Liability Derivatives | ||||||||||||||||||||
| Risk Exposure | Instrument | Location | Value | Location | Value | ||||||||||||||||||
| Equity Price | Options | — | $ | — | Call options written, at value | $ | 28,704,736 | ||||||||||||||||
Equity Premium Advantage (JLA)
| Location on the Statement of Assets and Liabilities | |||||||||||||||||||||||
| Underlying | Derivative | Asset Derivatives | Liability Derivatives | ||||||||||||||||||||
| Risk Exposure | Instrument | Location | Value | Location | Value | ||||||||||||||||||
| Equity Price | Options | — | $ | — | Call options written, at value | $ | 11,237,173 | ||||||||||||||||
Equity Premium and Growth (JPG)
| Location on the Statement of Assets and Liabilities | |||||||||||||||||||||||
| Underlying | Derivative | Asset Derivatives | Liability Derivatives | ||||||||||||||||||||
| Risk Exposure | Instrument | Location | Value | Location | Value | ||||||||||||||||||
| Equity Price | Options | — | $ | — | Call options written, at value | $ | 6,046,195 | ||||||||||||||||
The following tables present the amount of net realized gain (loss) and change in net unrealized appreciation (depreciation) recognized for the six months ended June 30, 2011, on derivative instruments, as well as the primary risk exposure associated with each.
| Net Realized Gain (Loss) from Call Options Written | Equity Premium Income (JPZ) | Equity Premium Opportunity (JSN) | Equity Premium Advantage (JLA) | Equity Premium and Growth (JPG) | |||||||||||||||
| Risk Exposure | |||||||||||||||||||
| Equity Price | $ | (6,837,242 | ) | $ | (6,216,933 | ) | $ | (172,860 | ) | $ | (2,470,804 | ) | |||||||
| Change in Net Unrealized Appreciation (Depreciation) of Call Options Written | Equity Premium Income (JPZ) | Equity Premium Opportunity (JSN) | Equity Premium Advantage (JLA) | Equity Premium and Growth (JPG) | |||||||||||||||
| Risk Exposure | |||||||||||||||||||
| Equity Price | $ | 1,738,050 | $ | (427,620 | ) | $ | (1,540,164 | ) | $ | 622,662 | |||||||||
Nuveen Investments
59
Notes to
FINANCIAL STATEMENTS (Unaudited) (continued)
4. Fund Shares
Transactions in shares were as follows:
| Equity Premium Income (JPZ) | Equity Premium Opportunity (JSN) | ||||||||||||||||||
| Six Months Ended 6/30/11 | Year Ended 12/31/10 | Six Months Ended 6/30/11 | Year Ended 12/31/10 | ||||||||||||||||
| Shares issued to shareholders due to reinvestment of distributions | — | 243,124 | — | 500,507 | |||||||||||||||
| Shares repurchased and retired | — | — | — | — | |||||||||||||||
| Weighted average: | |||||||||||||||||||
| Price per share repurchased and retired | — | — | — | — | |||||||||||||||
| Discount per share repurchased and retired | — | — | — | — | |||||||||||||||
| Equity Premium Advantage (JLA) | Equity Premium and Growth (JPG) | ||||||||||||||||||
| Six Months Ended 6/30/11 | Year Ended 12/31/10 | Six Months Ended 6/30/11 | Year Ended 12/31/10 | ||||||||||||||||
| Shares issued to shareholders due to reinvestment of distributions | — | 27,509 | — | — | |||||||||||||||
| Shares repurchased and retired | — | — | — | — | |||||||||||||||
| Weighted average: | |||||||||||||||||||
| Price per share repurchased and retired | — | — | — | — | |||||||||||||||
| Discount per share repurchased and retired | — | — | — | — | |||||||||||||||
5. Investment Transactions
Purchases and sales (excluding short-term investments and derivative transactions) during the six months ended June 30, 2011, were as follows:
| Equity Premium Income (JPZ) | Equity Premium Opportunity (JSN) | Equity Premium Advantage (JLA) | Equity Premium and Growth (JPG) | ||||||||||||||||
| Purchases | $ | 665,066 | $ | 24,106,509 | $ | 16,746,809 | $ | 1,001,275 | |||||||||||
| Sales | 39,770,294 | 78,801,525 | 36,160,930 | 10,563,035 | |||||||||||||||
Transactions in call options written during the six months ended June 30, 2011, were as follows:
| Equity Premium Income (JPZ) | Equity Premium Opportunity (JSN) | ||||||||||||||||||
| Number of Contracts | Premiums Received | Number of Contracts | Premiums Received | ||||||||||||||||
| Outstanding, beginning of period | 4,084 | $ | 15,172,360 | 10,814 | $ | 28,230,630 | |||||||||||||
| Options written | 16,646 | 55,793,424 | 54,457 | 96,971,858 | |||||||||||||||
| Options terminated in closing purchase transactions | (16,916 | ) | (57,143,214 | ) | (49,374 | ) | (101,118,515 | ) | |||||||||||
| Options expired | — | — | (1,306 | ) | (923,260 | ) | |||||||||||||
| Outstanding, end of period | 3,814 | $ | 13,822,570 | 14,591 | $ | 23,160,713 | |||||||||||||
Nuveen Investments
60
| Equity Premium Advantage (JLA) | Equity Premium and Growth (JPG) | ||||||||||||||||||
| Number of Contracts | Premiums Received | Number of Contracts | Premiums Received | ||||||||||||||||
| Outstanding, beginning of period | 6,083 | $ | 11,764,119 | 1,501 | $ | 5,575,988 | |||||||||||||
| Options written | 31,930 | 38,213,933 | 6,129 | 20,556,125 | |||||||||||||||
| Options terminated in closing purchase transactions | (28,389 | ) | (40,772,037 | ) | (6,202 | ) | (20,977,533 | ) | |||||||||||
| Options expired | (983 | ) | (704,967 | ) | — | — | |||||||||||||
| Outstanding, end of period | 8,641 | $ | 8,501,048 | 1,428 | $ | 5,154,580 | |||||||||||||
6. Income Tax Information
The following information is presented on an income tax basis. Differences between amounts for financial statement and federal income tax purposes are primarily due to timing differences in recording income, timing differences in recognizing certain gains and losses on investment transactions and the recognition of unrealized gain or loss for tax (mark-to-market) on option contracts. To the extent that differences arise that are permanent in nature, such amounts are reclassified within the capital accounts as detailed below. Temporary differences do not require reclassification. Temporary and permanent differences do not impact the net asset values of the Funds.
At June 30, 2011, the cost and unrealized appreciation (depreciation) of investments (excluding investments in derivatives), as determined on a federal income tax basis, were as follows:
| Equity Premium Income (JPZ) | Equity Premium Opportunity (JSN) | Equity Premium Advantage (JLA) | Equity Premium and Growth (JPG) | ||||||||||||||||
| Cost of investments | $ | 451,839,481 | $ | 726,797,140 | $ | 273,582,725 | $ | 215,886,766 | |||||||||||
| Gross unrealized: | |||||||||||||||||||
| Appreciation | $ | 147,322,002 | $ | 268,596,255 | $ | 108,741,953 | $ | 54,140,531 | |||||||||||
| Depreciation | (57,697,947 | ) | (59,081,575 | ) | (14,131,341 | ) | (24,072,218 | ) | |||||||||||
| Net unrealized appreciation (depreciation) of investments | $ | 89,624,055 | $ | 209,514,680 | $ | 94,610,612 | $ | 30,068,313 | |||||||||||
Permanent differences, primarily due to REIT adjustments and return of capital distributions, resulted in reclassifications among the Funds' components of net assets at December 31, 2010, the Funds' last tax year-end, as follows:
| Equity Premium Income (JPZ) | Equity Premium Opportunity (JSN) | Equity Premium Advantage (JLA) | Equity Premium and Growth (JPG) | ||||||||||||||||
| Paid-in surplus | $ | (38,039,565 | ) | $ | (74,320,304 | ) | $ | (30,740,951 | ) | $ | (14,317,398 | ) | |||||||
| Undistributed (Over-distribution) of net investment income | 38,056,011 | 74,358,312 | 30,751,211 | 14,317,529 | |||||||||||||||
| Accumulated net realized gain (loss) | (16,446 | ) | (38,008 | ) | (10,260 | ) | (131 | ) | |||||||||||
The tax components of undistributed net ordinary income and net long-term capital gains at December 31, 2010, the Funds' last tax year end, were as follows:
| Equity Premium Income (JPZ) | Equity Premium Opportunity (JSN) | Equity Premium Advantage (JLA) | Equity Premium and Growth (JPG) | ||||||||||||||||
| Undistributed net ordinary income * | $ | — | $ | — | $ | — | $ | — | |||||||||||
| Undistributed net long-term capital gains | — | — | — | — | |||||||||||||||
* Net ordinary income consists of net taxable income derived from dividends, interest, and net short-term capital gains, if any.
The tax character of distributions paid during the Funds' last tax year ended December 31, 2010 was designated for purposes of the dividends paid deduction as follows:
| Equity Premium Income (JPZ) | Equity Premium Opportunity (JSN) | Equity Premium Advantage (JLA) | Equity Premium and Growth (JPG) | ||||||||||||||||
| Distributions from net ordinary income * | $ | 10,215,397 | $ | 11,928,197 | $ | 2,769,975 | $ | 3,953,391 | |||||||||||
| Distributions from net long-term capital gains | — | — | — | — | |||||||||||||||
| Return of capital | 37,794,887 | 74,396,142 | 30,753,623 | 14,315,648 | |||||||||||||||
* Net ordinary income consists of net taxable income derived from dividends, interest, and net short-term capital gains, if any.
Nuveen Investments
61
Notes to
FINANCIAL STATEMENTS (Unaudited) (continued)
At December 31, 2010, the Funds' last tax year end, the Funds had unused capital loss carryforwards available for federal income tax purposes to be applied against future capital gains, if any. If not applied, the carryforwards will expire as follows:
| Equity Premium Income (JPZ) | Equity Premium Opportunity (JSN) | Equity Premium Advantage (JLA) | Equity Premium and Growth (JPG) | ||||||||||||||||
| Expiration: | |||||||||||||||||||
| December 31, 2017 | $ | 75,442,946 | $ | 104,952,898 | $ | 46,480,475 | $ | 33,170,912 | |||||||||||
| December 31, 2018 | 4,958,903 | 38,327,754 | 14,352,958 | 7,655,485 | |||||||||||||||
| Total | $ | 80,401,849 | $ | 143,280,652 | $ | 60,833,433 | $ | 40,826,397 | |||||||||||
The Funds have elected to defer net realized losses from investments incurred from November 1, 2010 through December 31, 2010, the Funds' last tax year end, ("post-October losses") in accordance with federal income tax regulations. The post-October losses are treated as having arisen on the first day of the current fiscal year. The following Funds have elected to defer post-October losses as follows:
| Equity Premium Income (JPZ) | Equity Premium Opportunity (JSN) | Equity Premium and Growth (JPG) | |||||||||||||
| Post-October capital losses | $ | 6,852,773 | $ | 1,539,720 | $ | 2,351,923 | |||||||||
7. Management Fees and Other Transactions with Affiliates
Each Fund's management fee consists of two components – a fund-level fee, based only on the amount of assets within the Fund, and a complex-level fee, based on the aggregate amount of all eligible fund assets managed by the Adviser. This pricing structure enables Fund shareholders to benefit from growth in the assets within their Fund as well as from growth in the amount of complex-wide assets managed by the Adviser.
The annual fund-level fee for each Fund, payable monthly, is calculated according to the following schedule:
| Average Daily Managed Assets* | Equity Premium Income (JPZ) Equity Premium Opportunity (JSN) Equity Premium Advantage (JLA) Fund-Level Fee Rate | ||||||
| For the first $500 million | .7000 | % | |||||
| For the next $500 million | .6750 | ||||||
| For the next $500 million | .6500 | ||||||
| For the next $500 million | .6250 | ||||||
| For managed assets over $2 billion | .6000 | ||||||
| Average Daily Managed Assets* | Equity Premium and Growth (JPG) Fund-Level Fee Rate | ||||||
| For the first $500 million | .6800 | % | |||||
| For the next $500 million | .6550 | ||||||
| For the next $500 million | .6300 | ||||||
| For the next $500 million | .6050 | ||||||
| For managed assets over $2 billion | .5800 | ||||||
Nuveen Investments
62
The annual complex-level fee for each Fund, payable monthly, is calculated according to the following schedule:
| Complex-Level Managed Asset Breakpoint Level* | Effective Rate at Breakpoint Level | ||||||
| $55 billion | .2000 | % | |||||
| $56 billion | .1996 | ||||||
| $57 billion | .1989 | ||||||
| $60 billion | .1961 | ||||||
| $63 billion | .1931 | ||||||
| $66 billion | .1900 | ||||||
| $71 billion | .1851 | ||||||
| $76 billion | .1806 | ||||||
| $80 billion | .1773 | ||||||
| $91 billion | .1691 | ||||||
| $125 billion | .1599 | ||||||
| $200 billion | .1505 | ||||||
| $250 billion | .1469 | ||||||
| $300 billion | .1445 | ||||||
* For the fund-level and complex-level fees, managed assets include closed-end fund assets managed by the Adviser that are attributable to financial leverage. For these purposes, financial leverage includes the funds' use of preferred stock and borrowings and certain investments in the residual interest certificates (also called inverse floating rate securities) in tender option bond (TOB) trusts, including the portion of assets held by a TOB trust that has been effectively financed by the trust's issuance of floating rate securities, subject to an agreement by the Adviser as to certain funds to limit the amount of such assets for determining managed assets in certain circumstances. The complex-level fee is calculated based upon the aggregate daily managed assets of all Nuveen Funds that constitute "eligible assets." Eligible assets do not include assets attributable to investments in other Nuveen Funds and assets in excess of $2 billion added to the Nuveen Fund complex in connection with the Adviser's assumption of the management of the former First American Funds effective January 1, 2011. As of June 30, 2011, the complex-level fee rate for each of these Funds was .1774%.
The management fee compensates the Adviser for overall investment advisory and administrative services and general office facilities. The Adviser is responsible for each Fund's overall strategy and asset allocation decisions. The Adviser has entered into sub-advisory agreements with Gateway Investment Advisers, LLC ("Gateway"), under which Gateway manages the investment portfolios of the Funds. Gateway is compensated for its services to the Funds from the management fee paid to the Adviser.
The Funds pay no compensation directly to those of its trustees who are affiliated with the Adviser or to its officers, all of whom receive remuneration for their services to the Funds from the Adviser or its affiliates. The Board of Trustees has adopted a deferred compensation plan for independent trustees that enables trustees to elect to defer receipt of all or a portion of the annual compensation they are entitled to receive from certain Nuveen advised funds. Under the plan, deferred amounts are treated as though equal dollar amounts had been invested in shares of select Nuveen advised funds.
For the first eight years of Equity Premium Income's (JPZ) operations, the Adviser has agreed to reimburse the Fund, as a percentage of average daily managed assets, for fees and expenses in the amounts and for the time periods set forth below:
| Year Ending October 31, | Year Ending October 31, | ||||||||||||||
| 2004 | * | .30 | % | 2009 | .30 | % | |||||||||
| 2005 | .30 | 2010 | .22 | ||||||||||||
| 2006 | .30 | 2011 | .14 | ||||||||||||
| 2007 | .30 | 2012 | .07 | ||||||||||||
| 2008 | .30 | ||||||||||||||
* From the commencement of operations.
The Adviser has not agreed to reimburse Equity Premium Income (JPZ) for any portion of its fees and expenses beyond October 31, 2012.
Nuveen Investments
63
Notes to
FINANCIAL STATEMENTS (Unaudited) (continued)
For the first eight years of Equity Premium Opportunity's (JSN) operations, the Adviser has agreed to reimburse the Fund, as a percentage of average daily managed assets, for fees and expenses in the amounts and for the time periods set forth below:
| Year Ending January 31, | Year Ending January 31, | ||||||||||||||
| 2005 | * | .30 | % | 2010 | .30 | % | |||||||||
| 2006 | .30 | 2011 | .22 | ||||||||||||
| 2007 | .30 | 2012 | .14 | ||||||||||||
| 2008 | .30 | 2013 | .07 | ||||||||||||
| 2009 | .30 | ||||||||||||||
* From the commencement of operations.
The Adviser has not agreed to reimburse Equity Premium Opportunity (JSN) for any portion of its fees and expenses beyond January 31, 2013.
For the first six years of Equity Premium Advantage's (JLA) operations, the Adviser has agreed to reimburse the Fund, as a percentage of average daily managed assets, for fees and expenses in the amounts and for the time periods set forth below:
| Year Ending May 31, | Year Ending May 31, | ||||||||||||||
| 2005 | * | .20 | % | 2009 | .20 | % | |||||||||
| 2006 | .20 | 2010 | .20 | ||||||||||||
| 2007 | .20 | 2011 | .10 | ||||||||||||
| 2008 | .20 | ||||||||||||||
* From the commencement of operations.
The Adviser has not agreed to reimburse Equity Premium Advantage (JLA) for any portion of its fees and expenses beyond May 31, 2011.
8. New Accounting Pronouncements
Financial Accounting Standards Board ("FASB") Transfers and Servicing (Topic 860): Reconsideration of Effective Control for Repurchase Agreements
On April 15, 2011, the FASB issued Accounting Standards Update ("ASU") No. 2011-03 ("ASU No. 2011-03"). The guidance in ASU No. 2011-03 is intended to improve the accounting for repurchase agreements and other similar agreements. Specifically, ASU No. 2011-03 modifies the criteria for determining when these transactions would be accounted for as financings (secured borrowings/lending agreements) as opposed to sales (purchases) with commitments to repurchase (resell). The effective date of ASU No. 2011-03 is for interim and annual periods beginning on or after December 15, 2011. At this time, management is evaluating the implications of this guidance and the impact it will have to the financial statement amounts or footnote disclosures, if any.
Fair Value Measurements and Disclosures
On May 12, 2011, the FASB issued ASU No. 2011-04 modifying Topic 820, Fair Value Measurements and Disclosures. At the same time, the International Accounting Standards Board ("IASB") issued International Financial Reporting Standard ("IFRS") 13, Fair Value Measurement. The objective of the FASB and IASB is convergence of their guidance on fair value measurements and disclosures. Specifically, ASU No. 2011-04 requires reporting entities to disclose i) the amounts of any transfers between Level 1 and Level 2, and the reasons for the transfers, ii) for Level 3 fair value measurements, a) quantitative information about significant unobservable inputs used, b) a description of the valuation processes used by the reporting entity and c) a narrative description of the sensitivity of the fair value measurement to changes in unobservable inputs if a change in those inputs might result in a significantly higher or lower fair value measurement. The effective date of ASU No. 2011-04 is for interim and annual periods beginning after December 15, 2011. At this time, management is evaluating the implications of this guidance and the impact it will have on the financial statement amounts and footnote disclosures, if any.
Nuveen Investments
64
Annual Investment Management
Agreement Approval Process (Unaudited)
The Board of Trustees (each, a "Board" and each Trustee, a "Board Member") of the Funds, including the Board Members who are not parties to the Funds' advisory or sub-advisory agreements or "interested persons" of any such parties (the "Independent Board Members"), are responsible for approving the advisory agreements (each, an "Investment Management Agreement") between each Fund and Nuveen Fund Advisors, Inc. (the "Advisor") and the sub-advisory agreements (each a "Sub-Advisory Agreement") between the Advisor and Gateway Investment Advisers, LLC (the "Sub-Advisor") (the Investment Management Agreements and the Sub-Advisory Agreements are referred to collectively as the "Advisory Agreements") and their periodic continuation. Pursuant to the Investment Company Act of 1940, as amended (the "1940 Act"), the Board is required to consider the continuation of advisory agreements and sub-advisory agreements on an annual basis. Accordingly, at an in-person meeting held on May 23-25, 2011 (the "May Meeting"), the Board, including a majority of the Independent Board Members, considered and approved the continuation of the Advisory Agreements for the Funds for an additional one-year period.
In preparation for their considerations at the May Meeting, the Board requested and received extensive materials prepared in connection with the review of the Advisory Agreements. The materials provided a broad range of information regarding the Funds, the Advisor and the Sub-Advisor (the Advisor and the Sub-Advisor are collectively, the "Fund Advisers" and each, a "Fund Adviser"). As described in more detail below, the information provided included, among other things, a review of Fund performance, including Fund investment performance assessments against peer groups and appropriate benchmarks, a comparison of Fund fees and expenses relative to peers, a description and assessment of shareholder service levels for the Funds, a summary of the performance of certain service providers, a review of product initiatives and shareholder communications and an analysis of the Advisor's profitability with comparisons to comparable peers in the managed fund business. As part of their annual review, the Board also held a separate meeting on April 19-20, 2011, to review the Funds' investment performance and consider an analysis provided by the Advisor of the Sub-Advisor which generally evaluated the Sub-Advisor's investment team, investment mandate, organizational structure and history, investment philosophy and process, performance of the applicable Fund, and significant changes to the foregoing. As a result of their review of the materials and discussions, the Board presented the Advisor with questions and the Advisor responded.
The materials and information prepared in connection with the annual review of the Advisory Agreements supplement the information provided to the Board during the year. In this regard, throughout the year, the Board, acting directly or through its
Nuveen Investments
65
Annual Investment Management Agreement
Approval Process (Unaudited) (continued)
committees, regularly reviews the performance and various services provided by the Advisor and the Sub-Advisor. The Board meets at least quarterly as well as at other times as the need arises. At its quarterly meetings, the Board reviews reports by the Advisor which include, among other things, Fund performance, a review of the investment teams and compliance reports. The Board also meets with key investment personnel managing the Fund portfolios during the year. In addition, the Board continues its program of seeking to visit each sub-advisor to the Nuveen funds at least once over a multiple year rotation, meeting with key investment and business personnel. The Board also met with State Street Bank & Trust Company, the Funds' accountant and custodian, in 2010. The Board considers factors and information that are relevant to its annual consideration of the renewal of the Advisory Agreements at these meetings held throughout the year. Accordingly, the Board considers the information provided and knowledge gained at these meetings when performing its annual review of the Advisory Agreements. The Independent Board Members are assisted throughout the process by independent legal counsel who provided materials describing applicable law and the duties of directors or trustees in reviewing advisory contracts and met with the Independent Board Members in executive sessions without management present.
The Board considered all factors it believed relevant with respect to each Fund, including among other factors: (a) the nature, extent and quality of the services provided by the Fund Advisers, (b) the investment performance of the Fund and Fund Advisers, (c) the advisory fees and costs of the services to be provided to the Funds and the profitability of the Fund Advisers, (d) the extent of any economies of scale, (e) any benefits derived by the Fund Advisers from the relationship with the Fund and (f) other factors. Each Board Member may have accorded different weight to the various factors in reaching his or her conclusions with respect to a Fund's Advisory Agreements. The Independent Board Members did not identify any single factor as all important or controlling. The Independent Board Members' considerations were instead based on a comprehensive consideration of all the information presented. The principal factors considered by the Board and its conclusions are described below.
A. Nature, Extent and Quality of Services
In considering renewal of the Advisory Agreements, the Independent Board Members considered the nature, extent and quality of the Fund Adviser's services, including advisory services and the resulting Fund performance and administrative services. The Independent Board Members reviewed materials outlining, among other things, the Fund Adviser's organization and business; the types of services that the Fund Adviser or its affiliates provide to the Funds; the performance record of the applicable Fund (as described in further detail below); and any initiatives Nuveen had taken for the applicable fund product line.
In considering advisory services, the Board recognized that the Advisor provides various oversight, administrative, compliance and other services for the Funds and the Sub-Advisor provides the portfolio investment management services to the Funds. Accordingly, in reviewing the portfolio management services provided to each Fund, the Board reviewed the materials provided by the Nuveen Investment Services Oversight Team
Nuveen Investments
66
analyzing, among other things, the Sub-Advisor's investment team and changes thereto, organization and history, assets under management, Fund objectives and mandate, the investment team's philosophy and strategies in managing the Fund, developments affecting the Sub-Advisor or Fund and Fund performance. The Independent Board Members also reviewed portfolio manager compensation arrangements to evaluate each Fund Adviser's ability to attract and retain high quality investment personnel, preserve stability, and reward performance but not provide an incentive to take undue risks. In addition, the Board considered the Advisor's execution of its oversight responsibilities over the Sub-Advisor. Given the importance of compliance, the Independent Board Members also considered Nuveen's compliance program, including the report of the chief compliance officer regarding the Funds' compliance policies and procedures.
In addition to advisory services, the Board considered the quality and extent of administrative and other non-investment advisory services the Advisor and its affiliates provide to the Funds, including product management, investment services (such as oversight of investment policies and procedures, risk management, and pricing), fund administration, oversight of service providers, shareholder services, administration of Board relations, regulatory and portfolio compliance, legal support, managing leverage and promoting an orderly secondary market for common shares.
In reviewing the services provided, the Board also reviewed materials describing various notable initiatives and projects the Advisor performed in connection with the closed-end fund product line. These initiatives included continued activities to refinance auction rate preferred securities; ongoing services to manage leverage that has become increasingly complex; continued secondary market offerings and share repurchases for certain funds; and continued communications efforts with shareholders, fund analysts and financial advisers. With respect to the latter, the Independent Board Members noted Nuveen's continued commitment to supporting the secondary market for the common shares of its closed-end funds through a comprehensive secondary market communication program designed to raise investor and analyst awareness and understanding of closed-end funds. Nuveen's support services included, among other things: continuing communications in support of refinancing efforts related to auction rate preferred securities; participating in conferences; communicating continually with closed-end fund analysts covering the Nuveen funds; providing marketing for the closed-end funds; share purchases; and maintaining and enhancing a closed-end fund website.
Based on their review, the Independent Board Members found that, overall, the nature, extent and quality of services provided to the respective Funds under each applicable Advisory Agreement were satisfactory.
B. The Investment Performance of the Funds and Fund Advisers
The Board, including the Independent Board Members, reviewed and considered the performance history of each Fund over various time periods. The Board reviewed, among other things, each Fund's historic investment performance as well as information comparing the Fund's performance information with that of other funds (the "Performance Peer Group") based on data provided by an independent provider of mutual fund data and with recognized and/or customized benchmarks.
Nuveen Investments
67
Annual Investment Management Agreement
Approval Process (Unaudited) (continued)
The Board reviewed reports, including a comprehensive analysis of the Funds' performance and the applicable investment team. In this regard, the Board reviewed each Fund's total return information compared to the returns of its Performance Peer Group and recognized and/or customized benchmarks for the quarter, one-, three- and five-year periods ending December 31, 2010 and for the same periods ending March 31, 2011.
The Independent Board Members also reviewed historic premium and discount levels, including a summary of actions taken to address or discuss other developments affecting the secondary market discounts of various funds. This information supplemented the Fund performance information provided to the Board at each of its quarterly meetings.
In reviewing performance comparison information, the Independent Board Members recognized that the usefulness of the comparisons of the performance of certain funds with the performance of their respective Performance Peer Group may be limited because the Performance Peer Group may not adequately represent the objectives and strategies of the applicable funds or may be limited in size or number. The Independent Board Members also noted that the investment experience of a particular shareholder in the Nuveen funds will vary depending on when such shareholder invests in the applicable fund, the class held (if multiple classes are offered) and the performance of the fund (or respective class) during that shareholder's investment period. With respect to any Nuveen funds that underperformed their peers and/or benchmarks from time to time, the Board monitors such funds closely and considers any steps necessary or appropriate to address such issues.
In considering the results of the comparisons, the Independent Board Members observed, among other things, that each Fund had demonstrated generally satisfactory performance compared to its peers, falling within the second or third quartile over various periods.
Based on their review, the Independent Board Members determined that each Fund's investment performance had been satisfactory.
C. Fees, Expenses and Profitability
1. Fees and Expenses
The Board evaluated the management fees and expenses of each Fund reviewing, among other things, such Fund's gross management fees, net management fees and net expense ratios in absolute terms as well as compared to the fee and expenses of a comparable universe of funds based on data provided by an independent fund data provider (the "Peer Universe") and in certain cases, to a more focused subset of funds in the Peer Universe (the "Peer Group") and any expense limitations.
The Independent Board Members further reviewed the methodology regarding the construction of the applicable Peer Universe and Peer Group (if any). In reviewing the comparisons of fee and expense information, the Independent Board Members took into account that in certain instances various factors such as: the asset level of a fund relative to peers; the limited size and particular composition of the Peer Universe or Peer Group; the investment objectives of the peers; expense anomalies;
Nuveen Investments
68
changes in the funds comprising the Peer Universe or Peer Group from year to year; levels of reimbursement; the timing of information used; and the differences in the type and use of leverage may impact the comparative data thereby limiting the ability to make a meaningful comparison with peers.
In reviewing the fee schedule for a Fund, the Independent Board Members also considered the fund-level and complex-wide breakpoint schedules (described in further detail below) and any fee waivers and reimbursements provided by Nuveen (applicable, in particular, for certain closed-end funds launched since 1999). In reviewing fees and expenses, the Board considered the expenses and fees to be higher if they were over 10 basis points higher, slightly higher if they were 6 to 10 basis points higher, in line if they were within 5 basis points higher than the peer average and below if they were below the peer average of the Peer Group (if available) or Peer Universe if there was no separate Peer Group. The Independent Board Members observed that the Funds had net management fees and net expense ratios below or in line with their peer averages.
Based on their review of the fee and expense information provided, the Independent Board Members determined that each Fund's management fees were reasonable in light of the nature, extent and quality of services provided to the Fund.
2. Comparisons with the Fees of Other Clients
The Independent Board Members further reviewed information regarding the nature of services and fee rates offered by the Advisor to other clients, including separately managed accounts (both retail and institutional accounts), foreign investment funds offered by Nuveen, and funds that are not offered by Nuveen but are sub-advised by one of Nuveen's investment management teams. In evaluating the comparisons of fees, the Independent Board Members noted that the fee rates charged to the Funds and other clients vary, among other things, because of the different services involved and the additional regulatory and compliance requirements associated with registered investment companies, such as the Funds. Accordingly, the Independent Board Members considered the differences in the product types, including, but not limited to, the services provided, the structure and operations, product distribution and costs thereof, portfolio investment policies, investor profiles, account sizes and regulatory requirements. The Independent Board Members noted, in particular, that the range of services provided to the Funds (as discussed above) is much more extensive than that provided to separately managed accounts. Given the inherent differences in the products, particularly the extensive services provided to the Funds, the Independent Board Members believe such facts justify the different levels of fees.
In considering the fees of the Sub-Advisor, the Independent Board Members also considered the pricing schedule or fees that the Sub-Advisor charges for similar investment management services for other fund sponsors or clients (such as retail and/or institutional managed accounts) as applicable. The Independent Board Members noted that such fees were the result of arm's-length negotiations.
Nuveen Investments
69
Annual Investment Management Agreement
Approval Process (Unaudited) (continued)
3. Profitability of Fund Advisers
In conjunction with its review of fees, the Independent Board Members also considered the profitability of Nuveen for its advisory activities (which incorporated Nuveen's wholly-owned affiliated sub-advisers) and its financial condition. The Independent Board Members reviewed the revenues and expenses of Nuveen's advisory activities for the last two years, the allocation methodology used in preparing the profitability data and an analysis of the key drivers behind the changes in revenues and expenses that impacted profitability in 2010. The Independent Board Members noted this information supplemented the profitability information requested and received during the year to help keep them apprised of developments affecting profitability (such as changes in fee waivers and expense reimbursement commitments). In this regard, the Independent Board Members noted that they have an Independent Board Member serve as a point person to review and keep them apprised of changes to the profitability analysis and/or methodologies during the year. The Independent Board Members also considered Nuveen's revenues for advisory activities, expenses, and profit margin compared to that of various unaffiliated management firms with similar amounts of assets under management and relatively comparable asset composition prepared by Nuveen.
In reviewing profitability, the Independent Board Members recognized the subjective nature of determining profitability which may be affected by numerous factors including the allocation of expenses. Further, the Independent Board Members recognized the difficulties in making comparisons as the profitability of other advisers generally is not publicly available and the profitability information that is available for certain advisers or management firms may not be representative of the industry and may be affected by, among other things, the adviser's particular business mix, capital costs, types of funds managed and expense allocations. Notwithstanding the foregoing, the Independent Board Members reviewed Nuveen's methodology and assumptions for allocating expenses across product lines to determine profitability. In reviewing profitability, the Independent Board Members recognized Nuveen's investment in its fund business. Based on their review, the Independent Board Members concluded that the Advisor's level of profitability for its advisory activities was reasonable in light of the services provided.
The Independent Board Members also considered the Sub-Advisor's revenues, expenses and profitability margins (pre- and post-tax). Based on their review, the Independent Board Members were satisfied that the Sub-Advisor's level of profitability was reasonable in light of the services provided.
In evaluating the reasonableness of the compensation, the Independent Board Members also considered other amounts paid to a Fund Adviser by the Funds as well as any indirect benefits (such as soft dollar arrangements, if any) the Fund Adviser and its affiliates receive, or are expected to receive, that are directly attributable to the management of the Funds, if any. See Section E below for additional information on indirect benefits a Fund Adviser may receive as a result of its relationship with the Funds. Based on their review of the overall fee arrangements of each
Nuveen Investments
70
Fund, the Independent Board Members determined that the advisory fees and expenses of the respective Fund were reasonable.
D. Economies of Scale and Whether Fee Levels Reflect These Economies of Scale
With respect to economies of scale, the Independent Board Members have recognized the potential benefits resulting from the costs of a fund being spread over a larger asset base, although economies of scale are difficult to measure and predict with precision, particularly on a fund-by-fund basis. One method to help ensure the shareholders share in these benefits is to include breakpoints in the advisory fee schedule. Generally, management fees for funds in the Nuveen complex are comprised of a fund-level component and a complex-level component, subject to certain exceptions. Accordingly, the Independent Board Members reviewed and considered the applicable fund-level breakpoints in the advisory fee schedules that reduce advisory fees as asset levels increase. Further, the Independent Board Members noted that although closed-end funds may from time-to-time make additional share offerings, the growth of their assets will occur primarily through the appreciation of such funds' investment portfolio.
In addition to fund-level advisory fee breakpoints, the Board also considered the Funds' complex-wide fee arrangement. Pursuant to the complex-wide fee arrangement, the fees of the funds in the Nuveen complex are generally reduced as the assets in the fund complex reach certain levels. The complex-wide fee arrangement seeks to provide the benefits of economies of scale to fund shareholders when total fund complex assets increase, even if assets of a particular fund are unchanged or have decreased. The approach reflects the notion that some of Nuveen's costs are attributable to services provided to all its funds in the complex and therefore all funds benefit if these costs are spread over a larger asset base.
Based on their review, the Independent Board Members concluded that the breakpoint schedules and complex-wide fee arrangement were acceptable and reflect economies of scale to be shared with shareholders when assets under management increase.
E. Indirect Benefits
In evaluating fees, the Independent Board Members received and considered information regarding potential "fall out" or ancillary benefits the respective Fund Adviser or its affiliates may receive as a result of its relationship with each Fund. In this regard, the Independent Board Members considered any revenues received by affiliates of the Advisor for serving as agent at Nuveen's trading desk and as co-manager in initial public offerings of new closed-end funds.
In addition to the above, the Independent Board Members considered whether the Fund Advisers received any benefits from soft dollar arrangements whereby a portion of the commissions paid by a Fund for brokerage may be used to acquire research that may be useful to the Fund Adviser in managing the assets of the Funds and other clients. With respect to the Advisor, the Independent Board Members recognized that the Advisor has the authority to pay a higher commission in return for brokerage and research services if
Nuveen Investments
71
Annual Investment Management Agreement
Approval Process (Unaudited) (continued)
it determines in good faith that the commission paid is reasonable in relation to the value of the brokerage and research services provided. The Independent Board Members noted that the Advisor's profitability may be somewhat lower if it did not receive the research services pursuant to the soft dollar arrangements and had to acquire such services directly.
With respect to the Sub-Advisor, the Board considered that while the Sub-Advisor may select brokers that provide it with research services, it is the Sub-Advisor's current practice not to receive soft dollar credits in connection with trades executed for the Funds.
Based on their review, the Independent Board Members concluded that any indirect benefits received by a Fund Adviser as a result of its relationship with the Funds were reasonable and within acceptable parameters.
F. Other Considerations
The Independent Board Members did not identify any single factor discussed previously as all-important or controlling. The Board Members, including the Independent Board Members, unanimously concluded that the terms of each Advisory Agreement are fair and reasonable, that the respective Fund Adviser's fees are reasonable in light of the services provided to each Fund and that the Advisory Agreements be renewed.
Nuveen Investments
72
Reinvest Automatically
Easily and Conveniently
Nuveen makes reinvesting easy. A phone call is all it takes to set up your reinvestment account.
Nuveen Closed-End Funds Automatic Reinvestment Plan
Your Nuveen Closed-End Fund allows you to conveniently reinvest distributions in additional Fund shares.
By choosing to reinvest, you'll be able to invest money regularly and automatically, and watch your investment grow through the power of compounding. Just like distributions in cash, there may be times when income or capital gains taxes may be payable on distributions that are reinvested.
It is important to note that an automatic reinvestment plan does not ensure a profit, nor does it protect you against loss in a declining market.
Easy and convenient
To make recordkeeping easy and convenient, each quarter you'll receive a statement showing your total distributions, the date of investment, the shares acquired and the price per share, and the total number of shares you own.
How shares are purchased
The shares you acquire by reinvesting will either be purchased on the open market or newly issued by the Fund. If the shares are trading at or above net asset value at the time of valuation, the Fund will issue new shares at the greater of the net asset value or 95% of the then-current market price. If the shares are trading at less than net asset value, shares for your account will be purchased on the open market. If the Plan Agent begins purchasing Fund shares on the open market while shares are trading below net asset value, but the Fund's shares subsequently trade at or above their net asset value before the Plan Agent is able to complete its purchases, the Plan Agent may cease open-market purchases and may invest the uninvested portion of the distribution in newly-issued Fund shares at a price equal to the greater of the shares' net asset value or 95% of the shares' market value on the last business day immediately prior to the purchase date. Distributions received to purchase shares in the open market will normally be invested shortly after the distribution payment date. No interest will be paid on distributions awaiting reinvestment. Because the market price of the shares may increase before purchases are completed, the average purchase price per share may exceed the market price at the time of valuation, resulting in the acquisition of fewer shares than if the distribution had been paid in shares issued by the Fund. A pro rata portion of any applicable brokerage commissions on open market purchases will be paid
Nuveen Investments
73
Reinvest Automatically
Easily and Conveniently (continued)
by Plan participants. These commissions usually will be lower than those charged on individual transactions.
Flexible
You may change your distribution option or withdraw from the Plan at any time, should your needs or situation change.
You can reinvest whether your shares are registered in your name, or in the name of a brokerage firm, bank, or other nominee. Ask your financial advisor if his or her firm will participate on your behalf. Participants whose shares are registered in the name of one firm may not be able to transfer the shares to another firm and continue to participate in the Plan.
The Fund reserves the right to amend or terminate the Plan at any time. Although the Fund reserves the right to amend the Plan to include a service charge payable by the participants, there is no direct service charge to participants in the Plan at this time.
Call today to start reinvesting distributions
For more information on the Nuveen Automatic Reinvestment Plan or to enroll in or withdraw from the Plan, speak with your financial advisor or call us at (800) 257-8787.
Nuveen Investments
74
Glossary of Terms
Used in this Report
• Average Annual Total Return: This is a commonly used method to express an investment's performance over a particular, usually multi-year time period. It expresses the return that would have been necessary each year to equal the investment's actual cumulative performance (including change in NAV or market price and reinvested dividends and capital gains distributions, if any) over the time period being considered.
• Current Distribution Rate: Current distribution rate is based on the Fund's current annualized quarterly distribution divided by the Fund's current market price. The Fund's quarterly distributions to its shareholders may be comprised of ordinary income, net realized capital gains and, if at the end of the calendar year the Fund's cumulative net ordinary income and net realized gains are less than the amount of the Fund's distributions, a tax return of capital.
• Net Asset Value (NAV): A Fund's NAV per share is calculated by subtracting the liabilities of the Fund from its total assets and then dividing the remainder by the number of shares outstanding. Fund NAVs are calculated at the end of each business day.
Nuveen Investments
75
Notes
Nuveen Investments
76
Notes
Nuveen Investments
77
Other Useful Information
Board of Trustees
John P. Amboian
Robert P. Bremner
Jack B. Evans
William C. Hunter
David J. Kundert
William J. Schneider
Judith M. Stockdale
Carole E. Stone
Virginia L. Stringer
Terence J. Toth
Fund Manager
Nuveen Fund Advisers, Inc.
333 West Wacker Drive
Chicago, IL 60606
Custodian
State Street Bank & Trust Company
Boston, MA
Transfer Agent and
Shareholder Services
State Street Bank & Trust Company
Nuveen Funds
P.O. Box 43071
Providence, RI 02940-3071
(800) 257-8787
Legal Counsel
Chapman and Cutler LLP
Chicago, IL
Independent Registered
Public Accounting Firm
PricewaterhouseCoopers LLP
Chicago, IL
Quarterly Portfolio of Investments and Proxy Voting Information
You may obtain (i) each Fund's quarterly portfolio of investments, (ii) information regarding how the Funds voted proxies relating to portfolio securities held during the most recent twelve-month period ended June 30, and (iii) a description of the policies and procedures that the Funds used to determine how to vote proxies relating to portfolio securities without charge, upon request, by calling Nuveen Investments toll-free at (800) 257-8787 or on Nuveen's website at www.nuveen.com.
You may also obtain this and other Fund information directly from the Securities and Exchange Commission (SEC). The SEC may charge a copying fee for this information. Visit the SEC on-line at http://www.sec.gov or in person at the SEC's Public Reference Room in Washington, D.C. Call the SEC at (202) 942-8090 for room hours and operation. You may also request Fund information by sending an e-mail request to publicinfo@sec.gov or by writing to the SEC's Public Reference Section at 100 F Street NE, Washington, D.C. 20549.
CEO Certification Disclosure
Each Fund's Chief Executive Officer has submitted to the New York Stock Exchange (NYSE) the annual CEO certification as required by Section 303A.12(a) of the NYSE Listed Company Manual.
Each Fund has filed with the SEC the certification of its Chief Executive Officer and Chief Financial Officer required by Section 302 of the Sarbanes-Oxley Act.
Common Share Information
Each Fund intends to repurchase shares of its own common stock in the future at such times and in such amounts as is deemed advisable. During the period covered by this report, the Funds repurchased shares of their common stock as shown in the accompanying table.
| Fund | Shares Repurchased | ||||||
| JPZ | — | ||||||
| JSN | — | ||||||
| JLA | — | ||||||
| JPG | — | ||||||
Any future repurchases will be reported to shareholders in the next annual or semi-annual report.
Nuveen Investments
78


Nuveen Investments makes it easy, with the ultimate online resource.
At nuveen.com/understand, you have access to comprehensive educational tools, video libraries and daily pricing for Nuveen's more than 130* closed-end funds–so you can stay up to date on the latest income-investing news and information.
All the tools and resources you need on closed-end funds are just a click away. www.nuveen.com/understand
* There are risks inherent in any investment, including market risk, interest rate risk, credit risk, and the possible loss of principal. There can be no assurance that fund objectives will be achieved and income is not guaranteed. Closed-end funds frequently trade at a discount to their net asset value. Diversification does not ensure against loss.
* As of 5/31/11
Nuveen Investments:
Serving Investors for Generations
Distributed by
Nuveen Securities, LLC
333 West Wacker Drive
Chicago, IL 60606
www.nuveen.com
Since 1898, financial advisors and their clients have relied on Nuveen Investments to provide dependable investment solutions through continued adherence to proven, long-term investing principles. Today, we offer a range of high quality equity and fixed-income solutions designed to be integral components of a well-diversified core portfolio.
Focused on meeting investor needs.
Nuveen Investments is a global investment management firm that seeks to help secure the long-term goals of institutions and high net worth investors as well as the consultants and financial advisors who serve them. We market our growing range of specialized investment solutions under the high-quality brands of HydePark, NWQ, Nuveen Asset Management, Santa Barbara, Symphony, Tradewinds and Winslow Capital. In total, Nuveen Investments managed approximately $210 billion of assets as of June 30, 2011.
Find out how we can help you.
To learn more about how the products and services of Nuveen Investments may be able to help you meet your financial goals, talk to your financial advisor, or call us at (800) 257-8787. Please read the information provided carefully before you invest. Investors should consider the investment objective and policies, risk considerations, charges and expenses of any investment carefully. Where applicable, be sure to obtain a prospectus, which contains this and other relevant information. To obtain a prospectus, please contact your securities representative or Nuveen Investments, 333 W. Wacker Dr., Chicago, IL 60606. Please read the prospectus carefully before you invest or send money.
Learn more about Nuveen Funds at: www.nuveen.com/cef
ESA-D-0611D
ITEM 2. CODE OF ETHICS.
Not applicable to this filing.
ITEM 3. AUDIT COMMITTEE FINANCIAL EXPERT.
Not applicable to this filing.
ITEM 4. PRINCIPAL ACCOUNTANT FEES AND SERVICES.
Not applicable to this filing.
ITEM 5. AUDIT COMMITTEE OF LISTED REGISTRANTS.
Not applicable to this filing.
ITEM 6. SCHEDULE OF INVESTMENTS.
a) See Portfolio of Investments in Item 1.
b) Not applicable.
ITEM 7. DISCLOSURE OF PROXY VOTING POLICIES AND PROCEDURES FOR CLOSED-END MANAGEMENT INVESTMENT COMPANIES.
Not applicable to this filing.
ITEM 8. PORTFOLIO MANAGERS OF CLOSED-END MANAGEMENT INVESTMENT COMPANIES.
Not applicable to this filing.
ITEM 9. PURCHASES OF EQUITY SECURITIES BY CLOSED-END MANAGEMENT INVESTMENT COMPANY AND AFFILIATED PURCHASERS.
Not applicable.
ITEM 10. SUBMISSION OF MATTERS TO A VOTE OF SECURITY HOLDERS.
There have been no material changes to the procedures by which shareholders may recommend nominees to the registrant’s Board implemented after the registrant last provided disclosure in response to this item.
ITEM 11. CONTROLS AND PROCEDURES.
(a) | The registrant’s principal executive and principal financial officers, or persons performing similar functions, have concluded that the registrant’s disclosure controls and procedures (as defined in Rule 30a-3(c) under the Investment Company Act of 1940, as amended (the “1940 Act”) (17 CFR 270.30a-3(c))) are effective, as of a date within 90 days of the filing date of this report that includes the disclosure required by this paragraph, based on their evaluation of the controls and procedures required by Rule 30a-3(b) under the 1940 Act (17 CFR 270.30a-3(b)) and Rules 13a-15(b) or 15d-15(b) under the Securities Exchange Act of 1934, as amended (the “Exchange Act”)(17 CFR 240.13a-15(b) or 240.15d-15(b)). |
|
|
(b) | There were no changes in the registrant’s internal control over financial reporting (as defined in Rule 30a-3(d) under the 1940 Act (17 CFR 270.30a-3(d)) that occurred during the second fiscal quarter of the period covered by this report that has materially affected, or is reasonably likely to materially affect, the registrant’s internal control over financial reporting. |
ITEM 12. EXHIBITS.
File the exhibits listed below as part of this Form.
(a)(1) Any code of ethics, or amendment thereto, that is the subject of the disclosure required by Item 2, to the extent that the registrant intends to satisfy the Item 2 requirements through filing of an exhibit: Not applicable to this filing.
(a)(2) A separate certification for each principal executive officer and principal financial officer of the registrant as required by Rule 30a-2(a) under the 1940 Act (17 CFR 270.30a-2(a)) in the exact form set forth below: Ex-99.CERT attached hereto.
(a)(3) Any written solicitation to purchase securities under Rule 23c-1 under the 1940 Act (17 CFR 270.23c-1) sent or given during the period covered by the report by or on behalf of the registrant to 10 or more persons: Not applicable.
(b) If the report is filed under Section 13(a) or 15(d) of the Exchange Act, provide the certifications required by Rule 30a-2(b) under the 1940 Act (17 CFR 270.30a-2(b)); Rule 13a-14(b) or Rule 15d-14(b) under the Exchange Act (17 CFR 240.13a-14(b) or 240.15d-14(b)), and Section 1350 of Chapter 63 of Title 18 of the United States Code (18 U.S.C. 1350) as an exhibit. A certification furnished pursuant to this paragraph will not be deemed “filed” for purposes of Section 18 of the Exchange Act (15 U.S.C. 78r), or otherwise subject to the liability of that section. Such certification will not be deemed to be incorporated by reference into any filing under the Securities Act of 1933 or the Exchange Act, except to the extent that the registrant specifically incorporates it by reference. Ex-99.906 CERT attached hereto.
SIGNATURES
Pursuant to the requirements of the Securities Exchange Act of 1934 and the Investment Company Act of 1940, the registrant has duly caused this report to be signed on its behalf by the undersigned, thereunto duly authorized.
(Registrant) Nuveen Equity Premium Advantage Fund
By (Signature and Title) | /s/ Kevin J. McCarthy |
|
| Kevin J. McCarthy | |
| Vice President and Secretary | |
Date: September 7, 2011
Pursuant to the requirements of the Securities Exchange Act of 1934 and the Investment Company Act of 1940, this report has been signed below by the following persons on behalf of the registrant and in the capacities and on the dates indicated.
By (Signature and Title) | /s/ Gifford R. Zimmerman |
|
| Gifford R. Zimmerman | |
| Chief Administrative Officer | |
| (principal executive officer) | |
Date: September 7, 2011
By (Signature and Title) | /s/ Stephen D. Foy |
|
| Stephen D. Foy | |
| Vice President and Controller | |
| (principal financial officer) | |
Date: September 7, 2011