EXPLANATORY NOTE
TreeHouse Foods, Inc. (the "Company") is filing this exhibit to reflect changes to the presentation of the Company’s financial information as set forth in the Company's Annual Report on Form 10-K for the year ended December 31, 2019 (the "2019 Form 10-K"), as filed with the Securities and Exchange Commission (the "SEC") on February 13, 2020, in order to give effect to a change in segment reporting.
As previously disclosed in the Quarterly Report on Form 10-Q for the period ended March 31, 2020 (as filed with the SEC on May 7, 2020), effective January 1, 2020, the Company changed how it manages its business, allocates resources, and goes to market, which resulted in modifications to its organizational and segment structure. As a result, the Company reorganized from a three segment structure previously organized by product category (Baked Goods, Beverages, and Meal Solutions) to a two segment structure organized by market dynamics (Meal Preparation and Snacking & Beverages). In connection with this segment reorganization, the Company also recast expenses related to its commercial sales organization from direct selling, general, and administrative expense previously included within the segments to corporate unallocated selling, general, and administrative expense to align with the revised organizational structure. All prior period information has been recast to reflect this change in reportable segments. This exhibit updates the information in the following items as initially filed in order to reflect the change in segment reporting: Part 1. Item 1 Business; Part 1. Item 2 Properties; Part II. Item 6 Selected Financial Data; Part II. Item 7 Management's Discussion and Analysis of Financial Condition and Results of Operations; and Part II. Item 8 Financial Statements and Supplementary Data.
No items in the 2019 Form 10-K other than those identified above are being updated by this filing. Information in the 2019 Form 10-K is generally stated as of December 31, 2019 and this filing does not reflect any subsequent information or events other than the change in segment reporting noted above. Without limiting the foregoing, this filing does not purport to update Management’s Discussion and Analysis of Financial Condition and Results of Operations contained in the 2019 Form 10-K for any information, uncertainties, transactions, risks, events or trends occurring, or known to management, other than the events described above. More current information is contained in the Company’s Quarterly Report on Form 10-Q for the period ended June 30, 2020 (the “Form 10-Q”) and other filings with the SEC. This exhibit should be read in conjunction with the 2019 Form 10-K, the Form 10-Q and any other documents the Company has filed with the SEC subsequent to February 13, 2020 (the “Other Documents”). The Form 10-Q and the Other Documents contain information regarding events, developments and updates to certain expectations of the Company that have occurred since the filing of the 2019 Form 10-K.
TABLE OF CONTENTS
|
| | |
| | Page |
| | | |
| | | |
| Item 1 | | |
| Item 2 | | |
| | | |
| | | |
| Item 6 | | |
| Item 7 | | |
| Item 8 | | |
PART I
References herein to “we”, “us”, “our”, “Company”, and “TreeHouse” refer to TreeHouse Foods, Inc. and its consolidated subsidiaries unless the context specifically states or implies otherwise.
We are a consumer packaged food and beverage manufacturer operating over 40 manufacturing facilities across the United States, Canada, and Italy servicing primarily retail grocery and food away from home customers. We manufacture a variety of shelf stable, refrigerated, fresh, and frozen products. We have a comprehensive offering of packaging formats and flavor profiles, and we also offer organic and preservative-free ingredients in many categories.
The Company was incorporated on January 25, 2005 by Dean Foods Company to accomplish a spin-off of certain specialty businesses to its shareholders, which was completed on June 27, 2005. Since the Company began operating as an independent entity, it has expanded its product offerings through a number of strategic and bolt-on acquisitions. We manufacture and sell the following:
| |
| • | private label products to retailers, such as supermarkets, mass merchandisers, and specialty retailers, for resale under the retailers’ own or controlled labels, |
| |
| • | private label and branded products to the foodservice industry, including foodservice distributors and national restaurant operators, |
| |
| • | branded products under our own proprietary brands, primarily on a regional basis to retailers, |
| |
| • | branded products under co-pack agreements to other major branded companies for their distributions, and |
| |
| • | products to our industrial customer base for repackaging in portion control packages and for use as ingredients by other food manufacturers. |
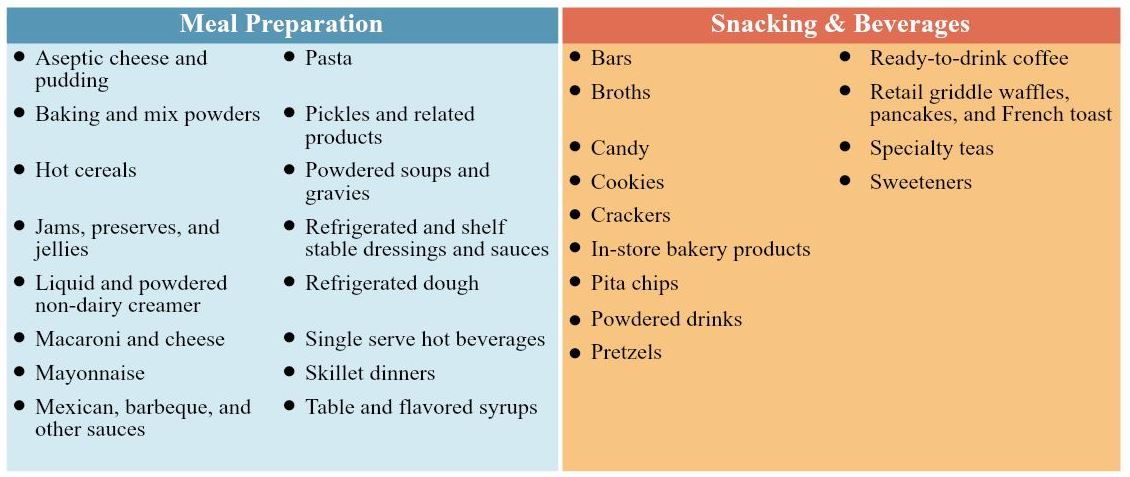
Our reportable segments, and the principal products that comprise each segment, are as follows:
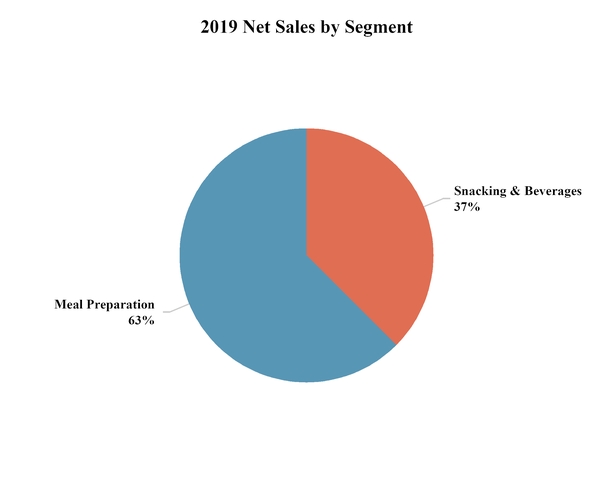
Net sales are distributed across segments in the following manner:
See Item 7 – Management’s Discussion and Analysis of Financial Condition and Results of Operations and Note 22 to the Consolidated Financial Statements for financial information by segment.
We operate our business as Bay Valley Foods, LLC ("Bay Valley"), Sturm Foods, Inc. (includes Cains Foods, Inc. beginning in the fourth quarter of 2019), S.T. Specialty Foods, Inc., Associated Brands, Inc., Protenergy Natural Foods, Inc., TreeHouse Private Brands, Inc., American Italian Pasta Company, Linette Quality Chocolates, Inc., Ralcorp Frozen Bakery Products, Inc., Cottage Bakery, Inc., and The Carriage House Companies, Inc. in the United States, E.D. Smith Foods, Ltd., Associated Brands, Inc., Protenergy Natural Foods Corporation, BFG Canada Ltd., and Western Waffles Corp. in Canada, and Pasta Lensi, S.r.l. in Italy. Bay Valley is a Delaware limited liability company, and a 100% owned subsidiary of TreeHouse. All operating units are directly or indirectly 100% owned subsidiaries of Bay Valley. As of August 1, 2019, Nutcracker Brands, Inc. and Flagstone Foods, Inc. are no longer subsidiaries due to the Snacks division divestiture.
Significant Divestitures and Acquisitions
On August 1, 2019, the Company completed the sale of its Snacks division to Atlas Holdings, LLC. ("Atlas"). Beginning in the third quarter of 2019, the Snacks division (through the date of sale) was excluded from continuing operations and segment results for all periods presented. Refer to Note 8 to our Consolidated Financial Statements for additional information.
Customers and Distribution
We sell our products through various distribution channels, including grocery retailers, foodservice distributors, and industrial and export, which includes food manufacturers and repackagers of foodservice products. We have an internal sales force that manages customer relationships and a broker network for sales to retail, foodservice, and export accounts. Industrial food products are generally sold directly to customers without the use of a broker. Most of our customers purchase products from us either by purchase order or pursuant to contracts that generally are terminable at will.
Products are shipped from our production facilities directly to customers, or from warehouse distribution centers where products are consolidated for shipment to customers if an order includes products manufactured in more than one production facility or product category. We believe this consolidation of products enables us to improve customer service by offering our customers a single order, invoice, and shipment. Some customers also pick up their orders at our production facilities or distribution centers.
We sell our products to a diverse customer base, including the leading grocery retailers and foodservice operators in the United States and Canada. Also, a variety of our customers purchase bulk products for industrial food applications. We currently supply more than 800 total customers in North America, including over 47 of the 75 largest non-convenience food retailers.
A relatively limited number of customers account for a large percentage of our consolidated net sales. For the year ended December 31, 2019, our ten largest customers accounted for approximately 57.6% of our consolidated net sales. For the years ended December 31, 2019, 2018 and 2017, our largest customer, Walmart Inc. and its affiliates, accounted for approximately 24.4%, 23.6%, and 23.1%, respectively, of our consolidated net sales. No other customer accounted for 10% or more of the Company’s consolidated net sales. The Company had revenues from customers outside of the United States of approximately 7.3%, 10.3%, and 10.5% of total consolidated net sales in 2019, 2018, and 2017, respectively, with 5.8%, 8.7%, and 8.8% from Canada in 2019, 2018, and 2017, respectively. Sales are determined based on the customer destination where the products are shipped.
Competition
Our business faces intense competition from large branded manufacturers and highly competitive private label and foodservice manufacturers. In some instances, large branded companies manufacture private label products. The industries in which we compete are expected to remain highly competitive for the foreseeable future. Our customers do not typically commit to buy predetermined amounts of products, and many retailers utilize bidding procedures to select vendors.
We have several competitors in each of our channels. For sales of private label products to retailers, the principal competitive factors are product quality, quality of service, and price. For sales of products to foodservice, industrial, and export customers, the principal competitive factors are price, product quality, specifications, and reliability of service.
Competition to obtain shelf space for our branded products with retailers generally is based on the expected or historical performance of our product sales relative to our competitors. The principal competitive factors for sales of our branded products to consumers are brand recognition and loyalty, product quality, promotion, and price. Some of our branded competitors have significantly greater resources and brand recognition than we do.
Recent trends impacting competition include an increase in snacking and awareness of healthier and “better for you” foods. These trends, together with a surge of specialty retailers who cater to consumers looking for either the highest quality ingredients, unique packaging, products to satisfy particular dietary needs, or value offerings where consumers are looking to maximize their food purchasing power, create pressure on manufacturers to provide a full array of products to meet customer and consumer demand.
We believe our strategies for competing in each of our business segments, which include providing superior product quality, effective cost control, an efficient supply chain, successful innovation programs, and competitive pricing, allow us to compete effectively.
Trademarks
We own a number of registered trademarks. While we consider our trademarks to be valuable assets, we do not consider any trademark to be of such material importance that its absence would cause a material disruption of our business. No trademark is material to any one segment.
Seasonality
In the aggregate, our sales are generally weighted slightly toward the second half of the year, particularly the fourth quarter, with a more pronounced impact on profitability. As our product portfolio has grown, we have shifted to a higher percentage of cold weather products. Products that show a higher level of seasonality include non-dairy powdered creamer, coffee, specialty teas, cappuccinos, hot cereal, saltine and entertainment crackers, in-store bakery items, refrigerated dough products, and certain pasta products, all of which generally have higher sales in the first and fourth quarters. Additionally, sales of broth are generally higher in the fourth quarter. Warmer weather products such as dressings, pickles, and condiments typically have higher sales in the second quarter, while drink mixes generally show higher sales in the second and third quarters.
Raw Materials and Supplies
Our raw materials consist of ingredients and packaging materials. Principal ingredients used in our operations include casein, cheese, cocoa, coconut oil, coffee, corn and corn syrup, cucumbers, eggs, fruit, non-fat dry milk, almonds, oats, palm oil, peppers, rice, soybean oil, sugar, tea, tomatoes, and wheat (including durum wheat). These ingredients are generally purchased under supply contracts. We believe these ingredients generally are available from a number of suppliers. The cost of raw materials used in our products may fluctuate due to weather conditions, regulations, fuel prices, energy costs, labor disputes, transportation delays, political unrest, industry, general U.S. and global economic conditions, or other unforeseen circumstances. The most important packaging materials and supplies used in our operations are cartons, composite cans, corrugated containers, glass, metal cans, metal closures, and plastic. Most packaging materials are purchased under long-term supply contracts. We believe these packaging materials are generally available from a number of suppliers. Volatility in the cost of our raw materials and packaging supplies can adversely affect our performance, as price changes often lag behind changes in costs, and we are not always able to adjust our pricing to reflect changes in raw material and supply costs.
For additional discussion of the risks associated with the raw materials used in our operations, see Part 1, Item 1A – Risk Factors and Item 7 - Known Trends and Uncertainties.
Working Capital
Our short-term financing needs are primarily for financing working capital and are generally highest in the first and third quarters as inventory levels increase relative to other quarters, due to the seasonal nature of our business. As a result of our product portfolio and the related seasonality, our financing needs are generally highest in the first and third quarters, while cash flow is highest in the second and fourth quarters following the seasonality of our sales.
Employees
As of December 31, 2019, our work force consisted of approximately 10,800 full-time employees, with 8,850 in the United States, 1,850 in Canada, and 100 in Italy.
Regulatory Environment and Environmental Compliance
The conduct of our businesses, and the production, distribution, sale, labeling, safety, transportation, and use of our products, are subject to various laws and regulations administered by federal, state, and local governmental agencies in the United States, as well as to foreign laws and regulations administered by government entities and agencies in markets where we operate. It is our policy to abide by the laws and regulations that apply to our businesses.
We are subject to national and local environmental laws in the United States and in foreign countries in which we do business including laws relating to water consumption and treatment, air quality, waste handling and disposal, and other regulations intended to protect public health and the environment. We are committed to meeting all applicable environmental compliance requirements.
The cost of compliance with national and international laws does not have, and is not expected to have, a material financial impact on our capital expenditures, earnings, or competitive position.
Supplemental Disclosure of Information about our Executive Officers
|
| | | | |
| Executive Officer | | Age | | Title |
| Steven Oakland | | 58 | | Chief Executive Officer and President since March 2018. |
| William J. Kelley Jr. | | 55 | | Executive Vice President and Chief Financial Officer since February 2020. |
| Thomas E. O'Neill | | 64 | | Executive Vice President since July 2011. General Counsel, Chief Administrative Officer and Corporate Secretary since January 2005. |
| C. Shay Braun | | 52 | | Senior Vice President, Chief Operations Officer since January 2019. |
| Lori G. Roberts | | 59 | | Senior Vice President, Human Resources since January 2015. Senior Vice President, Chief Human Resources Officer since January 2019. |
| Amit R. Philip | | 42 | | Senior Vice President, Chief Strategy Officer since September 2019. |
| Dean T. General | | 53 | | Senior Vice President, Chief Commercial Officer since February 2019. |
| Maurice "Moe" Alkemade | | 52 | | Senior Vice President, Division President, Beverages since January 2019. |
| Mark A. Fleming | | 49 | | Senior Vice President, Division President, Meal Preparation since February 2020. Division President, Baked Goods since January 2019. |
| Triona C. Schmelter | | 50 | | Senior Vice President, Chief Transformation Officer since February 2020. Division President, Meal Solutions since January 2019. |
| Kevin G. Jackson | | 53 | | Senior Vice President, Division President, Snacking & Beverages since February 2020. |
Available Information
We make available, free of charge, through the “Investors” link then "Financials" then "SEC Filings" on our Internet website at www.treehousefoods.com, our annual report on Form 10-K, quarterly reports on Form 10-Q, current reports on Form 8-K, and amendments to those reports filed or furnished pursuant to Section 13(a) or 15(d) of the Exchange Act, as soon as reasonably practicable after such material is electronically filed with or furnished to the SEC. We use our Internet website, through the “Investors” link, as a channel for routine distribution of important information, including news releases, analyst presentations, and financial information. We are not, however, including the information contained on our website, or information that may be accessed through links to our website, as part of, or incorporating such information by reference into, this Form 10-K. Copies of any materials the Company files with the SEC can be obtained free of charge through the SEC’s website at http://www.sec.gov.
We operate the following production facilities, the majority of which we own, as shown below. We lease our principal executive offices in Oak Brook, Illinois and other office space in Green Bay, Wisconsin; Omaha, Nebraska (1); and Winona, Ontario, Canada. We also maintain a network of owned and leased distribution facilities. We believe our owned and leased facilities are suitable for our operations and provide sufficient capacity to meet our requirements for the foreseeable future. See Note 3 to the Consolidated Financial Statements for information regarding restructuring programs including facility closures. The following chart lists the location and principal products produced (by segment) at our production facilities at December 31, 2019:
|
| | | | | | |
| Meal Preparation: | | | | | | |
Tolleson, Arizona (Dry pasta) | | Atlanta, Georgia
(Dressings, sauces, and dips) | | Forest Park, Georgia (Refrigerated dough) | | Chicago, Illinois
(Refrigerated foodservice pickles) |
Dixon, Illinois
(Aseptic cheese sauces, puddings, and gravies) | | Pecatonica, Illinois
(Non-dairy powdered creamer) | | Cedar Rapids, Iowa
(Hot cereal) | | New Hampton, Iowa
(Non-dairy powdered creamer) |
Fara Gera d'Adda, Bergamo, Italy*
(Dry pasta) | | Verolanuova, Brescia, Italy
(Dry pasta) | | Buckner, Kentucky
(Syrups, mayonnaise, preserves, jams, barbeque, and other sauces) | | Wayland, Michigan
(Non-dairy powdered creamer) |
Excelsior Springs, Missouri
(Dry pasta) | | Medina, New York (3)
(Dry dinners and dry soup) | | Faison, North Carolina
(Pickles, peppers, relish, and sauces) | | Winona, Ontario, Canada
(Jams, pie fillings, and specialty sauces) |
North East, Pennsylvania
(Salad dressings and mayonnaise) | | Columbia, South Carolina
(Dry pasta) | | Carrollton, Texas
(Refrigerated dough) | | San Antonio, Texas
(Mexican sauces) |
Green Bay, Wisconsin
(Pickles, peppers, relish, and sauces) | | Kenosha, Wisconsin
(Macaroni and cheese and skillet dinners) | | Manawa, Wisconsin (3)
(Single serve hot beverages and hot cereals) | | |
| | | | | | | |
| Snacking & Beverages: | | | | | | |
Lodi, California (2) (In-store bakery) | | Delta, British Columbia, Canada*
(Specialty tea) | | Brantford, Ontario, Canada (Frozen griddle) | | Georgetown, Ontario, Canada (Crackers) |
| Kitchener, Ontario, Canada (Crackers) | | Richmond Hill, Ontario, Canada*
(Broths and gravies) | | South Beloit, Illinois
(Cookies) | | Princeton, Kentucky
(Crackers) |
Cambridge, Maryland*
(Broth, gravies, and ready-to-drink coffee) | | Fridley, Minnesota (2)
(In-store bakery) | | Lakeville, Minnesota (Bars) | | Medina, New York (3)
(Beverages and beverage enhancers) |
| Tonawanda, New York (Cookies) | | Hanover, Pennsylvania
(Pretzels) | | Lancaster, Pennsylvania (Pretzels) | | Womelsdorf, Pennsylvania (Candy) |
Ogden, Utah*
(In-store bakery and frozen griddle) | | Manawa, Wisconsin (3)
(Powdered drinks) | | Milwaukee, Wisconsin
(Pita chips)
| | |
| | | | | | | |
| | | | | | | |
| *The Company leases these facilities. |
| |
| (1) | On July 18, 2018, the Company announced the planned closure of this administrative office. Refer to Note 3 to the Consolidated Financial Statements for more information. |
| |
| (2) | On January 10, 2020, the Company entered into a definitive agreement to sell these facilities. Refer to Note 8 to the Consolidated Financial Statements for more information. |
| |
| (3) | Production facility crosses multiple segments; principal products produced for each segment included within the above table. |
As of December 31, 2019, the Company also owns facilities in Sparks, Nevada and Lancaster, Ohio related to its Ready-to-eat Cereal business. These facilities were classified as discontinued operations; therefore, they are excluded from the table above.
PART II
| |
| Item 6. | Selected Financial Data |
The following table provides selected financial data as of and for each of the five years in the period ended December 31, 2019. The selected financial data should be read in conjunction with Item 7, and our Consolidated Financial Statements and related Notes.
On April 1, 2019, the Company changed its method of valuing its Pickle inventory in its Meal Preparation segment from the last-in, first-out (LIFO) method to the first-in, first-out (FIFO) method. After adopting the change, all of the Company's inventory is now valued using the FIFO method. The FIFO method has been applied retrospectively and is reflected in the Consolidated Statements of Operations for the years ended December 31, 2019, 2018, and 2017 and Consolidated Balance Sheets for the years ended December 31, 2019 and 2018. Additional periods in the table below were not recast for the change in inventory method because such information is not available without unreasonable effort or expense. Refer to Note 7 to the Consolidated Financial Statements for additional information regarding the inventory valuation change.
Beginning in the third quarter of 2019, the Company determined that both its Snacks division (through the date of sale) and its Ready-to-eat ("RTE") Cereal business met the discontinued operations criteria in Accounting Standards Codification 205-20-45 and were classified as discontinued operations. The results of these businesses have been reflected as discontinued operations in the Consolidated Statements of Operations and Consolidated Statements of Cash Flows for the years ended December 31, 2019, 2018, and 2017. The assets and liabilities of these businesses have been reflected in assets and liabilities of discontinued operations in the Consolidated Balance Sheets as of December 31, 2019 and 2018. Additional periods in the table below were not recast for discontinued operations because such information is not available without unreasonable effort or expense. Refer to Note 8 to the Consolidated Financial Statements for additional information regarding discontinued operations.
|
| | | | | | | | | | | | | | | | | | | |
| | Year Ended December 31, |
| | 2019 | | 2018 | | 2017 | | 2016 (1) | | 2015 |
| | (in millions, except per share data) |
| Operating data: | | | | | | | | | |
| Net sales | $ | 4,288.9 |
| | $ | 4,587.8 |
| | $ | 4,852.6 |
| | $ | 6,175.1 |
| | $ | 3,206.4 |
|
| Operating (loss) income | (16.1 | ) | | 83.4 |
| | 79.2 |
| | (95.5 | ) | | 241.3 |
|
| Net (loss) income from continuing operations | (110.3 | ) | | (46.2 | ) | | 111.3 |
| | — |
| | — |
|
| Net loss from discontinued operations | (250.7 | ) | | (18.2 | ) | | (390.8 | ) | | — |
| | — |
|
| Net (loss) income | (361.0 | ) | | (64.4 | ) | | (279.5 | ) | | (228.6 | ) | | 114.9 |
|
| Net (loss) earnings per basic share from continuing operations | $ | (1.96 | ) | | $ | (0.83 | ) | | $ | 1.95 |
| | $ | — |
| | $ | — |
|
| Net (loss) earnings per basic share | $ | (6.42 | ) | | $ | (1.15 | ) | | $ | (4.89 | ) | | $ | (4.10 | ) | | $ | 2.67 |
|
| Net (loss) earnings per diluted share from continuing operations | $ | (1.96 | ) | | $ | (0.83 | ) | | $ | 1.93 |
| | $ | — |
| | $ | — |
|
| Net (loss) earnings per diluted share | $ | (6.42 | ) | | $ | (1.15 | ) | | $ | (4.85 | ) | | $ | (4.10 | ) | | $ | 2.63 |
|
| Weighted average shares -- basic | 56.2 |
| | 56.0 |
| | 57.1 |
| | 55.7 |
| | 43.1 |
|
| Weighted average shares -- diluted | 56.2 |
| | 56.0 |
| | 57.6 |
| | 55.7 |
| | 43.7 |
|
| Other data: | | | | | | | | | |
| Balance sheet data (at end of period): | | | | | | | | | |
| Total assets | $ | 5,139.4 |
| | $ | 5,629.3 |
| | $ | 5,779.3 |
| | $ | 6,545.8 |
| | $ | 3,702.8 |
|
| Long-term debt, excluding current portion | 2,091.7 |
| | 2,297.4 |
| | 2,535.7 |
| | 2,724.8 |
| | 1,221.7 |
|
| Other long-term liabilities | 143.4 |
| | 168.2 |
| | 202.1 |
| | 202.3 |
| | 71.6 |
|
| Total stockholders’ equity | 1,830.9 |
| | 2,160.0 |
| | 2,263.3 |
| | 2,503.3 |
| | 1,854.9 |
|
| Cash flow data: | | | | | | | | | |
| Net cash provided by operating activities | $ | 307.7 |
| | $ | 505.8 |
| | $ | 506.0 |
| | $ | 478.6 |
| | $ | 290.6 |
|
| Capital expenditures | 146.8 |
| | 177.4 |
| | 161.6 |
| | 187.0 |
| | 86.1 |
|
| |
| (1) | The Company acquired the Private Brands Business in 2016. |
| |
| Item 7. | Management’s Discussion and Analysis of Financial Condition and Results of Operations |
Executive Overview
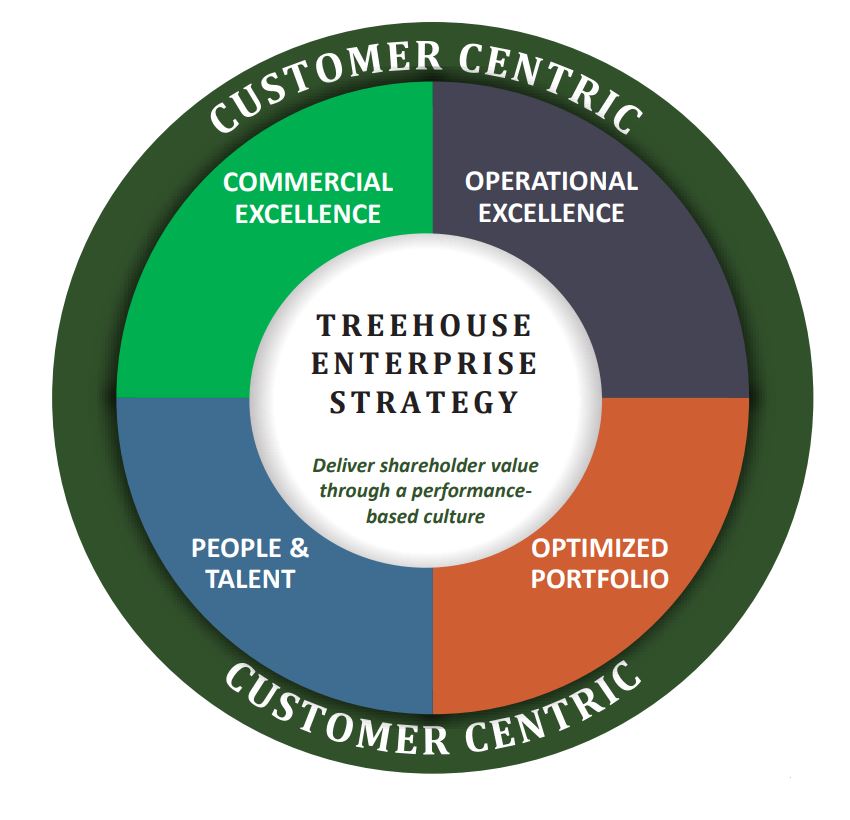
We make high quality food and beverages affordable to all. Our vision is to be the undisputed solutions leader for custom brands. Our mission is to create value as our customers’ preferred manufacturing and distribution partner, providing thought leadership, superior innovation and a relentless focus on execution. To achieve our mission we have developed a four point, customer centric enterprise strategy, as depicted graphically and explained further below:
| |
| • | Commercial Excellence. An unrelenting focus on the customer must be at the heart of everything we do. As private label continues to grow and evolve, our strategy is to be the solutions provider for our customers. To be a solutions provider, we must: understand our customers' needs and challenges; execute flawlessly; ensure products meet quality and safety standards and are competitively priced; and continue to innovate. During 2019, we designed, built, launched, and supported a new Commercial Excellence organization that is focused on the customer, eliminating the multiple touch points that existed with our previous division structure. |
| |
| • | Operational Excellence. We strive to be the supplier of choice and a world-class partner to our customers, a great investment to our shareholders, and a great place to work for our employees. We are working to build a high performance culture, as we communicate and engage our people with common metrics and build a continuous improvement mindset whereby the status quo is challenged. As we engage, educate and enable our employees, we are building a winning mindset rooted in the new TreeHouse mission, vision and purpose. In conjunction with this tenet of our strategy, we continue to progress in our rollout of a standardized management operating system across our manufacturing facilities ("TMOS"). Through December 31, 2019, we completed full implementations of TMOS in 30 plants and launched Lean Manufacturing in 18 locations. As of December 31, 2019, our service levels have improved over 300 basis points over the past two years, which represents our unrelenting focus on operational excellence. |
| |
| • | Optimized Portfolio. We will periodically review our portfolio in an attempt to identify areas of optimization. As part of this review, we may identify specific businesses (typically lower growth and lower margin) which may be better served by a fundamental change in tactics, strategy, or ownership. Optimizing the portfolio will allow us to focus our resources on fewer business in order to drive improved results and future cash generation. During 2019, we have simplified our organization through these portfolio optimization efforts, specifically related to the Snacks division. |
| |
| • | People & Talent. We are working to build a performance-based culture. We will be disciplined in our approach to building this culture, by communicating clear goals and fostering decision ownership. We have established a set of TreeHouse values that have been embraced by the organization and our goal is to align and incentivize our people and celebrate our successes together. |
The following discussion and analysis presents the factors that had a material effect on our financial condition, changes in financial condition, and results of operations for the years ended December 31, 2019, 2018, and 2017. This should be read in conjunction with the Consolidated Financial Statements and the Notes to those Consolidated Financial Statements included elsewhere in this report.
This Management’s Discussion and Analysis of Financial Condition and Results of Operations contains forward-looking statements. See Cautionary Statement Regarding Forward-Looking Information for a discussion of the uncertainties, risks, and assumptions associated with these statements.
Recent Developments
In-Store Bakery Facilities Divestiture
During the fourth quarter of 2019, the Company reached the decision to sell two of its In-Store Bakery facilities located in Fridley, Minnesota and Lodi, California, which manufacture breads, rolls, and cakes for in-store retail bakeries and foodservice customers. These two facilities are included within the Snacking & Beverages reporting segment. The Company determined the associated assets met the held for sale accounting criteria as of December 31, 2019 and were classified accordingly in the Consolidated Balance Sheets. These two facilities did not meet the criteria to be presented as a discontinued operation.
The disposal group was measured at fair value, and the Company recognized the expected disposal loss as an impairment charge of $41.1 million during the year ended December 31, 2019, as the fair value was determined to be less than the carrying value of the associated assets, including the related goodwill. The impairment is recognized within Asset impairment in the Consolidated Statements of Operations.
Discontinued Operations
Beginning in the third quarter of 2019, the Company determined that both its Snacks division and its RTE Cereal business met the discontinued operations criteria in Accounting Standards Codification ("ASC") 205-20-45 and were classified as discontinued operations. As such, both businesses have been excluded from continuing operations and segment results for all periods presented. Refer to Note 8 to our Consolidated Financial Statements for additional information.
Long-Lived Asset Impairments
We evaluate property, plant, and equipment and finite lived intangible assets for impairment when circumstances indicate that their carrying values may not be recoverable. Indicators of impairment include deteriorations in operating cash flows, the anticipated sale or disposal of an asset group, and other significant changes in business conditions.
During 2019, our assessment indicated an impairment in our Cookies and Dry Dinners asset groups driven by the historical and forecasted performance of these businesses. As a result, we recognized a total of $88.0 million of long-lived asset impairment losses. The impairment charges are included in Asset impairment in the Consolidated Statements of Operations. Refer to Note 9 to our Consolidated Financial Statements for additional information.
Impairment charges are measured by comparing the carrying values of the asset groups to their estimated fair values. The fair value of these assets were based on expected future cash flows using Level 3 inputs under ASC 820. We can provide no assurance regarding the prospect of additional impairment charges in future periods.
Change in Inventory Valuation Method
Effective April 1, 2019, the Company changed its method of valuing its Pickle inventory in its Meal Preparation segment from the last-in, first out (LIFO) method to the first-in, first out (FIFO) method. Prior period information included in this Form 10-K has been adjusted to apply the FIFO method retrospectively. Refer to Note 7 to our Consolidated Financial Statements for additional information.
Change in Segments
On January 1, 2019, the Company changed how it manages its business, allocates resources, and goes to market, which resulted in modifications to its organizational and segment structure (the “2019 Segment Change”). As a result, the Company consolidated its Condiments and Meals segments into one segment called Meal Solutions. Additionally, the Bars and Ready-to-eat cereal categories moved from the Company's Snacks and Meals segments, respectively, into the Baked Goods segment.
On January 1, 2020, the Company changed how it manages its business, allocates resources, and goes to market, which resulted in modifications to its organizational and segment structure (the "2020 Segment Change"). As a result, the Company reorganized from a three segment structure previously organized by product category (Baked Goods, Beverages, and Meal Solutions) to a two segment structure organized by market dynamics (Snacking & Beverages and Meal Preparation).
During 2019, all prior period information was originally recast to reflect the 2019 Segment Change. Upon the 2020 Segment Change, all prior period information was recast to reflect this change in reportable segments and as such, the information herein no longer presents the 2019 Segment Change. Refer to Note 22 for additional information.
Results of Operations
The following table presents certain information concerning our financial results, including information presented as a percentage of consolidated net sales:
|
| | | | | | | | | | | | | | | | | | | | |
| | Year Ended December 31, |
| | 2019 | | 2018 | | 2017 |
| | Dollars | | Percent | | Dollars | | Percent | | Dollars | | Percent |
| | (Dollars in millions) |
| Net sales | $ | 4,288.9 |
| | 100.0 | % | | $ | 4,587.8 |
| | 100.0 | % | | $ | 4,852.6 |
| | 100.0 | % |
| Cost of sales | 3,492.1 |
| | 81.4 |
| | 3,695.6 |
| | 80.6 |
| | 3,874.5 |
| | 79.8 |
|
| Gross profit | 796.8 |
| | 18.6 |
| | 892.2 |
| | 19.4 |
| | 978.1 |
| | 20.2 |
|
| Operating expenses: | |
| | |
| | |
| | |
| | |
| | |
|
| Selling and distribution | 256.9 |
| | 6.0 |
| | 328.5 |
| | 7.2 |
| | 345.5 |
| | 7.1 |
|
| General and administrative | 253.2 |
| | 5.9 |
| | 264.4 |
| | 5.7 |
| | 283.7 |
| | 5.8 |
|
| Amortization expense | 74.1 |
| | 1.8 |
| | 80.2 |
| | 1.7 |
| | 85.5 |
| | 1.8 |
|
| Asset impairment | 129.1 |
| | 3.0 |
| | — |
| | — |
| | 59.0 |
| | 1.2 |
|
| Other operating expense, net | 99.6 |
| | 2.3 |
| | 135.7 |
| | 3.0 |
| | 125.2 |
| | 2.6 |
|
| Total operating expenses | 812.9 |
| | 19.0 |
| | 808.8 |
| | 17.6 |
| | 898.9 |
| | 18.5 |
|
| Operating (loss) income | (16.1 | ) | | (0.4 | ) | | 83.4 |
| | 1.8 |
| | 79.2 |
| | 1.7 |
|
| Other expense (income): | |
| | |
| | |
| | |
| | |
| | |
|
| Interest expense | 102.4 |
| | 2.4 |
| | 107.8 |
| | 2.4 |
| | 122.4 |
| | 2.5 |
|
| (Gain) loss on foreign currency exchange | (3.5 | ) | | (0.1 | ) | | 8.6 |
| | 0.2 |
| | (5.0 | ) | | (0.1 | ) |
| Other expense (income), net | 40.8 |
| | 1.0 |
| | 24.6 |
| | 0.5 |
| | (9.7 | ) | | (0.2 | ) |
| Total other expense | 139.7 |
| | 3.3 |
| | 141.0 |
| | 3.1 |
| | 107.7 |
| | 2.2 |
|
| Loss before income taxes | (155.8 | ) | | (3.7 | ) | | (57.6 | ) | | (1.3 | ) | | (28.5 | ) | | (0.5 | ) |
| Income tax benefit | (45.5 | ) | | (1.1 | ) | | (11.4 | ) | | (0.3 | ) | | (139.8 | ) | | (2.9 | ) |
| Net (loss) income from continuing operations | (110.3 | ) | | (2.6 | ) | | (46.2 | ) | | (1.0 | ) | | 111.3 |
| | 2.4 |
|
| Net loss from discontinued operations | (250.7 | ) | | (5.8 | ) | | (18.2 | ) | | (0.4 | ) | | (390.8 | ) | | (8.1 | ) |
| Net loss | $ | (361.0 | ) | | (8.4 | )% | | $ | (64.4 | ) | | (1.4 | )% | | $ | (279.5 | ) | | (5.7 | )% |
Year Ended December 31, 2019 Compared to Year Ended December 31, 2018
Continuing Operations
Net Sales – Consolidated net sales decreased 6.5% to $4,288.9 million for the year ended December 31, 2019, compared to $4,587.8 million for the year ended December 31, 2018. The change in net sales from 2018 to 2019 was due to the following:
|
| | | | | | | | | | |
| | | Dollars | | Percent | | Percentage Change in Pounds |
| | | (In millions) | | | | |
| 2018 Net sales | | $ | 4,587.8 |
| | | | |
| Volume/mix excluding SKU rationalization | | (256.5 | ) | | (5.6 | )% | | (7.2 | )% |
| Pricing | | 27.5 |
| | 0.6 |
| | — |
|
| 2019 Organic Net Sales | | $ | 4,358.8 |
| | (5.0 | )% | | (7.2 | )% |
| SKU rationalization | | (60.2 | ) | | (1.3 | ) | | (1.3 | ) |
| Divestiture | | (4.5 | ) | | (0.1 | ) | | (0.1 | ) |
| Foreign currency | | (5.2 | ) | | (0.1 | ) | | — |
|
| 2019 Net sales | | $ | 4,288.9 |
| | (6.5 | )% | | (8.6 | )% |
Organic net sales decreased 5.0% for the year ended December 31, 2019 driven by:
| |
| • | Volume/mix was unfavorable 5.6% year-over-year across both segments primarily due to distribution lost as a result of pricing actions taken in 2018. Shipped volume in pounds excluding the impact of SKU rationalization and the divestiture of the McCann's business declined 7.2%. |
| |
| • | Pricing was favorable 0.6% during 2019 compared to 2018 driven by pricing actions executed in 2019 to cover commodity, freight, and packaging inflation, partially offset by competitive pressure in Single Serve Beverages. |
Our efforts to simplify and rationalize low margin SKUs from our product portfolio contributed 1.3% to the overall year-over-year decline in net sales, primarily within our Snacking & Beverages segment. The divestiture of the McCann's business in July 2018 and unfavorable foreign currency exchange each contributed 0.1% to the year-over-year decline in net sales.
Gross Profit — Gross profit as a percentage of net sales was 18.6% for the year ended December 31, 2019 compared to 19.4% for the year ended December 31, 2018, a decrease of 0.8 percentage points. The decrease is primarily due to lower volumes and the related cost impacts, $11.4 million of expenses related to regulatory compliance with upcoming nutrition label requirements and $4.3 million related to the multiemployer pension plan withdrawal recognized in 2019. This is partially offset by lower expenses associated with our restructuring programs of $4.4 million in 2019 compared to $13.3 million in 2018.
Total Operating Expenses — Total operating expenses as a percentage of net sales was 19.0% for the year ended December 31, 2019 compared to 17.6% for the year ended December 31, 2018, an increase of 1.4 percentage points. The increase is primarily due to non-cash impairment charges of $129.1 million related to the Cookies and Dry Dinners asset groups, within the Snacking & Beverages and Meal Preparation segments, respectively, and two In-Store Bakery facilities in 2019, and $13.4 million of acquisition, integration, divestiture and related gains mostly related to the divestiture of the McCann's business in 2018 compared to $0.6 million expense in 2019. This is partially offset by lower restructuring expenses of $99.3 million in 2019, compared to $149.1 million in 2018, lower freight costs due to increased market capacity and reduced spot market usage, and lower variable incentive compensation.
Total Other Expense — Total other expense decreased by $1.3 million to $139.7 million in 2019 compared to $141.0 million in 2018. The decrease was primarily due to favorable fluctuations in the currency exchange rates between the U.S. and Canadian dollar during the respective periods and lower interest expense. The lower interest expense reflects lower net debt compared to the prior year, partially offset by the year-over-year increase in the LIBOR interest rate. This decrease in total other expense is partially offset by unrealized losses of $47.0 million related to mark-to-market derivative contracts in 2019, compared to unrealized losses of $22.5 million in 2018.
Income Taxes - Income tax benefit was recorded at an effective rate of 29.2% in 2019 compared to 19.8% in 2018. The change in the Company’s effective tax rate year-over-year is primarily due to a one-time tax benefit in 2019 associated with the repatriation of the U.S. customer based intangibles formerly held by our Canadian subsidiaries, a change in the valuation
allowance recorded against certain deferred tax assets, and a change in the amount of executive compensation that is non-deductible for tax purposes.
Our effective tax rate may change from period to period based on recurring and non-recurring factors including the jurisdictional mix of earnings, enacted tax legislation, state income taxes, settlement of tax audits, and the expiration of the statute of limitations in relation to unrecognized tax benefits.
Discontinued Operations
Net loss from discontinued operations increased $232.5 million in the year ended December 31, 2019 compared to 2018. The increase is primarily the result of the non-cash pre-tax loss on the divestiture of the Snacks division of $98.4 million and expected disposal loss on the RTE Cereal business recognized as an impairment charge of $74.5 million during the twelve months ended December 31, 2019.
Year Ended December 31, 2019 Compared to Year Ended December 31, 2018 — Results by Segment
|
| | | | | | | | | | | | | |
| | Year Ended December 31, 2019 |
| | Meal Preparation | | Snacking & Beverages |
| | Dollars | | Percent | | Dollars | | Percent |
| | |
| Net sales | $ | 2,680.7 |
| | 100.0 | % | | $ | 1,608.2 |
| | 100.0 | % |
| Cost of sales | 2,162.4 |
| | 80.7 |
| | 1,313.2 |
| | 81.7 |
|
| Gross profit | 518.3 |
| | 19.3 |
| | 295.0 |
| | 18.3 |
|
| Freight out and commissions | 102.6 |
| | 3.8 |
| | 79.5 |
| | 4.9 |
|
| Direct selling, general, and administrative | 34.4 |
| | 1.3 |
| | 22.7 |
| | 1.4 |
|
| Direct operating income | $ | 381.3 |
| | 14.2 | % | | $ | 192.8 |
| | 12.0 | % |
|
| | | | | | | | | | | | | |
| | Year Ended December 31, 2018 |
| | Meal Preparation | | Snacking & Beverages |
| | Dollars | | Percent | | Dollars | | Percent |
| | |
| Net sales | $ | 2,871.6 |
| | 100.0 | % | | $ | 1,716.2 |
| | 100.0 | % |
| Cost of sales | 2,287.6 |
| | 79.7 |
| | 1,396.9 |
| | 81.4 |
|
| Gross profit | 584.0 |
| | 20.3 |
| | 319.3 |
| | 18.6 |
|
| Freight out and commissions | 127.0 |
| | 4.4 |
| | 113.3 |
| | 6.6 |
|
| Direct selling, general, and administrative | 38.1 |
| | 1.3 |
| | 25.8 |
| | 1.5 |
|
| Direct operating income | $ | 418.9 |
| | 14.6 | % | | $ | 180.2 |
| | 10.5 | % |
The change in net sales from the year ended December 31, 2018 to year ended December 31, 2019 was due to the following:
|
| | | | | | | | | | | | | | |
| | Year Ended December 31, |
| | Meal Preparation | | Snacking & Beverages |
| | Dollars | | Percent | | Dollars | | Percent |
| | |
| 2018 Net Sales | $ | 2,871.6 |
| | | | $ | 1,716.2 |
| | |
| SKU rationalization | (15.3 | ) | | (0.5 | )% | | (44.9 | ) | | (2.6 | )% |
| Volume/mix excluding SKU rationalization | (174.6 | ) | | (6.1 | ) | | (81.9 | ) | | (4.8 | ) |
| Pricing | 7.3 |
| | 0.3 |
| | 20.2 |
| | 1.2 |
|
| Divestiture | (4.5 | ) | | (0.2 | ) | | — |
| — |
| — |
|
| Foreign currency | (3.8 | ) | | (0.1 | ) | | (1.4 | ) | | (0.1 | ) |
| 2019 Net sales | $ | 2,680.7 |
| | (6.6 | )% | | $ | 1,608.2 |
| | (6.3 | )% |
Meal Preparation
Net sales in the Meal Preparation segment decreased $190.9 million or 6.6% in the year ended December 31, 2019 compared to the year ended December 31, 2018 due to unfavorable volume/mix primarily from lost distribution mostly in Pasta, Pickles, Powdered Creamers, and Single Serve Beverages, the continued impact of lower pricing on Single Serve Beverages due to competitive pressure, ongoing efforts to simplify and rationalize low margin SKUs, the divestiture of the McCann's business, and unfavorable foreign currency. These declines were partially offset by pricing actions taken to recover commodity, freight, and packaging inflation.
Direct operating income as a percentage of net sales decreased 0.4 percentage points in the year ended December 31, 2019 compared to the year ended December 31, 2018. The decrease is primarily due to lost distribution, the continued impact of lower pricing on Single Serve Beverages due to competitive pressure, and higher operating costs. These declines were partially offset by pricing actions taken in response to commodity, freight, and packaging inflation and lower freight costs due to increased market capacity and reduced spot market usage.
Snacking & Beverages
Net sales in the Snacking & Beverages segment decreased $108.0 million or 6.3% in the year ended December 31, 2019 compared to year ended December 31, 2018 due to unfavorable volume/mix primarily from lost distribution mostly in Broth, In-Store Bakery, Crackers and Bars, ongoing efforts to simplify and rationalize low margin SKUs, and unfavorable foreign currency. These declines were partially offset by pricing actions taken to recover commodity, freight, and packaging inflation.
Direct operating income as a percentage of net sales increased 1.5 percentage points in the year ended December 31, 2019 compared to the year ended December 31, 2018. The increase is primarily due to lower freight costs as a result of increased market capacity and reduced spot market usage, cost savings due to TreeHouse 2020 and Structure to Win initiatives, pricing actions taken to recover commodity, freight, and packaging inflation, and favorable mix due to the rationalization of low margin business. This was partially offset by lower volume.
Year Ended December 31, 2018 Compared to Year Ended December 31, 2017
Continuing Operations
Net Sales – Consolidated net sales decreased 5.5% to $4,587.8 million for the year ended December 31, 2018, compared to $4,852.6 million for the year ended December 31, 2017. The change in net sales from 2017 to 2018 was due to the following:
|
| | | | | | | | | | |
| | | Dollars | | Percent | | Percentage Change in Pounds |
| | | (In millions) | | | | |
| 2017 Net sales | | $ | 4,852.6 |
| | | | |
| Volume/mix excluding SKU rationalization | | (119.0 | ) | | (2.5 | )% | | (5.4 | )% |
| Pricing | | 71.2 |
| | 1.5 |
| | — |
|
| Product recalls | | (2.3 | ) | | — |
| | — |
|
| 2018 Organic Net Sales | | $ | 4,802.5 |
| | (1.0 | )% | | (5.4 | )% |
| SKU rationalization | | (149.2 | ) | | (3.1 | ) | | (2.8 | ) |
| Divestitures | | (65.9 | ) | | (1.4 | ) | | — |
|
| Foreign currency | | 0.4 |
| | — |
| | — |
|
| 2018 Net sales | | $ | 4,587.8 |
| | (5.5 | )% | | (8.2 | )% |
Organic net sales decreased 1.0% for the year ended December 31, 2018 driven by:
| |
| • | Volume/mix was unfavorable 2.5% year-over-year due to declines in the Meal Preparation segment. Shipped volume in pounds excluding the impact of SKU rationalization declined 5.4%. |
| |
| • | Pricing was favorable 1.5% during 2018 compared to 2017 driven by pricing actions to cover commodity, freight, and packaging inflation. |
Our efforts to simplify and rationalize low margin SKUs from our product portfolio contributed 3.1% to the overall year-over-year decline in net sales, across both segments. The divestiture of the McCann's business in July 2018 and the soup and infant feeding business ("SIF") in May 2017 contributed 1.4% to the year-over-year decline in net sales.
Gross Profit — Gross profit as a percentage of net sales was 19.4% for the year ended December 31, 2018 compared to 20.2% for the year ended December 31, 2017, a decrease of 0.8 percentage points. The decrease is primarily due to lower volumes across both segments and higher production costs, including costs associated with a labor dispute in the Meal Preparation segment, as well as higher freight, commodity and variable incentive compensation costs. This was partially offset by pricing actions to recover commodity, freight, and packaging inflation, and lower expenses for restructuring programs of $13.3 million for 2018 compared to $35.5 million for restructuring programs in 2017.
Total Operating Expenses - Total operating expenses decreased to $808.8 million in 2018 compared to $898.9 million in 2017. The decrease of $90.1 million in 2018 is primarily attributable to a goodwill and other intangible asset impairment of $59.0 million related to Bars asset group in the Snacking & Beverages segment in 2017, and savings from the Structure to Win initiative and other cost saving measures, partially offset by an increase in other operating expenses and higher freight costs. Included in other operating expenses in 2018 were costs associated with restructuring programs with respect to the Company's TreeHouse 2020 margin improvement program and other plant closures, and acquisition, integration, divestiture and related costs, partially offset by the gain on the divestiture of the McCann's business of $14.3 million in the third quarter of 2018. Other operating expenses in 2017 reflects a loss on the divestiture of the SIF business of $86.0 million in the second quarter of 2017, costs associated with restructuring programs with respect to the Company's TreeHouse 2020 margin improvement activities and other plant closures, and acquisition, integration, divestiture and related costs. Refer to Note 3 to our Consolidated Financial Statements for additional information regarding restructuring activity.
Total Other Expense - Total other expense increased by $33.3 million to $141.0 million in 2018 compared to $107.7 million for 2017. The increase was primarily related to non-cash mark-to-market expense in 2018 compared to non-cash mark-to-market income in 2017 on derivative instruments, primarily interest rate swaps, unfavorable fluctuations in currency exchange rates between the U.S. and Canadian dollar during the respective periods, and a loss on debt extinguishment related to repurchases of the 2022 Notes and 2024 Notes. This was partially offset by lower interest expense mainly driven by lower net debt and lower credit facility pricing from the December 1, 2017 credit agreement amendment.
Income Taxes - Income tax benefit was recorded at an effective rate of 19.8% in 2018 compared to 490.5% in 2017. The change in the Company’s effective tax rate year-over-year is primarily due to the enactment of the Tax Cuts and Jobs Act, restructuring of the Company’s foreign operations in 2017, the 2017 impairment of goodwill that was not deductible for tax purposes, and compensation of officers that is not deductible for tax purposes.
Our effective tax rate may change from period to period based on recurring and non-recurring factors including the jurisdictional mix of earnings, enacted tax legislation, state income taxes, settlement of tax audits, and the expiration of the statute of limitations in relation to unrecognized tax benefits.
Discontinued Operations
Net loss from discontinued operations decreased to $18.2 million in the year ended December 31, 2018 compared to $390.8 million in the year ended December 31, 2017. The decrease is primarily attributable to the impairment of goodwill and other intangible assets of $490.7 million related to the Snacks division in 2017. There was no impairment recorded in 2018.
Year Ended December 31, 2018 Compared to Year Ended December 31, 2017 — Results by Segment
|
| | | | | | | | | | | | | |
| | Year Ended December 31, 2018 |
| | Meal Preparation | | Snacking & Beverages |
| | Dollars | | Percent | | Dollars | | Percent |
| | |
| Net sales | $ | 2,871.6 |
| | 100.0 | % | | $ | 1,716.2 |
| | 100.0 | % |
| Cost of sales | 2,287.6 |
| | 79.7 |
| | 1,396.9 |
| | 81.4 |
|
| Gross profit | 584.0 |
| | 20.3 |
| | 319.3 |
| | 18.6 |
|
| Freight out and commissions | 127.0 |
| | 4.4 |
| | 113.3 |
| | 6.6 |
|
| Direct selling, general, and administrative | 38.1 |
| | 1.3 |
| | 25.8 |
| | 1.5 |
|
| Direct operating income | $ | 418.9 |
| | 14.6 | % | | $ | 180.2 |
| | 10.5 | % |
|
| | | | | | | | | | | | | |
| | Year Ended December 31, 2017 |
| | Meal Preparation | | Snacking & Beverages |
| | Dollars | | Percent | | Dollars | | Percent |
| | |
| Net sales | $ | 3,095.9 |
| | 100.0 | % | | $ | 1,751.9 |
| | 100.0 | % |
| Cost of sales | 2,452.3 |
| | 79.2 |
| | 1,398.5 |
| | 79.8 |
|
| Gross profit | 643.6 |
| | 20.8 |
| | 353.4 |
| | 20.2 |
|
| Freight out and commissions | 135.0 |
| | 4.4 |
| | 96.7 |
| | 5.5 |
|
| Direct selling, general, and administrative | 46.4 |
| | 1.5 |
| | 31.2 |
| | 1.8 |
|
| Direct operating income | $ | 462.2 |
| | 14.9 | % | | $ | 225.5 |
| | 12.9 | % |
The change in net sales from the year ended December 31, 2017 to year ended December 31, 2018 was due to the following:
|
| | | | | | | | | | | | | |
| | Year Ended December 31, |
| | Meal Preparation | | Snacking & Beverages |
| | Dollars | | Percent | | Dollars | | Percent |
| | |
| 2017 Net Sales | $ | 3,095.9 |
| | | | $ | 1,751.9 |
| | |
| SKU rationalization | (86.3 | ) | | (2.8 | )% | | (62.9 | ) | | (3.6 | )% |
| Volume/mix excluding SKU rationalization | (122.7 | ) | | (3.9 | ) | | 6.2 |
| | 0.4 |
|
| Pricing | 50.5 |
| | 1.6 |
| | 20.7 |
| | 1.2 |
|
| Divestitures | (65.9 | ) | | (2.1 | ) | | — |
| | — |
|
| Foreign currency | 0.1 |
| | — |
| | 0.3 |
| | — |
|
| 2018 Net sales | $ | 2,871.6 |
| | (7.2 | )% | | $ | 1,716.2 |
| | (2.0 | )% |
Meal Preparation
Net sales in the Meal Preparation segment decreased by $224.3 million, or 7.2%, for the year ended December 31, 2018 compared to the year ended December 31, 2017. The change in net sales was due to unfavorable volume/mix primarily related to Powdered Creamers, Refrigerated Dough, Pasta, Dry Dinners, Preserves, Pickles and Dressings, ongoing efforts to simplify and rationalize low margin SKUs, the divestiture of the SIF and McCann's businesses, and the impact of lower pricing on Single Serve Beverages due to competitive pressure. This was partially offset by pricing actions taken to recover commodity and freight inflation.
Direct operating income as a percentage of net sales decreased 0.3 percentage points for the year ended December 31, 2018 compared to the year ended December 31, 2017. This decrease was primarily due to higher production costs (Powdered Creamers) and the impact of lower pricing on Single Serve Beverages due to competitive pressure, partially offset by pricing actions taken to recover commodity and freight inflation, lower expenses due to Structure to Win savings combined with lower expenses due to other cost savings activities, and logistics efficiency.
Snacking & Beverages
Net sales in the Snacking & Beverages segment decreased by $35.7 million, or 2.0%, for the year ended December 31, 2018 compared to the year ended December 31, 2017. The change in net sales was due to ongoing efforts to simplify and rationalize low margin SKUs, partially offset by pricing actions taken to recover commodity and freight inflation, and favorable volume/mix.
Direct operating income as a percentage of net sales decreased 2.4 percentage points for the year ended December 31, 2018 compared to the year ended December 31, 2017. This decrease was primarily due to higher production, commodity, and freight costs, partially offset by pricing actions taken to recover commodity and freight inflation, and lower expenses due to Structure to Win savings combined with lower expenses due to other cost savings activities.
Known Trends and Uncertainties
The costs of raw materials, ingredients, packaging materials, fuel, and energy have been volatile in recent years and future changes in such costs may cause our results of operations and our operating margins to fluctuate significantly. We expect these costs to continue to be volatile with an overall long-term upward trend. We manage the impact of cost increases, wherever possible, on commercially reasonable terms, by locking in prices on the quantities we expect are required to meet our production requirements. In addition, we offset the effect of increased costs by raising prices to our customers. However, for competitive reasons, we may not be able to pass along the full effect of increases in raw materials and other input costs as we incur them. Additionally, the Company expects to incur additional costs related to compliance with the Nutrition Labeling and Education Act and Bioengineered Labeling Declaration.
Freight rates decreased during 2019 compared to 2018. This decrease in rates was primarily due to added capacity lowering freight rates in the trucking market. The Company attempts to secure freight agreements when available and price accordingly to offset the increase in rates.
The Canadian dollar exposure to revenue is greater than the exposure to input costs for Canadian produced products. As such, an unfavorable Canadian dollar leads to an unfavorable impact to the Company’s operating results. The average exchange rate for fiscal year 2019 compared to fiscal year 2018 between the U.S. and Canadian dollar shows the U.S. dollar strengthened approximately 2.4%, while the exchange rate at December 31, 2019 shows that the U.S. dollar weakened approximately 5.3% as compared to the rate at December 31, 2018. The Company enters hedging arrangements to limit the impact of these fluctuations. In addition to higher input costs, the Company is impacted by the re-measurement of the Canadian dollar denominated intercompany loans and the translation of the Canadian dollar financial statements.
Competitive Environment
There has been significant consolidation in the retail grocery and foodservice industries in recent years resulting in mass merchandisers and non-traditional grocers, such as those offering a limited assortment of products, gaining market share. As our customer base continues to consolidate, we expect competition to intensify as we compete for the business of fewer, large customers. Additionally, the introduction of e-commerce grocers brings new opportunities and risks. There can be no assurance that we will be able to keep our existing customers, or gain new customers. As the consolidation of the retail grocery and foodservice industry continues, we could lose sales and profits if any one or more of our existing customers were to be sold or if limited assortment stores reduce the variety of products that we sell.
Both the difficult economic environment and the increased competitive environment in the retail and foodservice channels have caused competition to become increasingly intense in our business. We expect this trend to continue for the foreseeable future.
Liquidity and Capital Resources
Cash Flow
Management assesses the Company’s liquidity in terms of its ability to generate cash to fund its operating, investing, and financing activities. The Company remains in a strong financial position, with resources available for reinvesting in existing businesses, conducting acquisitions, and managing its capital structure on a short and long-term basis. If additional borrowings are needed, approximately $723.6 million was available under the Revolving Credit Facility as of December 31, 2019. See Note 13 to our Consolidated Financial Statements for additional information regarding our Revolving Credit Facility. We are in compliance with the terms of the Revolving Credit Facility and expect to meet foreseeable financial requirements.
The following table is derived from our Consolidated Statement of Cash Flows:
|
| | | | | | | | | | | |
| | Year Ended December 31, |
| | 2019 | | 2018 | | 2017 |
| | (in millions) |
| Net Cash Flows Provided By (Used In): | |
| | |
| | |
|
| Operating activities of continuing operations | $ | 263.9 |
| | $ | 472.1 |
| | $ | 465.7 |
|
| Investing activities of continuing operations | (139.3 | ) | | (142.4 | ) | | (135.6 | ) |
| Financing activities of continuing operations | (206.9 | ) | | (311.0 | ) | | (278.3 | ) |
| Cash flows from discontinued operations | 115.0 |
| | 15.2 |
| | 16.1 |
|
Operating Activities From Continuing Operations
Our cash provided by operating activities of continuing operations was $263.9 million in 2019 compared to $472.1 million in 2018, a decrease of $208.2 million. The decrease is primarily attributable to lower accounts payable and higher incentive compensation payments partially offset by lower receivables due to the higher use of the Receivables Sales Program (refer to Note 6 to the Consolidated Financial statements for additional information). Accounts payable decreased largely due to the settlement of payables retained as part of the divestiture of the Snacks division.
Our cash provided by operating activities of continuing operations was $472.1 million in 2018 compared to $465.7 million in 2017, an increase of $6.4 million. The increase is primarily attributable to improved working capital management partially offset by higher restructuring program expenses in 2018.
The Company's working capital management emphasis continues to be focused on reducing inventory, driving faster collection of receivables, and extending vendor terms.
Investing Activities From Continuing Operations
Cash used in investing activities of continuing operations was $139.3 million in 2019 compared to $142.4 million in 2018, a decrease in cash used of $3.1 million, driven by lower capital expenditures in 2019 compared to 2018, partially offset by the proceeds from the sale of the McCann's business in 2018.
Cash used in investing activities of continuing operations was $142.4 million in 2018 compared to $135.6 million in 2017, an increase in cash used of $6.8 million, driven by higher capital expenditures in 2018 compared to 2017, partially offset by increased proceeds from divestitures.
Financing Activities From Continuing Operations
Net cash used in financing activities from continuing operations was $206.9 million in 2019 compared to $311.0 million in 2018, a decrease in cash used of $104.1 million. The decrease is primarily attributable to repurchases of the 2022 Notes and 2024 Notes (refer to Note 13) and common stock repurchases, which did not recur in 2019, partially offset by early payments of $200.0 million on the Company's term loans during 2019.
Net cash used in financing activities of continuing operations was $311.0 million in 2018 compared to $278.3 million in 2017, an increase in cash used of $32.7 million. The increase is primarily attributable to repurchases of the 2022 Notes and 2024 Notes (refer to Note 13) and common stock repurchases, partially offset by reduced net loan activity under the Revolver during 2018.
Cash Flows From Discontinued Operations
Our cash provided by discontinued operations was $115.0 million in 2019 compared to cash provided of $15.2 million in 2018, an increase in cash provided of $99.8 million. The increase in cash flow during 2019 compared to 2018 is primarily attributable to proceeds received from the sale of the Snacks division and lower inventory.
Our cash provided by discontinued operations was $15.2 million in 2018 compared to $16.1 million in 2017, a decrease in cash provided of $0.9 million. The decrease in cash flow during 2018 compared to 2017 is primarily attributable to lower cash earnings partially offset by lower inventory and lower capital expenditures.
Free Cash Flow From Continuing Operations
In addition to measuring our cash flow generation and usage based upon the operating, investing, and financing classifications included in the Consolidated Statements of Cash Flows, we also measure free cash flow from continuing operations (a Non-GAAP measure) which represents net cash provided by operating activities from continuing operations less capital expenditures. We believe free cash flow is an important measure of operating performance because it provides management and investors a measure of cash generated from operations that is available for mandatory payment obligations and investment opportunities such as funding acquisitions, repaying debt, and repurchasing our common stock.
The following table reconciles cash flow provided by operating activities from continuing operations (a GAAP measure) to our free cash flow from continuing operations (a Non-GAAP measure):
|
| | | | | | | | | | | |
| | Year Ended December 31, |
| | 2019 | | 2018 | | 2017 |
| | (In millions) |
| Cash flow provided by operating activities from continuing operations | $ | 263.9 |
| | $ | 472.1 |
| | $ | 465.7 |
|
| Less: Capital expenditures | (146.8 | ) | | (177.4 | ) | | (161.6 | ) |
| Free cash flow from continuing operations | $ | 117.1 |
| | $ | 294.7 |
| | $ | 304.1 |
|
Debt Obligations
At December 31, 2019, we had $458.4 million outstanding under Term Loan A, $681.6 million outstanding under Term Loan A-1, $375.9 million of the 2022 Notes outstanding, $602.9 million of the 2024 Notes outstanding, and $3.9 million of other obligations. In addition, at December 31, 2019, there were $26.4 million in letters of credit under the Revolving Credit Facility that were issued but undrawn.
Credit Agreement — On December 1, 2017, the Company entered into the Second Amended and Restated Credit Agreement (the “Credit Agreement”) which amends, restates, and replaces the Company’s prior credit agreement, dated as of February 1, 2016 (as amended from time to time prior to February 1, 2016, the “Prior Credit Agreement”). As amended, the senior unsecured credit facility includes a revolving credit facility (the “Revolving Credit Facility” or the “Revolver”) and two term loans. The Credit Agreement (1) extended the maturity dates of the Revolving Credit Facility, Term Loan A, and Term Loan A-1, (2) resized the Revolver from $900 million to $750 million, (3) consolidated three term loans into two, (4) tightened pricing, and (5) modified the fee structure on the Revolving Credit Facility to now calculate based on the unused portion of the commitments under the Revolving Credit Facility rather than the total commitments under the Revolving Credit Facility.
On June 11, 2018, the Company entered into Amendment No. 1 (the “Amendment”) to the Credit Agreement. Under the Amendment, among other things, (i) the leverage covenant threshold has increased through fiscal year 2019, (ii) the Company and the other loan parties secured the obligations with liens on substantially all of their personal property, and (iii) such liens will be released upon the Company’s leverage ratio being less than or equal to 4.00 to 1.00 no earlier than the fiscal quarter ended on December 31, 2019. The material terms and conditions under the Credit Agreement are otherwise substantially consistent with those contained in the Credit Agreement prior to the Amendment. In connection with this Amendment, $0.6 million in lender fees will be amortized ratably through January 31, 2025 and $1.8 million of fees will be amortized ratably through February 1, 2023.
On August 26, 2019, the Company entered into Amendment No. 2 (the “Amendment”) to the Credit Agreement. This Amendment permanently maintains the secured status of the credit facility and the maximum permitted leverage ratio at 4.5x. Absent the Amendment, the Credit Agreement was scheduled to return to unsecured status with a maximum permitted leverage
ratio of 4.0x in the fourth quarter of 2019. The material terms and conditions under the Credit Agreement are otherwise substantially consistent with those contained in the Credit Agreement prior to the Amendment.
The Company’s average interest rate on debt outstanding under its Credit Agreement for the year ended December 31, 2019 was 4.11%. Including the impact of the interest rate swap agreements in effect as of December 31, 2019, the average rate decreased to 3.60%.
Revolving Credit Facility — As of December 31, 2019, $723.6 million of the aggregate commitment of $750.0 million of the Revolving Credit Facility was available. Under the Credit Agreement, the Revolving Credit Facility matures on February 1, 2023. In addition, as of December 31, 2019, there were $26.4 million in letters of credit under the Revolving Credit Facility that were issued but undrawn, which have been included as a reduction to the calculation of available credit.
Interest is payable quarterly or, if earlier, at the end of the applicable interest period in arrears on any outstanding borrowings under the Revolving Credit Facility. The interest rates applicable to the Revolving Credit Facility are based upon the Company’s consolidated net leverage ratio or the Company’s Corporate Credit Rating, whichever results in lower pricing, and are determined by either (i) LIBOR, plus a margin ranging from 1.20% to 1.70%, or (ii) a Base Rate (as defined in the Credit Agreement), plus a margin ranging from 0.20% to 0.70%. The unused fee on the Revolving Credit Facility is also based on the Company’s consolidated net leverage ratio or the Company’s Corporate Credit Rating, whichever results in lower pricing, and accrues at a rate ranging from 0.20% to 0.35%.
The Credit Agreement is fully and unconditionally, as well as jointly and severally, guaranteed by our 100% owned direct and indirect domestic subsidiaries: Bay Valley Foods, LLC; Sturm Foods, Inc. (includes Cains Foods, Inc. beginning in the fourth quarter of 2019); S.T. Specialty Foods, Inc.; Associated Brands, Inc.; Protenergy Holdings, Inc.; Protenergy Natural Foods, Inc.; TreeHouse Private Brands, Inc. (formerly Ralcorp Holdings, Inc.); American Italian Pasta Company.; Linette Quality Chocolates, Inc.; Ralcorp Frozen Bakery Products, Inc.; Cottage Bakery, Inc.; The Carriage House Companies, Inc. and certain other domestic subsidiaries that may become guarantors in the future, which are collectively known as the “Guarantor Subsidiaries.” As of August 1, 2019, Nutcracker Brands, Inc. and Flagstone Foods, Inc. are no longer Guarantor Subsidiaries due to the Snacks division divestiture. During the fourth quarter of 2019, Cains Foods, L.P. was dissolved and Cains GP, LLC was renamed as TreeHouse Foods Services, LLC. The Credit Agreement contains various financial and restrictive covenants and requires that the Company maintain a consolidated net leverage ratio of no greater than 4.50 to 1.0. The Credit Agreement also contains cross-default provisions which could result in the acceleration of payments in the event TreeHouse or the Guarantor Subsidiaries (i) fails to make a payment when due in respect of any indebtedness or guarantee having an aggregate principal amount greater than $75.0 million or (ii) fails to observe or perform any other agreement or condition related to such indebtedness or guarantee as a result of which the holder(s) of such debt are permitted to accelerate the payment of such debt.
Term Loan A — On December 1, 2017, the Company entered into a $500 million term loan which amended and extended the Company’s existing term A loan. The maturity date is January 31, 2025. The interest rates applicable to Term Loan A are based upon the Company’s consolidated net leverage ratio or the Company’s Corporate Credit Rating, whichever results in lower pricing, and are determined by either (i) LIBOR, plus a margin ranging from 1.675% to 2.175%, or (ii) a Base Rate (as defined in the Credit Agreement), plus a margin ranging from 0.675% to 1.175%. Principal amortization payments are due on a quarterly basis and interest is payable quarterly or, if earlier, at the end of the applicable interest period in arrears on any outstanding borrowings under Term Loan A. Term Loan A is subject to substantially the same covenants as the Revolving Credit Facility, and also has the same Guarantor Subsidiaries.
Term Loan A-1 — On December 1, 2017, the Company entered into a $900 million term loan which amended and extended the Company’s existing tranche A-1 and tranche A-2 term loans. The maturity date is February 1, 2023. The interest rates applicable to Term Loan A-1 are the same as those applicable to the Revolving Credit Facility (other than, for the avoidance of doubt, the unused fee). Principal amortization payments are due on a quarterly basis and interest is payable quarterly or, if earlier, at the end of the applicable interest period in arrears on any outstanding borrowing under Term Loan A-1. Term Loan A-1 is subject to substantially the same covenants as the Revolving Credit Facility, and has the same Guarantor Subsidiaries.
Term Loan A-2 — On December 1, 2017, Term Loan A-2 was paid off as part the Credit Agreement utilizing borrowings under Term Loan A and Term Loan A-1.
2022 Notes — On March 11, 2014, the Company completed its underwritten public offering of $400 million in aggregate principal amount of 4.875% notes due March 15, 2022 (the “2022 Notes”). The net proceeds of $394.0 million ($400.0 million less underwriting discount of $6.0 million, providing an effective interest rate of 4.99%) were used to extinguish the Company’s previously issued 7.75% notes due on March 1, 2018 (the “2018 Notes”). Interest is payable on March 15 and September 15 of each year. The 2022 Notes will mature on March 15, 2022.
The Company may redeem all or some of the 2022 Notes upon not less than 30 nor more than 60 days’ notice, at the redemption prices as set forth in the Indenture plus any accrued or unpaid interest to the applicable redemption date. Subject to certain limitations, in the event of a change in control of the Company, the Company will be required to make an offer to purchase the 2022 Notes at a purchase price equal to 101% of the principal amount of the 2022 Notes, plus accrued and unpaid interest up to the purchase date.
2024 Notes — On January 29, 2016, the Company completed an exempt offering under Rule 144A and Regulation S of the Securities Act of $775 million in aggregate principal amount of 6.0% notes due February 15, 2024. The net proceeds from the issuance of the 2024 Notes (approximately $760.7 million after deducting issuance costs, providing an effective interest rate of 6.23%) were used to fund a portion of the purchase price of the Private Brands Business. Interest is payable on February 15 and August 15 of each year. The payments began on August 15, 2016. The 2024 Notes will mature on February 15, 2024.
The Company may redeem some or all of the 2024 Notes at any time on or after February 15, 2019 at the applicable redemption prices described in the Indenture plus accrued and unpaid interest, if any, up to but not including the redemption date. In the event of certain change of control events, as described in the Indenture, the Company may be required to purchase the 2024 Notes from the holders at a purchase price of 101% of the principal amount plus any accrued and unpaid interest.
The Company issued the 2022 Notes and 2024 Notes pursuant to a single base Indenture among the Company, the Guarantor Subsidiaries, and the Trustee. The Indenture provides, among other things, that the 2022 Notes and 2024 Notes will be senior unsecured obligations of the Company. The Company’s payment obligations under the 2022 Notes and 2024 Notes are fully and unconditionally, as well as jointly and severally, guaranteed on a senior unsecured basis by the Guarantor Subsidiaries, in addition to any future domestic subsidiaries that guarantee or become borrowers under its credit agreement, or guarantee certain other indebtedness incurred by the Company or its restricted subsidiaries. The Indenture was supplemented during the first quarter of 2016 to include the changes in Guarantor Subsidiaries noted above.
The Indenture governing the 2022 Notes and 2024 Notes contains customary event of default provisions (including, without limitation, defaults relating to the failure to pay at final maturity or the acceleration of certain other indebtedness). If an event of default occurs and is continuing, the trustee under the Indenture or holders of at least 25% in principal amount of such notes may declare the principal amount and accrued and unpaid interest, if any, on all such notes to be due and payable. The Indenture also contains restrictive covenants that, among other things, limit the ability of the Company and the Guarantor Subsidiaries to: (i) pay dividends or make other restricted payments, (ii) make certain investments, (iii) incur additional indebtedness or issue preferred stock, (iv) create liens, (v) pay dividends or make other payments (except for certain dividends and payments to the Company and certain subsidiaries of the Company), (vi) merge or consolidate with other entities or sell substantially all of its assets, (vii) enter into transactions with affiliates, and (viii) engage in certain sale and leaseback transactions. The foregoing limitations are subject to exceptions as set forth in the Indenture. In addition, if in the future, the 2022 Notes or 2024 Notes have an investment grade credit rating by both Moody’s Investors Services, Inc. and Standard & Poor’s Ratings Services, certain of these covenants will, thereafter, no longer apply to the 2022 Notes or 2024 Notes for so long as the 2022 Notes or 2024 Notes are rated investment grade by the two rating agencies.
We are in compliance with all applicable financial debt covenants as of December 31, 2019.
Contractual Obligations
The following table summarizes the Company’s obligations and commitments to make future payments as of December 31, 2019:
|
| | | | | | | | | | | | | | | | | | | |
| | Payments Due by Period |
| | Total | | Year 1 | | Years 2-3 | | Years 4-5 | | More Than 5 Years |
| | (in millions) |
| Debt obligations | $ | 2,118.8 |
| | $ | 14.0 |
| | $ | 403.9 |
| | $ | 1,267.5 |
| | $ | 433.4 |
|
| Debt interest payments (1) | 375.0 |
| | 95.9 |
| | 181.0 |
| | 96.0 |
| | 2.1 |
|
| Finance lease obligations | 3.9 |
| | 1.3 |
| | 2.1 |
| | 0.5 |
| | — |
|
| Purchasing obligations (2) | 650.9 |
| | 517.0 |
| | 122.7 |
| | 9.8 |
| | 1.4 |
|
| Operating leases | 234.2 |
| | 39.5 |
| | 62.0 |
| | 42.3 |
| | 90.4 |
|
| Benefit obligations (3) | 216.8 |
| | 20.9 |
| | 43.5 |
| | 45.6 |
| | 106.8 |
|
| Deferred compensation (4) | 14.4 |
| | 1.2 |
| | 4.3 |
| | 2.6 |
| | 6.3 |
|
| Unrecognized tax benefit (5) | 13.3 |
| | 4.9 |
| | 5.7 |
| | 2.6 |
| | 0.1 |
|
| Total | $ | 3,627.3 |
| | $ | 694.7 |
| | $ | 825.2 |
| | $ | 1,466.9 |
| | $ | 640.5 |
|
| |
| (1) | Debt interest payments represent estimated future interest payments based on applicable interest rates at December 31, 2019. |
| |
| (2) | Purchasing obligations primarily represent commitments to purchase minimum quantities of raw materials used in our production processes. We enter into these contracts from time to time in an effort to ensure a sufficient supply of raw ingredients. In addition, we have contractual obligations to purchase various services that are a part of our production process. |
| |
| (3) | Benefit obligations consist of future payments related to pension and postretirement benefits as estimated by an actuarial valuation. |
| |
| (4) | Deferred compensation obligations have been allocated to payment periods based on existing payment plans for terminated employees and the estimated timing of distributions to current employees based on age. |
| |
| (5) | The unrecognized tax benefit liability recorded by the Company was $13.3 million at December 31, 2019. The timing of cash settlement, if any, cannot be reasonably estimated. The Company’s gross unrecognized tax benefit included in the tabular reconciliation (see Note 12 to our Consolidated Financial Statements for additional information) was $12.3 million. |
In addition to the commitments set forth in the above table, at December 31, 2019, the Company had $26.4 million in letters of credit, the majority of which related to the Company’s workers’ compensation program.
Off-Balance Sheet Arrangements
The Company does not have any obligations that meet the definition of an off-balance sheet arrangement, other than letters of credit, which have or are reasonably likely to have a material effect on the Consolidated Financial Statements.
Other Commitments and Contingencies
The Company also has selected levels of property and casualty risks, primarily related to employee health care, workers’ compensation claims, and other casualty losses, in addition to contingent liabilities related to ordinary course litigation, investigations, and tax audits.
See Note 20 to our Consolidated Financial Statements for more information about the Company’s commitments and contingent obligations.
Critical Accounting Policies
Critical accounting policies are defined as those most important to the portrayal of a company’s financial condition and results, and require the most difficult, subjective, or complex judgments. In many cases, the accounting treatment of a particular transaction is specifically dictated by GAAP with no need for the application of our judgment. In certain circumstances, however, the preparation of the Consolidated Financial Statements in conformity with GAAP requires us to use our judgment to make certain estimates and assumptions. These estimates affect the reported amounts of assets and liabilities and disclosures of contingent assets and liabilities at the date of the Consolidated Financial Statements and the reported amounts of net sales and expenses during the reporting period. We have identified the policies described below as our critical accounting policies. See Note 1 to the Consolidated Financial Statements for a detailed discussion of significant accounting policies.
Trade Allowances — We maintain an allowance for customer promotional programs, marketing co-op programs, and other sales and marketing expenses. This allowance is based on a combination of historical rolling twelve-month average program activity and specific customer program accruals, and can fluctuate due to the level of sales and marketing programs, and timing of deductions. This allowance was $37.9 million and $45.7 million at December 31, 2019 and 2018, respectively.
Property, Plant, and Equipment and Other Finite Lived Assets — We evaluate property, plant, and equipment and finite lived intangible assets for impairment when circumstances indicate that their carrying values may not be recoverable (a "triggering event"). Indicators of impairment include deteriorations in operating cash flows, the anticipated sale or disposal of an asset group, and other significant changes in business conditions.
Impairment charges are measured by comparing the carrying values of the asset groups to their estimated fair values. The fair value of these assets were based on expected future cash flows using Level 3 inputs under ASC 820. We can provide no assurance regarding the prospect of additional impairment charges in future periods.
During the second quarter of 2019, due to changes in market price expectations for the sale of the Company's Snacks division, the Company assessed the recoverability of the carrying value of the long-lived assets associated with the division. This assessment resulted in total long-lived asset impairment losses of $66.5 million, comprised of $63.2 million of property, plant, and equipment impairment losses and $3.3 million of intangible asset impairment losses. These impairment charges are included in Net loss from discontinued operations in the Consolidated Statements of Operations.
During the third quarter of 2019, our assessment also indicated an impairment in our Cookies and Dry Dinners asset groups driven by the historical and forecasted performance of these businesses. As a result, we recognized $42.8 million of property,
plant, and equipment impairment losses and $45.2 million of finite lived intangible asset impairment. The impairment charges are included in Asset impairment in the Consolidated Statements of Operations.
Goodwill and Indefinite Lived Intangible Assets — Goodwill and indefinite lived intangible assets totaled $2,129.3 million as of December 31, 2019, resulting primarily from acquisitions. Upon acquisition, the purchase price is first allocated to identifiable assets and liabilities, including but not limited to inventory, accounts payable, trademarks, and customer-related intangible assets, with any remaining purchase price recorded as goodwill. Goodwill and indefinite lived trademarks are not amortized.
The Company has three reporting units within its two reportable and operating segments.
The Company completed its annual goodwill and intangible asset impairment analysis as of December 31, 2019. Our assessment did not result in an impairment. Our analysis employed the use of an income approach, corroborated by a market approach. The Company believes the income approach is the most reliable indicator of the fair value of the reporting units. Significant assumptions used in the income approach include growth and discount rates, margins, and the Company’s weighted average cost of capital. We used historical performance and management estimates of future performance to determine margins and growth rates. The income approach utilizes projected cash flow estimates developed by the Company to determine fair value, which are unobservable, Level 3 inputs. Unobservable inputs are used to measure fair value to the extent that relevant observable inputs are not available. The Company developed our estimates using the best information available at the time. Discount rates selected for each reporting unit approximated the total Company discount rate. Our weighted average cost of capital included a review and assessment of market and capital structure assumptions. The Company's three reporting units all have fair values that the Company considers to be substantially in excess of their carrying values (between 84% and 154%). Considerable management judgment is necessary to evaluate the impact of operating changes and to estimate future cash flows. Assumptions used, such as forecasted growth rates and our cost of capital, are consistent with our internal projections and operating plans. Changes in our estimates or any of our other assumptions used in our analysis could result in a different conclusion.
We reviewed our indefinite lived intangible assets, which consist of trademarks totaling $22.0 million as of December 31, 2019, using the relief from royalty method. Significant assumptions include the royalty rates, growth, margins, and discount rates. Our assumptions were based on historical performance and management estimates of future performance, as well as available data on licenses of similar products. The Company’s policy is that indefinite lived assets must have a history of strong sales and cash flow performance that we expect to continue for the foreseeable future. When these criteria are no longer met, the Company changes the classification. Considerable management judgment is necessary to evaluate the impact of operating changes and to estimate future cash flows. The fair value of one of our trademarks with a book value of $16.0 million as of December 31, 2019 exceeds its book value by 10%. Based on our plans for this product line, we do not anticipate impairment of this trademark in the foreseeable future. However, if our expectations are not met or certain factors outside of our control, such as discount rates, change then this trademark could become impaired. The remainder of our indefinite-lived trademarks had fair values in excess of book value of greater than 10%. Changes in our estimates or any of our other assumptions used in our analysis could result in a different conclusion.
Income Taxes — Deferred taxes are recognized for future tax effects of temporary differences between financial and income tax reporting using tax rates in effect for the years in which the differences are expected to reverse. We periodically estimate our probable tax obligations using historical experience in tax jurisdictions and informed judgments. There are inherent uncertainties related to the interpretations of tax regulations in the jurisdictions in which we operate. These judgments and estimates made at a point in time may change based on the outcome of tax audits and changes to, or further interpretations of, regulations. If such changes take place, there is a risk that our tax rate may increase or decrease in any period, which would impact our earnings. Future business results may affect deferred tax liabilities or the valuation of deferred tax assets over time.
Employee Benefit Plan Costs — We provide a range of benefits to our employees, including pension and postretirement benefits to our eligible employees and retirees. We record annual amounts relating to these plans based on calculations specified by GAAP, which include various actuarial assumptions, such as discount rates, assumed investment rates of return, compensation increases, employee turnover rates, and health care cost trend rates. We review our actuarial assumptions on an annual basis and make modifications to the assumptions based on current rates and trends when appropriate. As required by GAAP, the effect of such modifications is generally deferred and subsequently amortized over future periods. Different assumptions that we make could result in the recognition of different amounts of expense over different periods.
While a number of the key assumptions related to our qualified pension plans are long-term in nature, including assumed investment rates of return, compensation increases, employee turnover rates, and mortality rates, GAAP requires that our discount rate assumption be more heavily weighted to current market conditions. As such, our discount rate will likely change
frequently. We used a discount rate to determine our estimated future benefit obligations of 3.25% at December 31, 2019. If the discount rate were one percent higher, the pension plan liability would have been approximately 10.6%, or $35.5 million, lower as of December 31, 2019. If the discount rate were one percent lower, the pension plan liability would have been approximately 12.9%, or $43.2 million, higher as of December 31, 2019.
See Note 18 to our Consolidated Financial Statements for more information regarding our employee pension and retirement benefit plans.
Recent Accounting Pronouncements
Information regarding recent accounting pronouncements is provided in Note 2 to the Consolidated Financial Statements.
Non-GAAP Measures
We have included in this report measures of financial performance that are not defined by GAAP (“Non-GAAP”). A non-GAAP financial measure is a numerical measure of financial performance that excludes or includes amounts so as to be different than the most directly comparable measure calculated and presented in accordance with GAAP in the Company’s Consolidated Financial Statements. We believe these measures provide useful information to the users of the financial statements as we also have included these measures in other communications and publications.
For each of these non-GAAP financial measures, we provide a reconciliation between the non-GAAP measure and the most directly comparable GAAP measure, an explanation of why management believes the non-GAAP measure provides useful information to financial statement users, and any additional purposes for which management uses the non-GAAP measure. This non-GAAP financial information is provided as additional information for the financial statement users and is not in accordance with, or an alternative to, GAAP. These non-GAAP measures may be different from similar measures used by other companies.
Organic Net Sales
Organic Net Sales is defined as net sales excluding the impacts of SKU rationalization, divestitures, and foreign currency. This information is provided in order to allow investors to make meaningful comparisons of the Company's sales between periods and to view the Company's business from the same perspective as Company management.
Adjusted Earnings Per Diluted Share From Continuing Operations, Adjusting for Certain Items Affecting Comparability
Adjusted earnings per diluted share from continuing operations (“adjusted diluted EPS”) reflects adjustments to GAAP net (loss) income per diluted share from continuing operations to identify items that, in management’s judgment, significantly affect the assessment of earnings results between periods. This information is provided in order to allow investors to make meaningful comparisons of the Company’s earnings performance between periods and to view the Company’s business from the same perspective as Company management. As the Company cannot predict the timing and amount of charges that include, but are not limited to, items such as acquisition, integration, divestiture, and related costs, mark-to-market adjustments on derivative contracts, foreign currency exchange impact on the re-measurement of intercompany notes, restructuring programs, impairment of assets, and other items that may arise from time to time that would impact comparability, management does not consider these costs when evaluating the Company’s performance, when making decisions regarding the allocation of resources, in determining incentive compensation, or in determining earnings estimates.
The reconciliation of Adjusted Diluted EPS from continuing operations, excluding certain items affecting comparability, to the relevant GAAP measure of diluted EPS from continuing operations as presented in the Consolidated Statements of Operations, is as follows:
|
| | | | | | | | | | | | |
| | | Year Ended December 31, |
| | | 2019 | | 2018 | | 2017 |
| | | (unaudited) |
| Diluted (loss) income per share from continuing operations (GAAP) | | $ | (1.96 | ) | | $ | (0.83 | ) | | $ | 1.93 |
|
| Impairment | (1) | 2.28 |
| | — |
| | 1.02 |
|
| Restructuring programs | (2) | 1.87 |
| | 2.95 |
| | 1.28 |
|
| Mark-to-market adjustments | (3) | 0.83 |
| | 0.40 |
| | (0.04 | ) |
| Litigation matter | (4) | 0.44 |
| | — |
| | — |
|
| Change in regulatory requirements | (5) | 0.26 |
| | — |
| | — |
|
| Multiemployer pension plan withdrawal | (6) | 0.08 |
| | — |
| | — |
|
| Executive management transition | (7) | 0.05 |
| | 0.23 |
| | — |
|
| Tax indemnification | (8) | 0.02 |
| | (0.04 | ) | | — |
|
| Acquisition, integration, divestiture, and related costs | (9) | 0.01 |
| | (0.24 | ) | | 1.75 |
|
| Product recall | (10) | 0.01 |
| | — |
| | (0.06 | ) |
| Foreign currency (gain) loss on re-measurement of intercompany notes | (11) | (0.09 | ) | | 0.11 |
| | (0.10 | ) |
| Debt amendment and repurchase activity | (12) | — |
| | 0.12 |
| | 0.09 |
|
| Tax reform | (13) | — |
| | — |
| | (1.92 | ) |
| Taxes on adjusting items | | (1.42 | ) | | (0.75 | ) | | (1.20 | ) |
Dilutive impact of shares 1 | | 0.01 |
| | 0.02 |
| | — |
|
| Adjusted diluted EPS from continuing operations (Non-GAAP) | | $ | 2.39 |
| | $ | 1.97 |
| | $ | 2.75 |
|
| (1) - As reported results reflect a loss for the years ended December 31, 2019 and 2018, all equity awards were considered anti-dilutive and excluded from the EPS calculation. However, the corresponding adjusted amounts reflect net income, therefore, equity awards are considered dilutive, and an adjustment is required to reflect total dilutive shares of 56.5 million compared to basic shares of 56.2 million and total dilutive shares of 56.5 million compared to basic shares of 56.0 million for the years ended December 31, 2019 and 2018, respectively. |
During the years ended December 31, 2019, 2018, and 2017, the Company entered into transactions that affected the year-over-year comparison of its financial results that included the following:
(1) In 2019, the Company incurred $129.1 million of non-cash impairment charges related to the Cookies and Dry Dinners asset groups and to the expected disposal loss related to two In-Store Bakery facilities. The impairment charges related to the Cookies and Dry Dinners asset groups is comprised of a non-cash impairment charges of $45.2 million of finite lived intangible asset impairment losses and $42.8 million of property, plant, and equipment impairment losses. The impairment related to the expected disposal loss on the In-Store Bakery facilities is $41.1 million. In 2017, the Company incurred $59.0 million of non-cash impairment charges related to the Bars asset group. Refer to Note 8, Note 9, and Note 10 to our Consolidated Financial Statements for additional details.
(2) The Company’s restructuring and margin improvement activities are part of an enterprise-wide transformation to improve long-term profitability of the Company. During 2019, the Company incurred approximately $105.4 million in restructuring program costs versus $166.7 million in 2018 and $73.6 million in 2017. Refer to Note 3 of the Consolidated Financial Statements for additional information.
(3) The Company’s derivative contracts are marked-to-market each period with the unrealized changes in fair value being recorded in the Consolidated Statements of Operations. These are non-cash charges. As the contracts are settled, realized gains and losses are recognized and included in earnings. The mark-to-market impacts only are treated as non-GAAP adjustments. Refer to Note 21 to our Consolidated Financial Statements for additional details.
(4) During 2019, the Company recognized a $25.0 million accrual related to a litigation matter. The suit’s primary allegation relates to certain purported label misrepresentations as to the nature of its Grove Square coffee products. Refer to Note 20 to our Consolidated Financial Statements for additional details.
(5) During 2019, the Company incurred regulatory compliance costs related to upcoming changes in nutrition labeling requirements. These costs included period expenses associated with changes to our production plan to align with late changes to the regulatory deadline, consulting services, and inventory write-downs.
(6) During 2019, the Company executed a complete withdrawal from the Retail, Wholesale, and Department Store International Union and Industry Pension Fund. The Company settled the withdrawal in the fourth quarter of 2019 for $4.3 million.
(7) The executive management transition line includes costs related to the CFO transition in 2019 and the CEO transition in 2018. The CFO transition costs primarily relate to severance. The CEO transition costs primarily relate to accelerated stock-based compensation and modification accounting. Refer to Note 16 to our Consolidated Financial Statements for additional details.
(8) The tax indemnification line represents the non-cash write off of indemnification assets that were recorded in connection with acquisitions from prior years. These write-offs arose as a result of the related uncertain tax position being released due to the statute of limitation lapse or settlement with taxing authorities. Refer to Note 12 for additional details.
(9) The acquisition, integration, divestiture, and related costs line represents costs associated with completed and potential divestitures, completed and potential acquisitions, the related integration of the acquisitions, and gains or losses on the divestiture of a business.
(10) The product recall costs (reimbursement) primarily represents recoveries received and ongoing efforts to recover additional insurance proceeds related to an announced voluntary recall of products that occurred in 2016 regarding products that may be impacted by sunflower seeds potentially contaminated with Listeria monocytogenes (L.mono) that were provided by a supplier.
(11) The Company has Canadian dollar denominated intercompany loans and incurred foreign currency gains and losses to re-measure the loans at the respective period ends. These charges are non-cash and the loans are eliminated in consolidation.
(12) During 2018, the Company amended its Credit Agreement, resulting in third party costs to complete the transaction. The Company also completed the repurchase of certain of its outstanding debt in 2018. This activity resulted in the write-off of a portion of deferred financing costs as well as a loss on debt extinguishment. During 2017, the Company refinanced its credit facility including our revolver and related term loans. This activity resulted in the write-off of a portion of deferred financing costs as well as third party costs to complete the transactions.
(13) The tax reform line represents the impact of the Tax Act which was signed into law on December 22, 2017 and made significant changes to the Internal Revenue Code. For the period ending December 31, 2017, the Company recorded a provisional net benefit of $110.6 million, primarily attributable to adjustments to our net deferred tax liability, partially offset with a one-time transition tax on the mandatory deemed repatriation of cumulative foreign earnings. The tax impact recorded for the year ended December 31, 2018 was insignificant and the Company considers all provisional amounts to be final.
The tax impact on adjusting items is calculated based upon the tax laws and statutory tax rates applicable in the tax jurisdiction of the underlying non-GAAP adjustments.
Adjusted Net Income from Continuing Operations, Adjusted EBIT from Continuing Operations, Adjusted EBITDA from Continuing Operations, Adjusted EBITDAS from Continuing Operations, Adjusted Net Income Margin from Continuing Operations, Adjusted EBIT Margin from Continuing Operations, Adjusted EBITDA Margin from Continuing Operations, and Adjusted EBITDAS Margin from Continuing Operations, Adjusting for Certain Items Affecting Comparability
Adjusted net income from continuing operations represents GAAP net (loss) income as reported in the Consolidated Statements of Operations adjusted for items that, in management’s judgment, significantly affect the assessment of earnings results between periods as outlined in the adjusted diluted EPS from continuing operations section above. This information is provided in order to allow investors to make meaningful comparisons of the Company’s earnings performance between periods and to view the Company’s business from the same perspective as Company management. This measure is also used as a component of the Board of Directors' measurement of the Company’s performance for incentive compensation purposes and is the basis of calculating the adjusted diluted EPS from continuing operations metric outlined above.
Adjusted EBIT from continuing operations represents adjusted net income from continuing operations before interest expense, interest income, and income tax expense. Adjusted EBITDA from continuing operations represents adjusted net income from continuing operations before interest expense, interest income, income tax expense, and depreciation and amortization expense. Adjusted EBITDAS from continuing operations represents adjusted EBITDA from continuing operations before non-cash stock-based compensation expense. Adjusted EBIT from continuing operations, adjusted EBITDA from continuing operations, and adjusted EBITDAS from continuing operations are performance measures commonly used by management to assess operating performance, and the Company believes they are commonly reported and widely used by investors and other interested parties as a measure of a company’s operating performance between periods and/or as a component of our debt covenant calculations.
Adjusted net income margin from continuing operations, adjusted EBIT margin from continuing operations, adjusted EBITDA margin from continuing operations, and adjusted EBITDAS margin from continuing operations are calculated as the respective metric defined above as a percentage of net sales as reported in the Consolidated Statements of Operations adjusted for items that, in management’s judgment, significantly affect the assessment of earnings results between periods as outlined in the adjusted diluted EPS from continuing operations section above.
The following table reconciles the Company’s net (loss) income from continuing operations as presented in the Consolidated Statements of Operations, the relevant GAAP measure, to Adjusted net income from continuing operations, Adjusted EBIT from continuing operations, Adjusted EBITDA from continuing operations, and Adjusted EBITDAS from continuing operations for the years ended December 31, 2019, 2018, and 2017:
|
| | | | | | | | | | | | |
| | | Year Ended December 31, |
| | | 2019 | | 2018 | | 2017 |
| | | (unaudited in millions) |
| Net (loss) income from continuing operations (GAAP) | | $ | (110.3 | ) | | $ | (46.2 | ) | | $ | 111.3 |
|
| Impairment | (1) | 129.1 |
| | — |
| | 59.0 |
|
| Restructuring programs | (2) | 105.4 |
| | 166.7 |
| | 73.6 |
|
| Mark-to-market adjustments | (3) | 47.0 |
| | 22.5 |
| | (2.3 | ) |
| Litigation matter | (4) | 25.0 |
| | — |
| | — |
|
| Change in regulatory requirements | (5) | 14.7 |
| | — |
| | — |
|
| Multiemployer pension plan withdrawal | (6) | 4.3 |
| | — |
| | — |
|
| Executive management transition | (7) | 2.9 |
| | 13.0 |
| | — |
|
| Tax indemnification | (8) | 1.6 |
| | (2.0 | ) | | — |
|
| Acquisition, integration, divestiture, and related costs | (9) | 0.6 |
| | (13.5 | ) | | 100.9 |
|
| Product recall | (10) | 0.3 |
| | — |
| | (3.3 | ) |
| Foreign currency (gain) loss on re-measurement of intercompany notes | (11) | (5.0 | ) | | 6.2 |
| | (5.9 | ) |
| Debt amendment and repurchase activity | (12) | — |
| | 6.8 |
| | 5.0 |
|
| Tax reform | (13) | — |
| | — |
| | (110.6 | ) |
| Less: Taxes on adjusting items | | (80.5 | ) | | (42.0 | ) | | (69.3 | ) |
| Adjusted net income from continuing operations (Non-GAAP) | | 135.1 |
| | 111.5 |
| | 158.4 |
|
| Interest expense (excluding debt amendment and repurchase activity) | | 102.4 |
| | 105.4 |
| | 119.1 |
|
| Interest income | | (4.8 | ) | | (3.8 | ) | | (4.3 | ) |
| Income tax (benefit) expense | | (45.5 | ) | | (11.4 | ) | | (31.6 | ) |
| Add: Taxes on adjusting items | | 80.5 |
| | 42.0 |
| | 69.3 |
|
| Adjusted EBIT from continuing operations (Non-GAAP) | | 267.7 |
| | 243.7 |
| | 310.9 |
|
| Depreciation and amortization | (14) | 206.8 |
| | 209.1 |
| | 216.2 |
|
| Adjusted EBITDA from continuing operations (Non-GAAP) | | 474.5 |
| | 452.8 |
| | 527.1 |
|
| Stock-based compensation expense | (15) | 21.6 |
| | 20.5 |
| | 28.1 |
|
| Adjusted EBITDAS from continuing operations (Non-GAAP) | | $ | 496.1 |
| | $ | 473.3 |
| | $ | 555.2 |
|
| | | | | | | |
| Adjusted net income margin from continuing operations | | 3.1 | % | | 2.4 | % | | 3.3 | % |
| Adjusted EBIT margin from continuing operations | | 6.2 | % | | 5.3 | % | | 6.4 | % |
| Adjusted EBITDA margin from continuing operations | | 11.1 | % | | 9.9 | % | | 10.9 | % |
| Adjusted EBITDAS margin from continuing operations | | 11.6 | % | | 10.3 | % | | 11.4 | % |
|
| | | | | | | | | | | | | | |
| | | Location in Consolidated Statements of Operations | | Year Ended December 31, |
| | | | 2019 | | 2018 | | 2017 |
| | | | | (unaudited in millions) |
| (1) | Impairment | Asset impairment | | $ | 129.1 |
| | $ | — |
| | $ | 59.0 |
|
| (2) | Restructuring programs | Other operating expense, net | | 99.3 |
| | 149.1 |
| | 38.1 |
|
| | | Cost of sales | | 4.4 |
| | 13.3 |
| | 35.5 |
|
| | | General and administrative | | 1.7 |
| | 4.3 |
| | — |
|
| (3) | Mark-to-market adjustments | Other expense (income), net | | 47.0 |
| | 22.5 |
| | (2.3 | ) |
| (4) | Litigation matter | General and administrative | | 25.0 |
|
| — |
|
| — |
|
| (5) | Change in regulatory requirements | Cost of sales | | 11.4 |
|
| — |
|
| — |
|
|
| Selling and distribution | | 2.8 |
|
| — |
|
| — |
|
|
| General and administrative | | 0.5 |
|
| — |
|
| — |
|
| (6) | Multiemployer pension plan withdrawal | Cost of sales | | 4.3 |
|
| — |
|
| — |
|
| (7) | Executive management transition | General and administrative | | 2.9 |
| | 13.0 |
| | — |
|
| (8) | Tax indemnification | Other expense (income), net | | 1.6 |
| | (2.0 | ) | | — |
|
| (9) | Acquisition, integration, divestiture, and related costs | General and administrative | | 0.3 |
| | (0.1 | ) | | 13.6 |
|
| | | Other operating expense, net | | 0.3 |
| | (13.4 | ) | | 87.3 |
|
| (10) | Product recall | Net sales | | — |
| | — |
| | (2.3 | ) |
| | | Cost of sales | | — |
| | — |
| | (1.0 | ) |
| | | General and administrative | | 0.3 |
| | — |
| | — |
|
| (11) | Foreign currency (gain) loss on re-measurement of intercompany notes | (Gain) loss on foreign currency exchange | | (5.0 | ) | | 6.2 |
| | (5.9 | ) |
| (12) | Debt amendment and repurchase activity | General and administrative | | — |
| | 0.2 |
| | 1.7 |
|
| | | Other expense (income), net | | — |
|
| 4.2 |
|
| — |
|
| | | Interest expense | | — |
|
| 2.4 |
|
| 3.3 |
|
| (13) | Tax reform | Income tax benefit | | — |
| | — |
| | (108.2 | ) |
| | | Other expense (income), net | | — |
| | — |
| | (2.4 | ) |
| (14) | Depreciation included as an adjusting item | Cost of sales | | 2.2 |
| | 12.1 |
| | 16.4 |
|
| | | General and administrative | | 1.6 |
| | 4.1 |
| | 0.3 |
|
| (15) | Stock-based compensation expense included as an adjusting item | General and administrative | | 1.0 |
| | 10.3 |
| | 0.1 |
|
| |
| Item 8. | Financial Statements and Supplementary Data |
The Consolidated Financial Statements for 2019 are included in this report on the following pages:
REPORT OF INDEPENDENT REGISTERED PUBLIC ACCOUNTING FIRM
To the Stockholders and the Board of Directors of TreeHouse Foods, Inc.
Opinion on the Financial Statements
We have audited the accompanying consolidated balance sheets of TreeHouse Foods, Inc. and subsidiaries (the "Company") as of December 31, 2019 and 2018, the related consolidated statements of operations, comprehensive income (loss), stockholders' equity, and cash flows, for each of the three years in the period ended December 31, 2019, and the related notes and the schedule listed in the Index at Item 15 (collectively referred to as the "financial statements"). In our opinion, the financial statements present fairly, in all material respects, the financial position of the Company as of December 31, 2019 and 2018, and the results of its operations and its cash flows for each of the three years in the period ended December 31, 2019, in conformity with accounting principles generally accepted in the United States of America.
We have also audited, in accordance with the standards of the Public Company Accounting Oversight Board (United States) (PCAOB), the Company's internal control over financial reporting as of December 31, 2019, based on criteria established in Internal Control - Integrated Framework (2013) issued by the Committee of Sponsoring Organizations of the Treadway Commission and our report dated February 13, 2020 (not presented herein), expressed an unqualified opinion on the Company's internal control over financial reporting.
Change in Accounting Principle
As discussed in Note 2 to the financial statements, the Company has changed its method of accounting for leases effective January 1, 2019 due to the adoption of Accounting Standards Update ("ASU") No. 2016-02, Leases (Topic 842), using the modified retrospective transition method.
Basis for Opinion
These financial statements are the responsibility of the Company's management. Our responsibility is to express an opinion on the Company's financial statements based on our audits. We are a public accounting firm registered with the PCAOB and are required to be independent with respect to the Company in accordance with the U.S. federal securities laws and the applicable rules and regulations of the Securities and Exchange Commission and the PCAOB.
We conducted our audits in accordance with the standards of the PCAOB. Those standards require that we plan and perform the audit to obtain reasonable assurance about whether the financial statements are free of material misstatement, whether due to error or fraud. Our audits included performing procedures to assess the risks of material misstatement of the financial statements, whether due to error or fraud, and performing procedures that respond to those risks. Such procedures included examining, on a test basis, evidence regarding the amounts and disclosures in the financial statements. Our audits also included evaluating the accounting principles used and significant estimates made by management, as well as evaluating the overall presentation of the financial statements. We believe that our audits provide a reasonable basis for our opinion.
Critical Audit Matter
The critical audit matter communicated below is a matter arising from the current-period audit of the financial statements that was communicated or required to be communicated to the audit committee and that (1) relates to accounts or disclosures that are material to the financial statements and (2) involved our especially challenging, subjective, or complex judgments. The communication of critical audit matters does not alter in any way our opinion on the financial statements, taken as a whole, and we are not, by communicating the critical audit matter below, providing a separate opinion on the critical audit matter or on the accounts or disclosures to which it relates.
Asset Impairment - Cookies & Dry Dinners - Refer to Notes 9 and 10 to the financial statements
Critical Audit Matter Description
During the third quarter of 2019, the Company identified triggering events for the Dry Dinners and Cookies asset groups, within its Meal Preparation and Snacking & Beverages segments (the Meal Solutions and Baked Goods segments, respectively, prior to the change in reportable segments described in Note 22 to the financial statements), respectively, related to historical operating losses, revised forecasts showing continued operating losses, and management’s decision to reduce capital expenditures in these asset groups going forward. Upon identification of these triggering events, the Company performed a recoverability test and concluded the assets within these asset groups were not recoverable. As a result, the Company recognized $42.8 million of property, plant, and equipment impairment losses and $45.2 million of finite-lived intangible asset impairment losses.
We identified the impairment of these assets as a critical audit matter because of the significant estimates and assumptions management makes to identify the triggering events and determine the fair values of the assets. These triggering events and the related impairment losses required a high degree of auditor judgment and an increased extent of effort when performing audit procedures to evaluate the reasonableness of management’s triggering event analysis and assessment of the fair value of the assets that were impaired. Fair value evaluation involved the use of real and personal property fair value specialists.
How the Critical Audit Matter Was Addressed in the Audit
Our audit procedures related to the triggering event analyses and the assessment of the fair values of the assets impaired included the following, among others:
| |
| • | We tested the effectiveness of controls over management’s review of the triggering events and long-lived asset impairment analyses, including the review of the triggering event identification, the recoverability test and discounted cash flow analyses, and the impairment loss measurements. |
| |
| • | We evaluated the reasonableness of management’s triggering event identification including the facts and assumptions for each asset group that were considered as well as the timing of the triggering events. |
| |
| • | With the assistance of our fair value specialists, we evaluated the Company’s methodology for determining personal property and real property fair value by (1) evaluating the source information and assumptions used by management and (2) developing independent expectations of fair values. |
| |
| • | We evaluated management’s assumptions and determination that the customer relationship intangible assets related to Cookies and Dry Dinners should be fully impaired by (1) evaluating the source data information and assumptions used by management and (2) testing the mathematical accuracy of the discounted cash flows analyses. We also evaluated management’s allocation methodology to ensure the customer relationships attributable to Cookies and Dry Dinners were determined reasonably. |
/s/ DELOITTE & TOUCHE LLP
Chicago, IL
February 13, 2020 (August 25, 2020 as to the effects of the change in reportable segments described in Note 22)
We have served as the Company's auditor since 2005.
TREEHOUSE FOODS, INC.
CONSOLIDATED BALANCE SHEETS
(In millions, except per share data)
|
| | | | | | | |
| | December 31, 2019 | | December 31, 2018 |
| ASSETS |
| Current assets: | |
| | |
|
| Cash and cash equivalents | $ | 202.3 |
| | $ | 164.3 |
|
| Receivables, net of allowance for doubtful accounts of $0.9 and $1.0 | 270.6 |
| | 351.3 |
|
| Inventories | 544.0 |
| | 615.6 |
|
| Prepaid expenses and other current assets | 44.5 |
| | 61.0 |
|
| Assets held for sale | 27.0 |
| | — |
|
| Assets of discontinued operations | 131.1 |
| | 485.8 |
|
| Total current assets | 1,219.5 |
| | 1,678.0 |
|
| Property, plant, and equipment, net | 1,045.2 |
| | 1,142.3 |
|
| Operating lease right-of-use assets | 175.3 |
| | — |
|
| Goodwill | 2,107.3 |
| | 2,107.9 |
|
| Intangible assets, net | 554.7 |
| | 656.4 |
|
| Other assets, net | 37.4 |
| | 44.7 |
|
| Total assets | $ | 5,139.4 |
| | $ | 5,629.3 |
|
| LIABILITIES AND STOCKHOLDERS' EQUITY |
| Current liabilities: | |
| | |
|
| Accounts payable | $ | 508.4 |
| | $ | 577.9 |
|
| Accrued expenses | 273.2 |
| | 252.5 |
|
| Current portion of long-term debt | 15.3 |
| | 1.2 |
|
| Liabilities of discontinued operations | 16.5 |
| | 6.0 |
|
| Total current liabilities | 813.4 |
| | 837.6 |
|
| Long-term debt | 2,091.7 |
| | 2,297.4 |
|
| Operating lease liabilities | 158.5 |
| | — |
|
| Deferred income taxes | 101.5 |
| | 166.1 |
|
| Other long-term liabilities | 143.4 |
| | 168.2 |
|
| Total liabilities | 3,308.5 |
| | 3,469.3 |
|
| Commitments and contingencies (Note 20) |
|
| |
|
|
| Stockholders’ equity: | |
| | |
|
| Preferred stock, par value $0.01 per share, 10.0 shares authorized, none issued | — |
| | — |
|
Common stock, par value $0.01 per share, 90.0 shares authorized, 56.2 and 56.0 shares issued and outstanding, respectively | 0.6 |
| | 0.6 |
|
| Treasury stock | (83.3 | ) | | (83.3 | ) |
| Additional paid-in capital | 2,154.6 |
| | 2,135.8 |
|
| (Accumulated deficit) Retained earnings | (157.0 | ) | | 204.0 |
|
| Accumulated other comprehensive loss | (84.0 | ) | | (97.1 | ) |
| Total stockholders’ equity | 1,830.9 |
| | 2,160.0 |
|
| Total liabilities and stockholders’ equity | $ | 5,139.4 |
| | $ | 5,629.3 |
|
See Notes to Consolidated Financial Statements.
TREEHOUSE FOODS, INC.
CONSOLIDATED STATEMENTS OF OPERATIONS
(In millions, except per share data)
|
| | | | | | | | | | | |
| | Year Ended December 31, |
| | 2019 | | 2018 | | 2017 |
| Net sales | $ | 4,288.9 |
| | $ | 4,587.8 |
| | $ | 4,852.6 |
|
| Cost of sales | 3,492.1 |
| | 3,695.6 |
| | 3,874.5 |
|
| Gross profit | 796.8 |
| | 892.2 |
| | 978.1 |
|
| Operating expenses: | | | | | |
| Selling and distribution | 256.9 |
| | 328.5 |
| | 345.5 |
|
| General and administrative | 253.2 |
| | 264.4 |
| | 283.7 |
|
| Amortization expense | 74.1 |
| | 80.2 |
| | 85.5 |
|
| Asset impairment | 129.1 |
| | — |
| | 59.0 |
|
| Other operating expense, net | 99.6 |
| | 135.7 |
| | 125.2 |
|
| Total operating expenses | 812.9 |
| | 808.8 |
| | 898.9 |
|
| Operating (loss) income | (16.1 | ) | | 83.4 |
| | 79.2 |
|
| Other expense (income): | | | | | |
| Interest expense | 102.4 |
| | 107.8 |
| | 122.4 |
|
| (Gain) loss on foreign currency exchange | (3.5 | ) | | 8.6 |
| | (5.0 | ) |
| Other expense (income), net | 40.8 |
| | 24.6 |
| | (9.7 | ) |
| Total other expense | 139.7 |
| | 141.0 |
| | 107.7 |
|
| Loss before income taxes | (155.8 | ) | | (57.6 | ) | | (28.5 | ) |
| Income tax benefit | (45.5 | ) | | (11.4 | ) | | (139.8 | ) |
| Net (loss) income from continuing operations | $ | (110.3 | ) | | $ | (46.2 | ) | | $ | 111.3 |
|
| Net loss from discontinued operations | (250.7 | ) | | (18.2 | ) | | (390.8 | ) |
| Net loss | $ | (361.0 | ) | | $ | (64.4 | ) | | $ | (279.5 | ) |
| | | | | | |
| Earnings (loss) per common share - basic: | | | | | |
| Continuing operations | $ | (1.96 | ) | | $ | (0.83 | ) | | $ | 1.95 |
|
| Discontinued operations | (4.46 | ) | | (0.33 | ) | | (6.84 | ) |
| Net loss per share basic (1) | $ | (6.42 | ) | | $ | (1.15 | ) | | $ | (4.89 | ) |
| | | | | | |
| Earnings (loss) per common share - diluted: | | | | | |
| Continuing operations | $ | (1.96 | ) | | $ | (0.83 | ) | | $ | 1.93 |
|
| Discontinued operations | (4.46 | ) | | (0.33 | ) | | (6.78 | ) |
| Net loss per share diluted (1) | $ | (6.42 | ) | | $ | (1.15 | ) | | $ | (4.85 | ) |
| | | | | | |
| Weighted average common shares: | | | | | |
| Basic | 56.2 |
| | 56.0 |
| | 57.1 |
|
| Diluted | 56.2 |
| | 56.0 |
| | 57.6 |
|
(1) The sum of the individual per share amounts may not add due to rounding.
See Notes to Consolidated Financial Statements.
TREEHOUSE FOODS, INC.
CONSOLIDATED STATEMENTS OF COMPREHENSIVE INCOME (LOSS)
(In millions)
|
| | | | | | | | | | | |
| | Year Ended December 31, |
| | 2019 | | 2018 | | 2017 |
| Net loss | $ | (361.0 | ) | | $ | (64.4 | ) | | $ | (279.5 | ) |
| | | | | | |
| Other comprehensive income (loss), net of tax: | | | | | |
| Foreign currency translation adjustments | 12.3 |
| | (34.5 | ) | | 32.2 |
|
| Pension and postretirement adjustment | 0.8 |
| | — |
| | 7.6 |
|
| Adoption of ASU 2018-02 reclassification to retained earnings | — |
| | (1.1 | ) | | — |
|
| Other comprehensive income (loss) | 13.1 |
| | (35.6 | ) | | 39.8 |
|
| | | | | | |
| Comprehensive loss | $ | (347.9 | ) | | $ | (100.0 | ) | | $ | (239.7 | ) |
See Notes to Consolidated Financial Statements.
TREEHOUSE FOODS, INC.
CONSOLIDATED STATEMENTS OF STOCKHOLDERS’ EQUITY
(In millions)
|
| | | | | | | | | | | | | | | | | | | | | | | | | | | | | |
| | | | | | | | Retained | | | | | | | | |
| | | | | | Additional | | Earnings | | | | | | Accumulated Other | | |
| | Common Stock | | Paid-In | | (Accumulated | | Treasury Stock | | Comprehensive | | |
| | Shares | | Amount | | Capital | | Deficit) | | Shares | | Amount | | Loss | | Equity |
| Balance, January 1, 2017 (1) | 56.8 |
| | $ | 0.6 |
| | $ | 2,071.9 |
| | $ | 546.5 |
| | — |
| | $ | — |
| | $ | (101.3 | ) | | $ | 2,517.7 |
|
| Net loss | — |
| | — |
| | — |
| | (279.5 | ) | | — |
| | — |
| | — |
| | (279.5 | ) |
| Other comprehensive income | — |
| | — |
| | — |
| | — |
| | — |
| | — |
| | 39.8 |
| | 39.8 |
|
| Treasury stock repurchases | — |
| | — |
| | — |
| | — |
| | (0.6 | ) | | (28.7 | ) | | — |
| | (28.7 | ) |
| Equity awards exercised | 0.4 |
| | — |
| | 5.1 |
| | — |
| | — |
| | — |
| | — |
| | 5.1 |
|
| Stock-based compensation | — |
| | — |
| | 30.0 |
| | — |
| | — |
| | — |
| | — |
| | 30.0 |
|
| Balance, December 31, 2017 | 57.2 |
| | $ | 0.6 |
| | $ | 2,107.0 |
| | $ | 267.0 |
| | (0.6 | ) | | $ | (28.7 | ) | | $ | (61.5 | ) | | $ | 2,284.4 |
|
| Net loss | — |
| | — |
| | — |
| | (64.4 | ) | | — |
| | — |
| | — |
| | (64.4 | ) |
| Other comprehensive income | — |
| | — |
| | — |
| | — |
| | — |
| | — |
| | (34.5 | ) | | (34.5 | ) |
| Treasury stock repurchases | — |
| | — |
| | — |
| | — |
| | (1.2 | ) | | (54.6 | ) | | — |
| | (54.6 | ) |
| Equity awards exercised | 0.6 |
| | — |
| | (3.6 | ) | | — |
| | — |
| | — |
| | — |
| | (3.6 | ) |
| Stock-based compensation | — |
| | — |
| | 32.4 |
| | — |
| | — |
| | — |
| | — |
| | 32.4 |
|
| Cumulative effect of accounting change | — |
| | — |
| | — |
| | 1.4 |
| | — |
| | — |
| | (1.1 | ) | | 0.3 |
|
| Balance, December 31, 2018 | 57.8 |
| | $ | 0.6 |
| | $ | 2,135.8 |
| | $ | 204.0 |
| | (1.8 | ) | | $ | (83.3 | ) | | $ | (97.1 | ) | | $ | 2,160.0 |
|
| Net loss | — |
| | — |
| | — |
| | (361.0 | ) | | — |
| | — |
| | — |
| | (361.0 | ) |
| Other comprehensive income | — |
| | — |
| | — |
| | — |
| | — |
| | — |
| | 13.1 |
| | 13.1 |
|
| Equity awards exercised | 0.2 |
| | — |
| | (5.0 | ) | | — |
| | — |
| | — |
| | — |
| | (5.0 | ) |
| Stock-based compensation | — |
| | — |
| | 23.8 |
| | — |
| | — |
| | — |
| | — |
| | 23.8 |
|
| Balance, December 31, 2019 | 58.0 |
| | $ | 0.6 |
| | $ | 2,154.6 |
| | $ | (157.0 | ) | | (1.8 | ) | | $ | (83.3 | ) | | $ | (84.0 | ) | | $ | 1,830.9 |
|
| |
| (1) | The retained earnings balance has been revised from the amounts previously reported as a result of the change in Pickles inventory valuation method from LIFO to FIFO. Refer to Note 7 for additional information. |
See Notes to Consolidated Financial Statements.
TREEHOUSE FOODS, INC.
CONSOLIDATED STATEMENTS OF CASH FLOWS
(In millions)
|
| | | | | | | | | | | |
| | Year Ended December 31, |
| | 2019 | | 2018 | | 2017 |
| Cash flows from operating activities: | |
| | |
| | |
|
| Net loss | $ | (361.0 | ) | | $ | (64.4 | ) | | $ | (279.5 | ) |
| Net loss from discontinued operations | (250.7 | ) | | (18.2 | ) | | (390.8 | ) |
| Net (loss) income from continuing operations | (110.3 | ) | | (46.2 | ) | | 111.3 |
|
| Adjustments to reconcile net loss to net cash provided by operating activities: | | | | | |
| Depreciation and amortization | 210.6 |
| | 225.2 |
| | 232.9 |
|
| Asset impairment | 129.1 |
| | — |
| | 59.0 |
|
| Stock-based compensation | 22.6 |
| | 30.7 |
| | 28.2 |
|
| (Gain) loss on divestitures | — |
| | (14.3 | ) | | 86.0 |
|
| Unrealized loss (gain) on derivative contracts | 47.0 |
| | 22.5 |
| | (2.3 | ) |
| Deferred income taxes | (63.3 | ) | | (16.8 | ) | | (130.1 | ) |
| Other, net | (0.5 | ) | | 25.2 |
| | 4.0 |
|
| Changes in operating assets and liabilities, net of effect of divestitures and acquisitions: | | | | | |
| Receivables | 80.6 |
| | (29.1 | ) | | 103.3 |
|
| Inventories | 65.5 |
| | 50.6 |
| | 23.7 |
|
| Prepaid expenses and other assets | 7.1 |
| | 32.5 |
| | (18.9 | ) |
| Accounts payable | (80.9 | ) | | 106.1 |
| | (9.6 | ) |
| Accrued expenses and other liabilities | (43.6 | ) | | 85.7 |
| | (21.8 | ) |
| Net cash provided by operating activities - continuing operations | 263.9 |
| | 472.1 |
| | 465.7 |
|
| Net cash provided by operating activities - discontinued operations | 43.8 |
| | 33.7 |
| | 40.3 |
|
| Net cash provided by operating activities | 307.7 |
| | 505.8 |
| | 506.0 |
|
| Cash flows from investing activities: | | | | | |
| Additions to property, plant, and equipment | (122.7 | ) | | (155.0 | ) | | (135.5 | ) |
| Additions to intangible assets | (24.1 | ) | | (22.4 | ) | | (26.1 | ) |
| Proceeds from sale of fixed assets | 4.8 |
| | 5.7 |
| | 8.4 |
|
| Proceeds from divestitures | — |
| | 30.8 |
| | 18.8 |
|
| Other | 2.7 |
| | (1.5 | ) | | (1.2 | ) |
| Net cash used in investing activities - continuing operations | (139.3 | ) | | (142.4 | ) | | (135.6 | ) |
| Net cash provided by (used in) investing activities - discontinued operations | 71.2 |
| | (18.5 | ) | | (24.2 | ) |
| Net cash used in investing activities | (68.1 | ) | | (160.9 | ) | | (159.8 | ) |
| Cash flows from financing activities: | | | | | |
| Borrowings under Revolving Credit Facility | 194.1 |
| | 108.7 |
| | 676.9 |
|
| Payments under Revolving Credit Facility | (194.1 | ) | | (108.7 | ) | | (846.9 | ) |
| Repurchases of 2022 and 2024 Notes | — |
| | (196.2 | ) | | — |
|
| Proceeds from refinanced Term Loans | — |
| | — |
| | 1,400.0 |
|
| Payment on other long-term debt | — |
| | — |
| | (0.3 | ) |
| Payments on finance lease obligations and other debt | (1.9 | ) | | (1.2 | ) | | (2.3 | ) |
| Payment of deferred financing costs | — |
| | (2.4 | ) | | (4.9 | ) |
| Payments on Term Loans | (200.0 | ) | | (56.5 | ) | | (1,477.3 | ) |
| Repurchases of common stock | — |
| | (54.6 | ) | | (28.7 | ) |
| Receipts related to stock-based award activities | 0.7 |
| | 4.7 |
| | 12.1 |
|
| Payments related to stock-based award activities | (5.7 | ) | | (8.4 | ) | | (6.9 | ) |
| Other | — |
| | 3.6 |
| | — |
|
| Net cash used in financing activities - continuing operations | (206.9 | ) | | (311.0 | ) | | (278.3 | ) |
|
| | | | | | | | | | | |
| Net cash (used in) provided by financing activities - discontinued operations | — |
| | — |
| | — |
|
| Net cash used in financing activities | (206.9 | ) | | (311.0 | ) | | (278.3 | ) |
| Effect of exchange rate changes on cash and cash equivalents | 5.3 |
| | (2.4 | ) | | 2.8 |
|
| Net increase in cash and cash equivalents | 38.0 |
| | 31.5 |
| | 70.7 |
|
| Cash and cash equivalents, beginning of year | 164.3 |
| | 132.8 |
| | 62.1 |
|
| Cash and cash equivalents, end of year | $ | 202.3 |
| | $ | 164.3 |
| | $ | 132.8 |
|
| | | | | | |
| Supplemental cash flow disclosures | | | | | |
| Interest paid | $ | 110.2 |
| | $ | 118.2 |
| | $ | 115.4 |
|
| Net income taxes (refunded) paid | (7.3 | ) | | (7.0 | ) | | 12.4 |
|
| Non-cash investing activities: | | | | | |
| Accrued purchase of property and equipment | $ | 28.8 |
| | $ | 19.8 |
| | $ | 19.3 |
|
| Accrued other intangible assets | 3.2 |
| | 6.1 |
| | 3.2 |
|
| Right-of-use assets and operating lease obligations recognized at ASU 2016-02 transition | 252.5 |
| | — |
| | — |
|
| Right-of-use assets and operating lease obligations recognized after ASU 2016-02 transition | 13.1 |
| | — |
| | — |
|
See Notes to Consolidated Financial Statements.
TREEHOUSE FOODS, INC.
NOTES TO CONSOLIDATED FINANCIAL STATEMENTS
Years ended December 31, 2019, 2018, and 2017
1. SUMMARY OF SIGNIFICANT ACCOUNTING POLICIES
Basis of Presentation — The Consolidated Financial Statements include the accounts of TreeHouse Foods, Inc. and its 100% owned direct and indirect subsidiaries (the “Company,” “TreeHouse,” “we,” “us,” or “our”). All intercompany balances and transactions are eliminated in consolidation.
Discontinued Operations — Beginning in the third quarter of 2019, the Company determined that both its Snacks division and its Ready-to-eat ("RTE") Cereal business met the discontinued operations criteria in Accounting Standards Codification ("ASC") 205-20-45 and were classified as discontinued operations. As such, both businesses have been excluded from continuing operations and segment results for all periods presented. Refer to Note 8 for additional information.
Change in Segments — On January 1, 2019, the Company changed how it manages its business, allocates resources, and goes to market, which resulted in modifications to its organizational and segment structure (the “2019 Segment Change”). As a result, the Company consolidated its Condiments and Meals segments into one segment called Meal Solutions. Additionally, the Bars and Ready-to-eat cereal categories moved from the Company's Snacks and Meals segments, respectively, into the Baked Goods segment.
On January 1, 2020, the Company changed how it manages its business, allocates resources, and goes to market, which resulted in modifications to its organizational and segment structure (the "2020 Segment Change"). As a result, the Company reorganized from a three segment structure previously organized by product category (Baked Goods, Beverages, and Meal Solutions) to a two segment structure organized by market dynamics (Snacking & Beverages and Meal Preparation).
During 2019, all prior period information was originally recast to reflect the 2019 Segment Change. Upon the 2020 Segment Change, all prior period information was recast to reflect this change in reportable segments and as such, the information herein no longer presents the 2019 Segment Change. Refer to Note 22 for additional information.
Use of Estimates — The preparation of our Consolidated Financial Statements in conformity with accounting principles generally accepted in the United States of America (“GAAP”) requires management to use judgment to make estimates and assumptions that affect the reported amounts of assets and liabilities and disclosures of contingent assets and liabilities at the date of the Consolidated Financial Statements, and the reported amounts of net sales and expenses during the reporting period. Actual results could differ from these estimates.
Cash Equivalents — We consider temporary cash investments with an original maturity of three months or less to be cash equivalents. As of December 31, 2019 and 2018, $72.7 million and $86.4 million, respectively, represents cash and equivalents held in foreign jurisdictions, in local currencies, that are convertible into other currencies.
Inventories — Inventories are stated at the lower of cost or net realizable value. As of April 1, 2019, all the Company's inventory is valued using the FIFO method. The costs of finished goods inventories include raw materials, labor, and overhead costs.
Effective April 1, 2019, the Company changed its method of valuing its Pickle inventory in its Meal Preparation segment from the last-in, first out (LIFO) method to the first-in, first out (FIFO) method. Prior period information included in this Form 10-K has been recast to apply the FIFO method retrospectively. Refer to Note 7 for additional information.
Property, Plant, and Equipment — Property, plant, and equipment are stated at acquisition cost, plus capitalized interest on borrowings during the actual construction period of major capital projects. Depreciation and amortization are calculated using the straight-line method over the estimated useful lives of the assets as follows:
|
| | |
| Asset | | Useful Life |
| Buildings and improvements | | 12-40 years |
| Machinery and equipment | | 3-15 years |
| Office furniture and equipment | | 3-12 years |
TREEHOUSE FOODS, INC.
NOTES TO CONSOLIDATED FINANCIAL STATEMENTS – (Continued)
We perform impairment tests when circumstances indicate that the carrying value of an asset may not be recoverable. Finance leases are amortized over the shorter of their lease term or their estimated useful lives, and amortization expense is included in depreciation expense. Expenditures for repairs and maintenance, which do not improve or extend the life of the assets, are expensed as incurred.
Intangible and Other Assets — Identifiable intangible assets with finite lives are amortized over their estimated useful lives as follows:
|
| | |
| Asset | | Useful Life |
| Customer-related | | 5 to 20 years |
| Trademarks | | 10 to 20 years |
| Non-competition agreements | | Based on the terms of the agreements |
| Deferred financing costs associated with line-of-credit arrangements | | Based on the terms of the agreements |
| Formulas/recipes | | 5 to 7 years |
| Computer software | | 3 to 10 years |
All amortization expense related to intangible assets is recorded in Amortization expense in the Consolidated Statements of Operations.
Indefinite lived trademarks are evaluated for impairment annually in the fourth quarter or more frequently, if events or changes in circumstances indicate that the asset might be impaired. Impairment is indicated when their book value exceeds fair value. If the fair value of an evaluated asset is less than its book value, the asset is written down to fair value, which is generally based on its discounted future cash flows.
Amortizable intangible assets are evaluated for impairment whenever events or changes in circumstances indicate that the carrying amount may not be recoverable. If an evaluation of the undiscounted cash flows indicates impairment, the asset is written down to its estimated fair value, which is generally based on discounted future cash flows.
Goodwill is evaluated annually in the fourth quarter or more frequently, if events or changes in circumstances require an interim assessment. We assess goodwill for impairment (as of December 31) at the reporting unit level using income and market approaches, employing significant assumptions regarding growth, discount rates, and profitability at each reporting unit. Our estimates under the income approach are determined based on a discounted cash flow model. The market approach uses a market multiple methodology employing earnings before interest, taxes, depreciation, and amortization (“EBITDA”) and applies a range of multiples to those amounts in determining the indicated fair value. In determining the multiples used in this approach, we obtain the multiples for selected peer companies using the most recent publicly available information. In determining the indicated fair value of each reporting unit, the Company concludes based on the income approach, and uses the market approach to corroborate, as the Company believes the income approach is the most reliable indicator of the fair value of the reporting units. The resulting value is then compared to the carrying value of each reporting unit to determine if impairment is necessary.
Stock-Based Compensation — We measure compensation expense for our equity awards at their grant date fair value. The resulting expense is recognized over the relevant service period.
Accounts Receivable — We provide credit terms to customers in-line with industry standards, perform ongoing credit evaluations of our customers, and maintain allowances for potential credit losses based on historical experience. Customer balances are written off after all collection efforts are exhausted. Estimated product returns, which have not been material, are deducted from sales at the time of shipment.
Employment-Related Benefits — We provide a range of benefits to our employees, including pension and postretirement benefits to our eligible employees and retirees. We record annual amounts relating to these plans based on calculations specified by GAAP, which include various actuarial assumptions, such as discount rates, assumed investment rates of return, compensation increases, employee turnover rates, and health care cost trend rates. We review our actuarial assumptions on an annual basis and make modifications to the assumptions based on current rates and trends when appropriate.
Workers' Compensation — The measurement of the liability for our cost of providing these benefits is largely based upon loss development factors that contemplate a number of variables, including claims history and expected trends. These loss development factors are based on industry factors and, along with the estimated liabilities, are developed by us in consultation
TREEHOUSE FOODS, INC.
NOTES TO CONSOLIDATED FINANCIAL STATEMENTS – (Continued)
with external insurance brokers and actuaries. Changes in loss development factors, claims history, and cost trends could result in substantially different results in the future.
Income Taxes — The provision for income taxes includes federal, foreign, state, and local income taxes currently payable, and those deferred because of temporary differences between the financial statement and tax bases of assets and liabilities. Deferred tax assets or liabilities are computed based on the difference between the financial statement and income tax bases of assets and liabilities using enacted tax rates. Valuation allowances are recorded to reduce deferred tax assets when it is more likely than not that a tax benefit will not be realized. Deferred income tax expenses or credits are based on the changes in the asset or liability from period to period. We account for uncertain tax positions using a “more-likely-than-not” threshold. A tax benefit from an uncertain tax position is recognized if it is more-likely-than-not that the tax position will be sustained on examination by the taxing authorities, based on the technical merits of the position, or the statute of limitations concerning such issues lapses.
Foreign Currency Translation and Transactions — The functional currency of the Company’s foreign operations is the applicable local currency. The functional currency is translated into U.S. dollars for balance sheet accounts using currency exchange rates in effect as of the balance sheet date, and for revenue and expense accounts using a weighted-average exchange rate during the fiscal year. The translation adjustments are deferred as a separate component of Stockholders’ equity in Accumulated other comprehensive loss. Gains or losses resulting from transactions denominated in foreign currencies and intercompany debt that is not of a long-term investment nature are included in (Gain) loss on foreign currency exchange in the Consolidated Statements of Operations. Gains or losses resulting from intercompany debt that is designated a long-term investment are recorded as a separate component of Stockholders' equity in Accumulated other comprehensive loss.
Restructuring Expenses — Restructuring charges principally consist of severance and other employee separation costs, contract termination costs, accelerated depreciation, professional fees, and certain long-lived asset impairments. The Company recognizes restructuring obligations and liabilities for exit and disposal activities at fair value in the period the liability is incurred. One-time employee termination benefits for employee severance costs are expensed evenly starting at the communication date over the period during which the employee is required to render service to receive the severance. Ongoing benefit arrangements for employee severance costs are expensed when they become probable and reasonably estimable. Depreciation expense related to assets that will be disposed of or idled as a part of the restructuring activity is accelerated through the expected date of the asset shut down. Restructuring charges are incurred as a component of Operating (loss) income.
Research and Development Costs — We record research and development charges to expense as they are incurred and report them in General and administrative expense in our Consolidated Statements of Operations. Expenditures totaled $18.8 million, $19.2 million, and $27.8 million for the years ended December 31, 2019, 2018, and 2017, respectively.
Advertising Costs —Advertising costs are expensed as incurred and reported in Selling and distribution expense of our Consolidated Statements of Operations.
2. RECENTLY ISSUED ACCOUNTING PRONOUNCEMENTS
Adopted
In February 2016, the FASB issued Accounting Standards Update ("ASU") No. 2016-02, Leases, to increase transparency and comparability by recognizing lease assets and lease liabilities on the balance sheet and disclosing key information about leasing arrangements. The main difference between legacy GAAP and this ASU is the recognition of lease assets and lease liabilities by lessees for those leases classified as operating leases under legacy GAAP. The standard requires that entities apply the effects of these changes using a modified retrospective approach, which includes a number of optional practical expedients. In July 2018, the FASB issued ASU No. 2018-11, Leases (842), Targeted Improvements, which provides an additional transition election to not restate comparative periods for the effects of applying the new standard. This transition election permits entities to apply ASU No. 2016-02 on the adoption date and recognize a cumulative-effect adjustment to the opening balance of retained earnings. These ASU's are effective for fiscal years, and interim periods within those years, beginning after December 15, 2018.
The Company adopted these ASUs as of January 1, 2019 under the modified retrospective transition method prescribed by ASU 2018-11. Under this transition method, financial results reported in periods prior to the first quarter of 2019 are unchanged. On a continuing operations basis, the adoption of these ASUs resulted in the recognition of approximately $221.5 million of right-of-use assets and lease liabilities as of January 1, 2019. Also as a result of adoption, the Company reclassified $17.2 million of liabilities and $0.6 million of assets on its Consolidated Balance Sheet as of January 1, 2019 against the operating lease right-of-use asset. The adoption of these ASUs did not result in a cumulative-effect adjustment to the opening balance of retained earnings.
In addition, the Company elected the package of practical expedients permitted by the transition guidance. The adoption of these ASU’s did not have an impact on the Company’s Consolidated Statements of Operations or Cash Flows.
TREEHOUSE FOODS, INC.
NOTES TO CONSOLIDATED FINANCIAL STATEMENTS – (Continued)
Refer to Note 4 for additional information regarding the Company's leases.
3. RESTRUCTURING PROGRAMS
The Company’s restructuring and margin improvement activities are part of an enterprise-wide transformation to improve long-term profitability of the Company. These activities are aggregated into three categories: (1) TreeHouse 2020 – a long-term growth and margin improvement strategy; (2) Structure to Win – an operating expenses improvement program; and (3) other restructuring and plant closing costs (collectively the “Restructuring Programs”).
The costs by activity for the Restructuring Programs are outlined below:
|
| | | | | | | | | | | |
| | Year Ended December 31, |
| | 2019 | | 2018 | | 2017 |
| | (In millions) |
| TreeHouse 2020 | $ | 89.5 |
| | $ | 118.4 |
| | $ | 51.4 |
|
| Structure to Win | 15.9 |
| | 44.1 |
| | — |
|
| Other restructuring and plant closing costs | — |
| | 4.2 |
| | 22.2 |
|
| Total Restructuring Programs | $ | 105.4 |
| | $ | 166.7 |
| | $ | 73.6 |
|
Expenses associated with these programs are recorded in Cost of sales, General and administrative, and Other operating expense, net in the Consolidated Statements of Operations. The Company does not allocate costs associated with Restructuring Programs to reportable segments when evaluating the performance of its segments. As a result, costs associated with Restructuring Programs are not presented by reportable segment. See Note 22 for more information.
Below is a summary of costs by line item for the Restructuring Programs: |
| | | | | | | | | | | | |
| | | Year Ended December 31, |
| | | 2019 | | 2018 | | 2017 |
| | | (In millions) |
| Cost of sales | | $ | 4.4 |
| | $ | 13.3 |
| | $ | 35.5 |
|
| General and administrative | | 1.7 |
| | 4.3 |
| | — |
|
| Other operating expense, net | | 99.3 |
| | 149.1 |
| | 38.1 |
|
| Total | | $ | 105.4 |
| | $ | 166.7 |
| | $ | 73.6 |
|
The table below presents the exit cost liability activity as of December 31, 2019:
|
| | | | | | | | | | | | |
| | | |
| | | Severance | | Other Costs | | Total Liabilities |
| | | (In millions) |
| Balance as of December 31, 2018 | | $ | 19.3 |
| | $ | 2.6 |
| | $ | 21.9 |
|
| Expenses recognized | | 9.1 |
| | — |
| | 9.1 |
|
| Cash payments | | (22.8 | ) | | — |
| | (22.8 | ) |
| Reclassification due to adoption of ASU 2016-02 | | — |
| | (2.6 | ) | | (2.6 | ) |
| Balance as of December 31, 2019 | | $ | 5.6 |
| | $ | — |
| | $ | 5.6 |
|
Liabilities as of December 31, 2019 associated with total exit cost reserves relate to severance. The severance liability is included in Accrued expenses in the Consolidated Balance Sheets. Other costs represent early lease termination liabilities. As part of the Company's adoption of ASU 2016-02, these lease termination liabilities were offset with the initial right-of-use asset at transition. Refer to Note 4 for additional information.
TREEHOUSE FOODS, INC.
NOTES TO CONSOLIDATED FINANCIAL STATEMENTS – (Continued)
(1) TreeHouse 2020
In the third quarter of 2017, the Company announced TreeHouse 2020, a program intended to accelerate long-term growth through optimization of our manufacturing network, transformation of our mixing centers and warehouse footprint, and leveraging of systems and processes to drive performance. The Company’s workstreams related to these activities and selling, general, and administrative cost reductions will increase our capacity utilization, expand operating margins, and streamline our plant structure to optimize our supply chain. This program began in 2017 and will be executed through 2020. The table below shows key information regarding the Company's announced plant closures, a component of the broader TreeHouse 2020 program:
|
| | | | | | | | | | | | | | | | |
| Facility Location | | Date of Closure Announcement | | Full Facility Closure | | Primary Products Produced | | Primary Segment(s) Affected | | Total Costs to Close | | Total Cash Costs to Close |
| | | | | | | | | | | (In millions) |
| Brooklyn Park, Minnesota | | August 3, 2017 | | Completed in Q4 2017 | | Dry Dinners | | Meal Preparation | | $ | 16.1 |
| | $ | 9.6 |
|
| Plymouth, Indiana | | August 3, 2017 | | Completed in Q4 2017 | | Pickles | | Meal Preparation | | 9.3 |
| | 3.8 |
|
| Visalia, California | | February 15, 2018 | | Q1 2019 | | Pretzels | | Snacking & Beverages | | 22.1 |
| | 8.8 |
|
| | | | | | | | | | | $ | 47.5 |
| | $ | 22.2 |
|
Expenses associated with the Company's Dothan, Alabama; Battle Creek, Michigan; and Minneapolis, Minnesota facility closures are classified within Net loss from discontinued operations and are excluded from the table above. Total costs to close these three facilities were $29.7 million.
During the third quarter of 2018, the Company announced the closure of its Omaha, Nebraska office by January 31, 2019. This closure was completed during the first quarter of 2019.
Below is a summary of the overall TreeHouse 2020 program costs by type:
|
| | | | | | | | | | | | | | | | | | | |
| | Year Ended December 31, | | Cumulative Costs To Date | | Total Expected Costs |
| | 2019 | | 2018 | | 2017 | | |
| | | | (In millions) |
| Asset-related | $ | 2.9 |
| | $ | 9.2 |
| | $ | 33.0 |
| | $ | 45.1 |
| | $ | 45.1 |
|
| Employee-related | 10.8 |
| | 36.2 |
| | 9.1 |
| | 56.1 |
| | 57.3 |
|
| Other costs | 75.8 |
| | 73.0 |
| | 9.3 |
| | 158.1 |
| | 184.4 |
|
| Total | $ | 89.5 |
| | $ | 118.4 |
| | $ | 51.4 |
| | $ | 259.3 |
| | $ | 286.8 |
|
For the years ended December 31, 2019, 2018, and 2017, asset-related primarily consisted of accelerated depreciation; employee-related costs primarily consisted of dedicated project employee cost, severance, and retention; and other costs primarily consisted of consulting costs. Asset-related costs are included in Cost of sales while employee-related and other costs are primarily included in Other operating expense, net of the Consolidated Statements of Operations.
(2) Structure to Win
In the first quarter of 2018, the Company announced an operating expenses improvement program (“Structure to Win”) designed to align our organization structure with strategic priorities. The program is intended to drive operational effectiveness, cost reduction, and position the Company for growth with a focus on a lean customer focused go-to-market team, centralized supply chain, and streamlined administrative functions.
TREEHOUSE FOODS, INC.
NOTES TO CONSOLIDATED FINANCIAL STATEMENTS – (Continued)
Below is a summary of costs by type associated with the Structure to Win program: |
| | | | | | | | | | | | | | | | |
| | | Year Ended December 31, | | Cumulative Costs To Date | | Total Expected Costs |
| | | 2019 | | 2018 | | |
| | | | | (In millions) |
| Asset-related | | $ | 1.8 |
| | $ | 2.1 |
| | $ | 4.0 |
| | $ | 4.0 |
|
| Employee-related | | 4.8 |
| | 21.4 |
| | 26.1 |
| | 26.2 |
|
| Other costs | | 9.3 |
| | 20.6 |
| | 29.9 |
| | 30.2 |
|
| Total | | $ | 15.9 |
| | $ | 44.1 |
| | $ | 60.0 |
| | $ | 60.4 |
|
For the years ended December 31, 2019 and 2018, asset-related costs primarily consisted of accelerated depreciation, employee-related costs primarily consisted of severance and retention, and other costs primarily consisted of consulting services. Asset-related costs are included in General and administrative expense and the employee-related and other costs are included in Other operating expense, net of the Consolidated Statements of Operations. There were no costs related to this program during the year ended December 31, 2017.
During the first quarter of 2019, the Company announced the closure of its St. Louis, Missouri office by June 28, 2019. This closure was completed during the second quarter of 2019.
Other Restructuring and Plant Closing Costs — The Company continually analyzes its plant network to align operations with the current and future needs of its customers. Facility closure decisions are made when the Company identifies opportunities to lower production costs or eliminate excess manufacturing capacity while maintaining a competitive cost structure, service levels, and product quality. Expenses associated with facility closures are primarily aggregated in Other operating expense, net of the Consolidated Statements of Operations, with the exception of asset-related costs, which are recorded in Cost of sales.
Below is a summary of costs by type associated with the other restructuring and plant closing costs:
|
| | | | | | | |
| | Year Ended December 31, |
| | 2018 | | 2017 |
| | (In millions) |
| Asset-related | $ | 1.3 |
| | $ | 1.3 |
|
| Employee-related | — |
| | 3.2 |
|
| Other closure costs | 0.3 |
| | 11.8 |
|
| Total | $ | 1.6 |
| | $ | 16.3 |
|
For the year ended December 31, 2018, asset-related costs primarily consisted of inventory dispositions. For the year ended December 31, 2017, asset-related costs consisted of accelerated depreciation; employee-related costs primarily consisted of severance; and other costs primarily consisted of third-party costs. Asset-related costs are included in Cost of sales and employee-related and other closure costs are recorded in Other operating expense, net in the Consolidated Statements of Operations. There were no costs associated with other restructuring and plant closing costs for the year ended December 31, 2019.
Charges related to other cost reduction activities that are not related to our plant closings above totaled $2.6 million and $5.9 million for the years ended December 31, 2018 and 2017, respectively. These charges were primarily the result of a Private Brands plant closure initiated prior to TreeHouse’s acquisition and severance-related costs.
TREEHOUSE FOODS, INC.
NOTES TO CONSOLIDATED FINANCIAL STATEMENTS – (Continued)
4. LEASES
The Company has operating and finance leases for manufacturing facilities, warehouses and distribution centers, office space, and certain equipment. Remaining lease terms for these leases range from 1 year to 13 years. Some of the Company’s leases include options to extend the leases for up to 29 years, and some include options to terminate the leases within 1 year.
The Company does not record leases with an initial term of 12 months or less on the balance sheet. Expense for these short-term leases is recognized on a straight-line basis over the lease term.
Supplemental balance sheet information related to leases was as follows:
|
| | | | | | |
| | | Balance Sheet Classification | | December 31, 2019 |
| | | | | (In millions) |
| Assets | | | | |
| Operating | | Operating lease right-of-use assets | | $ | 175.3 |
|
| Finance | | Property, plant, and equipment, net | | 3.9 |
|
| Total assets | | | | $ | 179.2 |
|
| | | | | |
| Liabilities | | | | |
| Current liabilities | | | | |
| Operating | | Accrued expenses | | $ | 32.0 |
|
| Finance | | Current portion of long-term debt | | 1.3 |
|
| Total current liabilities | | | | 33.3 |
|
| Noncurrent liabilities | | | | |
| Operating | | Operating lease liabilities | | 158.5 |
|
| Finance | | Long-term debt | | 2.6 |
|
| Total noncurrent liabilities | | | | 161.1 |
|
| Total lease liabilities | | | | $ | 194.4 |
|
Right-of-use assets and their corresponding lease liabilities are measured and recognized based on the present value of the future minimum lease payments over the lease term at the commencement date.
Discount Rates
The majority of the Company's leases do not provide an implicit rate; therefore, the Company uses its incremental borrowing rate based on the information available at the commencement date in determining the present value of future payments for those leases. The Company has elected the practical expedient to apply discount rates to its lease portfolio based on the portfolio approach. The Company grouped the leases into portfolios by remaining lease term.
As of December 31, 2019, the weighted-average discount rates for the Company's operating and finance leases were 4.7% and 3.5%, respectively.
Lease Payments
The Company includes lease payments under options to extend or terminate the lease in the measurement of the right-of-use asset and lease liability when it is reasonably certain that it will exercise such options. For operating leases, lease expense for minimum lease payments is recognized on a straight-line basis over the lease term. Fixed lease costs represent the explicitly quantified lease payments prescribed by the lease agreement and are included in the measurement of the right-of-use asset and corresponding lease liability. Variable lease payments that depend on an index or a rate are included in the calculation of the right-of-use asset and lease liability based on the index or rate at lease commencement. Other variable lease payments such as those that depend on the usage or performance of an underlying asset are not included in the measurement of the right-of-use asset or lease liability. The Company has elected the practical expedient to combine lease and nonlease components into a single component for all of its leases.
TREEHOUSE FOODS, INC.
NOTES TO CONSOLIDATED FINANCIAL STATEMENTS – (Continued)
As of December 31, 2019, the weighted-average remaining term of the Company's operating and finance leases was 7.9 years and 3.2 years, respectively.
The components of lease expense were as follows:
|
| | | | | | |
| | | Statement of Operations Classification | | Year Ended
December 31, 2019 |
| | | | | (In millions) |
| Operating lease cost | | Cost of sales and General and administrative | | $ | 46.6 |
|
| Finance lease cost: | | | | |
| Amortization of right-of-use assets | | Cost of sales and General and administrative | | 1.8 |
|
| Interest on lease liabilities | | Interest expense | | 0.1 |
|
| Total finance lease cost | | | | 1.9 |
|
| Variable lease cost (1) | | Cost of sales and General and administrative | | 9.3 |
|
| Net lease cost | | | | $ | 57.8 |
|
| |
| (1) | Includes short-term leases, which are immaterial. |
Rent expense under operating leases was $51.6 million and $50.2 million as of December 31, 2018 and 2017, respectively.
As of December 31, 2019, future maturities of lease liabilities were as follows:
|
| | | | | | | | |
| | | Operating Leases (1) | | Finance Leases |
| | | (In millions) |
| 2020 | | $ | 39.5 |
| | $ | 1.4 |
|
| 2021 | | 34.4 |
| | 1.3 |
|
| 2022 | | 27.6 |
| | 0.9 |
|
| 2023 | | 23.9 |
| | 0.3 |
|
| 2024 | | 18.4 |
| | 0.2 |
|
| Thereafter | | 90.4 |
| | — |
|
| Total lease payments | | 234.2 |
| | 4.1 |
|
| Less: Interest | | (43.7 | ) | | (0.2 | ) |
| Present value of lease liabilities | | $ | 190.5 |
| | $ | 3.9 |
|
| |
| (1) | Operating lease payments include $3.3 million related to options to extend lease terms that are reasonably certain of being exercised. |
As of December 31, 2018, the composition of capital leases, which are reflected as Property, plant, and equipment in the Consolidated Balance Sheets, is as follows:
|
| | | |
| | December 31, |
| | 2018 |
| | (in millions) |
| Machinery and equipment | $ | 5.1 |
|
| Less accumulated amortization | (3.2 | ) |
| Total | $ | 1.9 |
|
TREEHOUSE FOODS, INC.
NOTES TO CONSOLIDATED FINANCIAL STATEMENTS – (Continued)
Other information related to leases were as follows:
|
| | | | |
| | | Year Ended
December 31, 2019 |
| | | (In millions) |
| Cash paid for amounts included in the measurement of lease liabilities: | | |
| Operating cash flows from operating leases | | $ | 42.0 |
|
| Operating cash flows from finance leases | | 0.1 |
|
| Financing cash flows from finance leases | | 1.9 |
|
5. REVENUE RECOGNITION
We manufacture and sell food and beverage products to retailers, distributors, food manufacturers, and the foodservice business. Revenue recognition is completed on a point in time basis when product control is transferred to the customer. In general, control transfers to the customer when the product is shipped or delivered to the customer based upon applicable shipping terms. Customer contracts generally do not include more than one performance obligation and the performance obligations in our contracts are satisfied within one year. No payment terms beyond one year are granted at contract inception.
Most contracts also include some form of variable consideration. The most common forms of variable consideration include discounts, rebates, and sales returns and allowances. Variable consideration is treated as a reduction in revenue when product revenue is recognized. Depending on the specific type of variable consideration, we use either the expected value or most likely amount method to determine the variable consideration. The Company reviews and updates its estimates and related accruals of variable consideration each period based on the terms of the agreements, historical experience, and any recent changes in the market.
The Company does not have significant deferred revenue or unbilled receivable balances arising from transactions with customers. We do not capitalize contract inception costs, as contracts are one year or less. The Company does not incur significant fulfillment costs requiring capitalization. Shipping and handling costs associated with outbound freight are included within Selling and distribution expenses and are accounted for as a fulfillment cost as incurred, including shipping and handling costs after control over a product has transferred to a customer. Shipping and handling costs recorded as a component of selling and distribution expense were approximately $148.3 million, $199.2 million, and $184.8 million for the years ended December 31, 2019, 2018, and 2017, respectively. In addition, any taxes collected on behalf of government authorities are excluded from net revenues.
Segment revenue disaggregated by product category groups are as follows:
|
| | | | | | | | | | | |
| | Year Ended December 31, |
| | 2019 | | 2018 | | 2017 |
| | (In millions) |
| Center store grocery | $ | 1,763.1 |
| | $ | 1,871.9 |
| | $ | 1,980.0 |
|
| Main course (1) | 917.6 |
| | 999.7 |
| | 1,115.9 |
|
| Total Meal Preparation | 2,680.7 |
| | 2,871.6 |
| | 3,095.9 |
|
| Sweet & savory snacks | 1,220.1 |
| | 1,306.3 |
| | 1,324.3 |
|
| Beverages & drink mixes | 388.1 |
| | 409.9 |
| | 427.6 |
|
| Total Snacking & Beverages | 1,608.2 |
| | 1,716.2 |
| | 1,751.9 |
|
| Unallocated net sales (2) | — |
| | — |
| | 4.8 |
|
| Total net sales | $ | 4,288.9 |
| | $ | 4,587.8 |
| | $ | 4,852.6 |
|
(1) On May 22, 2017, the Company sold the soup and infant feeding business ("SIF"). Included within this category was $59.5 million of SIF related sales for the twelve months ended December 31, 2017.
(2) Represents product recall reimbursements that were received during the twelve months ended December 31, 2017.
6. RECEIVABLES SALES PROGRAM
In December 2017 and June 2019, the Company entered into agreements to sell certain trade accounts receivable to two unrelated, third-party financial institutions (collectively, the “Receivables Sales Program”). The agreements can be terminated by either party with 60 days' notice. The Company has no retained interest in the receivables sold under the Program; however,
TREEHOUSE FOODS, INC.
NOTES TO CONSOLIDATED FINANCIAL STATEMENTS – (Continued)
under the agreements the Company does have collection and administrative responsibilities for the sold receivables. Under the Program, the maximum amount of receivables that may be sold at any time is $300.0 million.
Receivables sold under the Program are de-recognized from the Company's Consolidated Balance Sheet at the time of the sale and the proceeds from such sales are reflected as a component of the change in receivables in the operating activities section of the Consolidated Statements of Cash Flows. The outstanding amount of accounts receivable sold under the Receivables Sales Program was $243.0 million and $177.0 million as of December 31, 2019 and December 31, 2018, respectively.
The loss on sale of receivables was $4.3 million, $3.8 million, and $0.2 million for the years ended December 31, 2019, 2018, and 2017, respectively, and is included in Other expense (income), net in the Consolidated Statements of Operations. The Company has not recognized any servicing assets or liabilities as of December 31, 2019 or December 31, 2018, as the fair value of the servicing arrangement as well as the fees earned were not material to the financial statements.
As of December 31, 2019 and December 31, 2018, the Company had collected but not yet remitted to the financial institutions $158.3 million and $119.3 million, respectively. These amounts were included in Accounts payable in the Consolidated Balance Sheets.
7. INVENTORIES
|
| | | | | | | |
| | December 31, |
| | 2019 | | 2018 |
| | (In millions) |
| Raw materials and supplies | $ | 205.5 |
| | $ | 234.2 |
|
| Finished goods | 338.5 |
| | 381.4 |
|
| Total inventories | $ | 544.0 |
| | $ | 615.6 |
|
In order to align inventory valuation methods across the Company, effective April 1, 2019, the Company changed its method of valuing its Pickle inventory in its Meal Preparation segment from the last-in, first-out (LIFO) method to the first-in, first-out (FIFO) method. After adopting the change, all of the Company's inventory is now valued using the FIFO method. The Company believes that the FIFO method is preferable since it more accurately reflects the current market value of inventory presented on the Company's Consolidated Balance Sheets, improves comparability with the Company's peers, and results in consistency across its operations with respect to the method of inventory valuation. Prior period information included in this Form 10-K has been adjusted to apply the FIFO method retrospectively. As a result of the retrospective change, retained earnings as of January 1, 2017 increased $14.4 million. This change did not affect the Company's previously reported cash flows from operating, investing, or financing activities.
The impact of the change from LIFO to FIFO on the Company's Consolidated Statements of Operations and Comprehensive Loss is summarized below:
|
| | | | | | | | | | | | | | | | | | | | | | | |
| | Year Ended December 31, 2018 | | Year Ended December 31, 2017 |
| | As Reported | | Adjustment | | As Adjusted | | As Reported | | Adjustment | | As Adjusted |
| | (In millions, except per share data) |
| Cost of sales | $ | 3,691.6 |
| | $ | 4.0 |
| | $ | 3,695.6 |
| | $ | 3,879.3 |
| | $ | (4.8 | ) | | $ | 3,874.5 |
|
| Operating income (loss) | 87.4 |
| | (4.0 | ) | | 83.4 |
| | 74.4 |
| | 4.8 |
| | 79.2 |
|
| Income tax benefit | (10.4 | ) | | (1.0 | ) | | (11.4 | ) | | (137.9 | ) | | (1.9 | ) | | (139.8 | ) |
| Net (loss) income from continuing operations | (43.2 | ) | | (3.0 | ) | | (46.2 | ) | | 104.5 |
| | 6.8 |
| | 111.3 |
|
| Comprehensive (loss) income | (97.0 | ) | | (3.0 | ) | | (100.0 | ) | | (246.5 | ) | | 6.8 |
| | (239.7 | ) |
| Net (loss) earnings per common share from continuing operations - basic | $ | (0.78 | ) | | $ | (0.05 | ) | | $ | (0.83 | ) | | $ | 1.83 |
| | $ | 0.12 |
| | $ | 1.95 |
|
| Net (loss) earnings per common share from continuing operations - diluted | $ | (0.78 | ) | | $ | (0.05 | ) | | $ | (0.83 | ) | | $ | 1.81 |
| | $ | 0.12 |
| | $ | 1.93 |
|
TREEHOUSE FOODS, INC.
NOTES TO CONSOLIDATED FINANCIAL STATEMENTS – (Continued)
The impact of the change on the Company's Consolidated Balance Sheets as of December 31, 2018 is as follows:
|
| | | | | | | | | | | | |
| | | Year Ended December 31, 2018 |
| | | As Reported | | Adjustment | | As Adjusted |
| | | (in millions) |
| Inventories | | $ | 591.5 |
| | $ | 24.1 |
| | $ | 615.6 |
|
| Deferred income taxes | | 160.1 |
| | 6.0 |
| | 166.1 |
|
| Retained earnings | | 185.9 |
| | 18.1 |
| | 204.0 |
|
8. DISCONTINUED OPERATIONS AND OTHER DIVESTITURES
Discontinued Operations
Snacks
During the second quarter of 2019, due to changes in market price expectations for the sale of the Company's Snacks division, the Company assessed the recoverability of the carrying value of the long-lived assets associated with the asset group. This assessment resulted in total long-lived asset impairment losses of $66.5 million, comprised of $63.2 million of property, plant, and equipment impairment losses and $3.3 million of intangible asset impairment losses. These losses result from the estimated fair value of the Snacks asset group, which was determined by its estimated discounted cash flows. These cash flows represent Level 3 inputs under ASC 820. These impairment charges are included in Net loss from discontinued operations in the Consolidated Statements of Operations.
On August 1, 2019, the Company completed the sale of our Snacks division to Atlas Holdings, LLC. ("Atlas") for $90 million in cash, subject to customary purchase price adjustments. The Company classified the proceeds within Net cash provided by (used in) investing activities - discontinued operations and used the net proceeds of the sale to pay down debt. The Company recognized a non-cash pre-tax loss on the transaction upon closing of $98.4 million, which is recognized as a component of Net loss from discontinued operations in the Consolidated Statements of Operations. For tax purposes, the sale has resulted in an estimated capital loss of $586.9 million. As a result, we have established a deferred tax asset of $149.3 million. A full valuation allowance was recorded against the deferred tax asset as we have not met the accounting requirements for recognition of a benefit at this time. The sale of this business is part of the Company's strategy to pursue portfolio optimization. The Snacks division operated three plants located in Robersonville, North Carolina; El Paso, Texas; and Dothan, Alabama. A fourth plant in Minneapolis, Minnesota was not included with the sale and closed during the third quarter of 2019.
The Company entered into a Transition Services Agreement ("TSA") with Atlas, which is designed to ensure and facilitate an orderly transfer of business operations. The services provided under the TSA will terminate at various times between six and twelve months from the date of sale and can be renewed with a maximum of an additional twelve-month period for certain services. The income received under the TSA was not material for the year ended December 31, 2019 and is primarily classified within General and administrative expenses or Cost of sales in the Company's Consolidated Statements of Operations depending on the functions being supported by the Company. Except for customary post-closing adjustments and transition services, the Company has no continuing involvement with Atlas subsequent to the completion of the sale.
Ready-to-eat Cereal
On May 1, 2019, the Company entered into a definitive agreement to sell its RTE Cereal business, which until that time had been a component of the Meal Preparation reporting segment. The sale of this business is part of the Company's strategy to pursue portfolio optimization. On December 19, 2020, the Federal Trade Commission ("FTC") objected to the sale to Post. On December 23, 2019, the Company and Post then extended the sale agreement until January 31, 2020. On January 13, 2020, the sale to Post was terminated and the Company announced its intention to pursue a sale of the RTE business to alternative buyers.
The Company continues to classify the RTE Cereal business as a discontinued operation as of December 31, 2019. The expected disposal loss for the RTE Cereal business is remeasured each quarter at the lower of carrying value or estimated fair value less costs to sell and is included in the valuation allowance in the balance sheet. The Company has recognized the expected disposal loss as an impairment charge of $74.5 million during the year ended December 31, 2019. The impairment is classified as a component of Net loss from discontinued operations in the Consolidated Statements of Operations. Completion of the sale may be for amounts that could be significantly different from the current fair value estimate. The Company's estimate of fair value will be evaluated and recognized each reporting period until the divestiture is complete.
TREEHOUSE FOODS, INC.
NOTES TO CONSOLIDATED FINANCIAL STATEMENTS – (Continued)
The Company has reflected the Snacks division (through the date of sale) and RTE Cereal business as discontinued operations for all periods presented. Unless otherwise noted, amounts and disclosures throughout these Notes to Consolidated Financial Statements relate to the Company's continuing operations.
Results of discontinued operations were as follows:
|
| | | | | | | | | | | | |
| | | Year Ended December 31, |
| | | 2019 | | 2018 | | 2017 |
| | | (in millions) |
| Net sales | | $ | 638.0 |
| | $ | 1,226.6 |
| | $ | 1,454.1 |
|
| Cost of sales | | 619.5 |
| | 1,167.4 |
| | 1,346.9 |
|
| Selling, general, administrative and other operating expenses | | 55.2 |
| | 78.7 |
| | 103.6 |
|
| Asset impairment | | 141.0 |
| | — |
| | 490.7 |
|
| Loss on sale of business | | 98.4 |
| | — |
| | — |
|
| Operating loss from discontinued operations | | (276.1 | ) | | (19.5 | ) | | (487.1 | ) |
| Interest and other expense | | 7.7 |
| | 11.7 |
| | 4.1 |
|
| Income tax benefit | | (33.1 | ) | | (13.0 | ) | | (100.4 | ) |
| Net loss from discontinued operations | | $ | (250.7 | ) | | $ | (18.2 | ) | | $ | (390.8 | ) |
Assets and liabilities of discontinued operations presented in the Consolidated Balance Sheets as of December 31, 2019 and 2018 include the following:
|
| | | | | | | | |
| | | December 31, 2019 | | December 31, 2018 |
| | | (in millions) |
| Inventories | | $ | 41.6 |
| | $ | 248.2 |
|
| Prepaid expenses and other assets | | — |
| | 8.2 |
|
| Property, plant, and equipment, net | | 64.4 |
| | 132.1 |
|
| Operating lease right-of-use assets | | 7.5 |
| | — |
|
| Goodwill | | 53.5 |
| | 53.5 |
|
| Intangible assets | | 38.6 |
| | 43.8 |
|
| Valuation allowance | | (74.5 | ) | | — |
|
| Total assets of discontinued operations | | $ | 131.1 |
| | $ | 485.8 |
|
| | | | | |
| Accrued expenses and other liabilities | | $ | 8.3 |
| | $ | 6.0 |
|
| Operating lease liabilities | | 8.2 |
| | — |
|
| Total liabilities of discontinued operations | | $ | 16.5 |
| | $ | 6.0 |
|
Other Divestitures
In-Store Bakery Facilities
During the fourth quarter of 2019, the Company reached the decision to sell two of its In-Store Bakery facilities located in Fridley, Minnesota and Lodi, California, which manufacture breads, rolls, and cakes for in-store retail bakeries and foodservice customers. These two facilities are included within the Snacking & Beverages reporting segment. The Company determined the associated assets met the held for sale accounting criteria as of December 31, 2019 and were classified accordingly in the Consolidated Balance Sheets. These two facilities did not meet the criteria to be presented as a discontinued operation.
The disposal group was measured at fair value, and the Company recognized the expected disposal loss as an impairment charge of $41.1 million during the year ended December 31, 2019, as the fair value was determined to be less than the carrying value of the associated assets, including the related goodwill. The impairment is recognized within Asset impairment in the Consolidated Statements of Operations.
TREEHOUSE FOODS, INC.
NOTES TO CONSOLIDATED FINANCIAL STATEMENTS – (Continued)
On January 10, 2020, the Company entered into a definitive agreement to sell these facilities. The transaction is subject to customary closing conditions and is expected to close during the second quarter of 2020.
The following table represents detail of assets held for sale as of December 31, 2019:
|
| | | | |
| | | December 31, 2019 |
| | | (in millions) |
| Inventories | | $ | 9.4 |
|
| Property, plant, and equipment, net | | 40.9 |
|
| Goodwill | | 5.7 |
|
| Intangible assets, net | | 9.4 |
|
| Valuation allowance | | (41.1 | ) |
| Total assets held for sale | | $ | 24.3 |
|
The Company also had $2.7 million of assets classified as held for sale as of December 31, 2019 related to the closure of the Minneapolis, Minnesota facility. The sale of these assets is expected by the third quarter of 2020. There was no impairment related to the reclassification of these assets to assets held for sale.
McCann's Business
On July 16, 2018, the Company completed the divestiture of its McCann's business. The McCann's business produced steel cut Irish oatmeal and was previously reported within the Meal Preparation segment. This divestiture did not meet the criteria to be presented as a discontinued operation. The Company recognized a gain upon divestiture of $14.3 million within Other operating expense, net in the Consolidated Statements of Operations during the year ended December 31, 2018.
SIF Business
On May 22, 2017, the Company completed the divestiture of its SIF business. The SIF business produced private label condensed and ready-to-serve soup, baby food, and gravies for the Meal Preparation segment. This divestiture did not meet the criteria to be presented as a discontinued operation. The Company recognized a loss upon divestiture of $86.0 million within Other operating expense, net in the Consolidated Statements of Operations during the year ended December 31, 2017.
9. PROPERTY, PLANT, AND EQUIPMENT
|
| | | | | | | |
| | December 31, |
| | 2019 | | 2018 |
| | (In millions) |
| Land | $ | 53.7 |
| | $ | 61.6 |
|
| Buildings and improvements | 401.2 |
| | 421.8 |
|
| Machinery and equipment | 1,230.1 |
| | 1,201.9 |
|
| Construction in progress | 73.8 |
| | 99.2 |
|
| Total | 1,758.8 |
| | 1,784.5 |
|
| Less accumulated depreciation | (713.6 | ) | | (642.2 | ) |
| Property, plant, and equipment, net | $ | 1,045.2 |
| | $ | 1,142.3 |
|
During the fourth quarter of 2019, the Company reclassified $40.9 million of property, plant, and equipment to assets held for sale related to the In-Store Bakery facilities divestiture. Refer to Note 8 for additional information.
Asset Impairment
We evaluate property, plant, and equipment and finite lived intangible assets for impairment when circumstances indicate that their carrying values may not be recoverable. Indicators of impairment include deteriorations in operating cash flows, the anticipated sale or disposal of an asset group, and other significant changes in business conditions.
TREEHOUSE FOODS, INC.
NOTES TO CONSOLIDATED FINANCIAL STATEMENTS – (Continued)
During 2019, our assessment indicated an impairment in our Cookies and Dry Dinners asset groups, within the Snacking & Beverages and Meal Preparation segments, respectively, driven by the historical and forecasted performance of these businesses. As a result, we recognized $42.8 million of property, plant, and equipment impairment losses and $45.2 million of finite lived intangible asset impairment. The impairment charges are included in Asset impairment in the Consolidated Statements of Operations.
Impairment charges are measured by comparing the carrying values of the asset groups to their estimated fair values. The fair value of these assets were based on expected future cash flows using Level 3 inputs under ASC 820. We can provide no assurance regarding the prospect of additional impairment charges in future periods.
Depreciation expense was $136.5 million, $145.0 million, and $147.4 million in 2019, 2018, and 2017, respectively.
10. GOODWILL AND INTANGIBLE ASSETS
In connection with the change in organizational structure completed in the first quarter of 2019 (the “2019 Segment Change”), the Company allocated goodwill and accumulated impairment loss balances as of January 1, 2019 between reporting units using a relative fair value allocation approach. The change was considered a triggering event indicating a test for goodwill impairment was required as of January 1, 2019. The Company performed the impairment test, which did not result in the identification of any impairment losses.
In connection with the change in organizational structure completed in the first quarter of 2020 (the “2020 Segment Change”), the Company allocated goodwill and accumulated impairment loss balances as of January 1, 2020 between reporting units using a relative fair value allocation approach. The change was considered a triggering event indicating a test for goodwill impairment was required as of January 1, 2020. The Company performed the impairment test, which did not result in the identification of any impairment losses. As a result of the 2020 Segment Change, the Company has the following two reportable segments: Meal Preparation and Snacking & Beverages. See Note 22 for more information regarding the 2020 Segment Change.
During 2019, all prior period information was originally recast to reflect the 2019 Segment Change. Upon the 2020 Segment Change, all prior period information was recast to reflect this change in reportable segments and as such, the information herein no longer presents the 2019 Segment Change.
Changes in the carrying amount of goodwill for the years ended December 31, 2019 and 2018 are as follows:
|
| | | | | | | | | | | | |
| | | Meal Preparation | | Snacking & Beverages | | Total |
| | (in millions) |
| Balance at January 1, 2018 | | $ | 1,278.0 |
| | $ | 895.0 |
| | $ | 2,173.0 |
|
| Accumulated impairment losses | | (11.5 | ) | | (33.0 | ) | | (44.5 | ) |
| Divestiture | | (10.6 | ) | | — |
| | (10.6 | ) |
| Foreign currency translation | | (5.8 | ) | | (4.2 | ) | | (10.0 | ) |
| Balance at December 31, 2018 | | 1,250.1 |
| | 857.8 |
| | 2,107.9 |
|
| Reclassification to assets held for sale (1) | | — |
| | (5.7 | ) | | (5.7 | ) |
| Foreign currency translation | | 2.9 |
| | 2.2 |
| | 5.1 |
|
| Balance at December 31, 2019 | | $ | 1,253.0 |
| | $ | 854.3 |
| | $ | 2,107.3 |
|
(1) Relates to the reclassification of goodwill allocated to the In-Store Bakery facilities divestiture. Refer to Note 8 for additional information.
The Company performed the annual impairment assessment on goodwill as of December 31, 2019 and 2018, noting no impairment losses.
Upon completion of the annual goodwill impairment analysis as of December 31, 2017, the Company recorded impairment losses of $33.0 million related to the Snacks reporting unit. This reporting unit did not achieve the forecasted results for the year ended December 31, 2017. The Company finalized its budgeting process in the fourth quarter which resulted in reduced future revenue and profitability expectations. The primary factor impacting the future revenue and profitability expectations for the Snacks reporting unit was competitive pressures. These changes in expectations and the related reductions in discounted
TREEHOUSE FOODS, INC.
NOTES TO CONSOLIDATED FINANCIAL STATEMENTS – (Continued)
future cash flows resulted in book values that exceeded the fair values for these reporting units, which required the recognition of impairment losses. The Company early adopted ASU 2017-04, Simplifying the Test for Goodwill Impairment, during the fourth quarter of 2017; therefore, the income approach was used to calculate the impairment. This approach utilizes projected cash flow estimates developed by the Company to determine fair value, which are unobservable, Level 3 inputs. Unobservable inputs are used to measure fair value to the extent that relevant observable inputs are not available. The Company developed its estimates using the best information available at the time. As a result of the change in organizational structure completed in the first quarter of 2019, the Company allocated this impairment loss from the Snacks reporting unit to the Snacking & Beverages segment. The goodwill impairment losses are included in Asset impairment of the Consolidated Statements of Operations.
Approximately $368.7 million of goodwill is deductible for tax purposes.
Indefinite-lived Intangible Assets
The Company has $22.0 million and $21.4 million of trademarks with indefinite lives as of December 31, 2019 and 2018, respectively.
The Company performed the annual impairment assessment on indefinite-lived intangibles as of December 31, 2019 and 2018, resulting in no impairment losses. The fair value of one of our trademarks with a book value of $16.0 million as of December 31, 2019 exceeds its book value by 10%. Based on our plans for this product line, we do not anticipate impairment of this trademark in the foreseeable future. However, if our expectations are not met or certain factors outside of our control, such as discount rates, change then this trademark could become impaired. The remainder of the Company's indefinite-lived trademarks had fair values in excess of book value of greater than 10%. Changes in our estimates or any of our other assumptions used in our analysis could result in a different conclusion.
Finite-lived Intangible Assets
The gross carrying amounts and accumulated amortization of intangible assets, with finite lives, as of December 31, 2019 and 2018 are as follows.
|
| | | | | | | | | | | | | | | | | | | | | | | |
| | December 31, |
| | 2019 | | 2018 |
| | Gross Carrying Amount | | Accumulated Amortization | | Net Carrying Amount | | Gross Carrying Amount | | Accumulated Amortization | | Net Carrying Amount |
| | (In millions) |
| Intangible assets with finite lives: | |
| | |
| | |
| | |
| | |
| | |
|
| Customer-related | $ | 778.1 |
| | $ | (355.2 | ) | | $ | 422.9 |
| | $ | 861.6 |
| | $ | (334.0 | ) | | $ | 527.6 |
|
| Contractual agreements | 0.5 |
| | (0.5 | ) | | — |
| | 0.5 |
| | (0.5 | ) | | — |
|
| Trademarks | 53.0 |
| | (27.1 | ) | | 25.9 |
| | 52.8 |
| | (22.5 | ) | | 30.3 |
|
| Formulas/recipes | 22.1 |
| | (19.2 | ) | | 2.9 |
| | 23.4 |
| | (17.0 | ) | | 6.4 |
|
| Computer software | 179.0 |
| | (98.0 | ) | | 81.0 |
| | 154.4 |
| | (83.7 | ) | | 70.7 |
|
| Total finite lived intangibles | $ | 1,032.7 |
| | $ | (500.0 | ) | | $ | 532.7 |
| | $ | 1,092.7 |
| | $ | (457.7 | ) | | $ | 635.0 |
|
During the fourth quarter of 2019, the Company reclassified $9.4 million of primarily customer-related intangible assets to assets held for sale related to the In-Store Bakery facilities divestiture. Refer to Note 8 for additional information.
The Company routinely evaluates the useful life attributed to its assets. During the second quarter ended June 30, 2019, the Company determined that the useful lives of certain computer software should be increased from seven years to ten years based on historical experience related to the use of this software and our expectation of its future usability. The Company accounted for this as a change in estimate that was applied prospectively, effective as of April 1, 2019. This change in useful life resulted in a reduction of amortization expense of $5.0 million, and an increase in both basic and diluted earnings per share of $0.06, during the twelve months ended December 31, 2019.
Asset Impairment
During the third quarter of 2019, we recognized $45.2 million of finite lived intangible asset impairment. Refer to Note 9 for additional information.
TREEHOUSE FOODS, INC.
NOTES TO CONSOLIDATED FINANCIAL STATEMENTS – (Continued)
In the fourth quarter of 2017, the Company determined the carrying value of certain long-lived assets may not be recoverable due to the decline in forecasted future cash flows in the Bars asset group within the Snacks division. As a result, we evaluated long-lived assets for impairment and determined that the book value of the customer-related assets in this asset group were not recoverable. The customer-related assets were determined to have no fair value using an excess earnings approach and an impairment charge of $26.0 million was recorded on all remaining Bars customer-related assets. The excess earnings approach calculates the Company’s earnings above an expected return on the Company’s tangible assets. This approach utilizes projected cash flow estimates developed by the Company to determine fair value, which are unobservable, Level 3 inputs. Unobservable inputs are used to measure fair value to the extent that relevant observable inputs are not available. The Company developed our earnings estimates using the best information available at the time. No other impairments were identified related to the remaining long-lived assets of asset groups. The impairment is included in Asset impairment in the Consolidated Statements of Operations. As a result of the change in organizational structure completed in the first quarter of 2019, the Company moved the Bars asset group from the Snacks division to the Snacking & Beverages segment.
There were no other impairments related to finite lived intangibles.
Considerable management judgment is necessary to evaluate the impact of operating changes and to estimate future cash flows. Assumptions used in our impairment evaluations, such as forecasted growth rates and our cost of capital, are consistent with our internal projections and operating plans.
Estimated amortization expense on intangible assets for the next five years is as follows:
|
| | | |
| | (In millions) |
| 2020 | $ | 63.9 |
|
| 2021 | 61.5 |
|
| 2022 | 58.0 |
|
| 2023 | 57.6 |
|
| 2024 | 56.8 |
|
11. ACCRUED EXPENSES
Accrued expenses consist of:
|
| | | | | | | |
| | | | |
| | December 31, 2019 | | December 31, 2018 |
| | (In millions) |
| Payroll and benefits | $ | 50.4 |
| | $ | 108.5 |
|
| Trade promotion liabilities | 37.9 |
| | 45.7 |
|
| Operating lease liabilities | 32.0 |
| | — |
|
| Interest | 20.0 |
| | 19.1 |
|
| Taxes | 14.5 |
| | 9.7 |
|
| Health insurance, workers' compensation, and other insurance costs | 23.9 |
| | 29.1 |
|
| Derivative contracts | 57.2 |
| | 20.8 |
|
| Other accrued liabilities | 37.3 |
| | 19.6 |
|
| Total | $ | 273.2 |
| | $ | 252.5 |
|
12. INCOME TAXES
The components of loss before income taxes are as follows:
|
| | | | | | | | | | | |
| | Year Ended December 31, |
| | 2019 | | 2018 | | 2017 |
| | (in millions) |
| Domestic | $ | (154.4 | ) | | $ | (72.5 | ) | | $ | (48.3 | ) |
| Foreign | (1.4 | ) | | 14.9 |
| | 19.8 |
|
| Loss before income taxes | $ | (155.8 | ) | | $ | (57.6 | ) | | $ | (28.5 | ) |
TREEHOUSE FOODS, INC.
NOTES TO CONSOLIDATED FINANCIAL STATEMENTS – (Continued)
The following table presents the components of the 2019, 2018, and 2017 provision for income taxes:
|
| | | | | | | | | | | |
| | Year Ended December 31, |
| | 2019 | | 2018 | | 2017 |
| | (in millions) |
| Current: | |
| | |
| | |
|
| Federal | $ | 13.2 |
| | $ | (9.0 | ) | | $ | (17.7 | ) |
| State | 2.9 |
| | 5.5 |
| | (2.7 | ) |
| Foreign | 1.7 |
| | 8.9 |
| | 10.7 |
|
| Total current | 17.8 |
| | 5.4 |
| | (9.7 | ) |
| Deferred: | | | | | |
| Federal | (48.4 | ) | | (6.0 | ) | | (125.1 | ) |
| State | (11.8 | ) | | (6.6 | ) | | (3.6 | ) |
| Foreign | (3.1 | ) | | (4.2 | ) | | (1.4 | ) |
| Total deferred | (63.3 | ) | | (16.8 | ) | | (130.1 | ) |
| Total income tax benefit | $ | (45.5 | ) | | $ | (11.4 | ) | | $ | (139.8 | ) |
The following is a reconciliation of income tax benefit computed at the U.S. federal statutory tax rate to the income tax benefit reported in the Consolidated Statements of Operations:
|
| | | | | | | | | | | |
| | Year Ended December 31, |
| | 2019 | | 2018 | | 2017 |
| | (in millions) |
| Tax at statutory rate | $ | (32.7 | ) | | $ | (12.1 | ) | | $ | (10.0 | ) |
| State income taxes | (7.1 | ) | | (0.3 | ) | | (4.1 | ) |
| Tax benefit of cross-border intercompany financing structure | (2.1 | ) | | (2.3 | ) | | (3.9 | ) |
| Repatriation of intangibles | (4.6 | ) | | — |
| | — |
|
| Meals and entertainment | 0.2 |
| | 0.3 |
| | 0.8 |
|
| Disallowed officers' compensation | 1.6 |
| | 6.3 |
| | 0.5 |
|
| Excess tax benefits related to stock-based compensation | (0.1 | ) | | 0.8 |
| | (2.4 | ) |
| Section 956 inclusion, Section 78 gross-up | (0.1 | ) | | (0.2 | ) | | 13.2 |
|
| Goodwill impairment | 1.2 |
| | — |
| | 14.4 |
|
| Gain on divestiture | — |
| | 2.2 |
| | — |
|
| Remeasurement of deferred tax assets/liabilities | — |
| | (1.0 | ) | | (117.6 | ) |
| Transition tax | (1.9 | ) | | (0.4 | ) | | 9.6 |
|
| Foreign tax credit | — |
| | (0.1 | ) | | (29.7 | ) |
| Other tax credits | (0.9 | ) | | (1.3 | ) | | (0.8 | ) |
| Valuation allowance | 3.4 |
| | (1.1 | ) | | 3.5 |
|
| Uncertain tax positions | (2.5 | ) | | (2.9 | ) | | (4.5 | ) |
| Step-up in goodwill tax basis | (0.4 | ) | | (0.4 | ) | | (1.8 | ) |
| Return-to-provision | 0.1 |
| | (0.6 | ) | | (6.3 | ) |
| Other, net | 0.4 |
| | 1.7 |
| | (0.7 | ) |
| Total provision for income taxes | $ | (45.5 | ) | | $ | (11.4 | ) | | $ | (139.8 | ) |
TREEHOUSE FOODS, INC.
NOTES TO CONSOLIDATED FINANCIAL STATEMENTS – (Continued)
The tax effects of temporary differences giving rise to deferred income tax assets and liabilities were:
|
| | | | | | | |
| | December 31, |
| | 2019 | | 2018 |
| | (In millions) |
| Deferred tax assets: | |
| | |
| Pension and postretirement benefits | $ | 16.7 |
| | $ | 18.0 |
|
| Accrued liabilities | 21.4 |
| | 34.0 |
|
| Stock compensation | 12.6 |
| | 12.0 |
|
| Lease liabilities | 51.4 |
| | — |
|
| Interest limitation carryover | 30.3 |
| | 13.3 |
|
| Loss and credit carryovers | 201.7 |
| | 43.9 |
|
| Other | 27.6 |
| | 17.1 |
|
| Total deferred tax assets | 361.7 |
| | 138.3 |
|
| Valuation allowance | (167.9 | ) | | (15.1 | ) |
| Total deferred tax assets, net of valuation allowance | 193.8 |
| | 123.2 |
|
| | | | |
| Deferred tax liabilities: | | | |
| Fixed assets and intangible assets | (238.2 | ) | | (284.3 | ) |
| Lease assets | (50.5 | ) | | — |
|
| Inventory reserves | (2.5 | ) | | (5.0 | ) |
| Total deferred tax liabilities | (291.2 | ) | | (289.3 | ) |
| Net deferred income tax liability | $ | (97.4 | ) | | $ | (166.1 | ) |
The following table details the Company's tax attributes primarily related to net operating losses, tax credits, and capital losses for which it has recorded deferred tax assets:
|
| | | | | | | | | | |
| Tax Attributes | | Gross Attribute Amount | | Net Attribute Amount | | Expiration Years |
| | | (in millions) | | |
| U.S. net operating losses | | $ | 1.0 |
| | $ | 0.2 |
| | 2034 |
| Foreign net operating losses | | 45.5 |
| | 11.5 |
| | 2028 – 2039 |
| State net operating losses | | 204.6 |
| | 6.8 |
| | 2021 - 2039 |
| Federal credits | | — |
| | 14.1 |
| | 2027 |
| State credits | | — |
| | 15.4 |
| | 2020 – 2034 |
| Federal capital loss | | 586.9 |
| | 123.2 |
| | 2024 |
| State capital loss | | 586.9 |
| | 26.1 |
| | 2024 |
| Other | | | | 4.4 |
| | 2022-2036 |
| Total | | | | $ | 201.7 |
| | |
The Company assessed the realizability of its deferred tax assets and has recorded valuation allowances for certain foreign non-capital loss carryforwards, state net operating loss carryforwards, and state tax credit carryforwards that will more likely than not expire unused. In addition, as described in Note 8, the Company has recorded a full valuation allowance against the deferred tax asset of $149.3 million it established for its capital loss resulting from the sale of the Snacks division.
The Company or one of its subsidiaries files income tax returns in the U.S., Canada, Italy, and various U.S. states. In the U.S. federal jurisdiction, the Company is open to examination for the tax year ended December 31, 2016 and forward; for Canadian purposes, the Company is open to examination for the tax year ended December 31, 2011 and forward; for Italian purposes, the Company is open to examination for the tax years ended May 31, 2015 and forward; and for the various U.S. states the Company is generally open to examination for the tax year ended December 31, 2012 and forward.
TREEHOUSE FOODS, INC.
NOTES TO CONSOLIDATED FINANCIAL STATEMENTS – (Continued)
Our Canadian operations are under exam by the Canadian Revenue Agency (“CRA”) for tax years 2011 through 2015. These examinations are expected to be completed in 2020. In the second quarter of 2019, the Company's Italian subsidiary applied for and received amnesty from the Italian Revenue Agency to settle pending litigation related to its 2007 through 2009, 2013, and 2014 tax years. The settlement resulted in a nominal additional tax payment, which was indemnified by the previous owner of the Italian business. The Company has examinations in process with various state taxing authorities, which are expected to be completed in 2020.
During the year, the Company recorded adjustments to its unrecognized tax benefits. A reconciliation of the beginning and ending amount of unrecognized tax benefits is as follows:
|
| | | | | | | | | | | |
| | Year Ended December 31, |
| | 2019 | | 2018 | | 2017 |
| | (in millions) |
| Unrecognized tax benefits beginning balance | $ | 17.3 |
| | $ | 26.4 |
| | $ | 31.4 |
|
| Additions (reductions) based on tax positions related to the current year | — |
| | — |
| | 1.1 |
|
| Additions (reductions) based on tax positions of prior years | (1.1 | ) | | (0.6 | ) | | 0.4 |
|
| Reductions resulting from dispositions | (1.1 | ) | | — |
| | — |
|
| Reductions due to statute lapses | (2.8 | ) | | (8.3 | ) | | (4.6 | ) |
| Reductions related to settlements with taxing authorities | (0.1 | ) | | — |
| | (2.0 | ) |
| Foreign currency translation | 0.1 |
| | (0.2 | ) | | 0.1 |
|
| Unrecognized tax benefits ending balance | $ | 12.3 |
| | $ | 17.3 |
| | $ | 26.4 |
|
Unrecognized tax benefits are included in Other long-term liabilities of the Consolidated Balance Sheets. Of the amount accrued at December 31, 2019 and 2018, $3.4 million and $3.8 million, respectively, would impact net income when settled. Of the amounts accrued at December 31, 2019 and 2018, $9.9 million and $11.6 million, respectively, relates to unrecognized tax benefits assumed in prior acquisitions, which have been indemnified by the previous owners.
Management estimates that it is reasonably possible that the total amount of unrecognized tax benefits could decrease by as much as $4.9 million within the next 12 months, primarily as a result of the resolution of audits currently in progress and the lapsing of statutes of limitations. Approximately $0.3 million of the $4.9 million would affect net income when settled.
The Company recognizes interest expense (income) and penalties related to unrecognized tax benefits in income tax expense. During the years ended December 31, 2019, 2018, and 2017, the Company recognized $(0.2) million, $(0.2) million, and $0.9 million of interest and penalties in income tax expense from continuing operations, respectively. The Company has accrued approximately $3.9 million and $4.2 million for the payment of interest and penalties at December 31, 2019 and 2018, respectively, of which $3.7 million and $4.1 million is indemnified.
13. LONG-TERM DEBT
|
| | | | | | | |
| | December 31, |
| | 2019 | | 2018 |
| | (In millions) |
| | | | |
| Term Loan A | $ | 458.4 |
| | $ | 488.8 |
|
| Term Loan A-1 | 681.6 |
| | 851.2 |
|
| 2022 Notes | 375.9 |
| | 375.9 |
|
| 2024 Notes | 602.9 |
| | 602.9 |
|
| Finance leases | 3.9 |
| | 2.5 |
|
| Total outstanding debt | 2,122.7 |
| | 2,321.3 |
|
| Deferred financing costs | (15.7 | ) | | (22.7 | ) |
| Less current portion | (15.3 | ) | | (1.2 | ) |
| Total long-term debt | $ | 2,091.7 |
| | $ | 2,297.4 |
|
TREEHOUSE FOODS, INC.
NOTES TO CONSOLIDATED FINANCIAL STATEMENTS – (Continued)
The scheduled maturities of outstanding debt, excluding deferred financing costs, at December 31, 2019 are as follows (in millions):
|
| | | |
| 2020 | $ | 15.3 |
|
| 2021 | 15.2 |
|
| 2022 | 390.8 |
|
| 2023 | 659.9 |
|
| 2024 | 608.1 |
|
| Thereafter | 433.4 |
|
| Total outstanding debt | $ | 2,122.7 |
|
During the year ended December 31, 2018, the Company repurchased $24.1 million and $172.1 million of its 2022 Notes and 2024 Notes, respectively. The Company wrote off $2.4 million of debt issuance costs and recorded a loss on debt extinguishment of $4.2 million related to the repurchases, recorded within Interest expense and Other expense (income), net of the Consolidated Statement of Operations, respectively. There were no amounts repurchased during the years ended December 31, 2019 or 2017.
Credit Agreement
On December 1, 2017, the Company entered into the Second Amended and Restated Credit Agreement (the “Credit Agreement”) which amends, restates, and replaces the Company’s prior credit agreement, dated as of February 1, 2016 (as amended from time to time prior to February 1, 2016, the “Prior Credit Agreement”). As amended, the senior unsecured credit facility includes a revolving credit facility (the “Revolving Credit Facility” or the “Revolver”) and two term loans. The Credit Agreement (1) extended the maturity dates of the Revolving Credit Facility, Term Loan A, and Term Loan A-1, (2) resized the Revolver from $900 million to $750 million, (3) consolidated three term loans into two, (4) tightened pricing, and (5) modified the fee structure on the Revolving Credit Facility to now calculate based on the unused portion of the commitments under the Revolving Credit Facility rather than the total commitments under the Revolving Credit Facility.
On June 11, 2018, the Company entered into Amendment No. 1 (the “Amendment”) to the Credit Agreement. Under the Amendment, among other things, (i) the leverage covenant threshold has increased through fiscal year 2019, (ii) the Company and the other loan parties secured the obligations with liens on substantially all of their personal property, and (iii) such liens will be released upon the Company’s leverage ratio being less than or equal to 4.00 to 1.00 no earlier than the fiscal quarter ended on December 31, 2019. The material terms and conditions under the Credit Agreement are otherwise substantially consistent with those contained in the Credit Agreement prior to the Amendment. In connection with this Amendment, $0.6 million in lender fees will be amortized ratably through January 31, 2025 and $1.8 million of fees will be amortized ratably through February 1, 2023.
On August 26, 2019, the Company entered into Amendment No. 2 (the “Amendment”) to the Credit Agreement. This Amendment permanently maintains the secured status of the credit facility and the maximum permitted leverage ratio at 4.5x. Absent the Amendment, the Credit Agreement was scheduled to return to unsecured status with a maximum permitted leverage ratio of 4.0x in the fourth quarter of 2019. The material terms and conditions under the Credit Agreement are otherwise substantially consistent with those contained in the Credit Agreement prior to the Amendment.
The Company’s average interest rate on debt outstanding under its Credit Agreement for the year ended December 31, 2019 was 4.11%. Including the impact of the interest rate swap agreements in effect as of December 31, 2019, the average rate decreased to 3.60%.
Revolving Credit Facility — As of December 31, 2019, $723.6 million of the aggregate commitment of $750.0 million of the Revolving Credit Facility was available. Under the Credit Agreement, the Revolving Credit Facility matures on February 1, 2023. In addition, as of December 31, 2019, there were $26.4 million in letters of credit under the Revolving Credit Facility that were issued but undrawn, which have been included as a reduction to the calculation of available credit.
Interest is payable quarterly or, if earlier, at the end of the applicable interest period in arrears on any outstanding borrowings under the Revolving Credit Facility. The interest rates applicable to the Revolving Credit Facility are based upon the Company’s consolidated net leverage ratio or the Company’s Corporate Credit Rating, whichever results in lower pricing, and are determined by either (i) LIBOR, plus a margin ranging from 1.20% to 1.70%, or (ii) a Base Rate (as defined in the Credit Agreement), plus a margin ranging from 0.20% to 0.70%. The unused fee on the Revolving Credit Facility is also based on the
TREEHOUSE FOODS, INC.
NOTES TO CONSOLIDATED FINANCIAL STATEMENTS – (Continued)
Company’s consolidated net leverage ratio or the Company’s Corporate Credit Rating, whichever results in lower pricing, and accrues at a rate ranging from 0.20% to 0.35%.
The Credit Agreement is fully and unconditionally, as well as jointly and severally, guaranteed by our 100% owned direct and indirect domestic subsidiaries: Bay Valley Foods, LLC; Sturm Foods, Inc. (includes Cains Foods, Inc. beginning in the fourth quarter of 2019); S.T. Specialty Foods, Inc.; Associated Brands, Inc.; Protenergy Holdings, Inc.; Protenergy Natural Foods, Inc.; TreeHouse Private Brands, Inc. (formerly Ralcorp Holdings, Inc.); American Italian Pasta Company.; Linette Quality Chocolates, Inc.; Ralcorp Frozen Bakery Products, Inc.; Cottage Bakery, Inc.; The Carriage House Companies, Inc. and certain other domestic subsidiaries that may become guarantors in the future, which are collectively known as the “Guarantor Subsidiaries.” As of August 1, 2019, Nutcracker Brands, Inc. and Flagstone Foods, Inc. are no longer Guarantor Subsidiaries due to the Snacks division divestiture. During the fourth quarter of 2019, Cains Foods, L.P. was dissolved and Cains GP, LLC was renamed as TreeHouse Foods Services, LLC. The Credit Agreement contains various financial and restrictive covenants and requires that the Company maintain a consolidated net leverage ratio of no greater than 4.50 to 1.0. The Credit Agreement also contains cross-default provisions which could result in the acceleration of payments in the event TreeHouse or the Guarantor Subsidiaries (i) fails to make a payment when due in respect of any indebtedness or guarantee having an aggregate principal amount greater than $75.0 million or (ii) fails to observe or perform any other agreement or condition related to such indebtedness or guarantee as a result of which the holder(s) of such debt are permitted to accelerate the payment of such debt.
Term Loan A — On December 1, 2017, the Company entered into a $500 million term loan which amended and extended the Company’s existing term A loan. The maturity date is January 31, 2025. The interest rates applicable to Term Loan A are based upon the Company’s consolidated net leverage ratio or the Company’s Corporate Credit Rating, whichever results in lower pricing, and are determined by either (i) LIBOR, plus a margin ranging from 1.675% to 2.175%, or (ii) a Base Rate (as defined in the Credit Agreement), plus a margin ranging from 0.675% to 1.175%. Principal amortization payments are due on a quarterly basis and interest is payable quarterly or, if earlier, at the end of the applicable interest period in arrears on any outstanding borrowings under Term Loan A. Term Loan A is subject to substantially the same covenants as the Revolving Credit Facility, and also has the same Guarantor Subsidiaries.
Term Loan A-1 — On December 1, 2017, the Company entered into a $900 million term loan which amended and extended the Company’s existing tranche A-1 and tranche A-2 term loans. The maturity date is February 1, 2023. The interest rates applicable to Term Loan A-1 are the same as those applicable to the Revolving Credit Facility (other than, for the avoidance of doubt, the unused fee). Principal amortization payments are due on a quarterly basis and interest is payable quarterly or, if earlier, at the end of the applicable interest period in arrears on any outstanding borrowing under Term Loan A-1. Term Loan A-1 is subject to substantially the same covenants as the Revolving Credit Facility, and has the same Guarantor Subsidiaries.
Term Loan A-2 — On December 1, 2017, Term Loan A-2 was paid off as part the Credit Agreement utilizing borrowings under Term Loan A and Term Loan A-1.
2022 Notes — On March 11, 2014, the Company completed its underwritten public offering of $400 million in aggregate principal amount of 4.875% notes due March 15, 2022 (the “2022 Notes”). The net proceeds of $394.0 million ($400.0 million less underwriting discount of $6.0 million, providing an effective interest rate of 4.99%) were used to extinguish the Company’s previously issued 7.75% notes due on March 1, 2018 (the “2018 Notes”). Interest is payable on March 15 and September 15 of each year. The 2022 Notes will mature on March 15, 2022.
The Company may redeem all or some of the 2022 Notes upon not less than 30 nor more than 60 days’ notice, at the redemption prices as set forth in the Indenture plus any accrued or unpaid interest to the applicable redemption date. Subject to certain limitations, in the event of a change in control of the Company, the Company will be required to make an offer to purchase the 2022 Notes at a purchase price equal to 101% of the principal amount of the 2022 Notes, plus accrued and unpaid interest up to the purchase date.
2024 Notes — On January 29, 2016, the Company completed an exempt offering under Rule 144A and Regulation S of the Securities Act of $775 million in aggregate principal amount of 6.0% notes due February 15, 2024. The net proceeds from the issuance of the 2024 Notes (approximately $760.7 million after deducting issuance costs, providing an effective interest rate of 6.23%) were used to fund a portion of the purchase price of the Private Brands Business. Interest is payable on February 15 and August 15 of each year. The payments began on August 15, 2016. The 2024 Notes will mature on February 15, 2024.
The Company may redeem some or all of the 2024 Notes at any time on or after February 15, 2019 at the applicable redemption prices described in the Indenture plus accrued and unpaid interest, if any, up to but not including the redemption date. In the event of certain change of control events, as described in the Indenture, the Company may be required to purchase the 2024 Notes from the holders at a purchase price of 101% of the principal amount plus any accrued and unpaid interest.
TREEHOUSE FOODS, INC.
NOTES TO CONSOLIDATED FINANCIAL STATEMENTS – (Continued)
The Company issued the 2022 Notes and 2024 Notes pursuant to a single base Indenture among the Company, the Guarantor Subsidiaries, and the Trustee. The Indenture provides, among other things, that the 2022 Notes and 2024 Notes will be senior unsecured obligations of the Company. The Company’s payment obligations under the 2022 Notes and 2024 Notes are fully and unconditionally, as well as jointly and severally, guaranteed on a senior unsecured basis by the Guarantor Subsidiaries, in addition to any future domestic subsidiaries that guarantee or become borrowers under its credit agreement, or guarantee certain other indebtedness incurred by the Company or its restricted subsidiaries. The Indenture was supplemented during the first quarter of 2016 to include the changes in Guarantor Subsidiaries noted above.
The Indenture governing the 2022 Notes and 2024 Notes contains customary event of default provisions (including, without limitation, defaults relating to the failure to pay at final maturity or the acceleration of certain other indebtedness). If an event of default occurs and is continuing, the trustee under the Indenture or holders of at least 25% in principal amount of such notes may declare the principal amount and accrued and unpaid interest, if any, on all such notes to be due and payable. The Indenture also contains restrictive covenants that, among other things, limit the ability of the Company and the Guarantor Subsidiaries to: (i) pay dividends or make other restricted payments, (ii) make certain investments, (iii) incur additional indebtedness or issue preferred stock, (iv) create liens, (v) pay dividends or make other payments (except for certain dividends and payments to the Company and certain subsidiaries of the Company), (vi) merge or consolidate with other entities or sell substantially all of its assets, (vii) enter into transactions with affiliates, and (viii) engage in certain sale and leaseback transactions. The foregoing limitations are subject to exceptions as set forth in the Indenture. In addition, if in the future, the 2022 Notes or 2024 Notes have an investment grade credit rating by both Moody’s Investors Services, Inc. and Standard & Poor’s Ratings Services, certain of these covenants will, thereafter, no longer apply to the 2022 Notes or 2024 Notes for so long as the 2022 Notes or 2024 Notes are rated investment grade by the two rating agencies.
Interest Rate Swap Agreements — In June 2016 and February 2018, the Company entered into $500 million and $1,625 million, respectively, of long-term interest rate swap agreements to lock into a fixed LIBOR interest rate base. The swaps cover a period through February 28, 2025.
Fair Value - At December 31, 2019, the aggregate fair value of the Company's total debt was $2,146.1 million and its carrying value was $2,118.8 million. At December 31, 2018, the aggregate fair value of the Company's total debt was $2,311.3 million and its carrying value was $2,318.8 million. The fair values of Term Loan A and Term Loan A-1 were estimated using present value techniques and market-based interest rates and credit spreads. The fair values of the Company's 2022 Notes and 2024 Notes were estimated based on quoted market prices for similar instruments due to their infrequent trading volume. Accordingly, the fair value of the Company's debt is classified as Level 2 within the valuation hierarchy.
Finance Lease Obligations and Other — The Company owes $3.9 million related to finance leases. Finance lease obligations represent machinery and equipment financing obligations, which are payable in monthly installments of principal and interest, and are collateralized by the related assets financed. Refer to Note 4 for additional information regarding the Company's finance leases.
Deferred Financing Costs – As of December 31, 2019 and December 31, 2018, deferred financing costs of $15.7 million and $22.7 million were included as a direct deduction from outstanding long-term debt. Fees associated with the Revolving Credit Facility are presented in Other assets, net.
14. STOCKHOLDERS' EQUITY
Common Stock — The Company has authorized 90 million shares of common stock with a par value of $0.01 per share. No dividends have been declared or paid.
Share Repurchase Authorization — On November 2, 2017, the Company announced that the Board of Directors adopted a stock repurchase program. The stock repurchase program authorizes the Company to repurchase up to $400 million of the Company’s common stock at any time, or from time to time. Any repurchases under the program may be made by means of open market transactions, negotiated block transactions, or otherwise, including pursuant to a repurchase plan administered in accordance with Rules 10b5-1 and 10b-18 under the Securities Exchange Act of 1934, as amended (the “Exchange Act”). The size and timing of any repurchases will depend on price, market and business conditions, and other factors. The Company was authorized to enter into an administrative repurchase plan for $50 million of the $400 million in fiscal 2018. The administrative repurchase plan expired as of December 31, 2018. The Company continues to have the ability to make discretionary repurchases up to an annual cap of $150 million under the $400 million total authorization. Any shares repurchased will be held as treasury stock.
TREEHOUSE FOODS, INC.
NOTES TO CONSOLIDATED FINANCIAL STATEMENTS – (Continued)
There were no amounts repurchased during the year December 31, 2019. For the year ended December 31, 2018, the Company repurchased approximately 1.2 million shares of common stock for a total of $54.6 million. For the year ended December 31, 2017, the Company repurchased approximately 0.6 million shares of common stock for a total of $28.7 million.
Preferred Stock — The Company has authorized 10 million shares of preferred stock with a par value of $0.01 per share. No preferred stock has been issued.
15. EARNINGS PER SHARE
Basic earnings per share is computed by dividing net income by the number of weighted average common shares outstanding during the reporting period. The weighted average number of common shares used in the diluted earnings per share calculation is determined using the treasury stock method and includes the incremental effect related to the Company’s outstanding stock-based compensation awards.
The following table summarizes the effect of the share-based compensation awards on the weighted average number of shares outstanding used in calculating diluted earnings per share:
|
| | | | | | | | |
| | Year Ended December 31, |
| | 2019 | | 2018 | | 2017 |
| | (In millions) |
| Weighted average common shares outstanding | 56.2 |
| | 56.0 |
| | 57.1 |
|
| Assumed exercise/vesting of equity awards (1) | — |
| | — |
| | 0.5 |
|
| Weighted average diluted common shares outstanding | 56.2 |
| | 56.0 |
| | 57.6 |
|
| |
| (1) | Incremental shares from equity awards are computed by the treasury stock method. For the years ended December 31, 2019 and 2018, weighted average common shares outstanding is the same for the computations of basic and diluted shares because the Company had a net loss from continuing operations for the period. Equity awards, excluded from our computation of diluted earnings per share because they were anti-dilutive, were 1.6 million, 1.7 million, and 1.6 million for the years ended December 31, 2019, 2018, and 2017, respectively. |
16. STOCK-BASED COMPENSATION
The Board of Directors adopted, and the Company’s Stockholders approved, the “TreeHouse Foods, Inc. Equity and Incentive Plan” (the “Plan”). Under the Plan, the Compensation Committee may grant awards of various types of compensation, including stock options, restricted stock, restricted stock units, performance shares, performance units, other types of stock-based awards, and other cash-based compensation. The number of shares authorized to be awarded under the Plan is approximately 17.5 million, of which approximately 5.1 million remain available at December 31, 2019.
Total compensation expense related to stock-based payments and the related income tax benefit recognized in Net (loss) income from continuing operations was as follows:
|
| | | | | | | | | | | | |
| | | Year Ended December 31, |
| | | 2019 | | 2018 | | 2017 |
| | | (In millions) |
| Compensation expense related to stock-based payments | | $ | 22.6 |
| | $ | 30.7 |
| | $ | 28.2 |
|
| Related income tax benefit | | 5.8 |
| | 7.7 |
| | 10.4 |
|
In the first quarter of 2018, the Company entered into an amended employment agreement with our former Chief Executive Officer. The amended plan resulted in the modification of his outstanding equity awards by accelerating the vesting dates, changing outstanding performance units to vest at target, and extending the exercisability of options outstanding. Modification of the existing awards resulted in a charge of $10.0 million in the three months ended March 31, 2018. The impact of this modification on expense recognized for stock options, restricted stock units, and performance units was $1.2 million, $3.8 million, and $5.0 million, respectively.
The Company estimates that certain key executives and all directors will complete the required service conditions associated with their awards. For all other employees, the Company estimates its forfeiture rate based on historical experience.
All amounts below include continuing and discontinued operations.
TREEHOUSE FOODS, INC.
NOTES TO CONSOLIDATED FINANCIAL STATEMENTS – (Continued)
Stock Options — The following table summarizes stock option activity during 2019:
|
| | | | | | | | | | | | |
| | Employee Options | | Weighted Average Exercise Price | | Weighted Average Remaining Contractual Term (yrs.) | | Aggregate Intrinsic Value |
| | (In thousands) | | | | | | (In millions) |
| Outstanding, at January 1, 2019 | 1,720 |
| | $ | 75.24 |
| | 4.8 | | $ | 1.1 |
|
| Forfeited | (52 | ) | | 84.89 |
| | | | |
| Exercised | (13 | ) | | 51.54 |
| | | | |
| Expired | (127 | ) | | 81.40 |
| | | | |
| Outstanding, at December 31, 2019 | 1,528 |
| | 74.58 |
| | 3.7 | | 0.8 |
|
| Vested/expected to vest, at December 31, 2019 | 1,519 |
| | 74.53 |
| | 3.7 | | 0.8 |
|
| Exercisable, at December 31, 2019 | 1,479 |
| | 74.28 |
| | 3.6 | | 0.8 |
|
|
| | | | | | | | | | | |
| | Year Ended December 31, |
| | 2019 | | 2018 | | 2017 |
| | (In millions) |
| Intrinsic value of stock options exercised | $ | 0.1 |
| | $ | 3.8 |
| | $ | 12.1 |
|
| Tax benefit recognized from stock option exercises | — |
| | 0.7 |
| | 4.6 |
|
Future compensation costs related to unvested options totaled $0.3 million at December 31, 2019 and will be recognized over the remaining vesting period of the grants, which averages 0.3 years. The weighted average grant date fair value of options granted in 2017 was $25.56. There were no options granted in 2019 or 2018.
Stock options granted under the plan generally have a three year vesting schedule, vest one-third on each of the first three anniversaries of the grant date, and expire ten years from the grant date. Stock options are generally only granted to employees and non-employee directors.
Stock options are valued using the Black-Scholes option pricing model. Expected volatilities are based on historical volatilities of the Company’s stock price. The risk-free interest rate for periods within the contractual life of the stock options is based on the U.S. Treasury yield curve in effect at the time of the grant. We based our expected term on the simplified method as described under the SEC Staff Accounting Bulletin No. 107. Under this approach the expected term is 6.0 years. The assumptions used to calculate the value of the stock option awards granted in 2017 are presented as follows (no stock options were granted in 2019 or 2018):
|
| | | |
| | | 2017 |
| Weighted average expected volatility | | 26.74 | % |
| Weighted average risk-free interest rate | | 2.07 | % |
| Expected dividends | | — | % |
| Expected term | | 6.0 years |
|
Restricted Stock Units — Employee restricted stock unit awards generally vest based on the passage of time. These awards generally vest in approximately three equal installments on each of the first three anniversaries of the grant date. Director restricted stock units vest on the first anniversary of the grant date. Certain directors have deferred receipt of their awards until either their departure from the Board of Directors or a specified date. As of December 31, 2019, the amount of director restricted stock units that have been earned and deferred totaled 91,660 units.
TREEHOUSE FOODS, INC.
NOTES TO CONSOLIDATED FINANCIAL STATEMENTS – (Continued)
The following table summarizes the restricted stock unit activity during the year ended December 31, 2019:
|
| | | | | | | | | | | | | |
| | Employee Restricted Stock Units | | Weighted Average Grant Date Fair Value | | Director Restricted Stock Units | | Weighted Average Grant Date Fair Value |
| | (In thousands) | | | | (In thousands) | | |
| Outstanding, at January 1, 2019 | 685 |
| | $ | 52.20 |
| | 129 |
| | $ | 53.75 |
|
| Granted | 382 |
| | 62.64 |
| | 24 |
| | 66.79 |
|
| Vested | (279 | ) | | 59.73 |
| | (37 | ) | | 39.01 |
|
| Forfeited | (173 | ) | | 54.70 |
| | — |
| | — |
|
| Outstanding, at December 31, 2019 | 615 |
| | 54.58 |
| | 116 |
| | 58.30 |
|
|
| | | | | | | | | | | |
| | Year Ended December 31, |
| | 2019 | | 2018 | | 2017 |
| | (In millions) |
| Fair value of vested restricted stock units | $ | 19.5 |
| | $ | 16.6 |
| | $ | 14.0 |
|
| Tax benefit recognized from vested restricted stock units | 3.7 |
| | 2.5 |
| | 5.1 |
|
Future compensation costs related to restricted stock units are approximately $18.9 million as of December 31, 2019 and will be recognized on a weighted average basis over the next 1.9 years. The grant date fair value of the awards is equal to the Company’s closing stock price on the grant date.
Performance Units — Performance unit awards are granted to certain members of management. These awards contain service and performance conditions. For each of the three performance periods, one-third of the units will accrue, multiplied by a predefined percentage generally between 0% and 200%, depending on the achievement of certain operating performance measures. Additionally, for the cumulative performance period, a number of units will accrue, equal to the number of units granted multiplied by a predefined percentage generally between 0% and 200%, depending on the achievement of certain operating performance measures, less any units previously accrued. Accrued units will be converted to stock or cash, at the discretion of the Compensation Committee, generally, on the third anniversary of the grant date. The Company intends to settle these awards in stock and has the shares available to do so.
The following table summarizes the performance unit activity during the year ended December 31, 2019:
|
| | | | | | |
| | Performance Units | | Weighted Average Grant Date Fair Value |
| | (In thousands) | | |
| Unvested, at January 1, 2019 | 176 |
| | $ | 71.49 |
|
| Granted | 390 |
| | 61.88 |
|
| Vested | (17 | ) | | 98.28 |
|
| Forfeited | (67 | ) | | 82.24 |
|
| Unvested, at December 31, 2019 | 482 |
| | 61.28 |
|
|
| | | | | | | | | | | |
| | Year Ended December 31, |
| | 2019 | | 2018 | | 2017 |
| | (In millions) |
| Fair value of vested performance units | $ | 0.9 |
| | $ | 7.6 |
| | $ | 7.8 |
|
| Tax benefit recognized from performance units vested | 0.2 |
| | 0.1 |
| | 2.5 |
|
Future compensation costs related to the performance units are estimated to be approximately $15.1 million as of December 31, 2019, and are expected to be recognized over the next 2.0 years. The grant date fair value of the awards is equal to the Company’s closing stock price on the grant date.
TREEHOUSE FOODS, INC.
NOTES TO CONSOLIDATED FINANCIAL STATEMENTS – (Continued)
17. ACCUMULATED OTHER COMPREHENSIVE LOSS
Accumulated other comprehensive loss consists of the following components, all of which are net of tax:
|
| | | | | | | | | | | |
| | Foreign Currency Translation (1) | | Unrecognized Pension and Postretirement Benefits (2) | | Accumulated Other Comprehensive Loss |
| | (In millions) |
| Balance at January 1, 2017 | $ | (89.4 | ) | | $ | (11.9 | ) | | $ | (101.3 | ) |
| Other comprehensive income | 32.2 |
| | 1.5 |
| | 33.7 |
|
Reclassifications from accumulated other
comprehensive loss (3) | — |
| | 6.1 |
| | 6.1 |
|
| Other comprehensive income | 32.2 |
| | 7.6 |
| | 39.8 |
|
| Balance at December 31, 2017 | (57.2 | ) | | (4.3 | ) | | (61.5 | ) |
| Other comprehensive loss | (34.5 | ) | | (0.5 | ) | | (35.0 | ) |
Reclassifications from accumulated other
comprehensive loss (3) | — |
| | 0.5 |
| | 0.5 |
|
Reclassifications from accumulated other
comprehensive loss - Adoption of ASU 2018-02 | — |
| | (1.1 | ) | | (1.1 | ) |
| Other comprehensive loss | (34.5 | ) | | (1.1 | ) | | (35.6 | ) |
| Balance at December 31, 2018 | (91.7 | ) | | (5.4 | ) | | (97.1 | ) |
| Other comprehensive income | 12.3 |
| | 0.3 |
| | 12.6 |
|
Reclassifications from accumulated other
comprehensive loss (3) | — |
| | 0.5 |
| | 0.5 |
|
| Other comprehensive income | 12.3 |
| | 0.8 |
| | 13.1 |
|
| Balance at December 31, 2019 | $ | (79.4 | ) | | $ | (4.6 | ) | | $ | (84.0 | ) |
| |
| (1) | The tax impact of the foreign currency translation adjustment was insignificant for the years ended December 31, 2019 and 2018. There was no tax impact for the year ended December 31, 2017. |
| |
| (2) | The unrecognized pension and postretirement benefits reclassification is presented net of tax of $0.2 million for both of the years ending December 31, 2019 and 2018, and $4.7 million for the year ended December 31, 2017. |
| |
| (3) | Refer to Note 18 for additional information regarding these reclassifications. |
TREEHOUSE FOODS, INC.
NOTES TO CONSOLIDATED FINANCIAL STATEMENTS – (Continued)
18. EMPLOYEE PENSION AND POSTRETIREMENT BENEFIT PLANS
Pension and Postretirement Benefits — Certain of our employees and retirees participate in pension and other postretirement benefit plans. In connection with the acquisition of the Private Brands Business, the Company acquired three pension plans and one postretirement benefit plan. The obligations related to these plans were assumed by the Company at the acquisition date. Employee benefit plan obligations and expenses included in the Consolidated Financial Statements are determined based on plan assumptions, employee demographic data, including years of service and compensation, benefits and claims paid, and employer contributions. The information below includes the activities of the Company's continuing and discontinued operations.
Defined Contribution Plans — Certain of our union and non-union employees participate in savings and profit sharing plans. These plans generally provide for salary reduction contributions to the plans on behalf of the participants of between 1% and 80% of a participant’s annual compensation and provide for employer matching and profit sharing contributions. The Company established a tax-qualified defined contribution plan to manage the assets. On a continuing operations basis, for 2019, 2018, and 2017, the Company made matching and profit sharing contributions to the plans of $19.4 million, $19.3 million, and $20.7 million, respectively.
Multiemployer Pension Plans - The Company contributes to several multiemployer pension plans on behalf of employees covered by collective bargaining agreements. These plans are administered jointly by management and union representatives and cover substantially all full-time and certain part-time union employees who are not covered by other plans. The risks of participating in multiemployer plans are different from single-employer plans in the following aspects: (1) assets contributed to the multiemployer plan by one employer may be used to provide benefits to employees of other participating employers, (2) if a participating employer stops contributing to the plan, the unfunded obligations of the plan may be borne by the remaining participating employers, and (3) if the Company chooses to stop participating in a multiemployer plan, we could, under certain circumstances, be liable for unfunded vested benefits or other expenses of jointly administered union/management plans.
The Company’s participation in multiemployer pension plans is outlined in the table below. The EIN column provides the Employer Identification Number (“EIN”) of each plan. Unless otherwise noted, the most recent Pension Protection Act zone status available in 2019 and 2018 is for the plan’s years ended December 31, 2018, and 2017, respectively. The zone status is based on information that the Company received from the plan, and is certified by the plan’s actuary. Among other factors, plans in the red zone are generally less than 65% funded, plans in the yellow zone are less than 80% funded, and plans in the green zone are at least 80% funded. The FIP column indicates plans for which a financial improvement plan “(“FIP”) is either pending or has been implemented. The last column lists the expiration dates of the collective bargaining agreements to which the plans are subject. The Company began participating in the Bakery and Confectionery Union and Industry International Pension Fund and the Retail, Wholesale and Department Store International Union and Industry Pension Fund in 2016 as a result of the acquisition of the Private Brands Business. There have been no other significant changes in the number of Company employees covered by the multiemployer plans or other significant events that would affect the comparability of contributions to the plans.
TREEHOUSE FOODS, INC.
NOTES TO CONSOLIDATED FINANCIAL STATEMENTS – (Continued)
The following table lists information about the Company's individually significant multiemployer pension plans:
|
| | | | | | | | | | | | | | | | | | | | | | | | |
| | | | Pension Protection Act Zone Status | | | | TreeHouse Foods | | | | Expiration Date |
| | EIN / Pension | | Plan Year Ended December 31, | | FIP Implemented | | Contributions (in millions) | | Surcharge Imposed | | Of Collective Bargaining |
| Plan Name | Plan Number | | 2018 | | 2017 | | (yes or no) | | 2019 | | 2018 | | 2017 | | (yes or no) | | Agreement(s) |
| Bakery and Confectionery | | | | | | | | | | | | | | | | | |
| Union and Industry | | | | | | | | | | | | | | | | | 12/4/2020 |
|
| International Pension Fund | 52-6118572 / 001 | | Red | | Red | | Yes | | $ | 1.5 |
| | $ | 1.4 |
| | $ | 1.7 |
| | Yes | | 7/25/2020 |
|
| Central States Southeast and | | | | | | | | | | | | | | | | | |
| Southwest Areas Pension | | | | | | | | | | | | | | | | | |
| Fund | 36-6044243 / 001 | | Red | | Red | | Yes | | 1.0 |
| | 0.8 |
| | 0.7 |
| | Yes | | 12/31/2022 |
|
| Retail, Wholesale and | | | | | | | | | | | | | | | | | |
| Department Store | | | | | | | | | | | | | | | | | |
| International Union and | | | | | | | | | | | | | | | | | |
| Industry Pension Fund | 63-0708442 / 001 | | Red | | Red | | Yes | | 0.3 |
| | 0.6 |
| | 0.5 |
| | Yes | | (1 | ) |
| Rockford Area Dairy | | | | | | | | | | | | | | | | | |
| Industry Local 754, Intl. | | | | | | | | | | | | | | | | | |
| Brotherhood of Teamsters | | | | | | | | | | | | | | | | | |
| Retirement Pension Plan | 36-6067654 / 001 | | Green | | Green | | No | | 0.5 |
| | 0.5 |
| | 0.4 |
| | No | | 4/30/2021 |
|
| Western Conference of | | | | | | | | | | | | | | | | | |
| Teamsters Pension Fund | 91-6145047 / 001 | | Green | | Green | | No | | — |
| | 0.8 |
| | (1.0 | ) | | No | | (2 | ) |
| |
| (1) | During 2019, the Company executed a complete withdrawal from the Retail, Wholesale, and Department Store International Union and Industry Pension Fund and settled a withdrawal liability of $4.3 million. |
| |
| (2) | The Company partially withdrew from the Western Conference of Teamsters Pension Plan Trust as a result of the closure of its City of Industry, California facility during 2016. As a result, there is no collective bargaining agreement related to this plan. |
No other withdrawal liabilities were established related to multiemployer pension plans, as withdrawal from the remaining plans is not probable as of December 31, 2019.
The Company was listed in the following plan’s Form 5500 as providing more than 5.0% of the total contributions for the following plan and plan years:
|
| | |
| | | Years Contribution to Plan Exceeded |
| | | 5% of Total Contributions |
| Plan Name: | | (as of December 31 of the Plan's Year-End) |
| Rockford Area Dairy Industry Local 754, Intl. Brotherhood of Teamsters Retirement Pension Plan | | 2019, 2018, and 2017 |
Other Postretirement Benefits — Certain employees participate in benefit programs that provide certain health care and life insurance benefits for retired employees and their eligible dependents. The plans are unfunded. The Company estimates that its 2020 contributions to its postretirement benefit plans will be $1.6 million. The measurement date for the other postretirement benefit plans is December 31.
The Company contributes to certain multiemployer postretirement benefit plans other than pensions on behalf of employees covered by collective bargaining agreements. These plans are administered jointly by management and union representatives and cover all eligible retirees. These plans are primarily health and welfare funds and carry the same multiemployer risks as identified at the beginning of this Note. Total contributions to these plans were $0.2 million, $1.5 million, and $0.3 million for the years ended December 31, 2019, 2018, and 2017, respectively.
TREEHOUSE FOODS, INC.
NOTES TO CONSOLIDATED FINANCIAL STATEMENTS – (Continued)
Defined Benefit Pension Plans —The Company established a tax-qualified pension plan and master trust to manage the portion of the pension plan assets related to eligible salaried, non-union, and union employees not covered by a multiemployer pension plan. We also retain investment consultants to assist our Investment Committee with formulating a long-term investment policy for the master trust. The expected long-term rate of return on assets is based on projecting long-term market returns for the various asset classes in which the plan’s assets are invested, weighted by the target asset allocations. The estimated ranges are primarily based on observations of historical asset returns and their historical volatility. In determining the expected returns, we also consider consensus forecasts of certain market and economic factors that influence returns, such as inflation, gross domestic product trends, and dividend yields. Active management of the plan assets may result in adjustments to the historical returns. We review the rate of return assumption annually.
Our investment objectives are to minimize the volatility of the value of our pension assets relative to our pension liabilities and to ensure assets are sufficient to pay plan benefits. In 2018, we adopted a broad pension de-risking strategy intended to align the characteristics of our assets relative to our liabilities. The strategy targets investments depending on the funded status of the obligation. We anticipate this strategy will continue in future years and will be dependent upon market conditions and plan characteristics.
At December 31, 2019, our master trust was invested as follows: investments in equity securities were at 40%; investments in fixed income were at 53%; investments in hedge funds were at 6%; and cash equivalents were less than 1%. We believe the allocation of our master trust investments as of December 31, 2019 is generally consistent with the targets set forth by our Investment Committee.
The fair value of the Company’s pension plan assets at December 31, 2019 and 2018 was as follows:
|
| | | | | | | | |
| | | December 31, |
| | | 2019 | | 2018 |
| | | (in millions) |
| Equity funds (a) | | $ | 118.4 |
| | $ | 90.6 |
|
| Fixed income funds (b) | | 157.3 |
| | 143.6 |
|
| Alternative funds (c) | | 16.5 |
| | 16.1 |
|
| Cash and equivalents (d) | | 1.8 |
| | 1.7 |
|
| | | $ | 294.0 |
| | $ | 252.0 |
|
(a) This investment class includes domestic and international equity funds that includes both large and small/mid cap funds that track the S&P index as well as other equity indices. The Company elected the NAV practical expedient to value these funds.
(b) This investment class includes U.S. Treasury index funds as well as bond funds representative of the United States bond and debt markets with varying benchmark indices. The Company elected the NAV practical expedient to value these funds.
(c) This investment class primarily includes private equity funds. The valuation is based on NAV as reported by the asset
manager or investment company and adjusted for cash flows, if necessary. In making such an assessment, a variety of factors are reviewed by management, including but not limited to the timeliness of NAV as reported by the asset manager and changes in general economic and market conditions subsequent to the last NAV reported by the asset manager.
(d) Includes cash and cash equivalents such as short-term marketable securities. Cash and cash equivalents include
money market funds, which are valued based on NAV.
Pension benefits for eligible salaried and non-union employees were frozen in 2002 for years of creditable service. For these employees, incremental pension benefits are only earned for changes in compensation affecting final average pay. Pension benefits earned by union employees covered by collective bargaining agreements, but not participating in multiemployer pension plans, are earned based on creditable years of service and the specified benefit amounts negotiated as part of the collective bargaining agreements. The Company’s funding policy provides that annual contributions to the pension plan master trust will be at least equal to the minimum amounts required by Employee Retirement Income Security Act of 1974, as amended. The Company estimates that its 2020 contributions to its pension plans will be $2.2 million. The measurement date for the defined benefit pension plans is December 31.
TREEHOUSE FOODS, INC.
NOTES TO CONSOLIDATED FINANCIAL STATEMENTS – (Continued)
The following table summarizes information about our pension and postretirement benefit plans for the years ended December 31, 2019 and 2018:
|
| | | | | | | | | | | | | | | |
| | Pension Benefits | | Postretirement Benefits |
| | 2019 | | 2018 | | 2019 | | 2018 |
| | (in millions) |
| Change in benefit obligations: | |
| | | | | | |
| Benefit obligation, at beginning of year | $ | 300.0 |
| | $ | 325.2 |
| | $ | 28.1 |
| | $ | 33.8 |
|
| Service cost | 1.5 |
| | 1.9 |
| | — |
| | — |
|
| Interest cost | 12.2 |
| | 11.9 |
| | 1.1 |
| | 1.2 |
|
| Curtailment (1) | (0.5 | ) | | — |
| | — |
| | — |
|
| Actuarial losses (gains) (2) | 40.3 |
| | (19.8 | ) | | (0.1 | ) | | (5.1 | ) |
| Benefits paid | (17.5 | ) | | (19.2 | ) | | (1.6 | ) | | (1.8 | ) |
| Benefit obligation, at end of year | $ | 336.0 |
| | $ | 300.0 |
| | $ | 27.5 |
| | $ | 28.1 |
|
| Change in plan assets: | | | | | | | |
| Fair value of plan assets, at beginning of year | $ | 252.0 |
| | $ | 278.8 |
| | $ | — |
| | $ | — |
|
| Actual gain (loss) on plan assets | 55.8 |
| | (10.0 | ) | | — |
| | — |
|
| Company contributions | 3.7 |
| | 2.4 |
| | 1.6 |
| | 1.8 |
|
| Benefits paid | (17.5 | ) | | (19.2 | ) | | (1.6 | ) | | (1.8 | ) |
| Fair value of plan assets, at end of year | $ | 294.0 |
| | $ | 252.0 |
| | $ | — |
| | $ | — |
|
| Funded status of the plan | $ | (42.0 | ) | | $ | (48.0 | ) | | $ | (27.5 | ) | | $ | (28.1 | ) |
| Amounts recognized in the Consolidated Balance Sheets: | | | | | | | |
| Current liability | $ | (0.7 | ) | | $ | (0.7 | ) | | $ | (1.6 | ) | | $ | (1.8 | ) |
| Non-current liability | (41.3 | ) | | (47.3 | ) | | (25.9 | ) | | (26.3 | ) |
| Net amount recognized | $ | (42.0 | ) | | $ | (48.0 | ) | | $ | (27.5 | ) | | $ | (28.1 | ) |
Amounts recognized in Accumulated other comprehensive income (loss): | | | | | | | |
| Net actuarial loss (gain) | $ | 5.8 |
| | $ | 6.6 |
| | $ | (0.2 | ) | | $ | (0.2 | ) |
| Prior service cost | 0.5 |
| | 0.7 |
| | — |
| | — |
|
| Total, before tax effect | $ | 6.3 |
| | $ | 7.3 |
| | $ | (0.2 | ) | | $ | (0.2 | ) |
(1) Curtailment relates to the closure of the Company's Battle Creek, Michigan facility. (2) The change in actuarial loss (gain) was primarily due to the decrease in discount rates from 4.40% as of December 31, 2018 to 3.25% as of December 31, 2019. |
|
| | | | | | |
| | Pension Benefits |
| | 2019 | 2018 |
| | (in millions) |
| Accumulated benefit obligation | $ | 333.9 |
| $ | 296.7 |
|
Weighted average assumptions used to determine the pension benefit obligations: | | |
| Discount rate | 3.25 | % | 4.40 | % |
| Rate of compensation increases | 3.50%-4.00% |
| 3.50%-4.00% |
|
TREEHOUSE FOODS, INC.
NOTES TO CONSOLIDATED FINANCIAL STATEMENTS – (Continued)
The key actuarial assumptions used to determine the postretirement benefit obligations as of December 31, 2019 and 2018 are as follows:
|
| | | | | | | | | | | |
| | 2019 | | 2018 |
| | Pre-65 | | Post-65 | | Pre-65 | | Post-65 |
| Health care cost trend rates: | | | | | | | |
| Health care cost trend rate for next year | 7.29 | % | | 8.16 | % | | 7.32 | % | | 8.21 | % |
| Ultimate rate | 4.50 | % | | 4.50 | % | | 4.50 | % | | 4.50 | % |
| Discount rate | 3.25 | % | | 3.25 | % | | 4.40 | % | | 4.40 | % |
| Year ultimate rate achieved | 2028 |
| | 2028 |
| | 2026 |
| | 2026 |
|
The following table summarizes the net periodic cost of our pension and postretirement benefit plans for the years ended December 31, 2019, 2018, and 2017:
|
| | | | | | | | | | | | | | | | | | | | | | | |
| | Pension Benefits | | Postretirement Benefits |
| | 2019 | | 2018 | | 2017 | | 2019 | | 2018 | | 2017 |
| | (in millions) | | (in millions) |
| Components of net periodic costs: | | | | | | | | | | | |
| Service cost | $ | 1.5 |
| | $ | 1.9 |
| | $ | 3.6 |
| | $ | — |
| | $ | — |
| | $ | — |
|
| Interest cost | 12.2 |
| | 11.9 |
| | 14.7 |
| | 1.1 |
| | 1.2 |
| | 1.2 |
|
| Expected return on plan assets | (15.2 | ) | | (15.6 | ) | | (17.4 | ) | | — |
| | — |
| | — |
|
| Amortization of unrecognized prior service cost | 0.5 |
| | 0.2 |
| | 0.2 |
| | — |
| | — |
| | — |
|
| Amortization of unrecognized net loss | 0.2 |
| | 0.5 |
| | 0.9 |
| | — |
| | — |
| | — |
|
| Settlement expense | — |
| | — |
| | 0.2 |
| | — |
| | — |
| | — |
|
| Curtailment income (1) | (0.5 | ) | | — |
| | (1.4 | ) | | — |
| | — |
| | — |
|
| Net periodic (benefit) cost | $ | (1.3 | ) | | $ | (1.1 | ) | | $ | 0.8 |
| | $ | 1.1 |
| | $ | 1.2 |
| | $ | 1.2 |
|
(1) A curtailment gain was recognized during 2019 related to the closure of the Company's Battle Creek, Michigan facility. A curtailment gain was recognized during 2017 related to the freeze of several defined benefit pension plans.
|
| | | | | | | | | | | | | | | | | |
| | Pension Benefits | | Postretirement Benefits |
| | 2019 | | 2018 | | 2017 | | 2019 | | 2018 | | 2017 |
| Weighted average assumptions used to determine the periodic benefit costs: | | | | | | | | | | | |
| Discount rate | 4.40 | % | | 3.70 | % | | 4.25 | % | | 4.40 | % | | 3.70 | % | | 4.25 | % |
| Rate of compensation increases | 3.50%-4.00% |
| | 3.50%-4.00% |
| | 3.50%-4.00% |
| | — |
| | — |
| | — |
|
| Expected return on plan assets | 5.91 | % | | 5.80 | % | | 6.00 | % | | — |
| | — |
| | — |
|
Estimated future pension and postretirement benefit payments from the plans are as follows:
|
| | | | | | |
| | Pension Benefit | Postretirement Benefit |
| | (in millions) |
| 2020 | $ | 19.3 |
| $ | 1.6 |
|
| 2021 | 19.9 |
| 1.6 |
|
| 2022 | 20.3 |
| 1.7 |
|
| 2023 | 20.9 |
| 1.7 |
|
| 2024 | 21.3 |
| 1.7 |
|
| 2025-2029 | 98.1 |
| 8.7 |
|
TREEHOUSE FOODS, INC.
NOTES TO CONSOLIDATED FINANCIAL STATEMENTS – (Continued)
Most of our employees are not eligible for postretirement medical benefits and of those that are, the majority are covered by a multiemployer plan in which expenses are paid as incurred. The effect on those covered by plans for which we maintain a liability was not significant.
19. OTHER OPERATING EXPENSE, NET
The Company incurred other operating expense for the years ended December 31, 2019, 2018, and 2017, which consisted of the following:
|
| | | | | | | | | | | |
| | Year Ended December 31, |
| | 2019 | | 2018 | | 2017 |
| | (in millions) |
| Restructuring programs (1) | $ | 99.3 |
| | $ | 149.1 |
| | $ | 38.1 |
|
| (Gain) loss on divestitures (2) | — |
| | (14.3 | ) | | 86.0 |
|
| Other | 0.3 |
| | 0.9 |
| | 1.1 |
|
| Total other operating expense, net | $ | 99.6 |
| | $ | 135.7 |
| | $ | 125.2 |
|
(1) Refer to Note 3 for additional information.
(2) Refer to Note 8 for additional information.
20. COMMITMENTS AND CONTINGENCIES
Litigation, Investigations, and Audits - On November 16, 2016, a purported TreeHouse shareholder filed a class action captioned Tarara v. TreeHouse Foods, Inc., et al., Case No. 1:16-cv-10632, in the United States District Court for the Northern District of Illinois against TreeHouse and certain of its officers. The complaint, amended on March 24, 2017, is purportedly brought on behalf of all purchasers of TreeHouse common stock from January 20, 2016 through and including November 2, 2016. It asserts claims under Sections 10(b) and 20(a) of the Securities Exchange Act of 1934 and Rule 10b-5 promulgated thereunder and seeks, among other things, damages and costs and expenses. On December 22, 2016, another purported TreeHouse shareholder filed an action captioned Wells v. Reed, et al., Case No. 2016-CH-16359, in the Circuit Court of Cook County, Illinois, against TreeHouse and certain of its officers. This complaint, purportedly brought derivatively on behalf of TreeHouse, asserts state law claims against certain officers for breach of fiduciary duty, unjust enrichment, and corporate waste. On February 7, 2017, another purported TreeHouse shareholder filed an action captioned Lavin v. Reed, et al., Case No. 17-cv-01014, in the Northern District of Illinois, against TreeHouse and certain of its officers. This complaint is also purportedly brought derivatively on behalf of TreeHouse, and it asserts state law claims against certain officers for breach of fiduciary duty, unjust enrichment, abuse of control, gross mismanagement, and corporate waste. On February 8, 2019, another purported TreeHouse shareholder filed an action captioned Bartelt v. Reed, et al., Case No. 1:19-cv-00835, in the United States District Court for the Northern District of Illinois. This complaint is purportedly brought derivatively on behalf of TreeHouse and asserts state law claims against certain officers for breach of fiduciary duty, unjust enrichment, abuse of control, gross mismanagement, and corporate waste, in addition to asserting violations of Section 14 of the Securities Exchange Act of 1934. Finally, on June 3, 2019, another purported TreeHouse shareholder filed an action captioned City of Ann Arbor Employees’ Retirement System v. Reed, et al., Case No. 2019-CH-06753, in the Circuit Court of Cook County, Illinois, against TreeHouse and certain of its officers. Like Wells, Lavin, and Bartelt, this complaint is purportedly brought derivatively on behalf of TreeHouse and asserts claims for contribution and indemnification, breach of fiduciary duty, and aiding and abetting breaches of fiduciary duty.
All five complaints make substantially similar allegations (though the amended complaint in Tarara now contains additional detail). Essentially, the complaints allege that TreeHouse, under the authority and control of the individual defendants: (i) made certain false and misleading statements regarding the Company’s business, operations, and future prospects; and (ii) failed to disclose that (a) the Company’s private label business was underperforming; (b) the Company’s Flagstone business was underperforming; (c) the Company’s acquisition strategy was underperforming; (d) the Company had overstated its full-year 2016 guidance; and (e) TreeHouse’s statements lacked reasonable basis. The complaints allege that these actions artificially inflated the market price of TreeHouse common stock during the class period, thus purportedly harming investors. The Bartelt action also includes substantially similar allegations concerning events in 2017, and the Ann Arbor complaint also seeks contribution from the individual defendants for losses incurred by the company in these litigations. We believe that these claims are without merit and intend to defend against them vigorously.
Since its initial docketing, the Tarara matter has been re-captioned as Public Employees’ Retirement Systems of Mississippi v. TreeHouse Foods, Inc., et al., in accordance with the Court’s order appointing Public Employees’ Retirement Systems of
TREEHOUSE FOODS, INC.
NOTES TO CONSOLIDATED FINANCIAL STATEMENTS – (Continued)
Mississippi as the lead plaintiff. On May 26, 2017, the Public Employees’ defendants filed a motion to dismiss, which the court denied on February 12, 2018. On April 12, 2018, the Public Employees’ defendants filed their answer to the amended complaint. On April 23, 2018, the parties filed a joint status report with the Court, which set forth a proposed discovery and briefing schedule for the Court’s consideration. On July 13, 2018, lead plaintiff filed a motion to certify the class, and defendants filed their response in opposition to the motion to certify the class on October 8, 2018. On November 12, 2018, the parties filed an agreed motion to stay proceedings to allow them to explore mediation. The motion was granted on November 19. The parties thereafter engaged in mediation but failed to resolve the dispute. On March 29, 2019, the parties resumed litigation by filing an agreed motion for extension of time, which was granted on April 9. Under that schedule, lead plaintiff filed its reply class certification brief on May 17, 2019. No hearing on class certification has been set and the motion for class certification remains pending. The Public Employees’ defendants thereafter completed their production of documents, and on December 16, 2019, the parties agreed to extend the schedule 90 days. This agreed motion was granted on December 25, 2019. Under this schedule, the deadline to file document discovery motions is now March 16, 2020; the deadline to complete fact discovery (including depositions) is June 8, 2020; and opening expert reports must be served by July 27, 2020, followed by rebuttal reports and expert discovery. Summary judgment briefing will occur February 17, 2021 through May 12, 2021.
Due to the similarity of the complaints, the parties in Wells and Lavin entered stipulations deferring the litigation until the earlier of (i) the court in Public Employees’ entering an order resolving defendants’ anticipated motion to dismiss therein or (ii) plaintiffs’ counsel receiving notification of a settlement of Public Employees’ or until otherwise agreed to by the parties. On September 27, 2018, the parties in Wells and Lavin filed joint motions for entry of agreed orders further deferring the matters in light of the Public Employees’ Court’s denial of the motion to dismiss in February 2018. The Wells and Lavin Courts entered the agreed orders further deferring the matters on September 27, 2018 and October 10, 2018, respectively. On June 25, 2019, the parties jointly moved to consolidate the Bartelt matter with Lavin, so that it would be subject to the Lavin deferral order. This motion was granted on June 27, 2019, and Bartelt is now consolidated with Lavin and deferred. There is no set status date in Lavin at this time. Similarly, Ann Arbor was consolidated with Wells on August 13, 2019, and is now deferred. In Wells, the next status conference is set for March 6, 2020.
The Company is also party to matters challenging its wage and hour practices. These matters include a number of class actions consolidated under the caption Negrete v. Ralcorp Holdings, Inc., et al, pending in the U.S. District Court for the Central District of California, in which the plaintiffs allege a pattern of violations of California and/or federal law at several current and former Company manufacturing facilities across the State of California. While the Company cannot predict with certainty the results of this or any other legal proceeding, it does not expect this matter to have a material adverse effect on its financial condition, results of operations, or business.
In 2011, the Company’s Sturm Foods, Inc. business was sued in an action captioned Suchanek et al v. Sturm Foods, Inc. and TreeHouse, Inc. and the suit was followed by several class action proceedings in eight states which were consolidated into one case pending in federal court in East St. Louis, Illinois. The suit’s primary allegation relates to certain purported label misrepresentations as to the nature of its Grove Square coffee products. Without admitting liability or fault, the Company entered into a settlement agreement with all related parties and matters in the amount of $25.0 million. The court has preliminarily approved the settlement which is administratively proceeding per the settlement agreement. The court has scheduled a hearing in April 2020 to address final approval of the settlement.
In addition, the Company is party in the ordinary course of business to certain claims, litigation, audits, and investigations. The Company will record an accrual for a loss contingency when it is probable that a loss has been incurred and the amount of the loss can be reasonably estimated. The Company believes it has established adequate accruals for liabilities that are probable and reasonably estimable that may be incurred in connection with any such currently pending or threatened matter, none of which are significant. In the Company’s opinion, the settlement of any such currently pending or threatened matter is not expected to have a material impact on the Company’s financial position, results of operations, or cash flows.
21. DERIVATIVE INSTRUMENTS
The Company is exposed to certain risks relating to its ongoing business operations. The primary risks managed by derivative instruments include interest rate risk, foreign currency risk, and commodity price risk. Derivative contracts are entered into for periods consistent with the related underlying exposure and do not constitute positions independent of those exposures. The Company does not enter into derivative instruments for trading or speculative purposes.
Interest Rate Risk — The Company manages its exposure to changes in interest rates by optimizing the use of variable-rate and fixed-rate debt and by utilizing interest rate swaps to hedge our exposure to changes in interest rates, to reduce the volatility of our financing costs, and to achieve a desired proportion of fixed versus floating-rate debt, based on current and projected market conditions.
TREEHOUSE FOODS, INC.
NOTES TO CONSOLIDATED FINANCIAL STATEMENTS – (Continued)
As of December 31, 2019, the Company had entered into $1.8 billion of long-term interest rate swap agreements to lock into a fixed LIBOR interest rate base. Under the terms of the agreements, $1.8 billion in variable-rate debt was swapped for a weighted average fixed interest rate base of approximately 1.54% through 2019; 2.68% from 2019 through 2020; and 2.91% from 2021 through 2025. These instruments are not accounted for under hedge accounting and the changes in their fair value are recorded in the Consolidated Statements of Operations.
Foreign Currency Risk — Due to the Company’s foreign operations, it is exposed to foreign currency risk. The Company enters into foreign currency contracts to manage the risk associated with foreign currency cash flows. The Company’s objective in using foreign currency contracts is to establish a fixed foreign currency exchange rate for the net cash flow requirements for purchases that are denominated in U.S. dollars. These contracts do not qualify for hedge accounting and changes in their fair value are recorded in the Consolidated Statements of Operations. As of December 31, 2019, the Company had $15.9 million of U.S. dollar foreign currency contracts outstanding, expiring throughout 2020.
Commodity Risk — Certain commodities the Company uses in the production and distribution of its products are exposed to market price risk. The Company utilizes derivative contracts to manage this risk. The majority of commodity forward contracts are not derivatives, and those that are generally qualify for the normal purchases and normal sales scope exception under the guidance for derivative instruments and hedging activities and, therefore, are not subject to its provisions. For derivative commodity contracts that do not qualify for the normal purchases and normal sales scope exception, the Company records their fair value on the Consolidated Balance Sheets, with changes in value being recorded in the Consolidated Statements of Operations.
The Company’s derivative commodity contracts may include contracts for diesel, oil, plastics, natural gas, electricity, resin, corn, and other commodity contracts that do not meet the requirements for the normal purchases and normal sales scope exception.
Diesel contracts are used to manage the Company’s risk associated with the underlying cost of diesel fuel used to deliver products. Contracts for oil, plastics, and resin are used to manage the Company’s risk associated with the underlying commodity cost of a significant component used in packaging materials. Contracts for natural gas and electricity are used to manage the Company’s risk associated with the utility costs of its manufacturing facilities, and commodity contracts that are derivatives that do not meet the normal purchases and normal sales scope exception are used to manage the price risk associated with raw material costs. As of December 31, 2019, the Company had outstanding contracts for the purchase of 0.1 million megawatts of electricity, expiring throughout 2020 and 2021; 16.5 million gallons of diesel, expiring throughout 2020; 5.7 million dekatherms of natural gas, expiring throughout 2020.
The following table identifies the fair value of each derivative instrument:
|
| | | | | | | | |
| | | December 31, |
| | | 2019 | | 2018 |
| | | (In millions) |
| Asset derivatives | | |
| | |
|
| Commodity contracts | | $ | 0.8 |
| | $ | 0.6 |
|
| Foreign currency contracts | | — |
| | 1.5 |
|
| Interest rate swap agreements | | 0.8 |
| | 10.1 |
|
| | | $ | 1.6 |
| | $ | 12.2 |
|
| Liability derivatives | | | | |
| Commodity contracts | | $ | 0.6 |
| | $ | 1.8 |
|
| Foreign currency contracts | | 0.1 |
| | — |
|
| Interest rate swap agreements | | 56.5 |
| | 19.0 |
|
| | | $ | 57.2 |
| | $ | 20.8 |
|
As of December 31, 2019 and 2018, asset derivatives are included within Other assets, net and liability derivatives are included within Accrued expenses in the Consolidated Balance Sheets.
The fair values of the commodity contracts, foreign currency contracts, and interest rate swap agreements are determined using Level 2 inputs. Level 2 inputs are inputs other than quoted market prices that are observable for an asset or liability, either directly or indirectly. The fair values of the commodity contracts, foreign currency contracts, and interest rate swap agreements are based on an analysis comparing the contract rates to the market rates at the balance sheet date.
TREEHOUSE FOODS, INC.
NOTES TO CONSOLIDATED FINANCIAL STATEMENTS – (Continued)
We recorded the following gains and losses on our derivative contracts in the Consolidated Statements of Operations:
|
| | | | | | | | | | | | | |
| | Location of Gain (Loss) | | Year Ended December 31, |
| | Recognized in Net Income (Loss) | | 2019 | | 2018 | | 2017 |
| | | | (In millions) | | |
| Mark-to-market unrealized (loss) gain: | | | |
| | |
| | |
| Commodity contracts | Other expense (income), net | | $ | 1.5 |
| | $ | (2.7 | ) | | $ | 1.0 |
|
| Foreign currency contracts | Other expense (income), net | | (1.6 | ) | | 1.0 |
| | (0.2 | ) |
| Interest rate swap agreements | Other expense (income), net | | (46.9 | ) | | (20.8 | ) | | 1.5 |
|
| Total unrealized (loss) gain | | | $ | (47.0 | ) | | $ | (22.5 | ) | | $ | 2.3 |
|
| Realized gain (loss): | | | | | | | |
| Commodity contracts | Manufacturing related to Cost of sales and transportation related to Selling and distribution | | $ | 1.5 |
| | $ | 3.7 |
| | $ | 0.8 |
|
| Foreign currency contracts | Cost of sales | | 0.5 |
| | 1.6 |
| | (0.6 | ) |
| Interest rate swap agreements | Interest expense | | 6.5 |
| | 5.5 |
| | 1.1 |
|
| Total realized gain | | | $ | 8.5 |
| | $ | 10.8 |
| | $ | 1.3 |
|
| Total (loss) gain | | | $ | (38.5 | ) | | $ | (11.7 | ) | | $ | 3.6 |
|
22. SEGMENT AND GEOGRAPHIC INFORMATION AND MAJOR CUSTOMERS
On January 1, 2020, the Company changed how it manages its business, allocates resources, and goes to market, which resulted in modifications to its organizational and segment structure. As a result, the Company reorganized from a three segment structure previously organized by product category (Baked Goods, Beverages, and Meal Solutions) to a two segment structure organized by market dynamics (Meal Preparation and Snacking & Beverages). In connection with this segment reorganization, the Company also recast expenses related to its commercial sales organization from direct selling, general, and administrative expense previously included within the segments to corporate unallocated selling, general, and administrative expense to align with the revised organizational structure. All prior period information has been recast to reflect this change in reportable segments.
During the third quarter of 2019, the Company completed the sale of its Snacks division and classified the Snacks division and RTE Cereal business as discontinued operations. Values presented below are on a continuing operations basis, with prior period information recast to reflect the change. Refer to Note 8 for additional information regarding discontinued operations.
The Company manages operations on a company-wide basis, thereby making determinations as to the allocation of resources in total rather than on a segment-level basis. The Company has designated reportable segments based on how management views its business. The Company does not segregate assets between segments for internal reporting. Therefore, asset-related information has not been presented. The reportable segments, as presented below, are consistent with the manner in which the Company reports its results to the Chief Operating Decision Maker.
On a continuing operations basis, our segments are as follows:
Meal Preparation – Our Meal Preparation segment sells aseptic cheese & pudding; baking and mix powders; hot cereals; jams, preserves, and jellies; liquid and powdered non-dairy creamer; macaroni and cheese; mayonnaise; Mexican, barbeque, and other sauces; pasta; pickles and related products; powdered soups and gravies; refrigerated and shelf stable dressings and sauces; refrigerated dough; single serve hot beverages; skillet dinners; and table and flavored syrups.
Snacking & Beverages – Our Snacking & Beverages segment sells bars; broths; candy; cookies; crackers; in-store bakery products; pita chips; powdered drinks; pretzels; ready-to-drink coffee; retail griddle waffles, pancakes, and French toast; specialty teas; and sweeteners.
The Company evaluates the performance of its segments based on net sales dollars and direct operating income. Direct operating income is defined as gross profit less freight out, sales commissions, and direct selling, general, and administrative expenses. The amounts in the following tables are obtained from reports used by senior management and do not include income taxes. Other expenses not allocated include unallocated selling, general, and administrative expenses, unallocated costs of sales,
TREEHOUSE FOODS, INC.
NOTES TO CONSOLIDATED FINANCIAL STATEMENTS – (Continued)
and unallocated corporate expenses (amortization expense, other operating expense, and asset impairment). The accounting policies of the Company’s segments are the same as those described in the summary of significant accounting policies set forth in Note 1.
Financial information relating to the Company’s reportable segments on a continuing operations basis, revised to reflect the new segment structure, is as follows:
|
| | | | | | | | | | | |
| | Year Ended December 31, |
| | 2019 | | 2018 | | 2017 |
| | (In millions) |
| Net sales to external customers: | |
| | |
| | |
|
| Meal Preparation | $ | 2,680.7 |
| | $ | 2,871.6 |
| | $ | 3,095.9 |
|
| Snacking & Beverages | 1,608.2 |
| | 1,716.2 |
| | 1,751.9 |
|
| Unallocated (1) | — |
| | — |
| | 4.8 |
|
| Total | $ | 4,288.9 |
| | $ | 4,587.8 |
| | $ | 4,852.6 |
|
| Direct operating income: | | | | | |
| Meal Preparation | $ | 381.3 |
| | $ | 418.9 |
| | $ | 462.2 |
|
| Snacking & Beverages | 192.8 |
| | 180.2 |
| | 225.5 |
|
| Total | 574.1 |
| | 599.1 |
| | 687.7 |
|
| Unallocated selling, general, and administrative expenses | (270.9 | ) | | (288.7 | ) | | (319.9 | ) |
| Unallocated cost of sales (2) | (16.5 | ) | | (11.1 | ) | | (23.7 | ) |
| Unallocated corporate expense and other (3) | (302.8 | ) | | (215.9 | ) | | (264.9 | ) |
| Operating (loss) income | $ | (16.1 | ) | | $ | 83.4 |
| | $ | 79.2 |
|
| Depreciation: | | | | | |
| Meal Preparation | $ | 60.2 |
| | $ | 55.1 |
| | $ | 70.1 |
|
| Snacking & Beverages | 68.6 |
| | 76.3 |
| | 65.7 |
|
| Corporate office (4) | 7.7 |
| | 13.6 |
| | 11.6 |
|
| Total | $ | 136.5 |
| | $ | 145.0 |
| | $ | 147.4 |
|
| |
| (1) | Represents product recall reimbursements that were received during the year ended December 31, 2017. |
| |
| (2) | Includes charges related to restructurings and other costs managed at corporate. |
| |
| (3) | Includes asset impairments. |
| |
| (4) | Includes accelerated depreciation related to restructurings. |
Geographic Information — The Company had revenues from customers outside of the United States of approximately 7.3%, 10.3%, and 10.5% of total consolidated net sales in 2019, 2018, and 2017, respectively, with 5.8%, 8.7%, and 8.8% of total consolidated net sales going to Canada in 2019, 2018, and 2017, respectively. Sales are determined based on the customer destination where the products are shipped.
Long-lived assets consist of net property, plant, and equipment. The geographic location of long-lived assets is as follows:
|
| | | | | | | |
| | December 31, |
| | 2019 | | 2018 |
| | (in millions) |
| Long-lived assets: | |
| | |
|
| United States | $ | 899.6 |
| | $ | 998.5 |
|
| Canada | 129.1 |
| | 125.9 |
|
| Other | 16.5 |
| | 17.9 |
|
| Total | $ | 1,045.2 |
| | $ | 1,142.3 |
|
Major Customers — Walmart Inc. and affiliates accounted for approximately 24.4%, 23.6%, and 23.1% of consolidated net sales in 2019, 2018, and 2017, respectively. No other customer accounted for more than 10% of our consolidated net sales.
TREEHOUSE FOODS, INC.
NOTES TO CONSOLIDATED FINANCIAL STATEMENTS – (Continued)
When taking into account those receivables sold under our Receivables Sales Program (refer to Note 6 for more information), total trade receivables with the following customers represented more than 10% of our total trade receivables as of December 31, 2019 and 2018:
|
| | | | | |
| | December 31, 2019 | | December 31, 2018 |
| Costco | 18.2 | % | | (1 | ) |
| Aldi | (1 | ) | | 12.0 | % |
(1) Less than 10% of our total trade receivables.
23. QUARTERLY RESULTS OF OPERATIONS (unaudited)
The following is a summary of our unaudited quarterly results of operations for 2019:
|
| | | | | | | | | | | | |
| | Quarter |
| | First | Second | Third | Fourth |
| | (in millions, except per share data) |
| Fiscal 2019 | | | | |
| Net sales | $ | 1,066.8 |
| $ | 1,025.3 |
| $ | 1,057.3 |
| $ | 1,139.5 |
|
| Gross profit | 196.2 |
| 189.2 |
| 186.3 |
| 225.1 |
|
| (Loss) income before income taxes from continuing operations | (21.4 | ) | (56.9 | ) | (97.4 | ) | 19.9 |
|
| Net (loss) income from continuing operations | (14.5 | ) | (50.1 | ) | (61.0 | ) | 15.3 |
|
| Net (loss) income from discontinued operations | (12.4 | ) | (121.7 | ) | (116.8 | ) | 0.2 |
|
| Net (loss) income | (26.9 | ) | (171.8 | ) | (177.8 | ) | 15.5 |
|
| Earnings (loss) per common share - basic: | | | | |
| Continuing operations | $ | (0.26 | ) | $ | (0.89 | ) | $ | (1.08 | ) | $ | 0.27 |
|
| Discontinued operations | (0.22 | ) | (2.16 | ) | (2.07 | ) | — |
|
| Net (loss) earnings per share - basic (1) | $ | (0.48 | ) | $ | (3.05 | ) | $ | (3.16 | ) | $ | 0.27 |
|
| Earnings (loss) per common share - diluted: | | | | |
| Continuing operations | $ | (0.26 | ) | $ | (0.89 | ) | $ | (1.08 | ) | $ | 0.27 |
|
| Discontinued operations | (0.22 | ) | (2.16 | ) | (2.07 | ) | — |
|
| Net (loss) earnings per share - diluted (1) | $ | (0.48 | ) | $ | (3.05 | ) | $ | (3.16 | ) | $ | 0.27 |
|
| | | | | |
| |
| (1) | The sum of the individual per share amounts may not add due to rounding. In addition, the sum of the quarters may not equal the total year amount due to the impact of changes in average quarterly shares outstanding and rounding. |
TREEHOUSE FOODS, INC.
NOTES TO CONSOLIDATED FINANCIAL STATEMENTS – (Continued)
The following is a summary of our unaudited quarterly results of operations for 2018:
|
| | | | | | | | | | | | |
| | Quarter |
| | First | Second | Third | Fourth |
| | (in millions, except per share data) |
| Fiscal 2018 | | | | |
| Net sales | $ | 1,158.9 |
| $ | 1,117.5 |
| $ | 1,117.9 |
| $ | 1,193.5 |
|
| Gross profit | 211.6 |
| 215.1 |
| 214.0 |
| 251.5 |
|
| (Loss) income before income taxes from continuing operations | (44.1 | ) | (25.8 | ) | 15.2 |
| (2.9 | ) |
| Net (loss) income from continuing operations | (34.5 | ) | (19.5 | ) | 12.2 |
| (4.4 | ) |
| Net income (loss) from discontinued operations | 0.9 |
| — |
| (9.6 | ) | (9.5 | ) |
| Net (loss) income | (33.6 | ) | (19.5 | ) | 2.6 |
| (13.9 | ) |
| Earnings (loss) per common share - basic: | | | | |
| Continuing operations | $ | (0.61 | ) | $ | (0.35 | ) | $ | 0.22 |
| $ | (0.08 | ) |
| Discontinued operations | 0.02 |
| — |
| (0.17 | ) | (0.17 | ) |
| Net (loss) earnings per share - basic (1) | $ | (0.59 | ) | $ | (0.35 | ) | $ | 0.05 |
| $ | (0.25 | ) |
| Earnings (loss) per common share - diluted: | | | | |
| Continuing operations | $ | (0.61 | ) | $ | (0.35 | ) | $ | 0.22 |
| $ | (0.08 | ) |
| Discontinued operations | 0.02 |
| — |
| (0.17 | ) | (0.17 | ) |
| Net (loss) earnings per share - diluted (1) | $ | (0.59 | ) | $ | (0.35 | ) | $ | 0.05 |
| $ | (0.25 | ) |
| |
| (1) | The sum of the individual per share amounts may not add due to rounding. In addition, the sum of the quarters may not equal the total year amount due to the impact of changes in average quarterly shares outstanding and rounding. |
TREEHOUSE FOODS, INC.
NOTES TO CONSOLIDATED FINANCIAL STATEMENTS – (Continued)
24. GUARANTOR AND NON-GUARANTOR FINANCIAL INFORMATION
The 2022 Notes and 2024 Notes are fully and unconditionally, as well as jointly and severally, guaranteed by our directly and indirectly owned domestic subsidiaries, which are collectively known as the “Guarantor Subsidiaries”. Bay Valley Foods, LLC, which is a 100% owned direct subsidiary, maintains 100% direct and indirect ownership of the following Guarantor Subsidiaries: Sturm Foods, Inc. (includes Cains Foods, Inc. beginning in the fourth quarter of 2019); S.T. Specialty Foods, Inc.; Associated Brands, Inc.; Protenergy Holdings, Inc.; Protenergy Natural Foods, Inc.; TreeHouse Private Brands, Inc. (formerly Ralcorp Holdings, Inc.); American Italian Pasta Company.; Linette Quality Chocolates, Inc.; Ralcorp Frozen Bakery Products, Inc.; Cottage Bakery, Inc.; The Carriage House Companies, Inc. and certain other domestic subsidiaries that may become guarantors in the future. As of August 1, 2019, Nutcracker Brands, Inc. and Flagstone Foods, Inc. are no longer Guarantor Subsidiaries due to the Snacks division divestiture. During the fourth quarter of 2019, Cains Foods, L.P. was dissolved and Cains GP, LLC was renamed as TreeHouse Foods Services, LLC. Prior periods presented in this Note have not been recast to adjust for these changes in guarantor status in order to portray the operational history of the guarantors.
The guarantees of the Guarantor Subsidiaries are subject to release in limited circumstances, only upon the occurrence of certain customary conditions. There are no significant restrictions on the ability of the parent company or any guarantor to obtain funds from its subsidiaries by dividend or loan. The following condensed supplemental consolidating financial information presents the results of operations, financial position, and cash flows of the parent company, its Guarantor Subsidiaries, its non-guarantor subsidiaries, and the eliminations necessary to arrive at the information for the Company on a consolidated basis as of December 31, 2019 and December 31, 2018, and for the years ended December 31, 2019, 2018, and 2017. The equity method has been used with respect to investments in subsidiaries. The principal elimination entries eliminate investments in subsidiaries and intercompany balances and transactions.
TREEHOUSE FOODS, INC.
NOTES TO CONSOLIDATED FINANCIAL STATEMENTS – (Continued)
Condensed Supplemental Consolidating Balance Sheet
December 31, 2019
(In millions)
|
| | | | | | | | | | | | | | | | | | | |
| | Parent Company | | Guarantor Subsidiaries | | Non-Guarantor Subsidiaries | | Eliminations | | Consolidated |
| Assets | |
| | |
| | |
| | |
| | |
|
| Current assets: | |
| | |
| | |
| | |
| | |
|
| Cash and cash equivalents | $ | 129.6 |
| | $ | — |
| | $ | 72.7 |
| | $ | — |
| | $ | 202.3 |
|
| Accounts receivable, net | 0.6 |
| | 230.6 |
| | 39.4 |
| | — |
| | 270.6 |
|
| Inventories | — |
| | 463.6 |
| | 80.4 |
| | — |
| | 544.0 |
|
| Prepaid expenses and other current assets | 142.0 |
| | 17.7 |
| | 23.7 |
| | (138.9 | ) | | 44.5 |
|
| Assets held for sale | — |
| | 27.0 |
| | — |
| | — |
| | 27.0 |
|
| Assets of discontinued operations | 0.5 |
| | 130.6 |
| | — |
| | — |
| | 131.1 |
|
| Total current assets | 272.7 |
| | 869.5 |
| | 216.2 |
| | (138.9 | ) | | 1,219.5 |
|
| Property, plant, and equipment, net | 41.6 |
| | 858.0 |
| | 145.6 |
| | — |
| | 1,045.2 |
|
| Operating lease right-of-use assets | 32.5 |
| | 115.5 |
| | 27.3 |
| | — |
| | 175.3 |
|
| Goodwill | — |
| | 1,987.5 |
| | 119.8 |
| | — |
| | 2,107.3 |
|
| Investment in subsidiaries | 5,130.5 |
| | 436.7 |
| | — |
| | (5,567.2 | ) | | — |
|
| Deferred income taxes | 56.5 |
| | — |
| | — |
| | (56.5 | ) | | — |
|
| Intangible and other assets, net | 91.6 |
| | 443.3 |
| | 57.2 |
| | — |
| | 592.1 |
|
| Total assets | $ | 5,625.4 |
| | $ | 4,710.5 |
| | $ | 566.1 |
| | $ | (5,762.6 | ) | | $ | 5,139.4 |
|
| Liabilities and Stockholders’ Equity | | | | | | | | | |
| Current liabilities: | | | | | | | | | |
| Accounts payable | $ | 15.0 |
| | $ | 421.6 |
| | $ | 71.8 |
| | $ | — |
| | $ | 508.4 |
|
| Accrued expenses | 126.1 |
| | 264.4 |
| | 21.6 |
| | (138.9 | ) | | 273.2 |
|
| Current portion of long-term debt | 14.7 |
| | 0.6 |
| | — |
| | — |
| | 15.3 |
|
| Liabilities of discontinued operations | — |
| | 16.5 |
| | — |
| | — |
| | 16.5 |
|
| Total current liabilities | 155.8 |
| | 703.1 |
| | 93.4 |
| | (138.9 | ) | | 813.4 |
|
| Long-term debt | 2,090.2 |
| | 1.4 |
| | 0.1 |
| | — |
| | 2,091.7 |
|
| Operating lease liabilities | 39.5 |
| | 96.4 |
| | 22.6 |
| | — |
| | 158.5 |
|
| Deferred income taxes | — |
| | 139.2 |
| | 18.8 |
| | (56.5 | ) | | 101.5 |
|
| Other long-term liabilities | 11.4 |
| | 127.3 |
| | 4.7 |
| | — |
| | 143.4 |
|
| Intercompany accounts (receivable) payable, net | 1,497.6 |
| | (1,487.4 | ) | | (10.2 | ) | | — |
| | — |
|
| Stockholders’ equity | 1,830.9 |
| | 5,130.5 |
| | 436.7 |
| | (5,567.2 | ) | | 1,830.9 |
|
| Total liabilities and stockholders’ equity | $ | 5,625.4 |
| | $ | 4,710.5 |
| | $ | 566.1 |
| | $ | (5,762.6 | ) | | $ | 5,139.4 |
|
TREEHOUSE FOODS, INC.
NOTES TO CONSOLIDATED FINANCIAL STATEMENTS – (Continued)
Condensed Supplemental Consolidating Balance Sheet
December 31, 2018
(In millions)
|
| | | | | | | | | | | | | | | | | | | |
| | Parent Company | | Guarantor Subsidiaries | | Non-Guarantor Subsidiaries | | Eliminations | | Consolidated |
| Assets | |
| | |
| | |
| | |
| | |
|
| Current assets: | |
| | |
| | |
| | |
| | |
|
| Cash and cash equivalents | $ | 77.9 |
| | $ | — |
| | $ | 86.4 |
| | $ | — |
| | $ | 164.3 |
|
| Accounts receivable, net | 1.0 |
| | 314.1 |
| | 36.2 |
| | — |
| | 351.3 |
|
| Inventories | — |
| | 522.6 |
| | 93.0 |
| | — |
| | 615.6 |
|
| Prepaid expenses and other current assets | 80.9 |
| | 59.6 |
| | 16.8 |
| | (96.3 | ) | | 61.0 |
|
| Assets of discontinued operations | — |
| | 485.8 |
| | — |
| | — |
| | 485.8 |
|
| Total current assets | 159.8 |
| | 1,382.1 |
| | 232.4 |
| | (96.3 | ) | | 1,678.0 |
|
| Property, plant, and equipment, net | 42.8 |
| | 955.7 |
| | 143.8 |
| | — |
| | 1,142.3 |
|
| Goodwill | — |
| | 1,993.2 |
| | 114.7 |
| | — |
| | 2,107.9 |
|
| Investment in subsidiaries | 5,170.5 |
| | 559.3 |
| | — |
| | (5,729.8 | ) | | — |
|
| Deferred income taxes | 34.2 |
| | — |
| | — |
| | (34.2 | ) | | — |
|
| Intangible and other assets, net | 86.6 |
| | 531.7 |
| | 82.8 |
| | — |
| | 701.1 |
|
| Total assets | $ | 5,493.9 |
| | $ | 5,422.0 |
| | $ | 573.7 |
| | $ | (5,860.3 | ) | | $ | 5,629.3 |
|
| Liabilities and Stockholders’ Equity | | | | | | | | | |
| Current liabilities: | | | | | | | | | |
| Accounts payable | $ | 23.9 |
| | $ | 508.3 |
| | $ | 45.7 |
| | $ | — |
| | $ | 577.9 |
|
| Accrued expenses | 71.8 |
| | 258.0 |
| | 19.0 |
| | (96.3 | ) | | 252.5 |
|
| Current portion of long-term debt | 0.6 |
| | 0.5 |
| | 0.1 |
| | — |
| | 1.2 |
|
| Liabilities of discontinued operations | — |
| | 6.0 |
| | — |
| | — |
| | 6.0 |
|
| Total current liabilities | 96.3 |
| | 772.8 |
| | 64.8 |
| | (96.3 | ) | | 837.6 |
|
| Long-term debt | 2,296.2 |
| | 0.6 |
| | 0.6 |
| | — |
| | 2,297.4 |
|
| Deferred income taxes | — |
| | 183.8 |
| | 16.5 |
| | (34.2 | ) | | 166.1 |
|
| Other long-term liabilities | 17.7 |
| | 145.4 |
| | 5.1 |
| | — |
| | 168.2 |
|
| Intercompany accounts (receivable) payable, net | 923.7 |
| | (851.1 | ) | | (72.6 | ) | | — |
| | — |
|
| Stockholders’ equity | 2,160.0 |
| | 5,170.5 |
| | 559.3 |
| | (5,729.8 | ) | | 2,160.0 |
|
| Total liabilities and stockholders’ equity | $ | 5,493.9 |
| | $ | 5,422.0 |
| | $ | 573.7 |
| | $ | (5,860.3 | ) | | $ | 5,629.3 |
|
TREEHOUSE FOODS, INC.
NOTES TO CONSOLIDATED FINANCIAL STATEMENTS – (Continued)
Condensed Supplemental Consolidating Statement of Operations
Year Ended December 31, 2019
(In millions)
|
| | | | | | | | | | | | | | | | | | | |
| | Parent Company | | Guarantor Subsidiaries | | Non-Guarantor Subsidiaries | | Eliminations | | Consolidated |
| Net sales | $ | — |
| | $ | 4,104.5 |
| | $ | 551.4 |
| | $ | (367.0 | ) | | $ | 4,288.9 |
|
| Cost of sales | 0.2 |
| | 3,340.4 |
| | 518.5 |
| | (367.0 | ) | | 3,492.1 |
|
| Gross profit | (0.2 | ) | | 764.1 |
| | 32.9 |
| | — |
| | 796.8 |
|
| Selling, general, and administrative expense | 153.3 |
| | 324.1 |
| | 32.7 |
| | — |
| | 510.1 |
|
| Amortization expense | 10.3 |
| | 55.6 |
| | 8.2 |
| | — |
| | 74.1 |
|
| Asset impairment | — |
| | 129.1 |
| | — |
| | — |
| | 129.1 |
|
| Other operating expense, net | 77.0 |
| | 33.8 |
| | (11.2 | ) | | — |
| | 99.6 |
|
| Operating (loss) income | (240.8 | ) | | 221.5 |
| | 3.2 |
| | — |
| | (16.1 | ) |
| Interest expense | 104.0 |
| | — |
| | 4.1 |
| | (5.7 | ) | | 102.4 |
|
| (Gain) loss on foreign currency exchange | — |
| | (2.0 | ) | | (1.5 | ) | | — |
| | (3.5 | ) |
| Other expense (income), net | 40.3 |
| | (0.3 | ) | | (4.9 | ) | | 5.7 |
| | 40.8 |
|
| Loss before income taxes | (385.1 | ) | | 223.8 |
| | 5.5 |
| | — |
| | (155.8 | ) |
| Income tax (benefit) expense | (95.3 | ) | | 50.9 |
| | (1.1 | ) | | — |
| | (45.5 | ) |
| Equity in net income (loss) of subsidiaries | (53.3 | ) | | 10.0 |
| | — |
| | 43.3 |
| | — |
|
| Net income (loss) from continuing operations | (343.1 | ) | | 182.9 |
| | 6.6 |
| | 43.3 |
| | (110.3 | ) |
| Net (loss) income from discontinued operations | (17.9 | ) | | (236.2 | ) | | 3.4 |
| | — |
| | (250.7 | ) |
| Net (loss) income | $ | (361.0 | ) | | $ | (53.3 | ) | | $ | 10.0 |
| | $ | 43.3 |
| | $ | (361.0 | ) |
Condensed Supplemental Consolidating Statements of Operations
Year Ended December 31, 2018
(In millions)
|
| | | | | | | | | | | | | | | | | | | |
| | Parent Company | | Guarantor Subsidiaries | | Non-Guarantor Subsidiaries | | Eliminations | | Consolidated |
| Net sales | $ | — |
| | $ | 4,374.0 |
| | $ | 619.9 |
| | $ | (406.1 | ) | | $ | 4,587.8 |
|
| Cost of sales | — |
| | 3,551.7 |
| | 550.0 |
| | (406.1 | ) | | 3,695.6 |
|
| Gross profit | — |
| | 822.3 |
| | 69.9 |
| | — |
| | 892.2 |
|
| Selling, general, and administrative expense | 139.5 |
| | 419.0 |
| | 34.4 |
| | — |
| | 592.9 |
|
| Amortization expense | 11.8 |
| | 59.3 |
| | 9.1 |
| | — |
| | 80.2 |
|
| Other operating expense, net | 112.1 |
| | 19.9 |
| | 3.7 |
| | — |
| | 135.7 |
|
| Operating (loss) income | (263.4 | ) | | 324.1 |
| | 22.7 |
| | — |
| | 83.4 |
|
| Interest expense | 104.8 |
| | — |
| | 3.0 |
| | — |
| | 107.8 |
|
| (Gain) loss on foreign currency exchange | (0.4 | ) | | 5.8 |
| | 3.2 |
| | — |
| | 8.6 |
|
| Other expense (income), net | 29.8 |
| | (1.1 | ) | | (4.1 | ) | | — |
| | 24.6 |
|
| Loss before income taxes | (397.6 | ) | | 319.4 |
| | 20.6 |
| | — |
| | (57.6 | ) |
| Income tax (benefit) expense | (96.1 | ) | | 77.3 |
| | 7.4 |
| | — |
| | (11.4 | ) |
| Equity in net income (loss) of subsidiaries | 247.1 |
| | 19.5 |
| | — |
| | (266.6 | ) | | — |
|
| Net (loss) income from continuing operations | (54.4 | ) | | 261.6 |
| | 13.2 |
| | (266.6 | ) | | (46.2 | ) |
| Net (loss) income from discontinued operations | (10.0 | ) | | (14.5 | ) | | 6.3 |
| | — |
| | (18.2 | ) |
| Net (loss) income | $ | (64.4 | ) | | $ | 247.1 |
| | $ | 19.5 |
| | $ | (266.6 | ) | | $ | (64.4 | ) |
TREEHOUSE FOODS, INC.
NOTES TO CONSOLIDATED FINANCIAL STATEMENTS – (Continued)
Condensed Supplemental Consolidating Statements of Operations
Year Ended December 31, 2017
(In millions)
|
| | | | | | | | | | | | | | | | | | | |
| | Parent Company | | Guarantor Subsidiaries | | Non-Guarantor Subsidiaries | | Eliminations | | Consolidated |
| Net sales | $ | — |
| | $ | 4,523.2 |
| | $ | 684.5 |
| | $ | (355.1 | ) | | $ | 4,852.6 |
|
| Cost of sales | — |
| | 3,636.4 |
| | 593.2 |
| | (355.1 | ) | | 3,874.5 |
|
| Gross profit | — |
| | 886.8 |
| | 91.3 |
| | — |
| | 978.1 |
|
| Selling, general, and administrative expense | 114.4 |
| | 475.4 |
| | 39.4 |
| | — |
| | 629.2 |
|
| Amortization expense | 12.9 |
| | 63.0 |
| | 9.6 |
| | — |
| | 85.5 |
|
| Asset impairment | — |
| | 59.0 |
| | — |
| | — |
| | 59.0 |
|
| Other operating expense, net | 9.0 |
| | 112.6 |
| | 3.6 |
| | — |
| | 125.2 |
|
| Operating (loss) income | (136.3 | ) | | 176.8 |
| | 38.7 |
| | — |
| | 79.2 |
|
| Interest expense | 123.9 |
| | 0.3 |
| | 6.4 |
| | (8.2 | ) | | 122.4 |
|
| (Gain) loss on foreign currency exchange | 0.7 |
| | (4.7 | ) | | (1.0 | ) | | — |
| | (5.0 | ) |
| Other expense (income), net | (4.6 | ) | | (266.5 | ) | | (6.7 | ) | | 268.1 |
| | (9.7 | ) |
| Loss before income taxes | (256.3 | ) | | 447.7 |
| | 40.0 |
| | (259.9 | ) | | (28.5 | ) |
| Income tax (benefit) expense | (98.3 | ) | | (49.7 | ) | | 8.2 |
| | — |
| | (139.8 | ) |
| Equity in net income (loss) of subsidiaries | 141.1 |
| | 33.2 |
| | — |
| | (174.3 | ) | | — |
|
| Net (loss) income from continuing operations | (16.9 | ) | | 530.6 |
| | 31.8 |
| | (434.2 | ) | | 111.3 |
|
| Net (loss) income from discontinued operations | (2.7 | ) | | (389.5 | ) | | 1.4 |
| | — |
| | (390.8 | ) |
| Net (loss) income | $ | (19.6 | ) | | $ | 141.1 |
| | $ | 33.2 |
| | $ | (434.2 | ) | | $ | (279.5 | ) |
Condensed Supplemental Consolidating Statement of Comprehensive Income (Loss)
Year Ended December 31, 2019
(In millions)
|
| | | | | | | | | | | | | | | | | | | |
| | Parent Company | | Guarantor Subsidiaries | | Non-Guarantor Subsidiaries | | Eliminations | | Consolidated |
| Net loss | $ | (361.0 | ) | | $ | (53.3 | ) | | $ | 10.0 |
| | $ | 43.3 |
| | $ | (361.0 | ) |
| Other comprehensive income (loss), net of tax: | | | | | | | | | |
| Foreign currency translation adjustments | — |
| | — |
| | 12.3 |
| | — |
| | 12.3 |
|
| Pension and postretirement adjustment | — |
| | 0.8 |
| | — |
| | — |
| | 0.8 |
|
| Other comprehensive income (loss) | — |
| | 0.8 |
| | 12.3 |
| | — |
| | 13.1 |
|
Equity in other comprehensive income (loss) of
subsidiaries | 13.1 |
| | 12.3 |
| | — |
| | (25.4 | ) | | — |
|
| Comprehensive income (loss) | $ | (347.9 | ) | | $ | (40.2 | ) | | $ | 22.3 |
| | $ | 17.9 |
| | $ | (347.9 | ) |
TREEHOUSE FOODS, INC.
NOTES TO CONSOLIDATED FINANCIAL STATEMENTS – (Continued)
Condensed Supplemental Consolidating Statement of Comprehensive Income (Loss)
Year Ended December 31, 2018
(In millions)
|
| | | | | | | | | | | | | | | | | | | |
| | Parent Company | | Guarantor Subsidiaries | | Non-Guarantor Subsidiaries | | Eliminations | | Consolidated |
| Net loss | $ | (64.4 | ) | | $ | 247.1 |
| | $ | 19.5 |
| | $ | (266.6 | ) | | $ | (64.4 | ) |
| Other comprehensive income (loss), net of tax: | | | | | | | | | |
| Foreign currency translation adjustments | — |
| | — |
| | (34.5 | ) | | — |
| | (34.5 | ) |
| Adoption of ASU 2018-02 reclassification to retained earnings | — |
| | (1.1 | ) | | — |
| | — |
| | (1.1 | ) |
| Other comprehensive income (loss) | — |
| | (1.1 | ) | | (34.5 | ) | | — |
| | (35.6 | ) |
Equity in other comprehensive income (loss) of
subsidiaries | (35.6 | ) | | (34.5 | ) | | — |
| | 70.1 |
| | — |
|
| Comprehensive income (loss) | $ | (100.0 | ) | | $ | 211.5 |
| | $ | (15.0 | ) | | $ | (196.5 | ) | | $ | (100.0 | ) |
Condensed Supplemental Consolidating Statement of Comprehensive Income (Loss)
Year Ended December 31, 2017
(In millions)
|
| | | | | | | | | | | | | | | | | | | |
| | Parent Company | | Guarantor Subsidiaries | | Non-Guarantor Subsidiaries | | Eliminations | | Consolidated |
| Net loss | $ | (19.6 | ) | | $ | 141.1 |
| | $ | 33.2 |
| | $ | (434.2 | ) | | $ | (279.5 | ) |
| Other comprehensive income (loss), net of tax: | | | | | | | | | |
| Foreign currency translation adjustments | — |
| | — |
| | 32.2 |
| | — |
| | 32.2 |
|
| Pension and postretirement adjustment | — |
| | 7.6 |
| | — |
| | — |
| | 7.6 |
|
| Other comprehensive income (loss) | — |
| | 7.6 |
| | 32.2 |
| | — |
| | 39.8 |
|
Equity in other comprehensive (loss) income of
subsidiaries | 39.8 |
| | 32.2 |
| | — |
| | (72.0 | ) | | — |
|
| Comprehensive income (loss) | $ | 20.2 |
| | $ | 180.9 |
| | $ | 65.4 |
| | $ | (506.2 | ) | | $ | (239.7 | ) |
TREEHOUSE FOODS, INC.
NOTES TO CONSOLIDATED FINANCIAL STATEMENTS – (Continued)
Condensed Supplemental Consolidating Statement of Cash Flows
Year Ended December 31, 2019
(In millions)
|
| | | | | | | | | | | | | | | | | | | |
| | Parent Company | | Guarantor Subsidiaries | | Non-Guarantor Subsidiaries | | Eliminations | | Consolidated |
| Cash flows from operating activities: | |
| | |
| | |
| | |
| | |
|
| Net cash provided by (used in) operating activities - continuing operations | $ | (398.0 | ) | | $ | 554.9 |
| | $ | 63.7 |
| | $ | 43.3 |
| | $ | 263.9 |
|
| Net cash provided by (used in) operating activities - discontinued operations | (17.9 | ) | | 58.3 |
| | 3.4 |
| | — |
| | 43.8 |
|
| Net cash provided by (used in) operating activities | (415.9 | ) | | 613.2 |
| | 67.1 |
| | 43.3 |
| | 307.7 |
|
| Cash flows from investing activities: | | | | | | | | | |
| Additions to property, plant, and equipment | (0.4 | ) | | (108.1 | ) | | (14.2 | ) | | — |
| | (122.7 | ) |
| Additions to intangible assets | (24.0 | ) | | (0.1 | ) | | — |
| | — |
| | (24.1 | ) |
| Intercompany transfer | (325.7 | ) | | (942.7 | ) | | (13.6 | ) | | 1,282.0 |
| | — |
|
| Other | (6.4 | ) | | (27.4 | ) | | 41.3 |
| | — |
| | 7.5 |
|
| Net cash provided by (used in) investing activities - continuing operations | (356.5 | ) | | (1,078.3 | ) | | 13.5 |
| | 1,282.0 |
| | (139.3 | ) |
| Net cash provided by (used in) investing activities - discontinued operations | — |
| | 71.2 |
| | — |
| | — |
| | 71.2 |
|
| Net cash provided by (used in) investing activities | (356.5 | ) | | (1,007.1 | ) | | 13.5 |
| | 1,282.0 |
| | (68.1 | ) |
| Cash flows from financing activities: | | | | | | | | | |
| Net (repayment) borrowing of debt | (198.9 | ) | | (2.4 | ) | | (0.6 | ) | | — |
| | (201.9 | ) |
| Intercompany transfer | 1,023.4 |
| | 396.3 |
| | (94.4 | ) | | (1,325.3 | ) | | — |
|
| Receipts related to stock-based award activities | 0.7 |
| | — |
| | — |
| | — |
| | 0.7 |
|
| Payments related to stock-based award activities | (5.7 | ) | | — |
| | — |
| | — |
| | (5.7 | ) |
| Net cash provided by (used in) financing activities - continuing operations | 819.5 |
| | 393.9 |
| | (95.0 | ) | | (1,325.3 | ) | | (206.9 | ) |
| Net cash provided by (used in) financing activities - discontinued operations | — |
| | — |
| | — |
| | — |
| | — |
|
| Net cash provided by (used in) financing activities | 819.5 |
| | 393.9 |
| | (95.0 | ) | | (1,325.3 | ) | | (206.9 | ) |
| Effect of exchange rate changes on cash and cash equivalents | 4.6 |
| | — |
| | 0.7 |
| | — |
| | 5.3 |
|
| Increase (decrease) in cash and cash equivalents | 51.7 |
| | — |
| | (13.7 | ) | | — |
| | 38.0 |
|
| Cash and cash equivalents, beginning of period | 77.9 |
| | — |
| | 86.4 |
| | — |
| | 164.3 |
|
| Cash and cash equivalents, end of period | $ | 129.6 |
| | $ | — |
| | $ | 72.7 |
| | $ | — |
| | $ | 202.3 |
|
TREEHOUSE FOODS, INC.
NOTES TO CONSOLIDATED FINANCIAL STATEMENTS – (Continued)
Condensed Supplemental Consolidating Statement of Cash Flows
Year Ended December 31, 2018
(In millions)
|
| | | | | | | | | | | | | | | | | | | |
| | Parent Company | | Guarantor Subsidiaries | | Non-Guarantor Subsidiaries | | Eliminations | | Consolidated |
| Cash flows from operating activities: | |
| | |
| | |
| | |
| | |
|
| Net cash provided by (used in) operating activities - continuing operations | $ | 132.8 |
| | $ | 522.5 |
| | $ | 70.8 |
| | $ | (254.0 | ) | | $ | 472.1 |
|
| Net cash provided by (used in) operating activities - discontinued operations | (10.0 | ) | | 37.4 |
| | 6.3 |
| | — |
| | 33.7 |
|
| Net cash provided by (used in) operating activities | 122.8 |
| | 559.9 |
| | 77.1 |
| | (254.0 | ) | | 505.8 |
|
| Cash flows from investing activities: | | | | | | | | | |
| Additions to property, plant, and equipment | (14.2 | ) | | (122.7 | ) | | (18.1 | ) | | — |
| | (155.0 | ) |
| Additions to intangible assets | (21.8 | ) | | (0.5 | ) | | (0.1 | ) | | — |
| | (22.4 | ) |
| Intercompany transfer | 52.3 |
| | (209.9 | ) | | (15.1 | ) | | 172.7 |
| | — |
|
| Other | — |
| | 36.3 |
| | (1.3 | ) | | — |
| | 35.0 |
|
| Net cash (used in) provided by investing activities - continuing operations | 16.3 |
| | (296.8 | ) | | (34.6 | ) | | 172.7 |
| | (142.4 | ) |
| Net cash (used in) provided by investing activities - discontinued operations | — |
| | (18.5 | ) | | — |
| | — |
| | (18.5 | ) |
| Net cash (used in) provided by investing activities | 16.3 |
| | (315.3 | ) | | (34.6 | ) | | 172.7 |
| | (160.9 | ) |
| Cash flows from financing activities: | | | | | | | | | |
| Net borrowing (repayment) of debt | (254.8 | ) | | (1.5 | ) | | — |
| | — |
| | (256.3 | ) |
| Intercompany transfer | 168.7 |
| | (246.9 | ) | | (3.1 | ) | | 81.3 |
| | — |
|
| Repurchases of common stock | (54.6 | ) | | — |
| | — |
| | — |
| | (54.6 | ) |
| Receipts related to stock-based award activities | 4.7 |
| | — |
| | — |
| | — |
| | 4.7 |
|
| Payments related to stock-based award activities | (8.4 | ) | | — |
| | — |
| | — |
| | (8.4 | ) |
| Other | — |
| | 3.6 |
| | — |
| | — |
| | 3.6 |
|
| Net cash provided by (used in) financing activities - continuing operations | (144.4 | ) | | (244.8 | ) | | (3.1 | ) | | 81.3 |
| | (311.0 | ) |
| Net cash provided by (used in) financing activities - discontinued operations | — |
| | — |
| | — |
| | — |
| | — |
|
| Net cash provided by (used in) financing activities | (144.4 | ) | | (244.8 | ) | | (3.1 | ) | | 81.3 |
| | (311.0 | ) |
| Effect of exchange rate changes on cash and cash equivalents | — |
| | — |
| | (2.4 | ) | | — |
| | (2.4 | ) |
| (Decrease) increase in cash and cash equivalents | (5.3 | ) | | (0.2 | ) | | 37.0 |
| | — |
| | 31.5 |
|
| Cash and cash equivalents, beginning of period | 83.2 |
| | 0.2 |
| | 49.4 |
| | — |
| | 132.8 |
|
| Cash and cash equivalents, end of period | $ | 77.9 |
| | $ | — |
| | $ | 86.4 |
| | $ | — |
| | $ | 164.3 |
|
TREEHOUSE FOODS, INC.
NOTES TO CONSOLIDATED FINANCIAL STATEMENTS – (Continued)
Condensed Supplemental Consolidating Statement of Cash Flows
Year Ended December 31, 2017
(In millions)
|
| | | | | | | | | | | | | | | | | | | |
| | Parent Company | | Guarantor Subsidiaries | | Non-Guarantor Subsidiaries | | Eliminations | | Consolidated |
| Cash flows from operating activities: | |
| | |
| | |
| | |
| | |
|
| Net cash provided by (used in) operating activities - continuing operations | $ | (146.8 | ) | | $ | 1,005.5 |
| | $ | 33.9 |
| | $ | (426.9 | ) | | $ | 465.7 |
|
| Net cash provided by (used in) operating activities - discontinued operations | (2.7 | ) | | 41.6 |
| | 1.4 |
| | — |
| | 40.3 |
|
Net cash provided by (used in) operating
activities | (149.5 | ) | | 1,047.1 |
| | 35.3 |
| | (426.9 | ) | | 506.0 |
|
| Cash flows from investing activities: | | | | | | | | | |
| Additions to property, plant, and equipment | (4.2 | ) | | (113.2 | ) | | (18.1 | ) | | — |
| | (135.5 | ) |
| Additions to intangible assets | (25.5 | ) | | (0.5 | ) | | (0.1 | ) | | — |
| | (26.1 | ) |
| Intercompany transfer | 403.4 |
| | (402.0 | ) | | (38.7 | ) | | 37.3 |
| | — |
|
| Proceeds from sale of fixed assets | — |
| | 8.3 |
| | 0.1 |
| | — |
| | 8.4 |
|
| Proceeds from divestitures | — |
| | 18.5 |
| | 0.3 |
| | — |
| | 18.8 |
|
| Other | — |
| | — |
| | (1.2 | ) | | — |
| | (1.2 | ) |
| Net cash (used in) provided by investing activities - continuing operations | 373.7 |
| | (488.9 | ) | | (57.7 | ) | | 37.3 |
| | (135.6 | ) |
| Net cash (used in) provided by investing activities - discontinued operations | — |
| | (24.2 | ) | | — |
| | — |
| | (24.2 | ) |
Net cash (used in) provided by investing activities | 373.7 |
| | (513.1 | ) | | (57.7 | ) | | 37.3 |
| | (159.8 | ) |
| Cash flows from financing activities: | | | | | | | | | |
| Net borrowing (repayment) of debt | (252.2 | ) | | (2.5 | ) | | (0.1 | ) | | — |
| | (254.8 | ) |
| Intercompany transfer | 134.7 |
| | (531.5 | ) | | 7.2 |
| | 389.6 |
| | — |
|
| Repurchases of common stock | (28.7 | ) | | — |
| | — |
| | — |
| | (28.7 | ) |
| Receipts related to stock-based award activities | 12.1 |
| | — |
| | — |
| | — |
| | 12.1 |
|
| Payments related to stock-based award activities | (6.9 | ) | | — |
| | — |
| | — |
| | (6.9 | ) |
| Net cash provided by (used in) financing activities - continuing operations | (141.0 | ) | | (534.0 | ) | | 7.1 |
| | 389.6 |
| | (278.3 | ) |
| Net cash provided by (used in) financing activities - discontinued operations | — |
| | — |
| | — |
| | — |
| | — |
|
Net cash provided by (used in) financing activities | (141.0 | ) | | (534.0 | ) | | 7.1 |
| | 389.6 |
| | (278.3 | ) |
Effect of exchange rate changes on cash and cash equivalents | — |
| | — |
| | 2.8 |
| | — |
| | 2.8 |
|
| (Decrease) increase in cash and cash equivalents | 83.2 |
| | — |
| | (12.5 | ) | | — |
| | 70.7 |
|
| Cash and cash equivalents, beginning of period | — |
| | 0.2 |
| | 61.9 |
| | — |
| | 62.1 |
|
| Cash and cash equivalents, end of period | $ | 83.2 |
| | $ | 0.2 |
| | $ | 49.4 |
| | $ | — |
| | $ | 132.8 |
|